Article

Hydrogeophysical Characterization to Inform Future Mine Dewatering Strategies: Case Study of the Beni Amir Phosphate Deposit, Morocco


by
Ouissal Heddoun
*,
Majid El Baroudi
,
Anasse Ait Lemkademe
,
Abdelhamid Bouhouch
and
Mostafa Benzaazoua
Geology and Sustainable Mining Institute, Mohammed VI Polytechnic University, Benguerir 43150, Morocco
*
Author to whom correspondence should be addressed.
Water 2026, 18(17), 2163; https://doi.org/10.3390/w18172163
Submission received: 15 May 2026 / Revised: 15 June 2026 / Accepted: 16 June 2026 / Published: 2 September 2026
(This article belongs to the Section Hydrogeology)

Abstract

Groundwater management presents a challenge for open-cast phosphate mining within the Beni Amir deposit, Oulad Abdoun Basin, Morocco, where future mining operations are progressively reaching deeper saturated phosphate layers. This study integrates six Electrical Resistivity Tomography (ERT) profiles, eleven Magnetic Resonance Sounding (MRS) measurements, hydrostratigraphic modeling, 690 borehole logs, 580 piezometric measurements, and pumping-test results from 14 production wells to characterize the multilayer aquifer system. The comprehensive interpretation identifies three water-bearing zones: a shallow Eocene aquifer located within the Lutetian–Ypresian succession at depths approximately between 2 and 20 m, an intermediate Danian–Thanetian to Maastrichtian phosphate-bearing aquifer situated at depths ranging from 20 to 60 m, and a deeper Senonian marly limestone aquifer occurring below 60 m. Saturated zones are generally associated with low resistivity values, commonly below 28 Ω·m, and MRS-derived mobile water contents ranging from 0.3% to 4.4%. The hydraulic conductivity derived from MRS data exhibits a range of one and a half orders of magnitude across the majority of soundings, from 1.5 × 10⁻⁶ to 5 × 10⁻⁵ m/s. A comparative analysis with pumping tests shows that MRS-derived hydraulic conductivity is generally greater than well-test estimates, with localized discrepancies that may reflect scale effects, lithological heterogeneity, inversion uncertainties, and the necessity for localized calibration. As a working hypothesis, areas spatially associated with ephemeral streambed channels may represent potential zones of localized recharge or inflow, possibly where erosional truncation reduces the continuity of confining layers. The resultant hydrostratigraphic framework constrains saturated zones and hydraulic heterogeneity, thereby establishing a foundation for forthcoming groundwater flow modeling and mine dewatering evaluations.

1. Introduction

In semi-arid mining regions, groundwater is both an important resource and an operational limitation. In Morocco, rising water demand, recurrent drought, and reduced precipitation under a changing climate have increased pressure on groundwater reserves, producing a persistent imbalance between recharge and abstraction and, in several aquifers, pronounced water-level declines [1]. This groundwater depletion sharpens the need for sound mine-water management, particularly in Morocco’s Oulad Abdoun phosphate basin, where mining expansion toward the southern part of the Beni Amir deposit coincides with a progressive deepening of phosphate layers and, consequently, increasing volumes of groundwater that must be managed to maintain safe and productive working conditions [2,3].
In open-cast mines developed below or close to the water table, uncontrolled groundwater inflows can disrupt extraction, damage equipment, and impose substantial pumping costs; they may also compromise safety through slope instability, ground failure, and water inrush events [4]. Practical water control strategies, whether dewatering, diversion, sealing, or hybrid solutions, depend on accurately identifying the sources of inflow and the groundwater regime feeding the pit [4]. In a multilayered sedimentary context, where aquifer and aquitard units alternate vertically and may change laterally, this step is often one of the main limitations in designing dewatering systems.
A reliable dewatering design necessitates a hydrostratigraphic framework supported by layer-specific hydrogeological parameters (e.g., porosity, hydraulic conductivity, transmissivity, and specific yield) suitable for groundwater flow modeling and operational decision-making. Nonetheless, these parameters are frequently sparse, uncertain, or inadequately resolved at the scale required by large mining concessions [5]. Boreholes and pumping tests remain indispensable because boreholes constrain lithology, saturated intervals, and groundwater levels, whereas pumping tests provide site-specific estimates of hydraulic conductivity, transmissivity, and aquifer response to pumping; however, they sample the subsurface at discrete points and can be costly to densify [6], particularly where facies changes, structural discontinuities, or heterogeneous alteration patterns cause strong spatial variability. This scale mismatch between point-scale hydrogeological measurements and the spatial needs of mine-scale numerical groundwater flow models motivates the systematic use of hydrogeophysics to extend characterization between data control points [6,7,8].
Non-invasive geophysical approaches provide useful support to conventional drilling and pumping tests for hydrogeological characterization. Electrical Resistivity Tomography (ERT) and Magnetic Resonance Sounding (MRS) have been applied in hydrogeological investigations within the mining industry for decades [9,10]. ERT measures the electrical resistivity of subsurface materials, which depends on several physical properties and parameters including the concentration of dissolved minerals in the pore water, porosity, water content, grain size, presence of clay, temperature and phase of the pore water [11]. This method is effective for delineating aquifer structures, detecting anomalies such as low-resistivity zones associated with water-saturated sediments, and providing insights into the spatial distribution of water-bearing formations [12]. However, resistivity is not uniquely diagnostic of hydraulic properties [6], and the translation from resistivity to parameters such as water content or hydraulic conductivity remains indirect and strongly dependent on calibration and petrophysical assumptions [13]. Complementing ERT, MRS offers a more specialized approach to characterizing aquifer properties. Based on Nuclear Magnetic Resonance (NMR) principles, MRS provides estimates of water content, hydraulic conductivity, and aquifer depth, making it a valuable tool for assessing groundwater resources [14,15,16,17].
Although hydrogeological investigations have been conducted in phosphate mining regions in Morocco and elsewhere, studies that constrain aquifer geometry and derive layer-by-layer hydraulic properties at mine-relevant resolution remain limited [18,19,20,21,22,23,24]. In the Moroccan phosphate context, recent work has demonstrated the value of combining methods such as MRS, ERT, time-domain electromagnetic methods (TDEM), and frequency-domain electromagnetic methods (FDEM) for groundwater assessment [18,20], yet differences in local geology and hydrodynamic conditions restrict direct transferability of interpretations to the Beni Amir deposit. Moreover, a key operational uncertainty persists regarding the hydraulic separation and piezometric expression of the Eocene and Senonian aquifers beneath Maastrichtian formations, which complicates attribution of inflows and the design of targeted depressurization schemes. Addressing this gap requires an integrated characterization that couples geophysical imaging with hydrodynamic and lithostratigraphic constraints to produce actionable, formation-specific parameters for dewatering.
Accordingly, this study applies an integrated ERT-MRS workflow to characterize the multilayer aquifer system of the Beni Amir deposit within the Oulad Abdoun phosphate basin. The objectives are to delineate the geometry of water-bearing phosphatic and associated sedimentary formations, estimate MRS-derived mobile water content, and assess the spatial variability of hydraulic conductivity across the deposit. These properties are needed to anticipate dewatering requirements as mining advances toward saturated layers. To limit non-uniqueness, geophysical interpretations are evaluated against drilling information, piezometric measurements, and available pumping-test data; this establishes a hydrogeophysical and hydrostratigraphic basis for identifying sectors that may require further hydraulic testing and for guiding future groundwater-flow modeling and pre-mining dewatering assessment.

2. Materials and Methods

2.1. Location of the Study Area

The Oulad Abdoun phosphate basin, located in Morocco’s Western Meseta structural region [25], is the country’s oldest and most productive phosphate district. Mining began shortly after the creation of the Office Chérifien des Phosphates (OCP) in 1920 [26], with the first commercial extraction starting at Khouribga in March 1921. Since then, the basin has become the backbone of Morocco’s phosphate industry, providing roughly 70% of national production and playing a major role in exports [26,27].
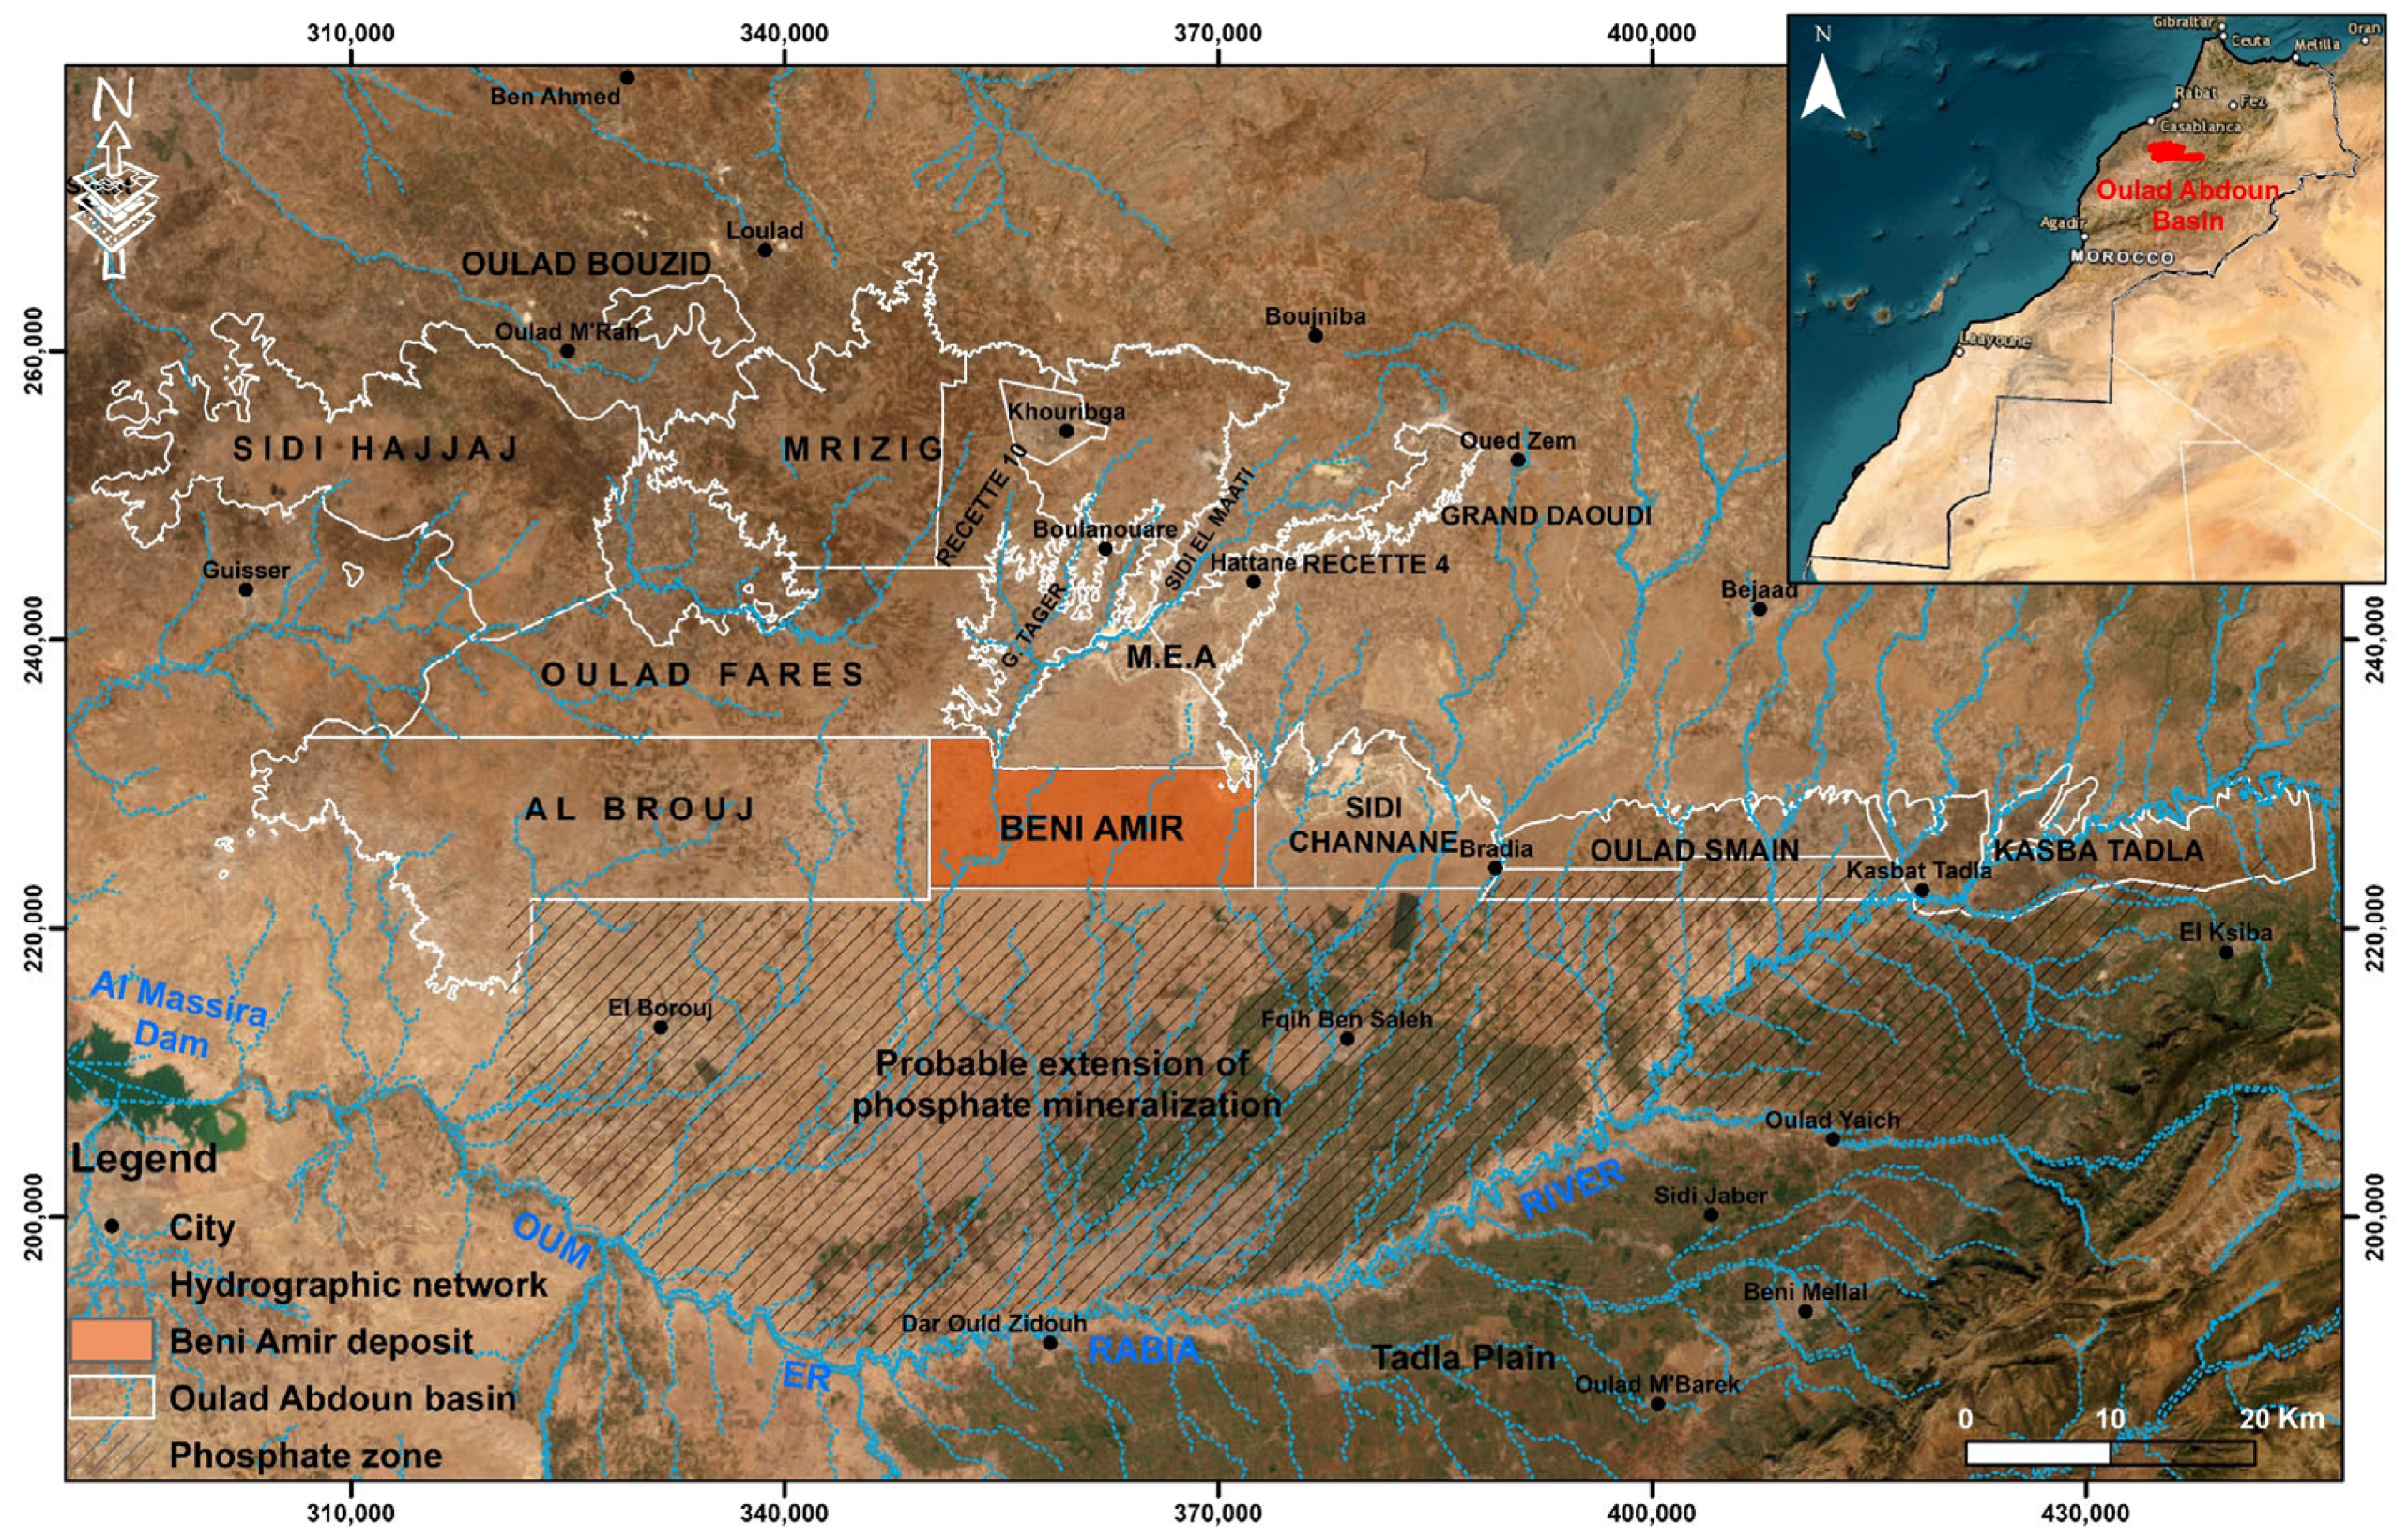
The basin contains at least 13 different phosphate deposits (Figure 1), ranging in age from the Late Cretaceous to the Eocene [28]. These deposits include Khouribga, Sidi Daoui, Merah El Ahrech, Mrizig, Sidi Hajjaj, Sidi Chennane, Ouled Fares, Al Brouj, Ouled Smain, Beni Amir, Ghar Tajer, Sidi El Maati, and Kasbat Tadla. The focus of this study is on the Beni Amir deposit, situated in the south of the Oulad Abdoun basin and measuring approximately 22.5 km from east to west and 8 km from north to south.

2.2. Geological and Hydrogeological Setting

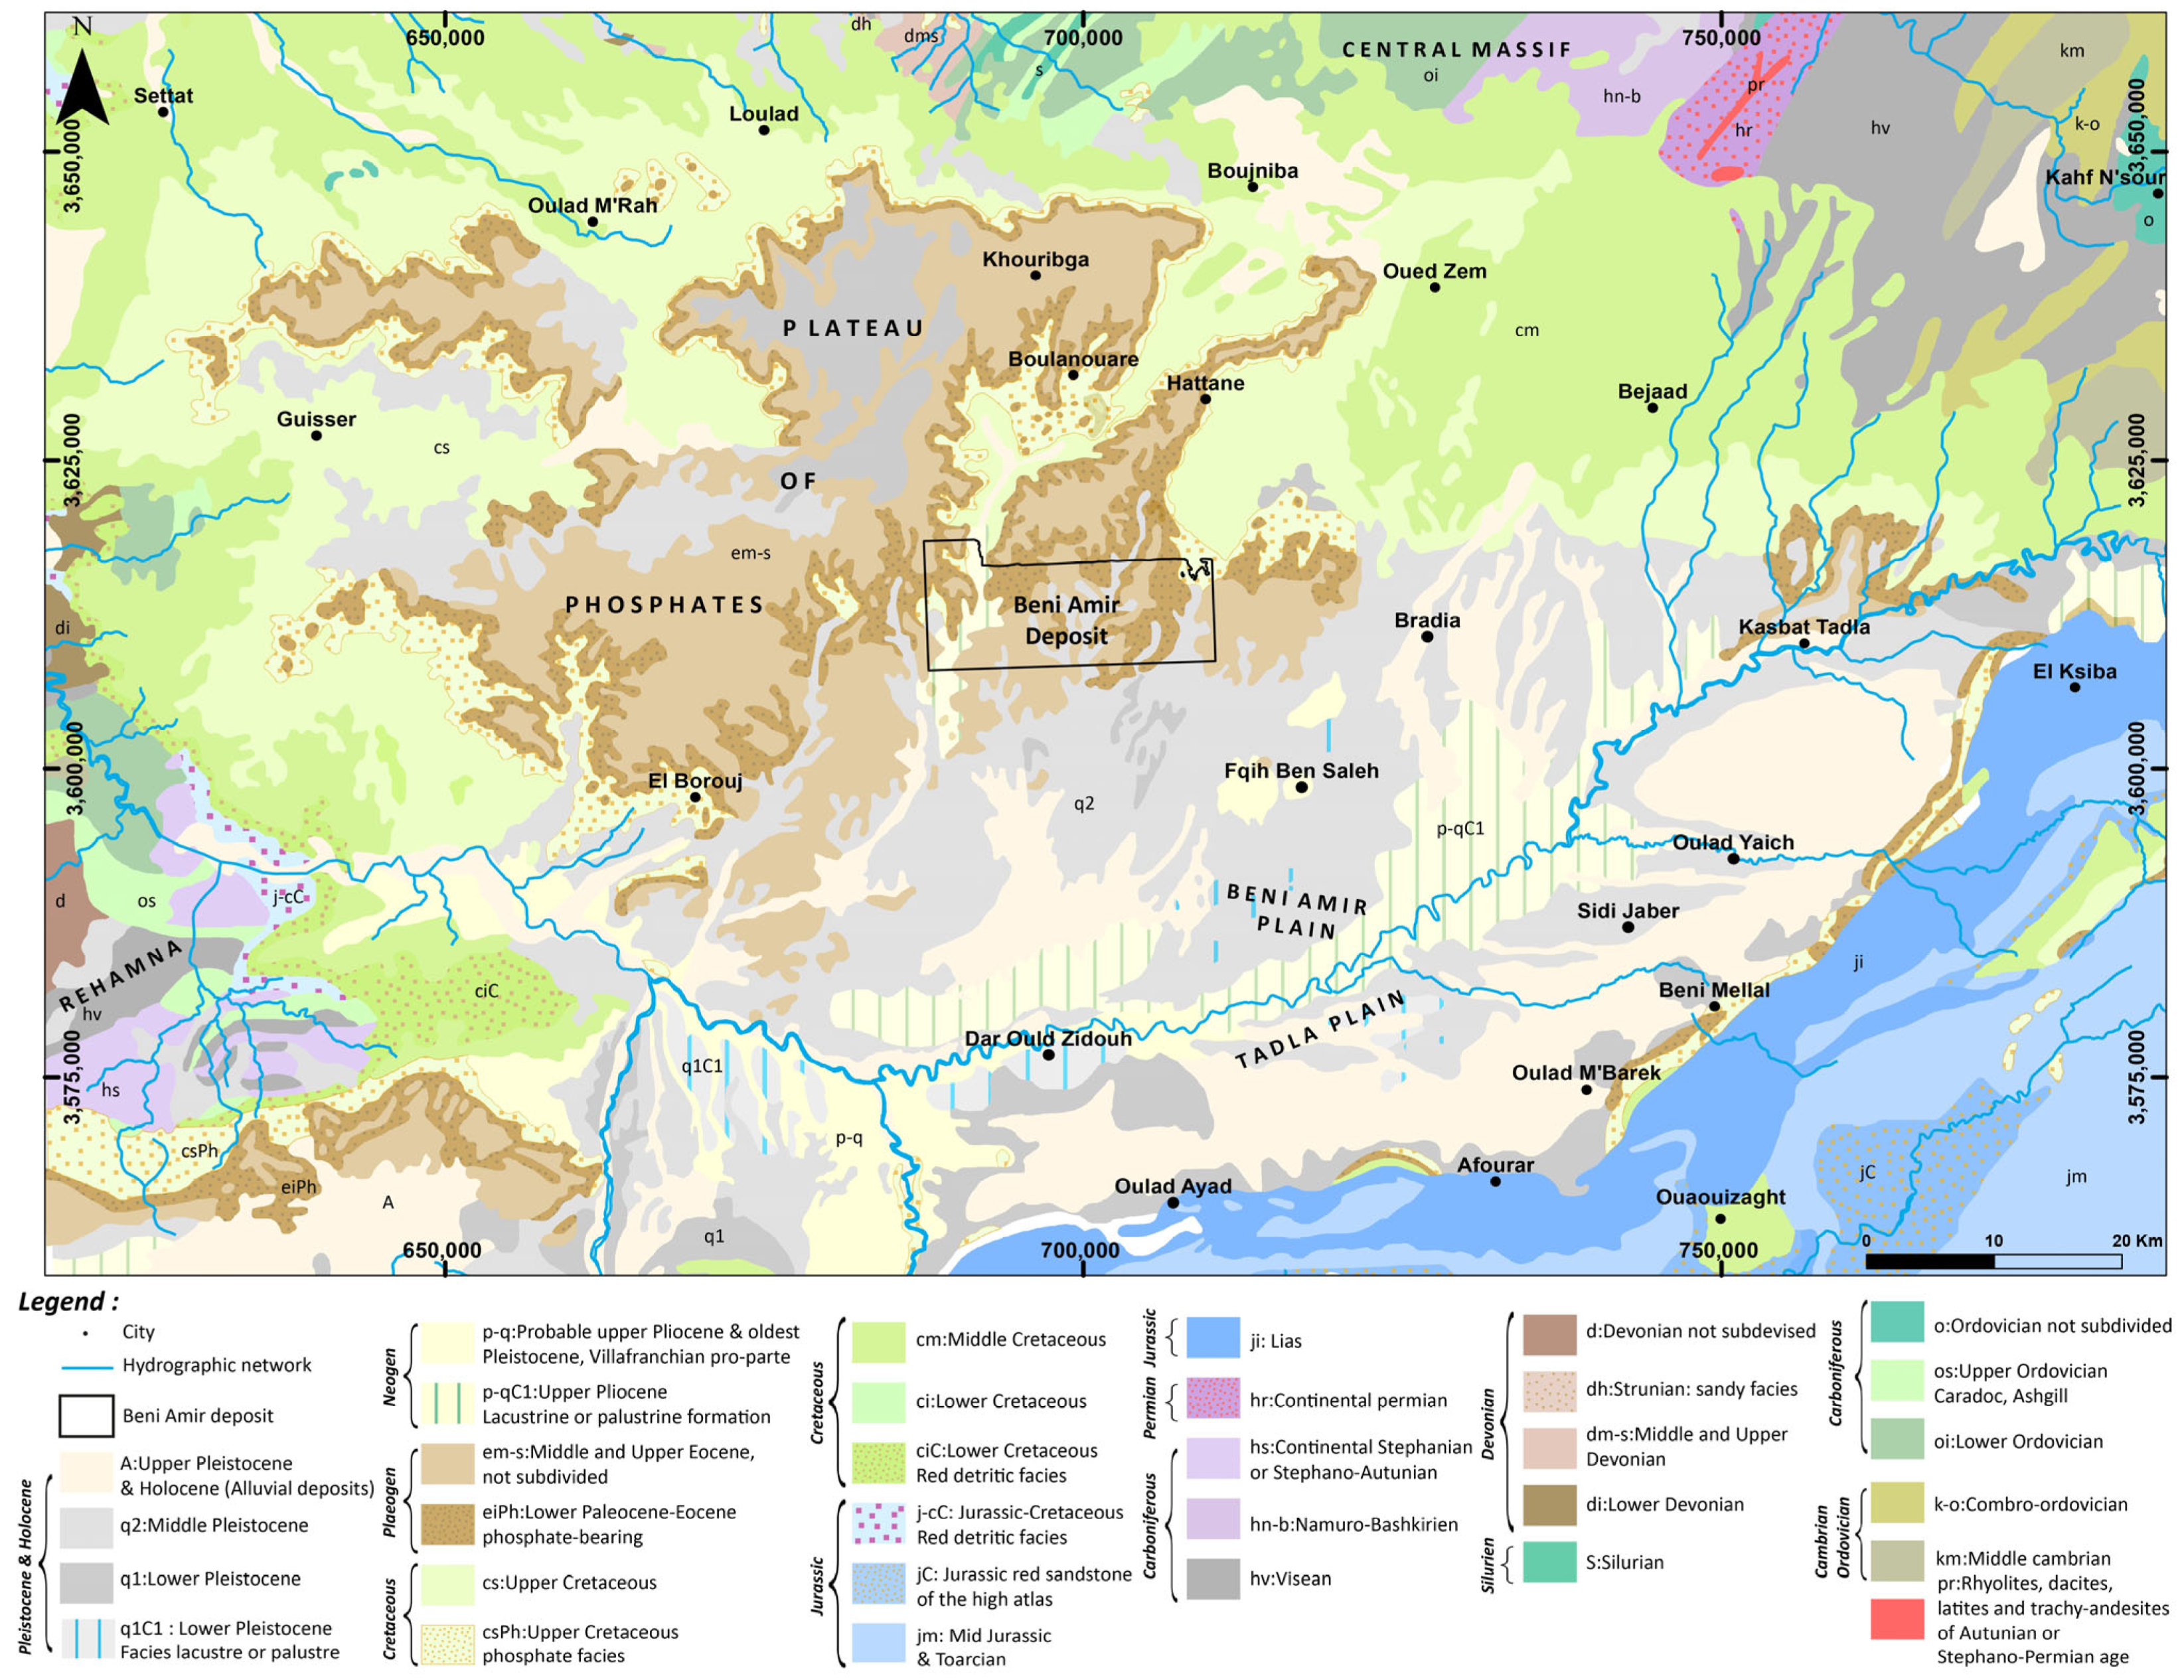
The Oulad Abdoun Basin is a key morphological unit within the Moroccan Mesetian domain, characterized by a nearly flat terrain with slight undulations and elevations ranging from 500 to 800 m. This basin is a stable platform composed of a phosphate sequence that spans from the red Infra-Cenomanian to the Upper Lutetian [29]. The geological layers include the Turonian limestone, which forms a significant water reservoir and is part of a complex aquifer system. This system, shared with the Phosphate Plateau and Tadla plain (Figure 2), includes multiple aquifers of varying hydraulic importance [30]. The geological structure of the basin is divided into seven main lithological units, each contributing to the region’s complex hydrogeological system:
(i) Cenomanian: Composed of highly gypsiferous benches and alternating marl and marl-limestone, it directly overlies the Paleozoic in the Bejaad and Kasba-Tadla regions [31,32];
(ii) Turonian: This predominantly limestone layer is significant as it forms a major aquifer, known for its water storage capacity. The Turonian limestone is strongly dolomitic and is heavily exploited in both the Khouribga area and the Tadla plain, making it the most important aquifer in the region;
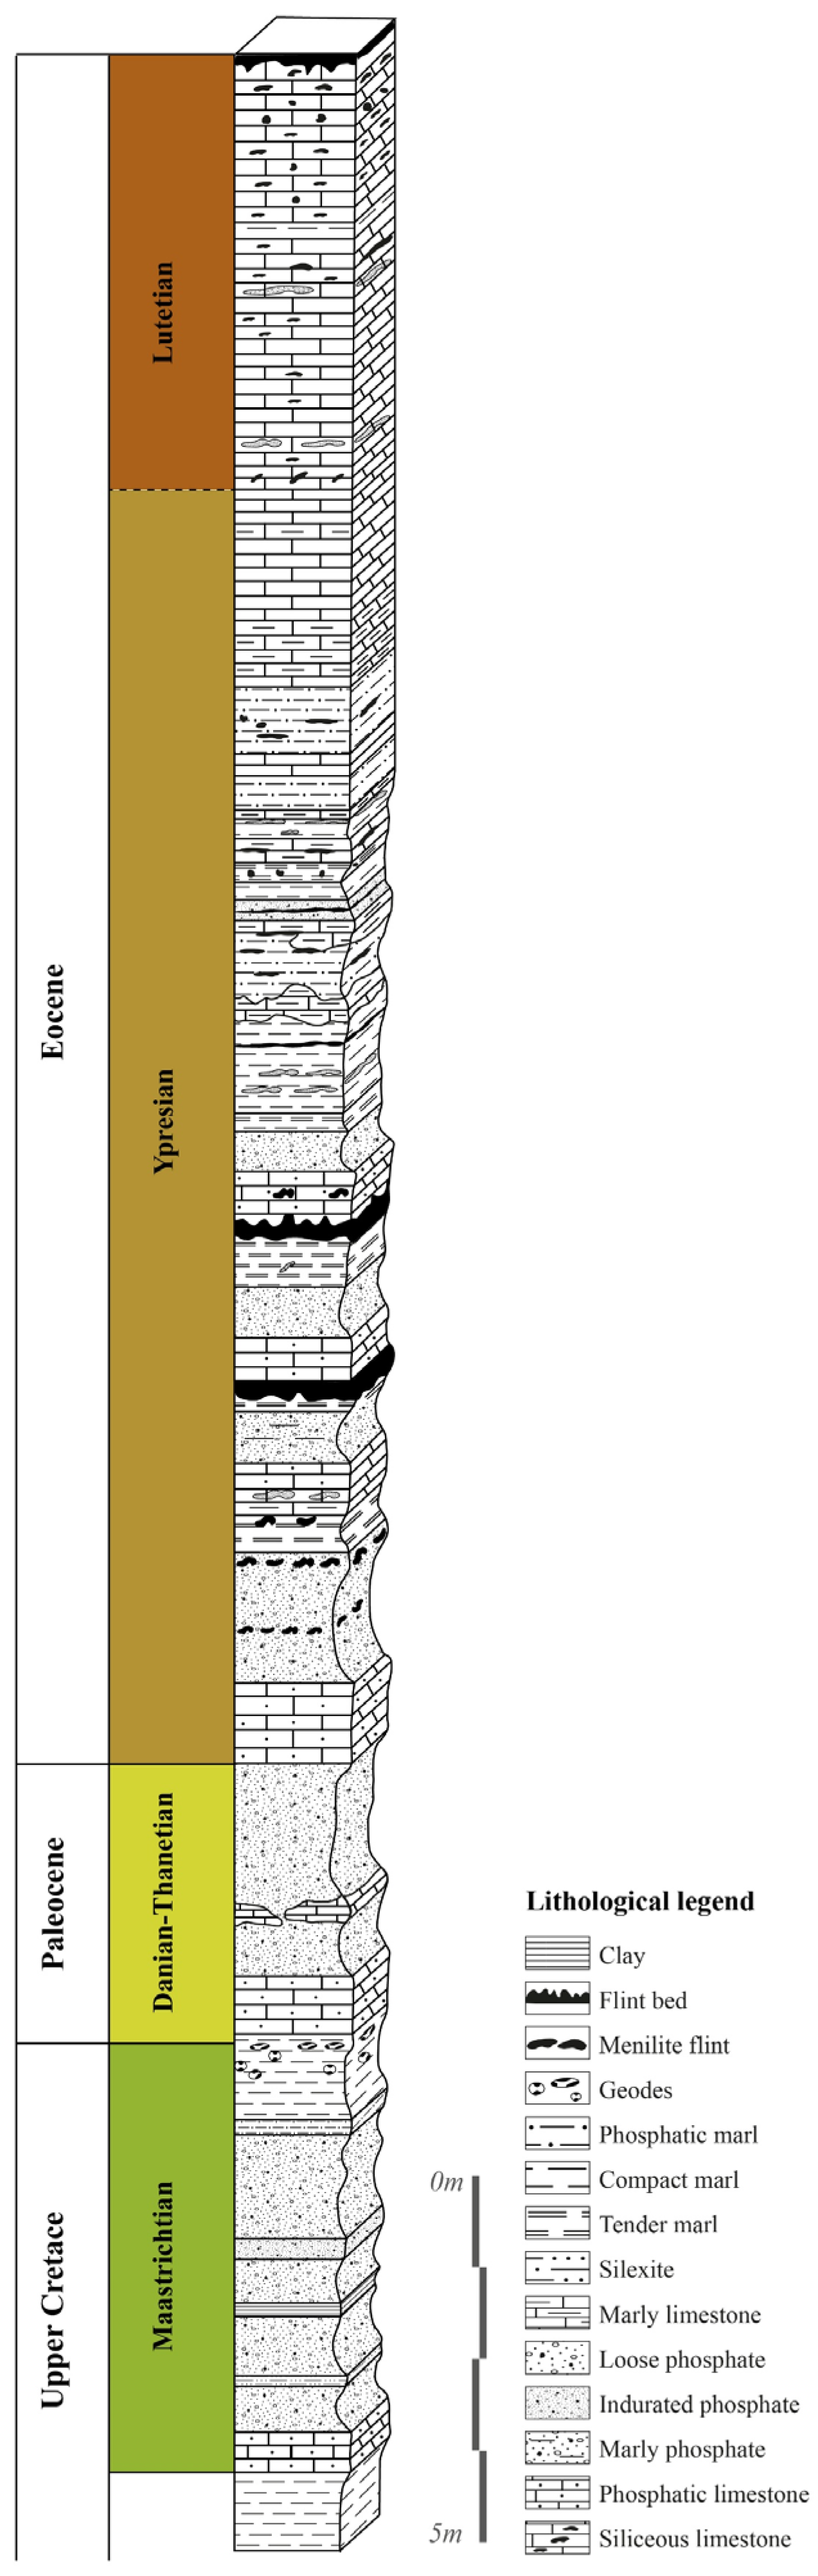
(iii) Senonian: Serving as the base for the phosphate series (Figure 3), the Senonian is a regressive marly limestone unit with thicknesses varying from 50 to 100 m. It consists of two marly layers separated by a limestone bar [33]. This unit plays a critical role in the hydrogeology of the region, forming part of the multilayered aquifer system. The flow direction is quite regular from north to south with a decreasing gradient towards the south;
(iv) Maastrichtian: Composed of marly phosphates and phosphate marls, the Maastrichtian layer begins with highly fossiliferous bone-bed limestone. This layer is integral to the phosphate series, contributing to the region’s mineral wealth [34]. Additionally, the Lower Maastrichtian is recognized as a high-potential water-bearing aquifer according to [20];
(v) Danian–Thanetian: This unit is made up of coarse phosphates, starting with phosphate limestones and transitioning to finer phosphates and marly phosphate limestone towards the top [35,36];
(vi) Ypresian: Typically beginning with phosphate limestone, the Ypresian layer includes a succession of phosphate levels intercalated with clays and siliceous marls [31,36];
(vii) Lutetian: Representing the end of phosphate sedimentation (Figure 3), the Lutetian layer is marked by both phosphatized and non-phosphatized limestones, marls, and a silicified Thersitées slab that caps the entire phosphate series [36]. Together, the Ypresian and Lutetian formations make up the Eocene aquifer, which is crucial for the phosphate region’s hydrogeology, contributing to the overall complexity of the aquifer systems. This aquifer covers an area of 7000 km2 and flows through the Eocene terrain in the Beni Oukil and El Bourouj regions and along the Tadla plain, where it eventually becomes confined as it extends southward beneath the Tadla [37].
Hydrogeologically, the Phosphate Plateau and the Tadla plain host a complex aquifer system with multiple layers. The overall system also includes the Mio-Plio-Quaternary, Eocene, and Senonian aquifers, which are separated by layers that limit water movement, yet allow for significant hydraulic intercommunication [38]. The Cenomanian-Turonian aquifer, which is unconfined in the Phosphate Plateau and confined under the Tadla plain, covers an area of about 10,000 km2, while the Eocene and Senonian aquifers further contribute to the region’s water resources.

2.3. Integrated Methodological Framework

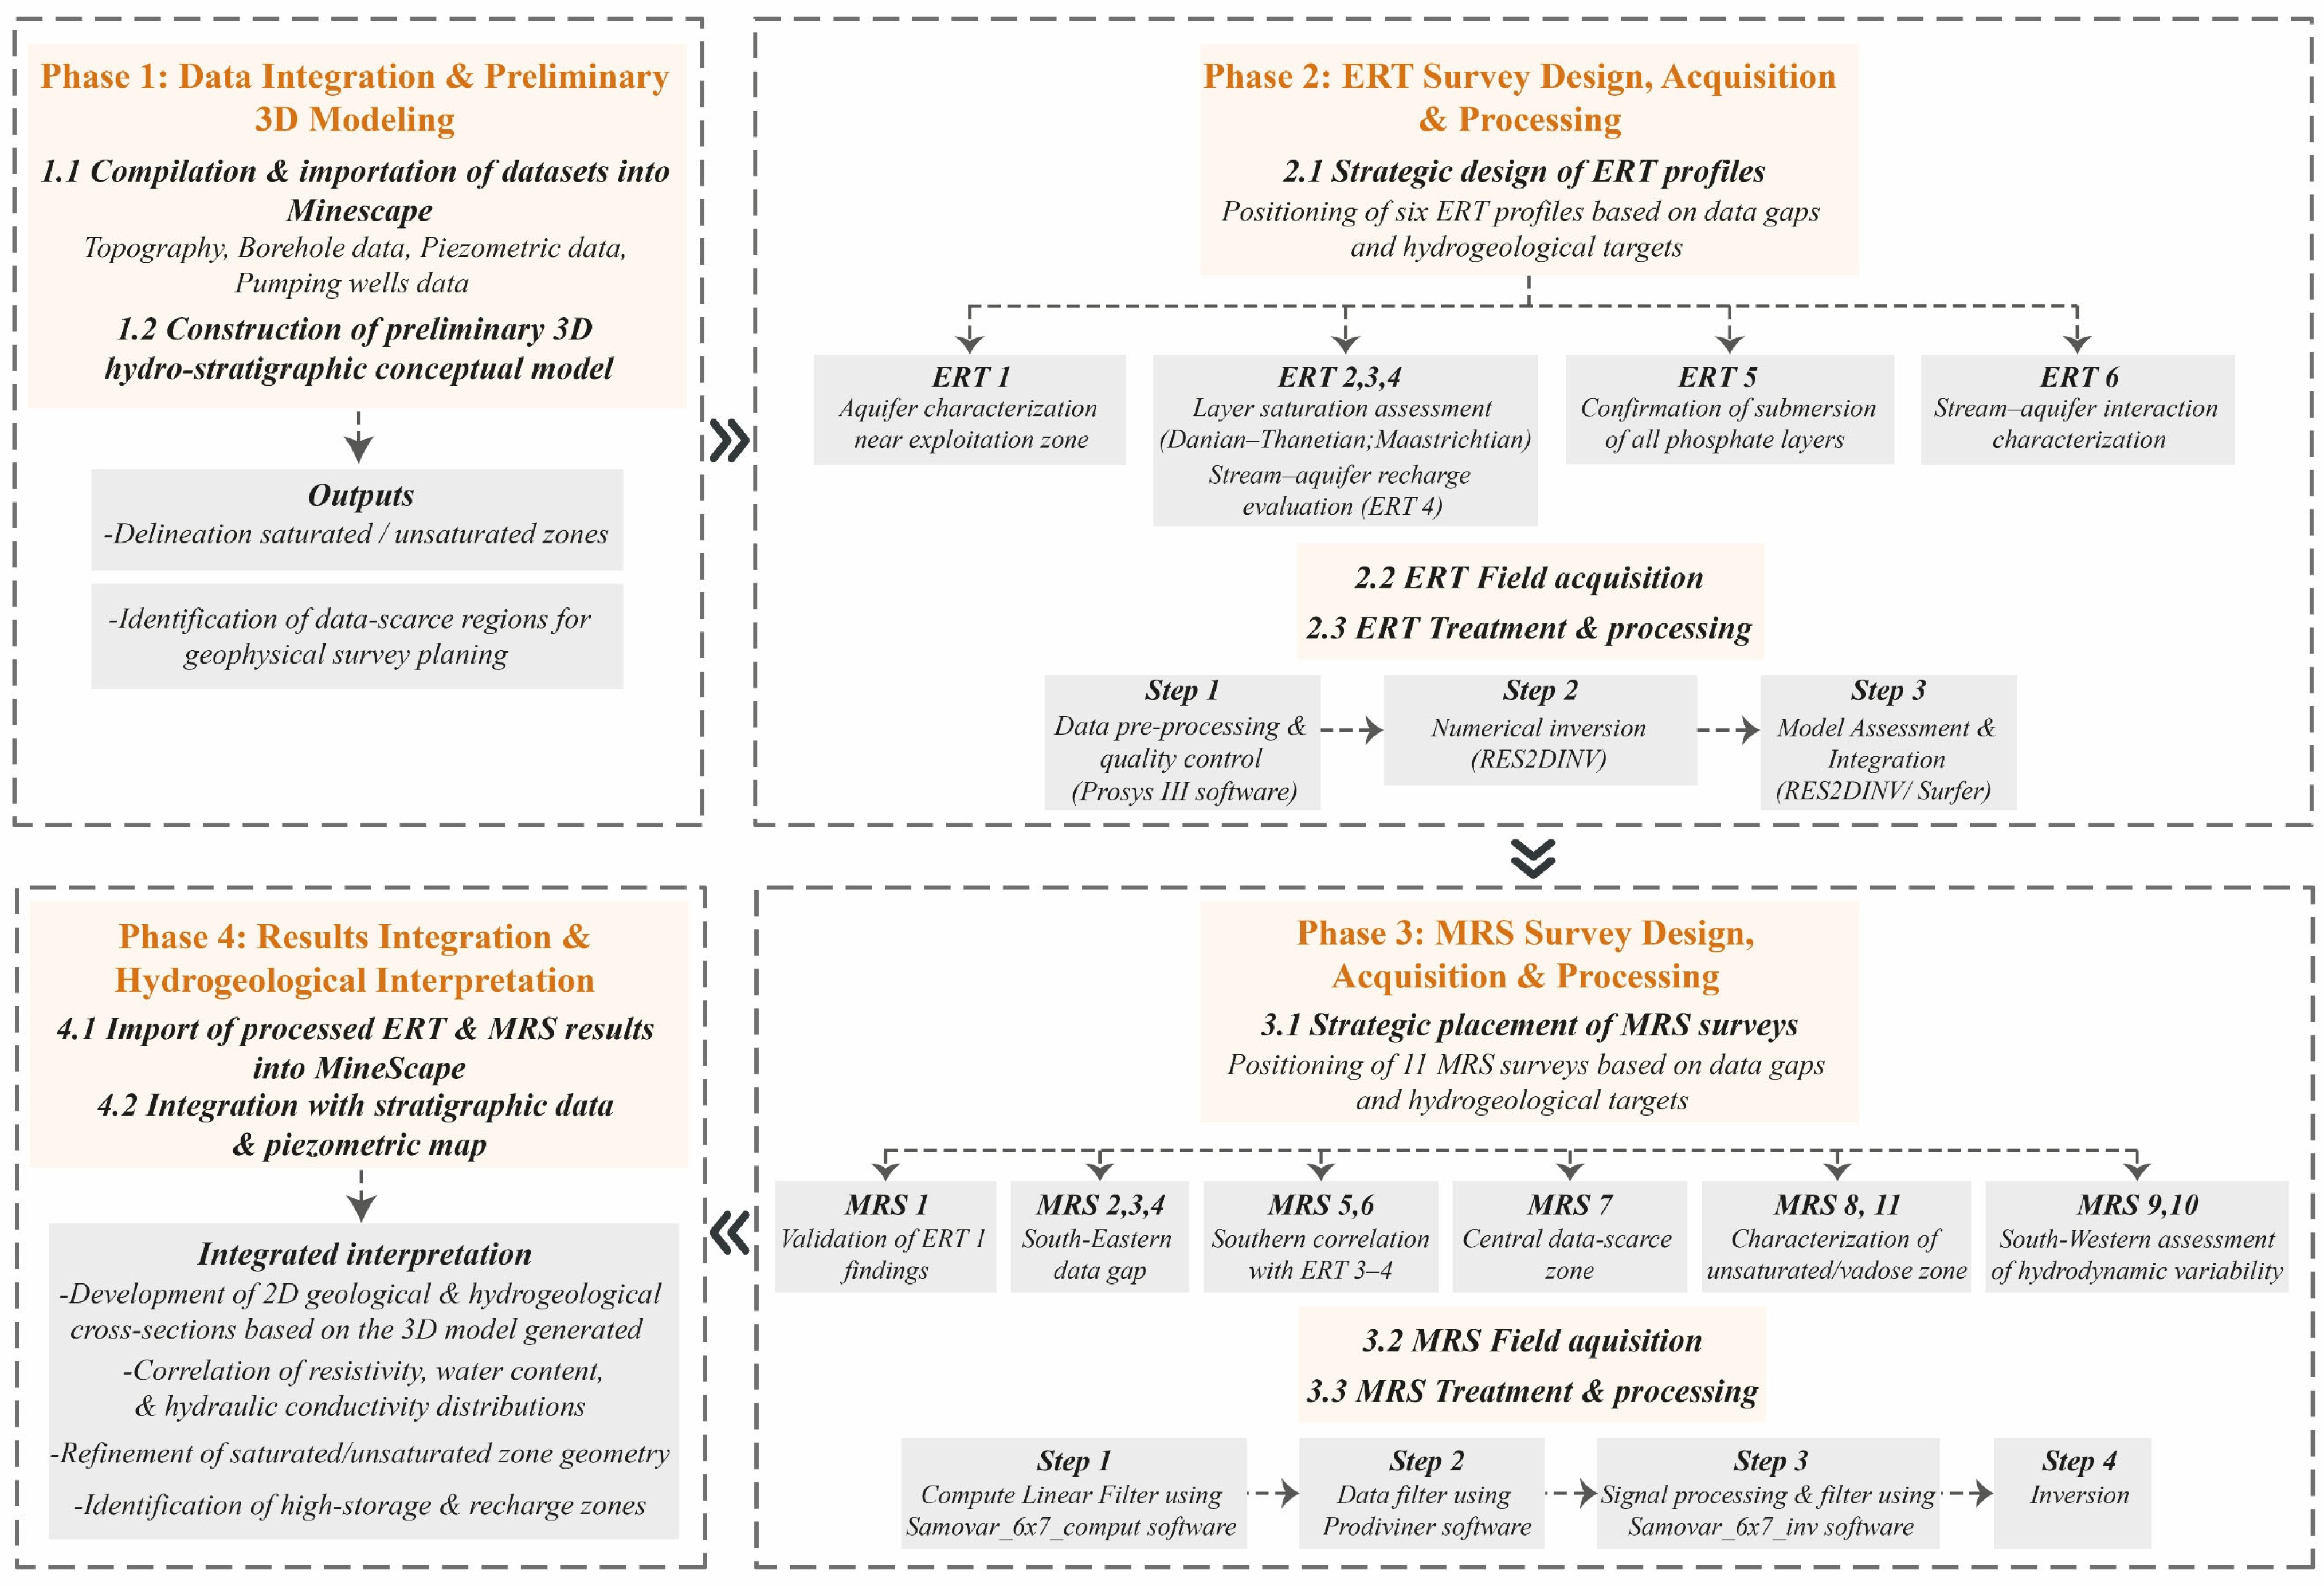
The methodological framework adopted in this study follows an integrated, multi-phase approach combining geological and hydrogeological datasets with Electrical Resistivity Tomography (ERT) and Magnetic Resonance Sounding (MRS) to characterize the aquifer systems of the Beni Amir deposit. The workflow is organized into four consecutive phases, illustrated in Figure 4, encompassing data integration and preliminary 3D modeling, ERT survey design and implementation, MRS survey design and implementation, and final integration with hydrogeological interpretation. This structure ensures that geophysical data collection is firmly grounded in geological constraints and that inversion results are evaluated within a consistent hydro-stratigraphic framework.

2.3.1. Data Integration and Preliminary 3D Modeling

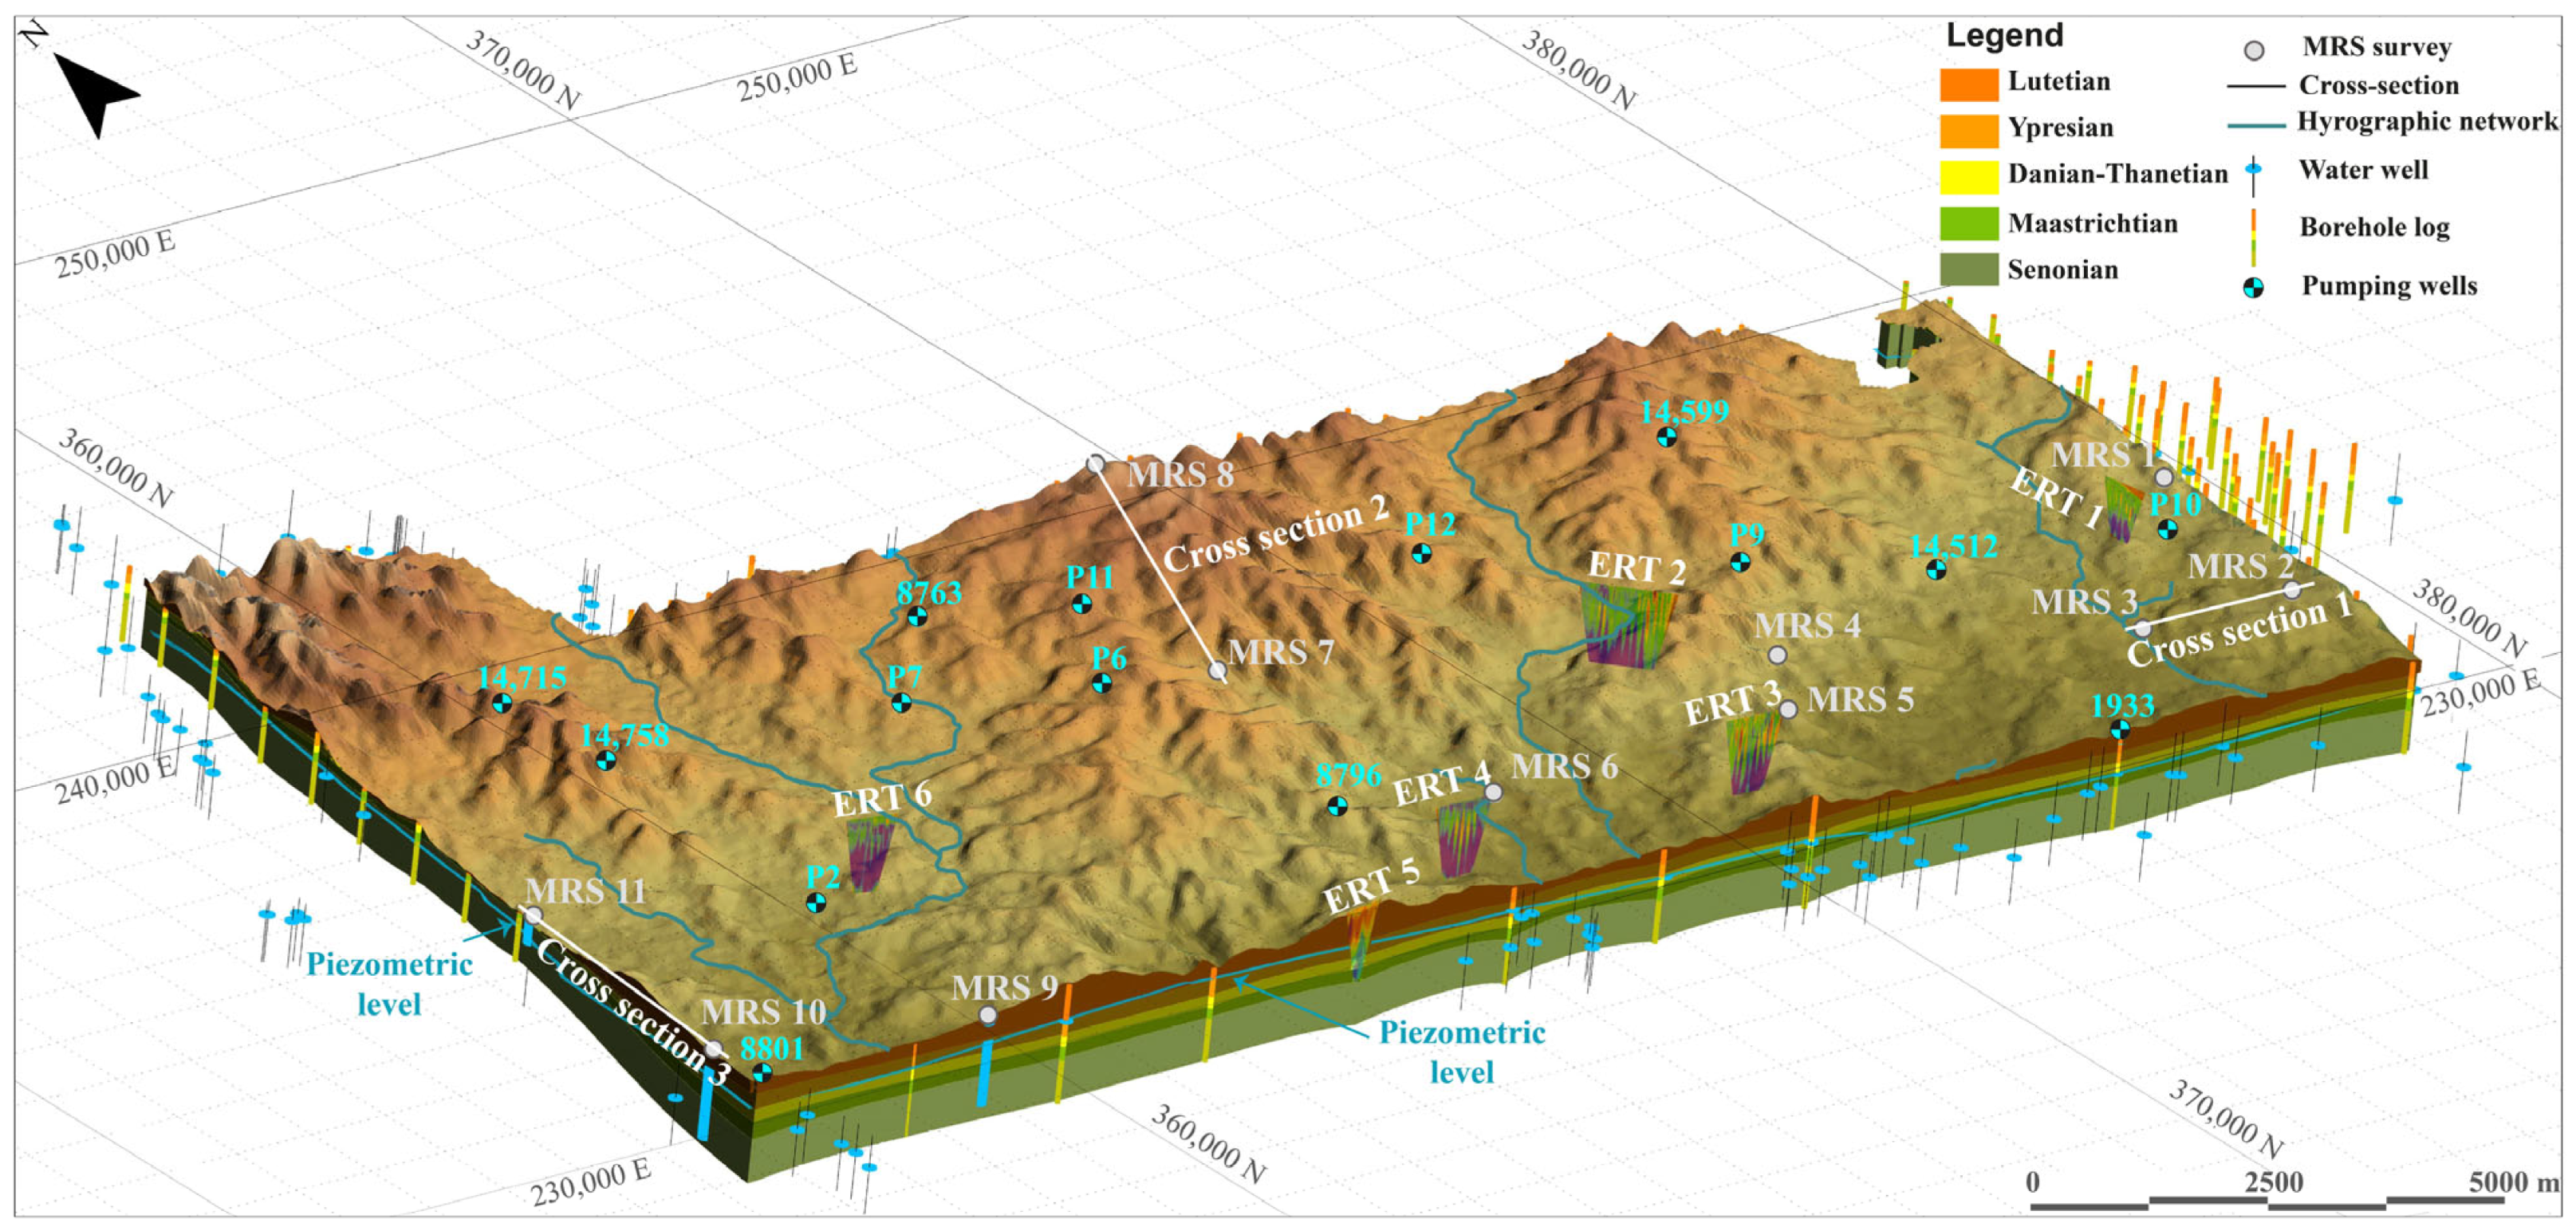
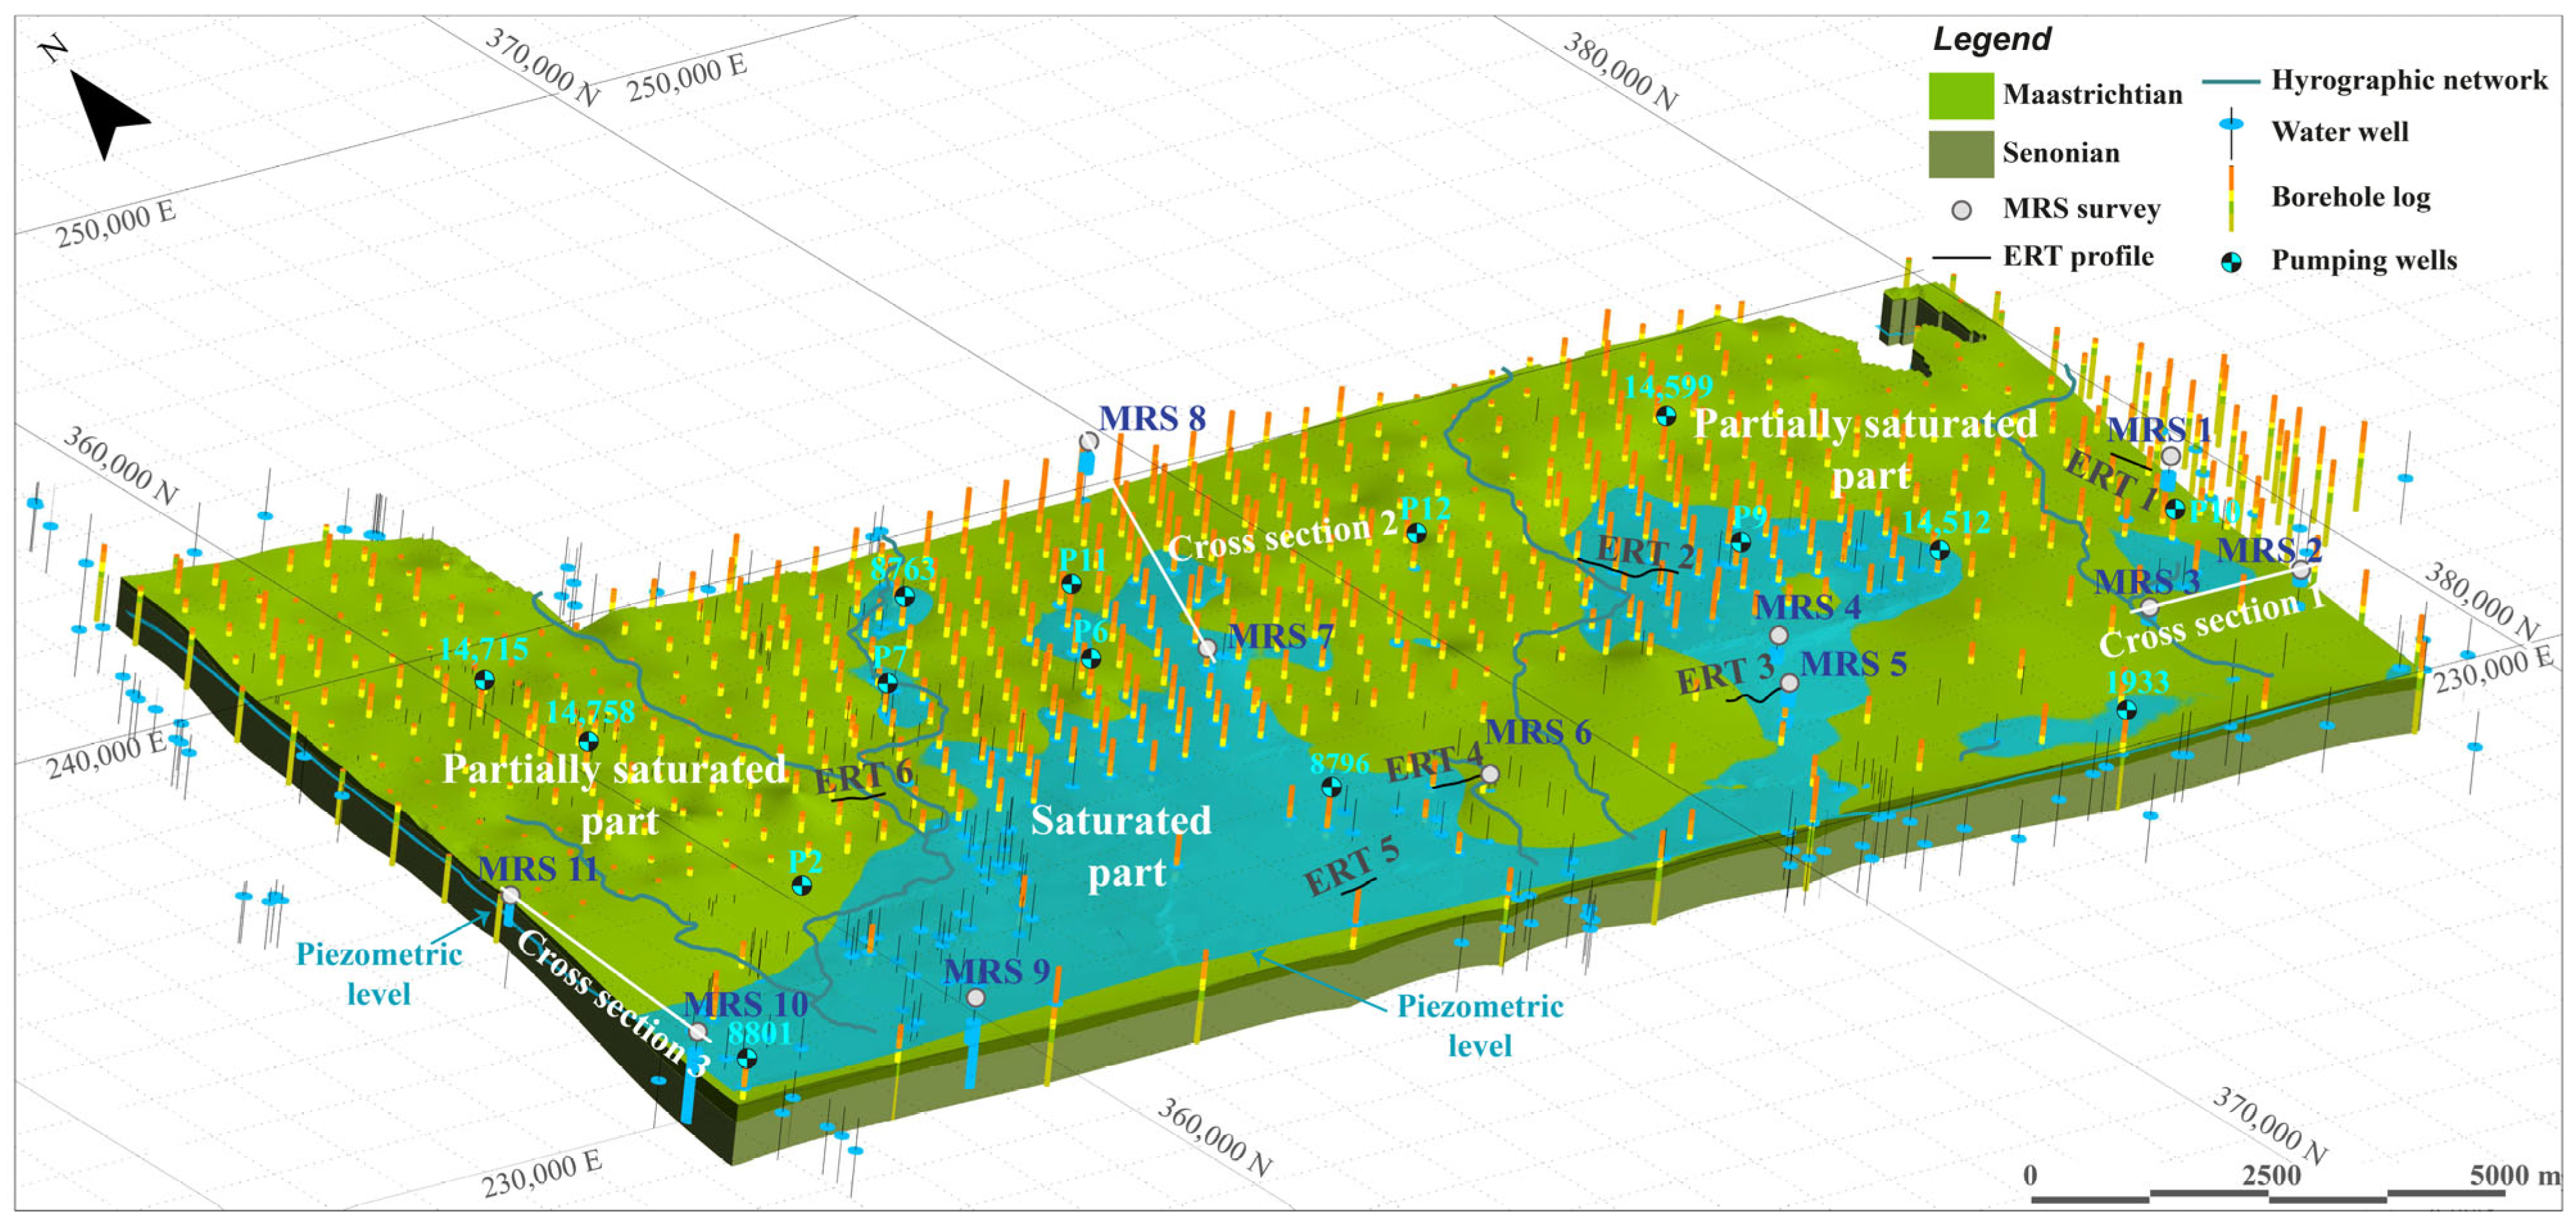
The investigation began with the compilation of existing topographical maps, borehole logs, piezometric data (collected in September 2023 from monitoring boreholes in the study area), hydrological data, and pumping well information. These datasets were imported into Datamine MineScape 2026 (build 13.0.209.0), for three-dimensional visualization and spatial analysis. A preliminary hydro-stratigraphic model (Figure 5) was constructed to delineate the spatial distribution of saturated and unsaturated zones, identify data-scarce regions, and guide the strategic placement of geophysical surveys. Survey sites were prioritized in the southern portion of the study area, where hydrogeological data were sparse. Site selection criteria included proximity to exploration wells for calibration, spatial coverage of data gaps, regions where aquifer boundaries remained uncertain, and adequate distance from electromagnetic interference sources for the MRS measurements. Following this approach, six ERT profiles and eleven MRS sites were established.

2.3.2. Electrical Resistivity Tomography (ERT)

i. 
Theoretical background
Electrical Resistivity Tomography (ERT) is a geophysical technique that images the subsurface by inferring the spatial distribution of electrical resistivity. This is achieved by injecting a controlled electrical current (I) into the ground through a pair of electrodes and measuring the resulting potential difference (ΔV) between other electrode pairs [39]. The apparent resistivity (ρ) in the Wenner configuration is calculated using the fundamental relationship: ρ = 2 π a ( V ) I where I is the applied current, V is the potential difference, and a is the electrode spacing. By varying electrode configurations, data at multiple depths and positions are collected [40].
The true subsurface resistivity distribution is then recovered through numerical inversion, a process that iteratively adjusts a subsurface model until the calculated apparent resistivities match the field measurements within an acceptable error threshold [41,42]. In hydrogeology, this method is particularly powerful as water-saturated zones typically exhibit low resistivity (<100 Ω·m) due to the presence of conductive pore water, providing a clear contrast with unsaturated sediments or resistive bedrock (>100 Ω·m).
ii. 
ERT field acquisition
Six ERT profiles were strategically established to address specific hydrogeological objectives as illustrated in Figure 4, Phase 2, 2.1. The ERT survey was carried out in May 2024. Data acquisition was conducted using a Syscal Pro Switch (Iris Instruments, Orléans, France) powered by a 12 V battery. Six multi-core cables, each with 16 electrodes spaced 5 m apart, were deployed. Survey parameters, including technical specifications, array type and depth of investigation, were pre-programmed using Electre Pro v.2.09 software, and then transferred to the measurement equipment before data acquisition began.
The initial profile (ERT 1) was measured using a dipole–dipole array, chosen for its high horizontal sensitivity. However, elevated noise levels caused by high electrode contact resistance (>10 kΩ), despite field efforts to improve electrode grounding, were reflected in standard deviations exceeding 10% and reduced data quality. Consequently, the subsequent profiles (ERT 2 to 6) employed an inverse Wenner-Schlumberger configuration, selected for its balanced sensitivity to both horizontal and vertical resistivity variations and its ability to achieve depths of investigation of 70–80 m [43], suitable for the target aquifers. Topographical data (X, Y, elevation) were recorded for each electrode to account for terrain variations [44]. For profiles ERT 2, 3, 4, and 6, the roll-along technique was implemented to extend profile lengths beyond the initial 96-electrode cable setup, allowing for continuous coverage of key geological features.
iii. 
Data processing and inversion
The processing and inversion of the ERT data followed a structured workflow to transform raw measurements into robust subsurface models (Figure 4, Phase 2, 2.3):
  • Data pre-processing and quality control: Raw data were imported into ProsysIII v02.10.01 software (IRIS Instruments, Orléans, France) for initial conditioning [45]. The primary function of this software was to merge roll-along segments, integrate topographic data, and apply rigorous quality filters. Data points exhibiting negative resistivity or a standard deviation greater than 10% were automatically removed. Subsequent manual inspection removed outliers, such as physically implausible readings [45].
  • Numerical inversion: The filtered apparent resistivity datasets, now coupled with their corresponding topographic coordinates, were inverted using RES2DINV ver.3.55 software (Geotomo software, Malaysia). This software implements a smoothness-constrained, least-squares inversion algorithm based on the Gauss-Newton method [42]. The inversion process works to minimize the difference (root-mean-square error (RMS)) between the measured apparent resistivities and those calculated from the subsurface model [46]. A smoothness constraint is applied to stabilize the solution and produce geologically plausible models.
  • Model assessment and integration: The inversion process typically converged within 3 to 5 iterations, yielding final RMS errors of less than 14% for all profiles, indicating a good fit between the model and the field data. The resulting 2D resistivity models were exported from RES2DINV as georeferenced grids. These grids were then imported into Surfer 13 for final visualization and contouring, applying a consistent color scale across all profiles. Finally, the validated models were imported into the MineScape software for integration with borehole stratigraphy and piezometric data. Nearby boreholes were projected onto the ERT profiles to compare resistivity contrasts with stratigraphic boundaries and groundwater levels. Resistivity ranges were then assigned to hydrogeological units based on their spatial correspondence with lithology and saturation state.

2.3.3. Magnetic Resonance Sounding (MRS)

i. 
Theoretical background
Magnetic Resonance Sounding (MRS) is a non-invasive geophysical technique based on Nuclear Magnetic Resonance (NMR) principles and is used to detect and quantify groundwater in the subsurface [47,48,49]. In the Earth’s magnetic field, hydrogen nuclei in groundwater align their magnetic moments with the field direction. When an electromagnetic pulse tuned to the Larmor frequency is transmitted through a surface loop, this alignment is perturbed and the protons begin to precess coherently. Following pulse termination, the protons relax back to equilibrium and generate a weak oscillating magnetic field known as the Free Induction Decay (FID), recorded by the same loop after a dead time of approximately 30 ms [50,51].
The FID amplitude is directly proportional to the number of excited hydrogen nuclei and thus provides a quantitative estimate of mobile water content (w). The temporal decay constant (T2*), which characterizes the FID envelope, reflects pore-size distribution: short T2* values occur in fine-grained materials with limited pore connectivity and low hydraulic conductivity, whereas longer T2* values are indicative of coarser sediments with higher hydraulic conductivity [52]. Because MRS responds only to mobile water, it does not detect bound water in clay minerals [53]. Consequently, MRS-derived water content represents mobile (detectable) water and underestimates total porosity in clay-rich intervals.
ii. 
MRS field acquisition
MRS measurements were collected using the NUMIS POLY system (IRIS Instruments) with a 100 × 100 m square loop, enabling effective investigation depths of approximately ~100 m. Survey locations were selected based on hydrogeological objectives defined in Figure 4, Phase 3, 3.1 and the availability of stratigraphic and piezometric information from nearby wells, allowing direct calibration of MRS-derived parameters. A reference noise loop was installed at each site to record ambient electromagnetic noise for subsequent subtraction [47,54].
The Earth’s magnetic field at the study area was measured using a Geometrics G-857 magnetometer, yielding an average field strength of 41,276.15 nT and a corresponding Larmor frequency of 1758.41 Hz. Data acquisition was performed with ProDiviner v.04.05.02 software [55]. Preliminary tests utilized 16 pulse moments and 80 stackings to evaluate noise conditions. Full datasets were acquired using 20 pulse moments with 80–120 stackings, depending on local electromagnetic noise levels. Ambient noise remained below 88.5 nV at most stations; however, MRS-8 exhibited elevated interference related to nearby high-voltage power lines and electric fences. Of the 17 sounding sites initially planned, six were rejected because persistent noise prevented stable signal recording. Eleven soundings were successfully acquired and retained for interpretation.
iii. 
Data processing and inversion
MRS data processing followed a structured workflow consisting of forward-kernel computation, noise reduction, and inversion as illustrated in Figure 4, Phase 3, 3.3.
  • Forward-kernel computation (linear filter): The processing sequence began with the computation of the linear filter using Samovar 6×7 computing module. This step required defining the MRS loop geometry, specifying the Larmor frequency measured in the field, and setting the inclination of the geomagnetic field (GMF). Additional parameters included the maximum investigation depth, pulse duration, and the geoelectrical cross-section [55]. At locations where ERT data were available, one-dimensional resistivity models derived from ERT inversions were incorporated into the kernel computation. Integrating a realistic resistivity structure improves the accuracy of the forward response and enhances the stability of the subsequent inversion [56].
  • Signal conditioning and noise reduction: Measured MRS signals were first imported into ProDiviner for pre-processing. At several sites, the “use for filtering signal” option was activated, enabling the subtraction of the reference-loop data from the primary loop response. This coherent noise-cancellation technique efficiently suppresses ambient electromagnetic interference from power lines and industrial sources, an essential step at sites affected by high noise levels. During subsequent processing in Samovar_6×7_inv, several filters were applied. A 50 Hz notch filter removed power-line interference, while a wide-band notch filter attenuated harmonic and broadband industrial noise. Additional filters, such as the band-pass or RC filter, were selectively applied depending on local noise conditions to isolate the resonance band around the Larmor frequency. A 100 ms processing window was used to retain the principal portion of the Free Induction Decay (FID) signal while excluding late-time noise. These combined filtering steps markedly improved the signal-to-noise ratio (S/N) and ensured that only stable, physically meaningful signals were used for inversion. At sites where the signal remained dominated by electromagnetic noise despite these filtering steps, the sounding was rejected and excluded from inversion.
  • Inversion using Samovar_6×7 inversion module: The inversion stage was performed using Samovar_6×7_inv inversion module, which requires the linear filter and the filtered MRS dataset as inputs. The software applies a regularized least-squares algorithm to estimate the vertical distributions of mobile water content (w) and relaxation time (T2*). For each pulse moment, the measured FID amplitudes are compared with synthetic FIDs computed from the forward kernel, and discrepancies are minimized while applying smoothness constraints to prevent non-physical oscillations in the model. The program also includes a blacklist function allowing the exclusion of noisy pulse moments, thereby preventing corrupted measurements from biasing the inversion. The number of layers and the regularization level were automatically selected based on data quality. The inversion outputs include depth profiles of w and T2*, along with diagnostic parameters such as fitting error, signal-to-noise ratio, and EN/IN noise ratios for each sounding. Additional outputs included the amplitude–pulse moment relationship and frequency-stability plots used to assess measurement consistency. Based on the T2* distribution, the software also derived first-order estimates of hydraulic conductivity and the cumulative transmissivity profile. These outputs formed the basis for subsequent hydrogeological interpretation and were used to constrain the aquifer structure and hydrodynamic properties in Phase 4.
Based on the inverted (w) and the T2* distribution, first-order estimates of hydraulic conductivity were calculated using the empirical relationship K = C P w ( T 2 * ) 2 , where K is hydraulic conductivity, w is the MRS water content, T 2 * is the relaxation time, and ( C P ) is an empirical calibration coefficient [53,57,58]. The cumulative transmissivity profile was then calculated as T = K i Z i , where ( K i ) is the hydraulic conductivity of layer i , and ( Z i ) is the corresponding layer thickness [58]. Because ( C P ) is lithology dependent and ideally requires calibration against pumping-test data; these estimates are considered first-order approximations. These outputs formed the basis for subsequent hydrogeological interpretation and were used to constrain the aquifer structure and hydrodynamic properties in Phase 4.

2.3.4. Data Integration and Hydrogeological Interpretation

Following completion of geophysical data acquisition and processing, the inverted ERT resistivity sections and MRS water content profiles were integrated with existing hydrogeological data using MineScape software (Figure 6). This phase complemented the preliminary 3D modeling conducted in Phase 1 by incorporating geophysical constraints to refine the hydrostratigraphic framework.
All datasets were georeferenced to a common coordinate system prior to import into the MineScape environment. The processed geophysical data, consisting of two-dimensional grids exported from Surfer 13 for ERT and one-dimensional depth profiles for MRS, were imported alongside borehole stratigraphic logs and piezometric level measurements. The integration workflow utilized MineScape’s slicing function to generate vertical cross-sectional corridors oriented along the ERT profile azimuths. These corridors provided a framework for displaying multiple data types in spatially consistent two-dimensional sections.

3. Results

The results derived from the inversion of six ERT profiles and eleven MRS surveys are presented below. The selection of MRS measurement presented was guided by data quality criteria, primarily based on signal-to-noise ratios ranging from 2.15 to 10.03. The results are organized according to the area’s hydrostratigraphic framework, progressing from partially saturated zones toward the saturated part of the deposit, where the Maastrichtian phosphate layer lies below the piezometric surface. This approach allows for a detailed characterization of aquifer geometry, groundwater distribution and hydrodynamic parameters.
In this study, the distinction between partially saturated and saturated sectors is based primarily on the position of the piezometric surface relative to the stratigraphic boundaries of the phosphate-bearing formations. A formation was considered saturated where the piezometric level lies above its top surface, partially saturated where the piezometric level intersects the formation between its top and base, and unsaturated where the piezometric level lies below its base. Borehole logs and ERT resistivity patterns were then used as complementary evidence to refine the geometry and lateral continuity of the water-bearing intervals. The resulting subdivision of the deposit into partially saturated and saturated sectors, shown in the hydrostratigraphic conceptual model (Figure 5), follows directly from this criterion.
This distinction is important because MRS-derived water content represents mobile or detectable groundwater content, not total saturation. Similar MRS water-content ranges may therefore occur in both partially saturated and saturated sectors, depending on lithology, pore structure, clay content, and groundwater mobility; in clay-rich or marly intervals, a saturated formation may show relatively low MRS water content where part of the water is bound or poorly mobile. For this reason, MRS results were not used as a direct threshold to classify saturation state, but as an indicator of mobile groundwater within the hydrostratigraphic framework constrained by drilling and piezometric data.

3.1. Partially Saturated Part of the Deposit

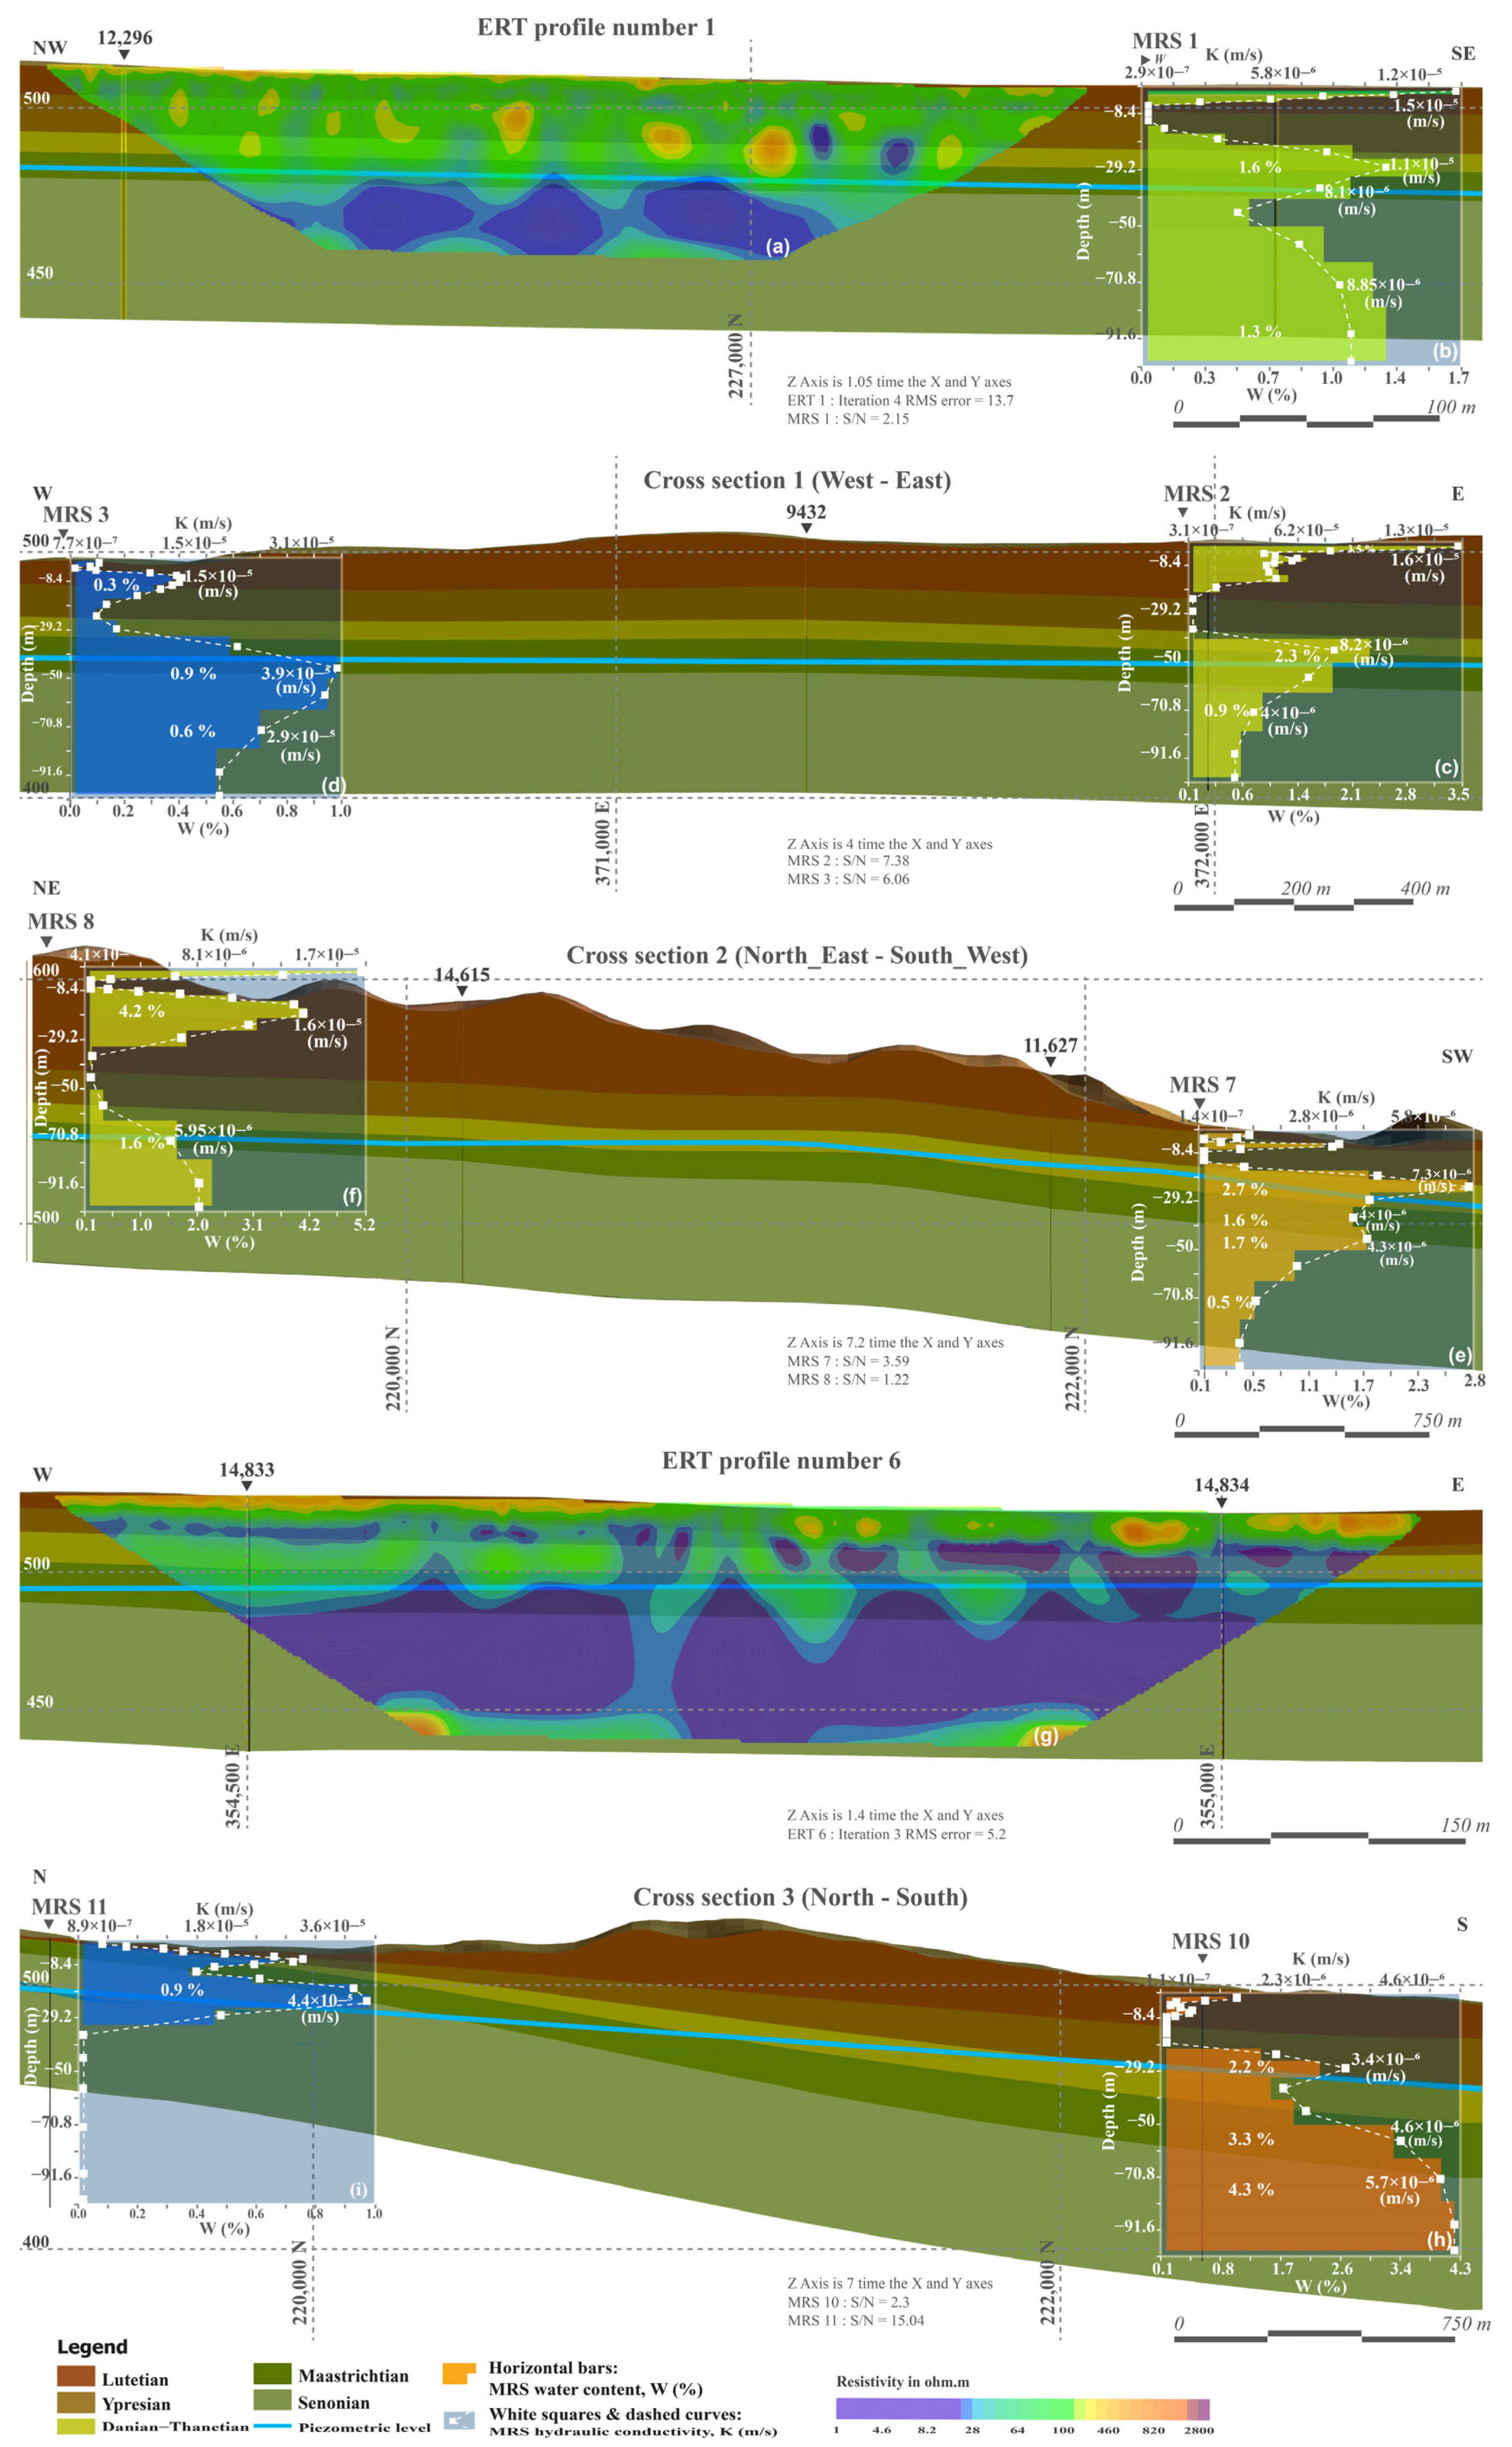
The partially saturated zone was investigated through a combination of two ERT profiles and seven MRSs distributed across three cross-sections (Figure 7). ERT provided laterally continuous two-dimensional resistivity images calibrated against stratigraphic borehole columns, while MRS supplied depth-resolved, quantitative estimates of water content and hydraulic conductivity at discrete sounding locations. The principal hydrogeological parameters derived from all MRSs are compiled in Table 1, and the observations from each transect are described below.
ERT Profile 1 and MRS 1—Eastern sector. ERT profile 1, Figure 7a, a 475 m northwest southeast profile located approximately 900 m east of the current exploitation limit, yielded resistivity values spanning 1–2800 Ω·m. Low-resistivity zones (<28 Ω·m)[59], corroborated by an on-site piezometric measurement of 35.68 m depth, are attributed to water-saturated Maastrichtian uncemented phosphate and Senonian marly limestone. Resistive units (100–2800 Ω·m) at depths between 0 and 35 m correspond to dry phosphatic limestone of the Upper Maastrichtian, Paleocene, and Eocene. Elevated contact resistance required replacement of the dipole–dipole array with the Wenner–Schlumberger configuration for all subsequent profiles. MRS 1, Figure 7b, located 302 m west of the ERT line, delineates three water-bearing horizons whose depths, water contents, and hydraulic conductivities are reported in Table 1.
Cross-section 1—Southwestern sector (MRS 2 and 3). Both soundings, Figure 7c,d, resolve the same tripartite aquifer architecture (Lutetian/Danian–Thanetian/Maastrichtian–Senonian; Table 1). A notable anomaly occurs at MRS 3, where the shallow Lutetian unit (4–16 m) exhibits anomalously low water content (0.3%) despite a relatively high hydraulic conductivity (1.5 × 10⁻⁵ m/s). A borehole located approximately 400 m from the profile confirms a water table at ~39 m depth, consistent with the MRS interpretations.
Cross-section 2—North central sector (MRS 7 and 8). MRS 7, Figure 7e, situated adjacent to a dry dam (no surface water at the time of investigation), identifies three aquifer units consistent with the regional stratigraphy (Table 1). The predicted water level is validated by a borehole located approximately 22 m from the sounding. MRS 8, Figure 7f, positioned northward, records the highest shallow water content observed across the study area (4.2% at 10–30 m within the Lutetian formation).
ERT Profile 6—Western transect. This 795 m profile, Figure 7g, intersects an intermittent stream and reveals three resistivity-defined units: dry Lutetian limestone (280–1000 Ω·m) at the profile margins, intermediate Ypresian–Thanetian layers (50–100 Ω·m), and a basal Maastrichtian—Senonian saturated system (1–28 Ω·m). The high-resistivity Lutetian unit disappears between 320 and 520 m at the stream crossing, where a thin, near-surface conductive anomaly is present.
Cross-section 3—South-western part (MRS 10 and 11). MRS 10, Figure 7h, identifies three aquifer horizons with water contents increasing with depth (1.2–2.1% to 4.3%, Table 1), and the results are in agreement with adjacent borehole logs and piezometric measurements. At MRS 11, Figure 7i, the sounding response is dominated by a single, shallow aquifer (15–27 m) exhibiting low water content (0.9%) and elevated hydraulic conductivity (4.4 × 10⁻⁵ m/s). A borehole located approximately 364 m to the southeast confirms that the upper phosphate formations, with the exception of the Maastrichtian, are absent in this area due to erosional truncation along the western margin of the deposit.

3.2. Saturated Part of the Deposit

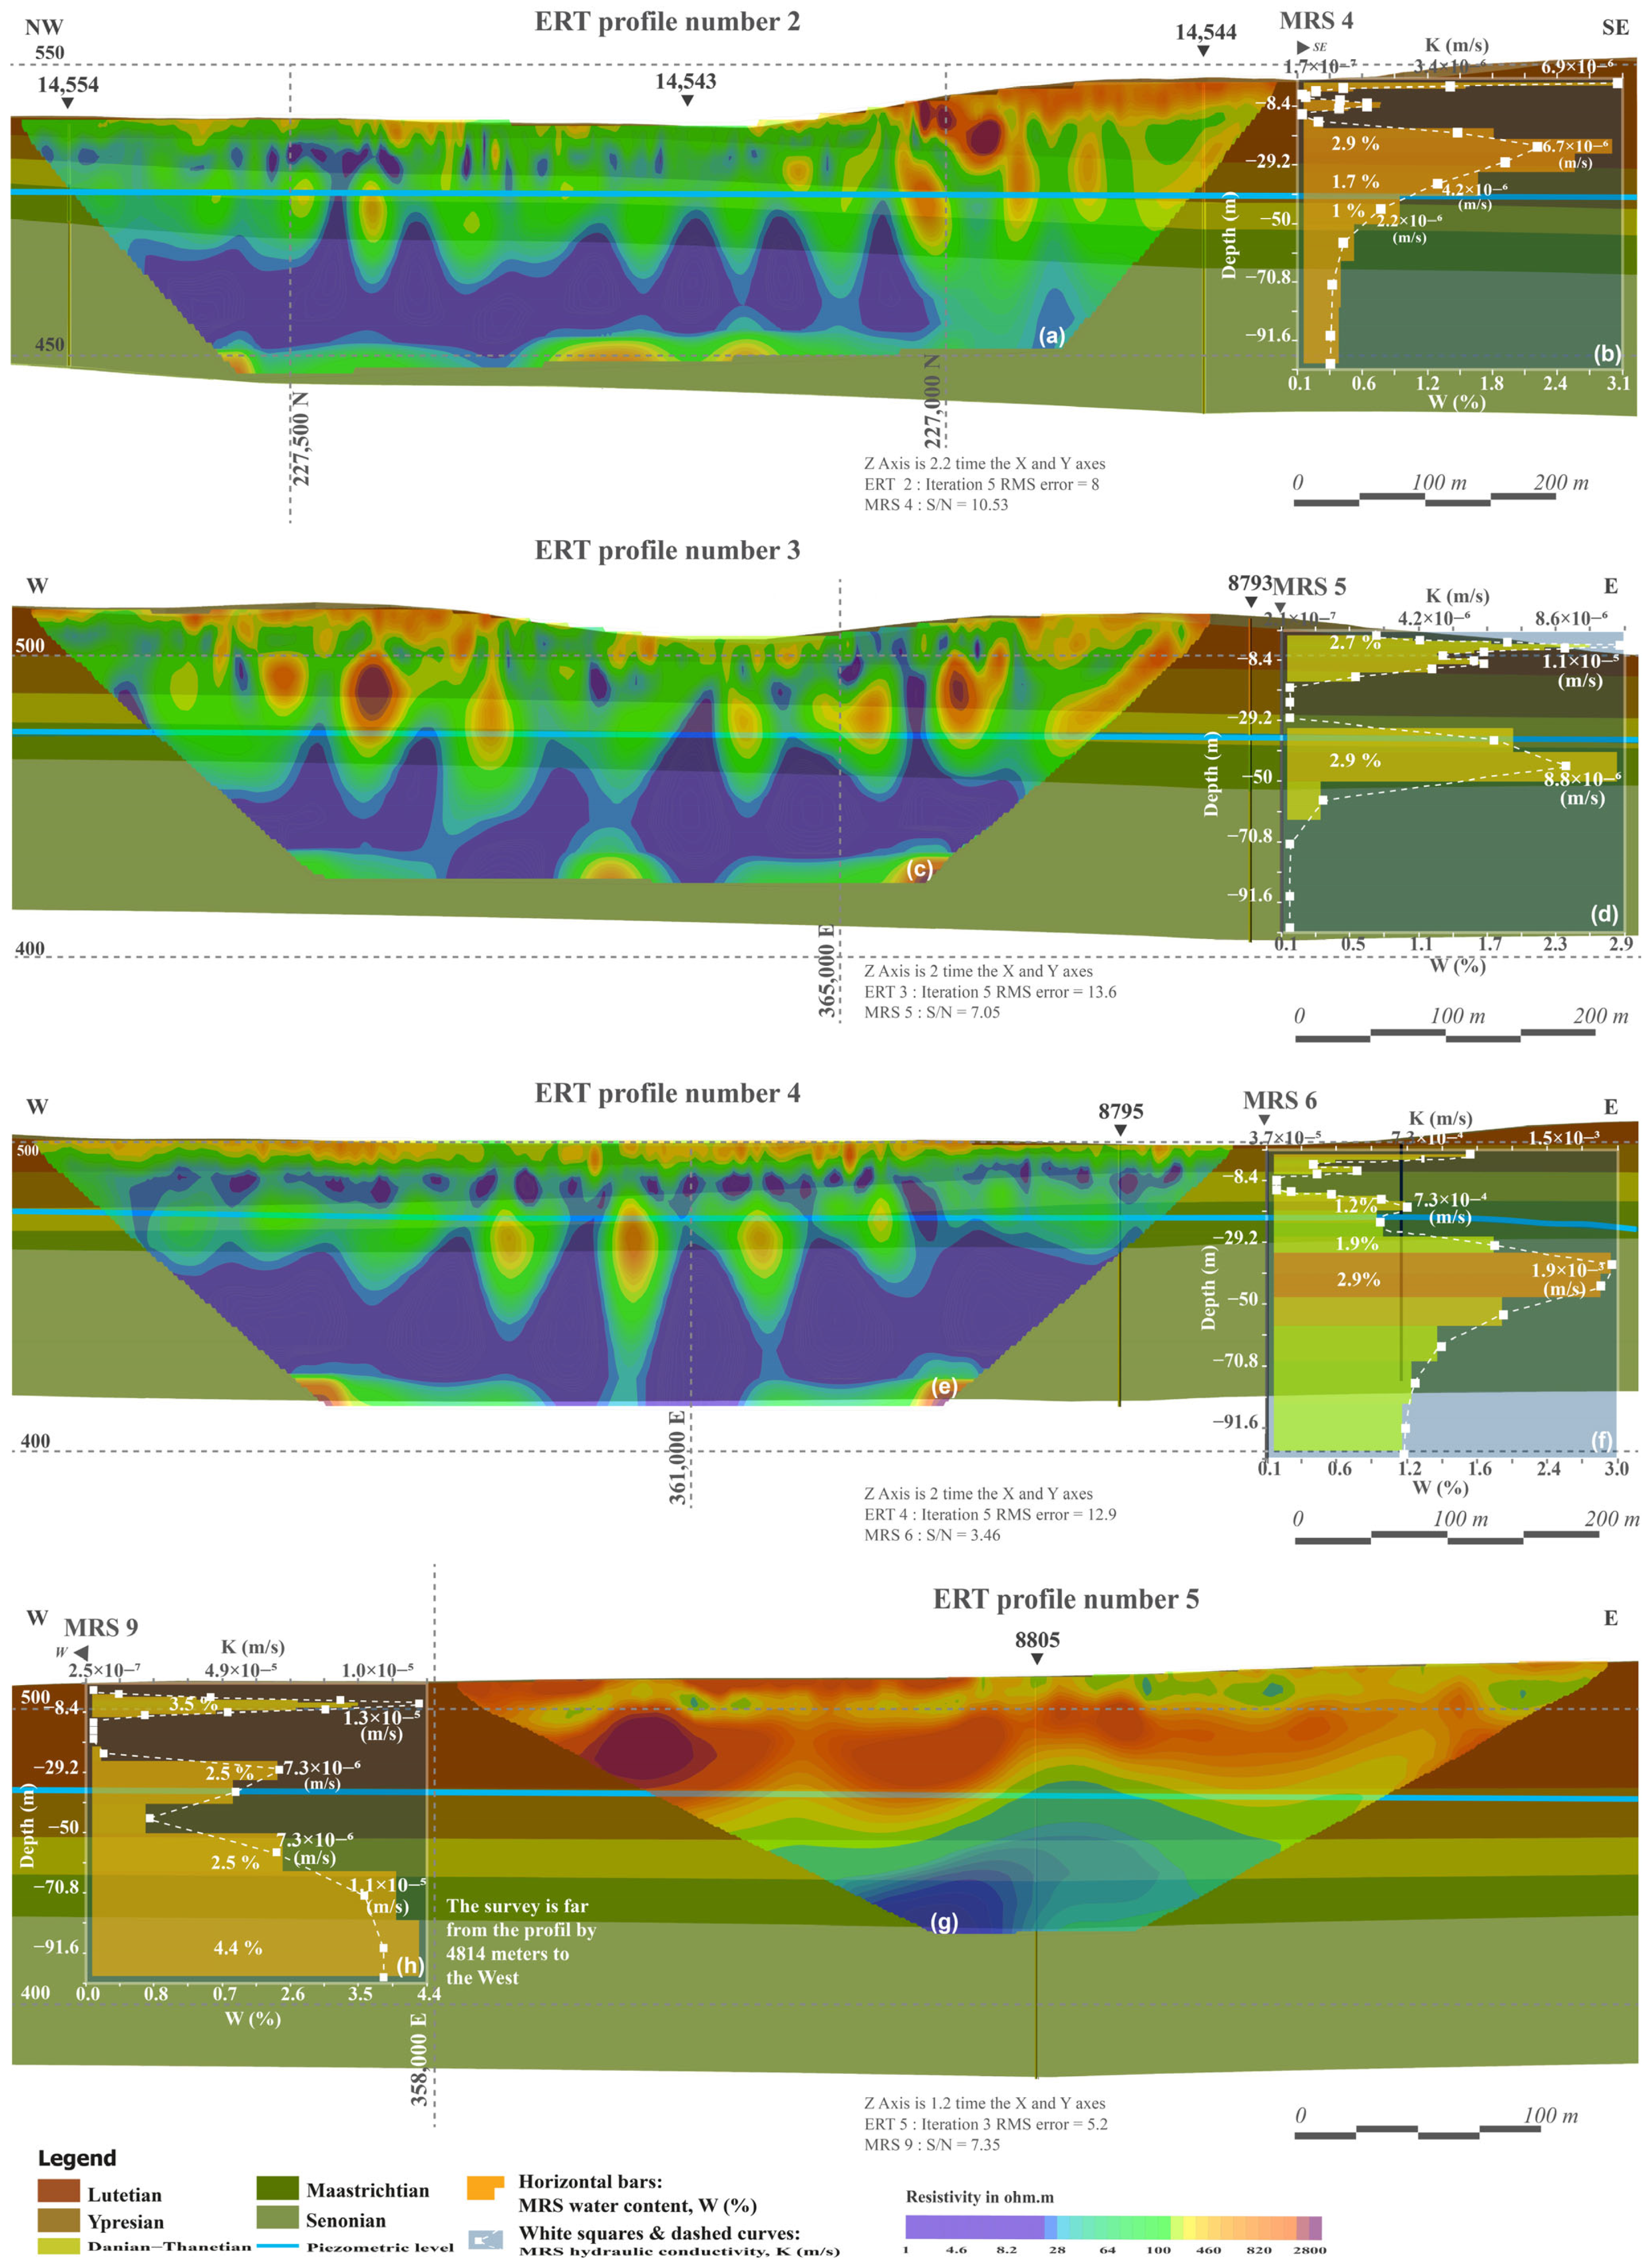
In this sector, piezometric measurements and borehole logs indicate that the piezometric surface lies above the top of the Maastrichtian phosphate layer, so that this layer and the underlying formations lie within the saturated zone. Four ERT profiles (2–5) and four MRSs (MRS 4–6 and 9) were acquired across the saturated zone of the phosphate deposit to refine the characterization of subsurface lithology and groundwater distribution (Figure 8). Each ERT profile was calibrated against available borehole stratigraphic columns, and MRSs provided depth-resolved estimates of water content and hydraulic conductivity. The principal hydrogeological parameters derived from all MRSs are compiled in Table 2; the key observations from each transect are discussed below.
ERT Profile 2—Northwestern sector. This 1115 m northwest southeast profile, Figure 8a), calibrated against three boreholes, defines three resistivity domains: a surficial high-resistivity unit (>460 Ω·m, Lutetian limestone) developed mainly in the southeastern portion, an intermediate domain (50–260 Ω·m, Ypresian and partially eroded Lutetian) dominating the central and northern sectors, where streambed erosion has removed the upper limestone, and a basal conductive zone (<28 Ω·m) corresponding to wet marl, clay, and phosphate of the Thanetian, Maastrichtian, and Senonian formations. The piezometric surface aligns precisely with the top of the low resistivity unit, and the saturated phosphatic layer deepens from 22 m in the northwest to 37.2 m in the southeast. A near-surface conductive anomaly is present in the northwestern sector.
ERT Profiles 3 and 4—Central sector. Both the 795 m west–east Profile 3, Figure 8c, and Profile 4, Figure 8e, exhibit the same three-layer architecture. Surface resistivities above 460 Ω·m identify dry Lutetian limestone, intermediate values (50–250 Ω·m) correspond to Ypresian and dry Lutetian facies, and resistivities below 28 Ω·m delineate water-saturated Thanetian and Maastrichtian uncemented phosphate, confirmed by borehole stratigraphic logs and a measured piezometric depth of 39 m in Profile 3. In Profile 4, a shallow conductive anomaly is present near a stream crossing, and localized high-resistivity zones occur at depth.
ERT Profile 5—Southwestern edge. This 475 m west–east profile, Figure 8g, acquired at the far southwestern limit of the deposit, confirms full submergence of all phosphate-bearing layers along this section. A broad conductive zone (<100 Ω·m) below the piezometric level is attributed to marly phosphate and clay-rich facies of the Ypresian, Thanetian, and Maastrichtian. Upper layers (0–38 m, >250 Ω·m) correspond to relatively dry Lutetian limestone. Compared with the eastern profiles, the saturated unit shows slightly higher resistivity values.

4. Discussion

4.1. Hydrostratigraphic Structure and Groundwater Distribution

The combined ERT–MRS investigation delineates a complex, multilayered aquifer system within the Beni Amir phosphate deposit, with spatial heterogeneity in both vertical and lateral dimensions. The hydrostratigraphic model derived from integrating geological, hydrogeological, and geophysical (ERT–MRS) data identifies three principal water-bearing zones: (i) a shallow Eocene aquifer within the Lutetian–Ypresian succession (approximately 2–20 m depth), (ii) an intermediate phosphate-bearing aquifer system hosted within the Danian–Thanetian and Maastrichtian formations (approximately 20–60 m depth), and (iii) a deeper Senonian marly limestone aquifer extending below 60 m depth.
In the uppermost Eocene zone, the Lutetian limestone generally forms a resistive, partially saturated to unsaturated horizon that hosts localized perched aquifers. These systems are often discontinuous, with highly variable saturation (0.3% to 4.2% water content) and generally moderate hydraulic conductivity (~10−5 m/s). At MRS 3, Figure 7d, the Lutetian unit shows low MRS water content (0.3%) together with relatively high hydraulic conductivity (1.5 × 10⁻⁵ m/s). This pattern is consistent with a dual-porosity behavior of the marly limestone, in which fracture networks dominate flow but remain largely air-filled within the vadose zone, and MRS responds only to mobile pore water rather than total porosity [53]. At MRS 8, Figure 7f, the Lutetian records the highest shallow water content in the study area (4.2%), consistent with enhanced local recharge relative to the western and southern sectors.
The Eocene distribution is locally influenced by erosion along ephemeral drainage pathways, where resistive caps thin or are removed, as evidenced in ERT 4, Figure 8e, and ERT 6, Figure 7g. Similarly, hydrogeological investigations across the phosphate plateau demonstrate that Eocene aquifers often exhibit interrupted water tables where Eocene sequences have been locally eroded, generating heterogeneous hydraulic connectivity and discrete recharge zones [60,61]. The Ypresian unit behaves predominantly as a semi-confining layer, separating shallow perched systems from deeper regional aquifers. Because this unit contains clays and shaly marls, low MRS-derived water content should not be interpreted as evidence of dry conditions. Part of the water in this unit may be adsorbed on clay minerals or retained in very small pores, and may therefore be poorly detected by MRS. Based on the combined evidence from ERT profiles, borehole lithology, and piezometric level, the Ypresian presents an intermediate resistivity and relatively low MRS-derived hydraulic conductivity, which may contribute to vertical hydraulic contrasts between upper and lower aquifer systems.
Beneath this upper unit, the Danian–Thanetian and Maastrichtian phosphate formations constitute the main saturated system across the deposit, forming the core of the water-bearing system. Water content typically ranges from 0.5% to 3.5%, with permeabilities from 10−6 to 10−5 m/s. These formations are systematically associated with low resistivity values (<28 Ω·m), measurable MRS-derived water contents, and piezometric levels, confirming their role as the dominant groundwater reservoirs. They exhibit broadly persistent geometry across the deposit ranging from partial saturation in the east (MRS 3, Figure 7d) to full saturation in the west and central portions (MRS 9, Figure 8h). At MRS 3, the deep Maastrichtian–Senonian interval lies below the ~39 m water table yet records only 0.9% MRS water content, reflecting the low effective porosity and high bound-water fraction of this fine-grained marly limestone rather than incomplete saturation.
At greater depths, the Senonian marly limestone forms a laterally extensive basal aquifer with variable but often significant water content (up to 4.4% at MRS 9) and hydraulic conductivity (~10−5 m/s). The Senonian formation is widely detected as a saturated horizon, in line with regional descriptions of limestone-marl successions forming aquifer systems [38,62]. However, the present results indicate that Senonian hydraulic behavior is not spatially uniform: enhanced hydraulic conductivity and storage occur in the western sector, likely due to stronger hydraulic connection with overlying units and proximity to recharge windows, where Eocene formations are locally truncated by erosion and Senonian limestones outcrop at the surface, as indicated by [61]. This variability may explain differences with studies that describe the Senonian as compact and relatively impermeable in parts of the Khouribga area [20], suggesting that Senonian hydrogeological function may shift between aquifer and aquitard depending on facies and structural context.
A clear transition from partially saturated conditions in the eastern sector to fully saturated conditions toward the southwestern part of the deposit is observed. In the partially saturated zone, aquifer boundaries remain less constrained, and groundwater occurs as discontinuous saturated lenses with variable water content (0.3–4.2%), characteristic of a vadose-dominated hydrological regime. Conversely, in the saturated sector, the phosphate-bearing sequence is largely submerged and forms laterally continuous conductive domains. The deepening of the saturated phosphatic layer from ~22 m in the northwest to ~37.2 m in the southeast along ERT Profile 2, Figure 8a, reflects a regional hydraulic gradient and supports a progressive increase in saturation toward the southwestern sector, aligning with the regional topographic gradient that dips gently toward the SW [2,61,63].
Vertical hydraulic connectivity varies markedly across the deposit. In some areas, low-resistivity domains extend from shallow depth to the deeper conductive zones (e.g., the northwestern sector of ERT Profile 2, Figure 8a, ERT 4, Figure 8e and ERT 6, Figure 7g), which may indicate vertical leakage pathways. In contrast, lower hydraulic conductivity intervals, particularly within the Ypresian unit, interpreted at MRS 9 between 40 and 50 m, promote vertical compartmentalization and may maintain distinct hydraulic behavior between overlying and underlying units.
Surface-water interactions are interpreted as a possible control on local recharge and saturation. Where ERT profiles intersect ephemeral streambeds, particularly along ERT Profiles 2, 4 and 6, erosional removal or thinning of the resistive Lutetian limestone is accompanied by the disappearance of high-resistivity layers (>460 Ω·m) and the presence of shallow conductive anomalies. Together with locally elevated near-surface water content inferred from MRS, these observations are consistent with localized infiltration along streambeds. Because the present geophysical dataset cannot resolve the dynamics of this process, the inference is treated as a working hypothesis rather than a demonstrated recharge mechanism. On this basis, these streambed-associated zones could help sustain local saturation where regional groundwater levels are relatively deep and could increase dewatering demand if they remain hydraulically connected during pumping.

4.2. Hydrodynamic Properties and Aquifer Heterogeneity

Hydraulic conductivity values derived from MRS inversions indicate substantial spatial variability, spanning one and a half orders of magnitude across most soundings (1.5 × 10⁻⁶ to 5 × 10⁻⁵ m/s), with a single anomalous value of 1.9 × 10⁻³ m/s at MRS 6. This variability likely reflects differences in lithology and texture (phosphate facies versus marl/limestone), diagenetic evolution, fracture intensity [20], and, critically, saturation state. Comparable K ranges in the partially saturated and fully saturated sectors reflect the shared phosphate and marl/limestone facies rather than the equivalence of in situ flow conditions.
In the partially saturated eastern sector, the Danian–Thanetian sandy phosphate typically exhibits intermediate hydraulic conductivity values (7.1 × 10⁻⁶ to 1.1 × 10⁻⁵ m/s), while the Maastrichtian uncemented phosphate facies tend to be slightly lower (3.9 × 10⁻⁶ to 8.1 × 10⁻⁶ m/s), consistent with textural contrasts. The Senonian marly limestone displays variable hydraulic behavior that appears strongly dependent on local facies and structural setting. At sites such as MRS 1, Figure 7b and MRS 10, Figure 7h, hydraulic conductivity remains modest (5.7 × 10⁻⁶ to 8.85 × 10⁻⁶ m/s), whereas at other sites (e.g., MRS 8, Figure 7f, MRS 11, Figure 7i) values increase to the 10−5 m/s range.
In the saturated southwestern sector, MRS 6 (Figure 8f) returns the highest hydraulic conductivity in the dataset (up to 1.9 × 10⁻³ m/s), two to three orders of magnitude above the neighboring soundings and the nearest pumping tests. This value is treated as a localized anomalous response rather than a representative formation property, and is not used quantitatively until verified by a co-located pumping test.
Water content distributions show similarly strong heterogeneity (0.3–4.4%). The highest values are observed in deep Senonian aquifers at MRS 9, Figure 8h (4.4%) and MRS 10, Figure 7h (4.3%), implying substantial storage potential in these horizons. Intermediate water contents (2.5–3.5%) characterize the Danian–Thanetian and Maastrichtian aquifers in fully saturated zones, whereas the lowest values (<1%) occur where saturation is partial or where mobile water is limited.

4.3. Methodological Integration and Comparison with Pumping Test Results

The complementary application of ERT and MRS proved essential for reducing interpretive ambiguity. ERT provided laterally continuous imaging of resistivity contrasts and saturation boundaries, while MRS supplied quantitative estimates of mobile water content and hydraulic conductivity at discrete locations [64]. Across profiles, the upper boundary of low-resistivity domains generally coincides with measured piezometric levels, supporting the use of resistivity as a saturation proxy when constrained by borehole stratigraphy and water-level data [65]. Similarly, MRS-derived water levels broadly match piezometric observations, in agreement with previous studies demonstrating the capability of MRS to identify groundwater levels in heterogeneous environments [66,67].
However, the comparison between K values derived from pumping tests and MRS (Table 3) reveals systematic differences: MRS-derived conductivities are commonly higher than pumping test estimates. This behavior is expected because pumping tests measure hydraulic response at the well scale (and are sensitive to well efficiency, partial penetration, and localized heterogeneity), whereas MRS estimates represent an effective property averaged over a larger investigated volume and are primarily associated with mobile water content [68]. MRS-derived K also depends on an empirical proportionality constant relating relaxation time and water content to hydraulic conductivity. Without local calibration, this constant controls the absolute values and is the main source of the observed offset, whereas the relative ranking between units is more robust. In heterogeneous media, MRS may overestimate K unless calibrated with local hydraulic data [66]. Spatial separation between pumping wells and MRSs also contributes to the mismatch. Several reference wells lie hundreds of meters to more than one kilometer from their paired soundings. Thus, even within the same stratigraphic unit, the two methods may not sample hydraulically equivalent materials. Inversion uncertainty and possible anomalous responses add further differences.
Nevertheless, coherent stratigraphic trends are preserved: Danian–Thanetian sandy phosphate units typically show moderate K, Maastrichtian phosphate units show variable K likely influenced by facies and fracture zones, and Senonian properties vary with lithofacies heterogeneity and recharge influence. The magnitude of the offset does not scale simply with the distance between each sounding and its reference well (Table 3), which indicates that lithological heterogeneity and local structure govern the differences. The preserved relative ranking between units, rather than absolute equality of K, is therefore the basis for integrating the two datasets.
Several challenges should be acknowledged. MRS is sensitive to electromagnetic noise and is less responsive to bound water in clay-rich materials [14,17], while ERT interpretation remains non-unique without stratigraphic and hydrochemical constraints.
The fixed instrumental dead time (~30 ms) limits the detection of rapidly decaying FID components associated with small pores and clay-bound water. In fine-grained intervals such as the Ypresian, MRS-derived water content should therefore be interpreted as a lower-bound estimate of mobile water rather than total water content. This does not compromise the study’s main objective, since the undetected fraction is largely immobile and contributes little to transmissivity or yield, and such intervals remain identifiable through their low-resistivity ERT signatures. The MRS sensitivity to noise directly affected the present survey, as six MRS sites were rejected, reducing point density in the central part and southern edge. Since the retained soundings still span the western, central, and eastern sectors, this lowered local resolution rather than overall coverage.
For inflow prediction and dewatering design, hydraulic conductivities from pumping tests provide quantitative inputs, while ERT and MRS are best used to map water-bearing formations, identify heterogeneity, and guide future hydraulic tests. MRS-derived K values should be treated as first-order approximations within uncertainty ranges or sensitivity scenarios, not as single deterministic design values, unless calibrated against pumping tests [48,69,70].
Future work should therefore prioritize (i) targeted pumping tests close to representative MRS sites to calibrate K and estimate storativity, (ii) hydrochemical sampling to constrain resistivity interpretation, (iii) infill surveys across the transition between partially saturated and saturated sectors, and (iv) time-lapse monitoring (water levels and/or repeat ERT) to capture seasonal recharge and dewatering dynamics. Ultimately, integrating these datasets into a 3D numerical groundwater model will enable scenario-based optimization of dewatering strategies and prediction of drawdown impacts at mine and basin scales.

5. Conclusions

Mining activities are presently in progress in the northeastern part of the Beni Amir phosphate deposit, whereas the deeper southern section remains under exploration. As extraction progresses towards areas where phosphate-bearing formations intersect the saturated zone, the groundwater conditions are expected to become increasingly important for mine planning. In this context, the present investigation combined six ERT profiles, eleven MRS surveys, hydrostratigraphic modeling, piezometric data, and existing pumping-test results to characterize the aquifer geometry, saturation state, mobile water content, and first-order hydraulic variability.
Within the investigated area, the Danian–Thanetian and Maastrichtian phosphate formations form the principal water-bearing horizons. The Senonian unit constitutes a deeper regional aquifer, with enhanced groundwater continuity towards the western and southwestern sectors. Saturation was defined based on the position of the piezometric surface relative to stratigraphic boundaries. ERT low-resistivity zones, generally below 28 Ω·m, facilitated the identification of saturated phosphates, marls, and clay-rich formations when constrained by boreholes and piezometric data, whereas high-resistivity zones above 250–460 Ω·m were mainly associated with relatively dry Lutetian limestone. MRS-derived mobile water content ranges from 0.3% to 4.4%, and most hydraulic conductivity estimates fall between 1.5 × 10⁻⁶ and 5 × 10⁻⁵ m/s. The highest value, 1.9 × 10⁻³ m/s at MRS 6, is treated as a localized anomalous or highly site-specific response and necessitates validation through a co-located pumping test prior to its application in design considerations. These results confirm that the deposit cannot be represented by a single homogeneous hydraulic parameter.
For practical mine planning, the study presents evaluative criteria. Priority areas for further testing are those where saturated low-resistivity domains coincide with phosphate-bearing formations below the piezometric surface, thicker saturated intervals, higher MRS-derived water contents, or elevated first-order hydraulic conductivity. Preliminary scenarios can also be defined: limited inflows are expected if mining remains in partially saturated sectors, while increased inflows may occur if mining advances into the fully saturated western and southwestern sectors, especially near ERT 5, MRS 9, and any high-conductivity zones.
These findings may inform the strategic placement of future pumping tests, monitoring wells, and additional boreholes. Nonetheless, they cannot yet define final abstraction volumes or the exact number of dewatering boreholes. Such decisions require calibrated pumping tests, storativity estimates, long-term water-level monitoring, and numerical groundwater-flow modeling. Therefore, this work provides a hydrogeophysical decision-support basis for future pre-mining dewatering assessment, rather than a final dewatering optimization tool.

Author Contributions

Conceptualization, O.H.; methodology, O.H.; software, O.H.; validation, M.E.B., A.A.L. and M.B.; formal analysis, O.H.; investigation, O.H., M.E.B. and A.B.; resources, M.E.B. and A.A.L.; data curation, M.E.B.; writing—original draft preparation, O.H.; writing—review and editing, M.E.B. and O.H.; visualization, M.E.B.; supervision, M.E.B., A.A.L. and M.B.; project administration, M.E.B., A.A.L. and M.B. All authors have read and agreed to the published version of the manuscript.

Funding

This research received financial support from Mohammed VI Polytechnic University (UM6P), Geology and Sustainable Mining Institute.

Data Availability Statement

The data supporting the findings of this study are not publicly available due to confidentiality restrictions related to the industrial and institutional datasets used in the research. Access to the data may be considered upon reasonable requests to the corresponding author and subject to permission from the data owner.

Acknowledgments

The authors gratefully acknowledge the OCP group for providing access to the geological and hydrogeological data used in this study, subject to confidentiality restrictions. The authors also thank Mohammed VI Polytechnic University and the Geology and Sustainable Mining Institute for their administrative and technical support during the preparation and execution of the field investigations. Special thanks are extended to Jamal Khaffou and Aymane Bouhmid for their support during fieldwork, and to Hennie Coetzee, Jim Sronce and Hajar Chamlal for their technical assistance.

Conflicts of Interest

The authors declare no conflicts of interest. The funders had no role in the design of the study; in the collection, analyses, or interpretation of data; in the writing of the manuscript; or in the decision to publish the results.

Abbreviations

The following abbreviations are used in this manuscript:
ERTElectrical Resistivity Tomography
MRSMagnetic Resonance Sounding
NMRNuclear Magnetic Resonance
FIDFree Induction Decay
TDEMTime-Domain Electromagnetic
FDEMFrequency-Domain Electromagnetic
RMSRoot Mean Square
OCPOffice Chérifien des Phosphates

References

  1. Hssaisoune, M.; Bouchaou, L.; Sifeddine, A.; Bouimetarhan, I.; Chehbouni, A. Moroccan Groundwater Resources and Evolution with Global Climate Changes. Geosciences 2020, 10, 81. [Google Scholar] [CrossRef] [Scilit]
  2. El Kiram, N.; Jaffal, M.; Kchikach, A.; El Azzab, D.; El Ghorfi, M.; Khadiri, O.; Jourani, E.-S.; Manar, A.; Nahim, M. Phosphatic Series Under Plio-Quaternary Cover of Tadla Plain, Morocco: Gravity and Seismic Data. Comptes Rendus Geosci. 2019, 351, 420–429. [Google Scholar] [CrossRef] [Scilit]
  3. Heddoun, O.; Ait Lemkademe, A.; Benzaazoua, M. Comprehensive Hydrogeological Analysis of the Beni Amir Deposit in the Oulad Abdoun Phosphate Basin, Morocco. Mine Water Environ. 2025, 44, 482–501. [Google Scholar] [CrossRef] [Scilit]
  4. Zago, M.M.; Fries, M.; Ramires, J.E.F. Groundwater Infiltration in a Gold Mine–A Geoelectrical Investigation Model as an Aid to Dewatering Process Determination. J. Appl. Geophys. 2020, 172, 103909. [Google Scholar] [CrossRef] [Scilit]
  5. Günther, T.; Müller-Petke, M. Hydraulic Properties at the North Sea Island of Borkum Derived from Joint Inversion of Magnetic Resonance and Electrical Resistivity Soundings. Hydrol. Earth Syst. Sci. 2012, 16, 3279–3291. [Google Scholar] [CrossRef] [Scilit]
  6. Mastrocicco, M.; Vignoli, G.; Colombani, N.; Zeid, N.A. Surface Electrical Resistivity Tomography and Hydrogeological Characterization to Constrain Groundwater Flow Modeling in an Agricultural Field Site near Ferrara (Italy). Environ. Earth Sci. 2010, 61, 311–322. [Google Scholar] [CrossRef] [Scilit]
  7. Andersen, T.R.; Poulsen, S.E.; Christensen, S.; Jørgensen, F. A Synthetic Study of Geophysics-Based Modelling of Groundwater Flow in Catchments with a Buried Valley. Hydrogeol. J. 2013, 21, 491–503. [Google Scholar] [CrossRef] [Scilit]
  8. Comte, J.-C.; Ofterdinger, U.; Legchenko, A.; Caulfield, J.; Cassidy, R.; Mézquita González, J.A. Catchment-Scale Heterogeneity of Flow and Storage Properties in a Weathered/Fractured Hard Rock Aquifer from Resistivity and Magnetic Resonance Surveys: Implications for Groundwater Flow Paths and the Distribution of Residence Times. In Groundwater in Fractured Bedrock Environments: Managing Catchment and Subsurface Resources; Ofterdinger, U., MacDonald, A.M., Comte, J.-C., Young, M.E., Eds.; Geological Society of London: London, UK, 2019; Volume 479. [Google Scholar]
  9. Guillon, S.; Girard, J.-F.; Williard, E.; Virlogeux, D.; Descostes, M. Modeling Subsurface Contaminant Transport from a Former Open-Pit Uranium Mine in Fractured Granites (La Ribière, France): Reducing Uncertainties with Geophysics. J. Contam. Hydrol. 2024, 263, 104343. [Google Scholar] [CrossRef] [Scilit] [PubMed]
  10. Mendoza, R.; Rey, J.; Martínez, J.; Hidalgo, M.C.; Sandoval, S. Geophysical Characterisation of Geologic Features with Mining Implications from ERT, TDEM and Seismic Reflection (Mining District of Linares-La Carolina, Spain). Ore Geol. Rev. 2021, 139, 104581. [Google Scholar] [CrossRef] [Scilit]
  11. Brunet, P.; Clément, R.; Bouvier, C. Monitoring Soil Water Content and Deficit Using Electrical Resistivity Tomography (ERT) –A Case Study in the Cevennes Area, France. J. Hydrol. 2010, 380, 146–153. [Google Scholar] [CrossRef] [Scilit]
  12. Sonkamble, S.; Sahya, A.; Jampani, M.; Ahmed, S.; Amerasinghe, P. Hydro-Geophysical Characterization and Performance Evaluation of Natural Wetlands in a Semi-Arid Wastewater Irrigated Landscape. Water Res. 2019, 148, 176–187. [Google Scholar] [CrossRef] [Scilit] [PubMed]
  13. Revil, A.; Karaoulis, M.; Johnson, T.; Kemna, A. Review: Some Low-Frequency Electrical Methods for Subsurface Characterization and Monitoring in Hydrogeology. Hydrogeol. J. 2012, 20, 617–658. [Google Scholar] [CrossRef] [Scilit]
  14. Behroozmand, A.A.; Keating, K.; Auken, E. A Review of the Principles and Applications of the NMR Technique for Near-Surface Characterization. Surv. Geophys 2015, 36, 27–85. [Google Scholar] [CrossRef] [Scilit]
  15. Binley, A.; Hubbard, S.S.; Huisman, J.A.; Revil, A.; Robinson, D.A.; Singha, K.; Slater, L.D. The Emergence of Hydrogeophysics for Improved Understanding of Subsurface Processes over Multiple Scales. Water Resour. Res. 2015, 51, 3837–3866. [Google Scholar] [CrossRef] [Scilit] [PubMed]
  16. Legchenko, A.; Descloitres, M.; Vincent, C.; Guyard, H.; Garambois, S.; Chalikakis, K.; Ezersky, M. Three-Dimensional Magnetic Resonance Imaging for Groundwater. New J. Phys. 2011, 13, 025022. [Google Scholar] [CrossRef] [Scilit]
  17. Legchenko, A.; Baltassat, J.-M.; Beauce, A.; Bernard, J. Nuclear Magnetic Resonance as a Geophysical Tool for Hydrogeologists. J. Appl. Geophys. 2002, 50, 21–46. [Google Scholar] [CrossRef] [Scilit]
  18. Charbaoui, A.; Kchikach, A.; Jaffal, M.; Khadiri, O.Y.; Guernouche, M.; Amar, M.; Bikarnaf, A.; Jourani, E.-S.; Khelifi, N. New Insights from Geophysical, Hydrogeological and Borehole Data into the Deep Structure of the Louta Phosphatic Deposit (Gantour Basin, Morocco): Mining Implications. Geosciences 2023, 13, 357. [Google Scholar] [CrossRef] [Scilit]
  19. Gerhart, J.M. Simulated Changes in Potentiometric Levels Resulting from Groundwater Development for Phosphate Mines, West-Central Florida. J. Hydrol. 1979, 43, 491–515. [Google Scholar] [CrossRef] [Scilit]
  20. Ihbach, F.-Z.; Kchikach, A.; Jaffal, M.; Elazzab, D.; Yazami, O.; Jourani, E.; Peña, J.; Ruano, P.; Olaiz, A.; Dávila, L. Geophysical Prospecting for Groundwater Resources in Phosphate Deposits (Morocco). Minerals 2020, 10, 842. [Google Scholar] [CrossRef] [Scilit]
  21. Nasri, N.; Souissi, F.; Ben Attia, T.; Ismailia, A.; Smida, O.; Tangour, D.; López Maldonado, E.A.; Souissi, R. Hydro Geochemical Characteristics and Mineralization Process of Groundwater in the Phosphatic Basin of Gafsa, Southwestern Tunisia. Hydrology 2024, 11, 142. [Google Scholar] [CrossRef] [Scilit]
  22. Kathy, B.; Nina, G.; Konstantinos, S.; Dercas, N.; Stefopoulou, A.; Anis, G.; Fatma, K.; Mohamed, S.; Anne-Gwenaëlle, G. Development of a Methodology for Integrated Water Resources Management in Mediterranean Phosphate Mine Areas. In Proceedings of the 5th International Congress on Environmental Modelling and Software, Ottawa, ON, Canada, 5–8 July 2010; Available online: https://scholarsarchive.byu.edu/cgi/viewcontent.cgi?article=2545&context=iemssconference (accessed on 25 July 2025).
  23. Yousif, M.; Sracek, O. An Overview of Phosphate Rocks and Their Mining Impact on Groundwater, Eastern Desert, Egypt. Arab J. Geosci. 2016, 9, 670. [Google Scholar] [CrossRef] [Scilit]
  24. Zhang, H.; Wang, Y.; Yang, R.; Ye, R. Modeling the Effects of Phosphate Mining on Groundwater at Different Stages of Mine Development. Mine Water Environ. 2018, 37, 604–616. [Google Scholar] [CrossRef] [Scilit]
  25. Bouda, A.; Salvan, H.M. État des connaissances sur le plateau continental marocain et ses dépôts phosphatés. Mines. Geol. Energ. 1971, 1971, 132. [Google Scholar]
  26. Boujo, A. Contribution à L’étude Géologique du Gisement de Phosphate Crétacé-Éocène des Ganntour (Maroc Occidental). Sciences Géologiques, Bulletins et Mémoires; Institut de Géologie, Université Louis-Pasteur: Strasbourg, France, 1976; 244p, Available online: https://www.persee.fr/doc/sgeol_0302-2684_1976_mon_43_1 (accessed on 25 July 2025).
  27. Moutaouakil, D.; Giresse, P. Petrology and Sedimentary Environments of Mesocenozoic Phosphorites from Ouled Abdoun Basin, Morocco. Bull.-Soc. Geol. Fr. 1993, 164, 473–491. [Google Scholar]
  28. El Haddi, H.; Benbouziane, A.; Mouflih, M. Geochemical Siliceous and Silicified Facies of Phosphate Series of Ouled Abdoun Basin (Morocco). Open J. Geol. 2014, 4, 295–302. [Google Scholar] [CrossRef]
  29. Choubert, G.; Faure-Muret, A. Evolution Du Domaine Atlasique Marocain Depuis Les Temps Paléozoïques. Mém. Hors-Sér.-Soc. Géol. Fr. 1960, 6, 447–527. [Google Scholar]
  30. Knouz, N.; Boudhar, A.; Bachaoui, E.M.; Saadi, C. Comparative Approach of Three Popular Intrinsic Vulnerability Methods: Case of the Beni Amir Groundwater (Morocco). Arab J. Geosci. 2018, 11, 281. [Google Scholar] [CrossRef] [Scilit]
  31. Belfkira, O. Evolutions sédimentologiques et géochimiques de la série phosphatée du Maestrichtien des Ouled Abdoun (Maroc). Ph.D. Thesis, Université Scientifique et Médicale de Grenoble, Grenoble, France, 1980. [Google Scholar]
  32. El-Mountassir, M. La Zone Rubéfiée de Sidi Daoui: Altération Météorique Du Phosphate de Chaux Des Ouled Abdoun (Maroc). Ph.D. Thesis, UER des sciences de la vie et de la terre, Institut de géologie, Grenoble, France, 1977. [Google Scholar]
  33. Boudda, A.; Choubert, G. Sur La Limite Inférieure Du Cambrien Au Maroc. CR Acad. Sci. Paris 1972, 275, 5–8. [Google Scholar]
  34. Bardet, N.; Suberbiola, X.P.; Jouve, S.; Bourdon, E.; Vincent, P.; Houssaye, A.; Rage, J.-C.; Jalil, N.-E.; Bouya, B.; Amaghzaz, M. Reptilian Assemblages from the Latest Cretaceous–Palaeogene Phosphates of Morocco: From Arambourg to Present Time. Hist. Biol. 2010, 22, 186–199. [Google Scholar] [CrossRef] [Scilit]
  35. Arambourg, C. Nouvelles Observations Sur Les Faunes et La Stratigraphie Des Phosphates Du Maroc; impr. Protat Frères: Mâcon, France, 1936. [Google Scholar]
  36. Salvan, H. Phosphates. Notes Et. Mémoires Du. Serv. Géologique Du. Maroc. 1952, 87, 283–320. [Google Scholar] [CrossRef] [Scilit]
  37. Hammani, A.; Kuper, M.; Debbarh, A.; Bouarfa, S.; Badraoui, M.; Bellouti, A. Evolution de l’exploitation Des Eaux Souterraines Dans Le Périmètre Irrigué Du Tadla. In Proceedings of the Séminaire sur la modernisation de l’agriculture irriguée; Hammani, A., Kuper, M., Debbarh, A., Eds.; IAV Hassan II: Rabat, Morocco, 2004; p. 8. [Google Scholar]
  38. Bouchaou, L.; Michelot, J.L.; Qurtobi, M.; Zine, N.; Gaye, C.B.; Aggarwal, P.K.; Marah, H.; Zerouali, A.; Taleb, H.; Vengosh, A. Origin and Residence Time of Groundwater in the Tadla Basin (Morocco) Using Multiple Isotopic and Geochemical Tools. J. Hydrol. 2009, 379, 323–338. [Google Scholar] [CrossRef] [Scilit]
  39. Daily, W.; Ramirez, A.; LaBrecque, D.; Nitao, J. Electrical Resistivity Tomography of Vadose Water Movement. Water Resour. Res. 1992, 28, 1429–1442. [Google Scholar] [CrossRef] [Scilit]
  40. Loke, M.H.; Chambers, J.E.; Rucker, D.F.; Kuras, O.; Wilkinson, P.B. Recent Developments in the Direct-Current Geoelectrical Imaging Method. J. Appl. Geophys. 2013, 95, 135–156. [Google Scholar] [CrossRef] [Scilit]
  41. Günther, T.; Rücker, C.; Spitzer, K. Three-Dimensional Modelling and Inversion of Dc Resistivity Data Incorporating Topography—II. Inversion. Geophys. J. Int. 2006, 166, 506–517. [Google Scholar] [CrossRef] [Scilit]
  42. Loke, M.H.; Barker, R.D. Rapid Least-squares Inversion of Apparent Resistivity Pseudosections by a quasi-Newton Method1. Geophys. Prospect. 1996, 44, 131–152. [Google Scholar] [CrossRef] [Scilit]
  43. Tassy, A.; Maxwell, M.; Borgomano, J.; Arfib, B.; Fournier, F.; Gilli, E.; Guglielmi, Y. Electrical Resistivity Tomography (ERT) of a Coastal Carbonate Aquifer (Port-Miou, SE France). Environ. Earth Sci. 2014, 71, 601–608. [Google Scholar] [CrossRef] [Scilit]
  44. Frifita, N.; Mickus, K.; Ben-Zaied, M.; Bouajila, A.; Mahmoudi, S.; Ouessar, M. Geophysical Contribution Using Electrical Resistivity to Study the Triassic Sandstone Aquifer, Southeastern Tunisia. J. Afr. Earth Sci. 2024, 210, 105165. [Google Scholar] [CrossRef] [Scilit]
  45. Rosales, R.M.; Martínez-Pagan, P.; Faz, A.; Moreno-Cornejo, J. Environmental Monitoring Using Electrical Resistivity Tomography (ERT) in the Subsoil of Three Former Petrol Stations in SE of Spain. Water Air Soil Pollut. 2012, 223, 3757–3773. [Google Scholar] [CrossRef] [Scilit]
  46. Olivier, K.K.J.; Jules, M.O.M.; Parfait, S.A.; Frédéric, P.; Brou, D.; Didier, G. Elaboration of a Hydrogeological Conceptual Model by Application of Electrical Resistivity Tomography: Case of the Lobo Catchment (Centre-Western Côte d’Ivoire). Sci. Afr. 2022, 16, e01234. [Google Scholar] [CrossRef] [Scilit]
  47. Lin, T.; Yu, S.; Zhao, H.; Zhang, Y.; Sun, H. Harmonic Noise Cancellation of Magnetic Resonance Sounding Signal Based on Wavelet Modulus Maximum. J. Appl. Geophys. 2022, 207, 104839. [Google Scholar] [CrossRef] [Scilit]
  48. Plata, J.L.; Rubio, F.M. The Use of MRS in the Determination of Hydraulic Transmissivity: The Case of Alluvial Aquifers. J. Appl. Geophys. 2008, 66, 128–139. [Google Scholar] [CrossRef] [Scilit]
  49. Wattanasen, K.; Elming, S.-Å. Direct and Indirect Methods for Groundwater Investigations: A Case-Study of MRS and VES in the Southern Part of Sweden. J. Appl. Geophys. 2008, 66, 104–117. [Google Scholar] [CrossRef] [Scilit]
  50. Chalikakis, K.; Nielsen, M.R.; Legchenko, A.; Hagensen, T.F. Investigation of sedimentary aquifers in Denmark using the magnetic resonance sounding method (MRS). Comptes Rendus. Géoscience 2009, 341, 918–927. [Google Scholar] [CrossRef] [Scilit]
  51. Perttu, N.; Wattanasen, K.; Phommasone, K.; Elming, S.-Å. Characterization of Aquifers in the Vientiane Basin, Laos, Using Magnetic Resonance Sounding and Vertical Electrical Sounding. J. Appl. Geophys. 2011, 73, 207–220. [Google Scholar] [CrossRef] [Scilit]
  52. Descloitres, M.; Chalikakis, K.; Legchenko, A.; Moussa, A.M.; Genthon, P.; Favreau, G.; Le Coz, M.; Boucher, M.; Oï, M. Investigation of Groundwater Resources in the Komadugu Yobe Valley (Lake Chad Basin, Niger) Using MRS and TDEM Methods. J. Afr. Earth Sci. 2013, 87, 71–85. [Google Scholar] [CrossRef] [Scilit]
  53. Lubczynski, M.; Roy, J. Hydrogeological Interpretation and Potential of the New Magnetic Resonance Sounding (MRS) Method. J. Hydrol. 2003, 283, 19–40. [Google Scholar] [CrossRef] [Scilit]
  54. Kremer, T.; Juul Larsen, J.; Nguyen, F. Processing Harmonic EM Noise with Multiple or Unstable Frequency Content in Surface NMR Surveys. Geophys J. Int. 2019, 219, 753–775. [Google Scholar] [CrossRef] [Scilit]
  55. Bernard, J. Instruments and Field Work to Measure a Magnetic Resonance Sounding; Boletín Geológico y Minero: Madrid, Spain, 2007. [Google Scholar]
  56. Legchenko, A.; Clément, R.; Garambois, S.; Maury, E.; Mic, L.-M.; Laurent, J.-P.; Desplanque, C.; Guyard, H. Investigating Water Distribution in the Luitel Lake Peat Bog Using MRS, ERT and GPR. Near Surf. Geophys. 2011, 9, 201–209. [Google Scholar] [CrossRef] [Scilit]
  57. Roy, J.; Lubczynski, M.W. MRS Multi-exponential Decay Analysis: Aquifer Pore-size Distribution and Vadose Zone Characterization. Near Surf. Geophys. 2005, 3, 287–298. [Google Scholar] [CrossRef] [Scilit]
  58. Vouillamoz, J.M.; Descloitres, M.; Toe, G.; Legchenko, A. Characterization of Crystalline Basement Aquifers with MRS: Comparison with Boreholes and Pumping Tests Data in Burkina Faso. Near Surf. Geophys. 2005, 3, 205–213. [Google Scholar] [CrossRef] [Scilit]
  59. Bennett, G.; Said, A.; Lupyana, S.; Macheyeki, A.S.; Shemsanga, C. Assessment to Locate Potential Deep Aquifer Systems Using Lithological Logs, Pumping Tests and Electromagnetic Surveys in Hard Rock Terrain of Dodoma Urban Area, Tanzania. J. Afr. Earth Sci. 2024, 216, 105310. [Google Scholar] [CrossRef] [Scilit]
  60. Ettazarini, S. Incidences of Water-Rock Interaction on Natural Resources Characters, Oum Er-Rabia Basin (Morocco). Environ. Geol. 2004, 47, 69–75. [Google Scholar] [CrossRef] [Scilit]
  61. Ettazarini, S. Groundwater Pollution Risk Mapping for the Eocene Aquifer of the Oum Er-Rabia Basin, Morocco. Environ. Geol. 2006, 51, 341–347. [Google Scholar] [CrossRef] [Scilit]
  62. Didi, S.; Hilali, A.; El Boute, S.; Hili, A.; Najine, A.; Hafiane, F.Z.; Benmoussa, A.; Sbaai, K.; Bazzar, K.; Mosaid, H. Groundwater Quality Mapping in the Northern Tadla Plain, Morocco, Using GIS and Combined Physico-Chemical and Bacteriological Analysis. Euro-Mediterr. J. Environ. Integr. 2025, 10, 2377–2399. [Google Scholar] [CrossRef] [Scilit]
  63. Zerouali, E.; Wafik, A.; Najine, A.; Radouani, F.; Chlahbi, S. Vulnerability Study by DRASTIC Method for Eocene and Turonian Aquifers in the Tadla Plain. J. BioMed Res. Environ. Sci. 2023, 4, 1486–1496. [Google Scholar] [CrossRef] [Scilit]
  64. Descloitres, M.; Ruiz, L.; Sekhar, M.; Legchenko, A.; Braun, J.-J.; Mohan Kumar, M.S.; Subramanian, S. Characterization of Seasonal Local Recharge Using Electrical Resistivity Tomography and Magnetic Resonance Sounding. Hydrol. Process. 2008, 22, 384–394. [Google Scholar] [CrossRef] [Scilit]
  65. Chambers, J.E.; Meldrum, P.I.; Wilkinson, P.B.; Ward, W.; Jackson, C.; Matthews, B.; Joel, P.; Kuras, O.; Bai, L.; Uhlemann, S.; et al. Spatial Monitoring of Groundwater Drawdown and Rebound Associated with Quarry Dewatering Using Automated Time-Lapse Electrical Resistivity Tomography and Distribution Guided Clustering. Eng. Geol. 2015, 193, 412–420. [Google Scholar] [CrossRef] [Scilit]
  66. Boucher, M.; Girard, J.-F.; Legchenko, A.; Baltassat, J.-M.; Dörfliger, N.; Chalikakis, K. Using 2D Inversion of Magnetic Resonance Soundings to Locate a Water-Filled Karst Conduit. J. Hydrol. 2006, 330, 413–421. [Google Scholar] [CrossRef] [Scilit][Green Version]
  67. Legchenko, A.; Descloitres, M.; Bost, A.; Ruiz, L.; Reddy, M.; Girard, J.-F.; Sekhar, M.; Mohan Kumar, M.; Braun, J.-J. Resolution of MRS Applied to the Characterization of Hard-Rock Aquifers. Groundwater 2006, 44, 547–554. [Google Scholar] [CrossRef] [Scilit]
  68. Chalikakis, K.; Nielsen, M.R.; Legchenko, A. MRS Applicability for a Study of Glacial Sedimentary Aquifers in Central Jutland, Denmark. J. Appl. Geophys. 2008, 66, 176–187. [Google Scholar] [CrossRef] [Scilit]
  69. Boucher, M.; Favreau, G.; Vouillamoz, J.M.; Nazoumou, Y.; Legchenko, A. Estimating Specific Yield and Transmissivity with Magnetic Resonance Sounding in an Unconfined Sandstone Aquifer (Niger). Hydrogeol. J. 2009, 17, 1805–1815. [Google Scholar] [CrossRef] [Scilit]
  70. Ryom Nielsen, M.; Hagensen, T.F.; Chalikakis, K.; Legchenko, A. Comparison of Transmissivities from MRS and Pumping Tests in Denmark. Near Surf. Geophys. 2011, 9, 211–224. [Google Scholar] [CrossRef] [Scilit]
Figure 1. Location map of the Oulad Abdoun phosphate basin and the Beni Amir deposit. White lines delineate the limits of the mining deposits.
Water 18 02163 g001
Figure 2. Simplified geological map of the study area (Extract from the 1:1,000,000 geological map).
Water 18 02163 g002
Figure 3. Lithostratigraphic log of the phosphate series of the Ouled Abdoun Basin [28].
Water 18 02163 g003
Figure 4. Integrated methodological workflow for hydrostratigraphic modeling, ERT, and MRS investigations in the Beni Amir phosphate deposit.
Water 18 02163 g004
Figure 5. The hydrostratigraphic conceptual model shows the partially saturated zone and the saturated zone of the Maastrichtian layer within the Beni Amir phosphate deposit.
Water 18 02163 g005
Figure 6. Hydrostratigraphic conceptual model of the Beni Amir phosphate deposit showing the location of ERT and MRS surveys on the 3D geological model. The vertical multicolored panels at each ERT site are the inverted 2D resistivity sections, displayed at reduced scale along their respective survey lines. Water wells are existing wells providing water-level and piezometric records; pumping wells are the production wells in which pumping tests were carried out.
Water 18 02163 g006
Figure 7. Integrated ERT–MRS hydrostratigraphic cross-sections in the partially saturated zone of the Beni Amir deposit, constrained by borehole stratigraphy and measured piezometric levels. The ERT profile shows inverted 2D resistivity distributions, with resistivity expressed in Ω·m according to the colour scale below each profile. The hydrostratigraphic units are represented using the same colour code throughout the figure: Lutetian, Ypresian, Danian–Thanetian, Maastrichtian, and Senonian. The blue line indicates the measured piezometric level. Numbered markers indicate boreholes used to constrain the stratigraphic interpretation. In each MRS panel, the horizontal bars show MRS-derived water content (W, %) and the white squares with dashed curves show MRS-derived hydraulic conductivity (K, m/s); depth is on the vertical axis, water content (%) on the lower x-axis, and hydraulic conductivity (m/s) on the upper x-axis. (a,g) ERT Profiles 1 and 6 showing resistivity distributions, stratigraphic boundaries, and piezometric levels; (b) MRS 1 inversion results showing water content and hydraulic conductivity versus depth; (c,d) West–East Cross-section 1 integrating MRS 2 and MRS 3; (e,f) Northeast–Southwest Cross-section 2 integrating MRS 7 and MRS 8; (h,i) North–South Cross-section 3 integrating MRS 10 and MRS 11, highlighting the vertical distribution of water content and hydraulic conductivity across hydrostratigraphic units. In each MRS panel, depth is shown on the vertical axis, water content (%) is plotted on the lower x-axis, and MRS-derived hydraulic conductivity (m/s) is plotted on the upper x-axis.
Water 18 02163 g007
Figure 8. Integrated ERT–MRS hydrostratigraphic cross-sections across the saturated zone of the Beni Amir phosphate deposit, constrained by borehole stratigraphy and measured piezometric levels. The ERT panels show inverted 2D resistivity distributions, with resistivity expressed in Ω·m according to the colour scale below each profile. The hydrostratigraphic units are represented using the same colour code throughout the figure: Lutetian, Ypresian, Danian–Thanetian, Maastrichtian, and Senonian. The blue line indicates the measured piezometric level. Numbered markers indicate boreholes used to constrain the stratigraphic interpretation. In each MRS panel, the horizontal bars show MRS-derived water content (W, %) and the white squares with dashed curves show MRS-derived hydraulic conductivity (K, m/s); depth is on the vertical axis, water content (%) on the lower x-axis, and hydraulic conductivity (m/s) on the upper x-axis. (a,c,e,g) ERT Profiles 2, 3, 4, and 5 showing resistivity distributions, stratigraphic boundaries, and piezometric levels; (b,d,f,h) MRSs 4, 5, 6, and 9 showing water content and hydraulic conductivity profiles versus depth. In each MRS panel, depth is shown on the vertical axis, water content (%) is plotted on the lower x-axis, and MRS-derived hydraulic conductivity (m/s) is plotted on the upper x-axis.
Water 18 02163 g008
Table 1. MRS results in the partially saturated zone of the Beni Amir phosphate deposit. Soundings are grouped by cross-section (Figure 7). Water-content values are MRS-derived mobile (free) water contents (effective porosity of the water-bearing material), not degrees of saturation.
MRSLocation/ProfileAquifer Unit (Age/Formation)Depth Interval (m)Water Content (%)Hydraulic Conductivity (m/s)Borehole/Piezometric Validation
MRS 1Eastern sector (ERT P. 1)Lutetian limestone2–61.71.5 × 10−5ERT profile 1 calibrated against borehole; on-site piezometric level at 35.68 m depth
Danian–Thanetian sandy phosphate20–301.61.1 × 10−5
Maastrichtian phosphate/Senonian marly limestone30–1001.1–1.38.1–8.85 × 10⁻⁶
MRS 2Southwest (Cross-sec. 1)Lutetian limestone2–20≤3.51.6 × 10−5
Danian–Thanetian sandy phosphate33–452.38.2 × 10−6
Maastrichtian phosphate45–602.3–1.77.85 × 10−6
MRS 3Southwest (Cross-sec. 1)Lutetian marly limestone (weakly sat.)4–160.31.5 × 10−5Borehole ~400 m: water table confirmed at ~39 m depth
Danian–Thanetian sandy phosphate24–340.27.1 × 10−6
Maastrichtian–Senonian34–1020.93.9 × 10−5
MRS 7North-central (Cross-sec. 2)Danian–Thanetian17–282.77.3 × 10−6Borehole ~22 m: water level consistent with upper aquifer top
Maastrichtian28–401.64.0 × 10−6
Senonian40–811.7–0.54.3 × 10−6
MRS 8North-central (Cross-sec. 2)Lutetian (over phosphate seq.)10–394.21.6 × 10−5
Maastrichtian–Senonian (lower)62–1001.65.95 × 10−6
MRS 10Southern sector (Cross-sec. 3)Danian–Thanetian29–391.2–2.13.4 × 10−6Borehole logs and piezometric data confirm aquifer geometry
Maastrichtian39–623.34.6 × 10−6
Senonian marl62–1024.35.7 × 10−6
MRS 11Western margin (Cross-sec. 3)Maastrichtian 15–270.94.4 × 10−5Borehole ~364 m: upper phosphate formations absent due to erosion
Table 2. MRS results in the saturated zone of the Beni Amir phosphate deposit. Soundings are referenced to the corresponding ERT profile (Figure 8). Water-content values are MRS-derived mobile (free) water contents, not degrees of saturation.
MRSLocation/ProfileAquifer Unit (Age/Formation)Depth Interval (m)Water Content (%)Hydraulic Conductivity (m/s)Borehole/Piezometric Validation
MRS 4Southeast (ERT P. 2)Lutetian limestone (thin zone)2–4MRS–borehole offset ~1193 m; slight water-level discrepancy attributed to distance
Ypresian16–321.74.2 × 10−6
Danian–Thanetian phosphate32–401.02.2 × 10−6
Maastrichtian uncemented phosphate40–580.51.5 × 10−6
Senonian58–1000.3
MRS 5Central (ERT P. 3)Lutetian limestone2–122.71.1 × 10−5Piezometric depth at 39 m consistent with ERT low-resistivity boundary; Senonian absent, lithological variation inferred
Danian–Thanetian/Maastrichtian30–552.98.6 × 10−6
MRS 6East of ERT P. 4Danian–Thanetian phosphate16–201.27.3 × 10−4Water levels consistent with ERT and MRS interpretations; the hydraulic conductivity at this station is the highest recorded in the survey and exceeds the other soundings
Maastrichtian phosphate20–351.97.3 × 10−4
Senonian35–1002.91.9 × 10−3
MRS 9Far southwest (ERT P. 5)Lutetian limestone4–103.51.3 × 10−5MRS water levels match the nearest borehole and the regional piezometric map; impermeable Ypresian interlayer (40–50 m) confirmed
Danian–Thanetian/Maastrichtian 25–812.57.3 × 10−6
Senonian marly limestone81–1004.41.0 × 10−5
Table 3. Comparison between pumping test and MRS-derived hydraulic conductivity values across various stratigraphic formations.
StratigraphyPumping WellK_Pumping (m/s)Water Level (m)Nearest MRSK_MRS (m/s)Distance (m)
Eocene87965.8 × 10−747.1263.5 × 10−42052
Danian–Thanetian14,5122.3 × 10−724.7711.1 × 10−64826
14,7154.6 × 10−734.24114.5 × 10−53960
88011.6 × 10−732.59102 × 10−6545
P102.7 × 10−734.4318.1 × 10−6752
P91.7 × 10−735.4244.2 × 10−61117
Maastrichtian14,5992.3 × 10−748.6442.2 × 10−63500
14,7582.6 × 10−737.68114.5 × 10−53122
19331.7 × 10−646.2333.9 × 10−52211
87631.5 × 10−746.2474.3 × 10−53161
P113.8 × 10−747.4474.3 × 10−51529
P65.3 × 10−743.0074.3 × 10−51572
P73 × 10−630.3074 × 10−53658
SenonianP121.5 × 10−637.3044.2 × 10−63122
P29.5 × 10−627.20114.5 × 10−52953
Disclaimer/Publisher’s Note: The statements, opinions and data contained in all publications are solely those of the individual author(s) and contributor(s) and not of MDPI and/or the editor(s). MDPI and/or the editor(s) disclaim responsibility for any injury to people or property resulting from any ideas, methods, instructions or products referred to in the content.