Article

Multi-Layer Soil Moisture Variability and Its Hydroclimatic Controls in Tajikistan, Central Asia

by
Nekruz Gulahmadov
1,2,
Yaning Chen
1,*,
Manuchekhr Gulakhmadov
1,2,
Gonghuan Fang
1,
Farhod Nasrulloev
1,2,
Seyed Omid Reza Shobairi
1,2 and
Aminjon Gulakhmadov
1,2,3
1
Xinjiang Institute of Ecology and Geography, Chinese Academy of Sciences, Urumqi 830011, China
2
Institute of Water Problems, Hydropower and Ecology of the National Academy of Sciences of Tajikistan, Dushanbe 734042, Tajikistan
3
Department of Hydraulics and Hydro Informatics, Tashkent Institute of Irrigation and Agricultural Mechanization Engineers, National Research University, Tashkent 60111496, Uzbekistan
*
Author to whom correspondence should be addressed.
Water 2026, 18(17), 2080; https://doi.org/10.3390/w18172080
Submission received: 5 June 2026 / Revised: 15 August 2026 / Accepted: 17 August 2026 / Published: 24 August 2026
(This article belongs to the Section Soil and Water)

Abstract

Tajikistan is highly vulnerable to climate change and depends heavily on agriculture, making soil moisture dynamics critical for water and food security. This study provides a comprehensive assessment of soil moisture variability across four depth layers (0–10 cm, 10–40 cm, 40–100 cm, and 100–200 cm) from 2000 to 2021 using NASA’s GLDAS-2 model and remote sensing data for land-air temperature, precipitation, and vegetation to identify key nexus of soil moisture change. Moisture data were converted to volumetric water content (m3/m3) to enable valid cross-layer comparisons. Our findings show that volumetric soil moisture increases with depth, from 0.219 m3/m3 at the surface to 0.293 m3/m3 in the deepest layer. Eastern Tajikistan exhibits higher moisture levels than the west, likely due to differing precipitation patterns. Seasonally, spring replenishes the soil with the highest moisture (0.270 m3/m3 at 0–10 cm), while summer strips it away (0.194 m3/m3 at 0–10 cm), potentially reflecting evapotranspiration losses. A significant warming trend is evident, with mean annual temperature peaking at 4.32 °C in 2016. Precipitation strongly influences upper-layer moisture (correlation: 0.49 at 0–10 cm; 0.44 at 10–40 cm). While annual averages remain stable, seasonal trends reveal significant winter wetting (+0.00043 m3/m3 per year, p < 0.001) and summer drying in the deepest layer, indicating intensifying seasonal contrasts. Vegetation follows a parallel pattern, declining from 2000 to 2010 and recovering thereafter. Greening is observed in 16.74% of the area, concentrated in the western mountains and northern highlands, while only 2.98% shows decline, mostly in small, fragmented patches. These findings highlight the substantial connection between climate, soil moisture, and vegetation in Tajikistan. They also suggest the need for depth-specific and seasonally aware water management strategies in this climate-sensitive region. Managing water here means looking beyond surface averages and thinking in layers, seasons, and geography.

1. Introduction

The variation in soil moisture represents a complex phenomenon shaped by numerous interconnected factors. At the forefront of these influences is climate change [1], which significantly alters precipitation patterns and moisture availability. Since precipitation [2] is the primary source of water input into the soil, any changes in its frequency or intensity directly impact moisture levels [3]. Additionally, temperature plays a crucial role in regulating evapotranspiration [4], striking a delicate balance between the water entering the soil and the water leaving it through evaporation. This dynamic interplay defines soil moisture levels in any given area. Beyond climate factors, the type of land cover [5,6] also affects soil characteristics and its capacity for water retention, further complicating moisture dynamics [7,8]. Different soil types have distinct physical properties that contribute to variations in moisture distribution. Consequently, the interactions among climate, vegetation, and land cover types result in a diverse landscape of soil moisture across various regions [9,10]. As climate change intensifies, it not only alters local weather patterns but also disrupts the intricate relationships between the Earth and the atmosphere [11,12]. This complexity underscores the importance of thoroughly analyzing the spatiotemporal characteristics of soil moisture [4,13,14,15] to understand how these variations interact with climate change, especially in water-limited regions, such as arid zones, where moisture availability is crucial for agricultural productivity, ecosystem health, and water resource management [16,17,18,19,20].
A prime example of this is Central Asia, the largest arid region in Eurasia, which is characterized by diverse landscapes and markedly varying climatic conditions across its expansive territory. This region encompasses several countries, including Kazakhstan, Kyrgyzstan, Uzbekistan, Turkmenistan, and Tajikistan, all grappling with challenges related to climate change and water scarcity [21,22,23,24,25,26]. With its extreme seasonal temperature fluctuations and ongoing moisture shortages, Central Asia exemplifies the complexities of arid environments that are particularly vulnerable to changes in the water cycle [27,28,29,30,31,32].
Among Central Asian countries, Tajikistan stands out as a critical case study due to its unique geographical, climatic, and ecological characteristics [33,34]. Nestled among towering mountains as a landlocked nation, Tajikistan experiences conditions that range from semiarid to arid, making it particularly vulnerable to extreme climate events such as droughts and floods. The ecological environment in Tajikistan is fragile and unstable, marked by limited biodiversity that struggles to adapt to harsh conditions exacerbated by the shrinkage of the Aral Sea [27,35,36,37,38,39,40,41,42]. Additionally, the country’s insufficient in situ observations pose significant challenges for effective environmental monitoring [43,44]. However, the use of gridded soil moisture data offers a promising solution, as it provides essential insights into soil moisture dynamics crucial for water resource modeling, drought early warning systems, and monitoring the carbon cycle within ecosystems [45,46].
By leveraging these data, Tajikistan can enhance its decision-making processes, improve resilience in its agricultural systems and ecosystems, and ultimately foster sustainable water management not only within the country but also across the broader region of Central Asia [47,48,49]. To understand soil moisture dynamics on a large scale, long-term observational datasets are essential; however, in situ data are often too sparse in arid regions to yield comprehensive spatial and temporal measurements. Recently, reanalysis and remotely sensed soil moisture data, such as the European Reanalysis-Interim v5 (ERA5) and the Global Land Data Assimilation System (GLDAS 2) [20,50,51], have emerged as invaluable tools to bridge this gap.
These datasets facilitate effective monitoring of soil moisture patterns at both regional and global scales. In Tajikistan, a country in Central Asia, the effects of climate change, including rising temperatures and shifting precipitation patterns, make the study of soil moisture dynamics critical for effective water management and agricultural sustainability [15,52,53,54,55]. Tajikistan is recognized as a water tower for Central Asia, supplying vital water resources to downstream countries via its extensive glacier- and snowmelt-fed river systems. However, despite its critical role in regional water security, the country’s soil moisture dynamics, particularly its vertical distribution across different depths, remain largely unexplored. Previous studies have typically relied on single-layer surface data or coarse-resolution products, without systematically investigating depth-dependent moisture variability and layer-specific responses to climatic forcing [56,57]. This gap is significant because shallow and deep soil layers play distinct hydrological roles. Surface layers are sensitive to precipitation and evaporation, while deeper layers regulate groundwater recharge and sustain vegetation during dry periods [45,46].
The contribution of this study is threefold. First, it provides the first multi-layer characterization of soil moisture across Tajikistan’s four depth layers (0–10, 10–40, 40–100, and 100–200 cm), revealing how moisture distribution differs between shallow and deep compartments. Second, it employs a long-term (2000–2021) temporal framework to capture both interannual trends and seasonal cycles, enabling the detection of recent shifts in soil moisture behavior. Third, it examines depth-dependent responses to essential climatic variables (ECVs) demonstrating that different hydroclimatic processes govern shallow and deep layers. Essential Climate Variables (ECVs) are critical for understanding climate system dynamics and have been widely applied in hydrological and environmental studies [58,59,60]. Here, we utilize four specific ECVs that feature long-term datasets and high geospatial resolution: near-surface air temperature, precipitation, vegetation dynamics, and land surface temperatures (LST) measured both during the day (LSTDay) and at night (LSTNight) from 2000 to 2021 [61,62]. Analyzing these variables together provides comprehensive insights into soil moisture dynamics in Tajikistan, highlighting the interactions among climatic factors and their cumulative impacts on the soil-water-vegetation system [61,63].
The primary aim of this study is to evaluate the spatial distribution and temporal changes in soil moisture in Tajikistan over the past 20 years, utilizing GLDAS-2 data to assess variations across topsoil, subsoil, and deeper soil layers. The specific objectives are to: (1) characterize the spatial and temporal patterns of soil moisture content at various depths; (2) investigate the spatial patterns of essential climatic variables; and (3) analyze the correlations between soil moisture variations and climatic factors across different seasons. By addressing this critical research gap, we aim to contribute to the development of adaptive strategies that enhance food security and ecosystem resilience in the face of climate variability.

2. Materials and Methods

2.1. Study Area

Tajikistan, a landlocked Central Asian country, is bordered by Kyrgyzstan to the North, Uzbekistan to the northwest, Afghanistan to the South, and the Chinese province of Xinjiang to the East (Figure 1). It features a diverse topography that significantly influences its climate. Mountain ranges cover 93% of the land, affecting weather patterns and biodiversity. Forests make up only 2.9% of the area, with 72.4% classified as primary forests, which are highly biodiverse. The country has about 4.6 million hectares (Mha) of arable land, which can irrigate 1.573 Mha. However, geographic constraints allow for only around 749,656 irrigable hectares to be utilized.
Additionally, there are 203,785 hectares of rain-fed arable land and approximately 3.9 Mha designated for pastures, underscoring the importance of livestock farming in the economy. The southwestern lowlands have a subtropical, semi-arid climate, transitioning into drier regions that rely on irrigation for agriculture [50]. In the lower elevations, average temperatures range from 23 °C (73.4 °F) to 30 °C (86 °F) in July, and from −1 °C (33.8 °F) to 3 °C (37.4 °F) in January. In contrast, the eastern Pamirs, characterized by rugged high-altitude terrain, experience average temperatures of 5 °C (41 °F) to 10 °C (50 °F) in July and −15 °C (5 °F) to −20 °C (−4 °F) in January. Tajikistan is the wettest of the Central Asian republics, with the most rainfall in winter and spring (https://www.weather-atlas.com/en/tajikistan-climate (accessed on 13 April 2026).

2.2. Dataset and Analysis

2.2.1. Soil Moisture Dataset

To assess the soil moisture dynamics, we explored the NASA Global Land Data Assimilation System Version 2 (GLDAS-2) Noah Land Surface Model L4 monthly [64,65], which provides soil moisture content in different depths of soil layers (0–10 cm, 10–40 cm, 40–100 cm, 100–200 cm underground) at the monthly 0.25° grid data from 2000 to 2021. The 0–10 cm layer was selected as the primary surface soil moisture layer because it is the most responsive to atmospheric forcing (precipitation and evaporation) and is the layer most directly relevant to agricultural productivity, vegetation health, and drought monitoring in arid regions [19,45]. Forced with a combination of model and observation data from 2000 to the present, these datasets were validated against available data from multiple sources [51,55]. To understand the spatio-temporal patterns of soil moisture content in Tajikistan, we conducted a mapping analysis of long-term central tendencies (mean) and interannual variability.
This assessment was structured around seasonal periods, specifically defining winter as December to February, spring as March to May, summer as June to August, and fall as September to November. However, to ensure valid comparisons across soil layers of different thicknesses, all GLDAS-2 soil moisture data, originally provided as total water storage (kg/m2), were converted to volumetric water content (m3/m3) using the following formula:
θ = s d
where θ is volumetric water content (m3/m3), S is total water storage (kg/m2, equivalent to mm of water equivalent), and d is layer thickness (mm). This conversion accounts for the varying thickness of each soil layer (0–10 cm = 100 mm, 10–40 cm = 300 mm, 40–100 cm = 600 mm, 100–200 cm = 1000 mm), enabling meaningful comparisons of moisture levels across layers.

2.2.2. Essential Climatic Variables (ECVs)

Essential Climate Variables (ECVs) are critical parameters that characterize the Earth’s climate system and assess climate change. The Global Climate Observing System (GCOS) identifies 50+ ECVs, which cover various components of the climate system, including the atmosphere, land, oceans, and ice [66]. In this study, we focused on four selected ECVs based on the availability of long-term datasets and high geospatial resolution (Table 1). These variables include near-surface air temperature, precipitation, vegetation dynamics, and both daytime (LSTDay) and nighttime (LSTNight) land surface temperatures from 2000 to 2021. Analyzing these variables collectively provides comprehensive insights into soil moisture dynamics, highlighting the interactions among climatic factors and their cumulative effects on the soil-water-vegetation system in Tajikistan. The below section describes each dataset.
To analyze and comprehend the temperature variations across Tajikistan from 2000 to 2021, we utilized a dataset sourced from the FLDAS Noah Land Surface Model L4 Global, which incorporates MERRA-2 and CHIRPS [66]. This dataset provides a range of land surface parameters generated by the Noah 3.6.1 model, as part of the Famine Early Warning Systems Network (FEWS NET) Land Data Assimilation System (FLDAS). The data is available at a resolution of 0.1°, spanning from January 1982 to the present. It features a monthly temporal resolution and covers a global expanse from 60° S to 90° N latitude and 180° W to 180° E longitude. Furthermore, we explored the utility of the Integrated Multi-satellite Retrievals for GPM (IMERG) Final Run [67], a NASA product that is highly recommended for general applications. This dataset provides estimations of global surface precipitation at a spatial resolution of 0.1° and is updated monthly. The IMERG dataset is particularly valuable for large-scale applications, especially in areas with limited or unreliable surface observations, such as Tajikistan. In addition, Land Surface Temperature (LST) is a critical climate variable indicating the temperature of the Earth’s surface in degrees Celsius [68].
It plays a vital role in understanding land surface processes at both local and global levels. In this study, we employed the MOD11A2 Version 6.1 product from the Terra Moderate Resolution Imaging Spectroradiometer [69], which provides daytime and nighttime LST in Kelvin. This product generates an average LST calculated over 8 days, featuring a spatial resolution of 1km within a grid measuring 1200 by 1200 Km. The pixel values in the MOD11A2 dataset reflect the simple average of all corresponding MOD11A1 LST pixel measurements collected during each 8-day interval, with data spanning from 2000 to the present. Data extraction and initial processing were performed using the NASA Giovanni online data exploration system (https://giovanni.gsfc.nasa.gov/giovanni/, (accessed on 5 January 2026), which provides a validated interface for accessing and analyzing GLDAS and other satellite-based Earth science datasets. Giovanni allows users to visualize, analyze, and intercompare data products without requiring local data downloads or extensive formatting, ensuring consistency and reproducibility in data handling.

2.2.3. Vegetation Cover

To analyze the dynamics of vegetation cover in Tajikistan, we utilized the MOD13Q1 Version 6 dataset from the Terra Moderate Resolution Imaging Spectroradiometer (MODIS) [70]. This dataset, generated every 16 days with a spatial resolution of 250 m, spans from 2000 to the present. MOD13Q1 offers the Normalized Difference Vegetation Index (NDVI), which serves as a continuity index relative to the NDVI derived from the National Oceanic and Atmospheric Administration’s Advanced Very High-Resolution Radiometer (NOAA-AVHRR). We employed NDVI values representing natural vegetation cover to assess local vegetative responses across Tajikistan. To further analyze the trends in annual variations in selected ECVs, we examined linear trends on a per-pixel basis from 2000 to 2021. Linear trend estimation establishes a regression relationship between the variables ( v i ) and time ( t i ). The regression coefficient ( C 0 ) indicates the trend of the variable ( x i ) [36].
C 0 = n × i = 1 n v i t i i = 1 n v i i = 1 n t i n × i = 1 n t i 2 ( i = 1 n t i ) 2
Additionally, we examined the spatial and temporal variations in ECVs through a comprehensive analysis of anomalies, which involved evaluating deviations from long-term averages from the early 2000s, using a base period of 2000–2010. The baseline period 2000–2010 was selected because it captures the earliest consistent MODIS record while representing a relatively stable climatic phase before the accelerated warming and drying observed in Central Asia after 2010. This period is also widely used in regional hydroclimate studies, ensuring comparability of our results. An 11-year baseline provides a statistically robust mean while remaining sensitive to recent climatic shifts. The same baseline period was applied consistently for all variables (soil moisture, temperature, precipitation, LST, and NDVI). Anomalies were calculated at the pixel level as the deviation of each year’s value from the 2000–2010 mean for each pixel using the following formula:
A i = V i   V b a s e
where A i is the anomaly for year i , V i is the value for year i , and V b a s e is the mean value over the baseline period (2000–2010). In addition, to elucidate the relationship between these climatic variables and soil moisture dynamics at various depths, we employed Pearson correlation analysis [71,72]. This method allows for a nuanced examination of the relationships between two specific variables while controlling for the influence of one or more additional variables.
By isolating these interactions, the Pearson correlation analysis provides a clearer picture of the intricate dynamics at play, thereby enriching our understanding of how these variables could potentially impact soil moisture in Tajikistan and informing potential adaptive strategies in response to changing environmental conditions [73,74,75]. Thus, each correlation coefficient is evaluated using the t-test at significance levels of 0.05 and 0.01. The Pearson correlation of variables x 1 and x 2 is calculated while controlling for the influence of a third variable y . This approach ensures that the relationships observed between x 1 and x 2 are not confounded by the effects of y , thereby providing a more accurate assessment of their direct association. This is tested by:
t x 1 x 2 . y = t x 1 x 2 t x 1 y t x 2 y 1 t x 1 y 2 1 r x 2 y 2

2.2.4. Data Pre-Processing and Analysis

To ensure consistency across all datasets, the multi-source data were unified to a common spatial framework. All datasets were resampled to a spatial resolution of 0.25° to match the GLDAS-2 soil moisture product, which served as the reference grid. Resampling was performed using the bilinear interpolation method for continuous variables (temperature, precipitation, and LST) and the nearest neighbor method for discrete variables (land cover). The projection coordinate system was standardized to WGS 1984 (EPSG:4326) [74]. Temporal aggregation was performed to ensure consistency across datasets with different temporal resolutions. Monthly datasets (GLDAS-2 soil moisture, FLDAS temperature, and IMERG precipitation) were used directly. For MODIS products (LST and NDVI), which are provided as 8-day and 16-day composites respectively, monthly means were calculated by averaging all composite values within each calendar month. This approach ensured that all variables were available at a consistent monthly temporal resolution for correlation and trend analyses. For MODIS products, quality filtering was applied using the provided quality control (QC) layers. Only pixels with good quality (QC = 0 or 1) were retained for analysis. Gap filling was not performed; instead, only pixels with valid observations were included in the monthly averages to avoid introducing artifacts from interpolation. For outlier detection and removal, the interquartile range (IQR) method was applied, whereby values falling outside 1.5 times the IQR above the 75th percentile or below the 25th percentile was excluded from the analysis. These preprocessing steps ensure the reproducibility of our analysis and minimize uncertainties arising from differences in spatial and temporal resolutions among datasets.
To further assess the robustness of our analytical framework, we conducted additional statistical diagnostics (Table S1). Multicollinearity among climate variables (temperature, precipitation, LST Day, and LST Night) was evaluated using the Variance Inflation Factor (VIF), with values below 10 considered acceptable. VIF was selected because it quantifies how much the variance of a regression coefficient is inflated due to correlations with other predictors, helping to identify redundancy among climate variables. Nonlinearity was tested by comparing linear and quadratic regression models using ANOVA; a p-value > 0.05 indicated no significant nonlinear relationship. This approach was chosen to determine whether a simple linear model adequately captures the relationship between soil moisture and climate variables, or whether more complex formulations would be required. Temporal autocorrelation in the residuals was examined using the Durbin–Watson test, with values close to 2 indicating no autocorrelation.
The Durbin–Watson test was selected because it is a widely used and robust method for detecting first-order autocorrelation in time series regression residuals, which is critical for ensuring the validity of significance tests. Lagged responses between climate variables and soil moisture were explored using cross-correlation analysis up to 6 months (Table S1).
Cross-correlation analysis was chosen to identify potential time delays in the response of soil moisture to climatic drivers, as hydrological processes such as infiltration and snowmelt can introduce lags that are not captured by contemporaneous correlations. To this end, this study utilized a range of software, including Google Earth Engine, ArcMap 10.8, and RStudio 2026.05.0+218 for data collection, processing, analytical tasks and mapping. The methodological workflow is presented in Supplementary Material Figure S1.

2.2.5. Uncertainty and Limitations

While this study provides valuable insights into Tajikistan’s soil moisture dynamics, several uncertainties warrant acknowledgement. The GLDAS-2 Noah model relies on simplified parameterizations of snowmelt, frozen ground, and evapotranspiration, which may introduce uncertainties in snow-dominated, complex terrain like the Pamir Mountains. The coarse spatial resolution (0.25°) cannot capture fine-scale heterogeneity driven by topography and land use, potentially masking local variations. The absence of in-situ observations in Tajikistan prevents direct validation, although previous studies have confirmed GLDAS reliability in Central Asia at regional scales. Additionally, satellite-based precipitation (IMERG) and LST (MODIS) products are subject to retrieval errors in mountainous terrain due to cloud cover and atmospheric interference. The potential influence of irrigation and land management practices on NDVI and soil moisture patterns, particularly in western Tajikistan’s agricultural areas, was not explicitly accounted for in this analysis. Temporal autocorrelation was detected in the deepest soil layer (100–200 cm) using the Durbin–Watson test (p = 0.005), suggesting that time-series dependency may influence trend detection in this layer. While this does not undermine the overall findings, it should be considered when interpreting long-term trends in deep soil moisture.
To better understand these uncertainties, it is useful to examine how GLDAS-2 soil moisture estimates are generated. GLDAS uses land surface models (e.g., Noah) that solve water and energy balance equations at the land-atmosphere interface. For soil moisture, these models simulate infiltration and evapotranspiration using Richards’s equation for unsaturated flow, which requires estimation of hydraulic conductivity and its strong dependence on soil moisture content [76]. This nonlinear relationship makes output highly sensitive to input parameters and boundary conditions. Forcing inputs include atmospheric variables (precipitation, temperature, radiation, humidity) from stations and satellites, as well as vegetation cover and soil texture. Soil hydraulic properties come from global databases (e.g., FAO Soil Map) using pedotransfer functions to estimate water-holding capacity at different depths [77]. Errors in any input, satellite, reanalysis, or soil data products, can propagate into soil moisture estimates [51,55]. These risks are acute in complex terrain like Tajikistan, where sparse observations increase reliance on models. Validation studies report uncertainties of approximately 0.05–0.06 m3/m3 for GLDAS surface soil moisture [51,78], indicating that absolute values should be interpreted with caution. Accordingly, we have reduced decimal precision in our results. However, the spatial and seasonal patterns remain robust, as they are based on relative differences and statistically significant trends. Thus, while GLDAS-2 is the best available long-term dataset for this region, interpretations should acknowledge these uncertainties. Future work should prioritize establishing soil moisture monitoring stations across Tajikistan’s climatic zones, in collaboration with national agencies, to enable direct validation and improve satellite-based estimates.

3. Results

3.1. Spatio-Temporal Diverging Patterns of Soil Moisture Distribution Across Tajikistan (2000–2021)

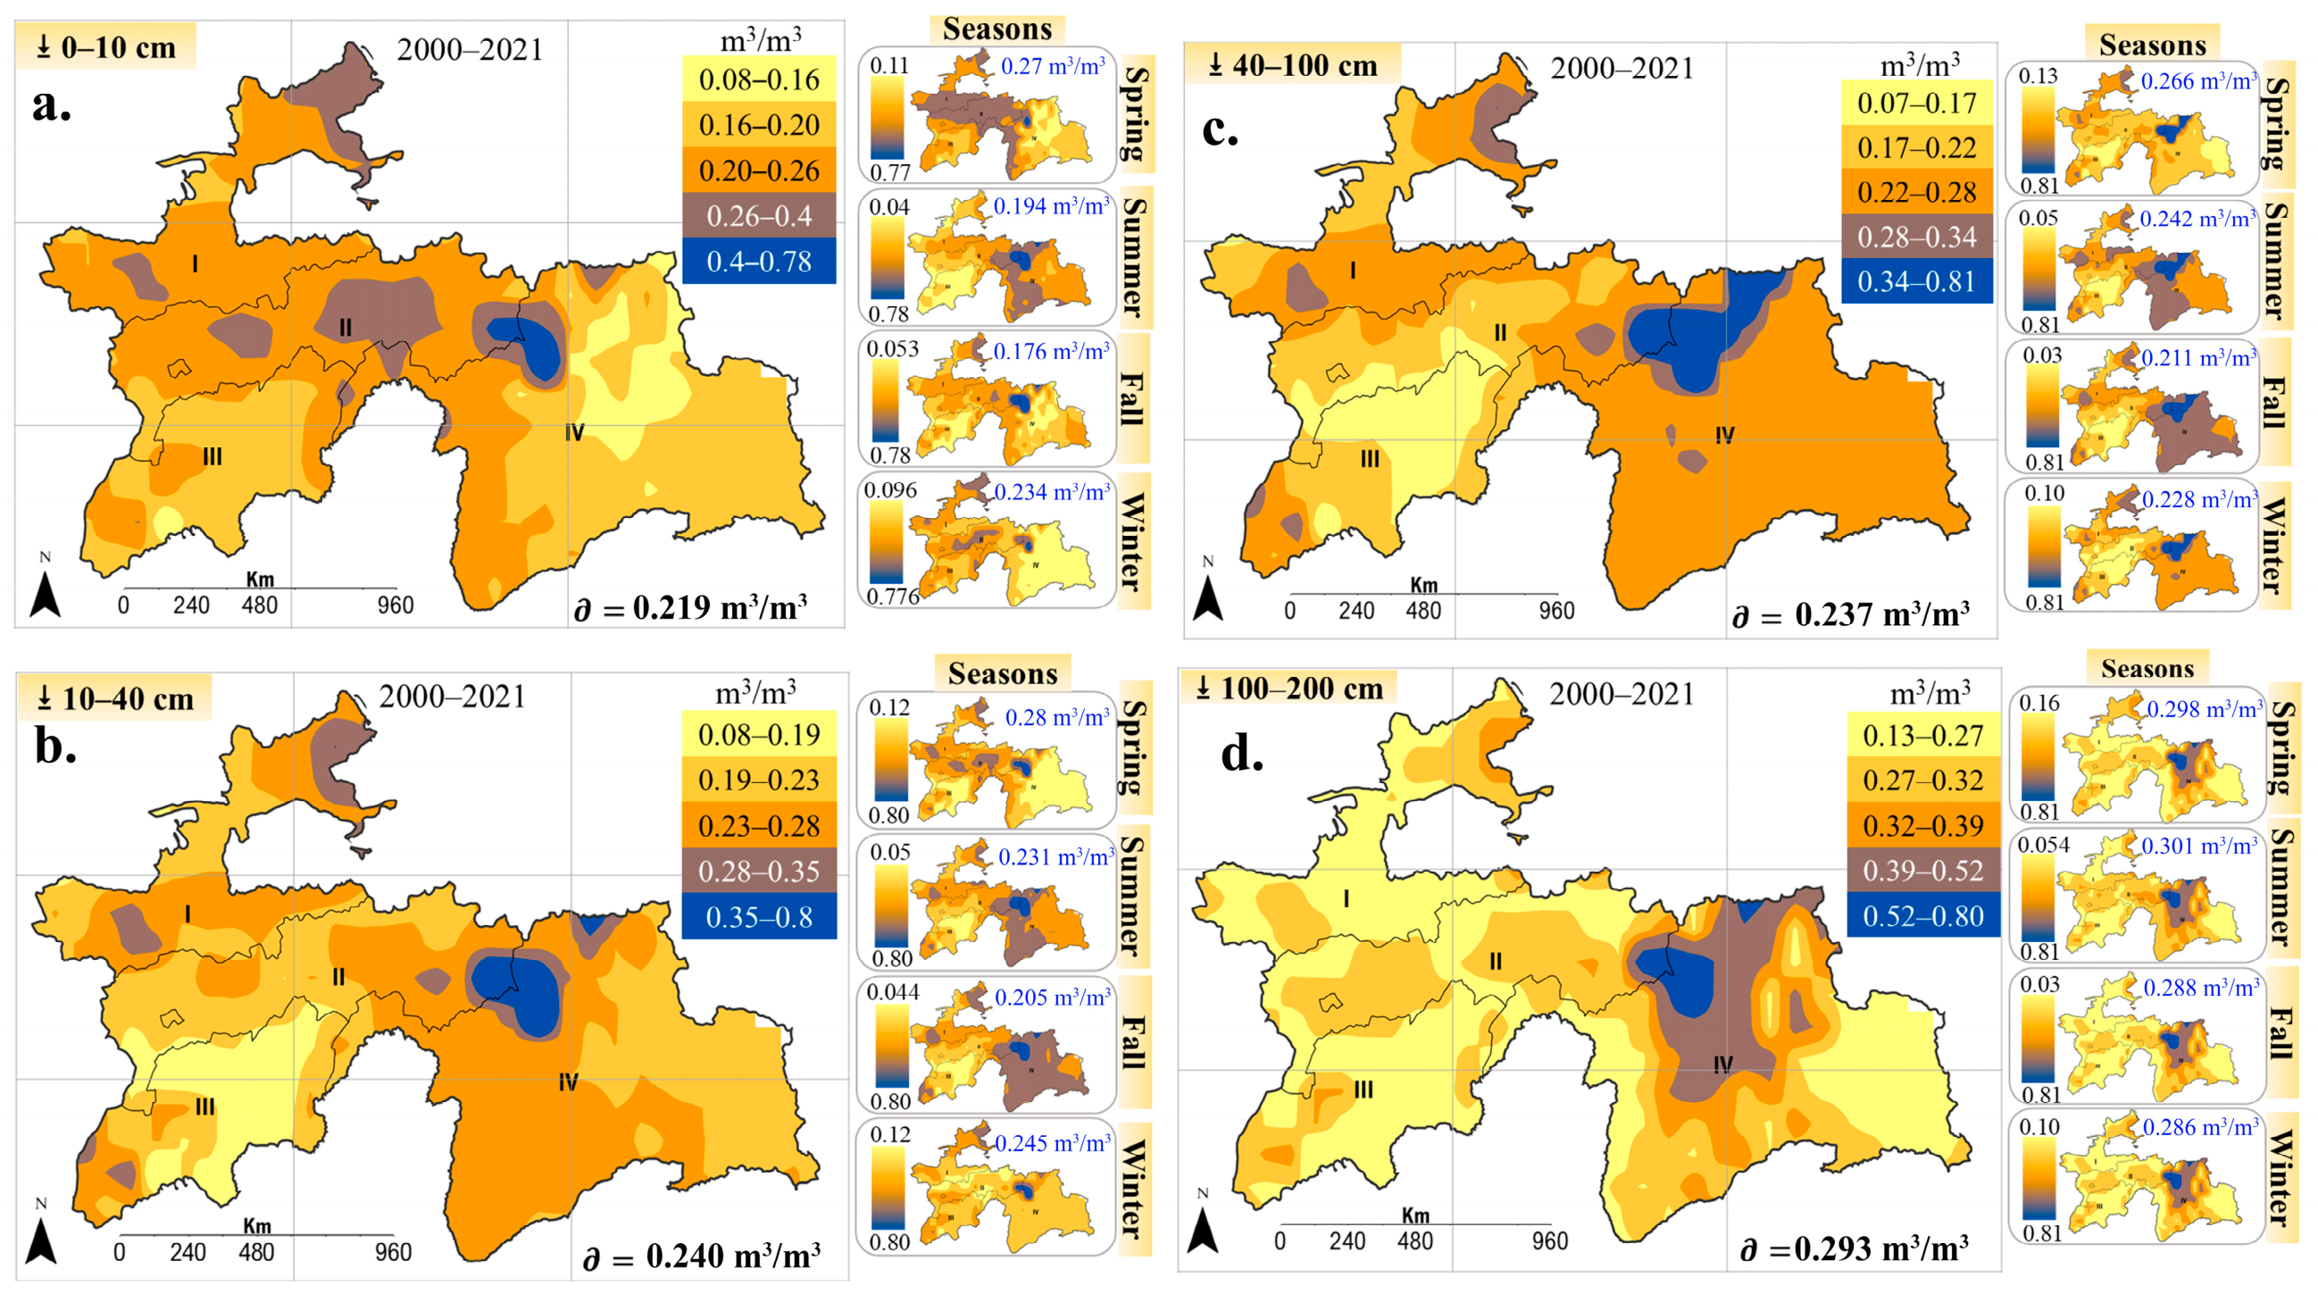
Soil moisture plays a critical role in terrestrial hydrological processes by influencing water balance, evaporation, runoff, and groundwater recharge [45,46]. Analysis of Figure 2 and Figure 3 present the spatio-temporal patterns of volumetric soil moisture (m3/m3) across four soil layers (0–10 cm, 10–40 cm, 40–100 cm, and 100–200 cm) in Tajikistan from 2000 to 2021. Across all seasons, volumetric soil moisture increased consistently with depth, with mean values of 0.219 m3/m3 in the surface layer (0–10 cm), 0.240 m3/m3 in the 10–40 cm layer, 0.237 m3/m3 in the 40–100 cm layer, and 0.293 m3/m3 in the deepest layer (100–200 cm) (Figure 2a–d). This depth-dependent increase was observed throughout the country. Still, it was particularly pronounced in the eastern provinces, including the transboundary regions of Badakhshon (Figure 2), while the western regions exhibited systematically lower moisture levels, likely due to regional differences in precipitation patterns [31]. The shallowest layer (0–10 cm) consistently showed the lowest moisture content, especially in the western zone (Figure 2a), suggesting the potential sensitivity of surface soils to climatic variability compared to deeper layers. Beyond the general depth-related patterns, soil moisture also displayed distinct seasonal variations.
Deeper layers (40–100 cm and 100–200 cm) consistently maintained higher moisture than shallower layers (0–10 cm and 10–40 cm) throughout all seasons, but the magnitude of this difference varied seasonally (Figure 2). Spring emerged as the wettest season across most layers, with values reaching 0.270 m3/m3 at 0–10 cm and 0.298 m3/m3 at 100–200 cm, while summer recorded the lowest surface moisture (0.194 m3/m3 at 0–10 cm), reflecting the combined effects of increased evapotranspiration and reduced precipitation during warmer months. Interestingly, the deepest layer (100–200 cm) remained relatively stable across seasons, ranging from 0.286 to 0.301 m3/m3, suggesting that deep soils are buffered from seasonal atmospheric forcing (Figure 2d).
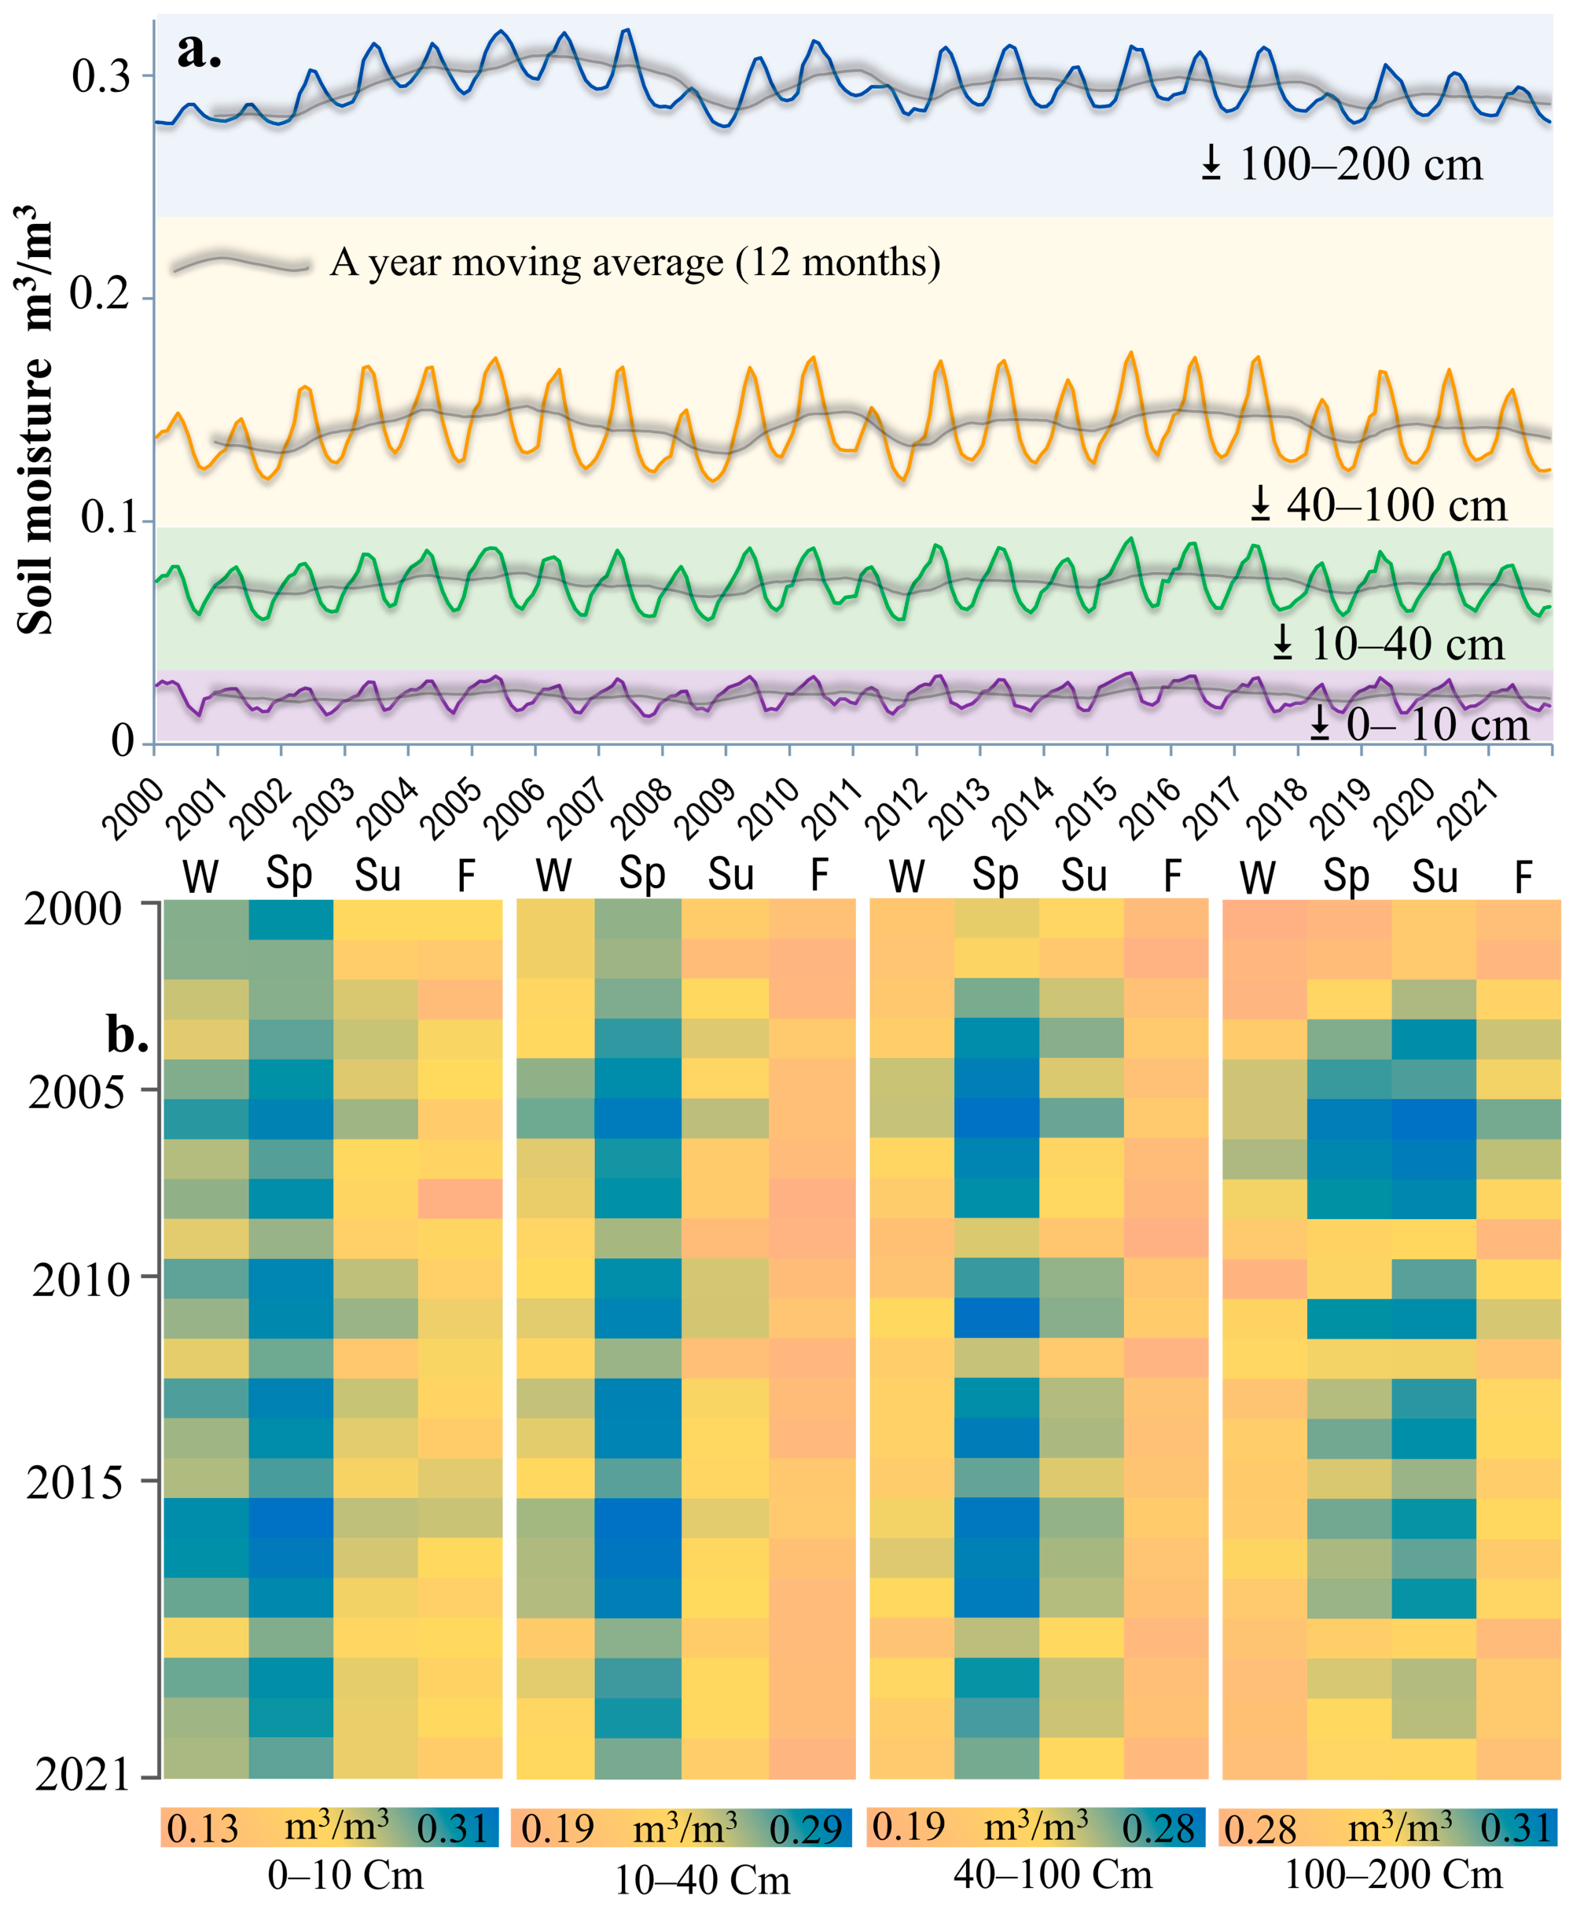
Fall and winter exhibited intermediate moisture levels, with values of 0.176 m3/m3 and 0.234 m3/m3 at 0–10 cm, respectively, further illustrating the seasonal rhythm of soil water dynamics (Figure 2d). Interannual variability further revealed distinct layer-specific behaviors over the study period (Figure 3a). The 0–10 cm layer exhibited inconsistent fluctuations without a discernible long-term trend, oscillating between 0.127 and 0.321 m3/m3, suggesting that surface moisture is governed primarily by short-term climatic variability rather than directional change. The 10–40 cm, 40–100 cm, and 100–200 cm layers showed ranges of 0.186–0.309 m3/m3, 0.197–0.293 m3/m3, and 0.277–0.321 m3/m3, respectively (Figure 3a). However, seasonal trend analysis revealed significant changes in deeper layers that were masked in the annual averages (Table 2).
The 100–200 cm layer exhibited a significant increasing trend in winter (+0.00043 m3/m3 per year, p < 0.001), but significant decreasing trends in spring (−0.00016 m3/m3 per year, p < 0.001), summer (−0.00009 m3/m3 per year, p < 0.01), and fall (−0.00067 m3/m3 per year, p < 0.05). Additionally, the 40–100 cm layer showed a significant decreasing trend in fall (−0.00141 m3/m3 per year, p < 0.05). These contrasting seasonal trends suggest that while winter recharge is increasing, warmer-season drying is intensifying, resulting in relatively stable annual averages (Figure 3b). The elevated spring moisture levels observed across most layers can be attributed to a confluence of environmental factors that together enhance soil water availability. Snowmelt from winter accumulation delivers a pulse of water to the soil profile, while increased spring precipitation further contributes to soil saturation [7,37]. At the same time, lower spring temperatures reduce evaporative losses compared to summer, allowing soils to retain moisture more effectively [79]. The thawing of seasonally frozen ground releases additional stored water as temperatures rise [8,80], and limited plant water uptake in early spring, before full vegetation development, allows more moisture to remain in the soil [43,48,81]. These interacting processes collectively elevate spring soil moisture, creating favorable conditions for ecological processes and biological activity in terrestrial ecosystems across Tajikistan.

3.2. Changes in Selected Essential Climatic Variables

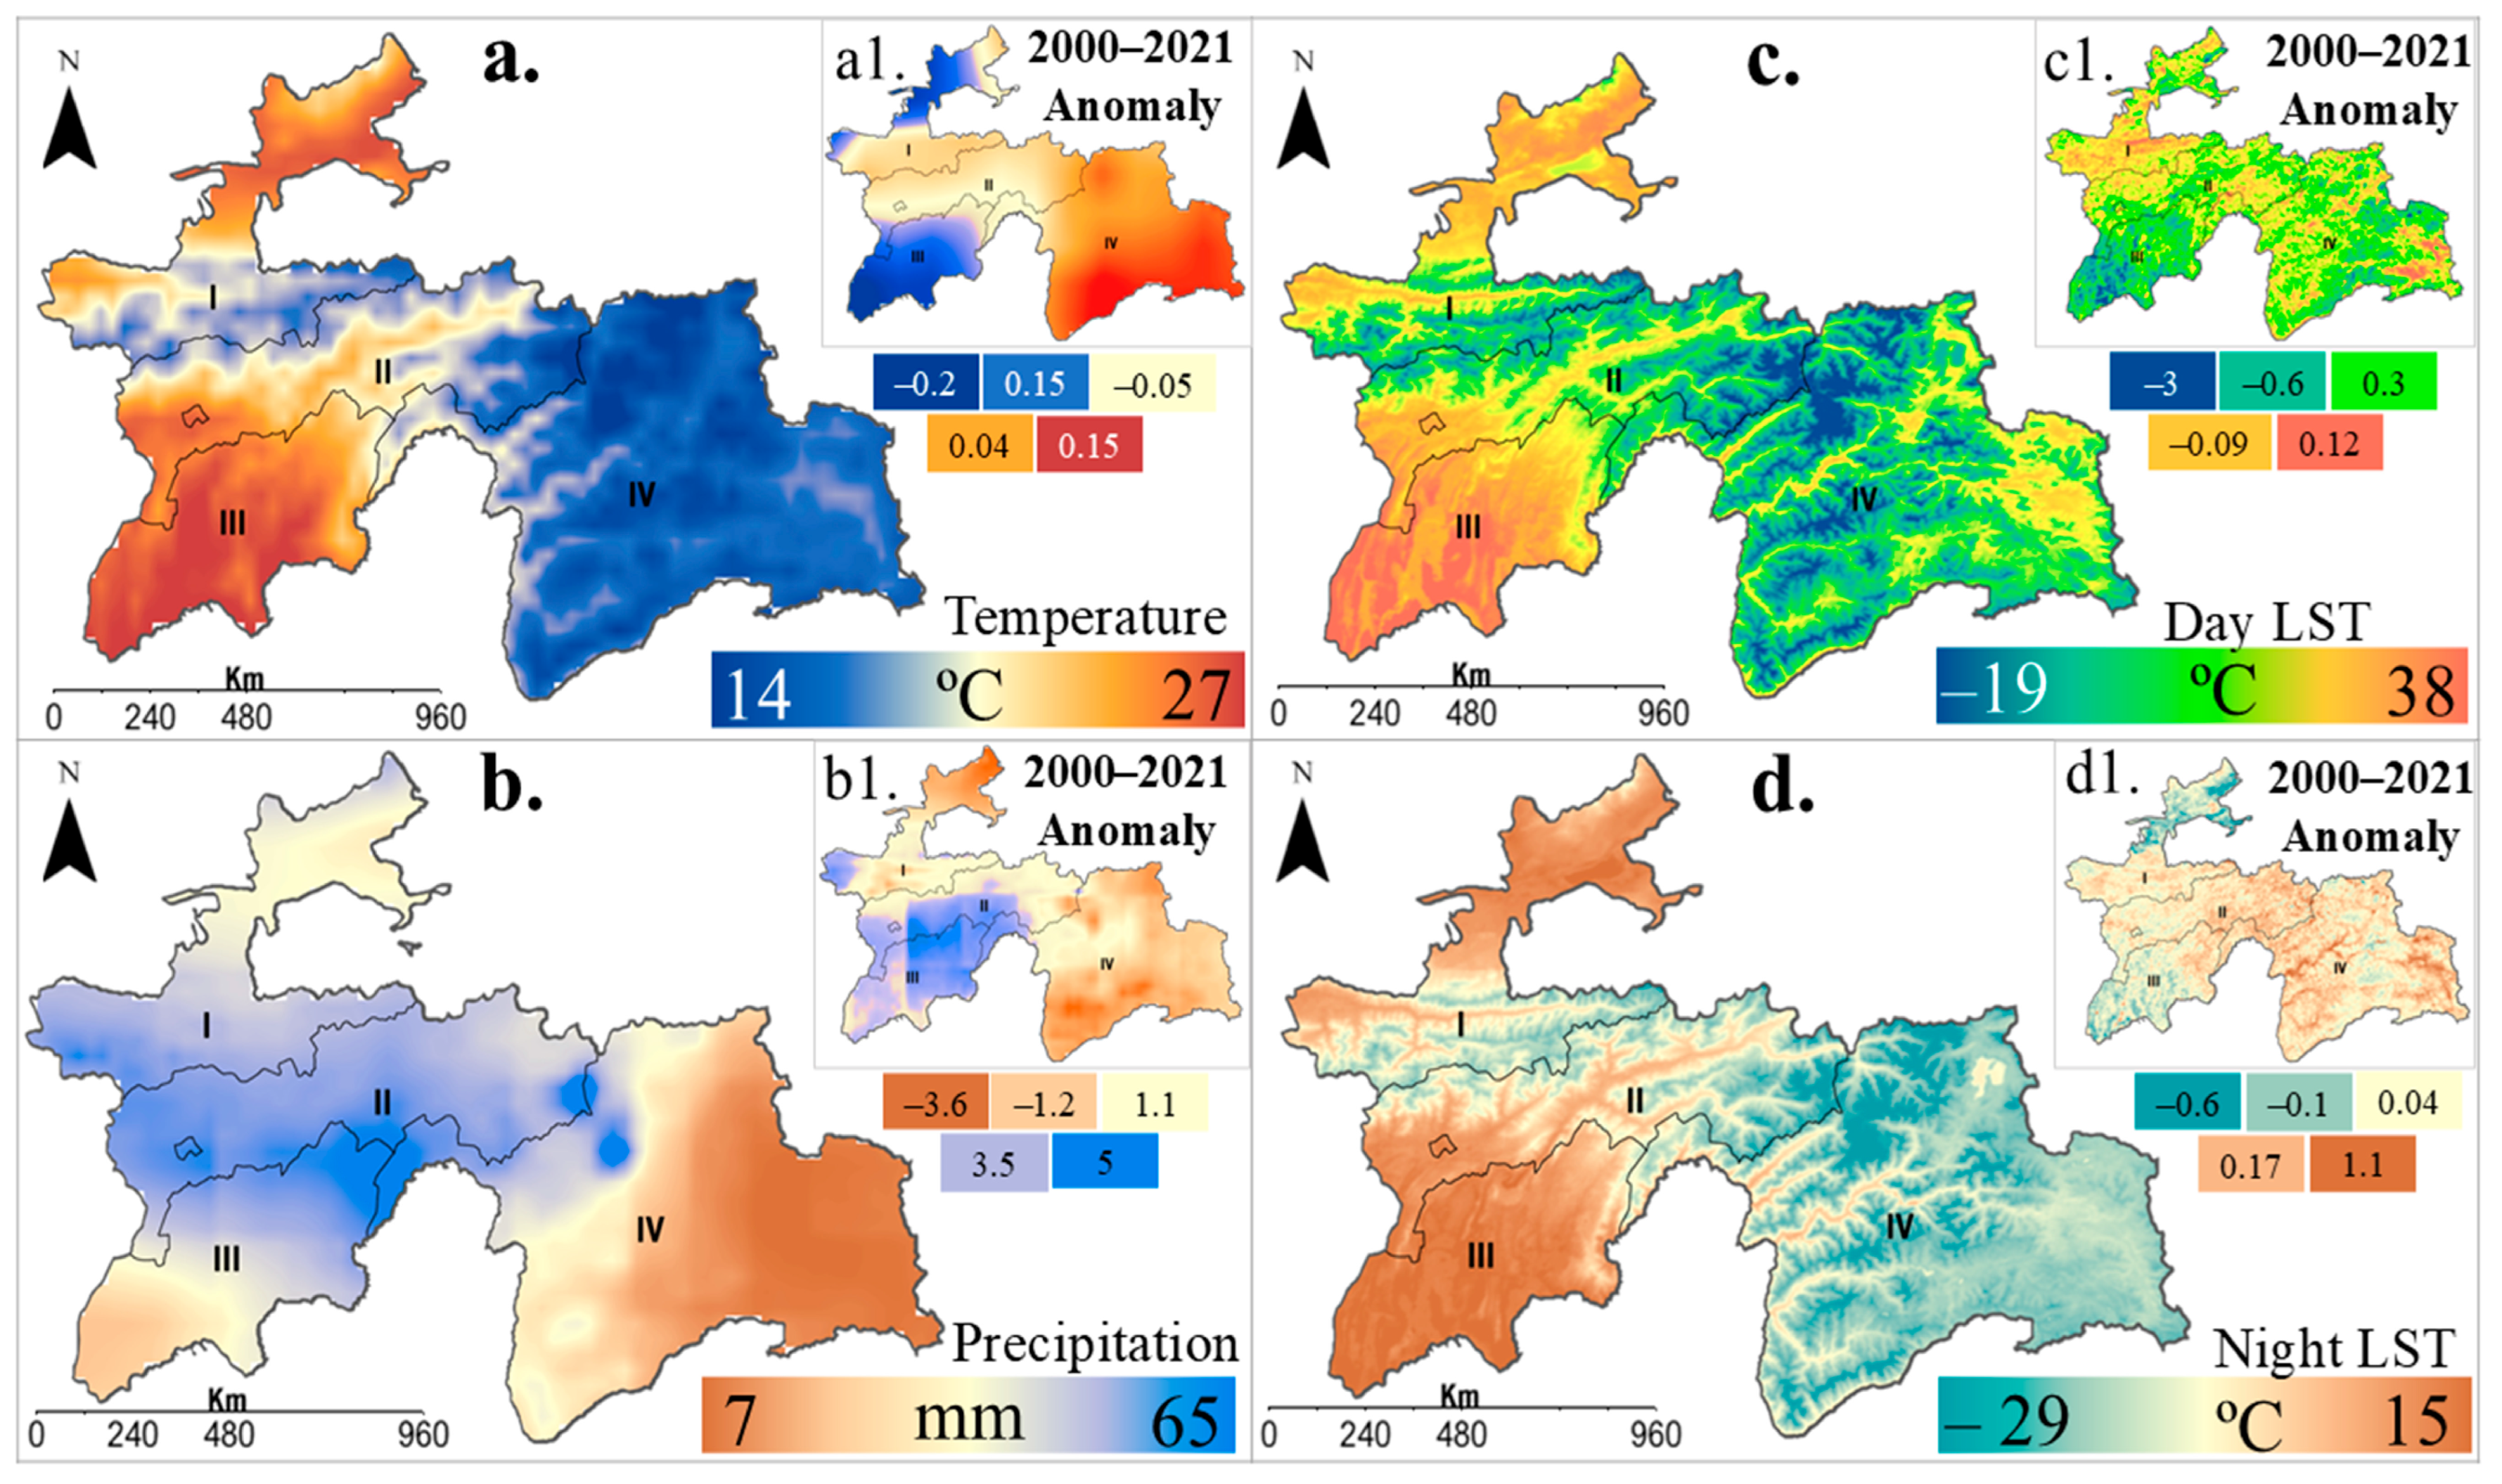
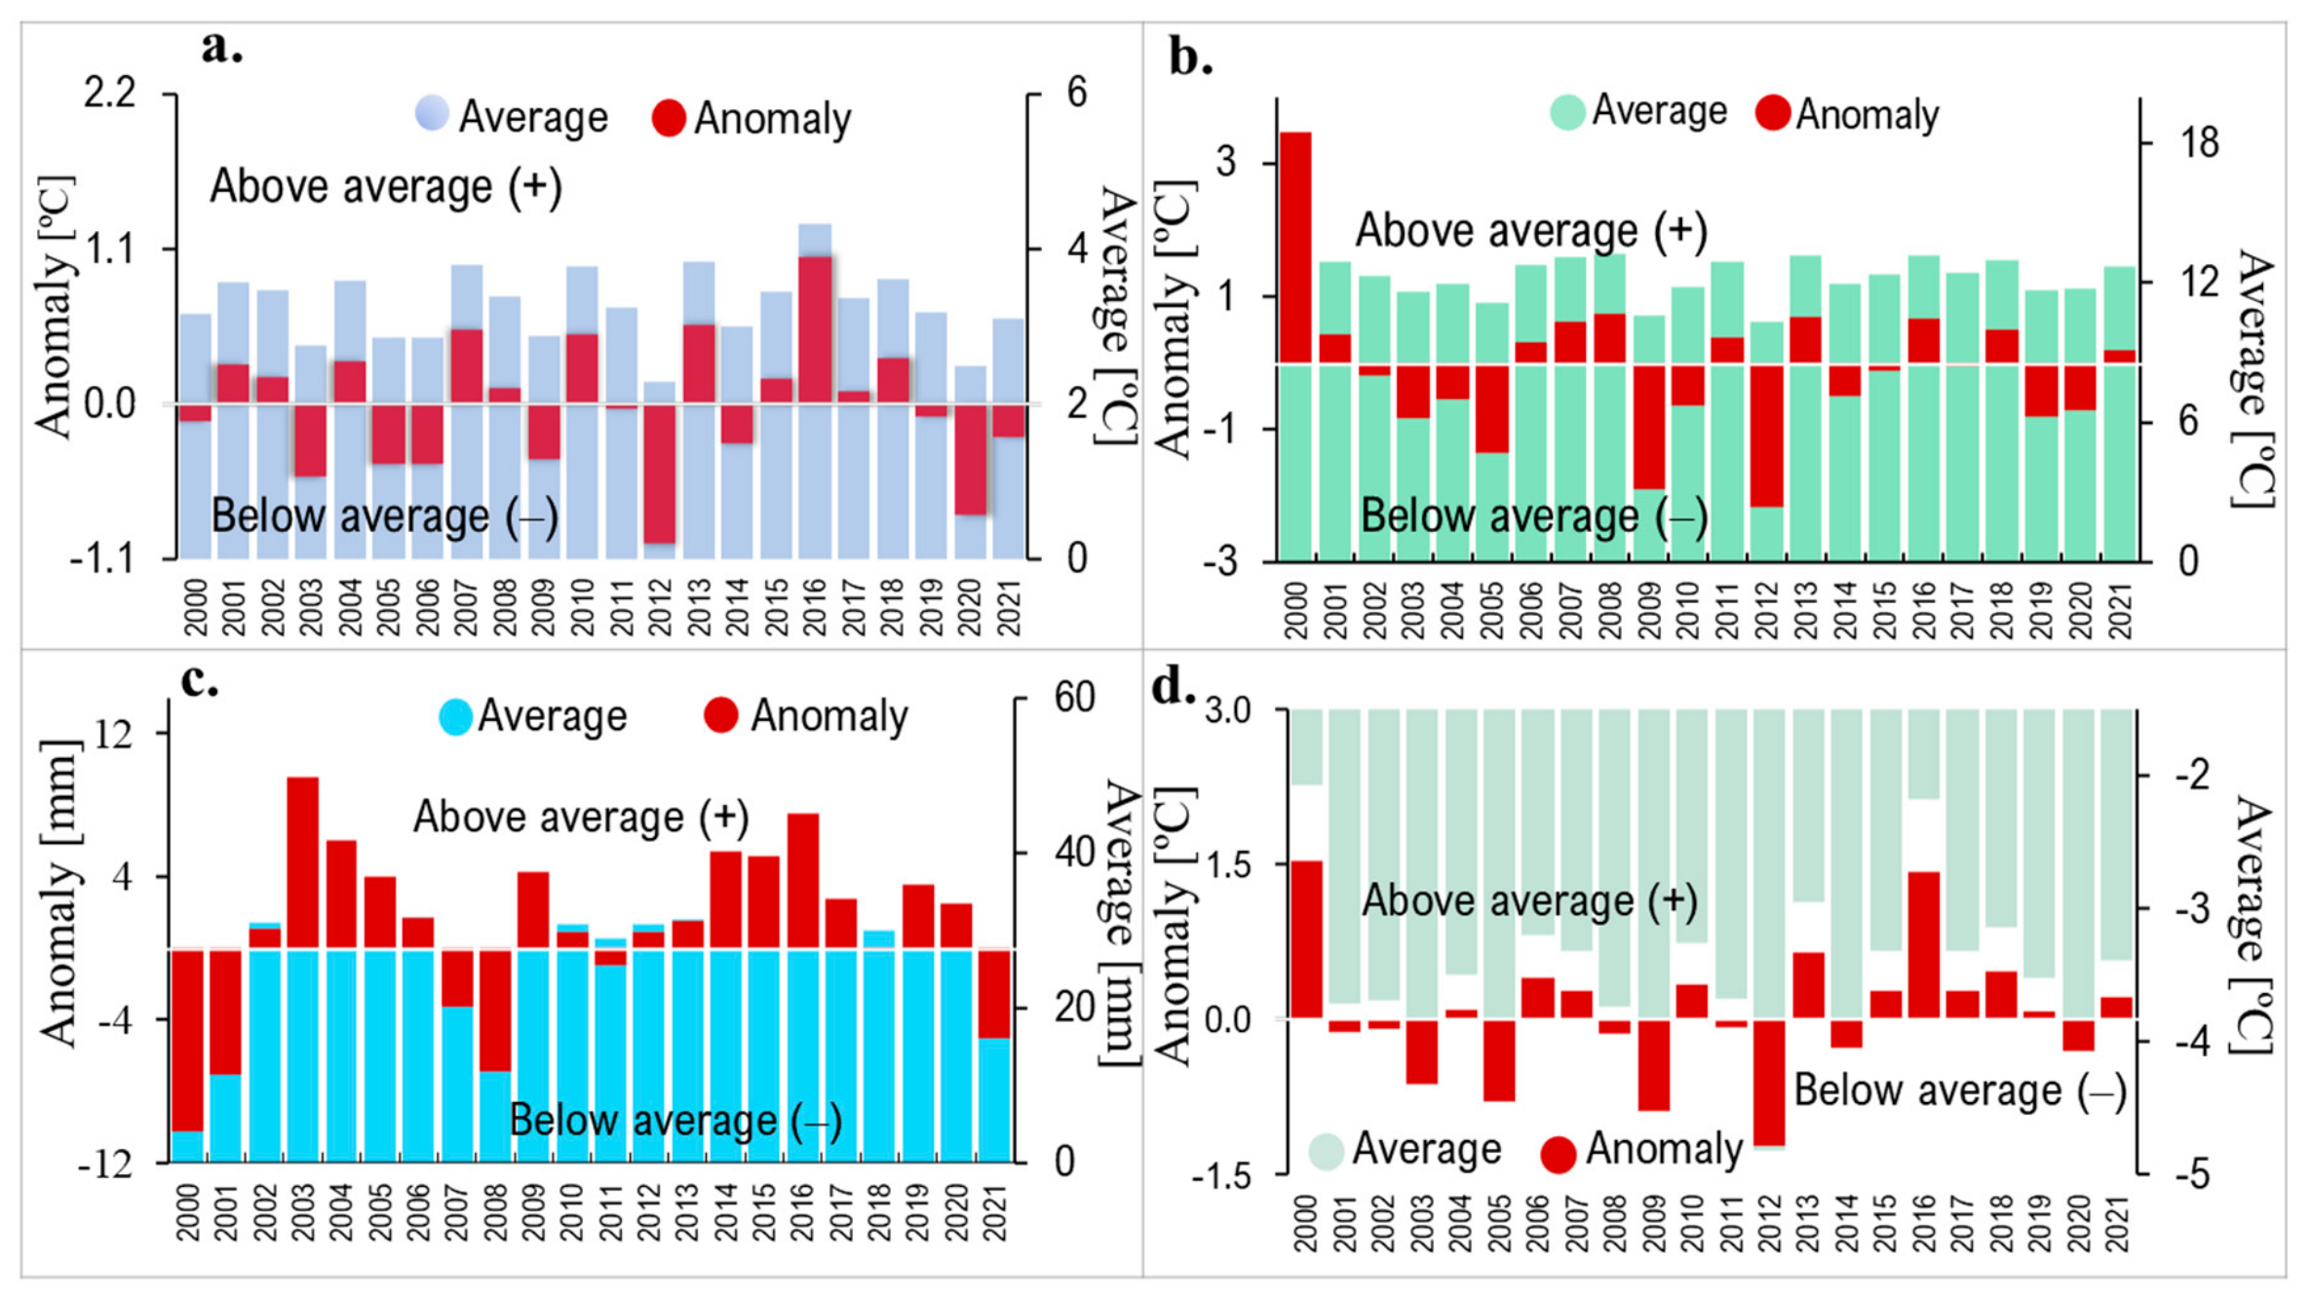
Spatially, annual average air temperatures ranged from 14 °C in the cooler zones to 20.7 °C in the warmer areas (Figure 4a). The western provinces, particularly Khatlon and the region around Tajikistan province, exhibited the warmest conditions, while the eastern mountain stronghold of Badakhshon remained significantly cooler. Sugd province presented a pronounced north–south thermal gradient, with warmer conditions in the north giving way to cooler temperatures in the south. Anomaly analysis relative to the 2000–2010 baseline (Figure 4a) revealed that the warmest regions experienced slight cooling (−0.2 °C), while the coldest areas warmed by approximately +0.15 °C, suggesting a gradual homogenization of thermal extremes across the country, a pattern that may have consequences for local ecosystems and agricultural systems [52,82]. Precipitation exhibited even sharper spatial contrasts.
Annual totals ranged from as little as 7 mm in the driest areas to as much as 65 mm in the wetter zones (Figure 4b). The western provinces, including Khatlon and southern Sugd, were characterized by high precipitation variability, while Badakhshon in the east remained persistently dry. Anomaly analysis (Figure 4b) revealed that the most variable regions experienced positive anomalies of up to +5 mm above the baseline, while eastern areas and northern Sugd saw reductions of approximately −3.6 mm. Such spatial disparities in precipitation have direct implications for water availability, soil moisture replenishment, and the timing and intensity of rainfall events critical for crop production [54,83,84]. In addition, land surface temperature (LST) patterns largely mirrored those of air temperature, but with more extreme values. Daytime LST reached 38 °C in Khatlon and northern Sugd, while dropping to −19 °C in the high-altitude terrain of Badakhshon (Figure 4c). Nighttime LST ranged from 15 °C in warmer areas to −29 °C in the mountains (Figure 4d). Anomaly analysis revealed a marked redistribution of thermal conditions: warmer regions experienced declining LST (−0.6 °C at night, −3 °C during the day), while colder regions warmed by as much as +1.1 °C at night. This spatial rebalancing of surface temperatures further indicates that Tajikistan’s climate is not changing uniformly, with some areas cooling while others warm, reflecting the complexity of climate change impacts across the country. It is worth noting that diagnostic tests confirmed the appropriateness of our analytical approach (Table S1). VIF values for all variables were below 10 (max = 8.14), indicating no significant multicollinearity. Tests for nonlinearity showed no evidence of significant nonlinear relationships (p > 0.05 for all layers).
The cross-correlation analysis revealed that precipitation drives soil moisture with no lag (0 months), while temperature and LST showed minor leads of 0–1 month, indicating that our linear correlation framework captures dominant relationships (Table S1).
The Durbin–Watson test indicated some autocorrelation only in the deepest layer (100–200 cm, p = 0.005), which we acknowledge as a limitation. Collectively, these findings point to a complex climatic transformation in Tajikistan, one defined not by uniform warming or drying, but by spatially heterogeneous shifts in temperature, precipitation, and surface thermal conditions. The warming of air temperatures, together with the spatial redistribution of thermal and moisture regimes, highlights the challenges facing local communities that depend on stable climatic conditions for agriculture, water management, and livestock production [53,57,76,85].
The analysis of ECVs in Tajikistan from 2000 to 2021 revealed distinct trends in temperature, precipitation, daytime and nighttime surface temperature, each with important implications for the region’s hydrological and ecological systems. Mean annual temperature exhibited considerable interannual variability, yet a warming trajectory emerged over the study period, with the warmest year recorded in 2016 when temperatures peaked at 4.32 °C, more than 1 °C above the long-term average (Figure 5a). Application of the Mann–Kendall test indicated a statistically significant warming trend (p < 0.01, Table 3). In contrast, the lowest mean temperature occurred in 2000 at 3.15 °C, a year marked by a slight negative anomaly of −0.12 °C. Precipitation, however, behaved differently, fluctuating considerably from year to year, with 2000 experiencing a severe deficit of −10.2 mm and 2003 receiving an excess of +9.6 mm above the baseline (Figure 5c). Despite these extremes, the overall trend in precipitation was positive but not statistically significant (p = 0.128), suggesting that while wetter years may be becoming more frequent, the signal remains obscured by high interannual variability.
This lack of significance does not imply absence of change, but rather that the trend is not yet distinguishable from natural variability over the 22-year record. Daytime land surface temperatures followed a pattern broadly similar to air temperatures, reaching their maximum mean values in 2016 at 13.16 °C (Figure 5b), yet they were punctuated by sharp negative anomalies, most notably in 2000 (−2.07 °C) and 2009 (−4.48 °C), underscoring the region’s vulnerability to episodic cooling events.
Nighttime LST, in contrast, remained relatively stable throughout the period, with only minor fluctuations and a peak anomaly of +1.42 °C in 2016, though consistently lower than daytime values (Figure 5d). Neither daytime nor nighttime LST showed statistically significant trends (Table 3), indicating that while the surface thermal regime is responsive to short-term variability, it has not undergone the same directional change observed in air temperature.

3.3. Response of Soil Moisture to Essential Climatic Variables

The temporal and spatial variability of soil moisture content results from a complex interplay of factors including land surface biophysical warming (LST), precipitation patterns, elevated surface air temperatures, and decreased surface specific humidity [56]. For instance, variations in land surface temperature affect evaporation rates, which in turn influence soil moisture retention. Additionally, precipitation patterns are critical, as they directly impact moisture replenishment in the soil. As surface air temperatures rise, the capacity for moisture retention diminishes, exacerbating soil moisture deficits, particularly in warmer regions. Simultaneously, decreased surface-specific humidity indicates reduced moisture in the air, which can further contribute to increased evaporation and diminished soil moisture levels. In the context of Tajikistan, a Pearson correlation analysis revealed a significant relationship between regional soil moisture averages and precipitation levels, indicated by correlation coefficients of 0.49 at 0–10 cm soil depths and 0.44 at 10–40 cm depths, both at a confidence level of 0.05 (Table 4). These findings highlight the vital role that precipitation plays in influencing soil moisture, particularly important for agricultural productivity and ecosystem health in the country.
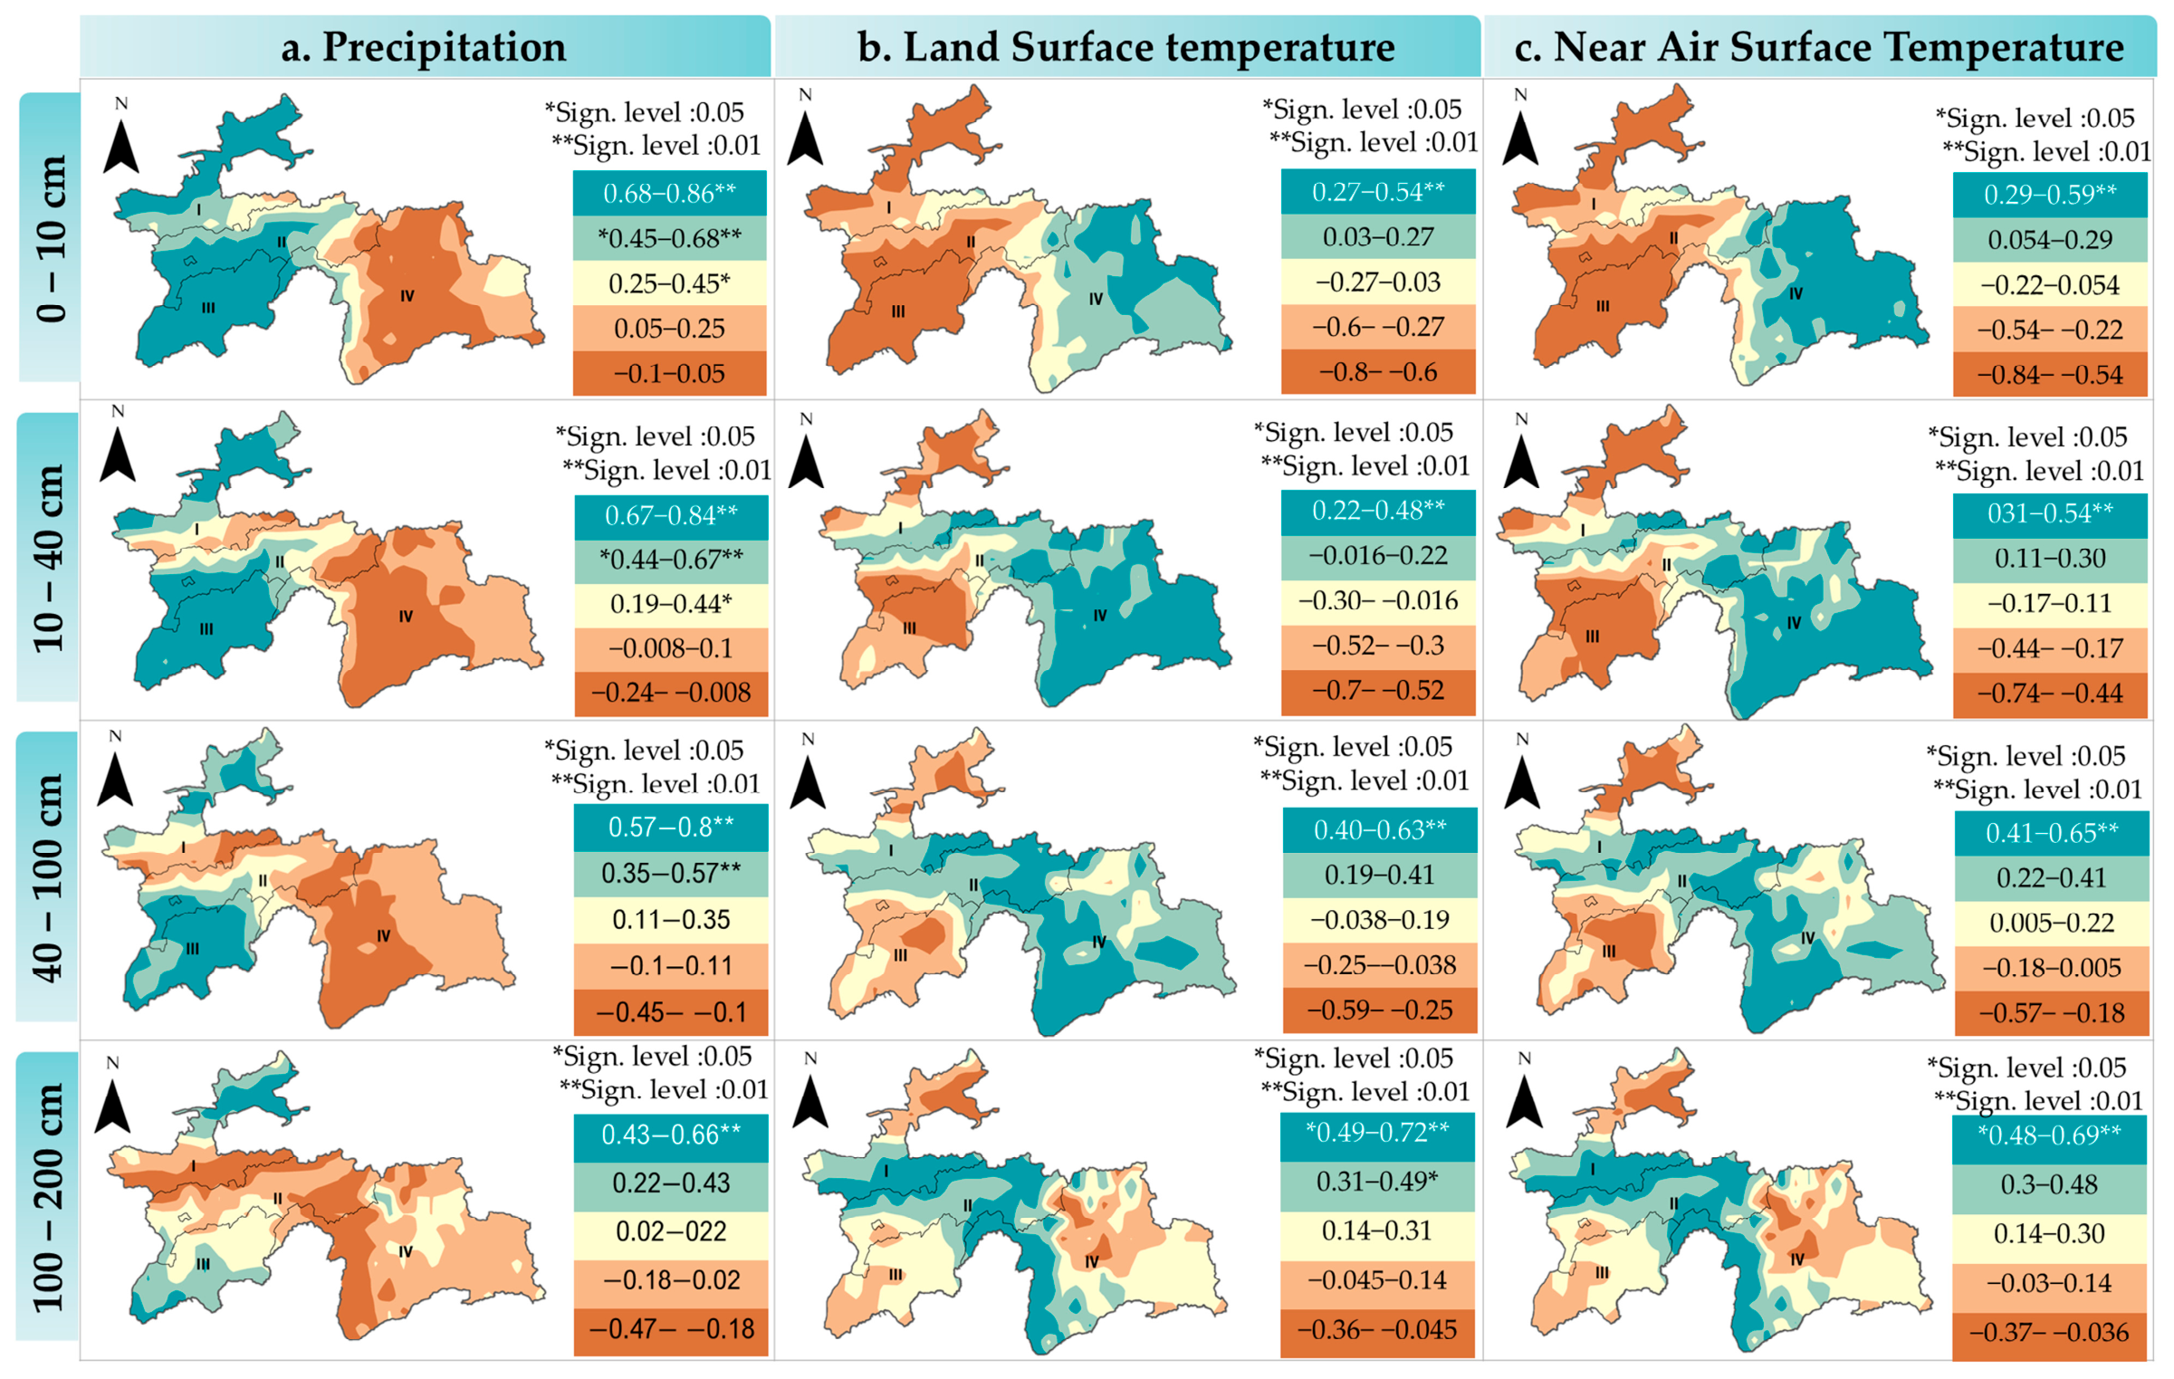
Local spatial assessments of the correlations between soil moisture and ECVs in Tajikistan have revealed noteworthy differences that merit eco-hydrological consideration (Figure 6). At a depth of 0–10 cm to 100 cm, soil moisture content exhibited a strong correlation to precipitation, exceeding the 0.01 confidence level in the western regions, partly in Khatlon and southern transboundary areas of Tajikistan province, along with the northern part of Sugd (Figure 6a). This suggests that these areas are significantly influenced by precipitation levels, highlighting their importance for local water resources and ecosystem health [3]. Concurrently, precipitation anomalies in these provinces have shown a tendency to exceed long-term averages compared to the base period (Figure 4b1), further emphasizing the moisture supply critical for sustaining soil productivity in these areas.
On the other hand, in the eastern region of Tajikistan, particularly within the mountainous areas of Badakhshon, the dynamics shift evidently. Here, increases in land and surface air temperatures, with decreasing precipitation compared to long-term averages, significantly influence soil moisture levels at the 0–10 cm depth. This relationship was tested at a confidence level of 0.01, indicating a potential interaction and influence of warming variables on soil moisture dynamics in the east compared to the west of Tajikistan (Figure 6b,c) which is much influenced by abundant precipitation. The nature of these findings exemplified the complexity of soil moisture behavior in Tajikistan and the varying influences of climatic factors across different regions. The pronounced correlation in the western provinces highlights the critical need for targeted water management and agricultural practices tailored to local conditions since Tajikistan relies on agriculture [47,76].
On the contrary, the emerging challenges in the eastern part, partly Badakhshon, where warming trends may exacerbate moisture deficits (Figure 4a,c,d). Such variability and complexity suggested that while precipitation remains a key driver of regional soil moisture in Tajikistan, other factors, such as topography, vegetation cover, and land use practices, may also significantly influence the relationships observed in different regions. Thus, this study analyzed the vegetation cover dynamics in the same context to comprehend the role of vegetation distribution in the evolving soil moisture dynamics (Figure 7). Recognizing these disparities is essential for tailoring effective agricultural practices and water management strategies, particularly considering the country’s vulnerability to climate change and the resulting impacts on water availability and soil health.
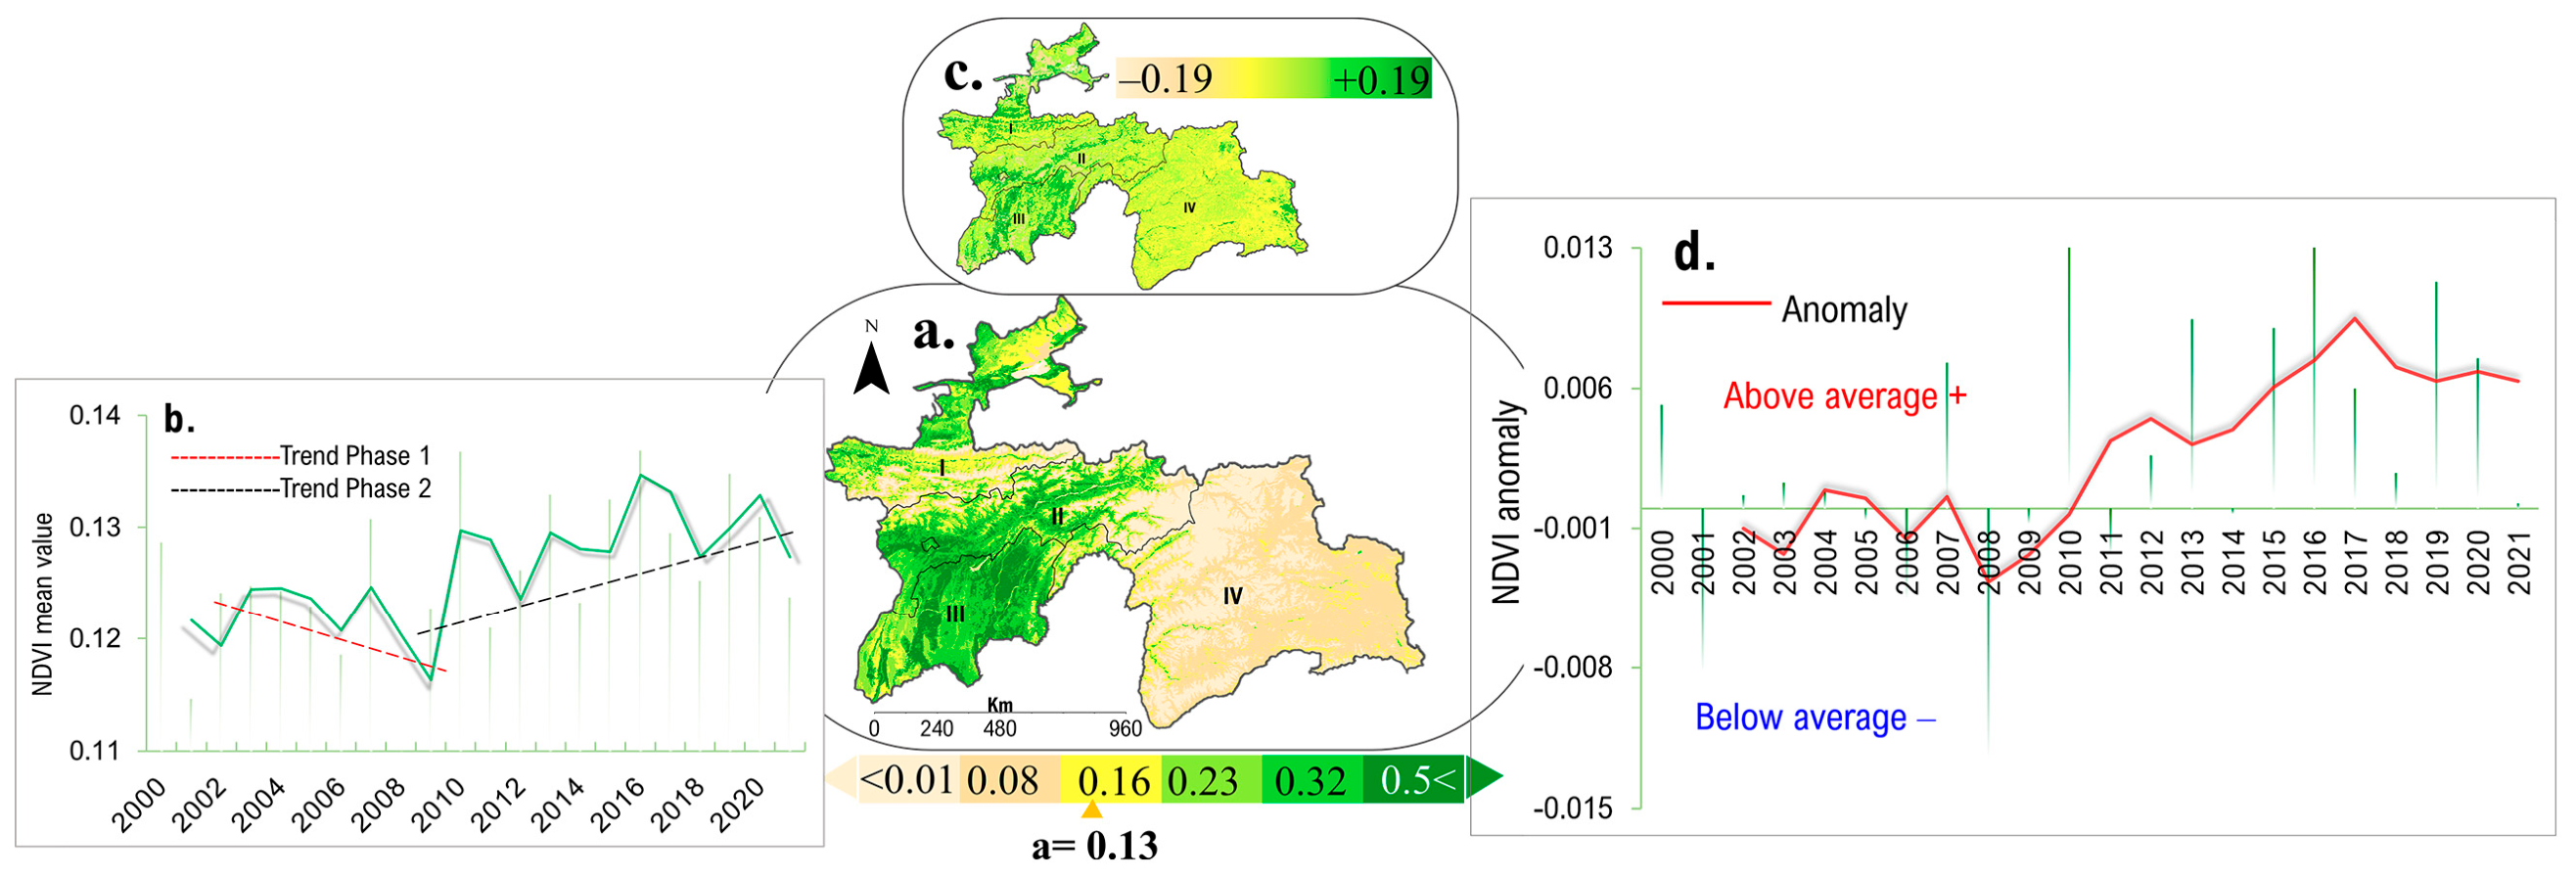
The monthly average NDVI, computed using the average value composite method, yielded an overall mean of 0.13 across the study period. Our analysis revealed two distinct phases in the evolution of vegetation dynamics: a declining trend from 2000 to 2010, followed by a significant increase during the subsequent period from 2010 to 2020. Spatial analysis of the average NDVI indicates that regions characterized by high vegetation coverage are predominantly located in the western parts of Tajikistan, particularly across Khatlon and northern Sughd, while areas with low vegetation coverage are concentrated in the eastern regions, notably Badakhshon. This spatial distribution emphasizes the heterogeneity of vegetation response to climatic factors across the region. Pixel-level trend analysis further revealed considerable geographical heterogeneity in vegetation changes over the 2000–2021 period (Figure S2). The statistical significance analysis shows that the majority of the country (80.28%) experienced no significant long-term changes in vegetation greenness (p ≥ 0.05), while only 19.72% of the study area displayed statistically significant trends (p < 0.05) (Table S2). Significant trends were predominantly concentrated in the western and northern mountainous regions, including the western Pamir Alay and Tian Shan ranges, whereas the eastern Pamir Plateau and much of the central valleys were characterized by largely stable vegetation conditions.
Among the significant trends, vegetation improvement was the dominant pattern, accounting for 16.74% of the total study area, while significant vegetation decline occupied only 2.98% (Table S2). As illustrated in Figure S2b, areas of significant improvement were mainly distributed across the western mountain slopes, northern highlands, and river valleys, indicating enhanced vegetation productivity in these topographically complex regions.
In contrast, significant declines were confined to small, fragmented patches, primarily in the northern valleys and isolated mountainous locations. The Sen’s slope analysis further confirms this spatial pattern (Figure S2c), with the strongest positive NDVI trends occurring in the western and northwestern mountain belts, moderate improvements extending into central mountainous areas, and relatively weak changes across the sparsely vegetated eastern Pamir Plateau. Negative trend magnitudes were limited in both extent and intensity, indicating localized rather than widespread vegetation degradation. A key observation from our assessment is the strong correlation between increased precipitation levels, particularly in the Khatlon region, and enhanced soil moisture content. This relationship is likely a primary driver for the observed rise in NDVI in western Tajikistan, suggesting that improved moisture conditions have facilitated vegetation growth. Additionally, irrigation in areas with increased NDVI likely plays a significant role in soil moisture dynamics, as these regions are dominated by cropland vegetation. Conversely, vegetation in the eastern part of the country appears to be under considerable stress, attributed to enduring low precipitation rates alongside elevated temperatures, both at land and air surface levels. Furthermore, our findings indicated that since 2010, NDVI values have consistently exhibited above-average anomalies relative to the baseline period. This trend is particularly pronounced in areas receiving substantial precipitation during the study timeframe, highlighting the crucial role of hydrological changes in influencing vegetation dynamics across diverse geographical contexts. Climate change is a key driver of natural vegetation dynamics, as changes in hydrothermal conditions have led to notable shifts in the NDVI of natural vegetation. While NDVI has increased with higher precipitation levels, significant fluctuations in temperature, both on land and in the air, have contributed to a decline in NDVI and the degradation of natural vegetation in the period following the baseline. Overall, the results suggest that Tajikistan experienced predominantly stable to improving vegetation conditions over the study period, with vegetation greening concentrated in the climatically favorable western mountains and limited evidence of persistent degradation elsewhere (Figure S2; Table S2).

4. Discussion

Our results suggest a substantial depth-dependent increase in soil moisture across Tajikistan, rising from 0.219 m3/m3 at the surface to 0.293 m3/m3 below 100 cm. This pattern reflects fundamental hydrological processes in arid mountain regions, where deeper soils are protected from evaporative losses and therefore retain water more effectively [45,46]. This finding is consistent with findings from Li et al. [36], who reported that soil moisture in Central Asia varies significantly with depth and is closely linked to precipitation and evapotranspiration dynamics. However, unlike the broader Central Asian pattern where Kazakhstan exhibits higher surface moisture and limited deep-layer increases, Tajikistan shows a more pronounced vertical gradient, likely due to its complex topography and glacial-fed river systems [31,40].
In addition, the east–west gradient in soil moisture, with higher values dominant in the Pamir region compared to the western lowlands, reflects the influence of orographic precipitation and the distribution of glaciers and snowmelt runoff [40]. The Pamir and Tian Shan ranges intercept moisture-bearing westerly winds, delivering greater snowfall and rainfall to the eastern highlands [31,38]. This spatial heterogeneity is consistent with studies showing that mountainous regions in Central Asia receive substantially more precipitation than lowland deserts [27,36]. The contrasting moisture regimes between eastern and western Tajikistan highlight the importance of topography in modulating water availability, a factor often overlooked in regional-scale assessments.
Seasonal soil moisture dynamics, spring maxima (0.270 m3/m3 at 0–10 cm) and summer minima (0.194 m3/m3), reflect the combined influence of snowmelt, spring rainfall, and evapotranspiration. This pattern is characteristic of high-altitude arid regions, where winter snow accumulation provides a critical water pulse in spring [7,37]. The relatively stable moisture levels in the deepest layer (100–200 cm), ranging from 0.286 to 0.301 m3/m3, suggest that deep soils buffer against seasonal atmospheric forcing and serve as a reservoir sustaining dry-season water availability [45,46]. Similar buffering effects have been observed in other Central Asian mountain systems, where deep soil moisture plays a critical role in maintaining ecosystem function during drought periods [45,51].
A key finding of this study is the intensification of seasonal contrasts in the deepest layer: significant winter wetting (+0.00043 m3/m3 per year, p < 0.001) and summer drying. This pattern is consistent with broader Central Asian trends, where warming temperatures have led to earlier snowmelt and increased winter precipitation [36,49]. Li et al. [36] documented a sharp increase in temperature in Central Asia after 1997 and noted that precipitation trends diminished in the early 21st century, leading to increased aridity.
Our findings extend this observation to the subsurface, suggesting that deep soil moisture is also responding to these climatic shifts. The fact that these changes are occurring in the deepest layer, typically the most stable part of the soil profile, indicates that the hydrological regime is undergoing a more fundamental transformation than surface observations alone would suggest. Subsequently, precipitation emerged as the dominant control on upper-layer soil moisture (correlation: 0.49 at 0–10 cm; 0.44 at 10–40 cm), consistent with previous studies in Asian drylands [51,55] and the findings of Li et al. [36], who reported that precipitation is the most important factor influencing soil moisture in the region.
The weaker correlations in deeper layers (0.23 at 40–100 cm; 0.11 at 100–200 cm) suggest that deep moisture is governed by longer-term processes, infiltration, groundwater recharge, and lateral flow from mountainous areas, rather than direct climate forcing [45,46]. This distinction is critical for water resource management, as deep moisture may serve as a drought reserve, but its sensitivity to changing winter precipitation patterns raises concerns about future water availability. Furthermore, vegetation dynamics in Tajikistan follow a pattern parallel to soil moisture, with a decline from 2000 to 2010 and recovery after 2010. This two-phase trajectory mirrors the NDVI trends observed across Central Asia by Li et al. [36], who reported increasing NDVI before 1998 and decreasing trends thereafter. In our study, greening concentrated in 16.74% of the study area, primarily in the western mountains and northern highlands, reflecting improved moisture conditions and possibly irrigation in cropland areas [47,85]. The limited browning (2.98%) suggests that widespread vegetation degradation is not occurring, consistent with the findings of Li et al. [36] that vegetation decline in Central Asia is spatially heterogeneous and concentrated in specific regions such as northern Kazakhstan. However, the persistent stress in the eastern Pamir Plateau highlights the vulnerability of high-altitude ecosystems to climatic variability [27,40].
The role of human activities, particularly irrigation and land management, adds another layer of complexity to the interpretation of soil moisture and vegetation trends. The western lowlands, including Khatlon and northern Sughd, are dominated by irrigated cropland, where water diversion from rivers supports agricultural production [47,85]. The greening trends observed in these areas likely reflect anthropogenic influence as much as natural climate variability. A previous study documented significant land-use changes in Central Asia, including grassland degradation and shrub encroachment, driven by both climatic and human factors [36,63].
While our study did not explicitly quantify irrigation effects, the spatial patterns of NDVI trends point to human activities as contributing factors in western Tajikistan, highlighting the need for integrated assessments that consider both climatic and anthropogenic drivers. The absence of in-situ validation data, uncertainties in GLDAS-2 parameterizations in snow-dominated terrain Chen et al. [51], and the coarse resolution of the datasets mean that our findings are most relevant at regional scales. As noted by Li et al. [36], the lack of systematic and consistent information in Central Asia remains a challenge for hydrological and ecological assessments. Future work should integrate ground-based observations, higher-resolution remote sensing, and explicit consideration of irrigation and land-use change to refine these assessments.

5. Conclusions

Understanding how soil moisture varies across space and depth is essential for regions like Tajikistan, where water scarcity, agricultural dependency, and accelerating climate change converge. This study provides a comprehensive multi-layer assessment of soil moisture dynamics across four depth intervals (0–10, 10–40, 40–100, and 100–200 cm) over the 2000–2021 period, using a consistent volumetric framework that enables meaningful cross-layer comparisons.
Our findings reveal that volumetric soil moisture increases with depth, ranging from 0.219 m3/m3 in the surface layer to 0.293 m3/m3 in the deepest layer. Spring emerges as the wettest season (0.270 m3/m3 at 0–10 cm), while summer records the lowest surface moisture (0.194 m3/m3), driven by heightened evapotranspiration. Critically, seasonal trend analysis exposes a shifting hydrological regime: significant winter wetting (+0.00043 m3/m3 per year, p < 0.001) in the deepest layer contrasts with drying trends in spring, summer, and fall, suggesting that while winter recharge is intensifying, warmer-season moisture losses are also increasing, resulting in stronger seasonal contrasts despite stable annual averages. Precipitation remains the dominant control on upper-layer moisture (correlation of 0.49 at 0–10 cm), while vegetation greening after 2010 reflects improved moisture conditions in recent years. Beyond Tajikistan, these findings carry relevance for other arid and semi-arid mountain regions where snowmelt, seasonal rainfall, and irrigation shape soil water availability. The observed seasonal shifts in deep-layer moisture highlight the importance of considering depth-specific responses when assessing climate change impacts on water resources. For drought monitoring, our results suggest that surface moisture alone is insufficient to capture full hydrological variability; deeper layers, which buffer against seasonal extremes, must also be considered. For agriculture and irrigation planning, the intensifying seasonal contrasts underscore the need for adaptive water management strategies that account for both winter recharge gains and summer drying pressures. Looking forward, integrating in-situ observations, higher-resolution remote sensing products, and explicit consideration of topography, land use, and irrigation practices will be essential to refine these assessments and support climate-resilient water management in Tajikistan and similar mountain-dominated arid regions.

Supplementary Materials

The following supporting information can be downloaded at https://www.mdpi.com/article/10.3390/w18172080/s1, Figure S1: Methodological framework of the study; Figure S2: Spatial patterns of NDVI trends in Tajikistan (2000–2021); Table S1: Summary of diagnostic tests for correlation analysis; Table S2: Summary of NDVI trend statistics in Tajikistan (2000–2021) based on pixel-level analysis.

Author Contributions

All authors were involved in the intellectual elements of this paper. Conceptualization, N.G. and Y.C.; formal analysis and writing, original draft preparation, N.G.; writing, review and editing, A.G. and F.N.; methodology, S.O.R.S. and G.F. data curation and investigation, M.G. All authors have read and agreed to the published version of the manuscript.

Funding

The research is supported by the National Natural Science Foundation of China (W2412135).

Data Availability Statement

The remote sensing and reanalysis datasets used in this study are publicly available, with access links provided in Table 1 and Section 2.2. The processed data generated during this study is available from the corresponding author upon reasonable request.

Acknowledgments

Nekruz Gulahmadov and co-authors would like to express their sincere gratitude to the Chinese Academy of Science (CAS). The authors are thankful to the National Academy of Sciences of Tajikistan and the Agency of Hydrometeorology of the Committee for Environmental Protection under the Government of the Republic of Tajikistan for providing the data for this research.

Conflicts of Interest

The authors declare no conflicts of interest.

References

  1. Zhou, Y.; Chang, S.; Huang, X.; Wang, W.; Hou, F.; Wang, Y.; Nan, Z. Increased Local Precipitation Weakens Long-Term Responses of Soil Carbon and Nitrogen to Climate Change: Insights from a 37-Year Experiment. Glob. Planet. Change 2025, 247, 104745. [Google Scholar] [CrossRef] [Scilit]
  2. Rodell, M.; Beaudoing, H.K.; L’ecuyer, T.; Olson, W.S.; Famiglietti, J.S.; Houser, P.R.; Adler, R.; Bosilovich, M.G.; Clayson, C.A.; Chambers, D. The Observed State of the Water Cycle in the Early Twenty-First Century. J. Clim. 2015, 28, 8289–8318. [Google Scholar] [CrossRef] [Scilit]
  3. Sehler, R.; Li, J.; Reager, J.; Ye, H. Investigating Relationship between Soil Moisture and Precipitation Globally Using Remote Sensing Observations. J. Contemp. Water Res. Educ. 2019, 168, 106–118. [Google Scholar] [CrossRef] [Scilit]
  4. Li, M.-H.; Li, Y.-Y.; Fan, J. Distribution Characteristics of Soil Moisture and Temperature under Different Land Use Types in the Deep Profile of Loess Area in Northern Shaanxi, China. J. Appl. Ecol. 2024, 35, 2552–2560. [Google Scholar] [CrossRef] [Scilit] [PubMed]
  5. Ji, C.; Tang, H. Towards Reliable Land Cover Mapping under Domain Shift: An Overview and Comprehensive Comparative Study on Uncertainty Estimation. Earth-Sci. Rev. 2025, 263, 105070. [Google Scholar] [CrossRef] [Scilit]
  6. Xue, Z.; Yang, G.; Yu, X.; Yu, A.; Guo, Y.; Liu, B.; Zhou, J. Multimodal Self-Supervised Learning for Remote Sensing Data Land Cover Classification. Pattern Recognit. 2025, 157, 110959. [Google Scholar] [CrossRef] [Scilit]
  7. Hyman-Rabeler, K.A.; Loheide, S.P. Drivers of Variation in Winter and Spring Groundwater Recharge: Impacts of Midwinter Melt Events and Subsequent Freezeback. Water Resour. Res. 2023, 59, e2022WR032733. [Google Scholar] [CrossRef] [Scilit]
  8. Jiang, R.; Li, T.; Liu, D.; Fu, Q.; Hou, R.; Li, Q.; Cui, S.; Li, M. Soil Infiltration Characteristics and Pore Distribution under Freezing-Thawing Conditions. Cryosphere 2021, 15, 2133–2146. [Google Scholar] [CrossRef] [Scilit]
  9. Li, X.; Piao, S.; Huntingford, C.; Peñuelas, J.; Yang, H.; Xu, H.; Chen, A.; Friedlingstein, P.; Keenan, T.F.; Sitch, S. Global Variations in Critical Drought Thresholds That Impact Vegetation. Natl. Sci. Rev. 2023, 10, nwad049. [Google Scholar] [CrossRef] [Scilit] [PubMed]
  10. Wang, Y.; Hu, W.; Sun, H.; Zhao, Y.; Zhang, P.; Li, Z.; Zhou, Z.; Tong, Y.; Liu, S.; Zhou, J. Soil Moisture Decline in China’s Monsoon Loess Critical Zone: More a Result of Land-Use Conversion Than Climate Change. Proc. Natl. Acad. Sci. USA 2024, 121, e2322127121. [Google Scholar] [CrossRef] [Scilit] [PubMed]
  11. Abbass, K.; Qasim, M.Z.; Song, H.; Murshed, M.; Mahmood, H.; Younis, I. A Review of the Global Climate Change Impacts, Adaptation, and Sustainable Mitigation Measures. Environ. Sci. Pollut. Res. 2022, 29, 42539–42559. [Google Scholar] [CrossRef] [Scilit] [PubMed]
  12. Oishy, M.N.; Shemonty, N.A.; Fatema, S.I.; Mahbub, S.; Mim, E.L.; Raisa, M.B.H.; Anik, A.H. Unravelling the Effects of Climate Change on the Soil-Plant-Atmosphere Interactions: A Critical Review. Soil Environ. Health 2025, 3, 100130. [Google Scholar] [CrossRef] [Scilit]
  13. De Lannoy, G.J.; Verhoest, N.E.; Houser, P.R.; Gish, T.J.; Van Meirvenne, M. Spatial and Temporal Characteristics of Soil Moisture in an Intensively Monitored Agricultural Field (OPE3). J. Hydrol. 2006, 331, 719–730. [Google Scholar] [CrossRef] [Scilit]
  14. Zhang, T.; Liu, Y.; Guo, J.; Tang, G.; Yang, Z. Soil Moisture Characteristics of Four Artificial Plant Communities in Aerial Seeding Afforestation Area and Their Response to Different Levels of Rainfall. Front. For. Glob. Change 2025, 7, 1457776. [Google Scholar] [CrossRef] [Scilit]
  15. Zhang, X.; Li, Y.; Li, F. Spatial Distribution Characteristics of Soil Water-Salt Gradients in the Ecological Buffer Zone of Arid Zone Lakes and Their Influencing Factors. J. Clean. Prod. 2024, 444, 141299. [Google Scholar] [CrossRef] [Scilit]
  16. Adams, R.M.; Hurd, B.H.; Lenhart, S.; Leary, N. Effects of Global Climate Change on Agriculture: An Interpretative Review. Clim. Res. 1998, 11, 19–30. [Google Scholar] [CrossRef] [Scilit]
  17. Imtiaz, S.; Shahid, S.; Ishfaq, T.; Ilyas, M.; Nawaz, A.F.; Shamshad, J.; Fiaz, S.; Arif, M. Impact of Climate Change on Agriculture. In Environment, Climate, Plant and Vegetation Growth; Springer: London, UK, 2024; pp. 285–305. [Google Scholar]
  18. Pathak, H.; Chatterjee, D.; Saha, S.; Das, B. Climate Change Impacts on Soil-Plant-Atmosphere Continuum; Springer: London, UK, 2024. [Google Scholar]
  19. Srivastava, P.K. Satellite Soil Moisture: Review of Theory and Applications in Water Resources. Water Resour. Manag. 2017, 31, 3161–3176. [Google Scholar] [CrossRef] [Scilit]
  20. Srivastava, P.K.; Han, D.; Rico-Ramirez, M.A.; O’Neill, P.; Islam, T.; Gupta, M.; Dai, Q. Performance Evaluation of WRF-Noah Land Surface Model Estimated Soil Moisture for Hydrological Application: Synergistic Evaluation Using SMOS Retrieved Soil Moisture. J. Hydrol. 2015, 529, 200–212. [Google Scholar] [CrossRef] [Scilit]
  21. Chen, X.; Cui, X.; Sun, L.; Yu, Y.; Zhang, H.; Liu, T.; Luo, G.; Hu, Z.; Huang, Y.; Malik, I. Dryland Social-Ecological Systems in Central Asia. In Dryland Social-Ecological Systems in Changing Environments; Springer Nature: Singapore, 2024; pp. 203–241. [Google Scholar]
  22. Didovets, I.; Krysanova, V.; Nurbatsina, A.; Fallah, B.; Krylova, V.; Saparova, A.; Niyazov, J.; Kalashnikova, O.; Hattermann, F.F. Attribution of Current Trends in Streamflow to Climate Change for 12 Central Asian Catchments. Clim. Change 2024, 177, 16. [Google Scholar] [CrossRef] [Scilit]
  23. Liu, C.; Chen, Y.; Huang, W.; Fang, G.; Li, Z.; Zhu, C.; Liu, Y. Climate Warming Positively Affects Hydrological Connectivity of Typical Inland River in Arid Central Asia. npj Clim. Atmos. Sci. 2024, 7, 250. [Google Scholar] [CrossRef] [Scilit]
  24. Mirzabaev, A. Climate Change Science and Policy in Central Asia: Current Situation and Future Perspectives. In Climate Change in Central Asia: Decarbonization, Energy Transition and Climate Policy; Springer: London, UK, 2023; pp. 23–32. [Google Scholar]
  25. Skalamera, M. The Distributional Effects of the EU’s and China’s Climate Diplomacy in Central Asia. Int. Environ. Agreem. Politics Law Econ. 2025, 25, 321–342. [Google Scholar] [CrossRef] [Scilit]
  26. Wang, X.; Chen, Y.; Li, Z.; Fang, G.; Wang, Y. Development and Utilization of Water Resources and Assessment of Water Security in Central Asia. Agric. Water Manag. 2020, 240, 106297. [Google Scholar] [CrossRef] [Scilit]
  27. Raduła, M.; Świerszcz, S.; Nobis, M.; Nowak, S.; Nobis, A.; Nowak, A. Palaeoclimate Has a Major Effect on the Diversity of Endemic Species in the Hotspot of Mountain Biodiversity in Tajikistan. Sci. Rep. 2021, 11, 18684. [Google Scholar] [CrossRef] [Scilit] [PubMed]
  28. Siegfried, T.; Mujahid, A.U.H.; Marti, B.; Molnar, P.; Karger, D.N.; Yakovlev, A. Unveiling the Future Water Pulse of Central Asia: A Comprehensive 21st Century Hydrological Forecast from Stochastic Water Balance Modeling. Clim. Change 2024, 177, 141. [Google Scholar] [CrossRef] [Scilit]
  29. Turral, H.; Burke, J.; Faurès, J.-M. Climate Change, Water and Food Security; FAO: Washington, DC, USA, 2011. [Google Scholar]
  30. Wang, H.; Wang, B.-B.; Cui, P.; Yao-Ming, M.; Wang, Y.; Jian-Sheng, H.; Wang, Y.; Ya-Mei, L.; Li-Jun, S.; Wang, J. Disaster Effects of Climate Change in High-Mountain Asia: State of Art and Scientific Challenges. Adv. Clim. Change Res. 2024, 15, 367–389. [Google Scholar] [CrossRef] [Scilit]
  31. Xenarios, S.; Shenhav, R.; Domullodzhanov, D. The Role of Water User Associations in Improving the Water for Energy Nexus in Tajikistan; Organization for Security and Co-operation in Europe: Vienna, Austria, 2019. [Google Scholar]
  32. Yao, J.; Chen, Y.; Chen, J.; Zhao, Y.; Tuoliewubieke, D.; Li, J.; Yang, L.; Mao, W. Intensification of Extreme Precipitation in Arid Central Asia. J. Hydrol. 2021, 598, 125760. [Google Scholar] [CrossRef] [Scilit]
  33. Khassanov, F.O.; Turginov, O.; Khudzhanazarov, U.; Tirkasheva, M. The Vegetation of the Pamir-Alay Mountainous System in Middle Asia. In Biodiversity, Conservation and Sustainability in Asia: Volume 2: Prospects and Challenges in South and Middle Asia; Springer: London, UK, 2022; pp. 53–65. [Google Scholar]
  34. Sodikov, K.; Arabov, F.; Bobohonzoda, K.R.; Asomuddin, K.; Fozilov, S.R. Sustainable Development of Ecological and Economic Use of Agricultural Land and Water Resources of the Republic of Tajikistan. In IOP Conference Series: Earth and Environmental Science; IOP Publishing: Bristol, UK, 2022; Volume 981, p. 022028. [Google Scholar]
  35. Bao, A.; Yu, T.; Xu, W.; Lei, J.; Jiapaer, G.; Chen, X.; Komiljon, T.; Khabibullo, S.; Sagidullaevich, X.B.; Kamalatdin, I. Ecological Problems and Ecological Restoration Zoning of the Aral Sea. J. Arid Land 2024, 16, 315–330. [Google Scholar] [CrossRef] [Scilit]
  36. Li, Z.; Chen, Y.; Li, W.; Deng, H.; Fang, G. Potential Impacts of Climate Change on Vegetation Dynamics in Central Asia. J. Geophys. Res. Atmos. 2015, 120, 12345–12356. [Google Scholar] [CrossRef] [Scilit]
  37. Lin, P.; He, Z.; Du, J.; Chen, L.; Zhu, X.; Tian, Q. Understanding the Hydrological Regime Based on the Runoff Events in a Mountainous Catchment with Seasonally Frozen Soil in the Qinghai-Tibet Plateau. Hydrol. Process. 2022, 36, e14716. [Google Scholar] [CrossRef] [Scilit]
  38. Normatov, I.S.; Azimov, D.; Sharofzoda, F. Spatial Distribution of Precipitation and Its Contribution to the Formation of the Transboundary Zeravshan River Runoff (Tajikistan). Russ. Meteorol. Hydrol. 2023, 48, 682–686. [Google Scholar] [CrossRef] [Scilit]
  39. Rahimzoda, S. Water-Energy Equation in Central and South Asia: A Perspective from Tajikistan. In The Water, Energy, and Food Security Nexus in Asia and the Pacific: Central and South Asia; Springer International Publishing: Cham, Switzerland, 2024; pp. 79–96. [Google Scholar]
  40. Safarov, M.; Kang, S.; Fazylov, A.; Gulayozov, M.; Banerjee, A.; Navruzshoev, H.; Chen, P.; Xue, Y.; Murodov, M. Estimating Glacier Dynamics and Supraglacial Lakes Together with Associated Regional Hazards Using High-Resolution Datasets in Pamir. J. Mt. Sci. 2024, 21, 3767–3788. [Google Scholar] [CrossRef] [Scilit]
  41. Safarov, M.; Kang, S.; Fazylov, A.; Gulayozov, M.; Navruzshoev, H.; Banerjee, A.; Mamadjanov, Y. Mapping the Territories of the Mountain-Foothill Zone of Tajikistan Exposed to Mudflows. J. Mt. Sci. 2025, 22, 16–30. [Google Scholar] [CrossRef] [Scilit]
  42. Wang, W.; He, S.; Guo, H.; Abuduwaili, J.; Samat, A.; De Maeyer, P.; Van de Voorde, T. Sand and Dust Storm Risk Assessment in Arid Central Asia: Implications for the Environment, Society, and Agriculture. Int. J. Disaster Risk Sci. 2024, 15, 703–718. [Google Scholar] [CrossRef] [Scilit]
  43. Muhuri, A.; Goïta, K.; Magagi, R.; Wang, H. Soil Moisture Retrieval during Crop Growth Cycle Using Satellite SAR Time Series. IEEE J. Sel. Top. Appl. Earth Obs. Remote Sens. 2023, 16, 9302–9319. [Google Scholar] [CrossRef] [Scilit]
  44. Pal, M.; Maity, R.; Dey, S. Statistical Modelling of Vertical Soil Moisture Profile: Coupling of Memory and Forcing. Water Resour. Manag. 2016, 30, 1973–1986. [Google Scholar] [CrossRef] [Scilit]
  45. Massoud, E.C.; Bloom, A.A.; Longo, M.; Reager, J.T.; Levine, P.A.; Worden, J.R. Information Content of Soil Hydrology in the Amazon as Informed by GRACE. Hydrol. Earth Syst. Sci. Discuss. 2021, 2021, 1407–1423. [Google Scholar] [CrossRef] [Scilit]
  46. Penna, D.; Segura, C.; Borga, M.; Hissler, C.; Latron, J.; Llorens, P.; Marchina, C.; Martìnez-Carreras, N.; Zuecco, G. Soil Moisture Response as a Tool to Understand Hydrological Processes across Forested Catchments in Different Climates. In EGU General Assembly Conference Abstracts; Harvard University: Cambridge, MA, USA, 2023; p. EGU-11410. [Google Scholar]
  47. Lerman, Z.; Sedik, D.J. The Economic Effects of Land Reform in Central Asia: The Case of Tajikistan; FAO: Washington, DC, USA, 2008. [Google Scholar]
  48. Liu, G.; Migliavacca, M.; Reimers, C.; Bastos, A.; Linscheid, N.; Reichstein, M.; Winkler, A.J. Compound Effects of Extreme Spring Temperature Fluctuations on Vegetation Phenology. In EGU General Assembly Conference Abstracts; Harvard University: Cambridge, MA, USA, 2023; p. EGU-14577. [Google Scholar]
  49. Yao, L.; Zhou, H.; Yan, Y.; Li, L.; Su, Y. Projection of Hydrothermal Condition in Central Asia under Four SSP-RCP Scenarios. J. Arid Land 2022, 14, 521–536. [Google Scholar] [CrossRef] [Scilit]
  50. Bellprat, O.; Spirig, C.; Flubacher, M.; Grandjean, J.; Roulet, Y.-A.; Moret, L.; Bavay, M.; Fiddes, J.; Orlowsky, B.; Kassam, S. A Low-Cost Approach to Develop Weather, Water and Climate Services (WWCS) in Rural Areas of Tajikistan. In Proceedings of the Copernicus Meetings 2022, Bonn, Germany, 5–9 September 2022. [Google Scholar]
  51. Chen, Y.; Yang, K.; Qin, J.; Zhao, L.; Tang, W.; Han, M. Evaluation of AMSR-E Retrievals and GLDAS Simulations against Observations of a Soil Moisture Network on the Central Tibetan Plateau. J. Geophys. Res. Atmos. 2013, 118, 4466–4475. [Google Scholar] [CrossRef] [Scilit]
  52. Fahad, S.; Sonmez, O.; Saud, S.; Wang, D.; Wu, C.; Adnan, M.; Turan, V. Climate Change and Plants: Biodiversity, Growth and Interactions; CRC Press: Boca Raton, FL, USA, 2021. [Google Scholar]
  53. Gao, X.; Wu, P.; Zhao, X.; Wang, J.; Shi, Y. Effects of Land Use on Soil Moisture Variations in a Semi-Arid Catchment: Implications for Land and Agricultural Water Management. Land Degrad. Dev. 2014, 25, 163–172. [Google Scholar] [CrossRef] [Scilit]
  54. Hatfield, J.L.; Boote, K.J.; Kimball, B.A.; Ziska, L.; Izaurralde, R.C.; Ort, D.; Thomson, A.M.; Wolfe, D. Climate Impacts on Agriculture: Implications for Crop Production. Agron. J. 2011, 103, 351–370. [Google Scholar] [CrossRef] [Scilit]
  55. Zhang, J.; Wang, W.C.; Wei, J. Assessing Land-Atmosphere Coupling Using Soil Moisture from the Global Land Data Assimilation System and Observational Precipitation. J. Geophys. Res. Atmos. 2008, 113, D17119. [Google Scholar] [CrossRef] [Scilit]
  56. Hu, Y.; Tang, C.; Chen, X.; Zhao, Y.; He, H.; Li, M.; Zhang, J. Spatiotemporal Variability of Soil Water Content and Its Influencing Factors on a Microscale Slope. Agronomy 2023, 13, 2035. [Google Scholar] [CrossRef] [Scilit]
  57. Zhang, P.; Zhang, J.; Chen, M. Economic Impacts of Climate Change on Agriculture: The Importance of Additional Climatic Variables Other Than Temperature and Precipitation. J. Environ. Econ. Manag. 2017, 83, 8–31. [Google Scholar] [CrossRef] [Scilit]
  58. Avinash, R.; Dwarakish, G. Essential Climate Variables for Accurate Climate Change Impact Studies on Hydrological Regime: A Comprehensive Review. In International Conference on Hydraulics, Water Resources and Coastal Engineering; Springer: London, UK, 2023; pp. 339–356. [Google Scholar]
  59. Ballari, D.; Vilches-Blázquez, L.M.; Orellana-Samaniego, M.L.; Salgado-Castillo, F.; Ochoa-Sánchez, A.E.; Graw, V.; Turini, N.; Bendix, J. Satellite Earth Observation for Essential Climate Variables Supporting Sustainable Development Goals: A Review on Applications. Remote Sens. 2023, 15, 2716. [Google Scholar] [CrossRef] [Scilit]
  60. Zhao, Z.-W.; Leng, P.; Han, X.-J.; Shang, G.-F. Global Maize Yield Responses to Essential Climate Variables: Assessment Using Atmospheric Reanalysis and Future Climate Scenarios. Comput. Electron. Agric. 2025, 232, 110140. [Google Scholar] [CrossRef] [Scilit]
  61. Firozjaei, M.K.; Mijani, N.; Kiavarz, M.; Duan, S.-B.; Atkinson, P.M.; Alavipanah, S.K. A Novel Surface Energy Balance-Based Approach to Land Surface Temperature Downscaling. Remote Sens. Environ. 2024, 305, 114087. [Google Scholar] [CrossRef] [Scilit]
  62. Wan, Z.; Hook, S.; Hulley, G. MODIS/Terra Land Surface Temperature/Emissivity 8-Day L3 Global 1 km SIN Grid V061; NASA EOSDIS Land Processes DAAC: Sioux Falls, SD, USA, 2021. [Google Scholar]
  63. He, L.; Guo, J.; Liu, X.; Yang, W.; Chen, L.; Jiang, Q.; Bai, M. Exploring the Multifaceted Reason for Deficits in Soil Water within Different Soil Layers in China’s Drylands. J. Environ. Manag. 2025, 373, 123634. [Google Scholar] [CrossRef] [Scilit] [PubMed]
  64. Beaudoing, H.; Rodell, M. GLDAS Noah Land Surface Model L4 Monthly 0.25 × 0.25 Degree V2.1; NASA/GSFC/HSL: Greenbelt, MD, USA, 2020. [Google Scholar]
  65. Rodell, M.; Houser, P.; Jambor, U.; Gottschalck, J.; Mitchell, K.; Meng, C.-J.; Arsenault, K.; Cosgrove, B.; Radakovich, J.; Bosilovich, M. The Global Land Data Assimilation System. Bull. Am. Meteorol. Soc. 2004, 85, 381–394. [Google Scholar] [CrossRef] [Scilit]
  66. Miranda Espinosa, M.T.; Giuliani, G.; Ray, N. Reviewing the Discoverability and Accessibility to Data and Information Products Linked to Essential Climate Variables. Int. J. Digit. Earth 2020, 13, 236–252. [Google Scholar] [CrossRef] [Scilit]
  67. Huffman, G.J.; Bolvin, D.T.; Nelkin, E.J.; Tan, J. Integrated Multi-satellitE Retrievals for GPM (IMERG) Technical Documentation; NASA/GSFC Code 612: Greenbelt, MD, USA, 2015. [Google Scholar]
  68. Li, Z.-L.; Tang, B.-H.; Wu, H.; Ren, H.; Yan, G.; Wan, Z.; Trigo, I.F.; Sobrino, J.A. Satellite-Derived Land Surface Temperature: Current Status and Perspectives. Remote Sens. Environ. 2013, 131, 14–37. [Google Scholar] [CrossRef] [Scilit]
  69. Wan, Z.; Hook, S.; Hulley, G. MOD11A1 MODIS/Terra Land Surface Temperature/Emissivity Daily L3 Global 1 km SIN Grid V006; NASA EOSDIS Land Processes DAAC: Sioux Falls, SD, USA, 2021. [Google Scholar]
  70. Didan, K. MODIS/Terra Vegetation Indices 16-Day L3 Global 250 m SIN Grid V061; NASA EOSDIS Land Processes DAAC: Sioux Falls, SD, USA, 2021. [Google Scholar]
  71. Dangendorf, F.; Herbst, S.; Reintjes, R.; Kistemann, T. Spatial Patterns of Diarrhoeal Illnesses with Regard to Water Supply Structures—A GIS Analysis. Int. J. Hyg. Environ. Health 2002, 205, 183–191. [Google Scholar] [CrossRef] [Scilit] [PubMed]
  72. Smith, H.W.; Ashworth, A.J.; Owens, P.R. GIS-Based Evaluation of Soil Suitability for Optimized Production on US Tribal Lands. Agriculture 2022, 12, 1307. [Google Scholar] [CrossRef] [Scilit]
  73. Cooper, D.J.; Bell, J.; Hodnett, M.; Beven, K.; Gilman, K.; Haria, A.; Gardner, C.; Robinson, M.; Evans, J.; Ward, H. Terrestrial Hydrological Processes. In Progress in Modern Hydrology: Past, Present and Future; Wiley: Hoboken, NJ, USA, 2015; pp. 100–134. [Google Scholar]
  74. EPSG:4326; WGS 84—WGS84-World Geodetic System 1984, Used in GPS. European Petroleum Survey Group (EPSG): Brussels, Belgium, 1984.
  75. Cui, Z.; Wang, C. Improvement of Summer Precipitation Simulation with Indirect Assimilation of Spring Soil Moisture over the Tibetan Plateau. Q. J. R. Meteorol. Soc. 2022, 148, 3231–3251. [Google Scholar] [CrossRef] [Scilit]
  76. Richards, L.A. Capillary Conduction of Liquids Through Porous Mediums. Physics 1931, 1, 318–333. [Google Scholar] [CrossRef] [Scilit]
  77. Reynolds, C.A.; Jackson, T.J.; Rawls, W.J. Estimating Soil Water-Holding Capacities by Linking the Food and Agriculture Organization Soil Map of the World with Global Pedon Databases and Continuous Pedotransfer Functions. Water Resour. Res. 2000, 36, 3653–3662. [Google Scholar] [CrossRef] [Scilit]
  78. Araki, R.; Mu, Y.; McMillan, H. Evaluation of GLDAS Soil Moisture Seasonality in Arid Climates. Hydrol. Sci. J. 2023, 68, 1109–1126. [Google Scholar] [CrossRef] [Scilit]
  79. Sveen, S.-E.; Nguyen, H.T.; Sørensen, B.R. Soil Moisture Variations in Frozen Ground Subjected to Hydronic Heating. J. Cold Reg. Eng. 2020, 34, 04020025. [Google Scholar] [CrossRef] [Scilit]
  80. Denham, S.O.; Barnes, M.L.; Chang, Q.; Korolev, M.; Wood, J.D.; Oishi, A.C.; Shay, K.O.; Stoy, P.C.; Chen, J.; Novick, K.A. The Rate of Canopy Development Modulates the Link between the Timing of Spring Leaf Emergence and Summer Moisture. J. Geophys. Res. Biogeosci. 2023, 128, e2022JG007217. [Google Scholar] [CrossRef] [Scilit]
  81. Muluneh, M.G. Impact of Climate Change on Biodiversity and Food Security: A Global Perspective—A Review Article. Agric. Food Secur. 2021, 10, 36. [Google Scholar] [CrossRef] [Scilit]
  82. Bodner, G.; Nakhforoosh, A.; Kaul, H.-P. Management of Crop Water under Drought: A Review. Agron. Sustain. Dev. 2015, 35, 401–442. [Google Scholar] [CrossRef] [Scilit]
  83. Vergni, L.; Todisco, F. Spatio-Temporal Variability of Precipitation, Temperature and Agricultural Drought Indices in Central Italy. Agric. For. Meteorol. 2011, 151, 301–313. [Google Scholar] [CrossRef] [Scilit]
  84. Wang, Y.; Yang, J.; Chen, Y.; Wang, A.; De Maeyer, P. The Spatiotemporal Response of Soil Moisture to Precipitation and Temperature Changes in an Arid Region, China. Remote Sens. 2018, 10, 468. [Google Scholar] [CrossRef] [Scilit]
  85. Asadov, S. Food Security and the Agricultural Cooperation Agenda in Central Asia with a Focus on Tajikistan. In University of Central Asia—Institute of Public Policy and Administration (IPPA) Working Paper; University of Central Asia: Bishkek, Kyrgyzstan, 2013. [Google Scholar]
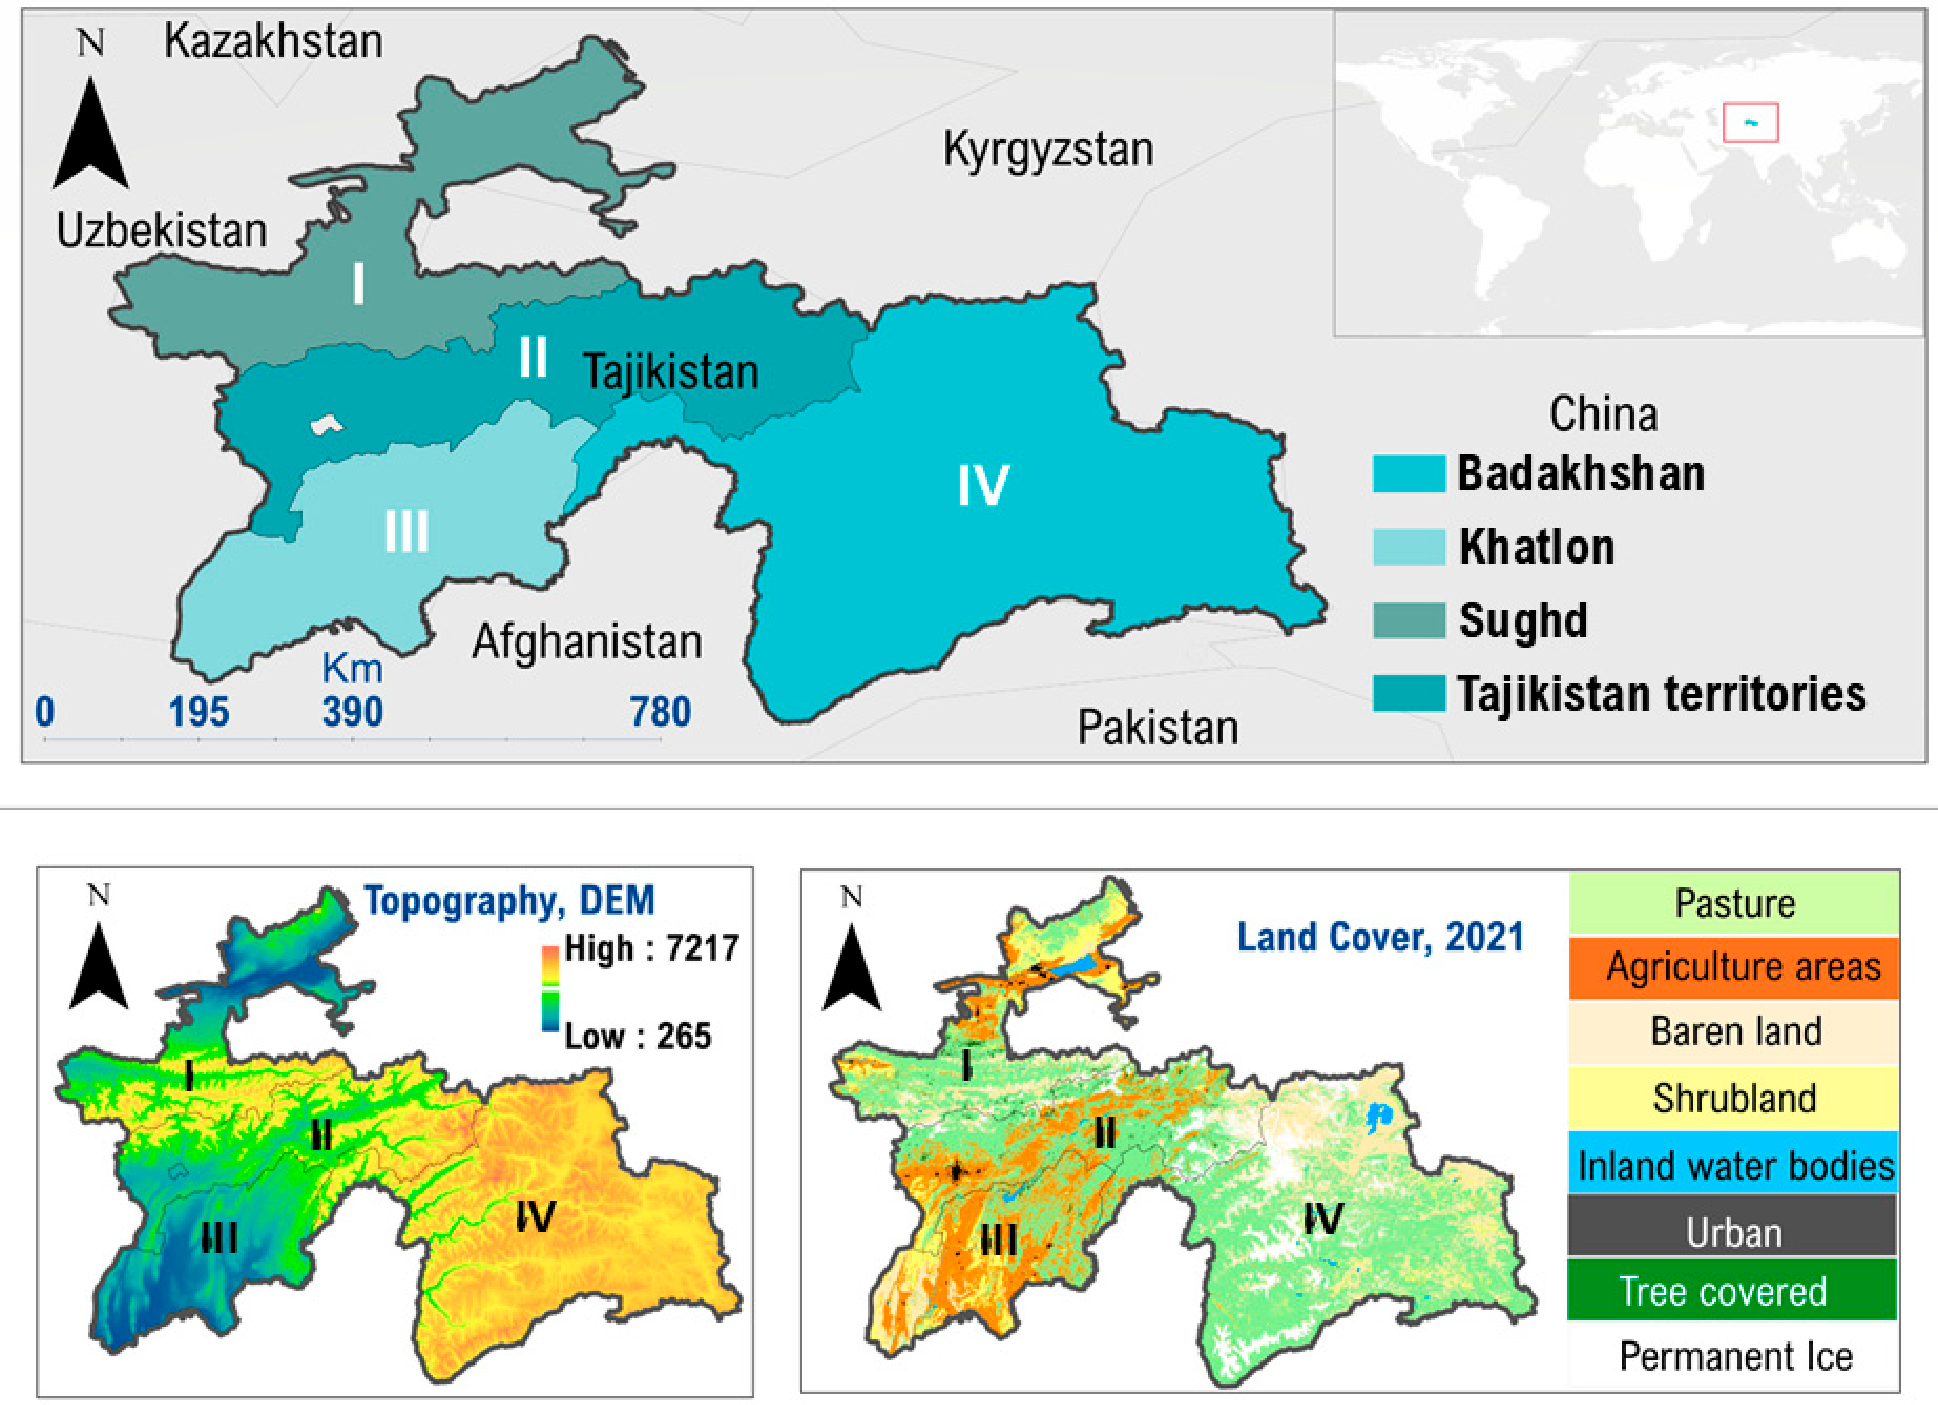
Figure 1. Study area map of Tajikistan alongside its elevation (m) and 2021 land cover categories. DEM: Digital Elevation Model. Roman numerals indicate provinces (I = Sugd, II = Tajikistan, III = Khatlon, IV = Badakhshon).
Water 18 02080 g001
Figure 2. Spatial distribution patterns of volumetric soil moisture (m3/m3) across four soil layers: (a) 0–10 cm, (b) 10–40 cm, (c) 40–100 cm, and (d) 100–200 cm in Tajikistan (2000–2021). Blue numbers inside maps represent the overall mean values, while Roman numerals indicate provinces (I = Sugd, II = Tajikistan, III = Khatlon, IV = Badakhshon). The downward arrow (⤓) indicates direction toward deeper soil layers.
Water 18 02080 g002
Figure 3. Temporal dynamics of volumetric soil moisture (m3/m3): (a) time series of annual mean values for each soil layer, and (b) interannual variability across seasons (W = Winter, Sp = Spring, Su = Summer, F = Fall) for different soil layers in Tajikistan (2000–2021). The downward arrow (⤓) indicates direction toward deeper soil layers.
Water 18 02080 g003
Figure 4. Spatial diverging patterns of essential climatic variables over Tajikistan (2000–2021) and their anomalies against the 2000–2010 Average: (a) air temperature, (b) precipitation, (c) daytime land surface temperature and (d) nighttime land surface temperature. (I = Sugd, II = Tajikistan, III = Khatlon, IV = Badakhshon).
Water 18 02080 g004
Figure 5. Temporal anomaly trends of essential climatic variables over Tajikistan from 2000 to 2021, including (a) air temperature, (b) daytime land surface temperature, (c) precipitation, and (d) nighttime land surface temperature.
Water 18 02080 g005
Figure 6. Spatial (Pearson) correlation of average soil moisture at different depths with various essential climatic variables across Tajikistan (2000–2021). Sign: Significant. * and ** indicate statistical significance level at p < 0.05 and p < 0.01, respectively.
Water 18 02080 g006
Figure 7. Distribution of vegetation cover in Tajikistan from 2000 to 2021. (a) Average NDVI; (b) temporal trends; (c) spatial anomalies compared to the 2000–2010 average; and (d) anomaly trends. (I = Sugd, II = Tajikistan, III = Khatlon, IV = Badakhshon).
Water 18 02080 g007
Table 1. Description of the dataset used.
DatasetSpatial ExtentSources
LST (Day and Nighttime) MOD11A21000 mhttps://lpdaac.usgs.gov/ (accessed on 13 April 2026)
Vegetation cover MOD13Q1250 mhttps://lpdaac.usgs.gov/ (accessed on 13 April 2026)
Near Air Surface Temperature0.1°https://disc.gsfc.nasa.gov (accessed on 13 April 2026)
Precipitation0.1°https://disc.gsfc.nasa.gov (accessed on 13 April 2026)
Soil Moisture (All layers)0.25°https://disc.gsfc.nasa.gov (accessed on 13 April 2026)
Table 2. Seasonal trends in volumetric soil moisture (m3/m3 per year) across different layers.
Season0–10 cm10–40 cm40–100 cm100–200 cm
Spring+0.00009−0.00007−0.00008−0.00016
Summer−0.00001−0.00003−0.00004−0.00009
Fall−0.00183−0.00175−0.00141−0.00067
Winter−0.00008+0.00020+0.00034+0.00043
Note: Bold values indicate statistically significant trends (p < 0.05). Negative values denote decreasing trends; positive values denote increasing trends. Trends were calculated using the Mann–Kendall test and Sen’s slope estimator.
Table 3. Mean Trend analysis of essential climatic variables in Tajikistan (2000–2021).
VariableUnitMeanTrend/Yearp-Value
Air temperature°C3.27+0.0014 **0.0009
Precipitationmm31.02+0.1400 *0.1278
LST-daytime°C12.4−0.0118 *0.7780
LST-Nighttime°C−3.53+0.0106 *0.3235
Note: ** = significant at p < 0.01; * = not significant (p > 0.05).
Table 4. Relations (Pearson correlation) of average soil moisture between near-surface temperature, precipitation, and Skin surface temperature in Tajikistan in 2000–2021 (** Sig. Level: 0.05).
Depths (cm)LST-NightLST-DayTemperaturePrecipitation
0–10−0.22−0.37−0.310.49 **
10–40−0.23−0.13−0.090.44 **
40–100−0.040.120.150.23
100–2000.030.230.240.11
Disclaimer/Publisher’s Note: The statements, opinions and data contained in all publications are solely those of the individual author(s) and contributor(s) and not of MDPI and/or the editor(s). MDPI and/or the editor(s) disclaim responsibility for any injury to people or property resulting from any ideas, methods, instructions or products referred to in the content.