4.1. Analysis of the Energy Dissipation Process of Different Energy Dissipators
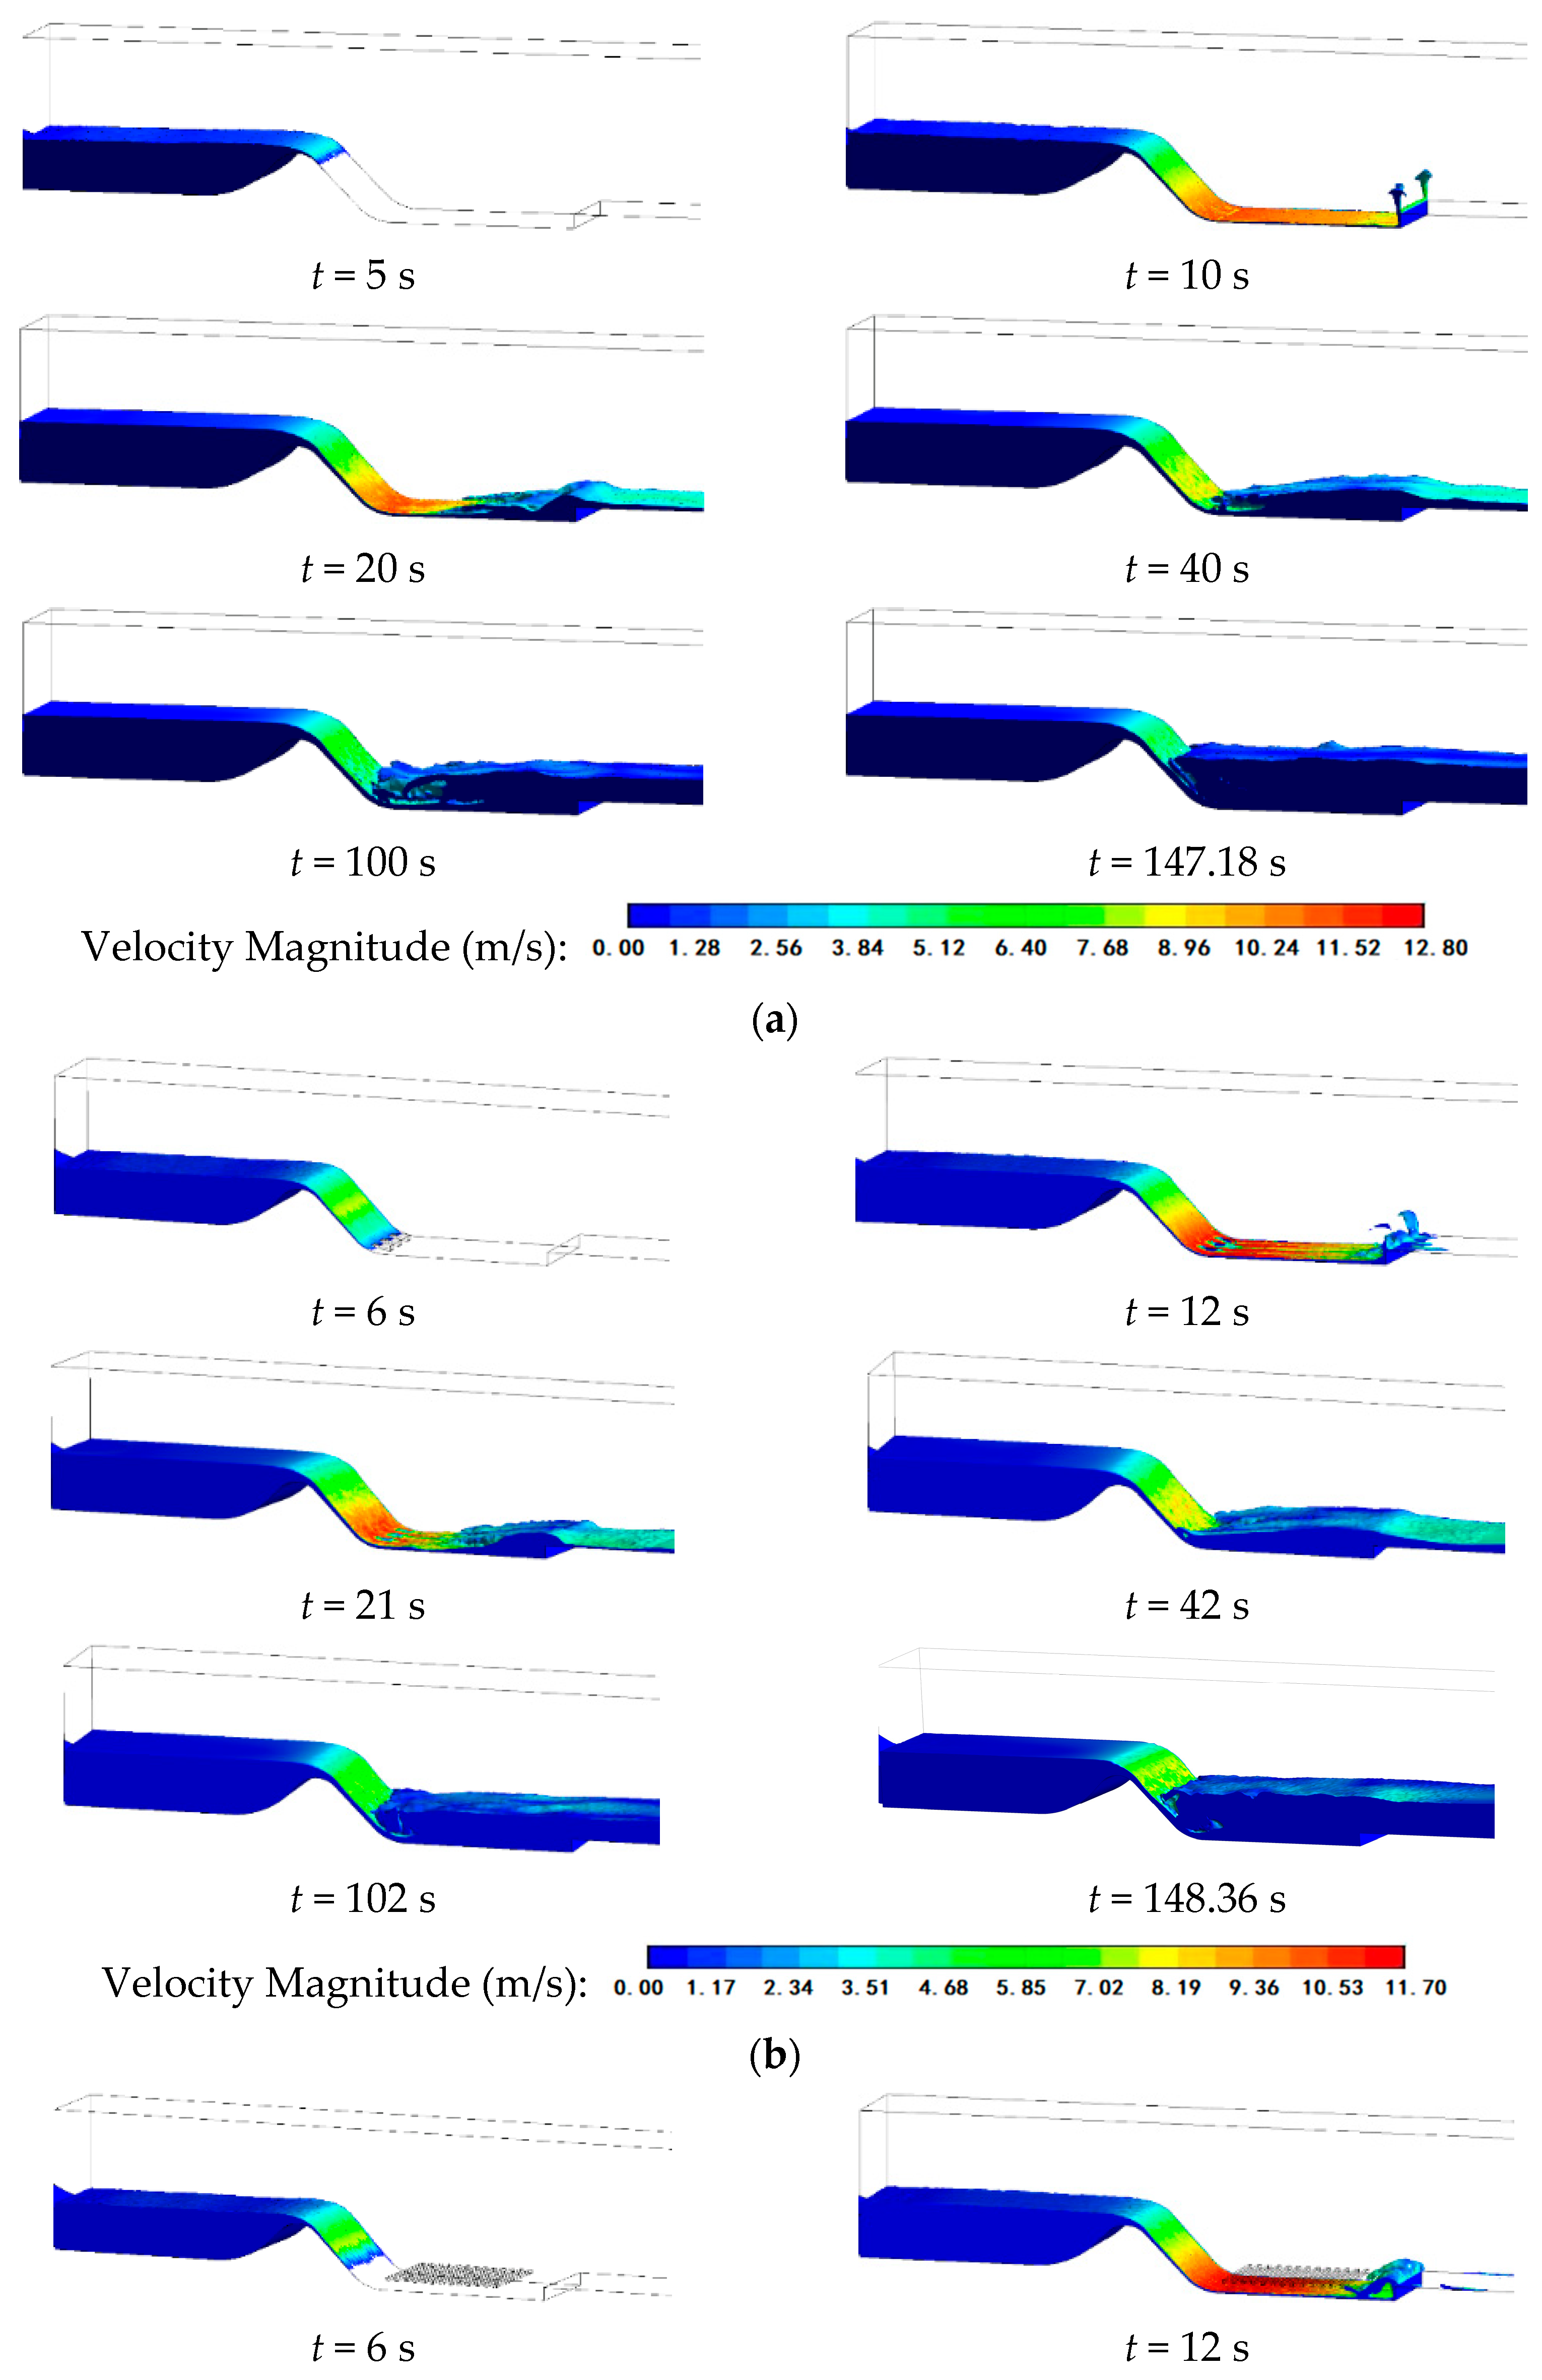
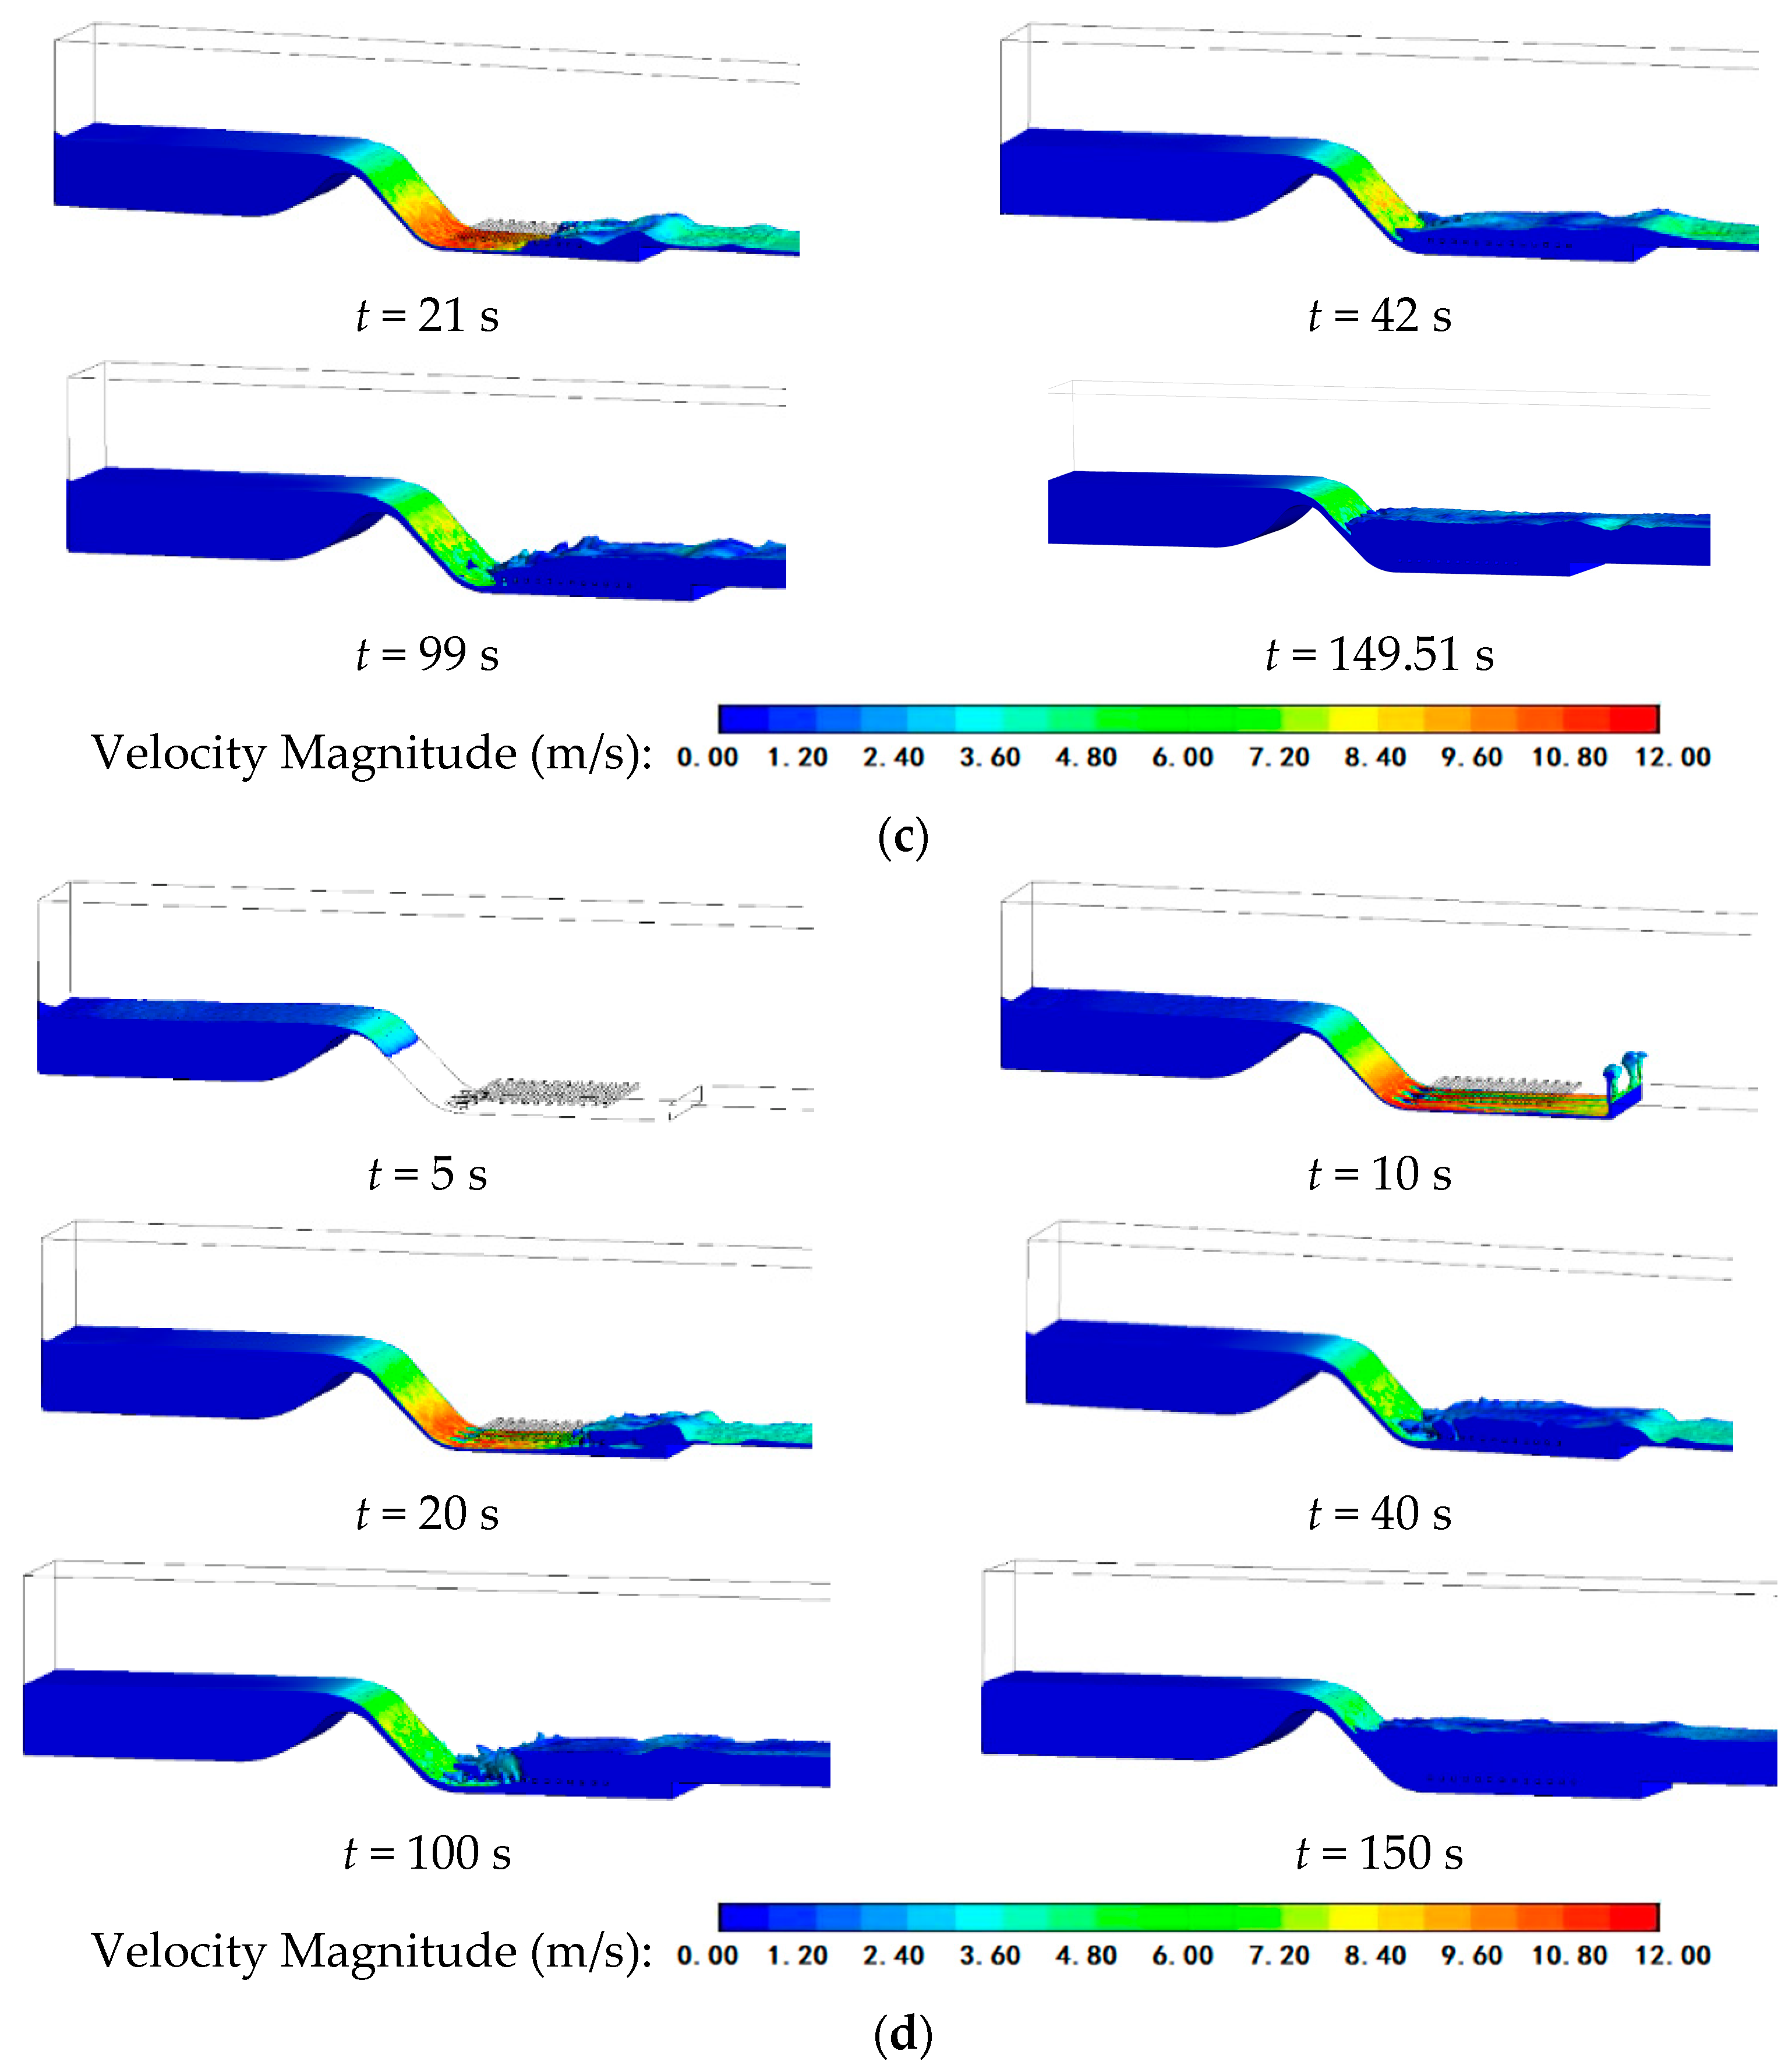
To more carefully analyze the energy dissipation of different energy dissipators when the pump station starts up and there is no water in the outlet sump, from the moment the water flow crosses the top of the water-retaining weir and starts to discharge until the energy dissipation is completed, a three-dimensional energy dissipation process diagram of the outlet sump was created. The free surface process diagram of the energy dissipation behind the retaining weir of the stilling basin is shown in
Figure 7.
During the energy dissipation process, the initial water flow velocity of each scheme is very high, presenting a rapid flow state. The water flow directly impacts the end sill of the stilling basin and then leaps up. In the middle stage, after the upstream inflow enters the stilling basin, it entrains bubbles. Since the tail water level is lower than the conjugate depth after the jump, an obvious repelled downstream hydraulic jump is formed. When the discharged water flow transitions from a rapid flow state to a slow flow state, a hydraulic jump occurs. The water flow entraps air and passes through the air–water interface, causing a large number of bubbles in the hydraulic jump section to be retained in the water flow, carried away as the water flow moves, and finally exchanged back to the free liquid surface and discharged. Eventually, the free liquid surface in the stilling basin stabilizes, the flow velocity decreases, and the air entrainment weakens.
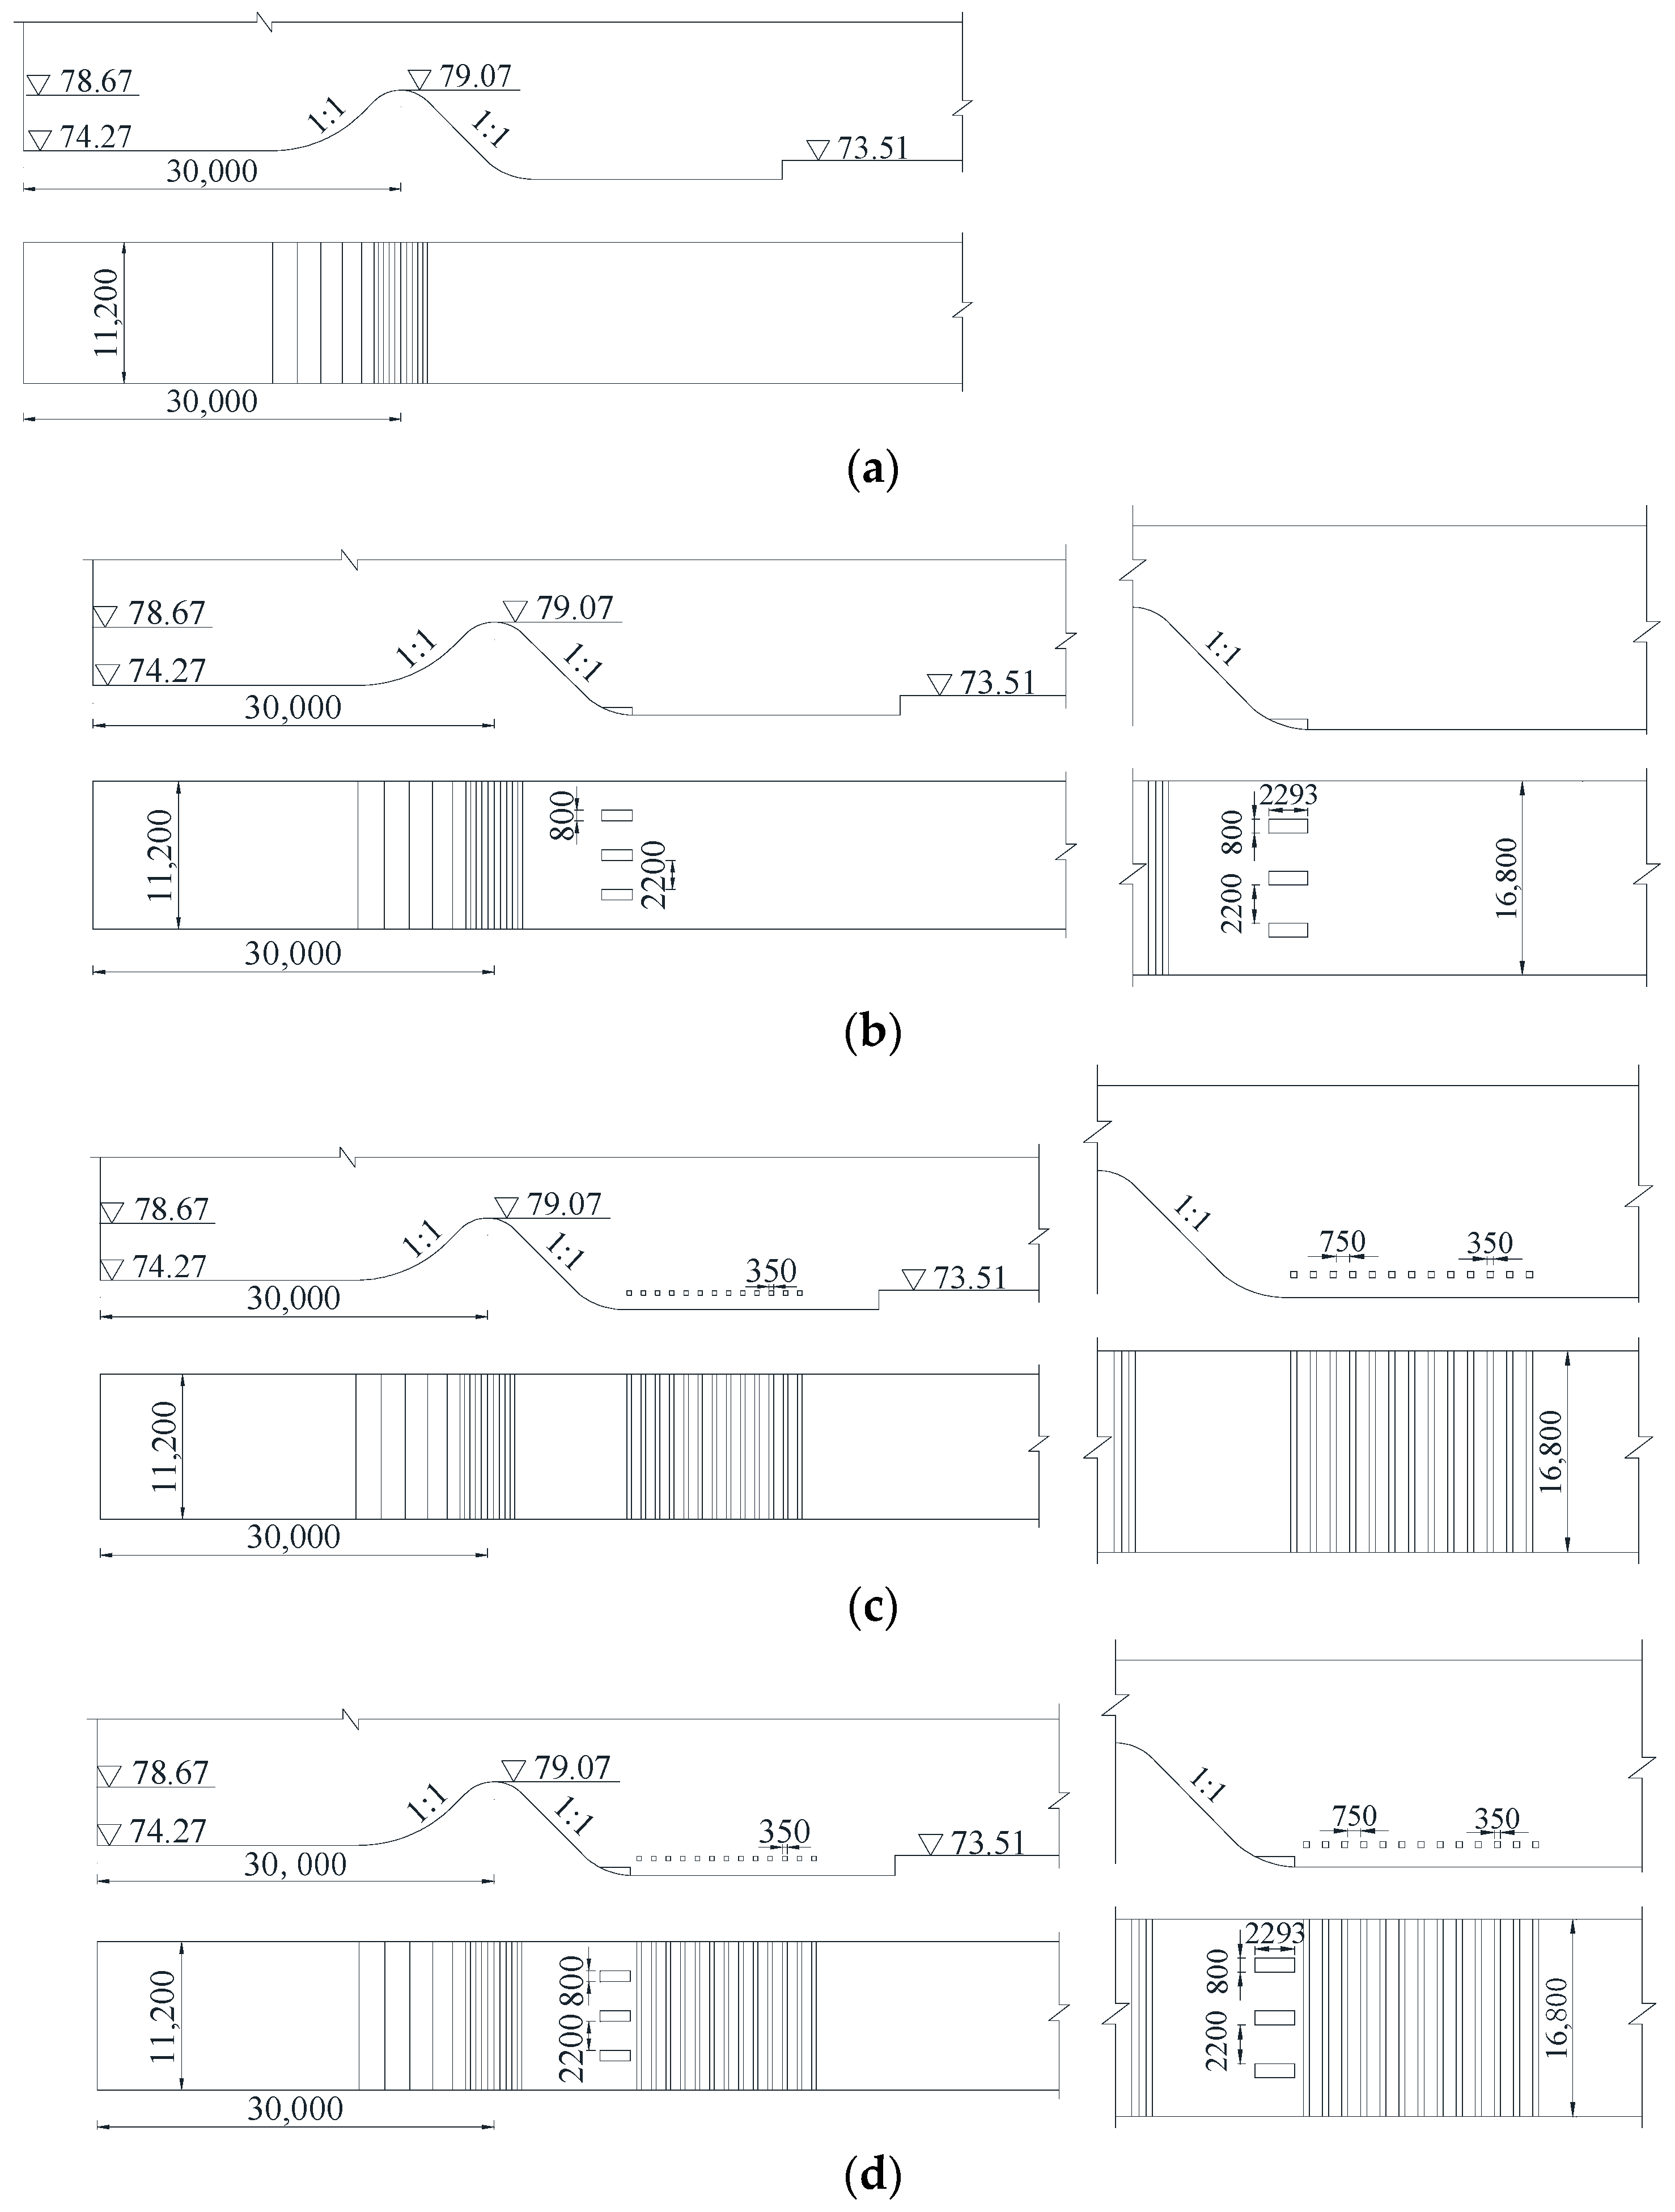
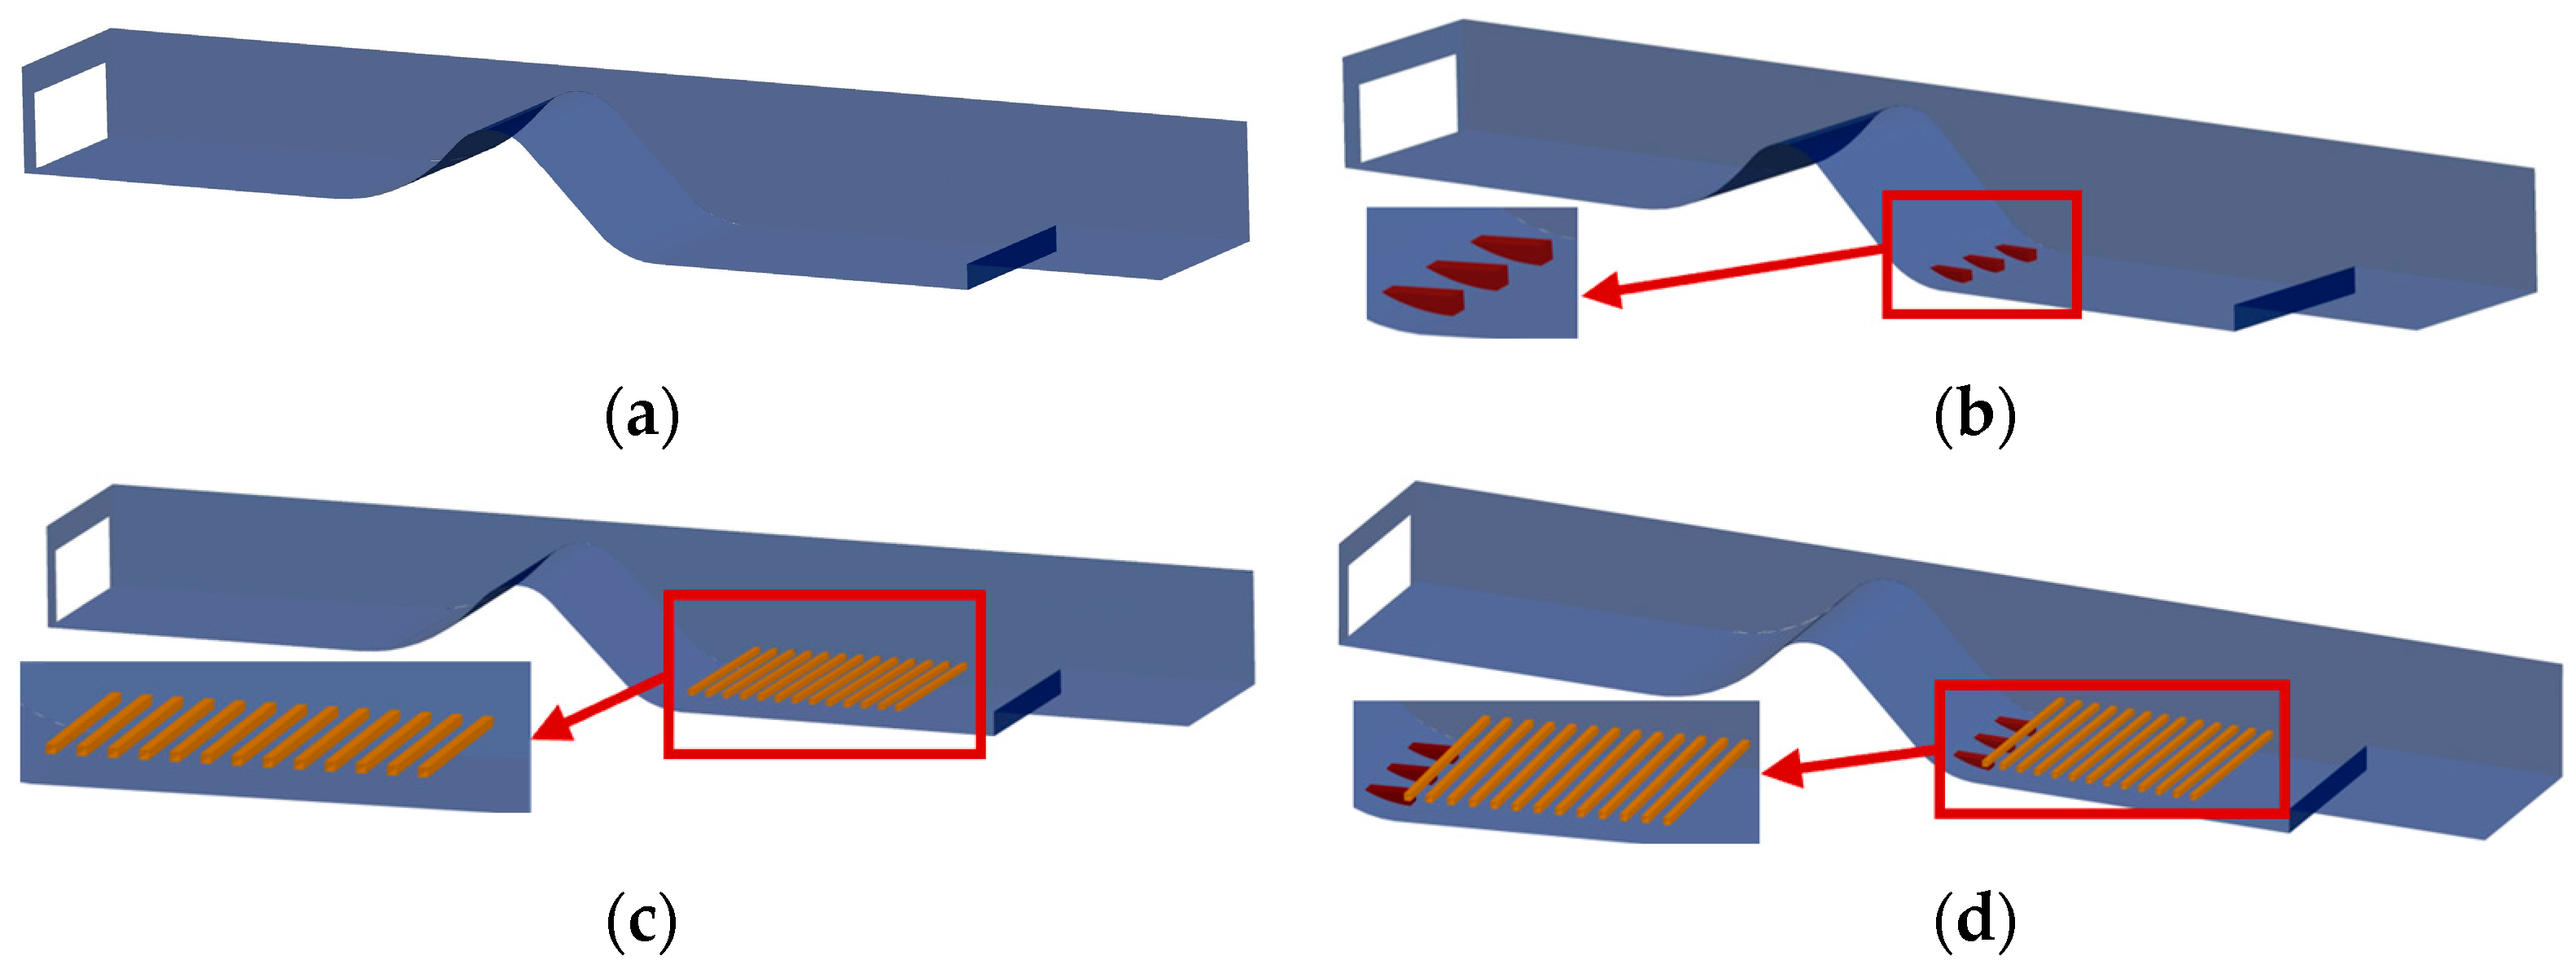
F1 has no auxiliary structure and forms a repelled downstream hydraulic jump. The initial flow velocity is the largest, and the maximum flow velocity can reach 12.8 m/s; for F2, the incoming water flow into the basin is dispersed into multiple small-scale water flows by the toe piers. The toe piers play a role in blocking the water flow and diverting it. The water flows passing through the toe piers impact and collide with each other, thus increasing the water depth at the head of the basin. The flow velocity of the free liquid surface of the discharged water flow is very high, and the maximum flow velocity reaches 11.7 m/s, but it is smaller than that of F1 during the same period; F3 uses a suspended grid to enhance shear. A part of the trajectory of the upper-layer water body in the stilling basin at the first suspended grid in the upper layer rolls around the grid, forming a backflow that intensifies the shear and collision of the water body. A part smoothly transitions to the downstream above the suspended grid, and another part rapidly flows through the gap between the suspended grid and the floor. Through the blocking and diverting effects of the suspended grid, the water depth at the head of the stilling basin is increased. Since there are no toe piers arranged, the initial maximum flow velocity is 12 m/s, which is increased compared with scheme F2; F4 combines toe piers and a suspended grid. The incoming water flow into the basin undergoes diversion and flushing effects by the toe piers, and the water body becomes turbulent at the head of the basin. Then, through the flow-stabilizing effect of the suspended grid, the water flow in the stilling basin makes a movement around the grid, and the overall flow pattern is good. The maximum flow velocity of the free liquid surface is 12 m/s.
By comparing the hydraulic jump length of each scheme at t = 20 s, it can be found that the hydraulic jump lengths of the four schemes are 16.0 m, 9.5 m, 15.6 m, and 9.2 m, revealing distinct differences in the flow confinement effect of different energy dissipators. In the cases without energy dissipators and with suspended grids alone, the hydraulic jump lengths reach 16.0 m and 15.6 m, which remain relatively large.
Scheme F1 is not equipped with auxiliary energy dissipators and cannot reduce the flow kinetic energy at the initial stage of water discharge. The flow travels a long distance inside the stilling basin before the formation of a hydraulic jump. For Scheme F2, the formation of reverse recirculation behind the toe piers pushes the hydraulic jump significantly upstream. The reduction in hydraulic jump length for Scheme F3 is insignificant. The mainstream downstream of the weir falls at high velocity along the basin floor, while the suspended grids are arranged in the upper part of the stilling basin and cannot directly interact with and disturb the core mainstream. At t = 20 s, the grids only exert weak shear on the upper slow flow, resulting in an extremely limited capacity to regulate the hydraulic jump pattern. Scheme F4 adopts combined toe piers and suspended grids, achieving a further reduction in hydraulic jump length compared with Scheme F2. The toe piers enlarge the contact shear area with the flow, and the suspended grids impose frictional resistance and flow-cutting effects. The synergistic effect of both structures enables the flow to complete kinetic energy dissipation and potential energy conversion over a shorter distance. Its hydraulic jump length is reduced by approximately 42.5% relative to Scheme F1, demonstrating that the combined energy dissipator can effectively shrink the hydraulic jump region and optimize the pressure distribution within the stilling basin.
Apart from differences in flow pattern and flow velocity, the stabilization time of the free surface also varies among different schemes. The stabilization time is defined as the duration from the moment water starts to overtop the retaining weir until the free surface downstream of the stilling basin reaches a steady state. The stabilization durations for the four schemes are 147.18 s, 148.36 s, 149.51 s, and 150 s, with insignificant overall discrepancies. Regardless of the type of energy dissipator, after flowing over the weir crest, the water undergoes a complete sequence of physical processes: impacting the stilling basin floor, raising the water level inside the basin, forming a stable hydraulic jump, and attaining the design downstream water level. The timescale of this process is governed by global boundary conditions including design discharge, design water level, and stilling basin volume, and is not remarkably affected by modifications to local energy dissipators.
The longer stabilization time observed in Scheme F4 does not indicate insufficient energy dissipation performance; instead, it is an inevitable outcome of intense turbulence in the early stage. Equipped with combined toe piers and suspended grids, Scheme F4 provides a larger contact area with the flow and imposes greater frictional resistance, enabling more thorough energy dissipation. Although an earlier stabilization of the water level in the outlet pool implies a more controllable energy dissipation process and allows the required inflow to be supplied to the downstream region sooner, for energy dissipation schemes with minor differences in stabilization time, the energy dissipation rate and near-bed flow velocity are more critical indicators for the stable and safe operation of pumping stations.
4.2. Analysis of the Hydraulic Performance of the Stilling Basin
In the case of using a stilling basin, adding a suitable auxiliary energy dissipator device can effectively improve the flow pattern of the discharged water flow behind the retaining weir. Therefore, a reasonable energy dissipation layout scheme has an important impact on the energy dissipation effect behind the retaining weir. The following will focus on analyzing the distribution of vortex structures, the near-bottom velocity, and the dissipation rate of each energy dissipation scheme and make comparisons.
The Omega criterion [
31] is adopted to identify vortex structures of the flow downstream of the weir, and the swirling strength λ
ci is used for iso-surface rendering. The definition of the core identification parameter Omega is as follows [
31,
32]:
where
and
denote the Frobenius norms of the rotation tensor and strain-rate tensor, and
represents a small positive constant.
λ
ci characterizes the rotational intensity of flow, defined as [
33]
where
is the discriminant of the eigenvalue equation for the velocity gradient tensor, and
R refers to the third invariant of the velocity gradient tensor.
The Omega criterion with Ω = 0.52 [
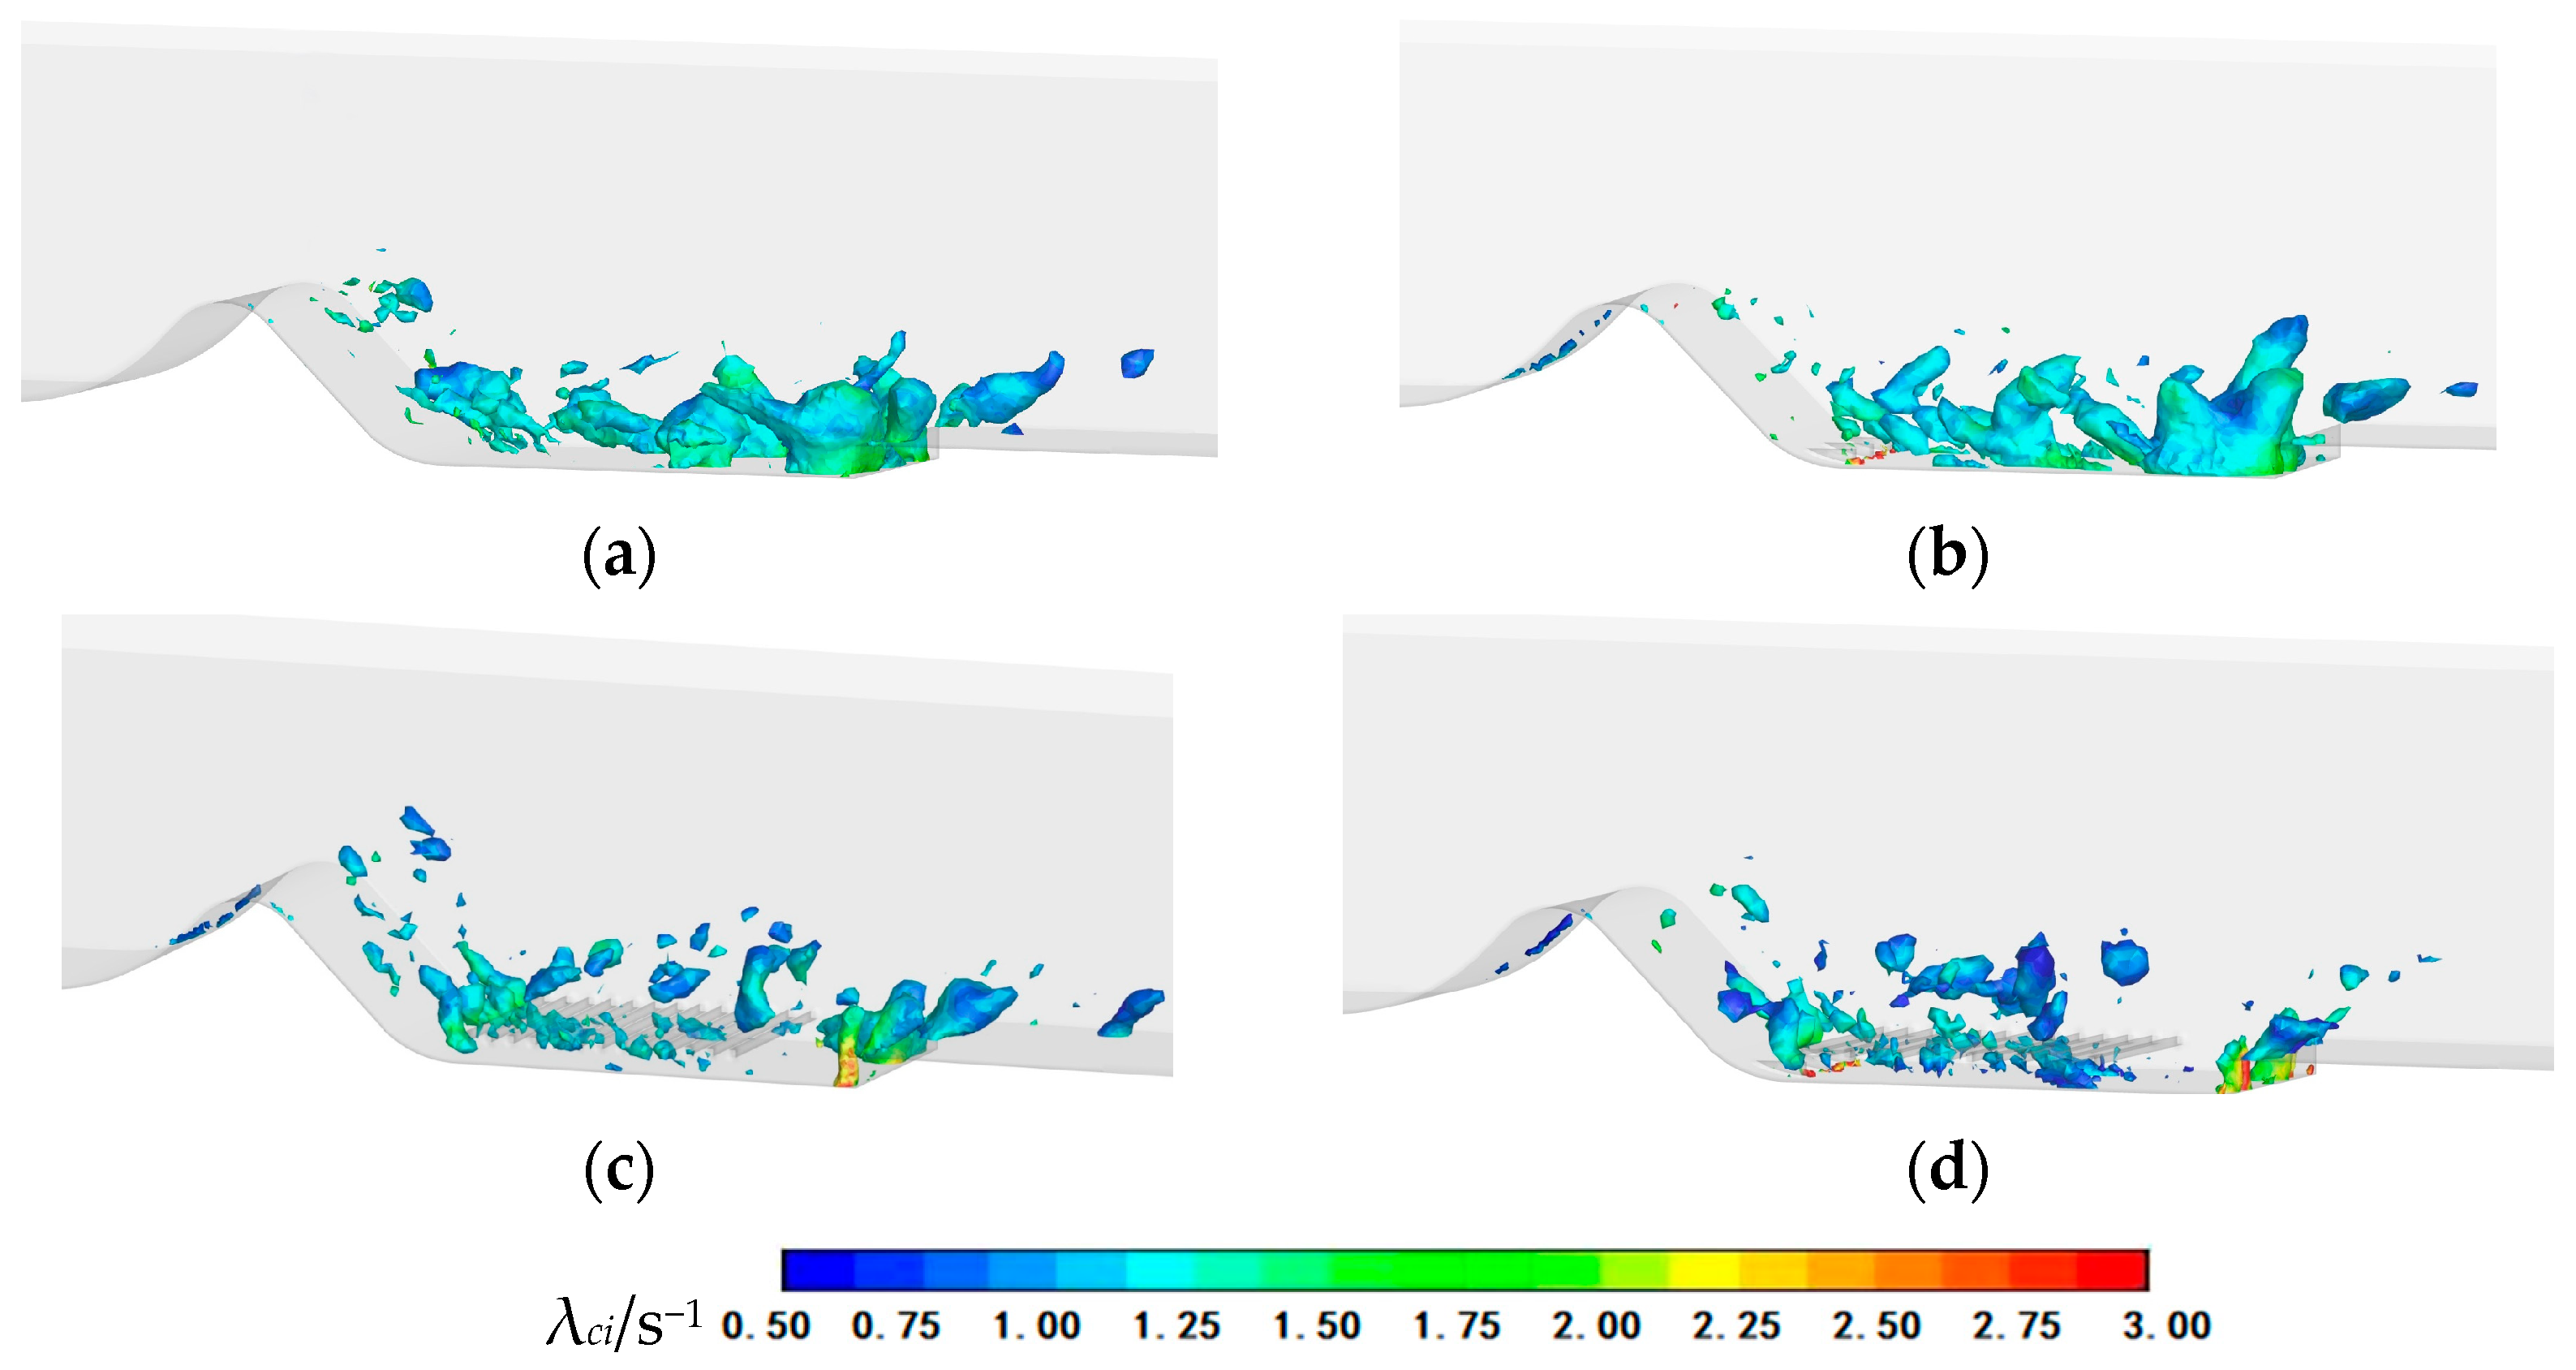
31] is applied to identify vortices within the outlet conduit, accompanied by color rendering based on swirling strength. The vortex structures inside the stilling basin under various schemes are presented in
Figure 8.
In Scheme F1, large-scale recirculation rolls emerge from the middle section of the stilling basin to the basin end sill, generating prominent vortex structures with large spatial dimensions and swirling strength concentrated at approximately 1.25 s−1. This phenomenon arises because the discharged flow enters the stilling basin without being blocked by auxiliary energy dissipators, triggering a distant hydraulic jump. The bulk flow retains considerable kinetic energy and propagates toward the outlet channel.
For Scheme F2, the installation of toe piers splits the inflow into the stilling basin and deflects the main flow away from the basin floor. Compared with Scheme F1, the vortex dimension near the outflow section downstream of the weir declines, whereas large-scale vortices still persist from the basin midsection to the end sill. Smaller vortices with elevated swirling strength are generated at the rear of the toe piers.
In Scheme F3, the suspended grid dissipator breaks up the inherent large-scale vortices inside the stilling basin. Small vortices formed behind the grid intensify mixing and collision of ambient water masses, improving internal energy dissipation and alleviating water surface fluctuations. The size of vortices at the basin end sill is further reduced, and small-scale vortices with swirling strength ranging from 2.25 s−1 to 3.00 s−1 develop along the sidewalls.
Scheme F4 adopts the combined arrangement of toe piers and suspended grids, which strengthens fluid shearing and impingement within the hydraulic jump zone. After flow discharges from the retaining weir into the basin, the vortex size at the inflow section is further lowered, and the overall swirling strength is relatively low, mainly distributed between 0.50 s−1 and 1.25 s−1. Numerous small-scale vortices form around the suspended grids, disintegrating the original large vortices in the basin and shrinking the vortex scale near the end sill. Nevertheless, small-scale vortices with strong rotational intensity remain distributed along the sidewalls.
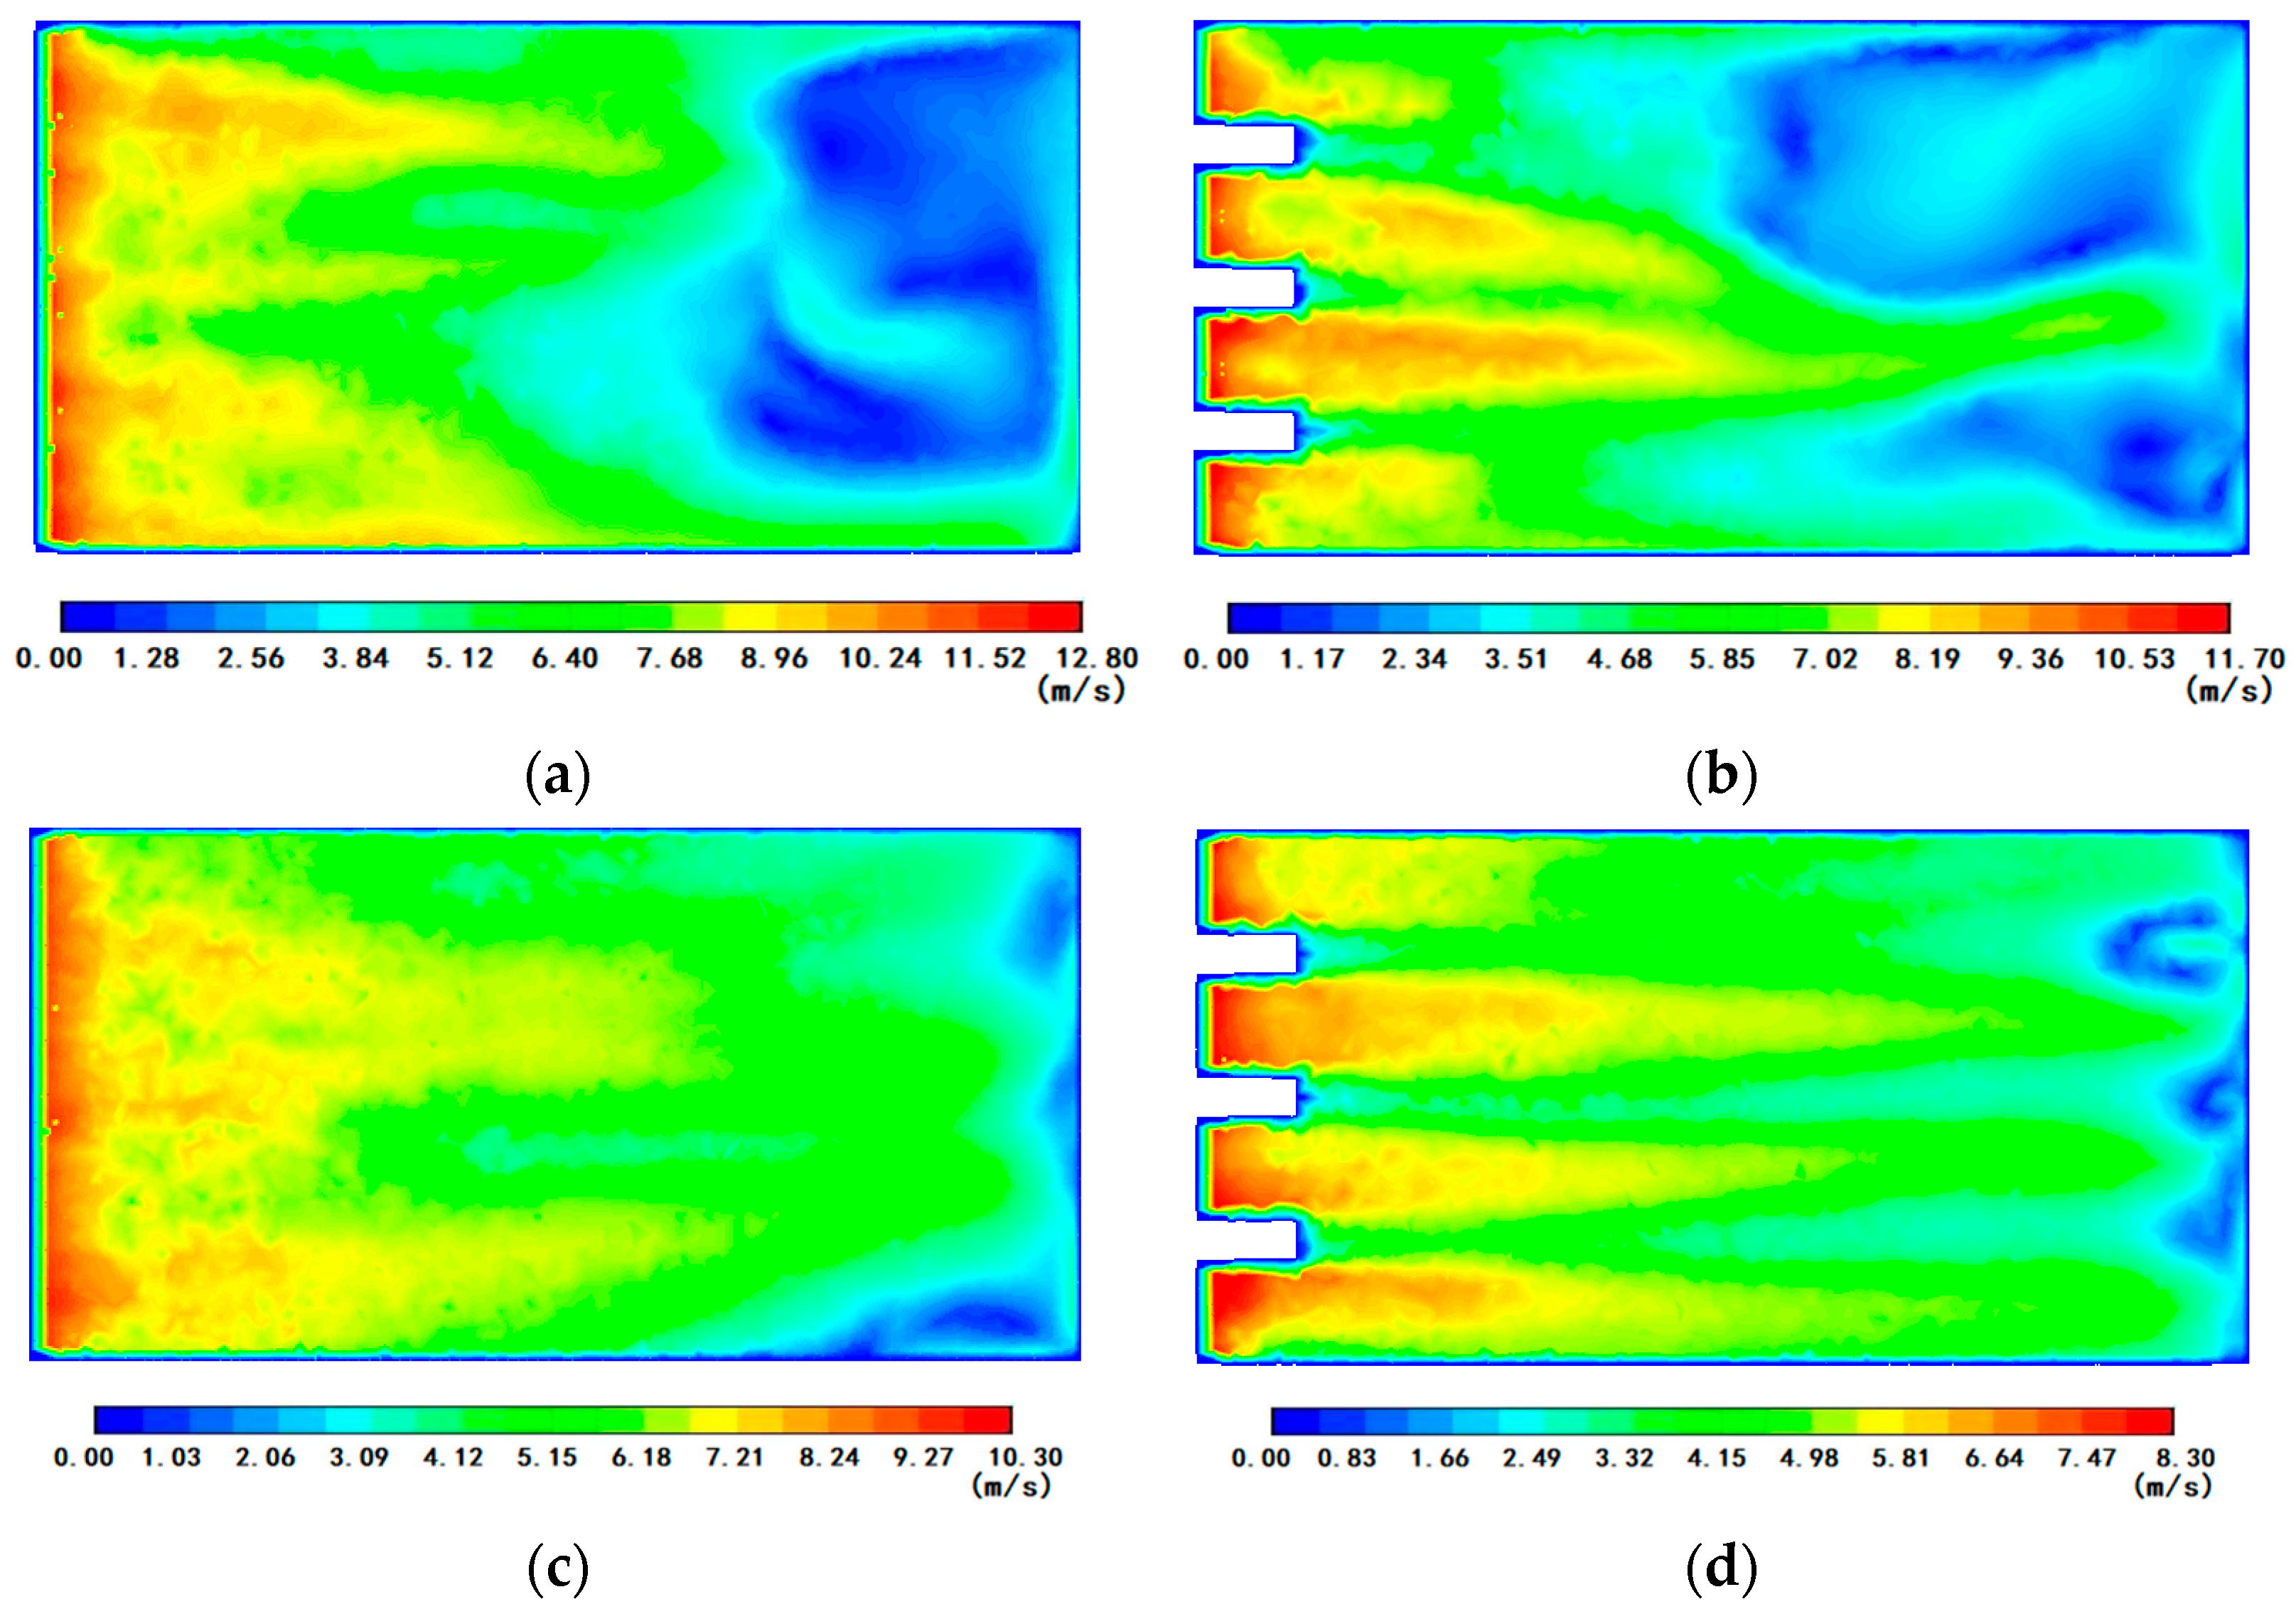
To further analyze the distribution state of the near-bottom velocity in the stilling basin behind the water-retaining weir, the near-bottom flow velocity distribution in the stilling basin behind the retaining weir under different schemes is formed, as shown in
Figure 9. The energy dissipation effect of Scheme F1 is poor, and the maximum velocity of flow on the inlet floor slab reaches 8.0 m/s, and the water flow deflects towards both sides of the floor slab. The velocities on both sides are relatively large, concentrated in distribution, and the water flow velocity in the middle part of the stilling basin changes uniformly; Scheme F2 has a significant effect on reducing the water flow velocity entering the basin. The toe piers disperse the discharged water flow into multiple small water flows, and the water flows collide and impact with each other, thus raising the water depth at the head of the stilling basin. The maximum near-bottom velocity of the water flow entering the basin is 7.2 m/s. The toe piers’ auxiliary energy dissipator has a good inhibitory effect on reducing the near-bottom velocity of the discharged water flow. Under the diversion and flow-deflection effects of the toe piers, the discharged water flow is in a state of longitudinal extension, lateral contraction, and mainstream dispersion. The overall bottom velocity of the stilling basin in Scheme F3 changes uniformly. The water flow entering the basin increases the water depth at the head of the basin through the blocking and diversion effects of the suspended grids, but the water flow passes through the gap between the suspended grids and the bottom slab of the stilling basin rapidly. The maximum near-bottom velocity of the water flow entering the basin is 7.4 m/s. Under the dispersion and flow-deflection effects of the suspended grids, the water flow entering the basin is in a state of mainstream dispersion, thus intensifying the shear collision between the main water flows in the basin and reducing the impact of the main water flow on the floor slab of the stilling basin. For the stilling basin with toe piers and suspended grid auxiliary energy dissipators in Scheme F4, the overall near-bottom velocity changes uniformly. The discharged water flow increases the internal velocity gradient of the water flow behind the toe piers under the diversion and flow-deflection effects of the toe piers, and then further reduces the kinetic energy of the water flow through the blocking and diversion effects of the suspended grids. The water flow passes through the gap between the suspended grids and the floor slab of the stilling basin rapidly. The maximum near-bottom velocity of the water flow entering the basin is 6.1 m/s.
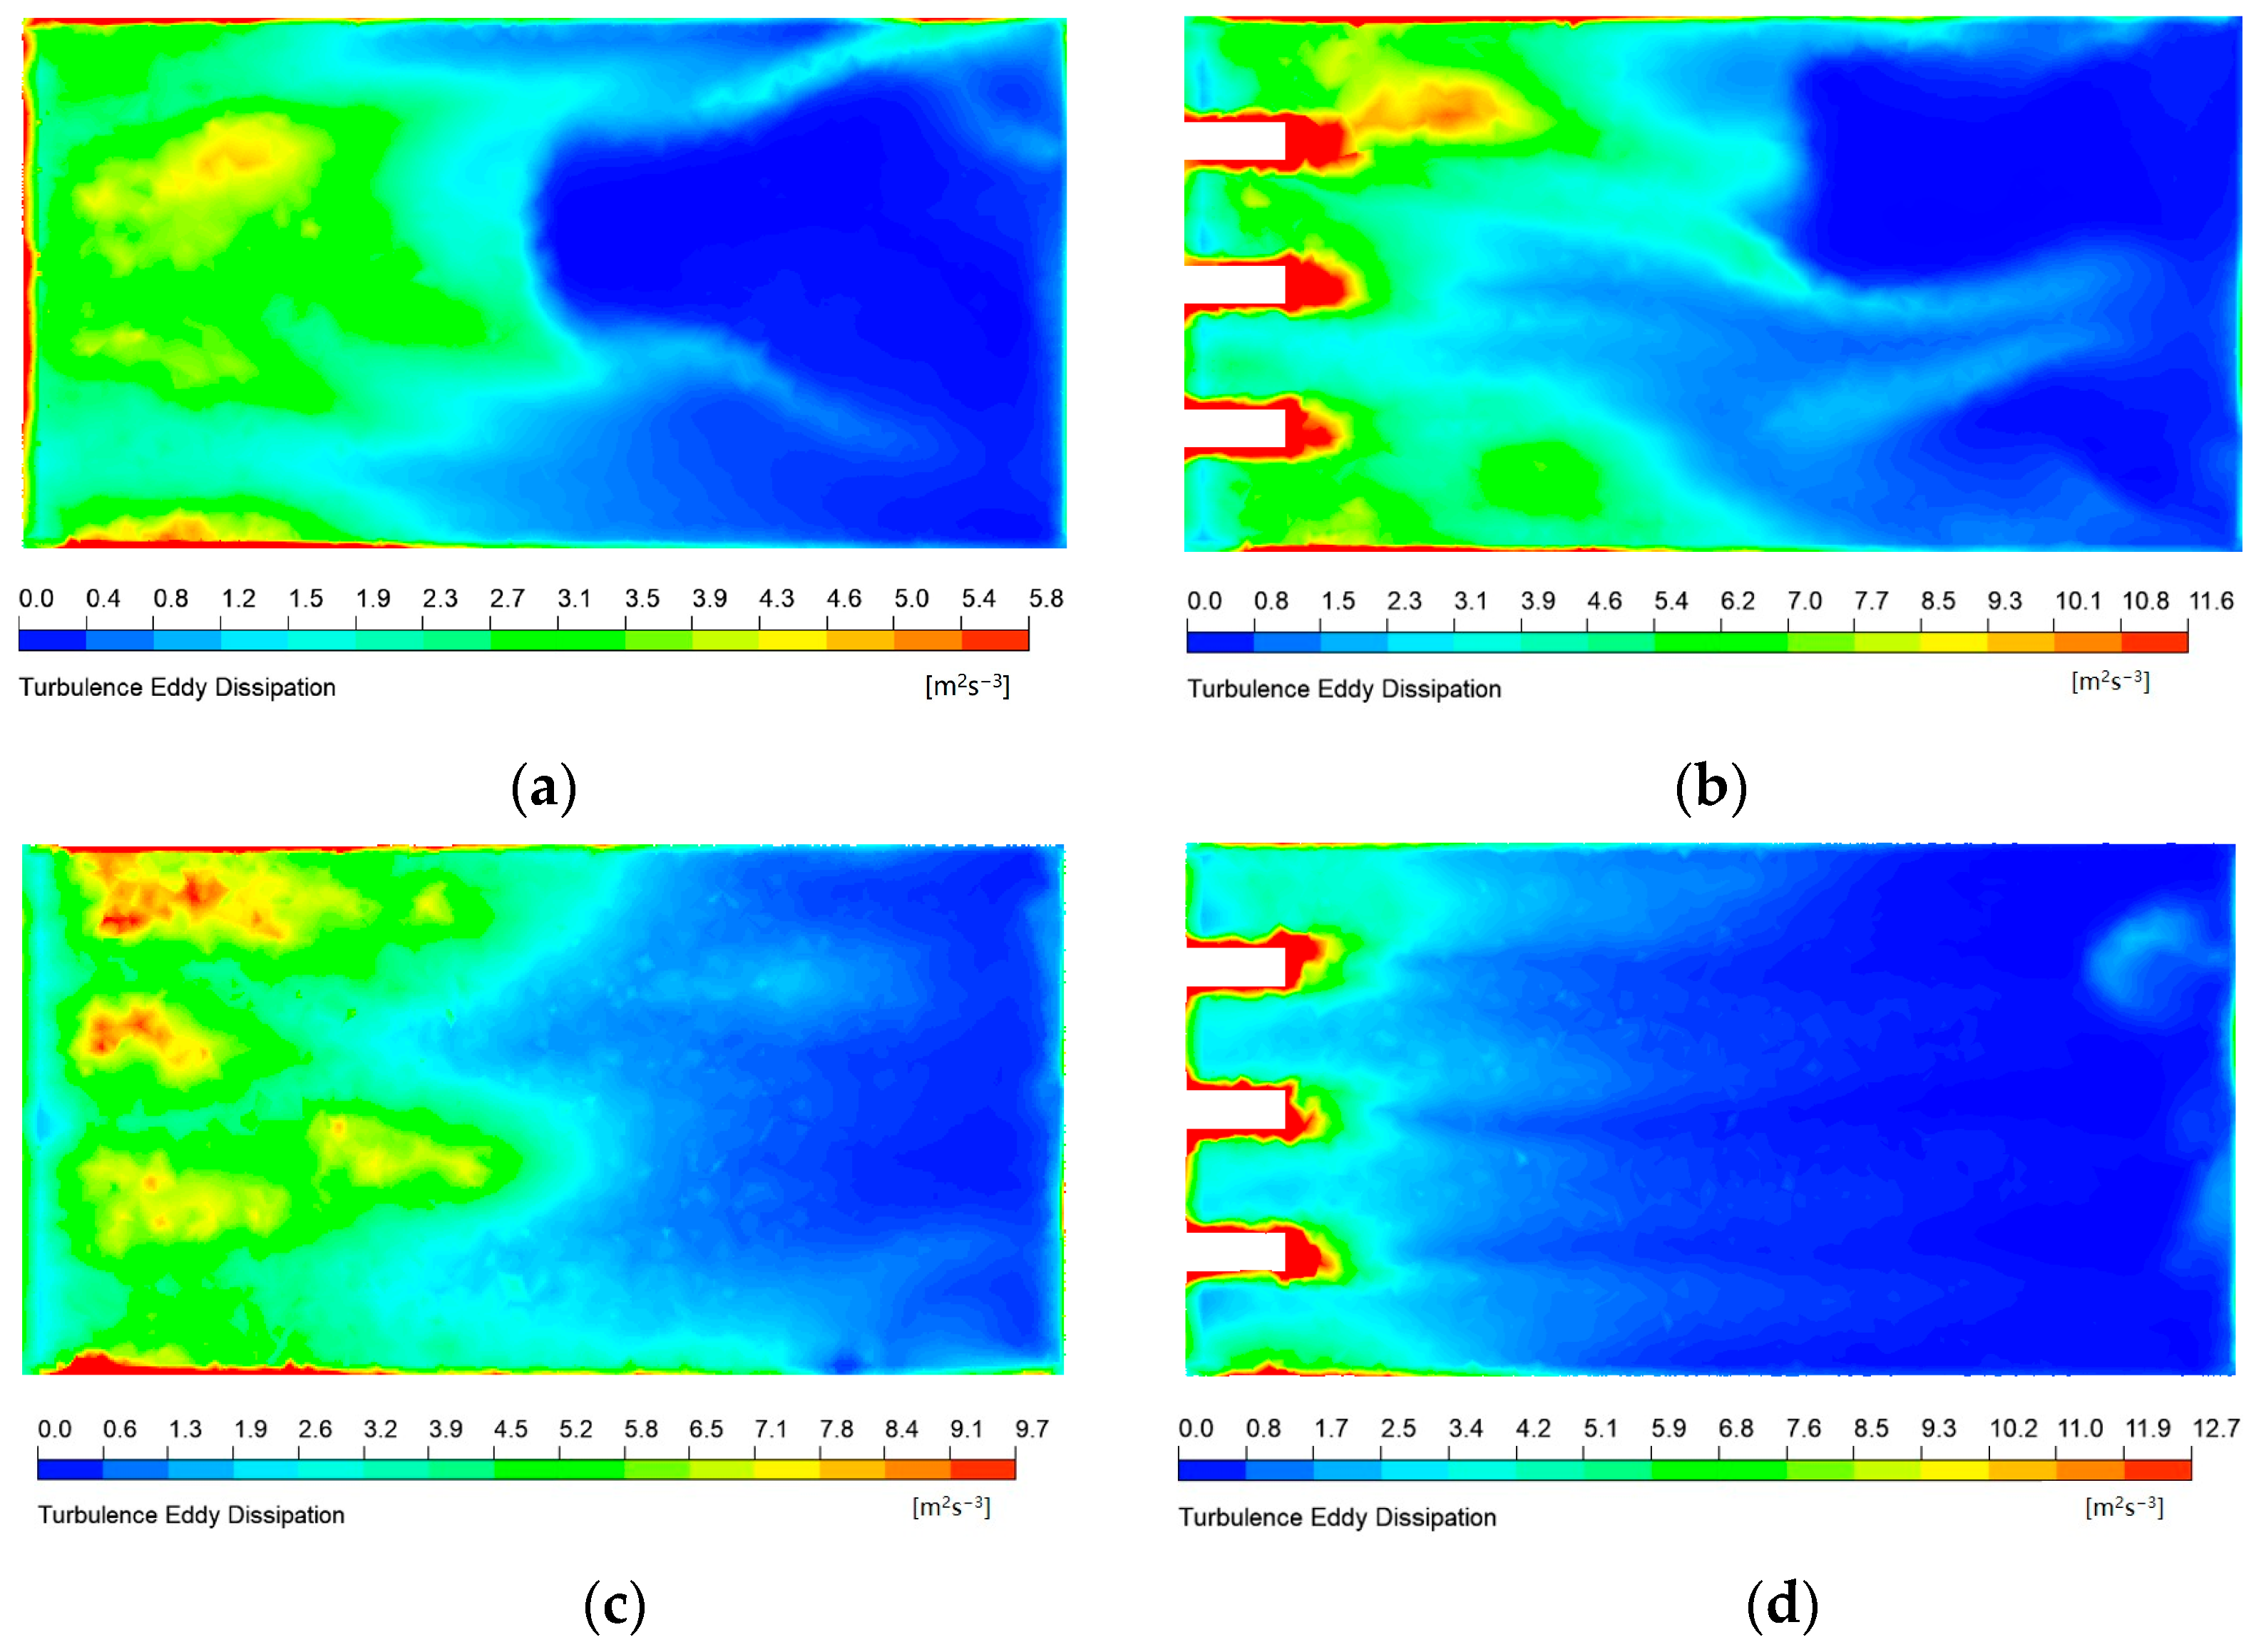
The dissipation rate refers to the rate at which turbulent kinetic energy is converted into molecular thermal kinetic energy under the action of molecular viscosity, and it is an important index for evaluating the energy dissipation effect. As the value of the dissipation rate increases, the energy loss of the water flow also increases. The distribution diagram of the near-bottom dissipation rate of the stilling basin plane behind the retaining weir under different energy dissipation schemes is shown in
Figure 10. For Scheme F1, the kinetic energy dissipation is small, and the maximum value is located at the place where the discharged water flow at the front end of the stilling basin impacts the bottom of the stilling basin, with the maximum value being approximately 5.8 m
2/s
3. For scheme F2, the discharged water flow is in a state of longitudinal extension, lateral contraction, and mainstream dispersion. The water flow in the basin undergoes intense shearing, friction, and collision effects on both sides and behind the toe piers, with a relatively large dissipation rate, with the maximum being approximately 11.6 m
2/s
3. For scheme F3, under the action of the flow obstruction and diversion of the suspended grids, the water flow in the basin undergoes intense shearing, friction, and collision effects around the suspended grids, with a relatively large dissipation rate, with the maximum being approximately 9.7 m
2/s
3. For scheme F4, the incoming water flow is first diverted and deflected by the toe piers and is dispersed into multiple small water flows. Then, under the action of the flow obstruction and diversion of the suspended grids, a part of it rolls around the grids, forming a backflow that intensifies the shear and collision of the water body. The water flow in the basin undergoes intense shearing, friction, and collision effects around the toe piers and the suspended grids, and the energy dissipation rate is relatively large, with the maximum being approximately 12.7 m
2/s
3.
Based on the above calculation results, the combined toe pier–suspended grid energy dissipator of Scheme F4 achieves great energy dissipation performance under this working condition. The mechanisms underlying the enhanced energy dissipation are elaborated as follows.
The first mechanism is the flow-splitting and jet-deflecting effect of toe piers. Installed at the inlet of the stilling basin, toe piers split the single high-speed mainstream discharged from the retaining weir into multiple narrow jets [
34]. This process expands the area of shear layers and increases the contact perimeter between the multiple jets and surrounding low-velocity water, thereby raising the production term of turbulent kinetic energy. Meanwhile, the piers deflect the mainstream away from the basin floor to mitigate floor impact and reduce the time-averaged hydrodynamic pressure on the bottom plate.
Second, suspended grids span the upper zone of the stilling basin and force the high-speed upper flow to bypass the grid bars and turn downward. Water flows through both the upper and lower sides of the bars, where the grids exert three effects on the flow: frictional resistance, flow blocking, and flow cutting. The two separated streams recombine and collide after passing through the grids, dissipating energy continuously. Small-scale vortices shed from the trailing edges of grid bars featuring high strain rates, which rapidly convert turbulent kinetic energy into heat via viscous dissipation, corresponding to an elevated turbulence dissipation rate [
35]. In addition, the flow-blocking effect of the grids diverts the upper high-speed flow to impinge on the low-velocity lower water body, generating intense vertical momentum exchange and homogenizing turbulence in the vertical direction.
The combined arrangement of toe piers and suspended grids does not merely superimpose their individual effects; instead, it forms a sequential energy dissipation system consisting of flow-splitting deflection, flow-around shear, and burst of small-scale vortices. Toe piers first divide the single mainstream into narrow jets, which then flow around the grids and increase the effective times of flow circulation around the grid members. The re-circulating wake flow induced by the grids conversely sustains the turbulence intensity behind the toe piers, creating a positive feedback loop.
4.3. Analysis of the Energy Dissipation Effect of Different Energy Dissipators Based on the Comprehensive Evaluation Objective Function
The stilling basin should not only meet the energy dissipation rate but also ensure its safe and stable operation to prevent the relevant hydraulic structures from being damaged by the water flow that has not been fully dissipated. Taking the relative near-bottom velocity and energy dissipation rate in the stilling basin as quantitative indicators, a comprehensive evaluation objective function is established, and finally, a better energy dissipation scheme is obtained.
Energy dissipation rate
E
where
E1 is the energy at the inlet section of the outlet sump, m;
E2 is the energy at the section 10 m downstream of the end of the stilling basin, m;
Z1 is the energy head at the inlet section of the outlet sump, m;
Z2 is the energy head at the section 10 m downstream of the end of the stilling basin, m;
h1 is the water depth at the inlet section of the outlet sump, m;
h2 is the water depth at the section 10 m downstream of the end of the stilling basin, m; α
1 and α
2 are kinetic energy correction coefficients;
is the velocity at the pre-jump section, taking the average velocity at the inlet section of the outlet sump, m/s;
is the average velocity at the section 10 m downstream of the end of the stilling basin, m/s; g is the acceleration due to gravity, g = 9.8 m/s
2.
Set the maximum velocity at a height of 0.5 m from the floor slab along the length of the stilling basin as the maximum bottom velocity
vmax, and use the ratio of the maximum near-bottom velocity
vmax of the floor slab to the average velocity
at the pre-jump section to represent the relative near-bottom velocity
v:
Comprehensive evaluation objective function
Y
where
C1 = −0.5,
C2 = 0.5, referring to the analytic hierarchy process theory in the Saaty scaling system, where the scale value equals 1 and the normalized weight is 0.5 when two indicators are of equal importance, and drawing on the practice of adopting an equal preference coefficient α = 0.5 for equally important evaluation dimensions in multi-criteria decision making described in References [
36,
37,
38], this weight coefficient is adopted for the comprehensive evaluation objective function in this study. The lower the value of the comprehensive evaluation objective function
Y, the better the energy dissipation effect of the stilling basin, which is a scheme with better comprehensive energy dissipation performance.
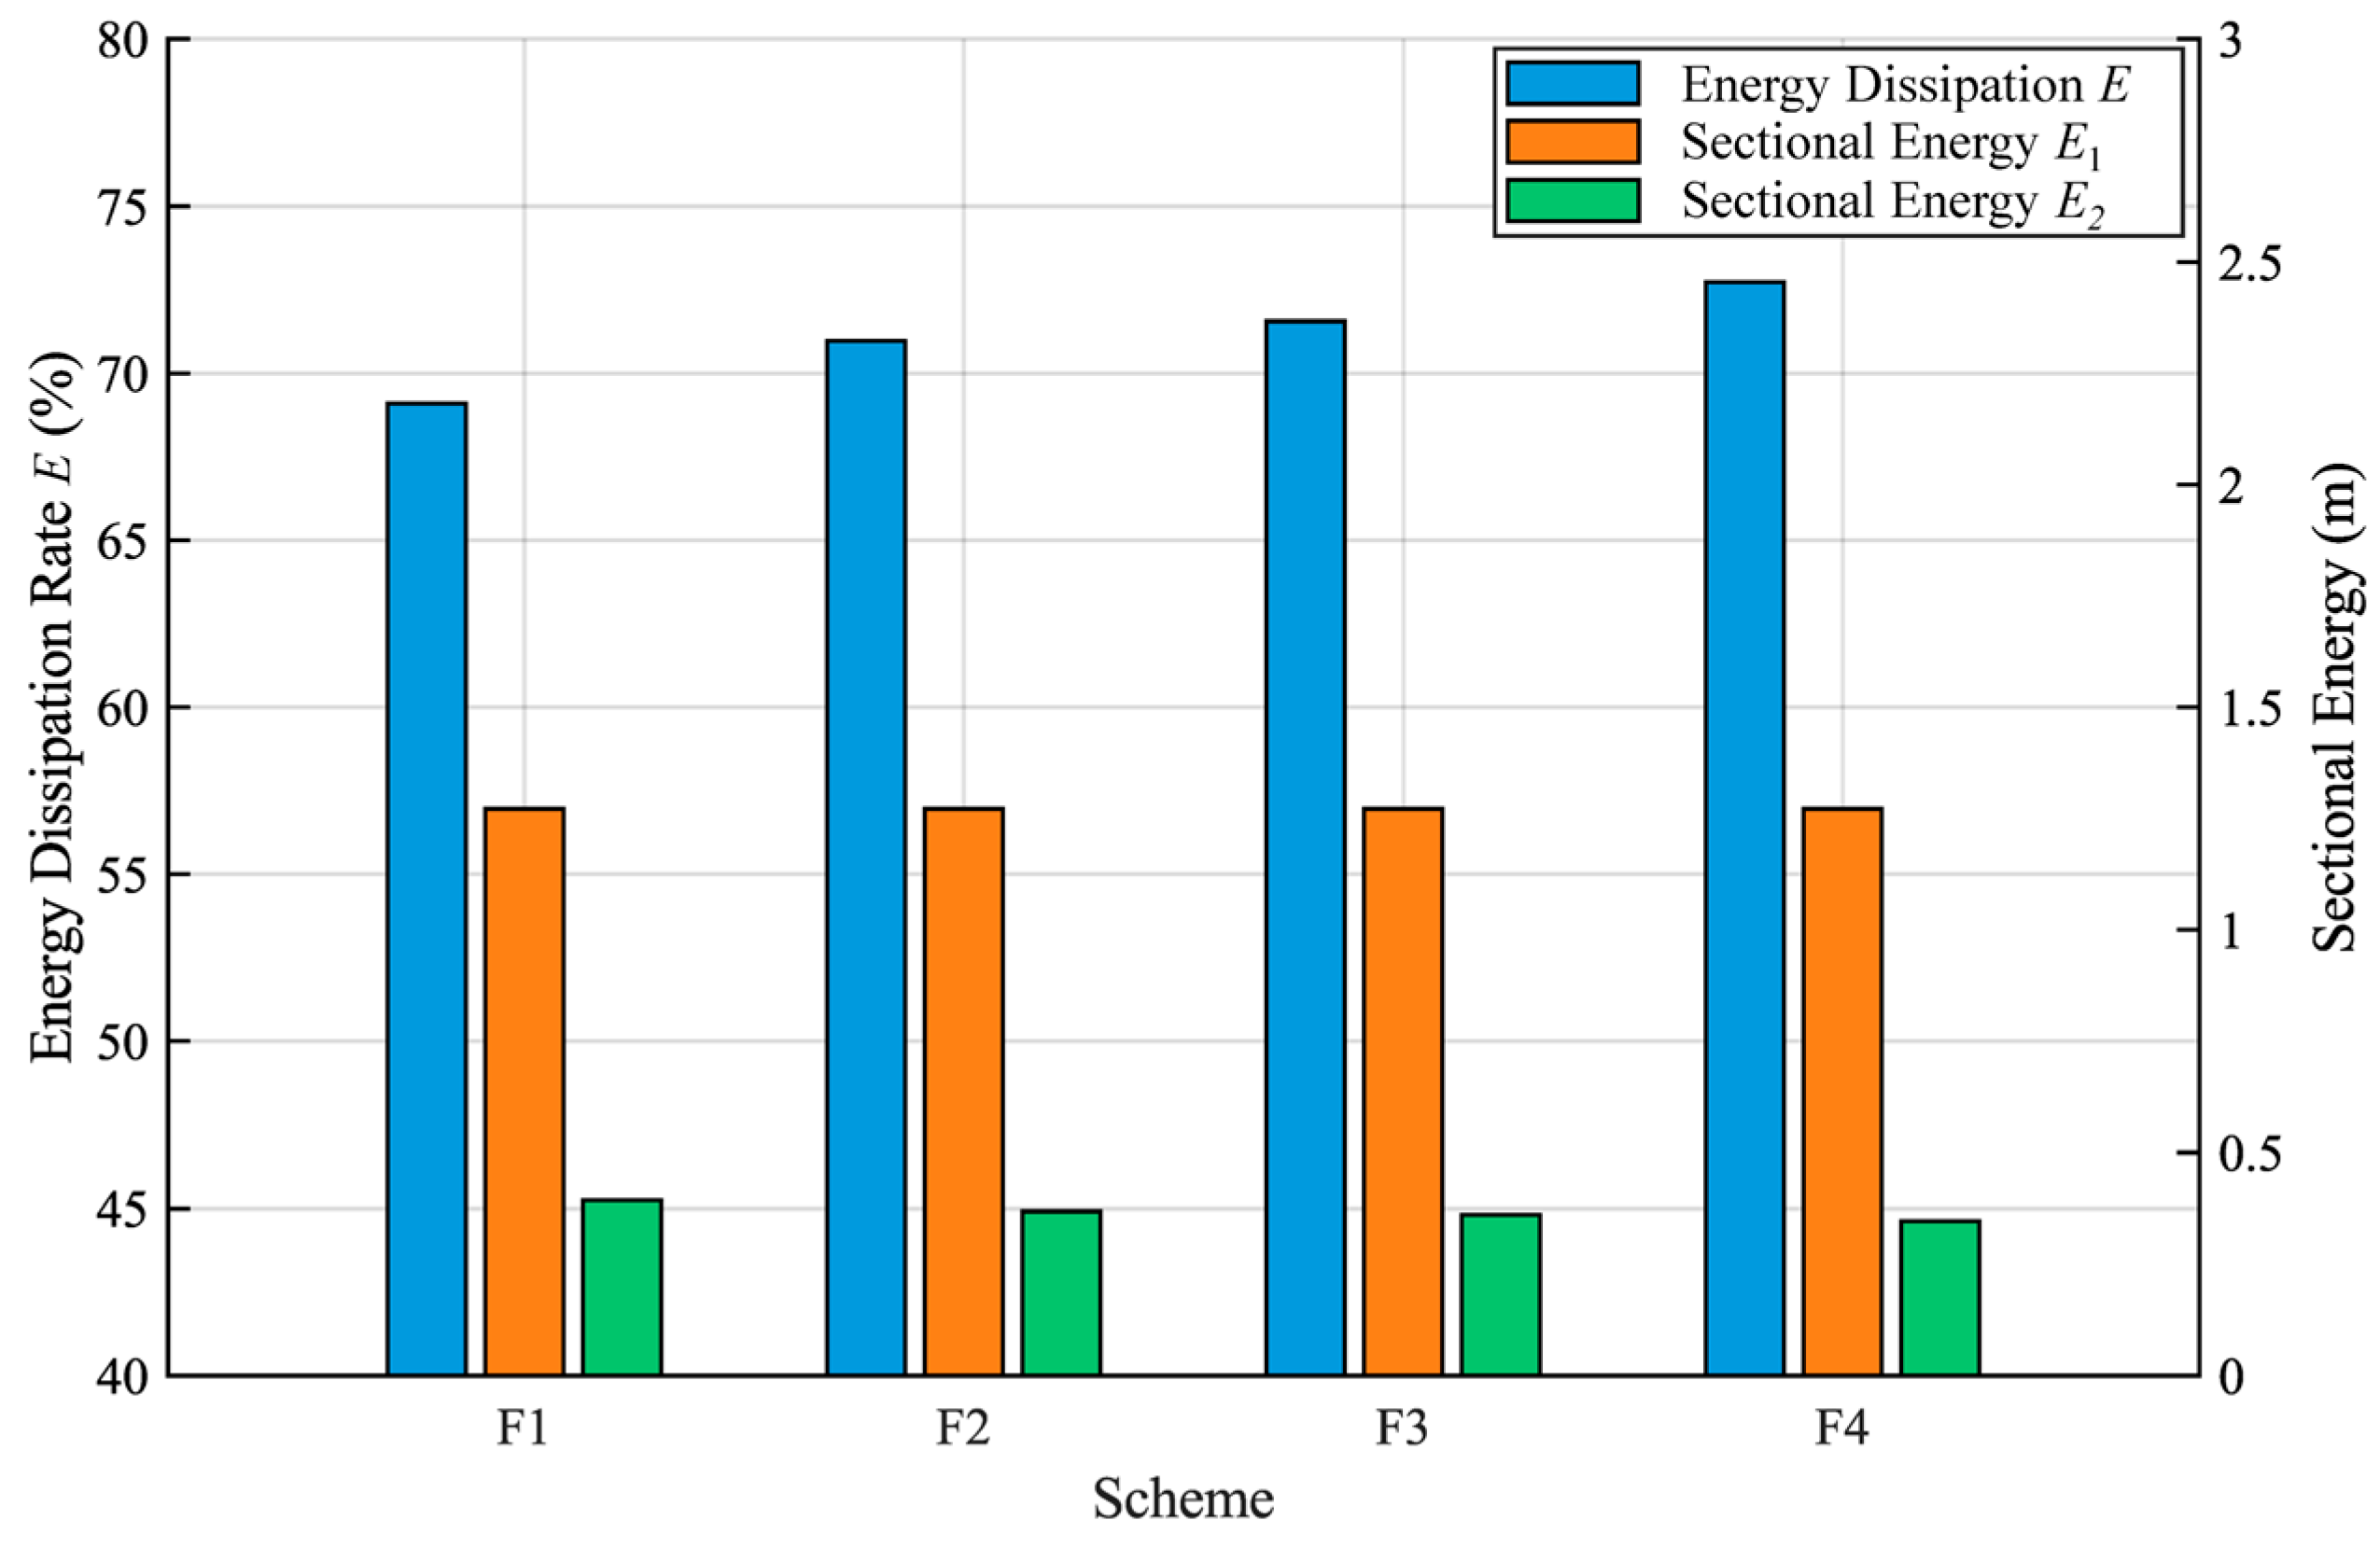
As can be seen from the energy dissipation rate calculation results in
Table 4, the energy dissipation rate of the F1 traditional stilling basin is 69.1%, the energy dissipation rate of the F2 stilling basin with toe piers is 70.97%, the energy dissipation rate of the F3 stilling basin with suspended grids is 71.56%, and the energy dissipation rate of the F4 stilling basin with combined arrangement of toe piers and suspended grids is 72.73%. At the design flow rate, compared with F1, the energy dissipation rate of F4 is increased by 3.63%, compared with F2 which is increased by 1.76%, and compared with F3 which is increased by 1.17%. The energy dissipation process of the stilling basin with combined arrangement of toe piers and suspended grids is more complex than that of the traditional stilling basin. Due to the placement of the toe pier energy dissipator, the discharged water flow is dispersed into multiple small water flows, changing the original water flow structure at the first section of the stilling basin. Also, due to the flow resistance and flow-splitting effects of the suspended grids, water flow accumulation and movement around the grids occur, changing the original hydraulic jump structure in the stilling basin, causing the hydraulic jump to occur earlier, and the water flow after the jump makes a movement around the grids, consuming some kinetic energy.
As shown in
Figure 11, after the toe pier auxiliary energy dissipator is installed in F1, the energy dissipation rate increases rapidly. The energy dissipation rates of F2 and F3 are not much different. After the toe pier–suspended grid combined energy dissipator is installed in F4, the energy dissipation rate increases significantly, showing a marked increase compared to F1.
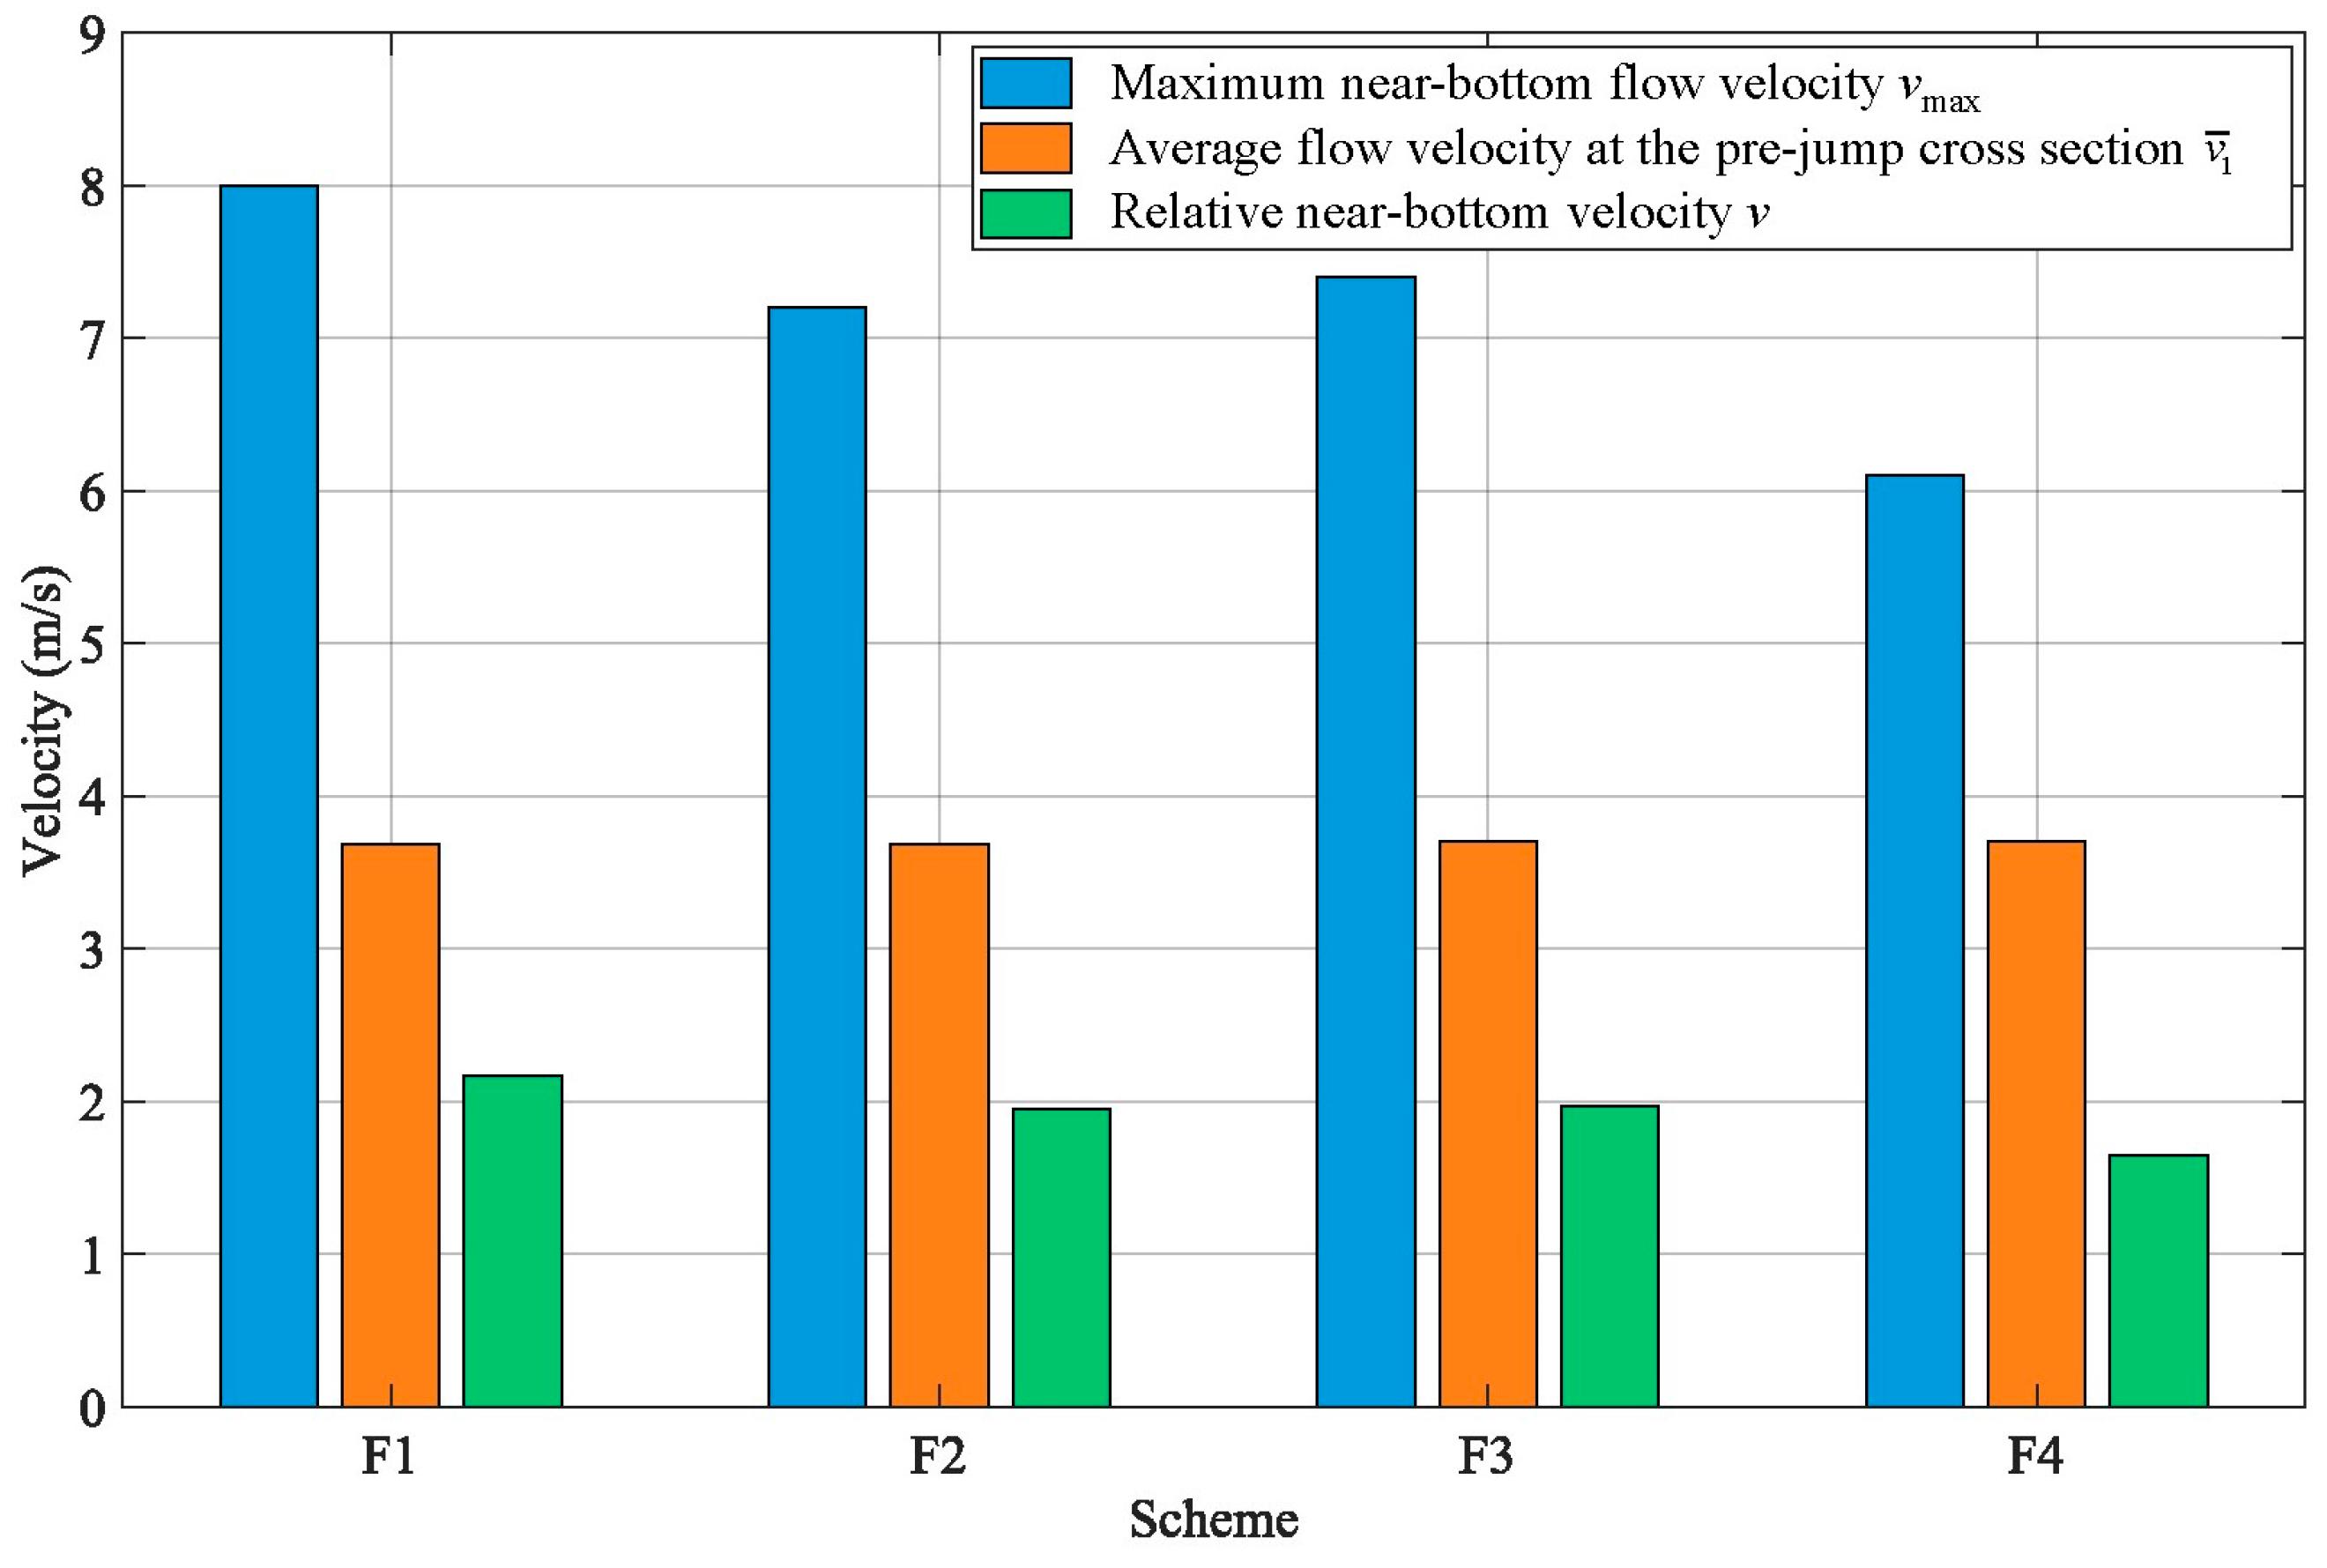
The calculation results of the relative near-bottom flow velocity
v are listed in
Table 5. For the average flow velocity at the pre-jump cross section, the calculation differences among various schemes are not obvious. The relative near-bottom flow velocity mainly depends on the maximum near-bottom flow velocity
vmax. As calculated above, the maximum near-bottom flow velocity of F1 is 8.0 m/s. The maximum critical flow velocity of F2 is 7.2 m/s. After the installation of the single suspended grids energy dissipation device, the maximum critical flow velocity in the sump reaches 7.4 m/s. After the installation of the combined energy dissipator of toe pier and suspended grid in F4, the maximum near-bottom flow velocity in the stilling basin reaches 6.1 m/s. The scheme with the minimum relative near-bottom flow velocity is the energy dissipation scheme with the combined installation of toe pier and suspended grid, with a value of 1.65 m/s.
The average flow velocity
, maximum near-bottom flow velocity
vmax, and relative near-bottom flow velocity
v at the pre-jump cross section of each scheme are shown in
Figure 12.
For the average flow velocity , at the pre-jump cross section, there is no obvious change trend among the schemes. For the maximum near-bottom flow velocity, the maximum near-bottom flow velocity of F2 is 10% lower than that of F1; the maximum near-bottom flow velocity of F3 is 8.75% lower than that of F1, but it increases compared with F2; the maximum near-bottom flow velocity vmax in the stilling basin of F4 decreases sharply, being 23.75% lower than that of F1.
As shown in
Table 6 and
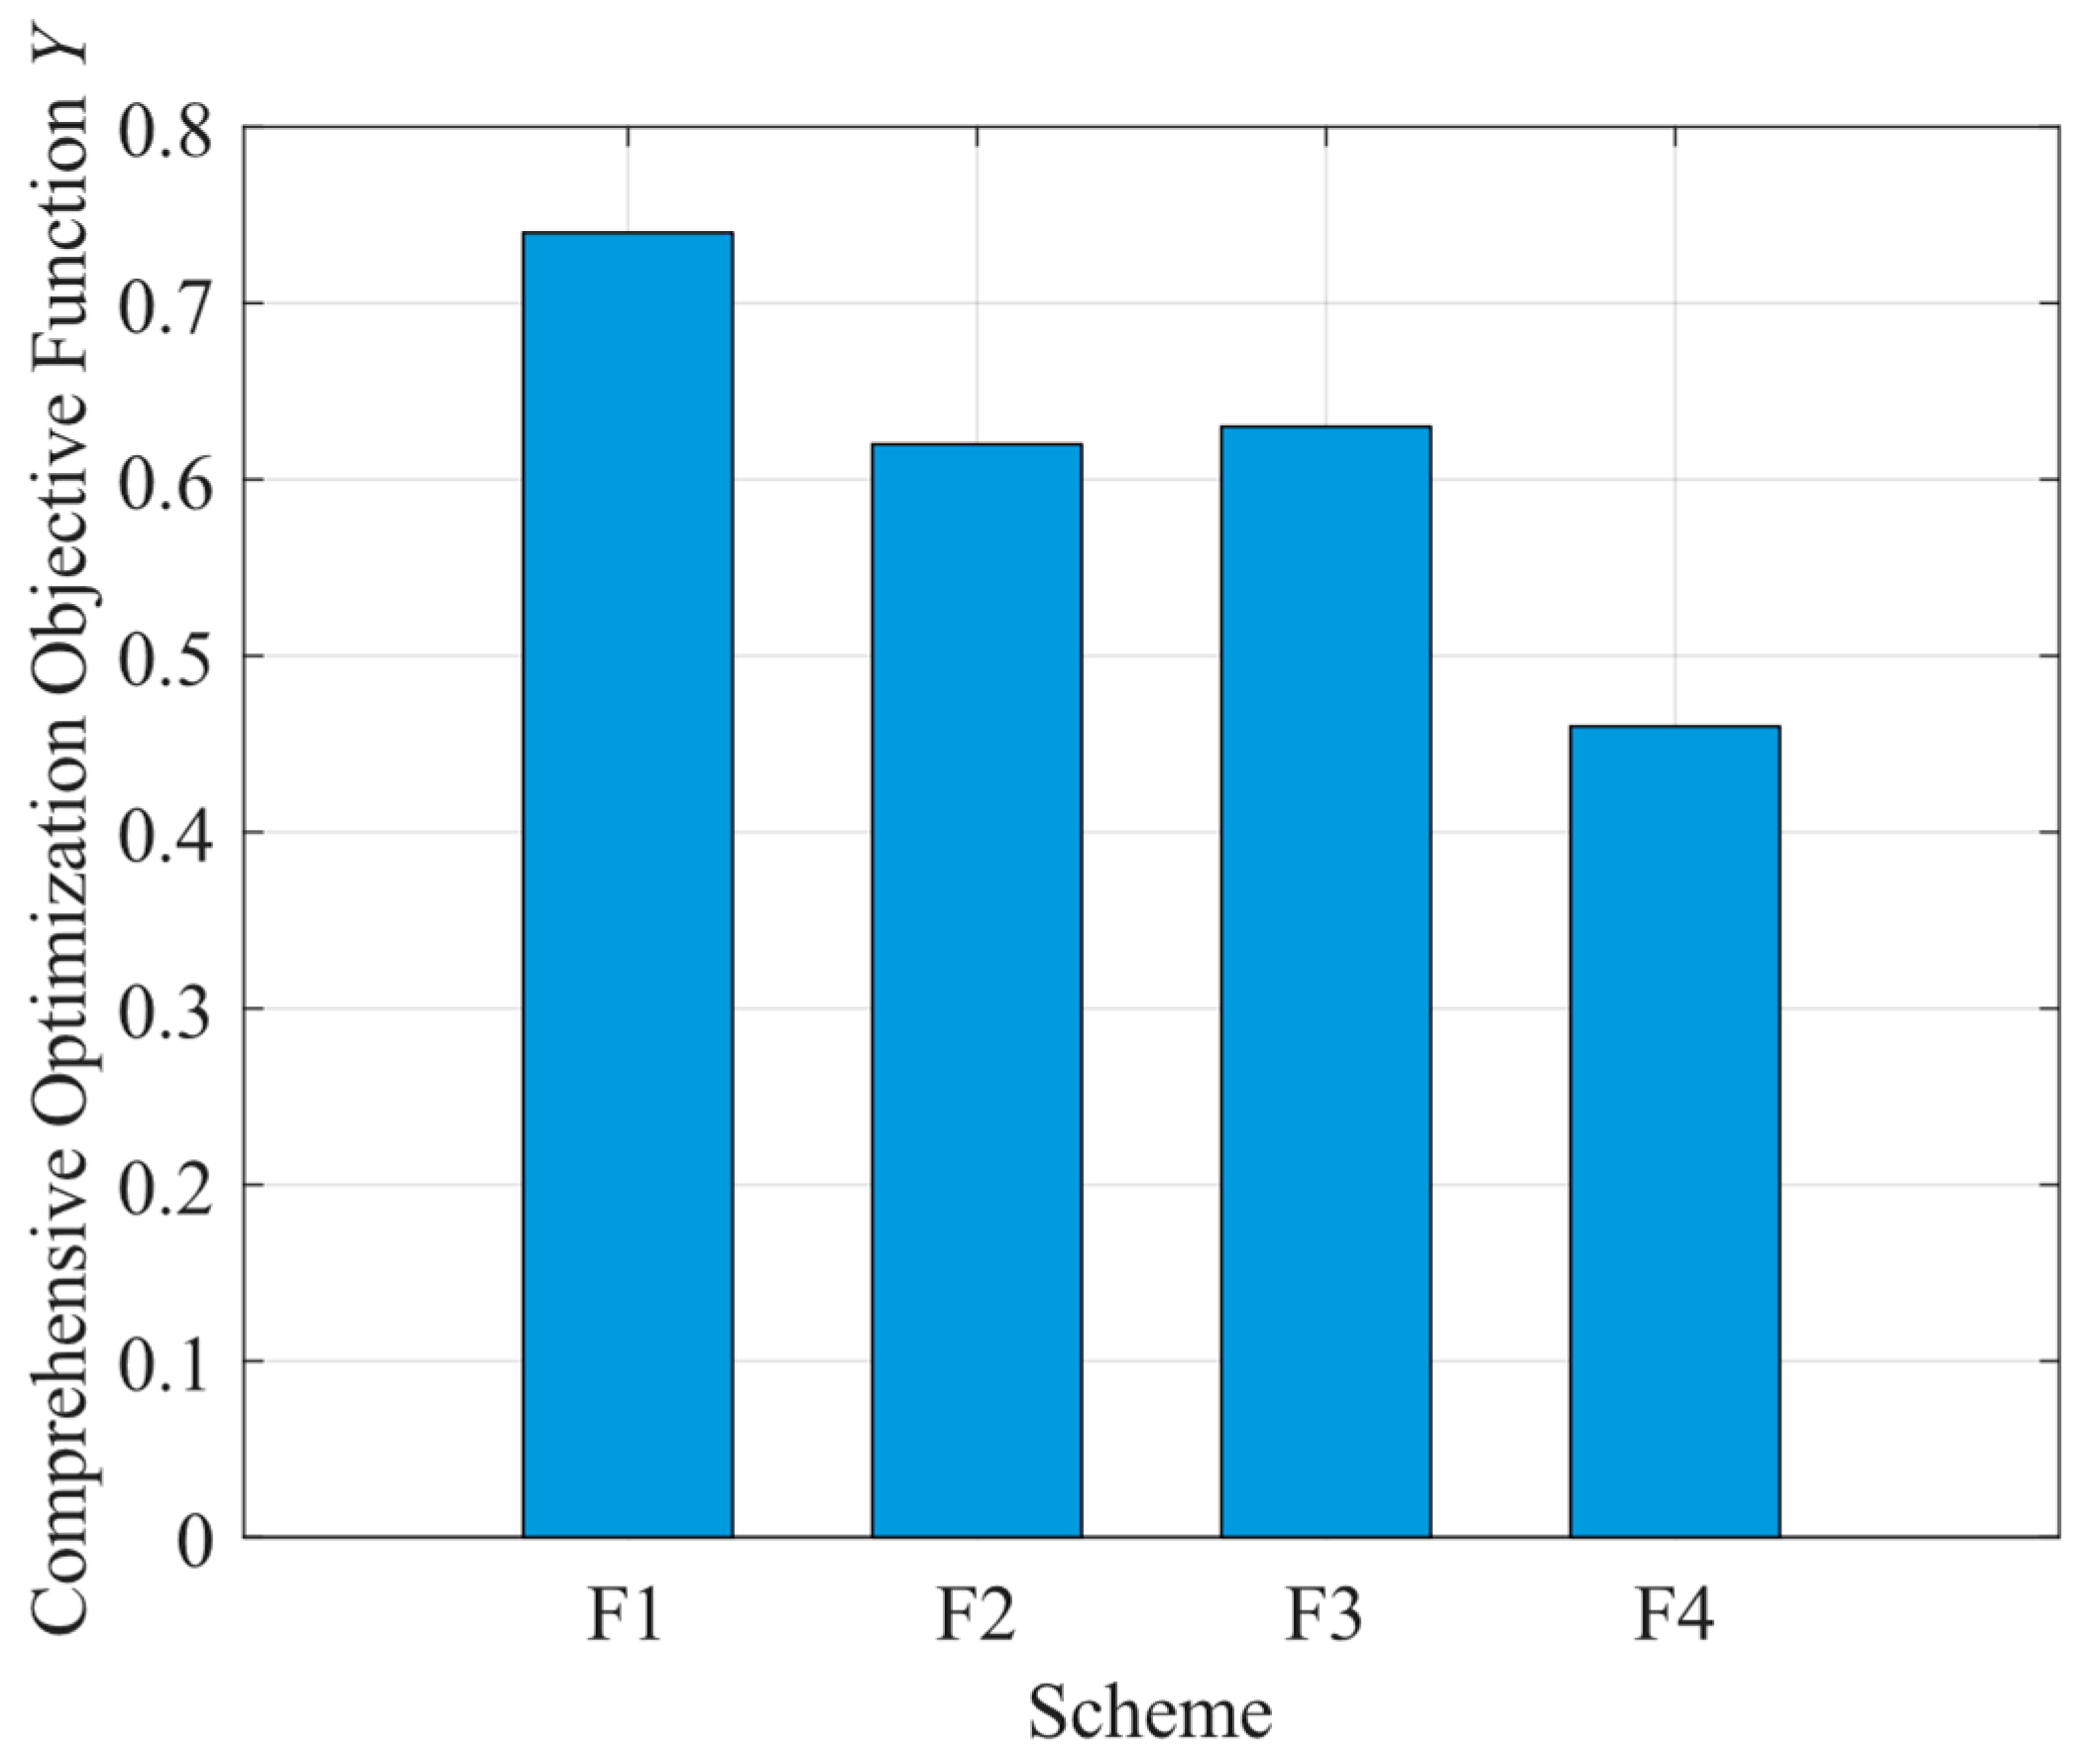
Figure 13, the value of the comprehensive evaluation objective function
Y of F1 is relatively high at 0.74, the hydraulic jump area is large, and the flow pattern in the basin is poor. The value of the comprehensive evaluation objective function
Y of F2 is 0.62, which is 16.22% lower than that of the traditional stilling basin. The value of the comprehensive evaluation objective function
Y of F3 is 0.63, which is 14.86% lower than that of the traditional stilling basin. The value of the comprehensive evaluation objective function of F4 is the lowest at 0.46, which is 37.84% lower than that of the traditional stilling basin, with the largest decrease. The vorticity distribution in the basin is concentrated and the flow pattern distribution is uniform, which can effectively avoid the scouring and damage of the stilling basin floor and improve the service life of the stilling basin. It can be found that after adding the combined energy dissipator of toe pier and suspended grid in the stilling basin, the energy dissipation rate is the highest, the relative near-bottom flow velocity is the smallest, and the value of the comprehensive evaluation objective function
Y is the smallest, indicating that its comprehensive performance is the best and it can effectively superimpose the advantages of each auxiliary energy dissipator.