1. Introduction
Indonesia is the world’s largest archipelagic state and consists of more than 17,000 islands, many of which face persistent challenges in securing reliable freshwater supplies. Within this archipelagic setting, island size is a critical factor, because freshwater availability and water resource infrastructure constraints generally intensify with decreasing land area, like small islands [
1]. Small islands are commonly defined as islands with an area of less than 2000 km
2 or a width of less than 10 km, whereas very small islands are often defined as islands smaller than 100 km
2 or with a maximum width of 3 km [
2]. Because of their smaller size, very small islands experience heightened constraints on catchment area, land availability for storage and infrastructure, and freshwater resource development. These conditions are particularly relevant in the Batam Regions, Riau Islands Province, where many islands are very small and strongly dependent on rainfall-based water systems.
Freshwater insecurity on very small islands is driven by both natural and anthropogenic factors. The small land area limits surface-water storage and reduces groundwater potential, while seawater intrusion further threatens freshwater quality [
3]. Fresh groundwater lenses on small islands are particularly vulnerable to drought, abstraction, sea level rise, and salinization [
4,
5]. At the same time, population growth, uneven infrastructure development, and climate variability intensify pressure on already limited water resources [
6]. To address these constraints, governments often develop multiple water supply options, including freshwater reservoirs, submarine pipelines, and seawater reverse osmosis (SWRO) systems [
7,
8,
9,
10]. However, these systems are not always sufficient or fully reliable. Small reservoirs depend entirely on rainfall recharge, making them vulnerable to prolonged dry seasons, while desalination systems are constrained by high energy demand, operating costs, and logistical challenges related to installation and maintenance [
7,
8,
9,
10,
11,
12]. Although centralized systems can improve water availability, they often require substantial financial investment, technical expertise, and continuous maintenance. These requirements can be difficult to sustain on very small islands because of limited local resources, logistical constraints, and vulnerability to climatic extremes. This vulnerability has been reported on Belakang Padang, where a previous study noted that the reservoir became empty during the 2016 drought, causing the water treatment plant to cease operations due to lack of raw water before distribution [
13,
14]. As a result, water security on very small islands often depends on combining centralized supply systems with decentralized household-level alternatives. This reflects broader water-security challenges in small island settings, where limited natural water storage, infrastructure constraints, and exposure to climatic extremes often require diversified water supply strategies [
15,
16].
Among these alternatives, household rainwater harvesting (RWH) is widely regarded as one of the most practical options for small island communities because of its relatively low cost, low energy requirement, and adaptability to household use [
17]. Nevertheless, its long-term effectiveness depends on whether it can provide a sufficiently reliable supply under variable rainfall conditions [
18]. Previous studies in island and tropical contexts have shown that the performance of RWH systems is frequently limited by both technical and operational factors. On Ifalik Atoll, many rooftop catchment systems failed during drought because of leaking gutters and poor system integrity [
17]. Modeling studies on small Greek islands revealed that even large storage tanks may be insufficient under highly variable rainfall regimes, highlighting the strong dependence on both system design and climatic variability [
19]. In Honiara, the effectiveness of urban RWH systems was reduced by infrastructural deficiencies and climate variability [
20]. A recent review further emphasized that inadequate maintenance, poor design, and limited user participation are widespread factors that reduce RWH efficiency [
21]. Similarly, experiences in the Caribbean have identified poor overflow management, contamination risk, and insufficient maintenance as key barriers to effective RWH use [
22]. Together, these studies show that RWH can be useful, but its reliability is not guaranteed, especially where rainfall is highly seasonal and storage capacity is limited.
Despite the relevance of household rainwater harvesting (RWH) for improving water security in Indonesian island communities, evidence on its practical reliability remains limited, particularly for very small islands where land area, roof catchment area, storage space, and alternative freshwater resources are severely constrained. Previous studies in Indonesia have mainly addressed water scarcity, desalination, groundwater vulnerability, or broader island water management issues [
23,
24,
25,
26], while fewer studies have examined whether household-scale RWH can function as a dependable domestic water source under the specific physical and climatic constraints of very small islands [
27].
The aim of this study is to assess the performance, reliability, and practical limitations of household RWH systems in very small island settings. This gap is particularly important for very small islands because their physical size severely limits freshwater storage, groundwater development, and the space available for water infrastructure. The Belakang Padang Island and Mecan Island (two islands out of 371 islands in Batam regions [
28]) have areas of only 2.317 km
2 and 0.29 km
2, respectively, yet both support permanent communities that face domestic water supply challenges due to seasonal rainfall variability and limited infrastructure. Although previous studies have examined water scarcity, the application of SWRO systems, groundwater vulnerability, and RWH potential on Indonesian islands, limited attention has been given to household RWH reliability on very small Indonesian islands during contrasting wet and dry years. To the best of our knowledge, this study is among the first household-scale assessments integrating storage performance, reliability analysis, and water saving efficiency under representative wet- and dry-year conditions for very small Indonesian islands.
To address this gap, this study assessed the reliability and limitations of household RWH on two very small Indonesian islands, the Belakang Padang Island and Mecan Island, during contrasting wet and dry years. Specifically, the study addressed three research questions: (1) How does household RWH performance differ between wet and dry years? (2) How do roof catchment area, tank storage capacity, and household water demand influence RWH reliability, water saving efficiency, and storage performance? (3) Can existing household RWH systems meet domestic water demand independently, or should they be considered supplementary and backup sources within a diversified island water supply system? Through field surveys and a daily water-balance approach, this study evaluated storage performance, WSE, and reliability under different tank-size and household-demand scenarios. The aim was to clarify the practical role of household RWH in very small island water systems and to determine whether it can function as a dependable domestic water source or mainly as a supplementary measure during periods of supply stress.
2. Materials and Methods
2.1. Study Area
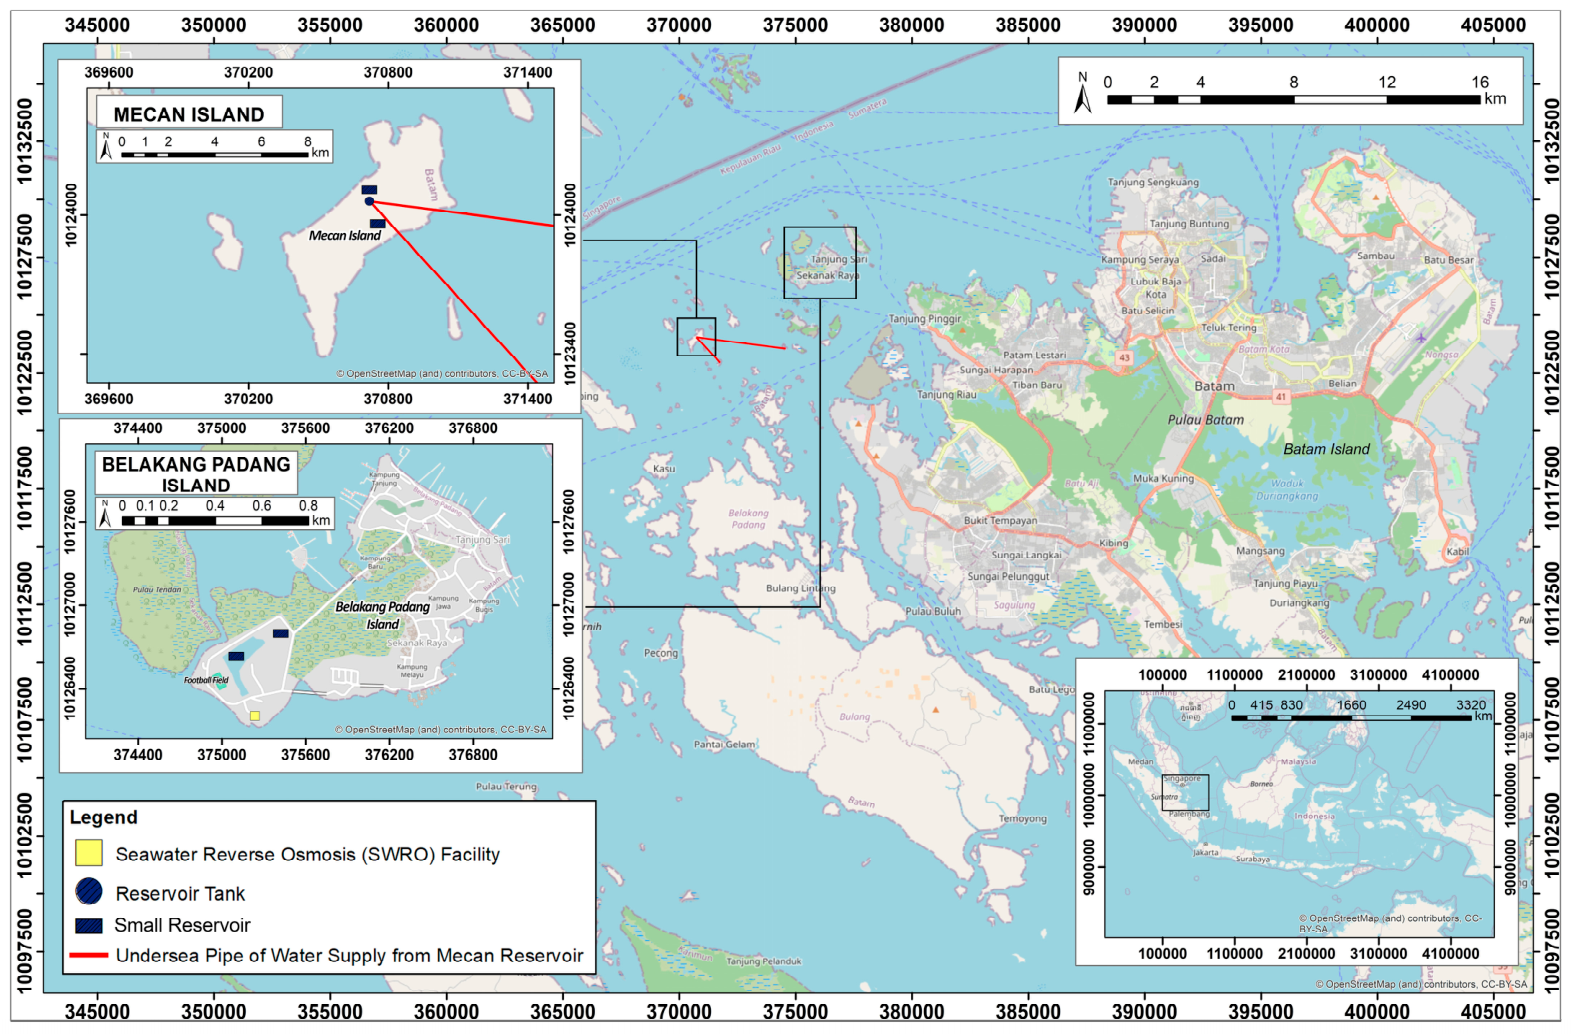
This study was conducted on two very small islands, the Belakang Padang Island and Mecan Island (
Figure 1). The two islands are located near each other and rely partly on reservoir-based water supply, although Belakang Padang also has access to SWRO, which is managed by the Regional Public Service Agency Integrated Service Unit for the Clean Water Program (Badan Layanan Umum Daerah Unit Pelayanan Terpadu Program Air Bersih; BLUD UPT PAB) Batam [
10]. The areas of the Belakang Padang Island and Mecan Island are 2.317 km
2 and 0.331 km
2, respectively [
7,
29]. The Belakang Padang Island has a population of over 10,000, whereas the Mecan Island is inhabited by only 100–200 people, with fishing constituting the primary livelihood [
7]. The domestic water sources on the Mecan Island include the Mecan Reservoir, unprotected wells, packaged drinking water (PDW), and RWH systems. However, in recent years, residents have ceased using well water due to concerns over contamination and unpleasant odors. On the Belakang Padang Island, the available domestic water sources comprise an SWRO system, a reservoir, unprotected wells, PDW, and RWH systems. As on the Mecan Island, Belakang Padang residents tend to avoid unprotected wells because of the island’s more stable water supply, and poor well conditions that led to water-quality concerns.
The performance of existing RWH systems on these very small islands was assessed through direct field observations combined with daily water balance and WSE analyses. The analysis proceeded in three stages. First, storage performance was simulated to examine daily tank behavior, overflow, and depletion during representative wet and dry years. Second, a reliability analysis was conducted to quantify the percentage of days when daily household demand was fully met under standardized tank and demand scenarios during wet (2023) and dry (2019) years. Third, WSE was calculated using the long-term rainfall record from 1994 to 2023 to evaluate the potential contribution of RWH to household water demand. A 30-year rainfall period is determined to capture interannual rainfall variability, including wet, normal, and dry years.
2.2. Selection of Representative Wet and Dry Years
The daily precipitation data used in this study were obtained from the Indonesian Agency for Meteorology, Climatology, and Geophysics (BMKG) at Hang Nadim International Airport, Batam Island. Because long-term precipitation data were unavailable for the Belakang Padang and Mecan Islands themselves, the Batam station, located approximately 3 km from Belakang Padang and 9 km from Mecan, was employed as the nearest reliable source to represent regional rainfall conditions. Given the short distances between the islands and their location within the same regional monsoonal climate system, the Batam rainfall record was assumed to be representative of rainfall variability on both the Belakang Padang and Mecan Islands.
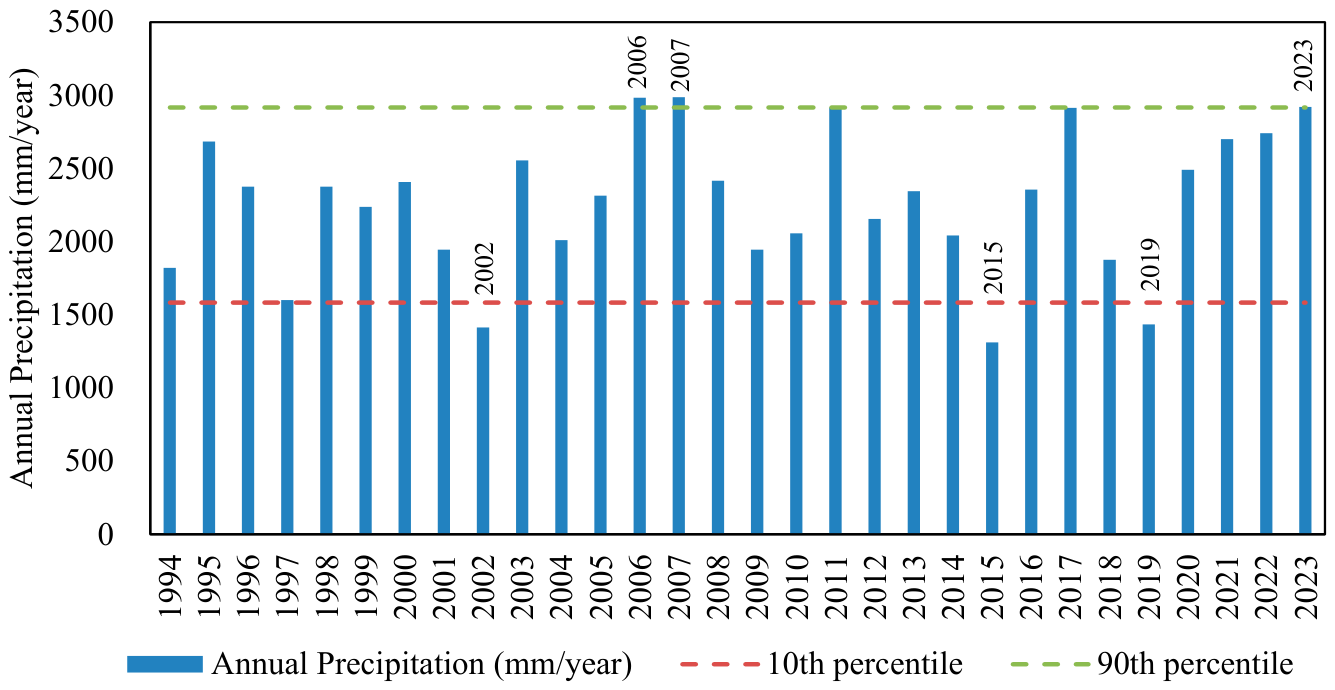
Figure 2 shows the marked interannual variability in annual precipitation over 1994–2023. To identify representative wet and dry years for the RWH simulations, a percentile-based approach was applied. Following Knapp et al. [
31], the 90th percentile (P90) and 10th percentile (P10) of the annual precipitation distribution were used as thresholds to classify extreme rainfall conditions. Years with annual precipitation greater than the 90th percentile were classified as extreme wet years, whereas years with annual precipitation lower than the 10th percentile were classified as extreme dry years.
Based on the annual precipitation record from 1994 to 2023, the P10 and P90 thresholds were 1583.47 mm and 2916.75 mm, respectively. Accordingly, 2006 (2982.4 mm), 2007 (2986.9 mm), and 2023 (2920.8 mm) were classified as extreme wet years because their annual precipitation exceeded the P90 threshold. Similarly, 2002 (1413.3 mm), 2015 (1311.1 mm), and 2019 (1433.8 mm) were classified as extreme dry years because their annual precipitation was below the P10 threshold.
Representative wet and dry years were subsequently selected as the years with annual precipitation closest to the respective percentile thresholds, following the percentile-based representative-year selection approach used by Imteaz et al. [
32]. Therefore, 2023 was selected as the representative wet year because its annual precipitation (2920.8 mm) was closest to the P90 threshold (2916.75 mm), differing by only 4.05 mm. Among the identified extreme dry years, 2019 had the smallest difference from the P10 threshold and was therefore selected as the representative dry year. This selection represented wet and dry conditions defined by the percentile thresholds while avoiding reliance on the single wettest or driest year, which may reflect an unusually extreme rainfall pattern. These representative years (2019 for the dry year and 2023 for the wet year) were subsequently used to evaluate RWH performance under contrasting high- and low-rainfall conditions.
2.3. Storage Performance Simulation
The water-balance approach was applied to evaluate the performance of RWH systems on very small islands using the Yield After Spillage (YAS) algorithm. In this method, the storage tank is treated as a control volume in which daily inflow is calculated as the product of precipitation, roof catchment area, and the runoff coefficient [
33]. Storage is updated by subtracting household water demand, while overflow and shortage are explicitly accounted for when storage exceeds tank capacity or becomes insufficient to meet demand. By iterating this balance over the simulation period, the method quantifies system performance during contrasting wet and dry years, allowing assessment of reliability, WSE, overflow potential, and shortage frequency. The model boundary was limited to the rooftop catchment, conveyance to the storage tank, tank storage, household withdrawal, overflow, and shortage components. Groundwater interaction was not included because harvested rainwater was assumed to be collected directly from roof surfaces and stored in household tanks, rather than infiltrating into, recharging, or being withdrawn from the aquifer. Minor system losses, such as first-flush diversion, leakage, and conveyance losses, were not explicitly modeled because the objective of this study was to evaluate household RWH storage performance and water supply reliability rather than harvested rainwater quality. These losses were assumed to be partially captured by the selected runoff coefficient, a common simplification in daily water-balance models [
32,
33]. However, the omission of explicit first flush losses may have resulted in slight overestimation of the harvested water volume, particularly during small rainfall events. Evaporation loss was assumed to be minor compared to with water withdrawal rainwater, which was assumed to be stored in covered household tanks; hence the collected water may be slightly overestimated. The daily rainfall threshold was set at the smallest nonzero value recorded from rainfall data, which was 1 mm. This value is widely used to distinguish wet days from dry days; therefore, rainfall below this threshold was considered ineffective for RWH [
34,
35].
The quantity of rainwater collected each day (Q
in, L) was calculated as:
where R is the daily rainfall (mm), A is the rooftop catchment area (m
2), and C is the runoff coefficient representing the collection efficiency of the roof. Since 1 mm of rainfall over an area of 1 m
2 is equivalent to 1 L of water, Q
in is obtained directly in liters without additional unit conversion. In this study, C was fixed at 0.85 because the roofing materials commonly used in the study area were galvanized steel or brick-based roofs. These materials typically have runoff coefficients of about 0.75–0.95 [
36]. Tank storage was simulated using a daily water balance using Equation (2):
where
St is the temporary storage volume after rainfall input at day t (L),
St−1 is the storage from the previous day (L). Daily rainfall was first added to the tank storage. Overflow was then calculated when storage exceeded tank capacity, and household demand was subtracted from the available storage. This calculation sequence was applied consistently for all tank-size and household-demand scenarios.
If storage exceeded the tank’s capacity, overflow losses were calculated as:
and storage was reset to the maximum allowable volume:
where S
avail,t is available water storage for water withdrawal (L). When stored water was insufficient to meet demand, shortages were calculated as:
where Q
out is the daily household water demand (L) and Q
shortage is the unmet portion of household water demand (L), which will be used for WSE analysis. The final storage at the end of the day (S
t) was calculated as:
and the tank volume was set to zero. This approach allowed estimation of harvested water availability, overflow losses, and shortage events under different rainfall regimes, tank capacities, and household-demand scenarios. The input data used in the analysis are summarized in
Table 1.
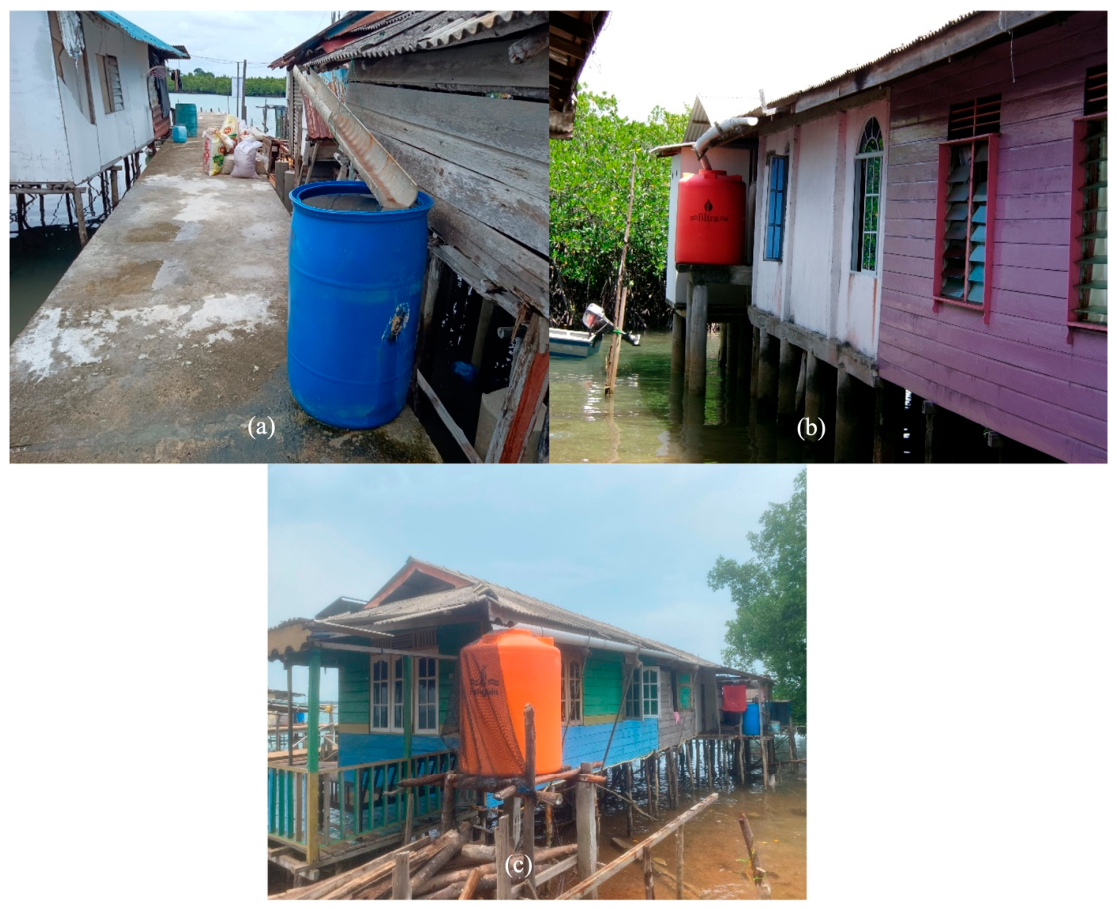
The data on rainwater tank sizes and roof area were obtained from field surveys conducted on both islands from 25 August to 27 September 2024. Ethics approval was obtained from the Ethics Committee of the University of Yamanashi, Japan (Approval No. 2024-006). Prior to the field survey, permission to conduct the study was obtained from the head of the Belakang Padang District. Verbal informed consent was obtained from the neighborhood heads and all other participants after the study objectives, the intended use of the collected data, and the voluntary nature of participation were explained in the local language. No personal identifiers were included in the analysis or reporting. Thirty households were sampled on each island and most were found to use one of three common rainwater tank sizes: 200, 500, or 1000 L. These common rainwater tank types are shown in
Figure 3. Roof areas were estimated by digitizing roof polygons from high-resolution Google Earth imagery and calculating the average roof area of the 30 surveyed households on each island. The same sample size was used on both islands to maintain a consistent survey design, particularly because the Mecan Island has a relatively small population of approximately 100–200 people. The estimated roof areas were treated as approximate effective catchment areas. The average of reservoir (or SWRO) water usage was 61.5 L/person/day, which was close to the household-demand scenarios constructed based on the Indonesian National Standard (SNI) 6728.1-2015, which recommends 60 L/person/day for domestic water demand [
37]. Based on the field surveys, household occupancy on those islands ranged from one to five people. Daily household demand was calculated as (D = 60N), where (D) is the household water demand (L/day) and (N) is the number of household members. Therefore, demand scenarios were therefore set for households of one to five people at 60–300 L/day, assuming that RWH was their sole water source. The storage performance analysis was conducted using daily rainfall data for all months in each representative year. Annual system performance was also assessed through full-year simulations for the reliability analysis and by using long-term rainfall records in the WSE assessment.
2.4. Rainwater Supply Reliability Assessment Under Demand and Storage Scenarios
Reliability was defined as the percentage of simulation days on which the RWH system fully satisfied household water demand. This definition is consistent with previous RWH studies that evaluated reliability as the proportion of days on which harvested rainwater is sufficient to meet the intended demand under varying rainfall conditions [
32].
The analysis was conducted for the Belakang Padang and Mecan Islands for a representative wet year (2023) and dry year (2019). Daily precipitation data for the full representative years were used in the simulations. Standardized household tank sizes were evaluated under daily household water demand scenarios (
Table 1).
Daily inflow to the storage tank was estimated from the precipitation, the roof catchment area, and the runoff coefficient. Household demand was subsequently deducted from the available storage each day to determine whether the system could fully satisfy daily water requirements. A day was considered successful when the available stored rainwater was equal to or greater than the corresponding daily water demand. Reliability was then calculated as:
where N
s is the number of days on which household demand was fully met and N
t is the total number of simulated days. Therefore, reliability represents the proportion of time during which households could depend entirely on harvested rainwater without requiring supplementary water sources.
2.5. Water Saving Efficiency (WSE) Analysis
In this study, household tank scenarios are presented in liters (L) for practical readability, whereas storage variables used in the WSE analysis are expressed in cubic meters (m3) to maintain consistency with SI-based ratio calculations. The WSE analysis was conducted using daily precipitation data from 1994 to 2023 to evaluate the long-term potential of household RWH systems to offset domestic water demand.
The WSE, originally proposed by Dixon et al. ([
38]) and modified by Han & Ki ([
33]), was calculated as (Equation (8)):
where
T is the final time interval, Y
t is the rainwater supplied on day
t (equivalent to Q
out,t − Q
shortage,
t) S
T is the final storage volume at the end of the simulation, and Q
out,
t is the water demand on day
t. WSE value greater than 1.0 indicates that the total harvested rainwater is theoretically sufficient to offset household demand over the analysis period. However, daily shortages may still occur depending on rainfall timing, storage capacity, and dry period duration. The input values used for the WSE analysis were based on the scenarios presented in
Table 1.
2.6. Sensitivity Analysis on Runoff Coeffcients
A sensitivity analysis was conducted to evaluate changes in the mean reliability and water saving efficiency (WSE) under runoff coefficients of 0.70, 0.85, and 0.95. For each runoff coefficient, the mean reliability and WSE were calculated by averaging the results across all tank-capacity scenarios (200–1000 L) and household water demand scenarios (60–300 L/household/day) presented in
Table 1.
3. Results
3.1. Storage Performance During the Representative Wet and Dry Years
Three rainwater tank volumes were considered in the model: 200, 500, and 1000 L. These storage sizes were applied to simulate household water-storage performance on the islands of Belakang Padang and Mecan during wet (2023) and dry (2019) years. In each case, daily harvested rainwater was calculated from precipitation, roof catchment area, and the runoff coefficient, while the maximum storage was constrained by the tank capacity.
3.1.1. Belakang Padang Island
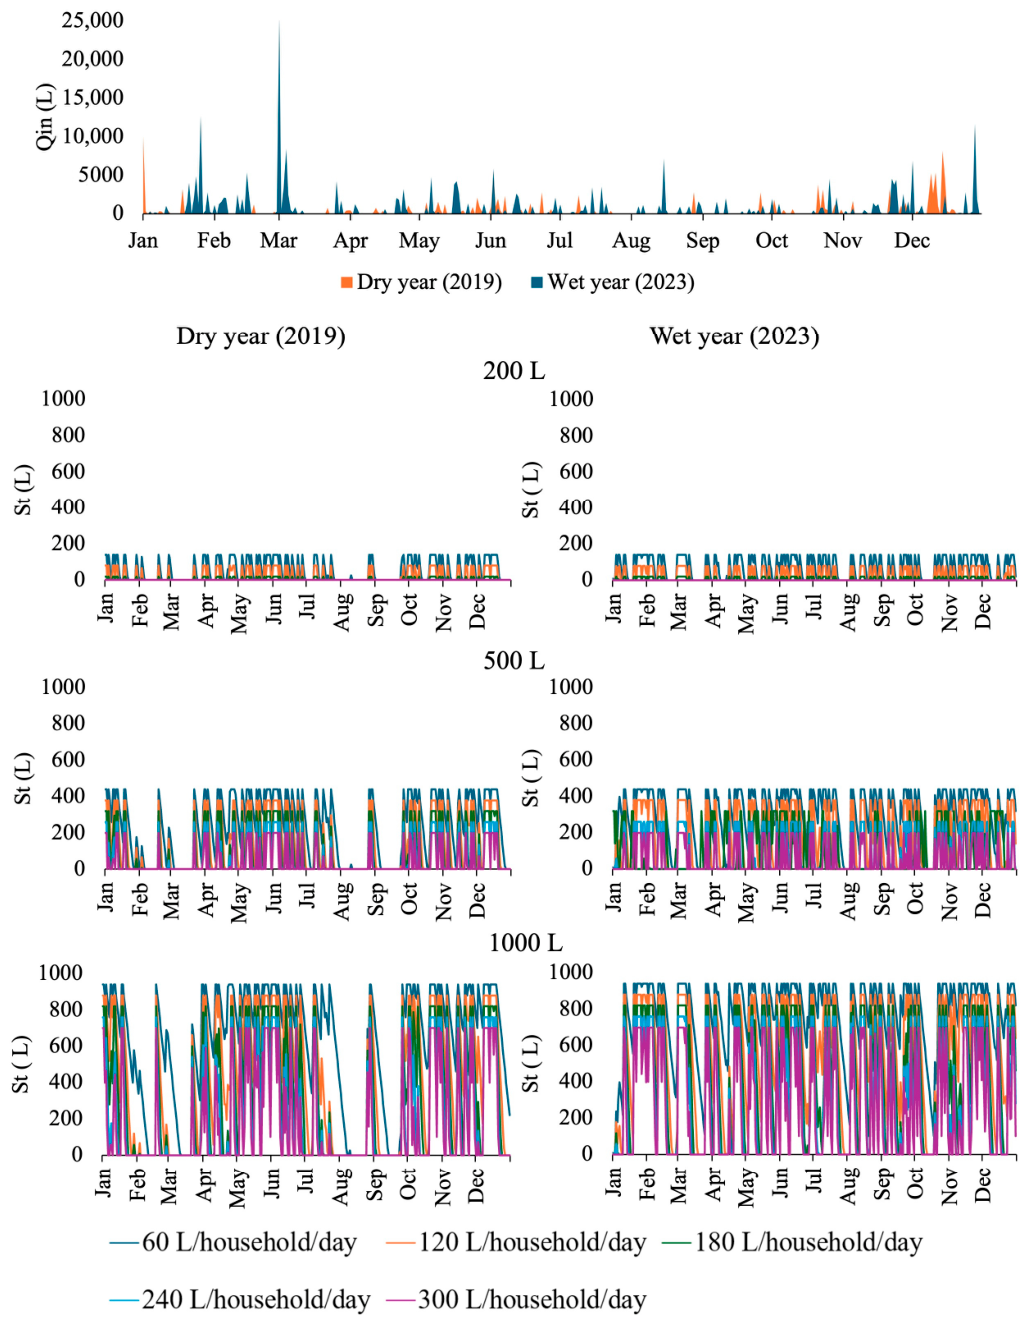
The daily RWH dynamics for the Belakang Padang Island are shown in
Figure 4. Rainwater inflow (Q
in) was intermittent in both years, but rainfall events were generally more frequent and produced larger inflows in 2023, including the highest inflow event in March. These differences affected the frequency with which the tanks were replenished. For the 200 L tank, storage was rapidly depleted under nearly all household-demand scenarios and remained close to zero for much of the year, especially in dry year. Although rainfall temporarily increased the stored volume, the small tank capacity and continuous daily demand caused the available water to be consumed soon after each rainfall event. Thus, the 200 L tank provided only limited short-term storage, even during the wet year.
Tank capacity of 500 L and 1000 L improved storage continuity by allowing a larger portion of the harvested rainwater to be retained between rainfall events. The 500 L tank showed more frequent and longer periods of available storage than the 200 L tank, although repeated depletion remained evident during prolonged low-rainfall periods, particularly in the dry year. The 1000 L tank provided the best performance and maintained relatively high storage levels for longer periods, especially under demands of 60–180 L/household/day. However, storage still periodically declined to zero when rainfall was insufficient or household demand was high, particularly at 240 and 300 L/household/day. Overall, the results indicate that RWH performance on the Belakang Padang Island was better during the wet year, while larger tank capacity and lower household demand increased the ability of the system to maintain water availability between rainfall events.
3.1.2. Mecan Island
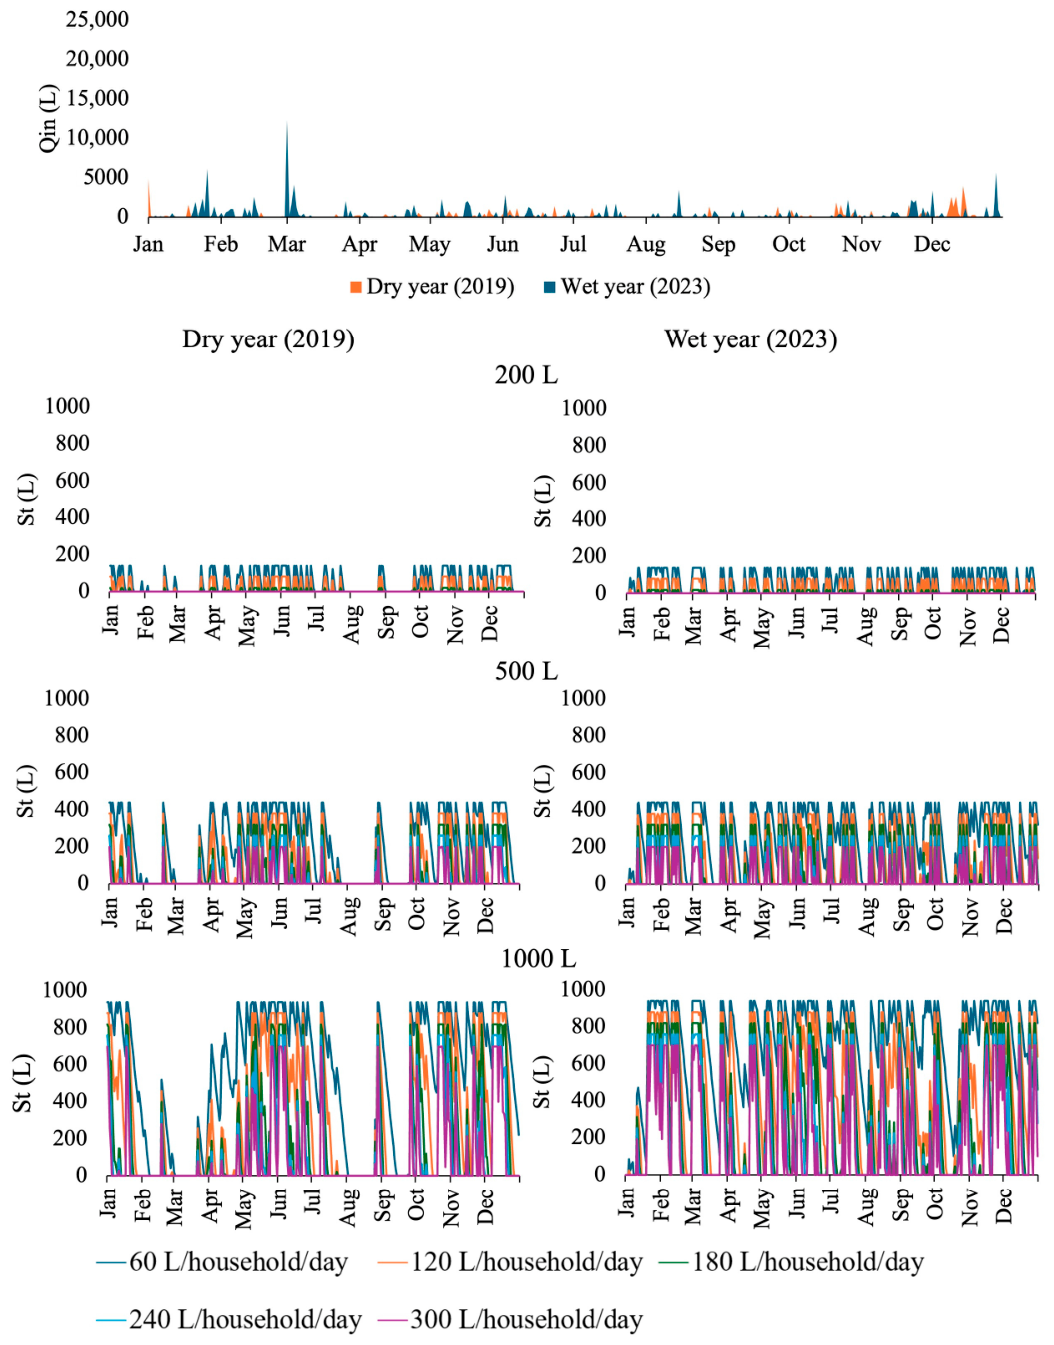
The daily storage dynamics for the Mecan Island are shown in
Figure 5. Q
in was similar to that observed for the Belakang Padang Island because the same rainfall pattern was used in the simulation. However, the Q
in volume was lower in Mecan because its assumed roof catchment area was smaller than that of Belakang Padang. Rainwater inflow remained intermittent in both years, although replenishment events were more frequent and generally larger in the wet year. The 200 L tank remained close to empty under most household-demand scenarios because the stored water was rapidly consumed after each rainfall event. Increasing the tank capacity to 500 L improved water retention, particularly under demands of 60–180 L/household/day. Nevertheless, repeated depletion occurred during extended low-rainfall periods, especially around March–April and August–September in the dry year. The 1000 L tank provided the greatest buffering capacity and retained water for longer periods, although it was still periodically depleted under the higher-demand scenarios of 240 and 300 L/household/day.
Compared with the Belakang Padang Island, the smaller catchment area in Mecan reduced the quantity of rainwater collected during each rainfall event, despite the similar temporal pattern of Qin. Consequently, the tanks in Mecan were replenished with smaller water volumes, and stored water was generally depleted more rapidly between rainfall events. This difference was particularly evident for the 200 L and 500 L tanks, which provided limited storage continuity under moderate and high household demands. The 1000 L tank improved storage performance on both islands, but Belakang Padang generally maintained higher storage levels because its larger catchment area generated greater harvested inflow. Overall, lower roof catchment area in the Mecan Island worsen the rainwater storage performance in that area.
3.1.3. Overflow Percentage
Annual overflow varied considerably between the two islands and across rainfall conditions (
Table 2). The overflow percentage was calculated by dividing the total annual overflow volume (Q
overflow) by the total annual harvested rainwater volume Qin. The lower and upper values in each cell represent the minimum and maximum overflow percentages obtained across the examined tank-capacity and household-demand scenarios, respectively. During the dry year (2019), overflow ranged from 59.4% to 90.2% on the Belakang Padang Island and from 38.3% to 80.5% on the Mecan Island. During the wet year (2023), the corresponding ranges increased to 72.2–93.8% and 52.8–87.3%, respectively. For equivalent tank-capacity and household-demand scenarios, overflow during the wet year was 3.6–12.8 percentage points higher on Belakang Padang and 6.9–16.0 percentage points higher on Mecan than during the dry year. The higher overflow in 2023 resulted from the greater rainfall input, which caused the tanks to reach their maximum storage capacities more frequently. Belakang Padang consistently exhibited higher overflow percentages than Mecan because its larger roof catchment area generated a greater volume of harvested rainwater relative to the same tank capacities.
3.2. Effect of Household Demand and Tank Size on Rainwater Supply Reliability
The reliability analysis (
Table 3) revealed that household RWH performance varied strongly according to rainfall condition, tank size, roof catchment area, and household demand. Reliability was consistently higher in the wet year than in the dry year for both Belakang Padang and Mecan, indicating that interannual rainfall variability strongly controls RWH performance. In the wet year, increasing the tank size from 200 to 1000 L clearly improved reliability across most household-demand scenarios. This improvement was especially visible for one- and two-person households, where larger tanks could store more rainfall and therefore fully meet daily household demand for longer.
Reliability decreased as household demand increased. For the same island, tank size, and rainfall condition, one-person households consistently displayed the highest reliability, while five-person households had the lowest reliability. This pattern indicates that the same RWH system becomes less effective when daily water demand increases. In several high-demand scenarios, especially with a 200 L tank, reliability remained very low or even reached 0%, indicating that small tanks are insufficient for larger households.
Belakang Padang consistently exhibited higher reliability than Mecan under equivalent tank-size and demand scenarios. For example, in the wet year, a 1000 L tank and a demand of 300 L/day provided reliability of 57.3% on Belakang Padang compared with 42.5% on Mecan. In the dry year, the reliability percentages were 39.5% and 24.4%, respectively. These differences reflect the larger average roof catchment area on Belakang Padang, which enabled more rainfall to be captured and stored from the same rainfall event.
Overall, reliability was 31–99.2% and 22.7–87.7% on Belakang Padang during the wet and dry years, respectively. On Mecan, reliability was 25.2–98.6% in the wet year and 15.3–81.4% in the dry year. Because reliability represents the percentage of days on which household water demand was fully satisfied by harvested rainwater, these values indicate substantial differences in the contribution of RWH to household water supply under varying rainfall conditions. Reliability declined markedly in dry years with increasing household demand, demonstrating that household RWH alone may be insufficient to provide a continuous year-round domestic water supply on very small islands.
3.3. The Water Saving Efficiency of Current Rainwater Harvesting Systems
The WSE values for all tank capacities and demand scenarios are shown in
Table 4. WSE decreased consistently as household demand increased from 60 to 300 L/day because the available rainwater represented a smaller proportion of the total water requirement. This effect remained evident even with a 1000 L tank: during the wet year, WSE declined from 1.029 to 0.628 on Belakang Padang and from 1.024 to 0.515 on Mecan. Conversely, at a fixed demand, WSE increased with tank capacity because larger tanks retained more water for later use. For example, at 120 L/day in 2023, increasing capacity from 200 to 1000 L raised WSE from 0.480 to 0.925 on Belakang Padang and from 0.456 to 0.890 on Mecan.
Across all scenarios, WSE was higher in the wet year than in the dry year because of greater rainfall input and more frequent tank replenishment. Belakang Padang generally recorded slightly higher values than Mecan due to its larger catchment area. Values above 1.00 under the lowest demand wet-year scenarios indicate that annual demand was fully met and some water remained in storage.
3.4. Sensitivity Analysis of the Runoff Coefficient
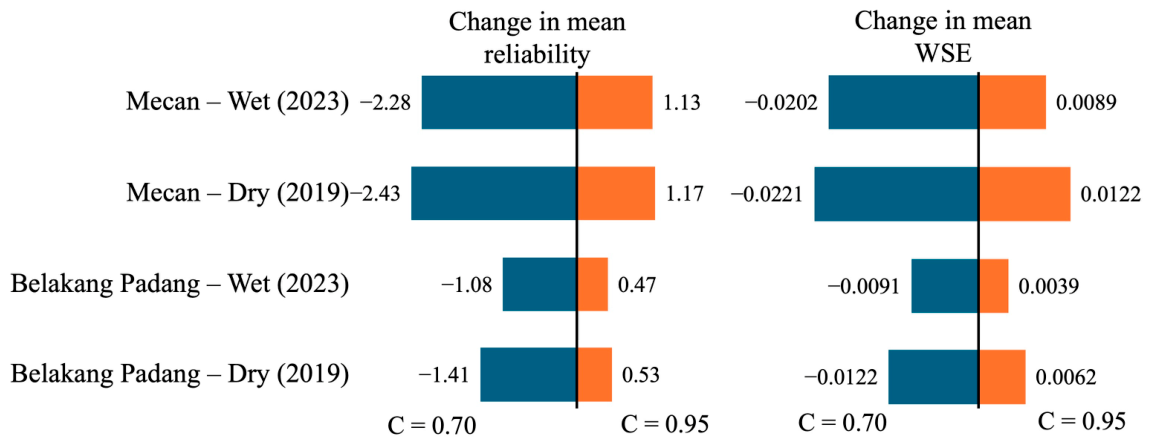
Figure 6 shows that reducing the runoff coefficient from 0.85 to 0.70 decreased both mean reliability and modified WSE, whereas increasing it to 0.95 produced modest improvements. Belakang Padang experienced mean reliability changes of −1.41 and −1.08 percentage points in the dry and wet years, respectively, while modified WSE decreased by 0.0122 and 0.0091. In Mecan, the corresponding reductions were larger, with reliability decreasing by 2.43 and 2.28 percentage points and modified WSE decreasing by 0.0221 and 0.0202. Increasing the coefficient to 0.95 improved reliability by 0.47–1.17 percentage points and modified WSE by 0.0039–0.0122. Overall, Mecan was more sensitive to runoff-coefficient changes, but the general performance pattern remained unchanged.
4. Discussion
4.1. Influence of Tank Capacity and Rainfall Variability
In the wet year, both islands experienced several rainfall events that rapidly increased harvested rainwater amounts and refilled storage tanks. At several points throughout the year, harvested volumes exceeded the capacities of the 200- and 500 L tanks and, during particularly intense rainfall events, even the 1000 L tanks. These results indicate that while wet conditions improved rainwater availability, limited storage capacity still led to overflow losses during intense rainfall events. Larger tanks reduced these losses and extended water availability during subsequent rainless periods, supporting previous findings that increased storage capacity improves RWH performance by buffering short-term rainfall variability [
39].
In contrast, storage performance was more constrained during the representative dry year (2019). Lower rainfall availability and longer rainless periods reduced opportunities for tank replenishment, causing storage to remain low for extended periods. Under these conditions, the 200 L tanks were depleted rapidly after rainfall events, particularly under the higher-demand scenarios. Although the 500 and 1000 L tanks retained stored water for longer, their ability to improve performance was limited by the amount of rainfall available for collection. Similar conclusions have been reported for small island RWH systems, where increasing storage alone cannot fully compensate for prolonged dry conditions [
38].
Among the evaluated storage options, the 1000 L tanks provided the greatest storage benefit. Under low- to moderate-demand conditions they stored more water during major rainfall events and extended water availability through subsequent rainless periods on both islands. However, even these larger tanks could not continuously satisfy high household demands, particularly during prolonged dry periods. This demonstrates that storage expansion can improve RWH performance, but its effectiveness remains limited depending on rainfall availability and household water demand.
4.2. Effect of Household Demand, Catchment Area, and Tank Size on Rainwater Supply Reliability and WSE
The rainwater supply reliability and WSE results indicate that system performance was strongly influenced by both household water demand and storage capacity. Reliability and WSE were generally higher in low-demand scenarios and declined progressively as daily household demand increased from 60 to 300 L/day. Larger storage tanks improved annual reliability across all scenarios by retaining more water during rainfall events and supplying water during subsequent rainless periods. However, continuous year-round household water supply was not achieved under high-demand conditions, particularly during the representative dry year. The islands of Belakang Padang and Mecan are located in close proximity and therefore experience broadly similar rainfall conditions. However, their household RWH performance differs because of differences in average roof catchment areas and storage characteristics. Belakang Padang had an average roof area of 100 m2, whereas Mecan had a smaller average roof area of 48 m2. Because the volume of harvested rainwater is directly proportional to rainfall, roof area, and runoff coefficient, the larger roof area on Belakang Padang generated a greater rainwater inflow from the same rainfall event.
Based on the sensitivity analysis, changes in the runoff coefficient produced greater variability in WSE on Mecan than on Belakang Padang. This greater sensitivity is primarily related to Mecan’s smaller roof catchment area, which limits the volume of rainwater collected. Consequently, changes in collection efficiency have a stronger effect on the amount of water available for storage and use, causing larger relative changes in WSE.
The reliability and WSE results indicate that Belakang Padang consistently achieved higher reliability than Mecan under equivalent tank-size and household-demand scenarios. For example, in the wet year with a 1000 L tank and a household demand of 300 L/day, reliability and WSE reached 57.3% and 0.628 on Belakang Padang compared with 42.5% and 0.515 on Mecan. In the dry year, the reliability percentages declined to 39.5% and 24.4%, respectively (0.451 and 0.331 for WSE). These differences are primarily explained by the larger average roof catchment area on Belakang Padang, which enabled more rain to be captured and stored from the same precipitation event. In contrast, the smaller roof catchment area on Mecan limited tank replenishment and reduced the benefits gained from increasing storage capacity.
4.3. The Practical Limitations of Household Rainwater Harvesting
Reliability above 98% and WSE of approximately 1.0 was achieved with a 1000 L tank under the lowest demand scenario of 60 L/household/day during the wet year. However, this condition may not represent many existing households in the study area. Field observations indicated that households on the study islands commonly consisted of three to five people, corresponding to a daily water demand of approximately 180–300 L/day. Under these levels of demand, WSE remains below 1.0 and reliability below 98%. This indicates that existing RWH systems are generally insufficient to function as the only household water source, especially when roof area and tank capacity are limited.
Increasing rainwater tank capacity improved WSE, reliability, and overall storage performance. The overflow results presented in
Table 2 show that overflow still occurred even with a 1000 L tank, suggesting that additional rainwater could be captured with greater storage capacity. Nevertheless, increasing tank capacity alone may not ensure annual water self-sufficiency for households with high water demand. RWH performance depends not only on storage volume but also on rainfall amount and distribution, roof catchment area, and household water consumption. During prolonged dry periods, even a large tank may become depleted when rainfall input is limited and demand remains high. Therefore, the primary limitation of existing household RWH systems is not the technology itself, but the mismatch among household water demand, roof catchment area, rainfall availability, and storage capacity.
4.4. The Role of Rainwater Harvesting as a Supplementary Water Source on Very Small Islands
RWH performance is strongly affected by rainfall limitation (rainfall variability), and design limitation (household demand, roof catchment area, and tank capacity). This agrees with several studies. Basinger et al. [
40] showed that RWH performance depends on the combined effects of rainfall patterns, roof catchment area, storage volume, and water demand. Based on a study by Feloni and Nastos [
19] on the Greek islands of Fourni and Nisyros, system reliability was strongly controlled by local rainfall conditions, roof catchment area, household size, and storage capacity.
The combined results of the storage performance, rainwater supply reliability, and WSE analyses reveal that household RWH cannot be considered a dependable independent source of domestic water supply on very small islands. This interpretation is supported by previous work showing that household RWH is best treated as an alternative source that complements primary supplies rather than replacing them [
33]. In practical terms, this is especially relevant because many households on both islands are already connected to freshwater reservoirs or SWRO systems. However, these centralized systems remain vulnerable to maintenance interruptions, technical failures, and delays in the supply of replacement parts [
6]. During such periods, stored rainwater can provide a temporary buffer for essential household needs.
The results suggest that the most realistic role of RWH on the Belakang Padang and Mecan Islands is as a supplementary or backup water source within a broader water supply system. RWH can provide a more affordable alternative to externally supplied water, particularly because water hauling may cost up to fifteen times more than reservoir water [
41]. However, although many households still have RWH systems installed, their routine use has declined, especially on the Belakang Padang Island, where only a small proportion of respondents reported continued reliance on harvested rainwater [
7]. This decline appears to reflect increasing dependence on centralized water supply system, which are perceived as more stable and convenient than household-level RWH. Nevertheless, RWH remains an important alternative source during supply interruptions, drought periods, or other emergencies. Therefore, greater efforts are needed to encourage residents, particularly on the Belakang Padang Island, to maintain and use their existing RWH systems as part of a diversified household water supply strategy.
Government support is also needed to improve the reliability of RWH systems on the Belakang Padang and Mecan Islands. Many residents of both islands work as fishers, an occupation generally associated with relatively low and uncertain household income [
8]. Consequently, increasing tank capacity or expanding roof catchment areas may be financially difficult for individual households. Government assistance could help overcome these limitations by providing subsidies, suitable storage tanks, improved gutters and conveyance systems, or financial support for expanding effective catchment areas. Such interventions would increase the amount of rainwater that can be collected and stored, reduce overflow during wet periods, and improve water availability during prolonged dry periods. Government-supported RWH improvement programs could therefore strengthen household water security while reducing dependence on more expensive water-hauling services.
4.5. Limitations and Future Work
This study was based on modeled RWH scenarios using representative wet and dry years, together with assumed catchment area, tank size, runoff coefficient, and household demand parameters. Although this approach is useful for comparing system performance under different rainfall and demand conditions, actual household outcomes may vary because of differences in water-use behavior, maintenance levels, roof condition, first flush losses, and system operation. Additionally, rainfall data were obtained from the nearest long-term BMKG station on the Batam Island, which may not fully capture small-scale rainfall variability between Belakang Padang and Mecan. Simplification of inflow and overflow may also lead to an underestimation of water shortages because the model does not account for inflow delays, gutter capacity constraints, or other water losses.
Moreover, digitization of roof area may not reflect the real catchment area because roof boundaries may be affected by satellite image resolution, roof overhangs, shadows, and manual interpretation during digitization. The water demand was also assumed only from RWH. Although the household survey identified the use of PDW and reservoir as one of the water sources, PDW and reservoir water consumption was not deducted from the modeled RWH demand for simplification. In practice, households may have lower demand for rainwater. Water quality was also not evaluated, although roof runoff quality, storage hygiene, and first-flush management are important for domestic RWH use. The January storage simulation represents short-term storage behavior under selected wet and dry years, while annual reliability and WSE provide broader performance indicators. Future studies should conduct long-term monitoring of household RWH systems, water quality assessments, partial-satisfaction, uncertainty, economic feasibility analyses of storage expansion, and climate change impact assessments using projected rainfall scenarios.
5. Conclusions
This study modeled the performance of household RWH systems on two very small Indonesian islands, Belakang Padang and Mecan, during a representative wet year (2023) and dry year (2019). The results reveal that RWH performance is controlled by the combined effects of rainfall variability, storage capacity, roof catchment area, and household water demand.
The storage performance and reliability, and water saving efficiency analyses showed that rainfall availability was the primary factor influencing system performance. In the wet year, frequent rainfall events replenished storage tanks and improved water availability, while larger tanks reduced overflow losses and extended water availability during rainless periods. In contrast, the lower rainfall availability during the dry year substantially reduced system performance, and increasing the storage capacity alone could not fully compensate for the limited rainfall input. Reliability and water saving efficiency declined as household water demand increased and was consistently higher on Belakang Padang than on Mecan because of the larger roof catchment area available for rainwater collection.
Overall, the findings indicate that household RWH should not be considered an independent domestic water supply system on very small islands. Instead, its most practical role is as a supplementary or backup water source that enhances household water security during periods of limited water availability or temporary disruptions to centralized supply systems. For the Belakang Padang and Mecan Islands, reintroducing RWH and improving household RWH through appropriate storage capacity and effective use of the available roof catchment area are part of a broader strategy to strengthen water security on very small islands under variable rainfall conditions and possible future climate uncertainty.