Article

Recharge of Shallow Groundwater in Alluvial Aquifers in the Humid Region of Central China: A Case Study of the Zishui Plain in the Dongting Lake Area


School of Environmental Studies, China University of Geosciences, Wuhan 430078, China
*
Author to whom correspondence should be addressed.
Water 2026, 18(15), 1871; https://doi.org/10.3390/w18151871
Submission received: 11 May 2026 / Revised: 12 July 2026 / Accepted: 27 July 2026 / Published: 1 August 2026
(This article belongs to the Section Hydrogeology)

Abstract

The Dongting Basin in central China has experienced increasing pressure on water resources due to intensified industrial and agricultural activities and increasingly frequent droughts. Therefore, reliable estimates of groundwater recharge are essential for evaluating the sustainability of groundwater resources in this region. An integrated approach combining the water table fluctuation (WTF), groundwater age, and chloride mass balance (CMB) was applied to estimate groundwater recharge in the Quaternary aquifer of the Zishui Plain, a sub-basin of the Dongting Basin. The mean recharge values derived from these methods were 268.2, 226.2, and 167.03 mm/year, respectively. The corresponding mean R/P ratios were 19.4%, 16.5%, and 12.2%. Differences between the recharge estimates reflect methodological differences among the three approaches and suggest that lithology, river seepage, and human activities contribute to the observed spatial variability in groundwater recharge. The WTF method generally produced the highest recharge estimates, whereas the CMB and groundwater age methods tended to provide lower estimates because of their respective methodological limitations. The integrated application of these methods may provide a more comprehensive assessment of groundwater recharge and may serve as a useful reference for groundwater management in the Dongting Basin.

1. Introduction

Due to population growth, industrial development, and droughts driven by climate change, global water demand has been steadily increasing [1,2,3,4,5]. Consequently, assessing groundwater recharge is crucial for sustainable groundwater management [3,6,7,8]. However, groundwater recharge is influenced by climatic, geological, physiographic, and hydrological factors, resulting in pronounced spatial and temporal variability [1,9,10]; therefore, accurately estimating actual recharge remains one of the major challenges in hydrogeological investigations [4,11,12,13].
Several methods are available for estimating groundwater recharge, including the chloride mass balance (CMB) method [9,14], water table fluctuation (WTF) method [15,16], Darcy’s law [17], soil moisture balance (SMB) [16], baseflow separation (BFS) methods [18], hydrological models (e.g., WetSpass) [19], and groundwater age method [9], which is determined based on several tracers, such as tritium (3H), sulfur hexafluoride (SF6) and chlorofluorocarbons (CFCs). Among these methods, the CMB, WTF, and groundwater age methods are widely used for groundwater recharge estimation.
The CMB method estimates recharge by comparing chloride concentrations in precipitation with those in soil water or groundwater, and it can be applied to both the unsaturated and saturated zones [20,21]. The WTF method calculates recharge by multiplying the rise in the groundwater table by the specific yield (Sy), and it has been widely used to estimate recharge [22,23]. Environmental tracers (e.g., 3H and CFCs) have been used to evaluate the apparent age of groundwater; when combined with information on sampling depth relative to the water table and aquifer porosity, they can be used to estimate groundwater recharge [2].
Each method is applicable over different spatial and temporal scales [4,14,21]. For example, the WTF method is more suitable for estimating local recharge over event-based to annual timescales [1,24], whereas groundwater age and the CMB method provide average recharge estimates over timescales from years to millennia [25,26]. As each method is based on different assumptions, the use of a single recharge estimate may be inappropriate and can lead to overestimation or underestimation of renewable groundwater resources [3,27,28]. Therefore, it is recommended to integrate multiple methods to improve the reliability of recharge assessments [9,19,29,30,31], especially in alluvial aquifers, where the system is highly heterogeneous [1,9]. Numerous studies have applied a variety of methods to estimate groundwater recharge worldwide. However, most of these investigations have focused on semi-arid and arid regions, such as Ethiopia, sub-Saharan Africa, southern Africa, the North China Plain, and the Loess Plateau [3,32,33,34,35]. In contrast, relatively few studies have been conducted in humid, high-precipitation regions, particularly in central China.
The Dongting Basin is located in central China and is one of the important agricultural and industrial bases [36]. In recent years, water resource availability in this region has been under increasing pressure due to industrial and agricultural development, rapid urbanization, and climatic anomalies [36,37,38,39]. The Quaternary aquifer in the region provides a substantial backup water source for millions of residents [40]. However, there is a lack of information regarding groundwater recharge in this area. Recent studies have mainly focused on assessing groundwater quality [41,42,43]; apart from Chang (2023) [44], who investigated the apparent age of shallow groundwater, little is currently known about groundwater recharge in this region.
To better understand the spatial variability of groundwater recharge in the Dongting Basin, the Zishui Plain was selected as a representative study area. This region contains a single groundwater system [45], and its stratigraphic structure is considered representative. In this study, three methods were employed to estimate groundwater recharge: the WTF method, the groundwater age method, and the CMB method. The results obtained from each method were compared to evaluate the reliability of the recharge estimates. The findings of this study are intended to improve the understanding of groundwater recharge processes and to provide insights for the effective development and management of groundwater resources.

2. Materials and Methods

2.1. Study Area

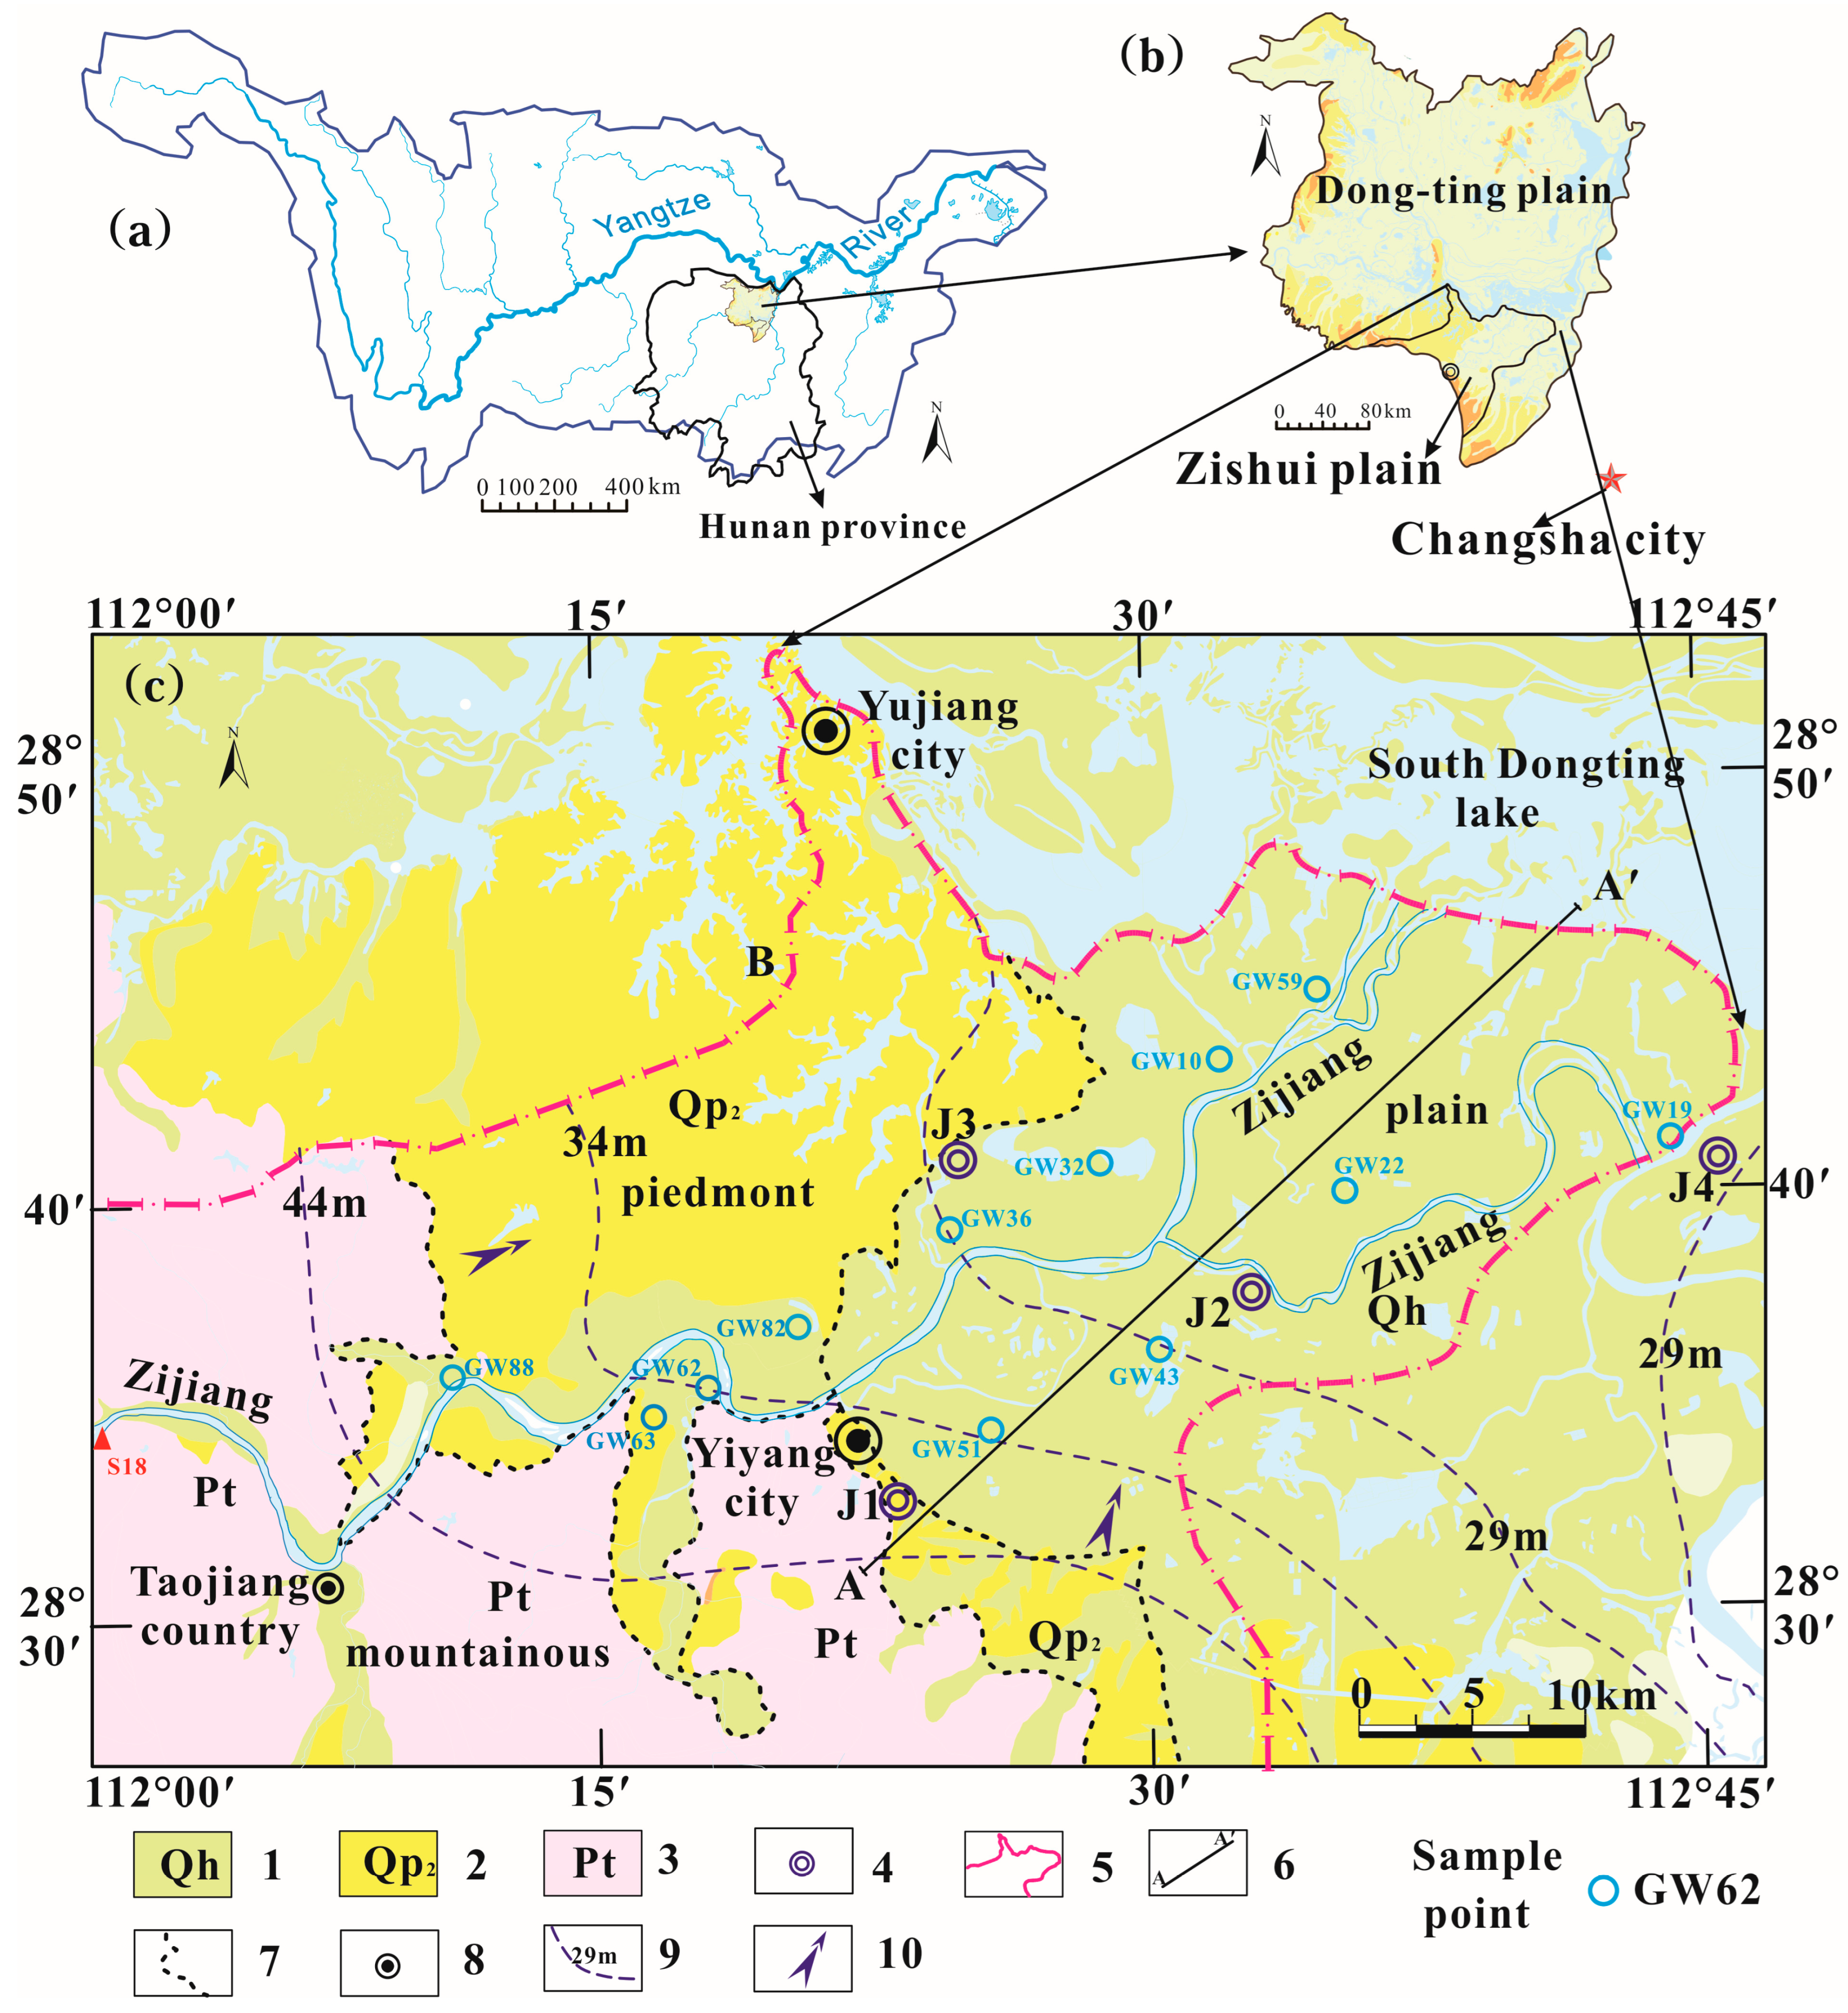
The Dongting Plain, located in the northern part of Hunan Province, China, is one of the largest Quaternary sedimentary basins in the middle Yangtze River region, covering an area of 19,700 km2 [46]. The Zishui Plain, a third-order sub-basin of the Dongting Plain, is located in its southern part [45], with coordinates ranging from 112°00′–112°45′ E and 28°30′–28°50′ N (Figure 1a, b). It covers an area of 1268 km2 and is administratively part of Yiyang City. The Zishui River has a total length of 650 km and an average annual runoff of 2.27 × 10¹⁰ m3. This area has a subtropical monsoon climate with an average annual temperature of 17 °C and an annual precipitation of 1373 mm [42].
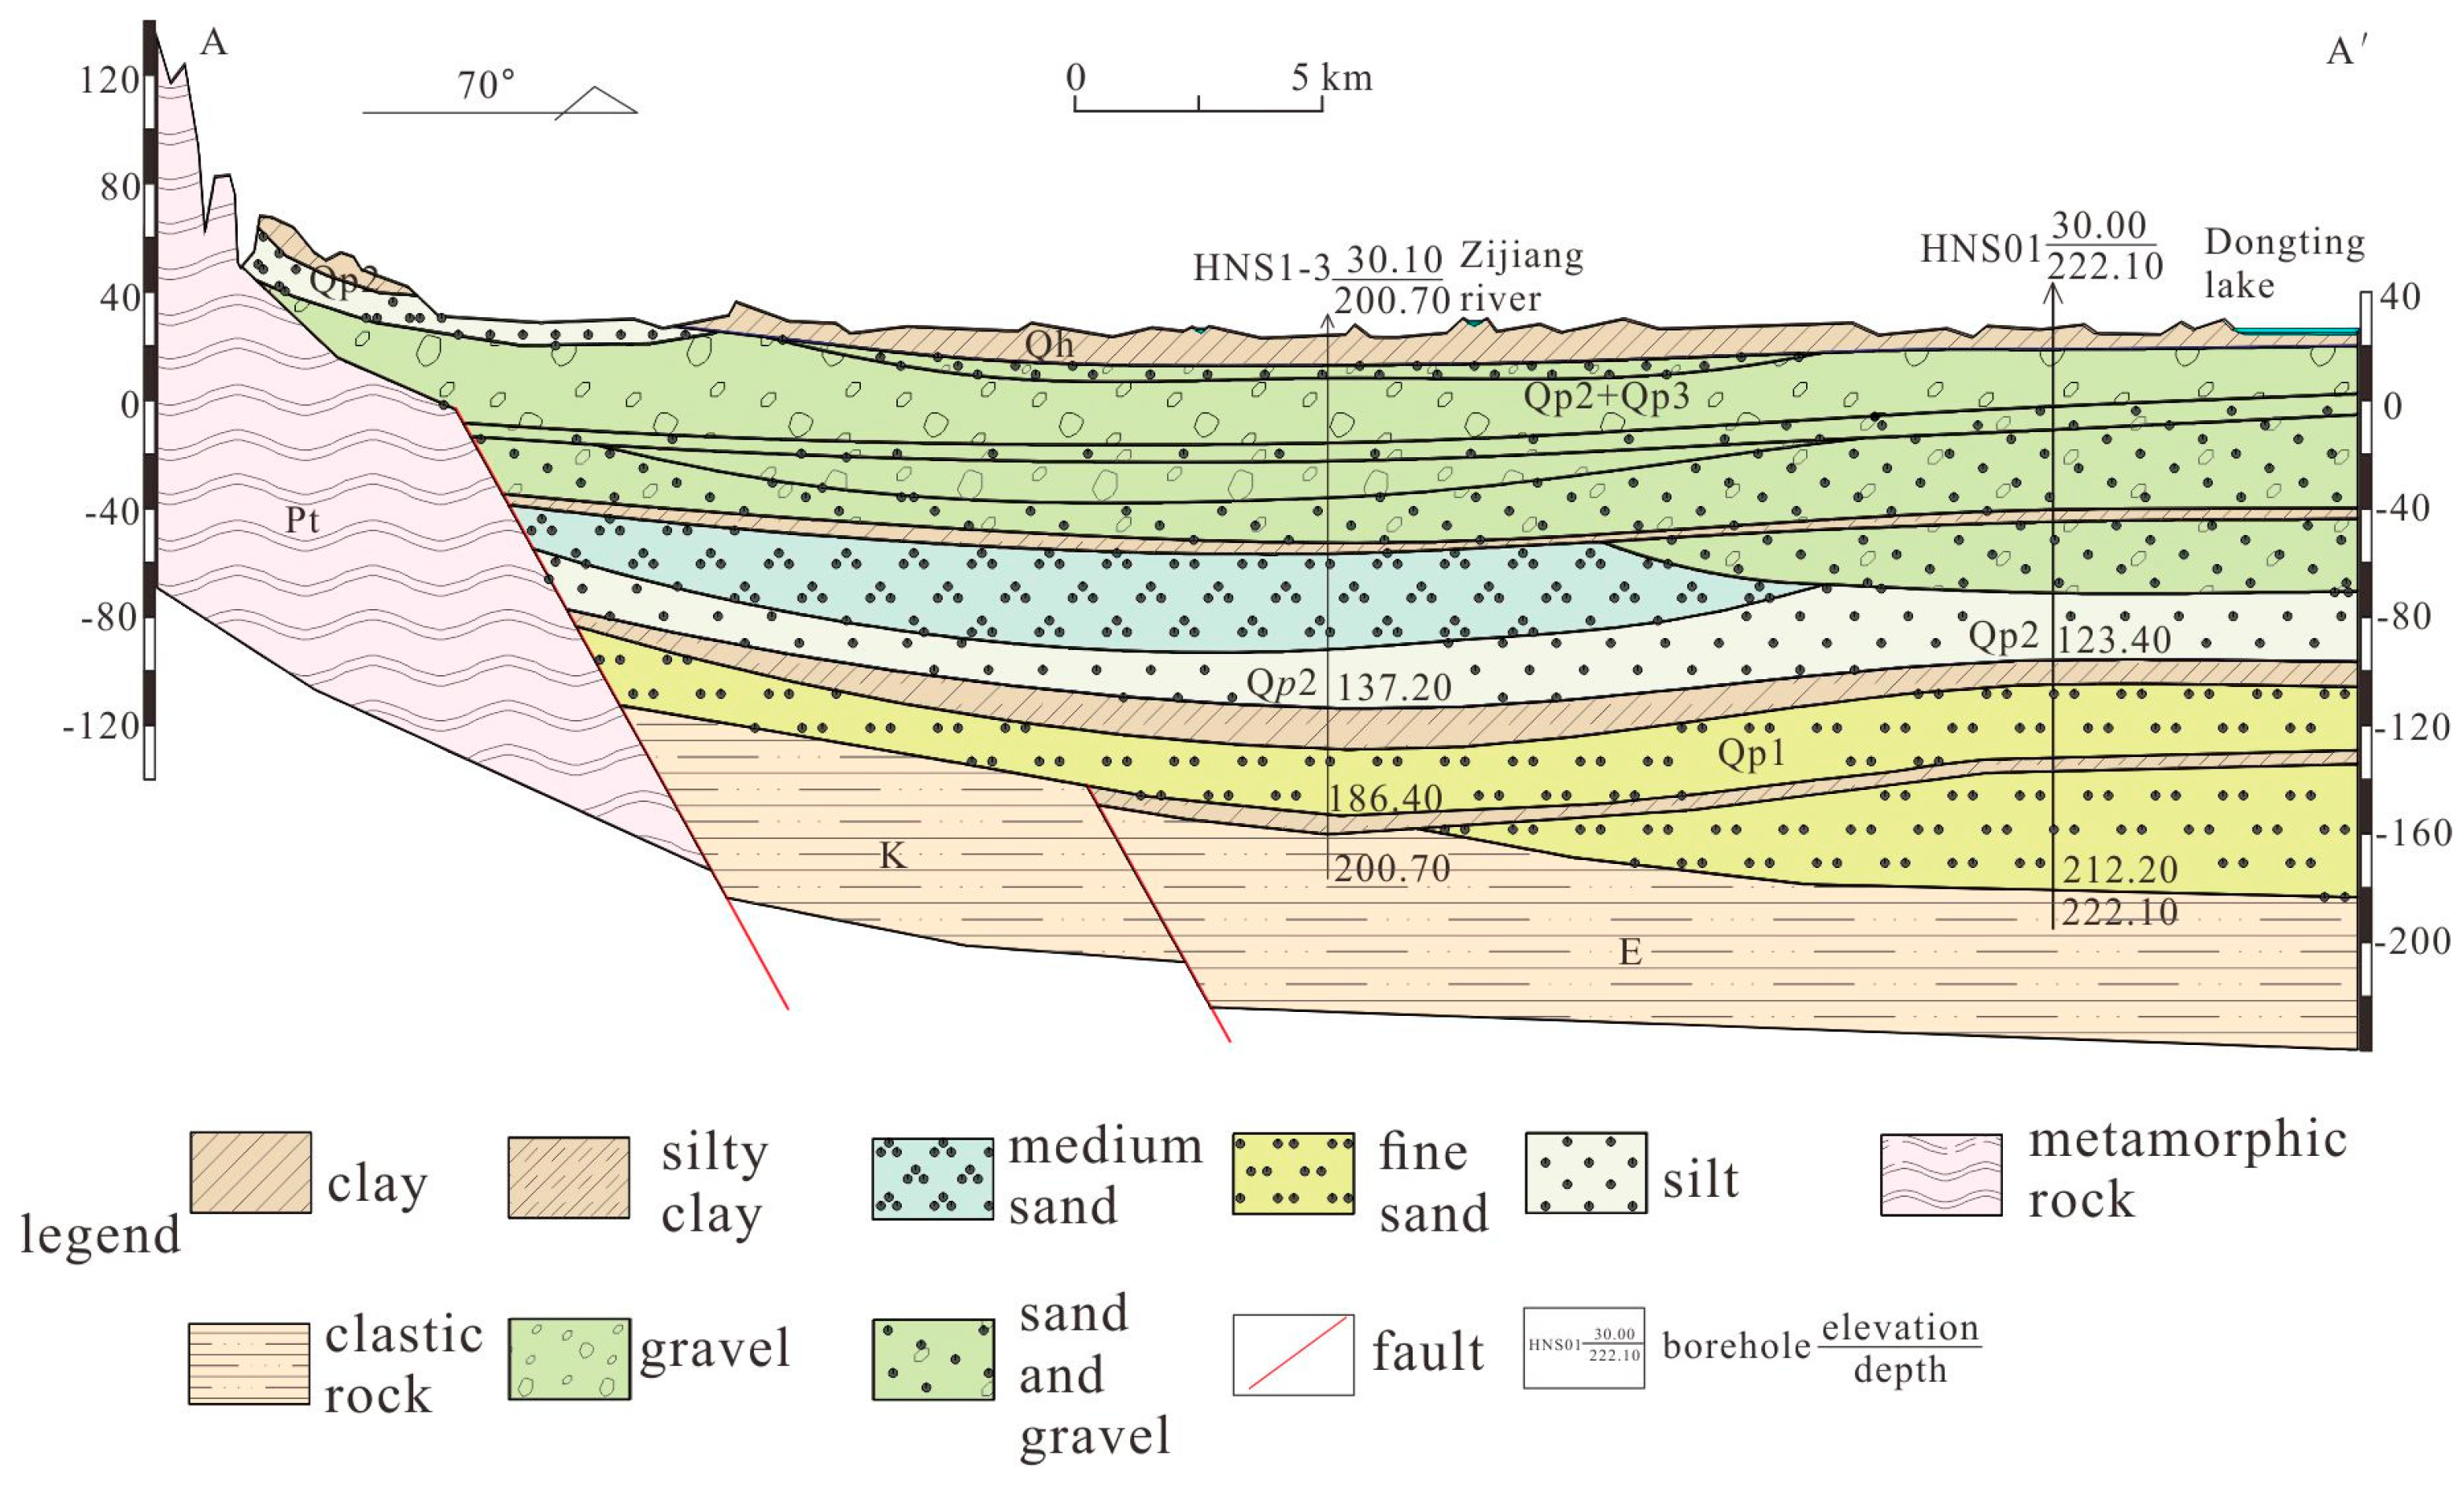
The study area exhibits a topography that slopes from the southwest to the northeast. It can be categorized into three distinct zones based on its geomorphological characteristics: the mountainous area, the piedmont area, and the plain area (Figure 1c). The Quaternary aquifer system can be divided into the Holocene phreatic porous aquifer (Holocene, Qh), the Middle-Upper Pleistocene porous aquifer (Qp2), and the Lower Pleistocene porous-fractured aquifer (Qp1) from top to bottom (Figure 2). Among these, the Middle-Upper Pleistocene porous aquifer is the principal aquifer across the study area and serves as the target aquifer in this study. It is mainly composed of silty clay, clayey silt, and fine- to coarse-grained sand interbedded with gravel [47], with a thickness of approximately 50–150 m [40,45].
The groundwater flow direction is from the edge of the plain towards the center (Figure 1c). The main recharge sources are precipitation and leakage of surface water and lateral subsurface flow from the adjacent aquifer unit. Additional recharge comes from irrigation return flow. The discharge pathway of groundwater in the area includes pumping, evaporation, and lateral runoff.

2.2. Groundwater Recharge Estimation Methods

This study employed three different methods to estimate groundwater recharge: the WTF method, the groundwater age method, and the CMB method. The principles, data sources, sample collection and analysis procedures for each method are described below.

2.2.1. Water Table Fluctuation

The water table fluctuation (WTF) method is one of the most widely used approaches for estimating recharge. The equations are as follows [1,7]:
R = S y h t
where R is the recharge (mm/year), Δ h is the change in the groundwater level over a specific time interval Δ t , and S y is the specific yield (dimensionless).
This method assumes that changes in groundwater table are caused by recharge from precipitation entering the aquifer or discharge from it [7,48]. It also assumes that the specific yield (Sy) remains constant across the entire relevant aquifer system [49]. Δh is determined by extrapolating the antecedent recession curve to the time of recharge, which can be performed either by manually drawing the extrapolation line or by using numerical methods [4,50].
The WTF method is most suitable for estimating recharge in response to individual rainfall events, thereby quantifying “gross recharge.” It can also be applied to seasonal or annual groundwater table fluctuations to estimate “net recharge”. The estimation of “net recharge” does not require the prediction of recession; however, it relies on measurements taken at regular time intervals and at a sufficiently high frequency [50]. Here, Δh denotes the change in groundwater levels between successive water-level measurements [7]. In this study, interannual groundwater table variations were used as an indicator of aquifer recharge, and therefore the analysis focused on annual recharge estimation rather than the short-term response of groundwater levels to individual precipitation events.
Detailed groundwater table dynamics were obtained from the Hunan Hydrology and Water Resources Bureau. Groundwater table data covering the period from January 2019 to December 2021 were used. The depths of the four monitoring wells range from 45.02 to 55.04 m, and their locations are shown in Figure 1c. Precipitation data for the corresponding period were collected from the Changsha meteorological station (approximately 80 km from Yiyang) and obtained from the China Meteorological Data Sharing Service System.

2.2.2. Groundwater Age-Based Recharge Estimation

The apparent age of groundwater can be used to estimate recharge [25,51]; the equations are as follows:
R = φ H / t l n H / ( H z )
where H is the aquifer thickness (mm), φ is the porosity, t is the travel time (years), and z is the depth below the water table (mm).
Ideally, Equation (3) applies to a homogeneous, isotropic, and unconfined aquifer of constant thickness that receives uniform recharge from vertically infiltrating water [6,52].
The CFCs include trichlorofluoromethane (CFC-11), dichlorodifluoromethane (CFC-12), and trichlorofluoroethane (CFC-113), which are synthetic organic compounds produced for a wide range of industrial and domestic applications; they serve as effective tracers of young, modern groundwater [53]. The apparent groundwater age (CFCs) data in the study area were reported by Chang (2023) [44]. Following the methodology outlined by Busenberg and Plummer (2000) [54], Previous study measured the concentrations of CFCs (CFC-11, CFC-12, and CFC-113) in groundwater samples collected from 12 wells (Figure 1c) within the study area [44]. The apparent groundwater ages were then estimated based on Henry’s law, recharge temperature, atmospheric pressure, and the Northern Hemisphere atmospheric mixing ratios. Considering that CFC-11 and CFC-113 are relatively less stable than CFC-12 under subsurface conditions [55] and may be subject to degradation [44], the apparent ages derived from CFC-12 were adopted as the primary basis in this study.

2.2.3. Chloride Mass Balance Method

The Chloride Mass Balance (CMB) method is widely used to estimate long-term groundwater recharge [20,27]. This method calculates recharge by comparing the deposition flux of chloride (Cl) at the land surface with its concentration in groundwater. The equation is given by the following:
R = P C l p C l g w
where R is the annual groundwater recharge (mm/year), P is the mean annual precipitation (mm/year), C l p is the chloride concentration in precipitation (mg/L), and C l g w is the chloride concentration in groundwater (mg/L).
This method is based on the following assumptions: (1) precipitation is the sole source of chloride (Cl); (2) chloride behaves conservatively along groundwater flow paths, with no alteration in its concentration; (3) there are no additional sources of chloride in the subsurface or aquifer (e.g., from urban or industrial waste, mining activities, rock weathering, or fertilizers); and (4) surface runoff is negligible or absent [56,57,58].
Groundwater samples for chloride analysis were collected along the groundwater flow path during December 2021 (simultaneously with the CFC samples), with a total of 12 samples collected. The water temperature (T), electrical conductivity (EC), pH, and dissolved oxygen (DO) of the samples were measured in the field using a portable water quality analyzer (WTW 3630 IDS, WTW GmbH, Wuppertal, Germany), with accuracies of 0.1 °C, 1 µS/cm, 0.01 pH units, and 0.01 mg/L, respectively. All water samples were collected in pre-cleaned polypropylene bottles and were filtered through 0.45 μm nitrocellulose membranes. Samples were acidified to pH < 2 by adding concentrated HNO3 (1% by volume HNO3) for cation analysis. Alkalinity was determined in the field by titrating 20 mL of water sample with 0.05 N HCl. All samples were sealed with Parafilm and stored at 4 °C before analysis. Chloride (Cl) concentrations were determined using an ion chromatograph (Dionex ICS-1100, Thermo Fisher Scientific Inc., Waltham, MA, USA) with an analytical precision of 0.1 mg/L. All analyses were conducted at China University of Geosciences, Wuhan, China.

3. Results

3.1. Groundwater Table Fluctuation

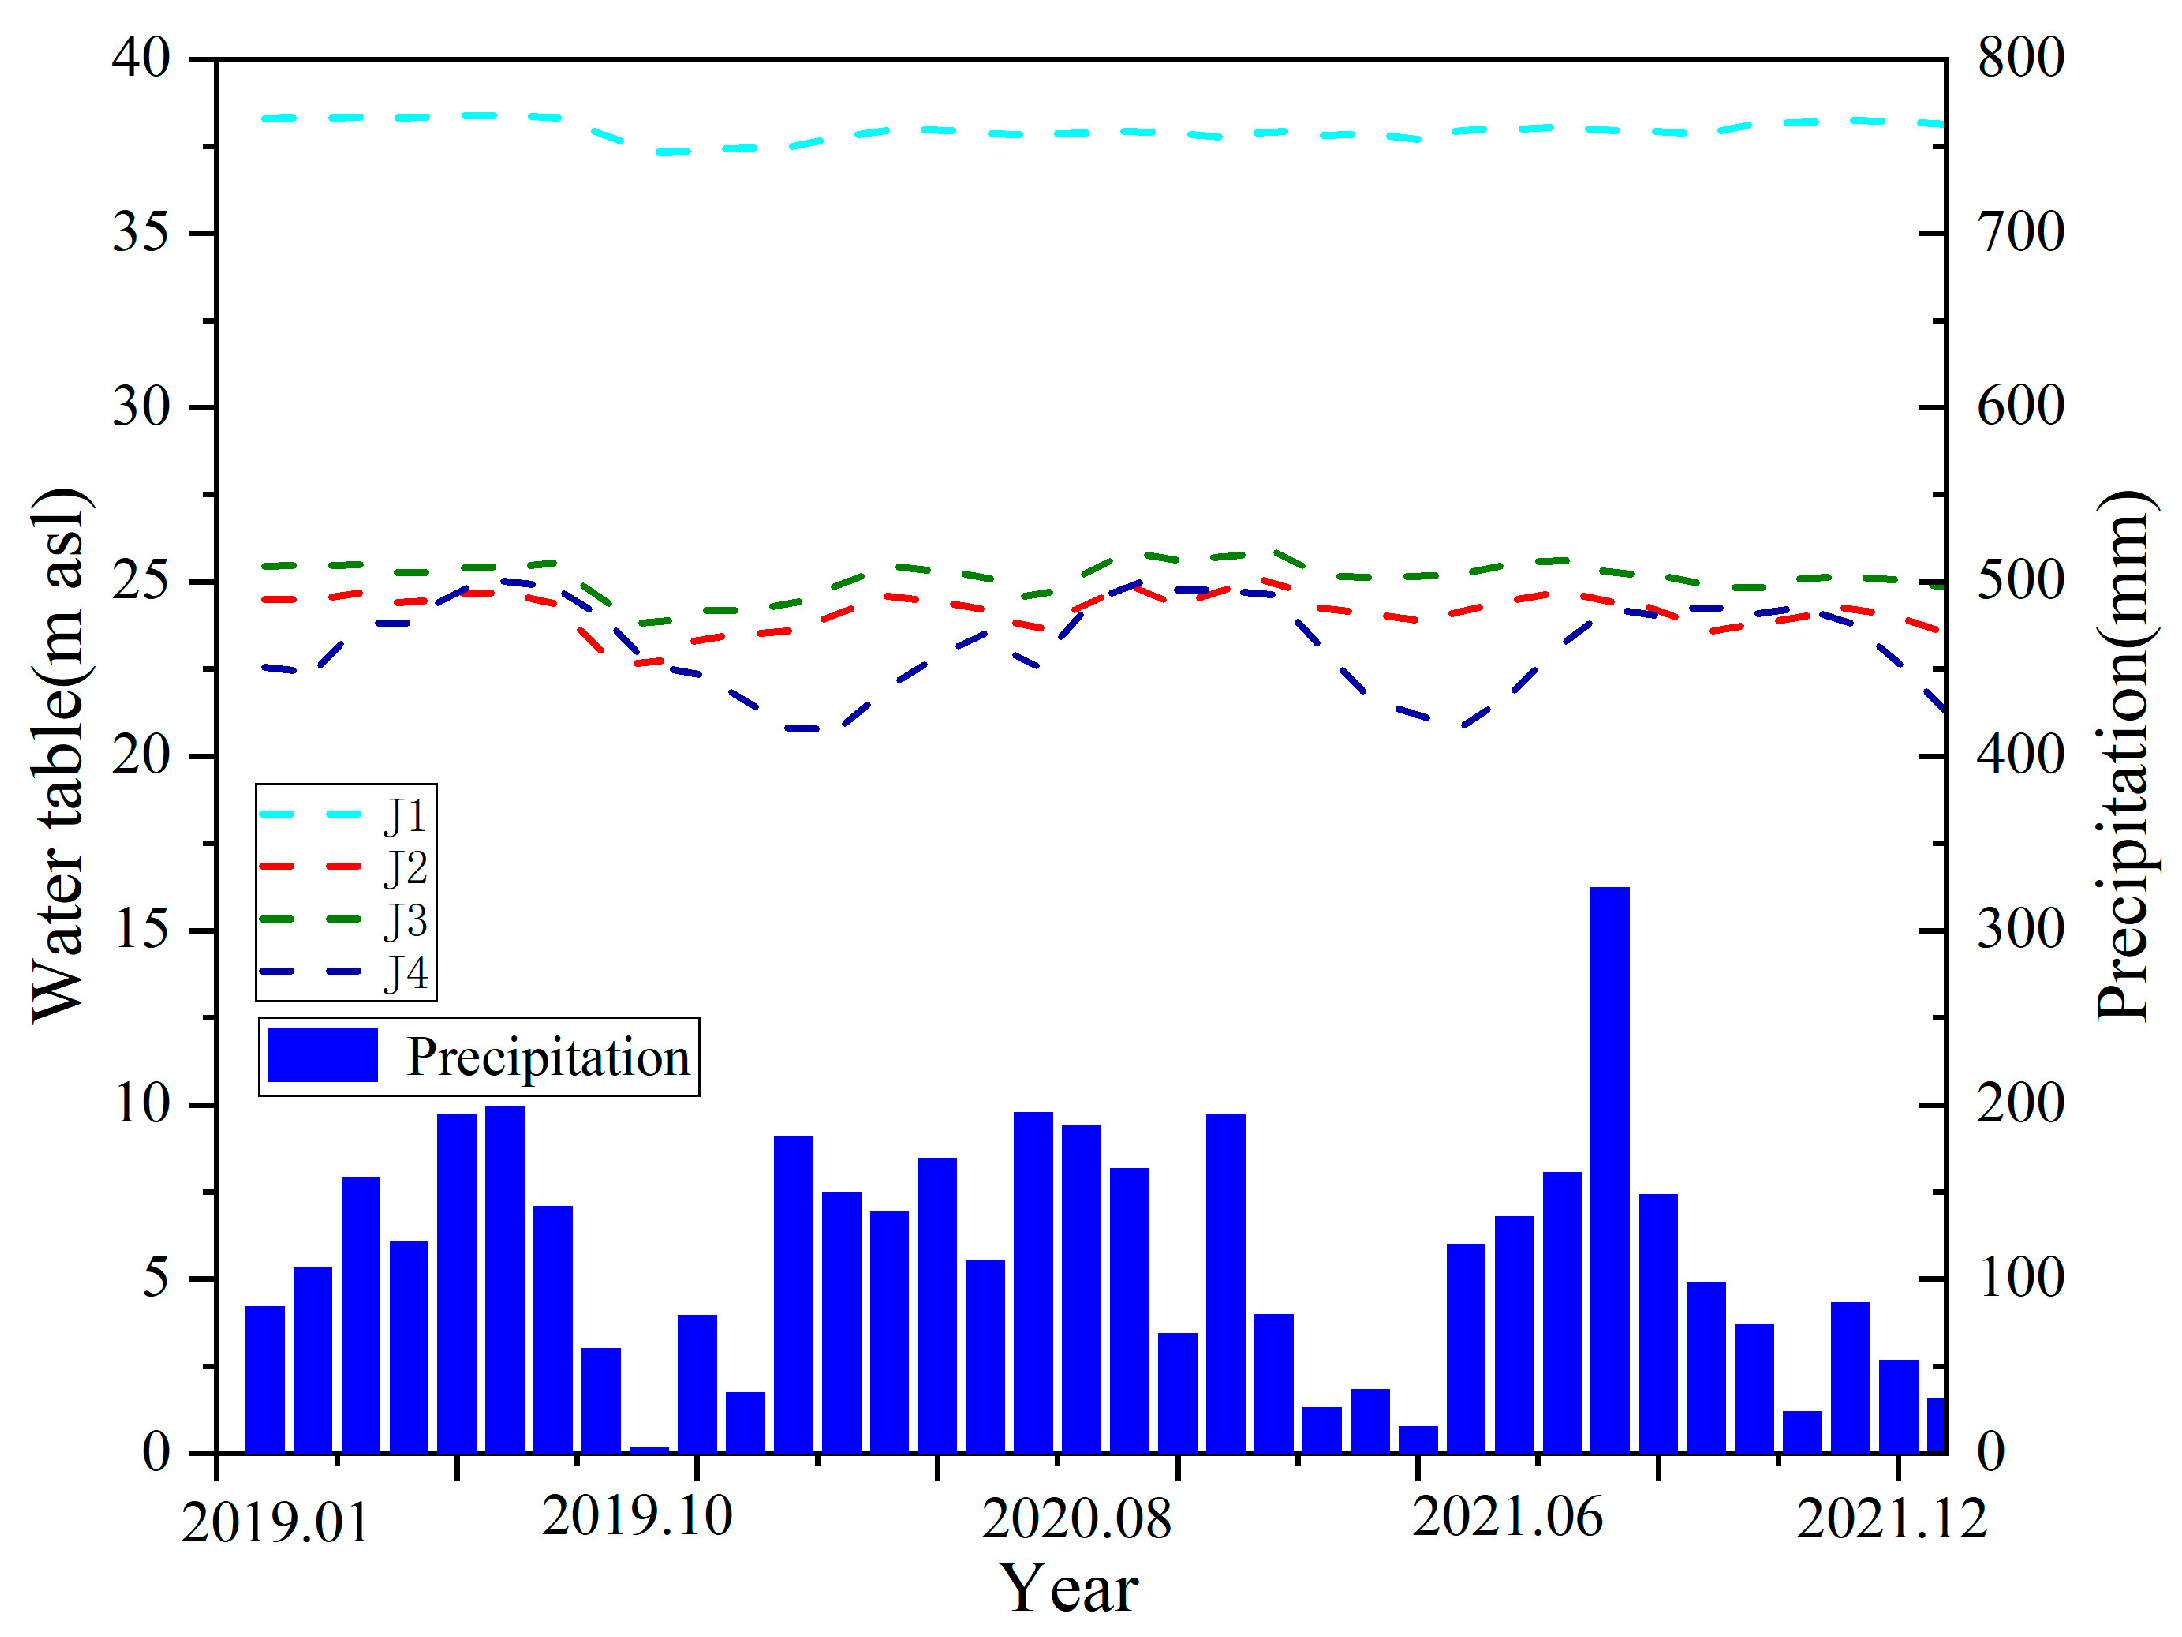
Using the amplitude of annual groundwater-level fluctuations and specific yield (Sy), “net recharge” can be evaluated. Groundwater-level fluctuations (Figure 3) show that, over the hydrological years 2019–2021, the range of water-level variation at the four monitoring wells is between 0.71 m/year and 4.96 m/year. Among them, J1 shows the smallest fluctuation, with an average of approximately 0.99 m/year, whereas J4 shows the largest fluctuation, with an average of approximately 4.69 m/year. Overall, the magnitude of groundwater-level fluctuations generally increases from southwest to northeast along the groundwater flow direction.
High groundwater levels generally occur during the rainy season from June to October, while low levels are observed during the dry season from November to April. The peaks in groundwater levels lag precipitation peaks. The groundwater-level curves at all monitoring wells reach their maxima and minima almost synchronously during the rainy and dry seasons, suggesting good hydraulic connectivity within the aquifer system. Interannual variations in groundwater levels are relatively small, with water levels in different years declining to nearly the same positions (Figure 3).
In this study, the aquifers tapped by the four monitoring wells all belong to the Middle Pleistocene Quaternary formation (Qp2). Based on a typical borehole in the Dongting Basin, the Qp2 strata consist mainly of brownish-yellow clay, fine sand, medium sand, coarse sand, and sandy gravel layers [47]. According to Johnson (1967) [59] and related studies, the specific yield (Sy) of sandy aquifers generally ranges from 0.10 to 0.30, with approximately 0.10–0.28 for fine sand, 0.15–0.32 for medium sand, and up to 0.20–0.35 for coarse sand. A specific yield (Sy) of 0.10 was adopted based on pumping-test results from a regional hydrogeological investigation conducted in the study area. This value is consistent with the typical range reported for sandy–clayey aquifers in previous studies [7,9]. Because sufficient site-specific measurements were unavailable for all monitoring wells, this representative value was assumed to be spatially uniform throughout the study area.
Based on Equation (1), the estimated groundwater recharge ranges from 71 mm/year to 496 mm/year, with a mean value of 268.2 mm/year. The recharge-to-precipitation (R/P) ratio ranges from 4.7% to 36.3% cross the study area (Table 1).
The applicability of the WTF method spans from local to regional scales and is largely determined by the number and spatial distribution of monitoring wells [4,24,60]. Previous studies have estimated groundwater recharge using monitoring networks ranging from one well per approximately 230 km2 to more than 3000 km2 [15,61,62]. The monitoring density adopted in the present study (approximately 317 km2 per well) is therefore comparable to those reported in previous regional-scale applications of the WTF method.
In the present study, the study area was divided into four hydrogeological subregions based on topography, stratigraphy, and river boundaries. The boundary between Zone 1 and Zones 2–3 corresponds to the transition from the piedmont terrain to the plain and also coincides with the boundary between the Qp2 and Qh strata (Figure 1). The boundaries between Zones 2, 3, and 4 are defined by the Zishui River and its tributaries (Figure 1). Within each zone, the hydrogeological conditions are relatively homogeneous, and the hydraulic connectivity is generally good. Therefore, each monitoring well was considered representative of the groundwater conditions within its corresponding hydrogeological subregion. The monitoring wells were selected to represent the dominant hydrogeological settings rather than to achieve a uniform spatial distribution.
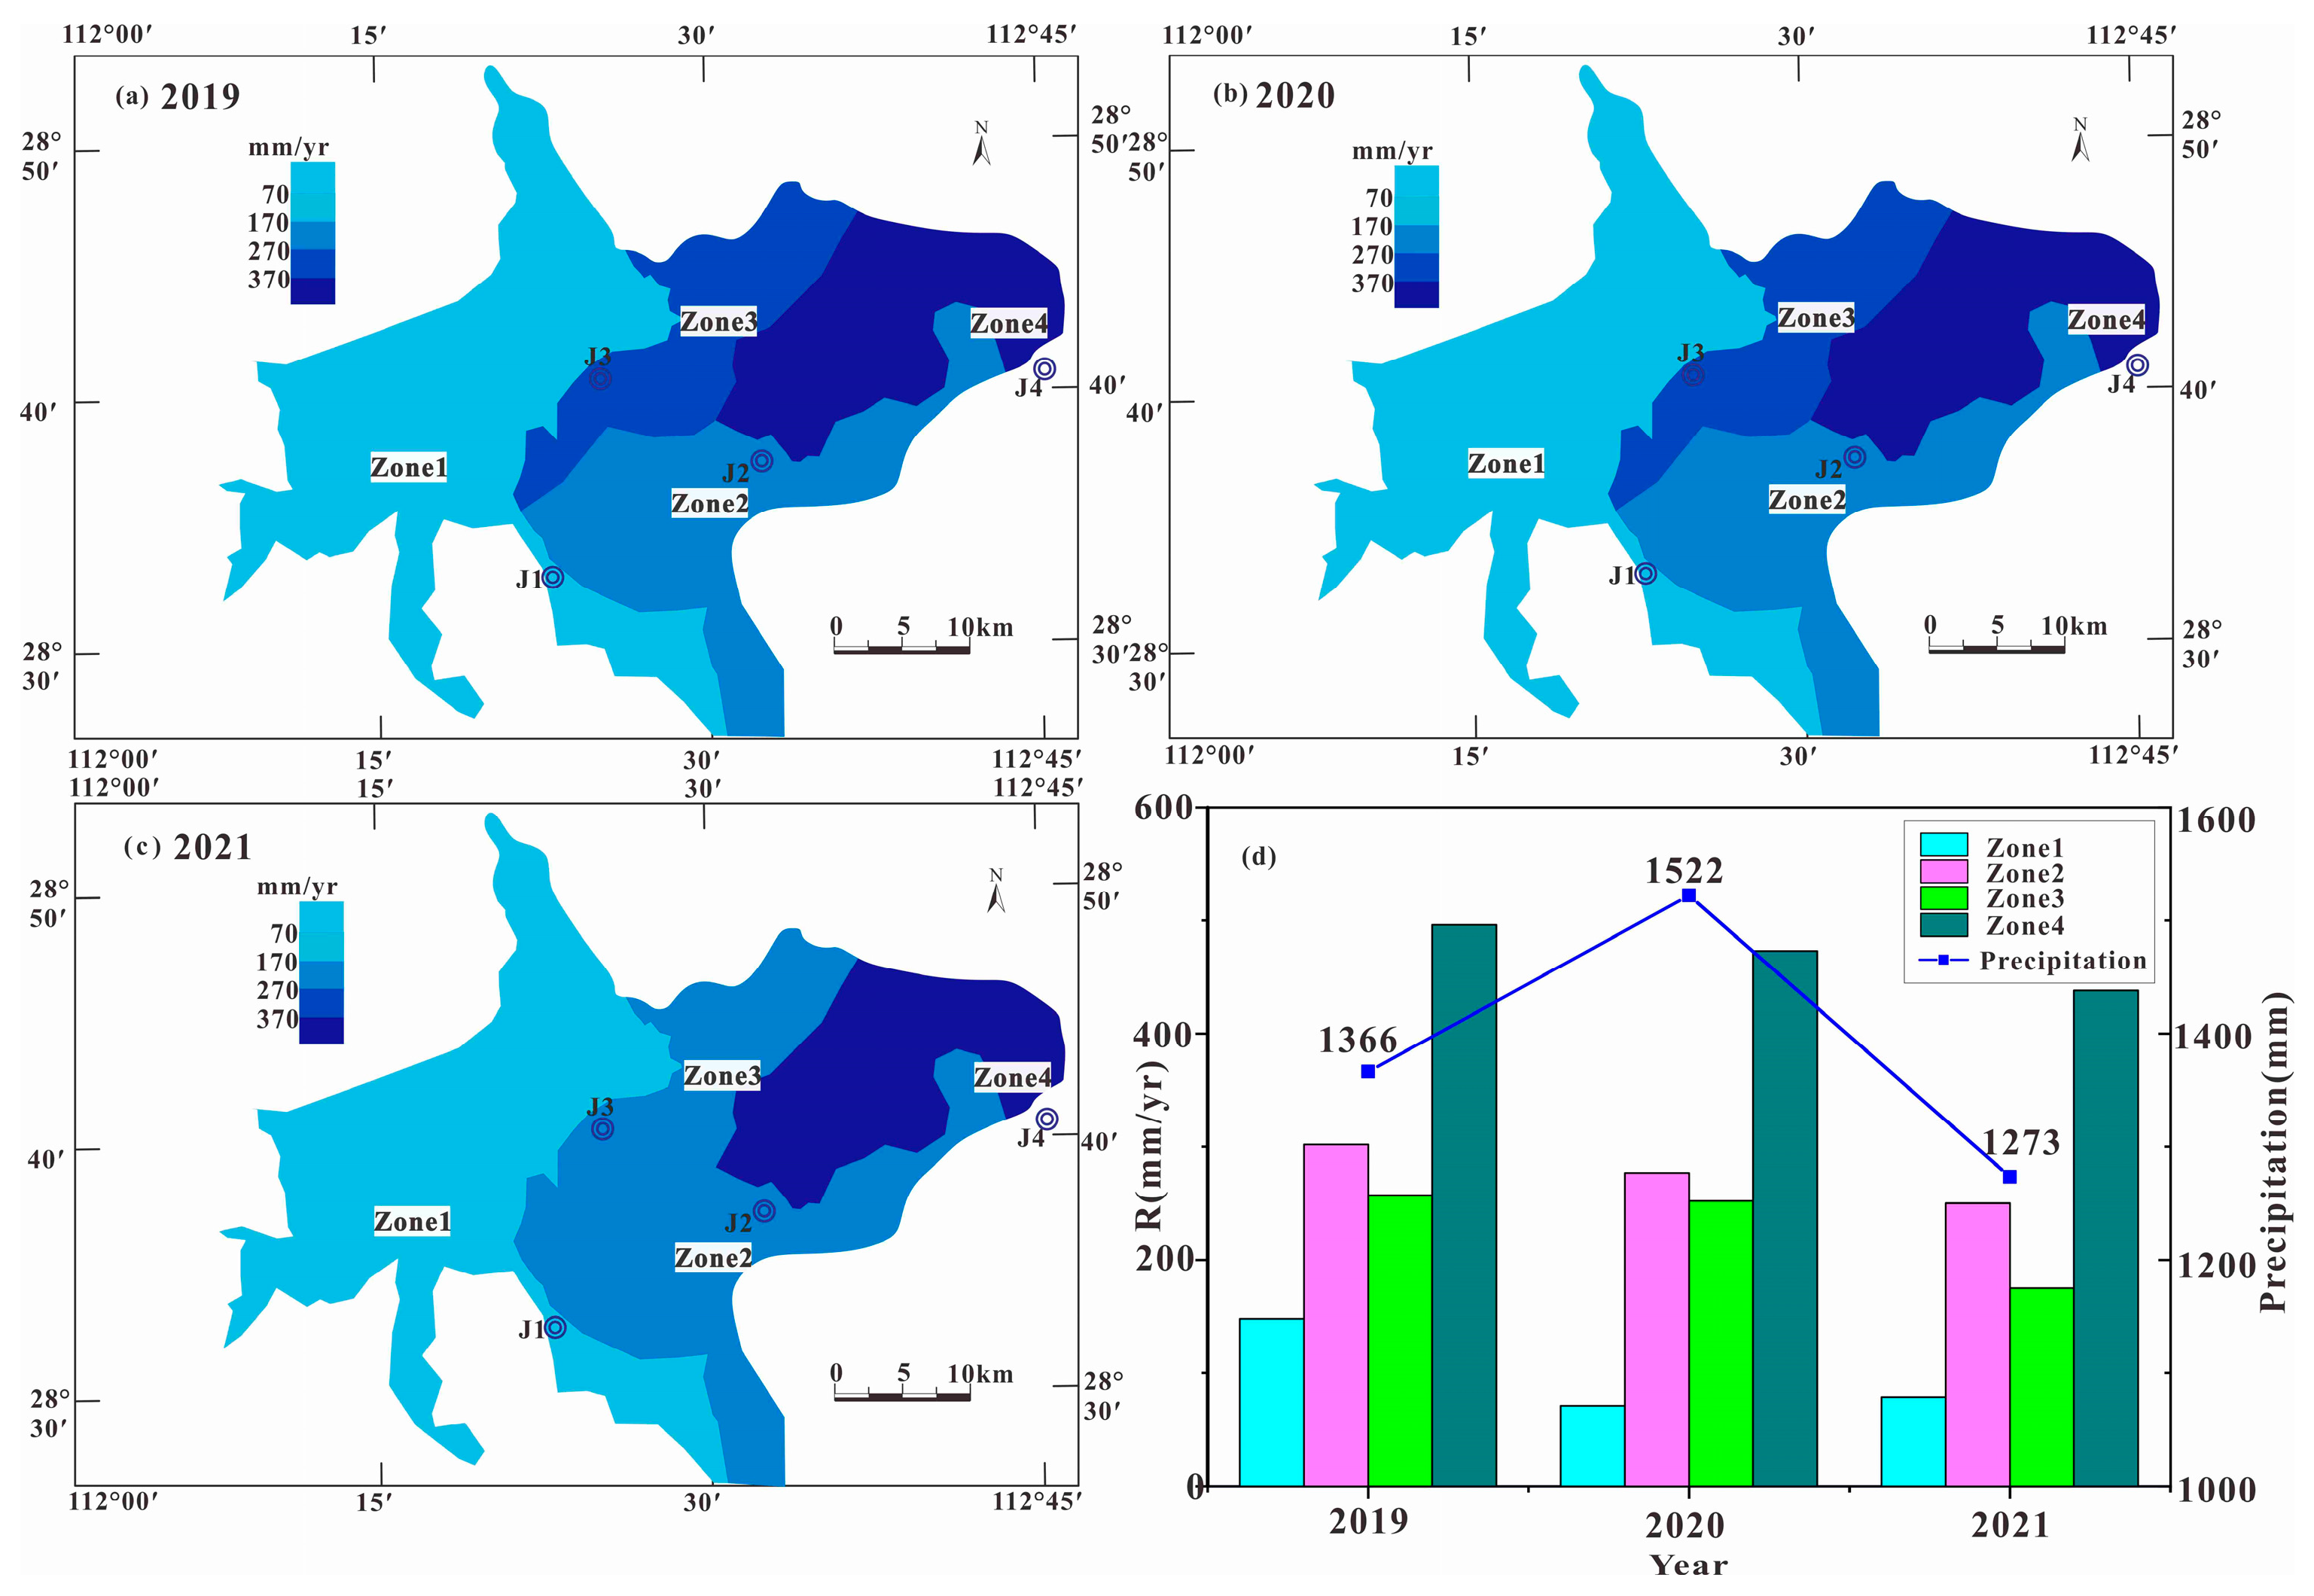
Figure 4 provides a first-order representation of the spatial variability in groundwater recharge across the basin, suggesting a general increase in recharge from the southwest to the northeast. In the interpolated map, Zone 1, located in the southwestern part of the study area, is interpreted to exhibit relatively low recharge of 71–148 mm/year (R/P = 4.6–10.8%). Groundwater recharge shows a progressive increase from Zone 2 to Zone 3, ranging from 175 to 302 mm/year (R/P = 13.7–22.1%). In Zone 4, recharge increases further to 438–496 mm/year (R/P ranges from 31.1–36.3%). Overall, the interpolated recharge pattern suggests a gradual increase in groundwater recharge along the inferred groundwater flow direction.
The observed variability can be partly attributed to differences in geological conditions. Zone 1 is predominantly composed of reticulated red clay, which exhibits poor water-bearing capacity and low permeability [45]. This condition may weaken and delay the infiltration process reaching the groundwater table. By contrast, groundwater recharge in Zones 2, 3, and 4 is derived not only from direct precipitation recharge but also from lateral groundwater inflow from Zone 1 and seepage from the Zishui River and its tributaries. Together, these factors result in pronounced spatial heterogeneity in recharge.
Over the groundwater monitoring period (2019–2021), although recharge exhibits some variability, the overall spatial pattern remained broadly consistent (Figure 4d). In 2019, precipitation was concentrated during the rainy season (Figure 3), with a total annual rainfall of 1366 mm, and the average recharge reached 22%. In contrast, although total precipitation in 2020 was higher (1522 mm), it was more evenly distributed throughout the year, resulting in a lower average recharge of only 17.6%. Differences in recharge were observed among the monitored years, suggesting that groundwater recharge may be influenced not only by the total amount of precipitation but also by its temporal distribution; however, the relatively short monitoring period limits the assessment of long-term interannual variability.

3.2. Groundwater Age Method

For the aquifer thickness H in Equation (2), the Qp2 aquifer is the principal water-bearing formation in the study area, with a total thickness ranging from 50 to 150 m. Because the sampled wells are generally less than 20 m deep, the measured groundwater ages mainly represent water from the shallow part of the aquifer rather than the entire aquifer system. Therefore, a representative effective aquifer thickness of 20 m, corresponding to the shallow flow system, was adopted for all sampling locations. Using a uniform effective thickness provides a consistent basis for regional-scale recharge estimation, although it may introduce some uncertainty into the absolute recharge estimates. The parameter z was calculated as the distance between the groundwater level and the bottom of the well screen. An aquifer porosity of 0.30, which is a typical value for fine- to medium-grained sand [51], was adopted as a representative value for all sampling locations because site-specific porosity measurements were unavailable. Although this simplification may affect the absolute recharge estimates, it provides a practical basis for regional-scale recharge estimation. A total of 10 wells were ultimately selected for analysis; two were excluded due to concentrations below the detection limit (GW32, GW22).
Based on the groundwater age-dating method, groundwater recharge in the study area ranges from 114.07 to 332.86 mm/year, with an average value of 226.2 mm/year, accounting for approximately 8.3–24.2% of the mean annual precipitation (R/P) (Table 2).
The recharge contours were generated using the Kriging interpolation function in MapGIS software to illustrate the general regional pattern of groundwater recharge. Given the relatively sparse spatial sampling, the interpolated recharge maps should be interpreted as a first-order conceptual representation of regional recharge patterns rather than precise predictions at unsampled locations.
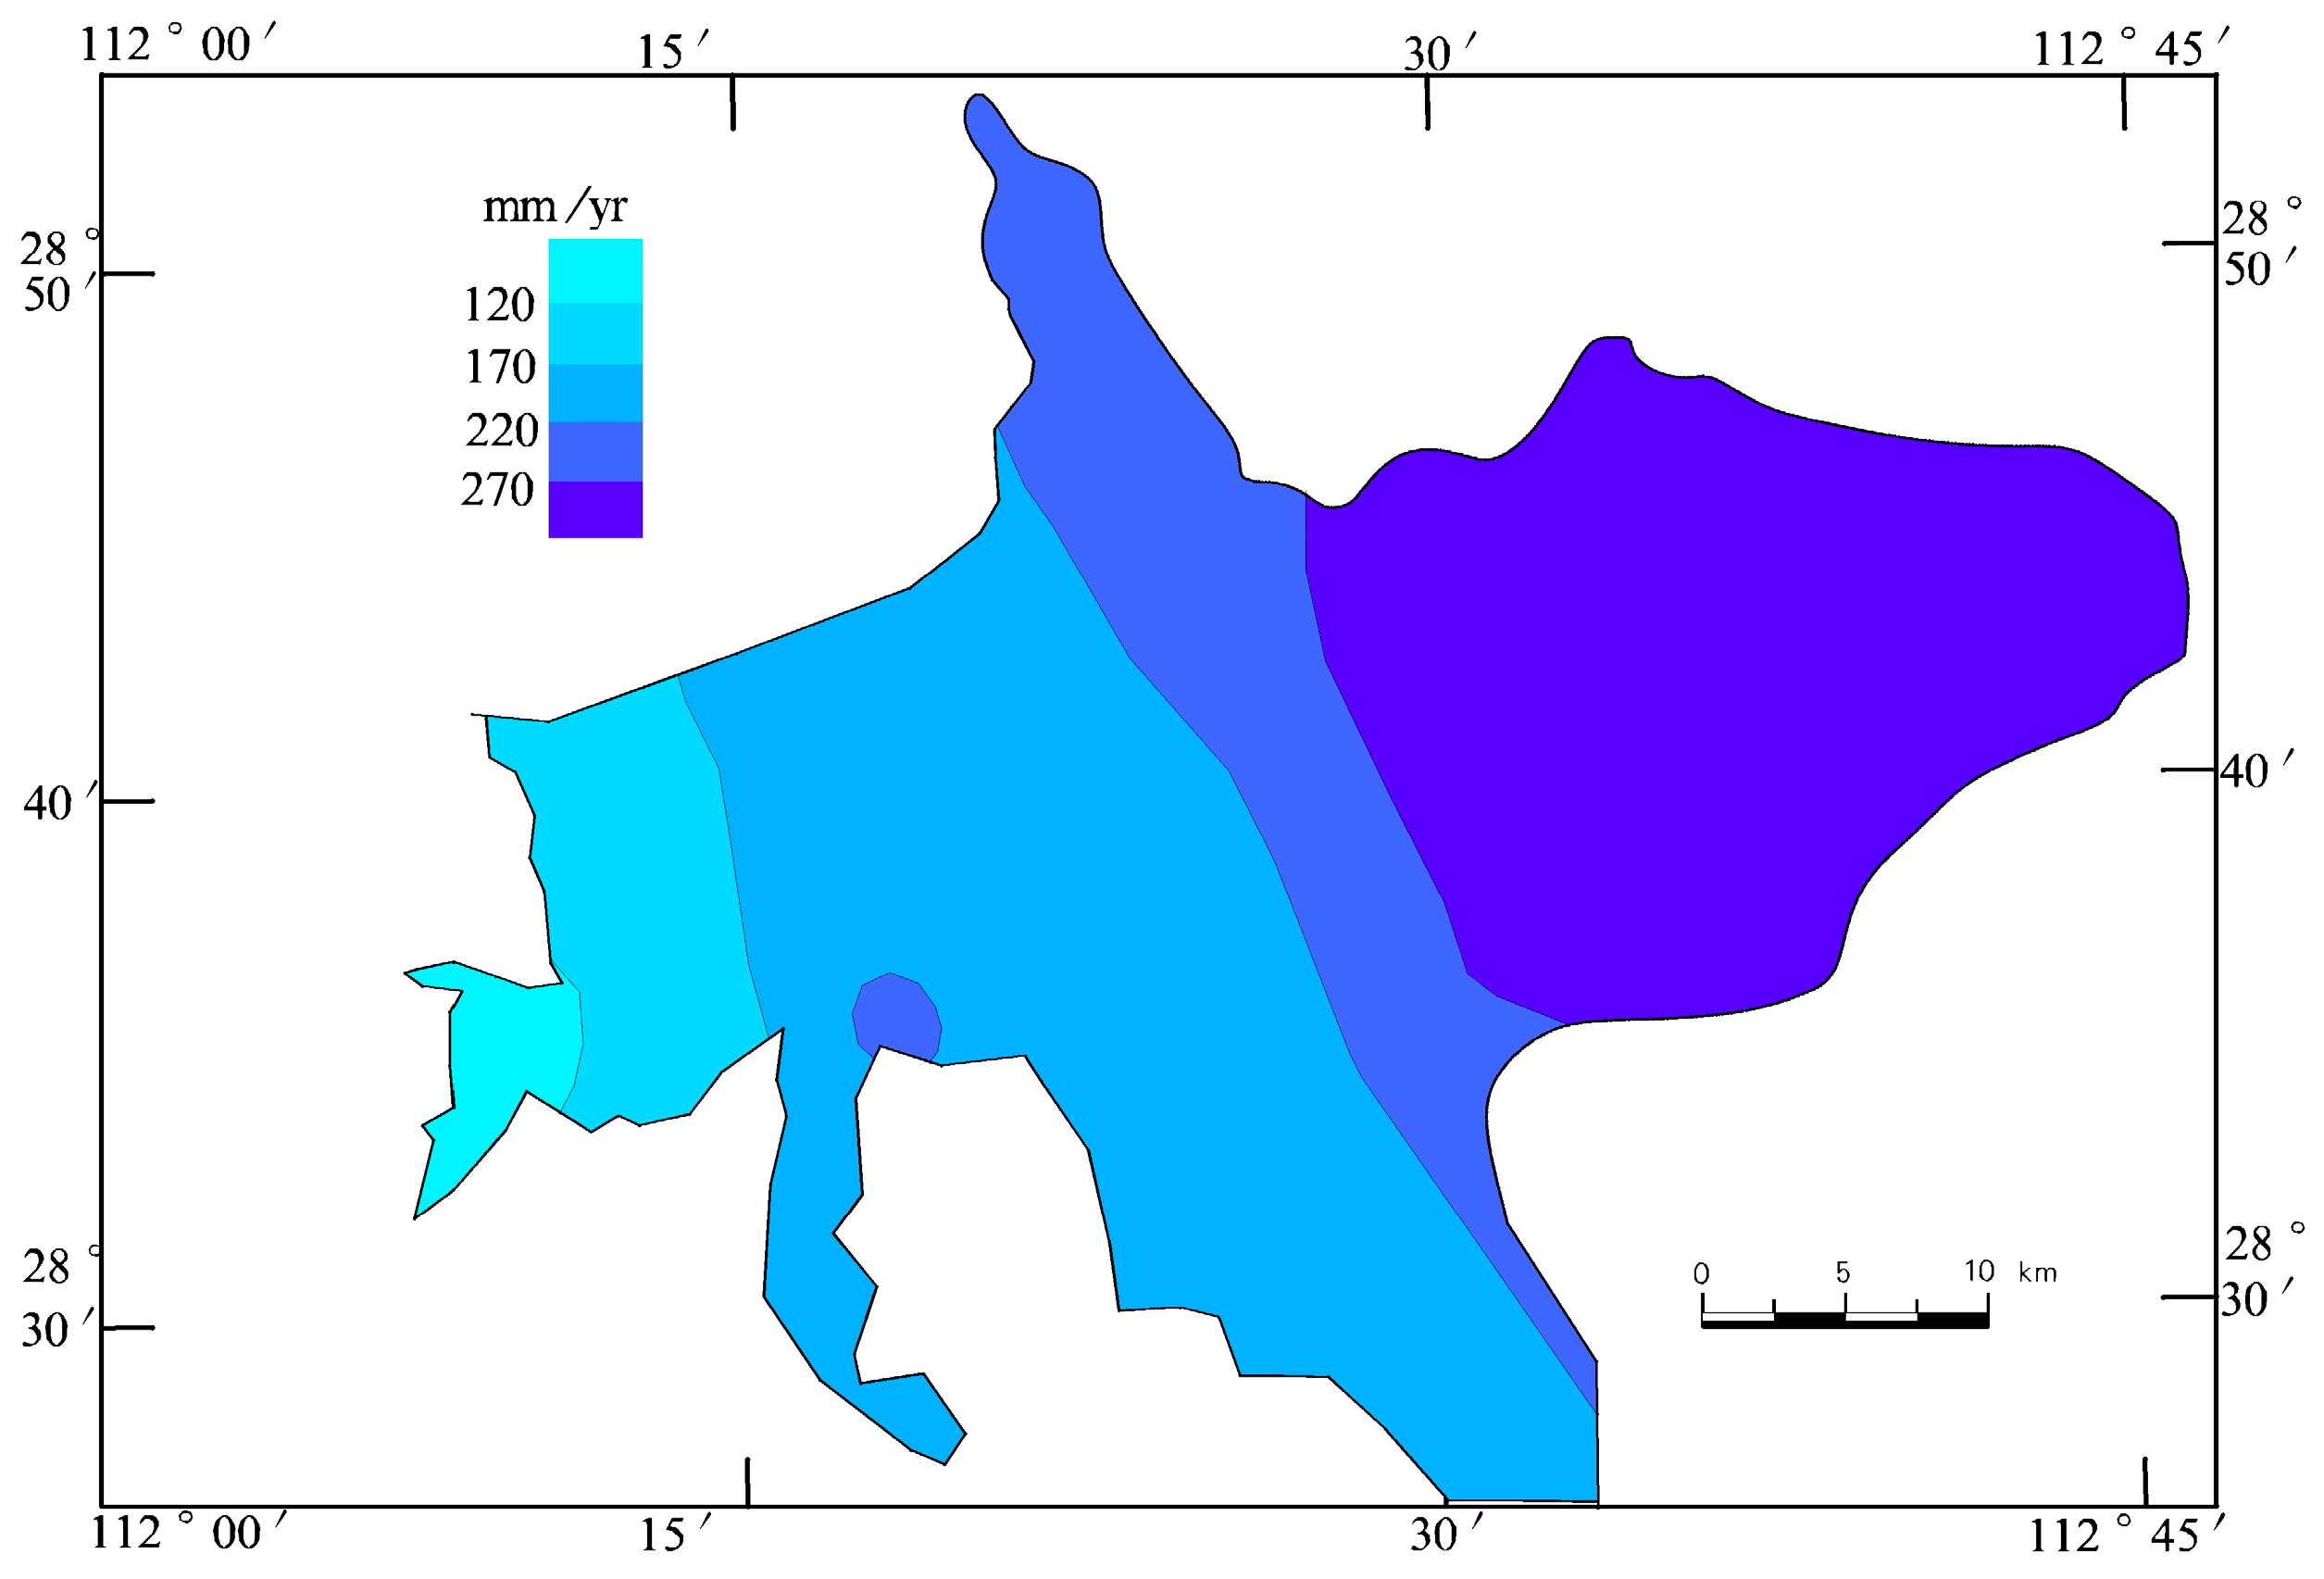
As shown in Figure 5, the interpolated recharge map suggests a general increase in groundwater recharge from southwest to northeast. In the interpolated map, recharge generally ranges from 120 to 220 mm/year in the southwestern region, whereas the highest interpolated values exceed 270 mm/year in the northeastern area.

3.3. Chloride Mass Balance

Chloride concentrations in the 12 sampled shallow wells ranged from 4.65 to 38.56 mg/L, with a mean concentration of 16.11 mg/L. The analytical results of groundwater chloride concentrations are presented in Table 3. Higher chloride concentrations were observed in groundwater from the southwestern hilly areas, whereas lower values were found in the northeastern plain. Given that the study area is an important industrial and agricultural base, groundwater is inevitably affected by agricultural fertilization and industrial wastewater inputs. Therefore, the recharge estimates are presented here first, and their validity is further discussed in Section 4.1.
A key challenge in applying the CMB method is the selection of an appropriate C l p value. Pan [63] reported a rainfall-weighted mean chloride concentration of 1.33 mg/L based on precipitation samples collected in Yiyang from January to December 2017. Considering that chloride concentrations in atmospheric precipitation are relatively stable with limited interannual variation [3,64], this value was adopted as the C l p in this study. P is defined as the mean annual precipitation, with a value of 1373 mm/year [42]. The study area is relatively small (approximately 60 km in length and 20 km in width), and a uniform precipitation value was therefore applied. The region is located at least 800 km from the ocean, indicating negligible marine influence. Due to land reclamation activities, such as polder construction around the lake, surface water levels in the study area have long remained higher than groundwater levels [65,66]; therefore, surface runoff can be considered negligible. Based on Equation (3), the estimated recharge ranges from 47.36 to 392.64 mm/year, with an average of 167.03 mm/year, accounting for approximately 4.7–28.6% of annual precipitation (Table 3).
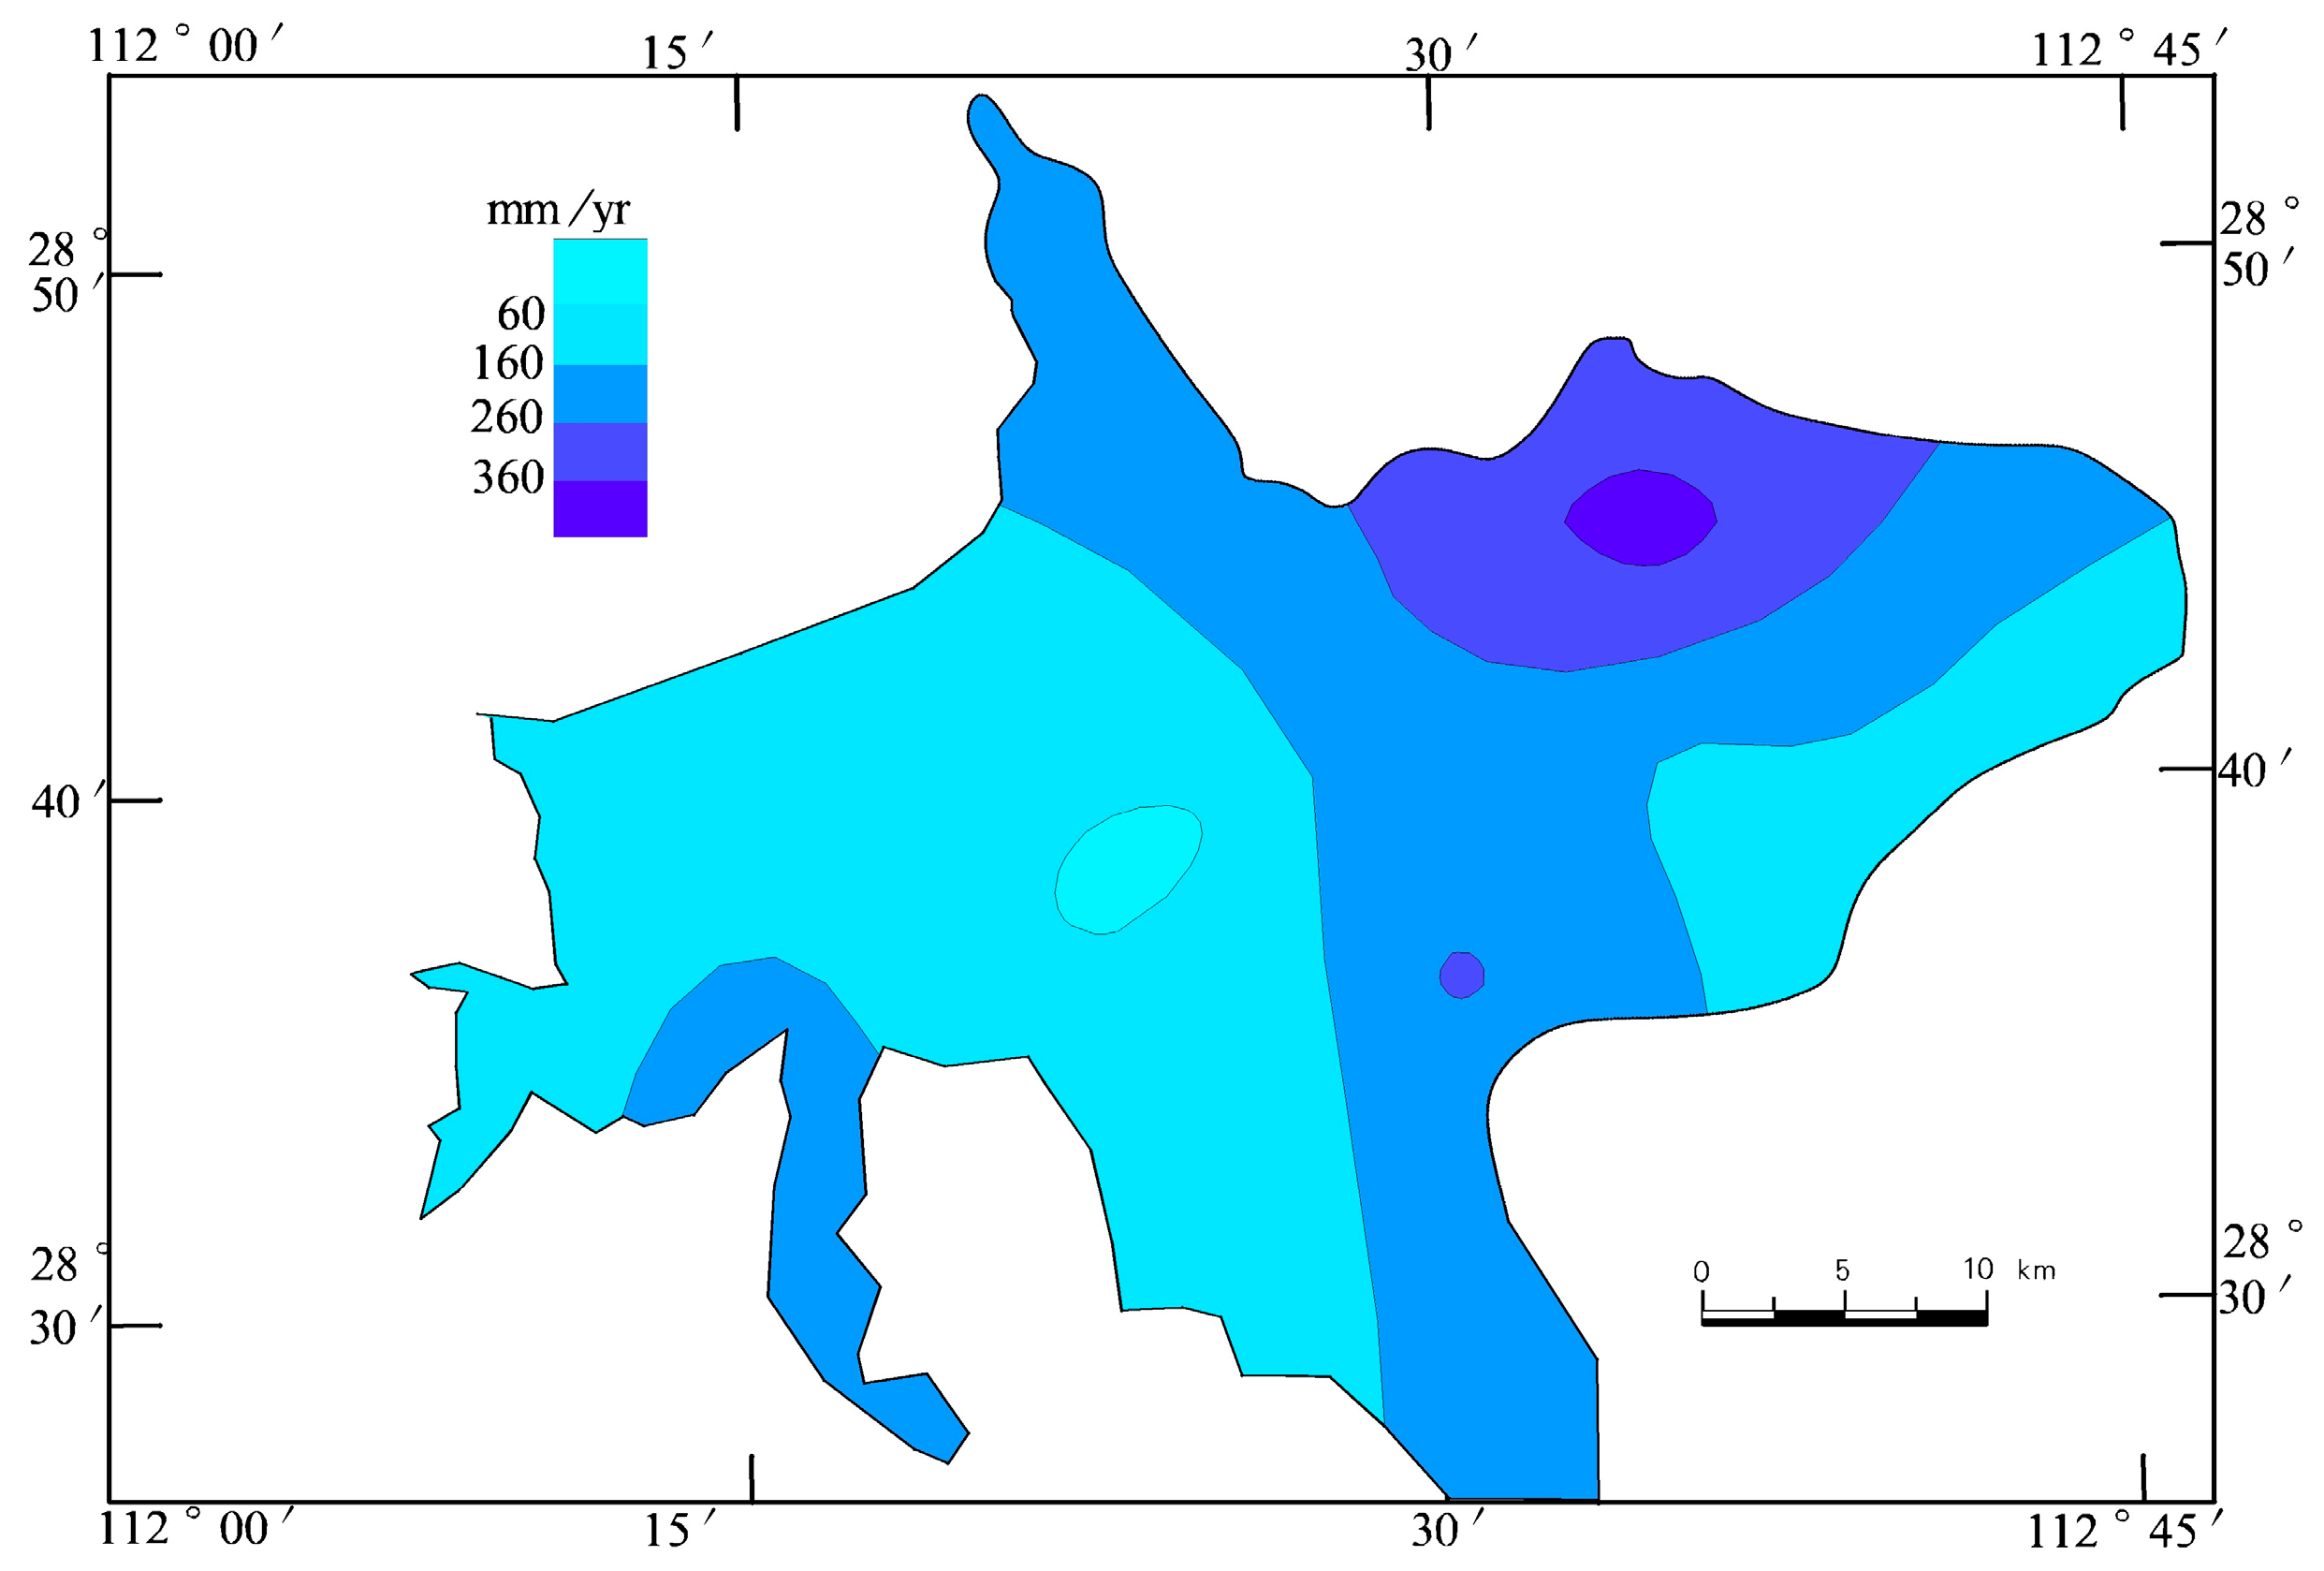
Spatial analysis of the recharge estimates obtained using the CMB method was also conducted by Kriging interpolation to evaluate their spatial variability. Consequently, the CMB results are interpreted as a comparative estimate rather than a definitive measure of groundwater recharge. Due to the variability in chloride concentrations in groundwater, the recharge estimates derived from the CMB method exhibit pronounced spatial heterogeneity. As shown in Figure 6, the interpolated recharge map suggests a general increase in groundwater recharge from the southwestern part of the study area (<160 mm/year) toward the northeastern part (>300 mm/year). This spatial pattern is generally consistent with the recharge distributions obtained from the WTF method and groundwater age approaches, although the absolute magnitudes of the estimated recharge differ.

4. Discussion

4.1. Evaluation and Limitations of Different Recharge Estimation Methods

The recharge estimation methods used in this study operate at different spatial and temporal scales and rely on distinct conceptual frameworks, assumptions, and data requirements, each with inherent advantages and limitations [19,27]. Therefore, the recharge estimates obtained from the three methods were evaluated in terms of their regional patterns, methodological assumptions, and associated uncertainties to provide a more comprehensive interpretation of groundwater recharge in the study area.
The WTF method captures groundwater recharge variability at an interannual timescale. A representative specific yield (Sy) is commonly assumed to be spatially uniform when applying this method [49]. In this study, Sy was selected based on the best available hydrogeological information. Nevertheless, because recharge estimated by the WTF method is directly proportional to the adopted Sy, spatial variations in Sy may proportionally influence the absolute magnitude of the estimated recharge. More site-specific determinations of Sy would therefore help reduce this source of uncertainty. Unlike the other two methods, the WTF method estimates the total volume of water entering the aquifer. As a result, it may overestimate actual recharge, particularly in areas with low drainage efficiency [9,25]. In the present study, the WTF method yielded the highest recharge estimates, with a mean value of 268.2 mm/year, which is approximately 1.5 times higher than that obtained using the CMB method (167.03 mm/year). In addition, the WTF method is constrained by the limited number of monitoring wells [22,50], which restricts its spatial representativeness, as the current groundwater dataset is derived from only four monitoring wells.
The groundwater age method represents recharge integrated over intermediate timescales. For this method, although a representative porosity of 0.30 was adopted based on previous studies, spatial variability in porosity may also influence the absolute magnitude of the estimated recharge. Another source of uncertainty is the assumed effective aquifer thickness. In practice, the effective thickness contributing to recharge may vary spatially depending on local hydrogeological conditions. This can lead to relatively limited variation in the estimated recharge (114.07–332.86 mm/year, with a median of 226.2 mm/year). Therefore, the effective aquifer thickness, well construction characteristics, and aquifer porosity should be carefully constrained when applying this method to improve the reliability of recharge estimates [1].
The CMB method generally reflects long-term average recharge conditions, and this method yields the lowest recharge estimates compared with the other methods, with an average of approximately 167.03 mm/year. As chloride concentrations increase, the estimated recharge correspondingly decreases. Therefore, this method is sensitive to external inputs of chloride in groundwater, particularly those associated with atmospheric deposition or anthropogenic activities, which may lead to an underestimation of recharge when applying the CMB method [13,14]. In the study area, a change of 0.1 mg/L in precipitation chloride concentration results in an approximate change of 30 mm/year in the estimated recharge. The lack of long-term precipitation chemistry data is a major source of uncertainty in the CMB estimates. In this study, the precipitation chloride concentration was derived from the one-year dataset reported by Pan [63]. Therefore, temporal variability in atmospheric chloride deposition may contribute to uncertainty in the estimated recharge. Long-term monitoring of precipitation chemistry in the study area would help better constrain groundwater recharge estimates obtained using the CMB method.
Another possible reason for the relatively low recharge estimates obtained using the CMB method is the input of chloride from agricultural practices (e.g., potassium chloride fertilizers) or from industrial and municipal wastewater, particularly in urbanized and agriculturally developed areas [67]. The urban area of the study region is located in the southwestern piedmont (Figure 1c), whereas the northeastern plain is sparsely populated, with only scattered villages because of the high flood risk. Therefore, the relatively low recharge estimated by the CMB method in the southwestern area is likely attributable to anthropogenic chloride inputs associated with urban activities. In contrast, although human activities are generally less intensive in the northeastern plain, localized anthropogenic influences cannot be completely excluded at some sampling sites (e.g., GW36 and GW19).
Undoubtedly, the assumptions underlying each method are the most direct factors influencing the magnitude of estimated recharge. These estimated values are inherently affected by the specific assumptions and characteristics of each approach. Due to differences in measurement scales, the ranges of recharge estimates derived from the three methods vary, and their mean values also differ to some extent. The WTF method generally produced the highest recharge estimates in this study, partly because groundwater-level rises may also reflect lateral inflow in addition to precipitation recharge. The groundwater age method yields intermediate values with a relatively narrower range and, as it primarily accounts for recharge from precipitation, provides an intermediate estimate under the adopted assumptions. In contrast, the CMB method is based on point-scale estimates and, due to the influence of agricultural and industrial activities, may underestimate current recharge; therefore, it should be applied with caution when extrapolated to the regional scale.
Overall, the recharge estimates presented in this study are influenced by uncertainties associated with representative hydrogeological parameters, including specific yield (Sy), porosity, effective aquifer thickness, and precipitation chloride concentration. Although these simplifications may affect the absolute magnitude of the estimated recharge, they do not diminish the value of integrating multiple methods to identify the general regional variability of groundwater recharge. Accordingly, the interpolated recharge maps and conceptual recharge model should be interpreted as first-order representations of regional recharge patterns rather than precise quantitative predictions.

4.2. Conceptual Model

In this study, three methods (WTF, groundwater age, and CMB) were used to estimate groundwater recharge in the Zishui Plain, yielding recharge values of 268.2, 226.2, and 167.03 mm/year, respectively. The corresponding mean R/P ratios were 19.4%, 16.5%, and 12.2%. In comparison, Chen (2024) [34] used the CMB method to estimate groundwater recharge under different land-use types on the Loess Plateau in eastern Gansu Province of China, reporting recharge rates of 14 and 16 mm/year for maize fields and wheat fields, respectively, accounting for approximately 19–20% of annual precipitation. In another study, Banks [32] applied three different techniques (CFCs, CMB, and the WTF method) to shallow unconfined aquifers in Ethiopia, Uganda, and Malawi, obtaining average recharge values of 327 mm/year (24–26% of annual rainfall), 112 mm/year (8–9% of annual rainfall), and 86 mm/year (9–10% of annual rainfall), respectively. These comparisons indicate that although humid and arid regions may exhibit broadly similar R/P ratios, the absolute magnitude of groundwater recharge generally increases with precipitation.
In addition, consistent with recharge patterns observed in alluvial aquifer systems worldwide [9,68], groundwater recharge in the Zishui Plain appears to be strongly influenced by lithological heterogeneity, which likely affects recharge pathways, spatial variability, and the responses of different recharge estimation methods.
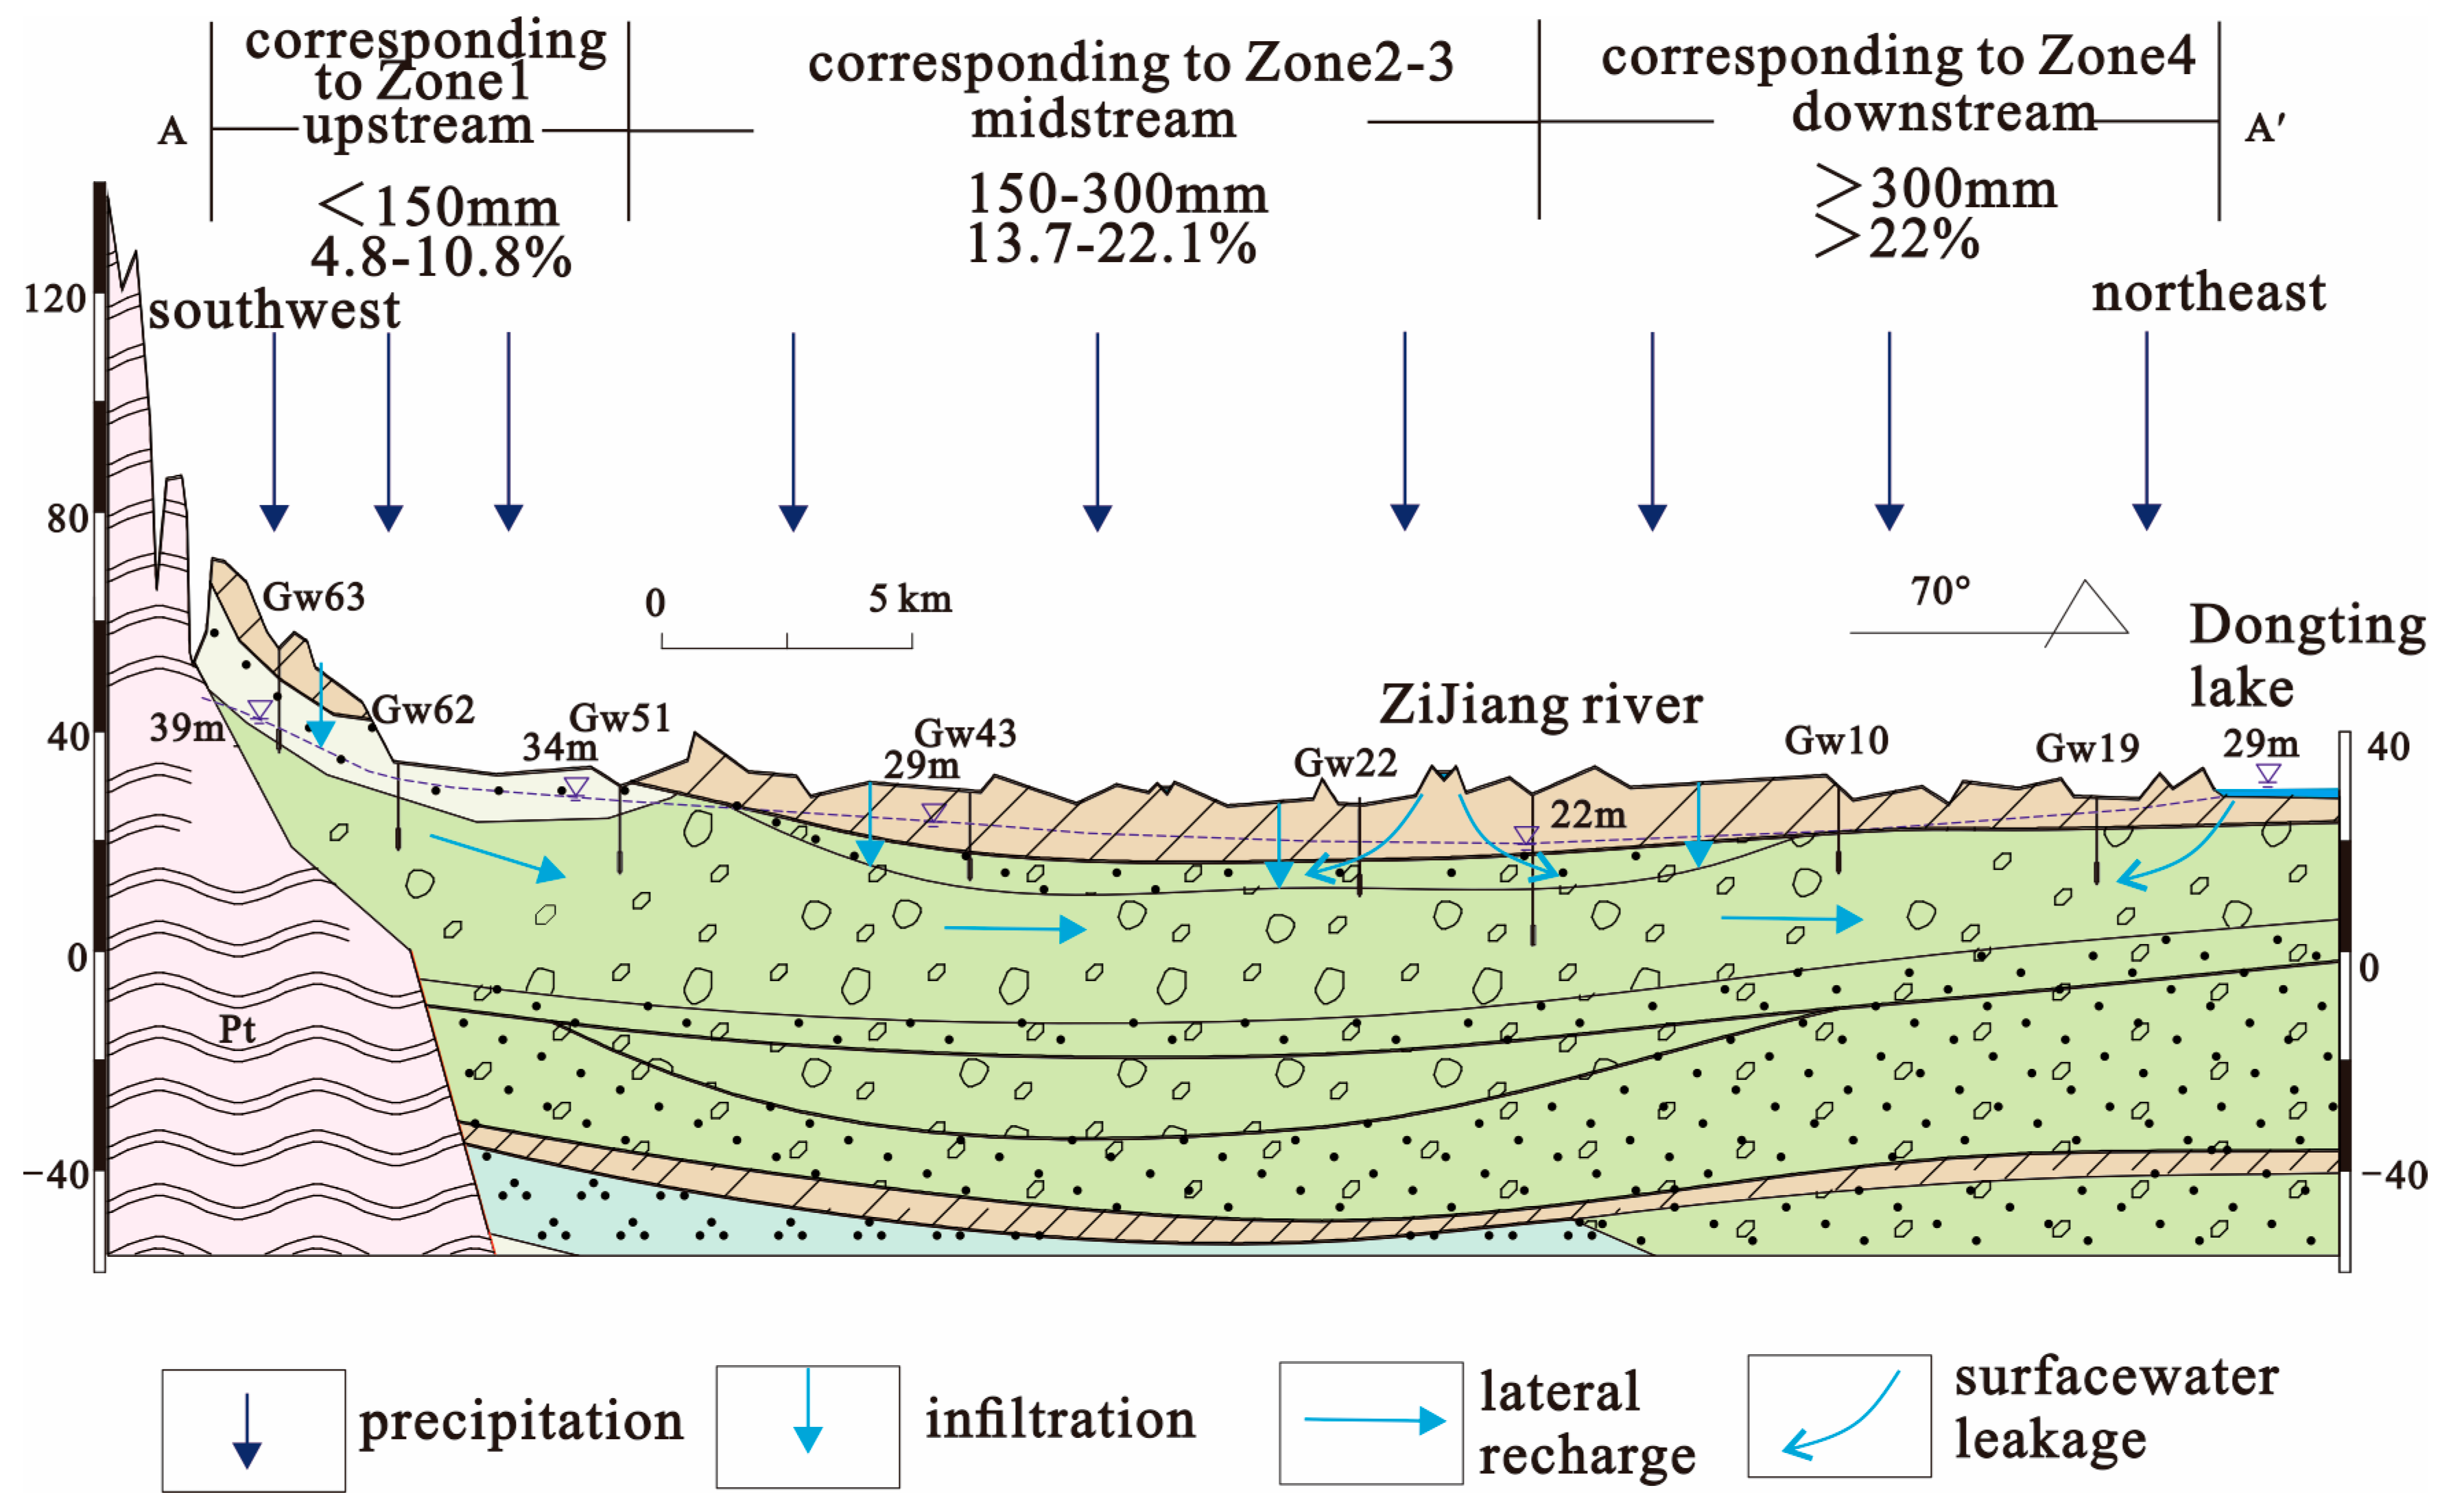
Based on the integrated interpretation of the three recharge estimation methods, a first-order conceptual model was developed to illustrate the general spatial pattern of shallow groundwater recharge (Figure 7; here, the upstream, midstream, and downstream areas correspond to Zone 1, Zones 2–3, and Zone 4 of the WTF-based zoning, respectively). These subdivisions are intended to facilitate the conceptual interpretation of regional recharge patterns rather than to define precise hydrogeological boundaries.
The upstream area (corresponding to Zone 1) contains the major urban (Yiyang City) and residential areas of the basin. Consequently, the CMB method is more susceptible to anthropogenic chloride inputs, whereas the groundwater age method is subject to uncertainty associated with the assumed effective aquifer thickness. Consequently, the WTF results were considered the most suitable reference for the conceptual interpretation of groundwater recharge in the upstream area.
In the upstream part of the study area, groundwater recharge is considered to be primarily derived from atmospheric precipitation. In this portion of the catchment, the surface is predominantly composed of low-permeability sediments, and groundwater levels do not exhibit significant fluctuations. A considerable portion of rainfall is likely lost to evapotranspiration or discharged downstream, contributing to relatively low recharge. Recharge is estimated to be less than 150 mm/year, accounting for approximately 4.8–10.8% of the mean annual precipitation (Figure 7). In the midstream area (corresponding to Zone 2–3), the influence of river leakage is limited, and the WTF method is considered to provide a more representative estimate of groundwater recharge. Additionally, differences in surface sediments between the left and right banks contribute to spatial variability in recharge, with estimated values ranging from 150 to 300 mm/year, equivalent to approximately 13.7–22.1% of the mean annual precipitation (Figure 7).
The downstream area (corresponding to zone 4) functions as a discharge zone and is influenced by lateral recharge from both surface water and upstream groundwater, resulting in the largest groundwater-level fluctuations. Recharge estimates obtained using the WTF method range from 438 to 496 mm/year, equivalent to approximately 31–36% of the mean annual precipitation (Figure 7), which are considered relatively high. Therefore, for the purpose of the conceptual model, the groundwater age estimates were adopted to represent the downstream recharge pattern, indicating that groundwater recharge in the downstream area is estimated to exceed 300 mm/year.

5. Conclusions

This study presents a regional case study in which three established recharge estimation methods (WTF, groundwater age, and CMB) are jointly applied to evaluate groundwater recharge in a humid alluvial aquifer. The results indicate that the WTF method yields an average recharge of 268.2 mm/year, the groundwater age method estimates 226.2 mm/year, and the CMB method produces 167.03 mm/year. Due to the inherent limitations of each approach, reliance on a single method may lead to significant misinterpretation of recharge. Therefore, a comprehensive comparison of multiple methods is essential for a more reliable assessment of regional groundwater recharge. Based on the integrated interpretation of the three methods, a first-order conceptual pattern of groundwater recharge was inferred, with recharge generally being less than 150 mm/year in the upstream area, 150–300 mm/year in the midstream area, and greater than 300 mm/year in the downstream area. The integrated application of the WTF, groundwater age, and CMB methods helps improve the understanding of regional groundwater recharge processes in the Zishui Plain. Although the results should be interpreted in light of the limitations of the monitoring network and the adopted assumptions, they may provide useful support for groundwater management in the Dongting Basin and a reference for groundwater recharge assessment in similar hydrogeological settings.

Author Contributions

Conceptualization, Z.C., J.L. and X.L.; methodology, Z.C.; software, Z.C.; validation, Z.C. and J.L.; formal analysis, Z.C., J.L. and X.L.; investigation, Z.C.; resources, J.L.; data curation, J.L.; writing—original draft preparation, Z.C.; writing—review and editing, J.L. and X.L.; visualization, Z.C.; supervision; J.L. and X.L.; project administration, J.L. and X.L.; funding acquisition, J.L. All authors have read and agreed to the published version of the manuscript.

Funding

This research was funded by the National Natural Science Foundation of China (Grant Nos. 42377071, 41977167) and the Guangxi Key Research and Development Program (GuikeAB 21196026).

Data Availability Statement

The data presented in this study are available within the article.

Acknowledgments

The authors gratefully acknowledge Pengyu Fu and Zhixin Zhang for their assistance with the field investigations. The authors also thank Yanan Zhang for her assistance with the laboratory analysis of the water samples. In addition, the authors sincerely acknowledge the Hunan Hydrology and Water Resources Bureau for providing the groundwater-level data used in this study.

Conflicts of Interest

The authors declare no conflicts of interest.

References

  1. Scanlon, B.R.; Healy, R.W.; Cook, P.G. Choosing appropriate techniques for quantifying groundwater recharge. Hydrogeol. J. 2002, 10, 18–39. [Google Scholar] [CrossRef]
  2. Mudimbu, D.; Namaona, W.; Sinda, M.C.; Brauns, B.; Gooddy, D.C.; Darling, W.G.; Banda, K.; Phiri, E.; Nalivata, P.C.; Mtambanengwe, F.; et al. Groundwater recharge in basement aquifers in subhumid drylands of sub-Saharan Africa. Hydrogeol. J. 2024, 32, 1993–2009. [Google Scholar] [CrossRef]
  3. Gebru, T.A.; Tesfahunegn, G.B. Chloride mass balance for estimation of groundwater recharge in a semi-arid catchment of northern Ethiopia. Hydrogeol. J. 2019, 27, 363–378. [Google Scholar] [CrossRef]
  4. Israel, C.; Ricardo, H.; Carlos, M.; Bruno, C.; Leila, G.; Fernando, R.; Vinicius, F.B.; Sandra, P.; Isabela, H. Spatiotemporal groundwater recharge assessment under prolonged drought conditions in São Paulo State, Brazil. Sustain. Water Resour. Manag. 2026, 12, 29. [Google Scholar] [CrossRef]
  5. Hirata, R.; Goodarzi, L.; Rrig, F.S.; Alves, L.M.; Bertolo, R. Climate change impacts on groundwater: A growing challenge for water resources sustainability in Brazil. Environ. Monit. Assess. 2025, 197, 784. [Google Scholar] [CrossRef] [PubMed]
  6. Kaown, D.; Koh, D.-C.; Lee, K.-K. Effects of groundwater residence time and recharge rate on nitrate contamination deduced from δ18O, δD, 3H/3He and CFCs in a small agricultural area in Chuncheon, Korea. J. Hydrol. 2009, 366, 101–111. [Google Scholar] [CrossRef]
  7. Healy, R.W.; Cook, P.G. Using groundwater levels to estimate recharge. Hydrogeol. J. 2002, 10, 91–109. [Google Scholar] [CrossRef]
  8. David, P.-V.; Romero, J.; Collados-Lara, A.J.; Francisco Javier, A.; Francisca, F.-C.; Baena-Ruiz, L. Using the Turnover Time Index to Identify Potential Strategic Groundwater Resources to Manage Droughts within Continental Spain. Water 2020, 12, 3281. [Google Scholar] [CrossRef]
  9. King, A.C.; Raiber, M.; Cox, M.E.; Cendón, D.I. Comparison of groundwater recharge estimation techniques in an alluvial aquifer system with an intermittent/ephemeral stream (Queensland, Australia). Hydrogeol. J. 2017, 25, 1759–1777. [Google Scholar] [CrossRef]
  10. Fitts, C.R. Groundwater Science, 2nd ed.; Academic Press: Cambridge, MA, USA, 2012. [Google Scholar]
  11. Raiber, M.; Webb, J.A.; Cendón, D.I.; White, P.; Jacobsen, G. Environmental isotopes meet 3D geological modelling: Conceptualising recharge and structurally-controlled aquifer connectivity in the basalt plains of south-western Victoria, Australia. J. Hydrol. 2015, 527, 262–280. [Google Scholar] [CrossRef]
  12. Cherry, M.; Gilmore, T.; Mittelstet, A.; Gastmans, D.; Santos, V.; Gates, J.B. Recharge seasonality based on stable isotopes: Nongrowing season bias altered by irrigation in Nebraska. Hydrol. Process. 2020, 34, 1575–1586. [Google Scholar] [CrossRef]
  13. Akurugu, B.A.; Seidenfaden, I.K.; Obuobie, E.; Stisen, S.; Yidana, S.M.; Chegbeleh, L.P. Groundwater recharge estimation from multiple independent methods in the fractured hard rock aquifers in the Densu River Basin, Ghana. Sustain. Water Resour. Manag. 2025, 11, 10. [Google Scholar] [CrossRef]
  14. Saghravani, S.R.; Yusoff, I.; Wan Md Tahir, W.Z.; Othman, Z. Comparison of water table fluctuation and chloride mass balance methods for recharge estimation in a tropical rainforest climate: A case study from Kelantan River catchment, Malaysia. Environ. Earth Sci. 2015, 73, 4419–4428. [Google Scholar] [CrossRef]
  15. Kpegli, K.A.R.; Adandedji, F.; Ahouandogbo, C.; Djihouessi, M.B.; Hounkpe, J.; N’Tcha M’Po, Y.; Bossa, A.Y.; Alassane, A.; Sintondji, L.O.; Mama, D.; et al. Groundwater Recharge Assessment in Central Benin: The Case of the Collines Region (West Africa). Water 2024, 16, 1330. [Google Scholar] [CrossRef]
  16. N’Tcha M’Po, Y.; Lawin, E.A.; Yao, B.K.; Oyerinde, G.T.; Attogouinon, A.; Afouda, A.A. Decreasing Past and Mid-Century Rainfall Indices over the Ouémé River Basin, Benin (West Africa). Climate 2017, 5, 74. [Google Scholar] [CrossRef]
  17. Khan, R.; Islam, S.; Singh, R. Methods of estimating groundwater Recharge. Int. J. Eng. Assoc. 2016, 5, 6–9. [Google Scholar]
  18. Arnold, J.G.; Allen, P.M.; Muttiah, R.; Bernhardt, G. Automated Base Flow Separation and Recession Analysis Techniques. Groundwater 1995, 33, 1010–1018. [Google Scholar] [CrossRef]
  19. Degu, Y.; Kebede, S.; Birhanu, B. Estimating distributed national-scale groundwater recharge in Ethiopia using multiple methods. Appl. Water Sci. 2026, 16, 129. [Google Scholar] [CrossRef]
  20. Eriksson, E.; Khunakasem, V. Chloride concentration in groundwater, recharge rate and rate of deposition of chloride in the Israel Coastal Plain. J. Hydrol. 1969, 7, 178–197. [Google Scholar] [CrossRef]
  21. Ray, R.K.; Syed, T.H.; Saha, D.; Sarkar, B.C.; Reddy, D.V. Recharge mechanism and processes controlling groundwater chemistry in a Precambrian sedimentary terrain: A case study from Central India. Environ. Earth Sci. 2017, 76, 136. [Google Scholar] [CrossRef]
  22. Manu, E.; De Lucia, M.; Akiti, T.T.; Kühn, M. Stable Isotopes and Water Level Monitoring Integrated to Characterize Groundwater Recharge in the Pra Basin, Ghana. Water 2023, 15, 3760. [Google Scholar] [CrossRef]
  23. Arnaldo José Cambraia, N.; Rodrigues, L.N. Evaluation of groundwater recharge estimation methods in a watershed in the Brazilian Savannah. Environ. Earth Sci. 2020, 79, 140. [Google Scholar] [CrossRef]
  24. Becke, A.L.; Solórzano-Rivas, S.C.; Werner, A.D. The watertable fluctuation method of recharge estimation: A review. Adv. Water Resour. 2024, 189, 104635. [Google Scholar] [CrossRef]
  25. Hagedorn, B.; El-Kadi, A.I.; Mair, A.; Whittier, R.; Ha, K. Estimating recharge in fractured aquifers of a temperate humid to semiarid volcanic island (Jeju, Korea) from water table fluctuations, and Cl, CFC-12 and 3H chemistry. J. Hydrol. 2011, 409, 650–662. [Google Scholar] [CrossRef]
  26. Cartwright, I.; Weaver, T.R.; Stone, D.; Reid, M. Constraining modern and historical recharge from bore hydrographs, 3H, 14C, and chloride concentrations: Applications to dual-porosity aquifers in dryland salinity areas, Murray Basin, Australia. J. Hydrol. 2007, 332, 69–92. [Google Scholar] [CrossRef]
  27. Healy, R. Estimating Groundwater Recharge; Cambridge University Press: Cambridge, UK, 2010. [Google Scholar] [CrossRef]
  28. Lafare, A.E.A.; Peach, D.W.; Hughes, A.G. Use of point scale models to improve conceptual understanding in complex aquifers: An example from a sandstone aquifer in the Eden valley, Cumbria, UK. Hydrol. Process. 2021, 35, e14143. [Google Scholar] [CrossRef]
  29. Walker, D.; Parkin, G.; Schmitter, P.; Gowing, J.; Tilahun, S.A.; Haile, A.T.; Yimam, A.Y. Insights from a multi-method recharge estimation comparison study. Groundwater 2019, 57, 245–258. [Google Scholar]
  30. Vries, J.J.D.; Simmers, I. Groundwater recharge: An overview of processes and challenges. Hydrogeol. J. 2002, 10, 5–17. [Google Scholar] [CrossRef]
  31. Seidenfaden, I.; Mansour, M.; Bessiere, H.; Pulido-Velazquez, D.; Hjberg, A.; Samolov, K.A.; Baena-Ruiz, L.; Bishop, H.; Dessì, B.; Hinsby, K. Evaluating recharge estimates based on groundwater head from different lumped models in Europe. J. Hydrol. Reg. Stud. 2023, 47, 101399. [Google Scholar] [CrossRef]
  32. Banks, E.W.; Cook, P.G.; Owor, M.; Okullo, J.; Macdonald, A.M. Environmental tracers to evaluate groundwater residence times and water quality risk in shallow unconfined aquifers in sub Saharan Africa. J. Hydrol. 2020, 598, 125753. [Google Scholar]
  33. Peng, X.; Fan, J.; Wang, Q.; Warrington, D. Discrepancy of sap flow in Salix matsudana grown under different soil textures in the water-wind erosion crisscross region on the Loess Plateau. Plant Soil 2015, 390, 383–399. [Google Scholar]
  34. Chen, P.; Ma, X.; Ma, J.; Zeng, H.; Huang, Q.; Wang, Y.; Zhou, Y.; Zhang, L. Discrepancy and estimates of groundwater recharge under different land use types on the Loess Plateau. J. Hydrol. Reg. Stud. 2024, 53, 101793. [Google Scholar] [CrossRef]
  35. Zhai, Y.; Wang, J.; Huan, H. Characterizing the groundwater renewability and evolution of the strongly exploited aquifers of the North China Plain by major ions and environmental tracers. J. Radioanal. Nucl. Chem. 2013, 296, 1263–1274. [Google Scholar] [CrossRef]
  36. He, H.G.; Li, F.; Guo, W.J.; Sheng, D. Preliminary Analysis of the Impacts of Urbanization Development on Water Security in the Dongting Lake Area. Hunan Water Resour. Hydropower 2017, 2, 59–62. [Google Scholar]
  37. Ge, G.H.; Xiong, Y.J.; Li, Z.X. Analysis of Drought Characteristics in the Dongting Lake Area in 2022 and Its Implications. Hunan Water Resour. Hydropower 2023, 14, 54–59. [Google Scholar]
  38. Wang, X.; Xiao, W.H.; Zhu, W.Y.; Yan, D.H.; Hao, C.L.; Shi, X. Water Supply Security Issues in the Dongting Lake Area. South—North Water Transf. Water Sci. Technol. 2012, 10, 4. [Google Scholar]
  39. Hu, G.W.; Zhang, L. Current Status of Drinking Water Safety and Influencing Factors in the Dongting Lake Area after the Operation of the Three Gorges Project. Sci. Technol. Rev. 2018, 36, 8. [Google Scholar]
  40. Pi, J.G.; Liu, C.M.; Pan, S. Study on safe water supply from shallow groundwater in the Dongting Lake area. South China Geol. Miner. Resour. 2009, 4, 48–53. [Google Scholar]
  41. Huang, B.; Jiang, H.; Qian, Z.; Long, Q.B. Spatial Distribution Characteristics of Groundwater Quality around the Dongting Lake Area. China Rural Water Hydropower 2019, 10, 34–37. [Google Scholar]
  42. Yuan, R.Q.; Zhong, Y.X.; Long, X.T. Comprehensive Evaluation of Shallow Groundwater Quality in the Upstream Plain of Dongting Lake. Water Resour. Prot. 2021, 37, 121–127. [Google Scholar]
  43. Fu, P.Y.; Liang, X.; Chang, Z.K.; Zhang, X.; Sun, L.Q.; Cao, M.D.; Zhang, Z.X.; Zhang, J. Distribution and Sources of Antimony (Sb) in Groundwater at the Lower Reaches of the Zishui River. Earth Sci. 2023, 48, 4229–4242. [Google Scholar]
  44. Chang, Z.K.; Ma, B.; Li, J.; Liang, X.; Fu, P.Y.; Cao, M.D.; Zhang, Z.X.; Du, Y.C. Study on the age and circulation renewal of shallow groundwater in the Dongting Basin based on tritium and CFCs. Earth Sci.-J. China Univ. Geosci. 2023, 48, 4256–4269. [Google Scholar]
  45. Wang, J.X. Coupled Simulation Study of Hydrological and Groundwater Numerical Models in the Jianghan–Dongting Plain Basin. Ph.D. Thesis, China University of Geosciences, Wuhan, China, 2015. [Google Scholar]
  46. Chen, D.P.; Li, C.A.; Bai, D.Y.; He, Y.; Jiang, Q.S.; Chen, S.Q. Preliminary Establishment of the Quaternary Stratigraphic Framework in the Dongting Basin. Geol. Sci. Technol. Inf. 2014, 33, 7. [Google Scholar]
  47. Sun, L.Q.; Zhang, X.; Liang, X.; Chang, Z.K.; Fu, P.Y.; Zhang, J. Identification and Characteristics of the Quaternary Sedimentary Environment in the Zishui Delta Region of the Dongting Basin. Earth Sci. 2021, 46, 3245–3257. [Google Scholar]
  48. Yang, L.; Qi, Y.; Zheng, C.; Andrews, C.; Yue, S.; Lin, S.; Li, Y.; Wang, C.; Xu, Y.; Li, H. A Modified Water-Table Fluctuation Method to Characterize Regional Groundwater Discharge. Water 2018, 10, 503. [Google Scholar] [CrossRef]
  49. Misstear, B.D.R. Groundwater recharge assessment: A key component of river basin management. In Proceedings of the National Hydrology Seminar on “River Basin Management”, Tullamore, Ireland, 21 November 2000. [Google Scholar]
  50. Delin, G.N.; Healy, R.W.; Lorenz, D.L.; Nimmo, J.R. Comparison of local- to regional-scale estimates of ground-water recharge in Minnesota, USA. J. Hydrol. 2007, 334, 231–249. [Google Scholar] [CrossRef]
  51. Welch, H.L.; Green, C.T.; Coupe, R.H. The fate and transport of nitrate in shallow groundwater in northwestern Mississippi, USA. Hydrogeol. J. 2011, 19, 1239–1252. [Google Scholar] [CrossRef]
  52. Hinkle, S.; Bohlke, J.; Duff, J.; Morgan, D.; Weick, R. Aquifer-scale controls on the distribution of nitrate and ammonium in ground water near La Pine, Oregon, USA. J. Hydrol. 2007, 333, 486–503. [Google Scholar] [CrossRef]
  53. Cartwright, I.; Cendón, D.; Currell, M.; Meredith, K. A review of radioactive isotopes and other residence time tracers in understanding groundwater recharge: Possibilities, challenges, and limitations. J. Hydrol. 2017, 555, 797–811. [Google Scholar] [CrossRef]
  54. Plummer, N.; Rupert, M.G.; Busenberg, E.; Schlosser, P. Age of irrigation water in ground water from the Eastern Snake River Plain Aquifer, south-central Idaho. Ground Water 2000, 38, 264–283. [Google Scholar] [CrossRef]
  55. Chambers, L.; Gooddy, D.; Binley, A. Use and application of CFC-11, CFC-12, CFC-113 and SF6 as environmental tracers of groundwater residence time: A review. Geosci. Front. 2019, 10, 1643–1652. [Google Scholar] [CrossRef]
  56. Cook, P.; Dogramaci, S.; McCallum, J.; Hedley, J. Groundwater age, mixing and flow rates in the vicinity of large open pit mines, Pilbara region, northwestern Australia. Hydrogeol. J. 2017, 25, 39–53. [Google Scholar] [CrossRef]
  57. Allison, G.B.; Hughes, M.W. The use of environmental chloride and tritium to estimate total recharge to an unconfined aquifer. Soil Res. 1978, 16, 181–195. [Google Scholar] [CrossRef]
  58. Wood, W.W. Use of and misuse of the chloride-mass balance method in estimating groundwater recharge. Ground Water 1999, 37, 2–3. [Google Scholar] [CrossRef]
  59. Johnson, A.I. Specific Yield: Compilation of Specific Yields for Various Materials; Water-Supply Paper 1662-D; U.S. Government Printing Office: Washington, DC, USA, 1967.
  60. Labrecque, G.; Chesnaux, R.; Boucher, M.-A. Water-table fluctuation method for assessing aquifer recharge: Application to Canadian aquifers and comparison with other methods. Hydrogeol. J. 2020, 28, 521–533. [Google Scholar] [CrossRef]
  61. Walraevens, K.; Bennett, G.; Alfarrah, N.; Gebreyohannes, T.; Berhane, G.; Hagos, M.; Hussien, A.; Nigate, F.; Belay, A.S.; Birhanu, A.; et al. Assessing the Potential of Volcanic and Sedimentary Rock Aquifers in Africa: Emphasizing Transmissivity, Water Quality, and Recharge as Key Evaluation Metrics. Water 2025, 17, 109. [Google Scholar] [CrossRef]
  62. Kebede, A.B.; Tufa, F.G.; Kitessa, W.M.; Gudeta, B.G.; Debela, S.K.; Yenehun, A.; Feyessa, F.F.; Hermans, T.; Walraevens, K. Estimation of Groundwater Recharge in the Volcanic Aquifers in a Tropical Climate, Southwestern Ethiopia: Insights from Water Table Fluctuation and Chloride Mass Balance Methods. Water 2025, 17, 3043. [Google Scholar] [CrossRef]
  63. Pan, X.Z. Characteristics and Causes of the Chemical Composition of Atmospheric Precipitation in Yiyang City. Guangdong Chem. Ind. 2019, 46, 2. [Google Scholar]
  64. Ait El Mekki, O.; Laftouhi, N.-E.; Hanich, L. Estimate of regional groundwater recharge rate in the Central Haouz Plain, Morocco, using the chloride mass balance method and a geographical information system. Appl. Water Sci. 2017, 7, 1679–1688. [Google Scholar] [CrossRef][Green Version]
  65. Shi, X.; Xiao, W.H.; Wang, Y.; Wang, X. Analysis of the Overall Variation Characteristics and Causes of Dongting Lake Water Levels over the Past 50 Years. South—North Water Transf. Water Sci. Technol. 2012, 10, 5. [Google Scholar]
  66. Wang, J.L.; Huang, B.; Zheng, Y.; Xu, Y. Study on the Spatial Distribution Characteristics of Groundwater Levels around the Dongting Lake Area. Resour. Environ. Yangtze Basin 2020, 29, 9. [Google Scholar]
  67. Katz, B.G.; Eberts, S.M.; Kauffman, L.J. Using Cl/Br ratios and other indicators to assess potential impacts on groundwater quality from septic systems: A review and examples from principal aquifers in the United States. J. Hydrol. 2011, 397, 151–166. [Google Scholar] [CrossRef]
  68. Merouchi, H.; Bouderbala, A.; Elmeddahi, Y. Integrating chloride mass balance and water table fluctuation methods for enhanced groundwater recharge estimation in semi-arid regions: A case study of the Upper Cheliff Alluvial Aquifer, Algeria. Acta Geophys. 2025, 73, 5839–5854. [Google Scholar] [CrossRef]
Figure 1. (a) The location of the Yangtze River Watershed, Hunan Province, and the Dongting Plain. (b) Location of the Dongting Plain and the Zishui Plain. (c) Geomorphic types, surface water systems, and sampling site distribution in the study area. Legend: 1, Holocene; 2, Middle Pleistocene; 3, Proterozoic; 4, location of monitoring wells; 5, watershed; 6, geological section; 7, geomorphic boundary; 8, urban settlements; 9, groundwater levels; 10, groundwater flow direction.
Water 18 01871 g001
Figure 2. Hydrogeological cross section (A–A′ in Figure 1c).
Water 18 01871 g002
Figure 3. Precipitation and groundwater-level fluctuations at the monitoring wells in the Zishui Plain.
Water 18 01871 g003
Figure 4. Spatial distribution of groundwater recharge (2019–2021) and its relationship with precipitation in different zones.
Water 18 01871 g004
Figure 5. Spatial distribution of groundwater recharge (mm/year) estimated using the groundwater age method.
Water 18 01871 g005
Figure 6. Spatial distribution of groundwater recharge (mm/year) estimated using the CMB method.
Water 18 01871 g006
Figure 7. Shallow groundwater recharge conceptual model of Zishui Plain. The lithological legends are the same as in Figure 2.
Water 18 01871 g007
Table 1. Estimated groundwater annual recharge using the WTF method.
Well CodeYearh (m)SyR (mm/Year)P/R (%)
J120191.480.114810.8
20200.710.1714.7
20210.790.1796.2
J220193.020.130222.1
20202.770.127718.2
20212.50.125019.6
J320192.570.125718.8
20202.520.125216.5
20211.750.117513.7
J420194.960.149636.3
20204.730.147331.1
20214.380.143834.4
average 268.219.4
Table 2. Recharge estimates calculated from the groundwater age method. The groundwater age calculation procedure for sample ages is presented in Chang [44].
Sample CodeDepth (m)AgeφR (mm/Year)R/P (%)
GW101460.80.3332.8524.2
GW3617650.3196.2514.3
GW4315720.3268.2719.5
GW5112610.3182.2013.3
GW59963.20.3280.8520.5
GW6212400.3247.6118.0
GW63935.50.3174.9712.7
GW829410.3180.5913.2
GW881043.60.3114.078.3
GW1914400.3284.5720.7
average 226.216.5
Table 3. Estimated groundwater recharge using the CMB method.
Sample CodeClgw (mg/L)Clp (mg/L)P (mm)R (mm)R/P (%)
GW106.961.331373262.2119.1
GW3638.561.33137347.363.4
GW436.961.331373262.43 19.1
GW5121.011.33137386.916.3
GW594.651.331373392.6428.6
GW6216.731.331373109.137.9
GW637.171.331373254.6018.5
GW8228.101.33137364.984.7
GW8818.621.33137398.107.1
GW1919.781.33137392.336.7
GW2214.711.331373124.149.0
GW328.721.331373209.4915.3
average16.111.331373167.0312.2
Disclaimer/Publisher’s Note: The statements, opinions and data contained in all publications are solely those of the individual author(s) and contributor(s) and not of MDPI and/or the editor(s). MDPI and/or the editor(s) disclaim responsibility for any injury to people or property resulting from any ideas, methods, instructions or products referred to in the content.