Article

ENSO-Induced Heterogeneous Response of Landfalling Tropical Cyclone Precipitation over East China


1
Shenzhen Institute of Guangdong Ocean University, Shenzhen 518108, China
2
Key Laboratory of High Impact Weather (special), China Meteorological Administration, Changsha 410000, China
3
South China Sea Institute of Marine Meteorology, College of Ocean and Meteorology, Guangdong Ocean University, Zhanjiang 524088, China
4
Western Guangdong Key Laboratory of Marine Meteorological Disaster Theory and Application, Guangdong Ocean University, Zhanjiang 524088, China
5
Donghai Laboratory, Zhoushan 316021, China
*
Author to whom correspondence should be addressed.
Water 2026, 18(15), 1849; https://doi.org/10.3390/w18151849
Submission received: 11 June 2026 / Revised: 16 July 2026 / Accepted: 20 July 2026 / Published: 30 July 2026
(This article belongs to the Section Water and Climate Change)

Abstract

East China is a global hotspot for landfalling tropical cyclones (TCs). While previous studies have extensively examined the influence of El Niño–Southern Oscillation (ENSO) on TC activity, whether and how ENSO alters the spatial organization of precipitation in landfalling TCs remains insufficiently understood. Using high-resolution satellite precipitation observations and ERA5 reanalysis data, this study investigates the heterogeneous responses of landfalling TC precipitation over East China to different ENSO phases. Composite analyses indicate ENSO-associated differences in TC precipitation at both regional and storm-relative scales. At the regional scale, positive composite precipitation differences occur over Fujian, southern Zhejiang, and Taiwan during El Niño years, whereas negative differences occur in parts of northern East China relative to La Niña years. At the storm-relative scale, mean outer-rainband precipitation was estimated to be 26.02% higher during El Niño years; however, the storm-level bootstrap 95% confidence interval included zero, indicating uncertainty associated with the limited number of independent TC events. Precipitation during La Niña years was relatively more concentrated within the inner-core region. Mechanistic diagnostics show that the El Niño composite is associated with differences in thermodynamic and dynamic conditions, including higher low-level cyclonic vorticity, upper-level divergence, ascent, and anomalous steering flows over southern East China and adjacent seas. TC-centric analysis further indicates that higher moisture supply and dynamic lifting coincide with the outer-rainband precipitation contrast during El Niño years. These findings suggest that ENSO is associated with spatially heterogeneous and structurally distinct responses of landfalling TC precipitation over East China, providing a diagnostic basis for understanding ENSO-related differences in regional TC precipitation risk.

1. Introduction

Tropical cyclones (TCs) are destructive natural weather systems over the western North Pacific (WNP), generating extreme winds and heavy precipitation that frequently strike the East Asian coast [1,2,3]. East China is vulnerable to landfalling TCs [4,5]. Upon landfall, a TC’s destructive winds typically weaken rapidly due to increased surface friction and reduced ocean heat fluxes. However, TC-induced precipitation often persists or even intensifies as the storm interacts with complex inland topography and baroclinic environments [6,7]. Evidence suggests that these water-related hazards can cause more extensive economic losses and human casualties than direct wind impacts [8,9,10,11,12]. Recent studies have documented notable changes in WNP TC activity, including shifts in landfalling track densities and intensification rates [13,14], suggesting that the precipitation footprint of landfalling TCs may be increasingly shaped by the evolving background climate state.
El Niño–Southern Oscillation (ENSO) acts as a major large-scale climate signal modulating these interannual variations in the WNP [15]. Previous research has indicated that ENSO influences WNP TC activities across multiple dimensions, including genesis location, track patterns, peak intensity, and overall landfall frequency [16,17,18,19,20]. For instance, during El Niño phases, TC genesis locations tend to shift southeastward, resulting in longer over-ocean durations, greater potential intensities, and a higher tendency to recurve northward before reaching the Asian continent. Conversely, La Niña phases favor northwestward genesis, leading to more frequent landfalls over southern and eastern China [21]. ENSO is also associated with variations in the large-scale circulation over East Asia, including variations in the intensity and position of the western Pacific subtropical high and tropical moisture transport pathways [22]. These circulation anomalies may influence TC tracks and the ambient thermodynamic environments encountered by TCs, with implications for broad-scale precipitation patterns across China.
Despite these advances, existing studies predominantly focus on the interannual variations in TC genesis frequency and generalized tracks. While previous studies have explored the total precipitation volumes associated with landfalling TCs [23,24,25], comparatively less attention has been paid to the spatial structure of landfalling TC precipitation and its evolutionary processes over East China. Recent work has begun to examine ENSO-related variations in TC precipitation structure over the broader WNP basin and has reported associated differences in TC precipitation patterns [26,27]. However, quantitative assessments of the structural differences in TC precipitation within the East China domain remain limited [28,29,30]. In addition, the processes through which synoptic-scale factors are associated with TC precipitation structure and post-landfall precipitation persistence over East China require further examination [31,32,33,34,35].
This study investigates the heterogeneous responses and environmental mechanisms of TC precipitation over East China under different ENSO phases. The novelty of this study lies in its integrated analysis of ENSO-related landfalling TC precipitation responses from both regional and storm-relative perspectives. Specifically, this study uses high-resolution Integrated Multi-satellitE Retrievals for GPM (IMERG) precipitation observations to quantify regional precipitation heterogeneity, applies a TC-relative framework to distinguish precipitation changes between the inner-core and outer-rainband regions, and combines ERA5 environmental diagnostics to examine the dynamical and thermodynamic conditions associated with these precipitation differences. Through this framework, this study aims to examine how ENSO is associated with multiscale differences in landfalling TC precipitation over East China. The remainder of this study is organized as follows. Section 2 describes the data and methodology. Section 3 presents the heterogeneous regional and storm-relative responses of TC precipitation under different ENSO phases. Section 4 investigates the environmental conditions associated with the observed precipitation redistribution.

2. Data and Methods

2.1. Data

TC track data are obtained from the IBTrACS dataset, which provides key parameters including TC center location, maximum sustained wind speed, and minimum sea-level pressure at 3-h intervals [36,37]. In this study, TCs affecting eastern China, defined as those making landfall in the coastal regions of Zhejiang, Fujian, Jiangsu, Anhui, Taiwan and Shanghai during 1998–2024, are selected for analysis.
Precipitation data are derived from the Final Run product of IMERG covering 1998–2024 at a spatial resolution of 0.1° × 0.1° and a half-hourly temporal resolution. Previous studies have shown that high-resolution global satellite precipitation observations can capture the spatiotemporal characteristics of TC precipitation intensity [38], and their relatively high spatial resolution enables the characterization of detailed precipitation structures within small radii of a TC [39]. Following the approach of previous studies [40,41], TC-induced precipitation is defined as precipitation occurring within a 500 km radius of the TC center. Large-scale atmospheric variables are extracted from the ERA5 reanalysis [42], at a spatial resolution of 0.25° × 0.25° and an hourly temporal resolution. The variables used include zonal and meridional winds, relative vorticity, divergence, vertical velocity, and vertically integrated moisture flux convergence (VIMFC).
For identifying El Niño and La Niña events, the monthly Sea Surface Temperature (SST) data used in this study are derived from the Hadley Centre Sea Ice and Sea Surface Temperature (HadISST1) dataset [43], released by the Met Office Hadley Centre, with a spatial resolution of 1° × 1°.

2.2. Methods

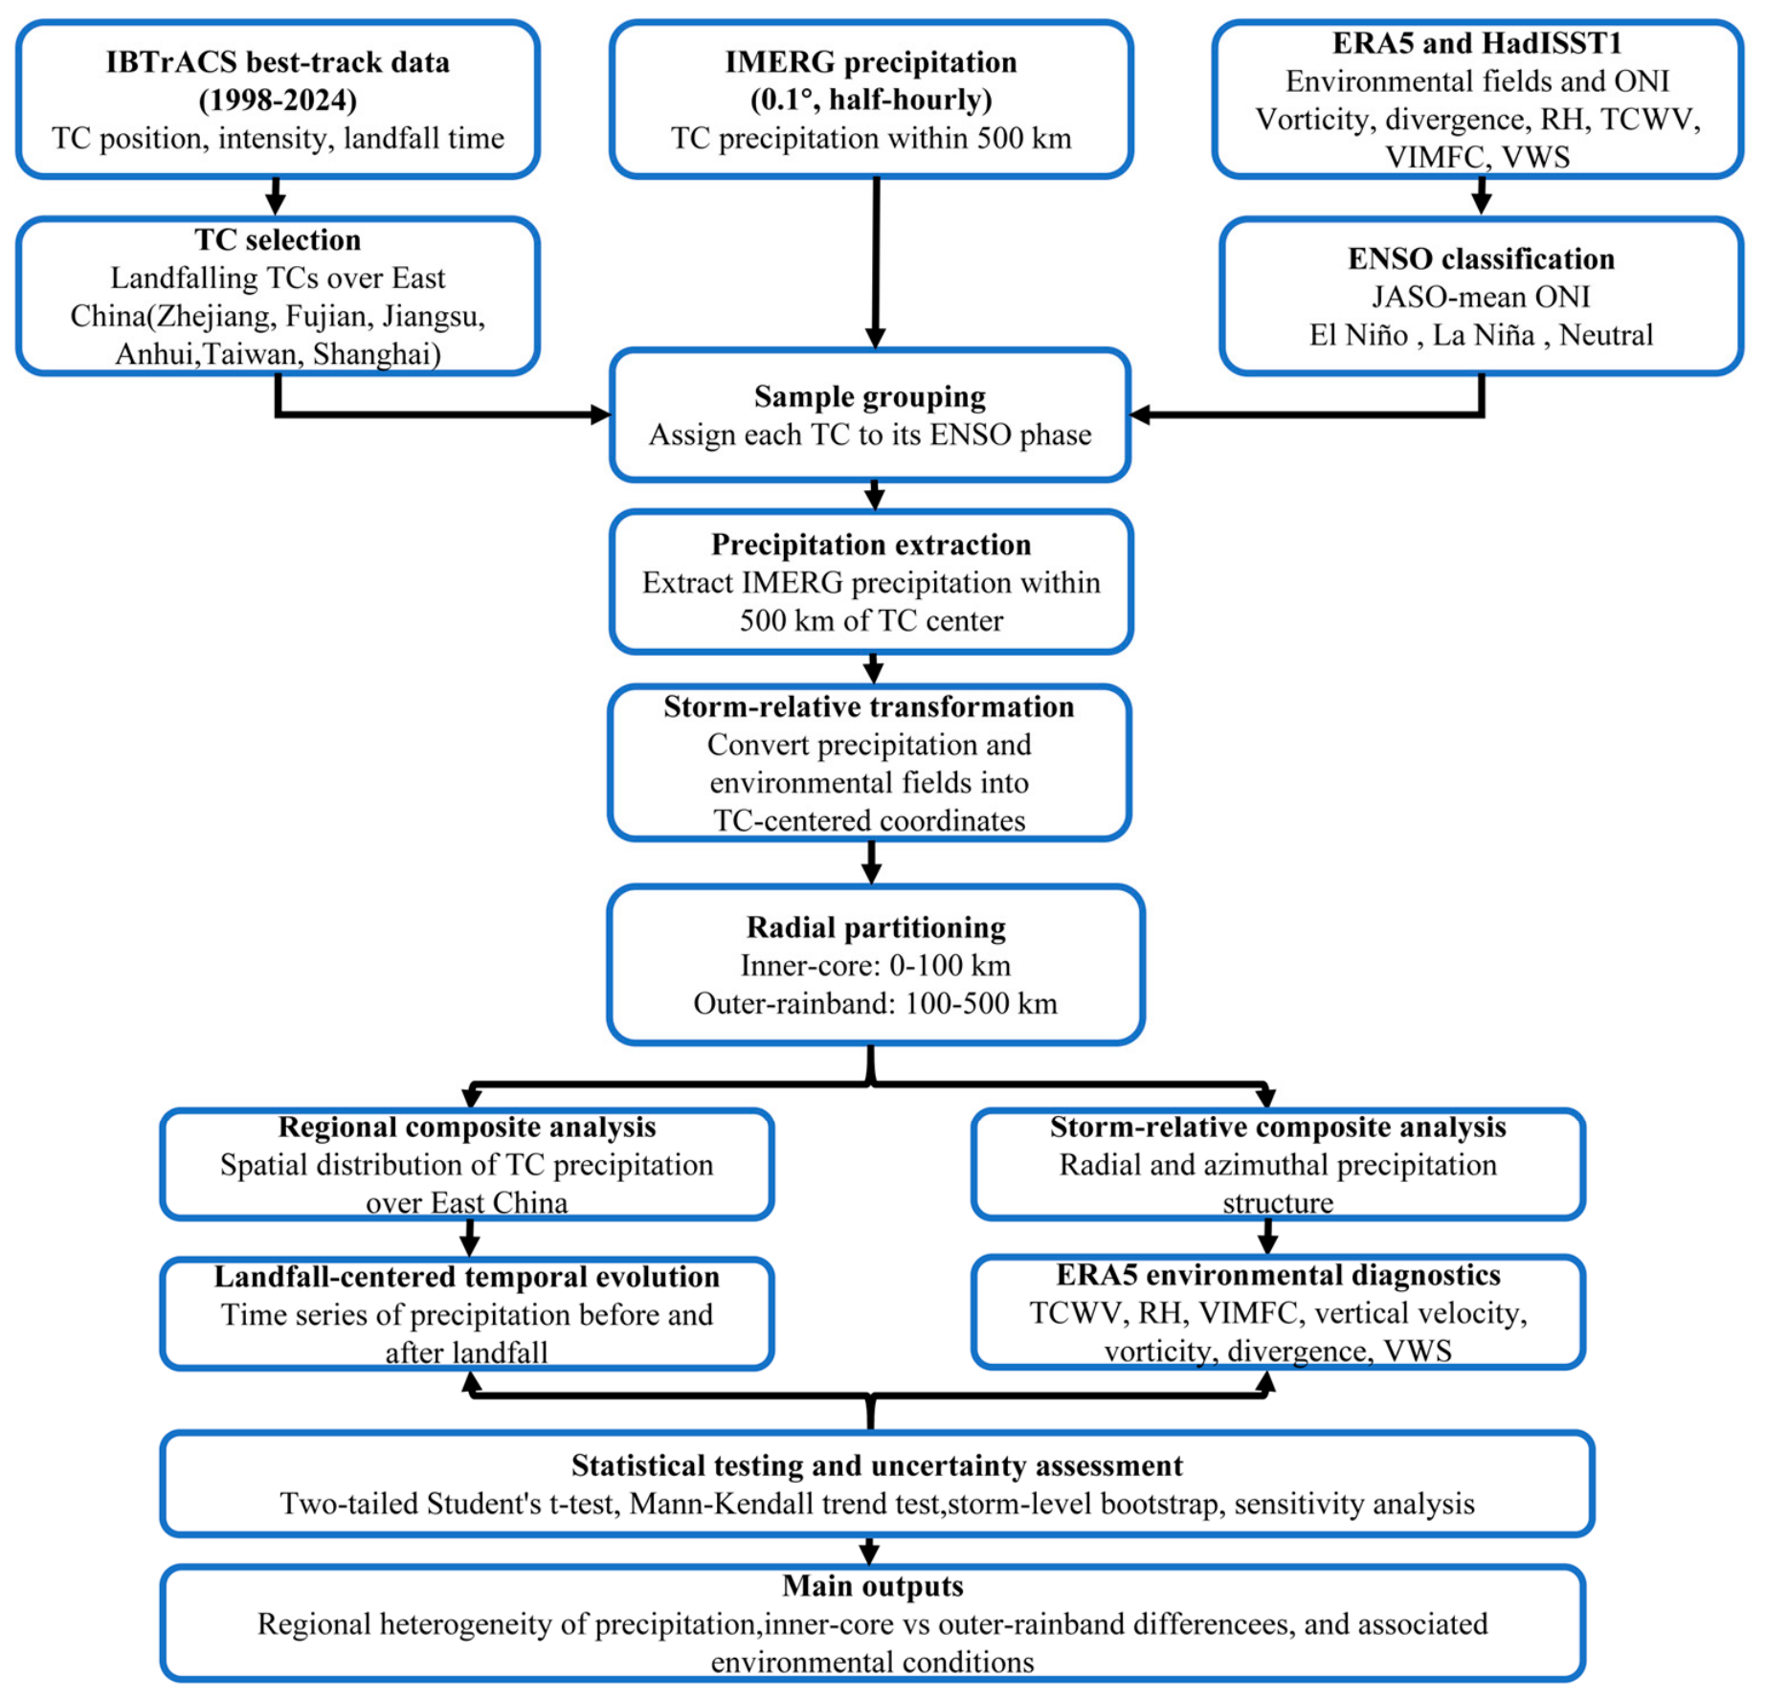
The overall methodological framework, including TC selection, ENSO classification, precipitation analysis, and environmental diagnostics, is illustrated in Figure 1.
Vertical wind shear (VWS) is an important environmental factor influencing TC structure and precipitation distribution. Based on the wind field data described above, this study defines VWS following the method of Yu et al. [28] as the magnitude of the vector difference between the mean wind fields at 200 hPa and 850 hPa within a 500 km radius of the TC center. The calculation formula is as follows:
VWS   =   u 200   u 850 2 + v 200   v 850 2
where u and v denote the zonal and meridional wind components.
Moisture transport and convergence are critical thermodynamic factors modulating the intensity and distribution of TC precipitation. To quantitatively characterize the asymmetric distribution of moisture conditions, this study calculated the VIMFC, following the definition by Banacos and Schultz (2005) as the negative divergence of the vertically integrated moisture flux vector [44]. This metric comprehensively reflects the combined contributions of moisture advection and mass convergence to precipitation. The calculation formula is expressed as follows:
VIMFC = · Q = Q u x + Q v y
where Qu and Qv represent the zonal and meridional components of Q, respectively. Q denotes the vertically integrated moisture flux vector, which is calculated as follows:
Q = 1 g P top P s q   V dp
where g represents the gravitational acceleration (9.8 m·s−2), and q denotes the specific humidity (kg·kg−1). V indicates the horizontal wind vector, consisting of the zonal component u (positive eastward) and the meridional component v (positive northward). Ps represents the surface pressure, and Ptop is the pressure at the top of the integration layer (300 hPa).
To classify TC samples by ENSO phase, the Oceanic Niño Index (ONI) was calculated from the HadISST dataset as the 3-month running mean of SST anomalies in the Niño 3.4 region (5° S–5° N, 170°–120° W) relative to the 1981–2010 climatological base period. The July–October (JASO) mean ONI was adopted to characterize the ENSO background during the late-summer-to-autumn season, when landfalling TC precipitation over East China is most active. This seasonal ONI-based classification is consistent with previous TC rainfall studies that define ENSO phases using ONI averaged over the main TC rainfall season [27]. A year was classified as El Niño (La Niña) if the JASO mean ONI was greater than or equal to 0.5 °C (less than or equal to −0.5 °C); otherwise, it was classified as Neutral. Five El Niño years (2002, 2004, 2009, 2015, and 2023) and seven La Niña years (1998, 1999, 2007, 2010, 2011, 2020, and 2022) met these selection criteria. TCs were then assigned to the ENSO phase of their year of occurrence. Based on this classification, the analysis included 14 TCs under El Niño conditions and 18 TCs under La Niña conditions over the 1998–2024 period. Neutral years were retained in the classification to provide background information on interannual TC occurrence. Therefore, they were not included in the primary El Niño-La Niña composite comparison.
A TC-relative coordinate system is used to composite the spatial distributions of TC precipitation and atmospheric variables [45]. Each TC center is relocated to the coordinate origin, allowing the asymmetric precipitation structure and radial distribution to be compared across ENSO phases.
The Mann–Kendall test was applied to annual time series to assess long-term variations in TC precipitation and environmental variables, with each annual value treated as one temporal observation. For comparisons between El Niño and La Niña phases, the independent sampling unit was the TC event. Each TC event contributed one event-level value or event-mean field to the statistical comparison of storm-relative precipitation metrics and spatial composite fields. Differences in scalar metrics were evaluated using a two-tailed Student’s t-test, whereas spatial differences were assessed at each grid point using a two-sided Mann–Whitney U test. For the landfall-centered temporal evolution, the comparison at each relative time used one observation from each TC event; observations at successive relative times from the same event were not pooled as independent samples. Black dots in the figures indicate grid points at which the pointwise local differences are significant at the 95% confidence level. No field significance or false discovery rate (FDR) correction was applied to the spatial tests.
Considering the dependence among multiple time windows from the same TC event, we further estimated the uncertainty of key storm-relative precipitation metrics using a storm-level bootstrap approach. In each bootstrap iteration, TC events were resampled with replacement within the El Niño and La Niña groups, respectively. The precipitation metric was calculated at the event level before deriving the group-mean difference between the two ENSO phases. This procedure was repeated 10,000 times to obtain the bootstrap distribution of the storm-level precipitation difference and the corresponding 95% confidence interval.

3. Heterogeneous Responses of Landfalling TC Precipitation to ENSO

3.1. ENSO-Modulated Landfalling TC Activity and Precipitation

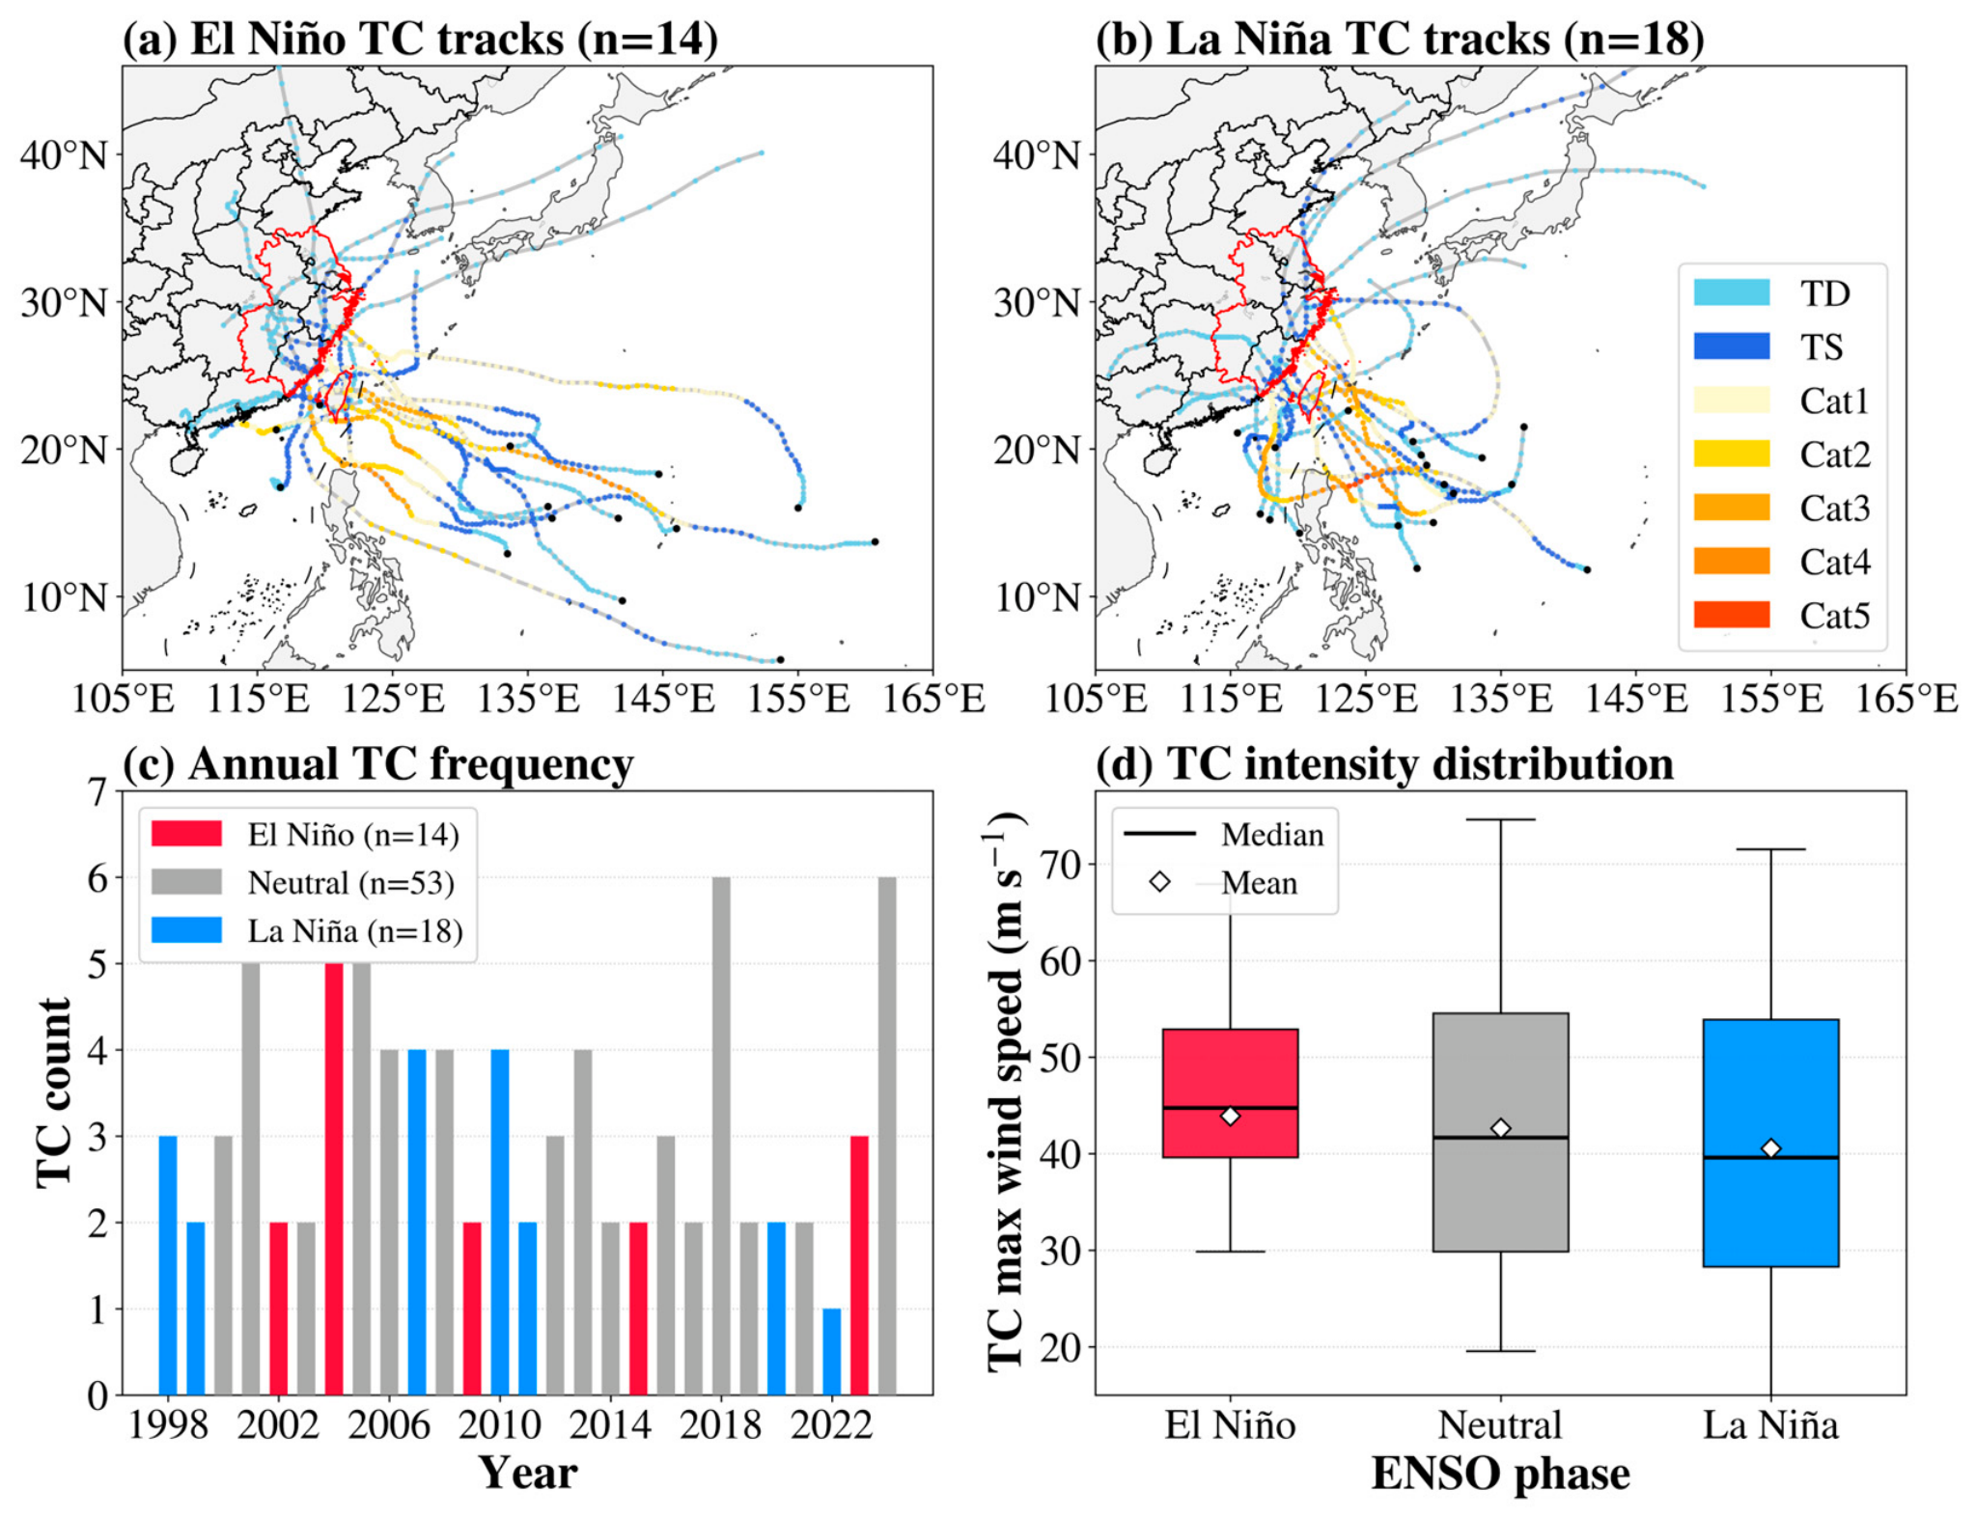
Figure 2 illustrates the TC tracks, annual frequency, and intensity distributions for El Niño and La Niña years. Regarding the spatial distribution of TC tracks, TCs during El Niño years tend to penetrate further inland into East China (Figure 2a), whereas those during La Niña years exhibit a more pronounced northward shift, with more TCs originating from the South China Sea (Figure 2b). The overall frequency of TCs making landfall in East China shows no significant difference between the two ENSO phases (Figure 2c). The statistical distribution of the maximum lifetime wind speed achieved by each TC, stratified by background climate states, reveals that TCs in El Niño years have a slightly higher mean peak intensity than those in La Niña years (Figure 2d). These differences in TC track characteristics, frequency, and intensity between El Niño and La Niña years provide a basis for examining how ENSO phases modulate the associated precipitation distribution and structure over East China.
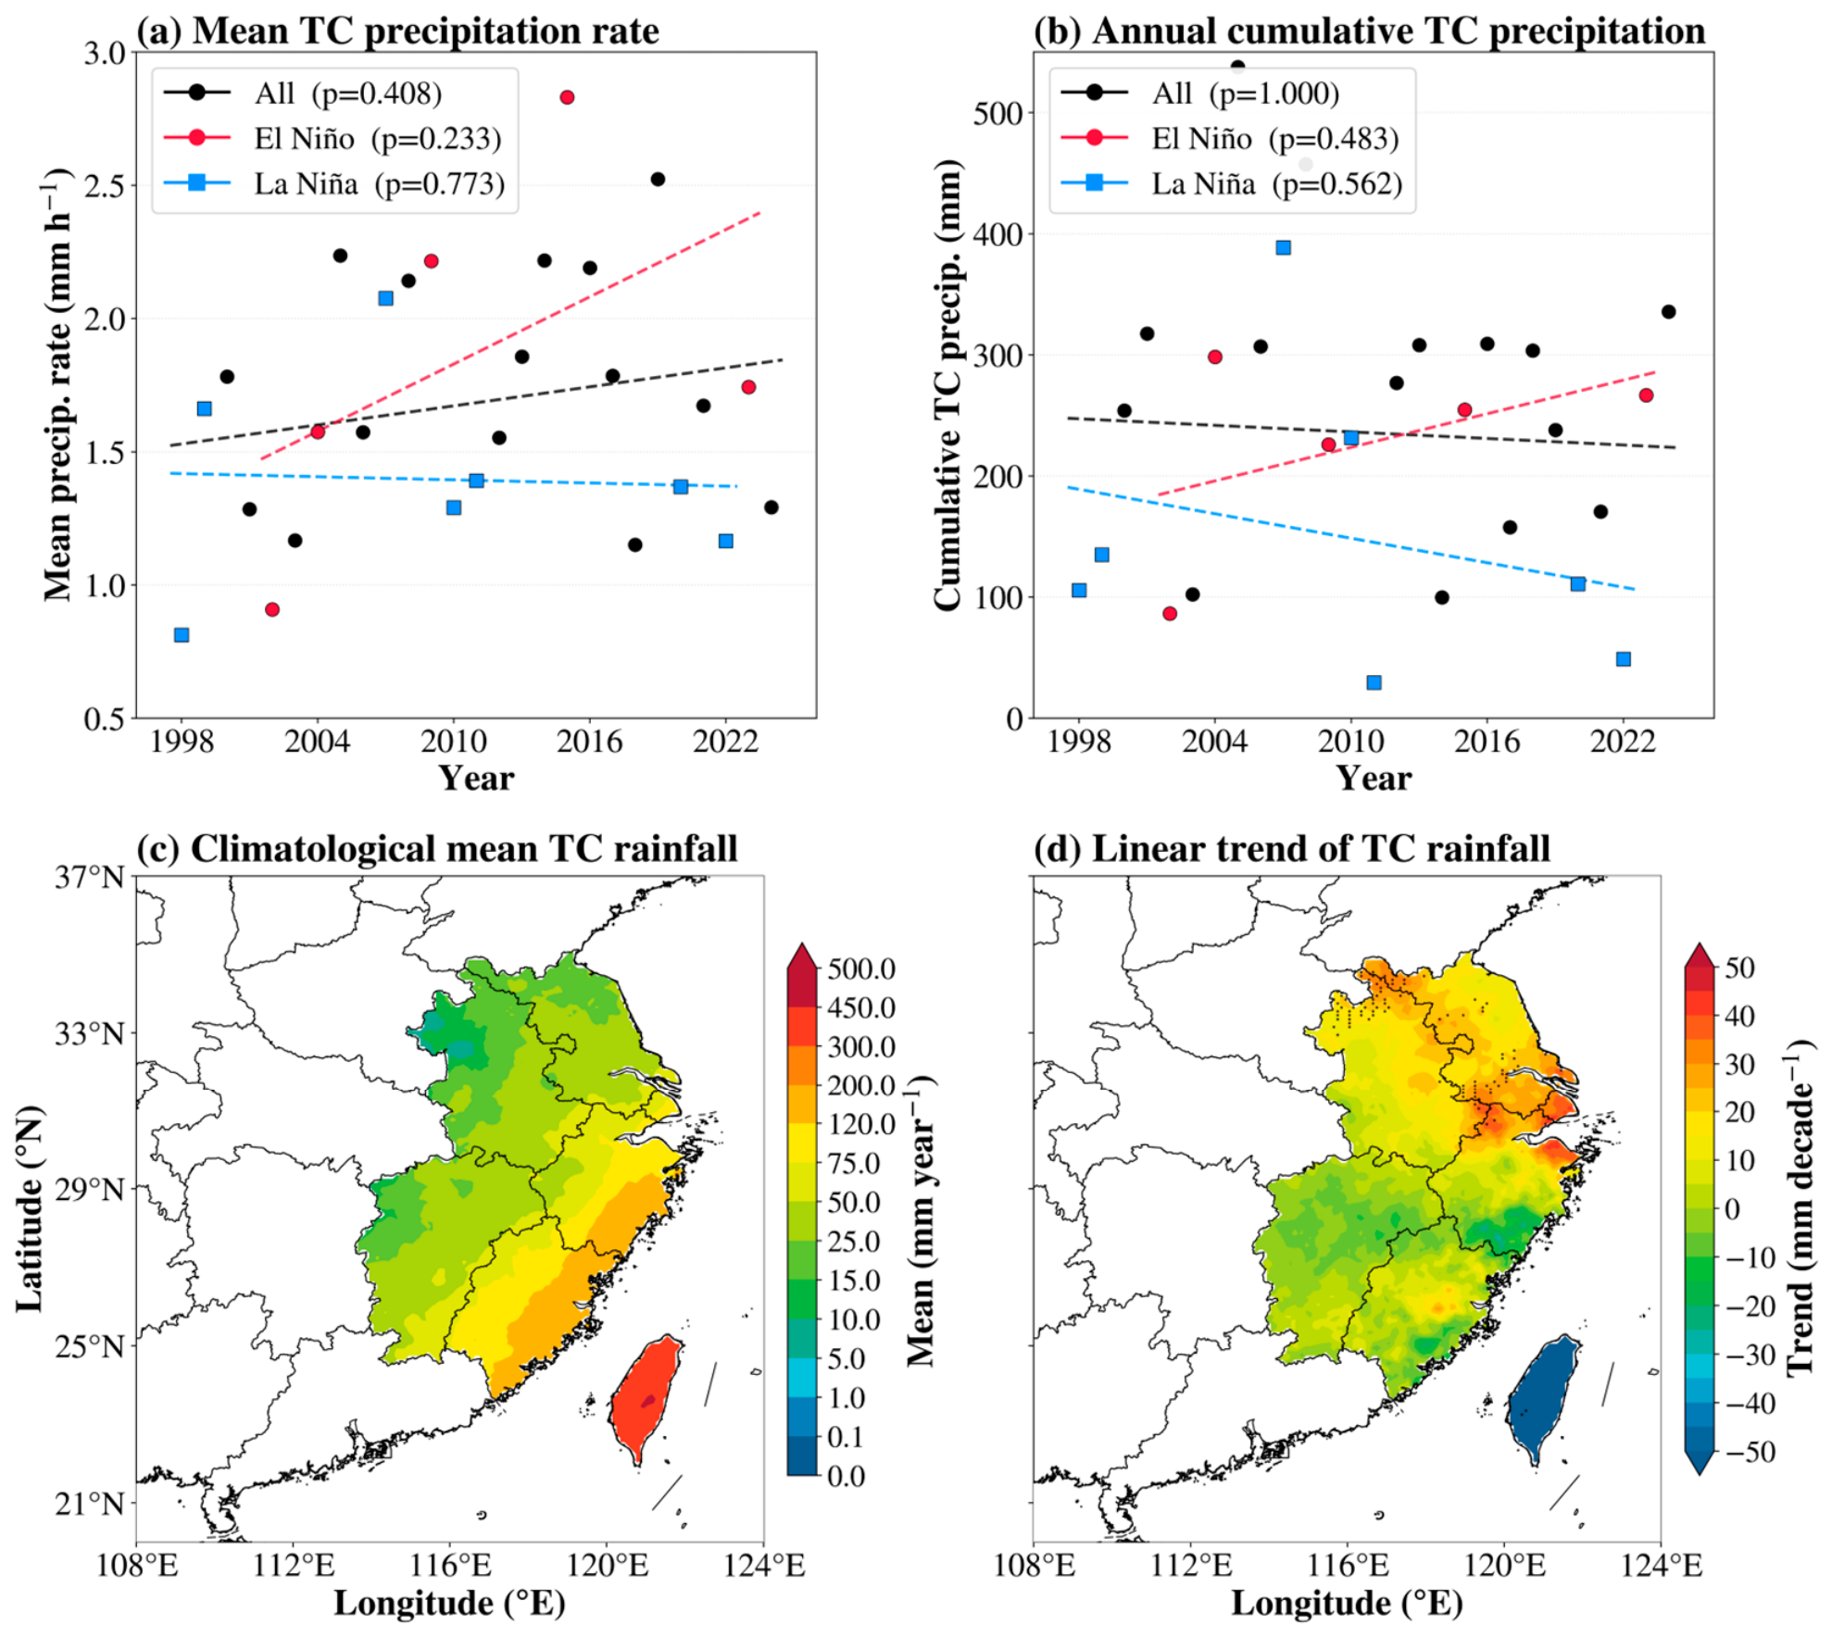
To further reveal the characteristics of landfalling TC precipitation over East China under different ENSO phases, this study conducts a statistical analysis of the mean precipitation intensity, annual accumulated TC precipitation, and their spatial distribution using high-resolution satellite precipitation data from 1998 to 2024. The results show that the overall mean precipitation intensity of TCs exhibits a weak increasing trend (p = 0.408, Figure 3a), with an increase of 0.12 mm h−1 decade−1. Under different ENSO phases, the mean precipitation intensity of landfalling TCs in East China during El Niño years shows an overall increasing trend (0.42 mm h−1 decade−1), with particularly higher precipitation intensity in some years after 2010. The peak precipitation intensity occurred in 2015, reaching as high as 2.83 mm h−1, suggesting higher mean precipitation intensity during El Niño years, although the limited sample size warrants caution in interpreting this difference. In contrast, the mean TC precipitation intensity during La Niña years shows a weaker trend. The variation in annual accumulated TC precipitation further indicates that the total TC precipitation in East China is significantly influenced by individual years and single TC events. The overall annual accumulated TC precipitation shows no statistically significant change (Figure 3b). During El Niño years, accumulated TC precipitation exhibits a certain increasing trend, with an increase of 46.21 mm decade−1, while during La Niña years, it shows a decreasing trend (−33.69 mm decade−1). These results suggest that the total precipitation of landfalling TCs in East China under El Niño conditions tends to increase, though this trend is not statistically significant. It should be noted that due to the limited number of landfalling TC samples in East China and the large contribution of individual heavy-precipitation TCs to annual accumulated precipitation, the variation in annual accumulated precipitation is susceptible to sample size and extreme cases.
From a climatological spatial distribution perspective, East China TC precipitation exhibits a clear pattern of decreasing from the coast inland (Figure 3c). High-value areas of mean TC precipitation are mainly distributed in Taiwan, Fujian, coastal Zhejiang, and adjacent southeast coastal regions, with Taiwan experiencing the highest precipitation, exceeding 300 mm annually. In contrast, TC precipitation in Anhui, northern Jiangxi, and inland areas is relatively low. Further analysis of the spatial trends in TC precipitation reveals significant regional differences in TC precipitation changes across East China (Figure 3d). In southern Jiangsu, Shanghai, northern Zhejiang, and some coastal areas, TC precipitation shows an increasing trend, with locally pronounced increases, implying that the risk of TC precipitation affecting northern East China and the Yangtze River Delta region may have increased in recent years. Meanwhile, southern Fujian and Taiwan show decreasing trends, with Taiwan exhibiting a particularly notable decline. This north–south difference suggests that the change in East China TC precipitation is not a uniform increase across the entire region but rather a regional adjustment of the precipitation impact range or the primary precipitation center.

3.2. Heterogeneous Regional Responses of TC Precipitation

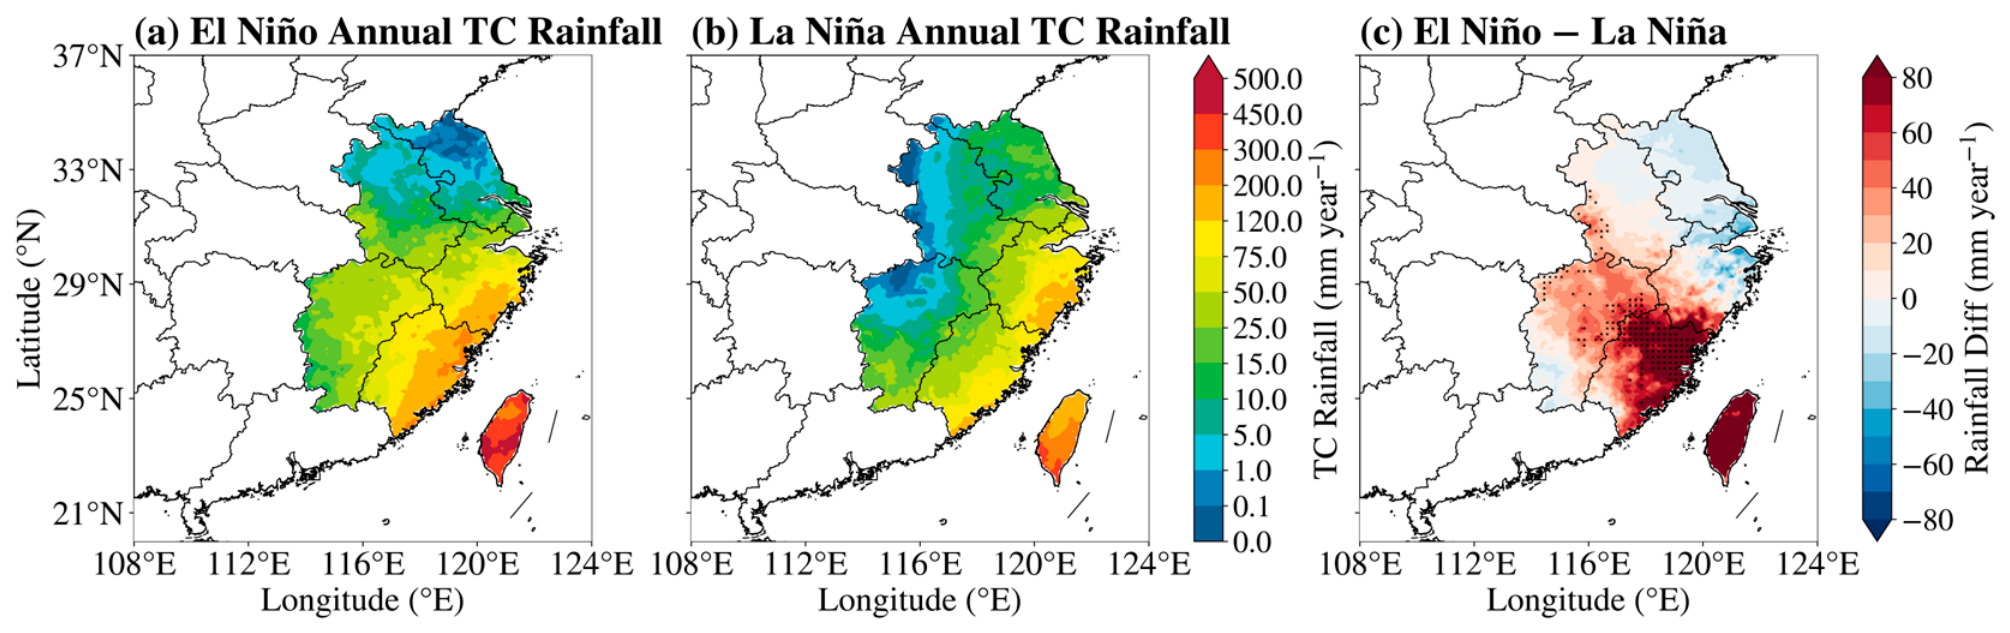
ENSO phases not only influence the frequency and intensity of landfalling TCs in East China but also further modulate the spatial distribution of TC precipitation. Figure 4 shows the spatial distribution differences in annual mean TC precipitation over East China between El Niño and La Niña years. The results indicate that under both ENSO phases, East China TC precipitation exhibits a clear spatial pattern of decreasing from the coast inland, whereas the composite precipitation intensity and the location of high-value areas differ between the two phases.
During El Niño years, high-value TC precipitation over East China is mainly concentrated in southwestern Taiwan (570.9 mm yr−1) and the Fujian region (Figure 4a). Eastern Fujian, southern Zhejiang, and coastal areas all exhibit relatively high TC precipitation, indicating that under El Niño conditions, TCs affecting East China are more likely to maintain heavy precipitation near the southeast coast. In contrast, during La Niña years, the high-value precipitation areas are mainly concentrated in a southeast coastal belt, while precipitation decreases rapidly inland, with a land-area mean precipitation of only 40.7 mm yr−1 (Figure 4b), suggesting that under La Niña conditions, the contribution of TCs to inland East China precipitation is relatively limited. The difference field between El Niño and La Niña years further shows that TC precipitation during El Niño years is generally higher than that during La Niña years, with a regional mean precipitation difference of 27.7 mm yr−1. Positive differences are mainly concentrated in Fujian, southern Zhejiang, southeastern Jiangxi, and Taiwan, while northern East China exhibits negative differences. Among these, the maximum positive composite difference occurs in the sea area north of Taiwan, reaching 332.7 mm yr−1 (Figure 4c). These patterns indicate ENSO phase-associated differences in the regional distribution of TC precipitation. Given the pointwise testing framework and the absence of multiple-comparison correction, the stippling in Figure 4c identifies locally significant grid-point differences within the composite pattern.

3.3. Storm-Relative Redistribution of TC Precipitation

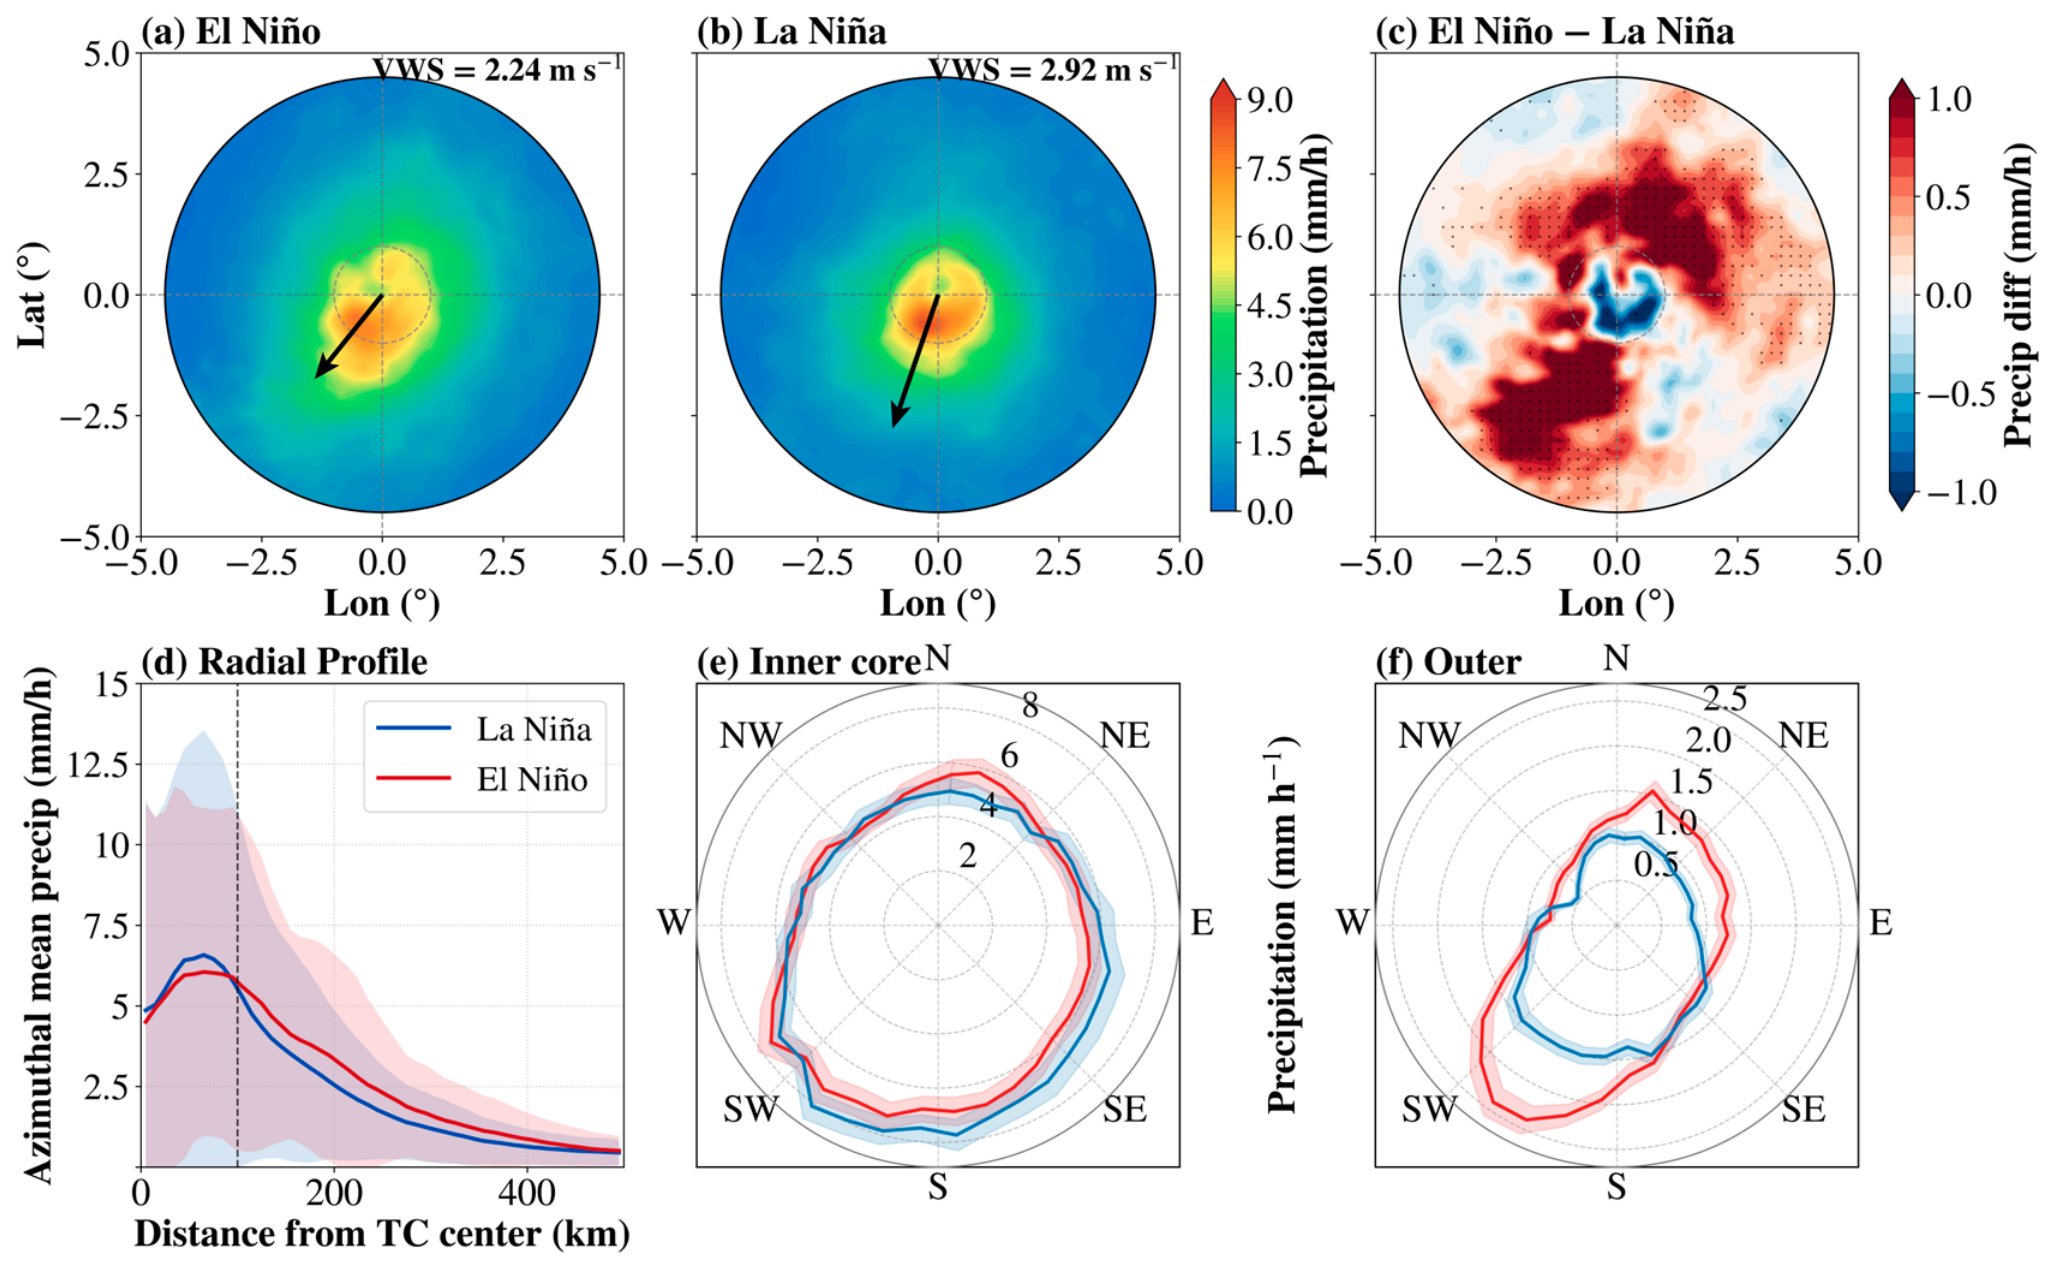
To reveal the influence of ENSO phases on the internal precipitation structure of landfalling TCs in East China, this study further analyzed the composite spatial distribution, radial profiles, and azimuthal distribution characteristics of TC precipitation during El Niño and La Niña years. The composite spatial distribution of TC precipitation during El Niño and La Niña years shows that heavy TC precipitation structures occur within the TC inner-core region (within 100 km of the TC center). However, the spatial patterns of precipitation differ between the two ENSO phases. During El Niño years, the precipitation distribution extends relatively more toward the southwest, with a larger area of heavy precipitation near the center. In contrast, precipitation near the center is more concentrated during La Niña years. The arrows in the figure indicate that the composite VWS intensity during La Niña years is 3.65 m s−1, higher than the 2.75 m s−1 during El Niño years (Figure 5a,b), suggesting that landfalling TCs in East China are subject to stronger environmental VWS under La Niña conditions. The difference field between El Niño and La Niña years further indicates that the TC precipitation differences between the two phases exhibit spatial heterogeneity. Relative to La Niña years, El Niño years show positive differences in the outer-rainband region (especially the southwest and northeast quadrants), while negative differences exist near the TC center (Figure 5c).
The radial mean precipitation profile further verifies the above characteristics. Under both ENSO phases, TC precipitation reaches its maximum near the center and decreases rapidly with increasing distance, with a marked decline in precipitation intensity beyond 100–200 km. Quantitative comparison of TC precipitation in the inner-core and outer-rainband regions shows that in the inner-core region (0–100 km), the mean precipitation intensity during La Niña years (6.681 mm h−1) is slightly higher than that during El Niño years (6.302 mm h−1). In the outer-rainband region (100–500 km), the mean precipitation intensity during El Niño years (1.700 mm h−1) is higher than that during La Niña years (1.374 mm h−1). These results indicate that during La Niña years, precipitation is stronger in the TC inner-core region, whereas during El Niño years, the contribution of outer-rainband precipitation is relatively enhanced (Figure 5d).
Storm-level bootstrap analysis was used to evaluate the uncertainty of the outer-rainband precipitation difference. Mean outer-rainband precipitation within 100–500 km was 1.691 mm h−1 for El Niño TCs and 1.342 mm h−1 for La Niña TCs, corresponding to an estimated relative difference of 26.02%. The bootstrap-estimated 95% confidence interval for this relative difference was −11.02% to 75.51% and included zero. Thus, outer-rainband precipitation was higher on average in the El Niño composite, but the quantitative magnitude of the difference remains uncertain because of the limited number of independent TC events. Results from the radial sensitivity analysis are provided in Table S1. Across TC precipitation radii of 300, 400, and 500 km and inner-core thresholds of 100, 150, and 200 km, the El Niño composite exhibited higher mean outer-rainband precipitation than the La Niña composite, with relative differences ranging from 25.58% to 37.00%. Thus, the direction of the composite outer-rainband difference was retained across the tested radial definitions.
Azimuthal distribution analysis further reveals quadrant differences in precipitation distribution. In the inner-core region, the overall precipitation difference between the two ENSO phases is relatively small. Both El Niño and La Niña composites exhibit relatively high precipitation from the southwest to west, whereas precipitation is relatively weak on the southeast side (Figure 5e). In the outer-rainband region, the azimuthal differences are more pronounced. Outer-rainband precipitation in the southwest and northeast quadrants is higher in the El Niño composite than in the La Niña composite, whereas lower values occur in the La Niña composite, particularly from the south to southeast (Figure 5f). These patterns are consistent with the positive outer-rainband precipitation differences shown in Figure 5c. The La Niña composite also exhibits stronger VWS and lower outer-rainband precipitation. By contrast, the El Niño composite shows higher outer-rainband precipitation, especially in the southwest and northeast quadrants. These composite features suggest that the observed precipitation differences are associated with differences in radial extent and quadrant distribution.
We repeated the composite analysis after excluding the two TCs with the largest outer-rainband precipitation contributions. After removing these events, outer-rainband precipitation during El Niño years remained approximately 17% higher than that during La Niña years. Although the magnitude of the El Niño–La Niña difference was reduced, the positive composite difference remained, indicating that it was not produced exclusively by the two excluded high-contribution events.

3.4. Temporal Evolution of Landfalling TC Intensity and Precipitation

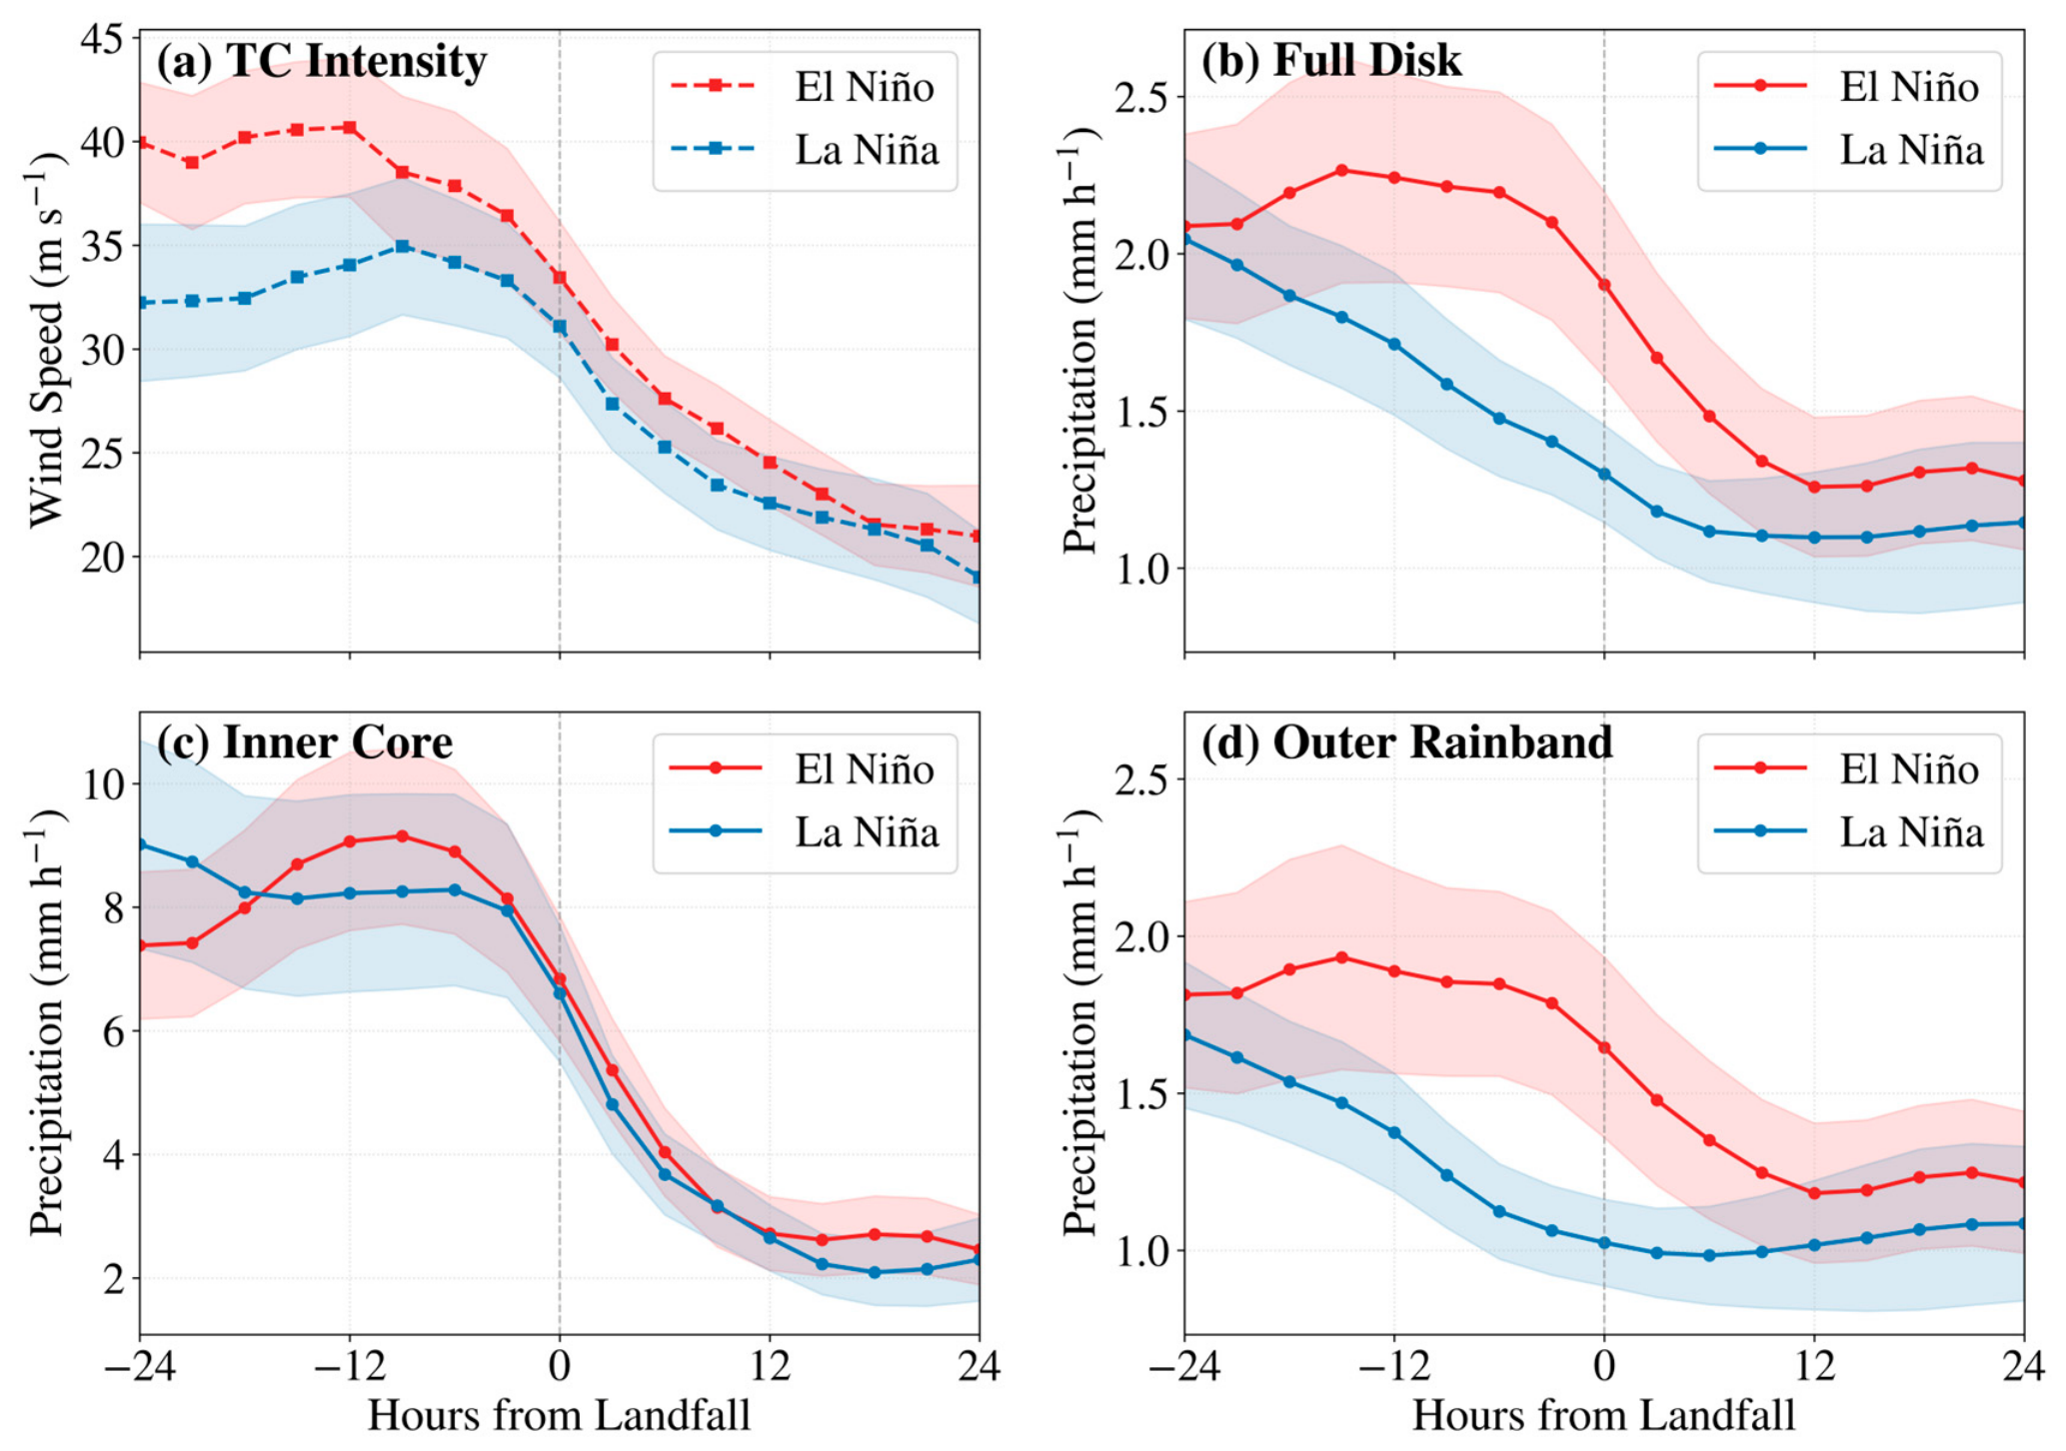
Figure 6 shows the temporal evolution of TC intensity and precipitation intensity during the period from 24 h before to 24 h after landfall (t = 0 denotes the landfall time). The results indicate that the overall intensity of landfalling TCs in East China during El Niño years is higher on average than that during La Niña years from 24 h before landfall to the landfall moment (Figure 6a). The maximum wind speed of TCs during El Niño years reaches a relatively high level approximately 12–18 h before landfall and then gradually weakens. In contrast, TC intensity during La Niña years is generally weaker, with lower mean intensity before landfall compared to El Niño years. After landfall, TC intensity decreases rapidly under both phases, a change that may be attributed to the combined effects of increased land surface friction, reduced moisture supply, and disruption of the low-level circulation.
The precipitation evolution further indicates that TC precipitation during El Niño years is generally stronger than that during La Niña years (Figure 6b). From 24 h before landfall to the landfall moment, the mean precipitation rate of TCs during El Niño years is consistently higher than that during La Niña years, reaching a higher value approximately 12–18 h before landfall. This suggests that landfalling East China TCs during El Niño years have a stronger capacity for precipitation organization before approaching land. After landfall, TC precipitation intensity decreases markedly under both phases, but El Niño years maintain relatively higher precipitation levels, remaining higher than La Niña years particularly during the 6–24 h post-landfall period. The relatively slower post-landfall precipitation decay during El Niño years may be related to their stronger landfall intensity and larger precipitation extent.
The temporal evolution of TC inner-core precipitation shows that precipitation intensity in the TC central region is stronger before landfall and decreases rapidly after landfall under both ENSO phases (Figure 6c). Inner-core precipitation during El Niño years peaks approximately 12 h before landfall, while during La Niña years, it also maintains relatively high levels in the earlier pre-landfall stage. During the period from 24 h before landfall to the landfall moment, La Niña years exhibit slightly stronger inner-core precipitation from 24 to 18 h prior, whereas El Niño years show higher precipitation from 18 h before landfall to the landfall moment compared to La Niña years. After landfall, inner-core precipitation decreases rapidly under both phases, indicating the rapid disruption of the TC central circulation and deep convective structure following landfall.
Compared with inner-core precipitation, outer-rainband precipitation was higher in the El Niño composite before and after landfall, with the largest differences occurring from 24 h before landfall to 12 h after landfall (Figure 6d). These temporal differences coincide with variations in environmental moisture transport, VWS, topographic lifting, and low-level convergence. The composites therefore suggest that ENSO-phase-associated environmental and storm-scale conditions may contribute to the observed outer-rainband precipitation differences from the pre-landfall to early post-landfall period.
The storm-relative precipitation differences were examined together with TC intensity, VWS, and landfall characteristics. The El Niño composite was characterized by higher mean TC intensity before landfall, higher outer-rainband precipitation, and differences in moisture and dynamic lifting in the outer-rainband region. In the La Niña composite, precipitation was relatively more concentrated in the inner-core region, where stronger VWS and storm-relative structural differences may also affect the radial distribution of precipitation. These composite features suggest that the observed inner-core and outer-rainband differences may reflect combined ENSO phase-associated environmental conditions and storm-scale characteristics.
An event-level comparison of storm characteristics was further conducted to examine whether the composite precipitation differences were accompanied by systematic differences in storm intensity, landfall location, and translation speed. The comparison indicates that El Niño cases tend to have higher pre-landfall intensity and higher mean outer-rainband precipitation, whereas the differences in landfall latitude, landfall longitude, and translation speed are relatively small. These results suggest that the storm-relative precipitation contrast is not simply explained by systematic differences in landfall location or translation speed, but may still reflect the combined effects of ENSO-related environmental conditions and storm-scale characteristics.

4. Environmental Conditions Associated with the Heterogeneous Precipitation Responses

4.1. Modulation of the Large-Scale Dynamical Environment on Total Precipitation

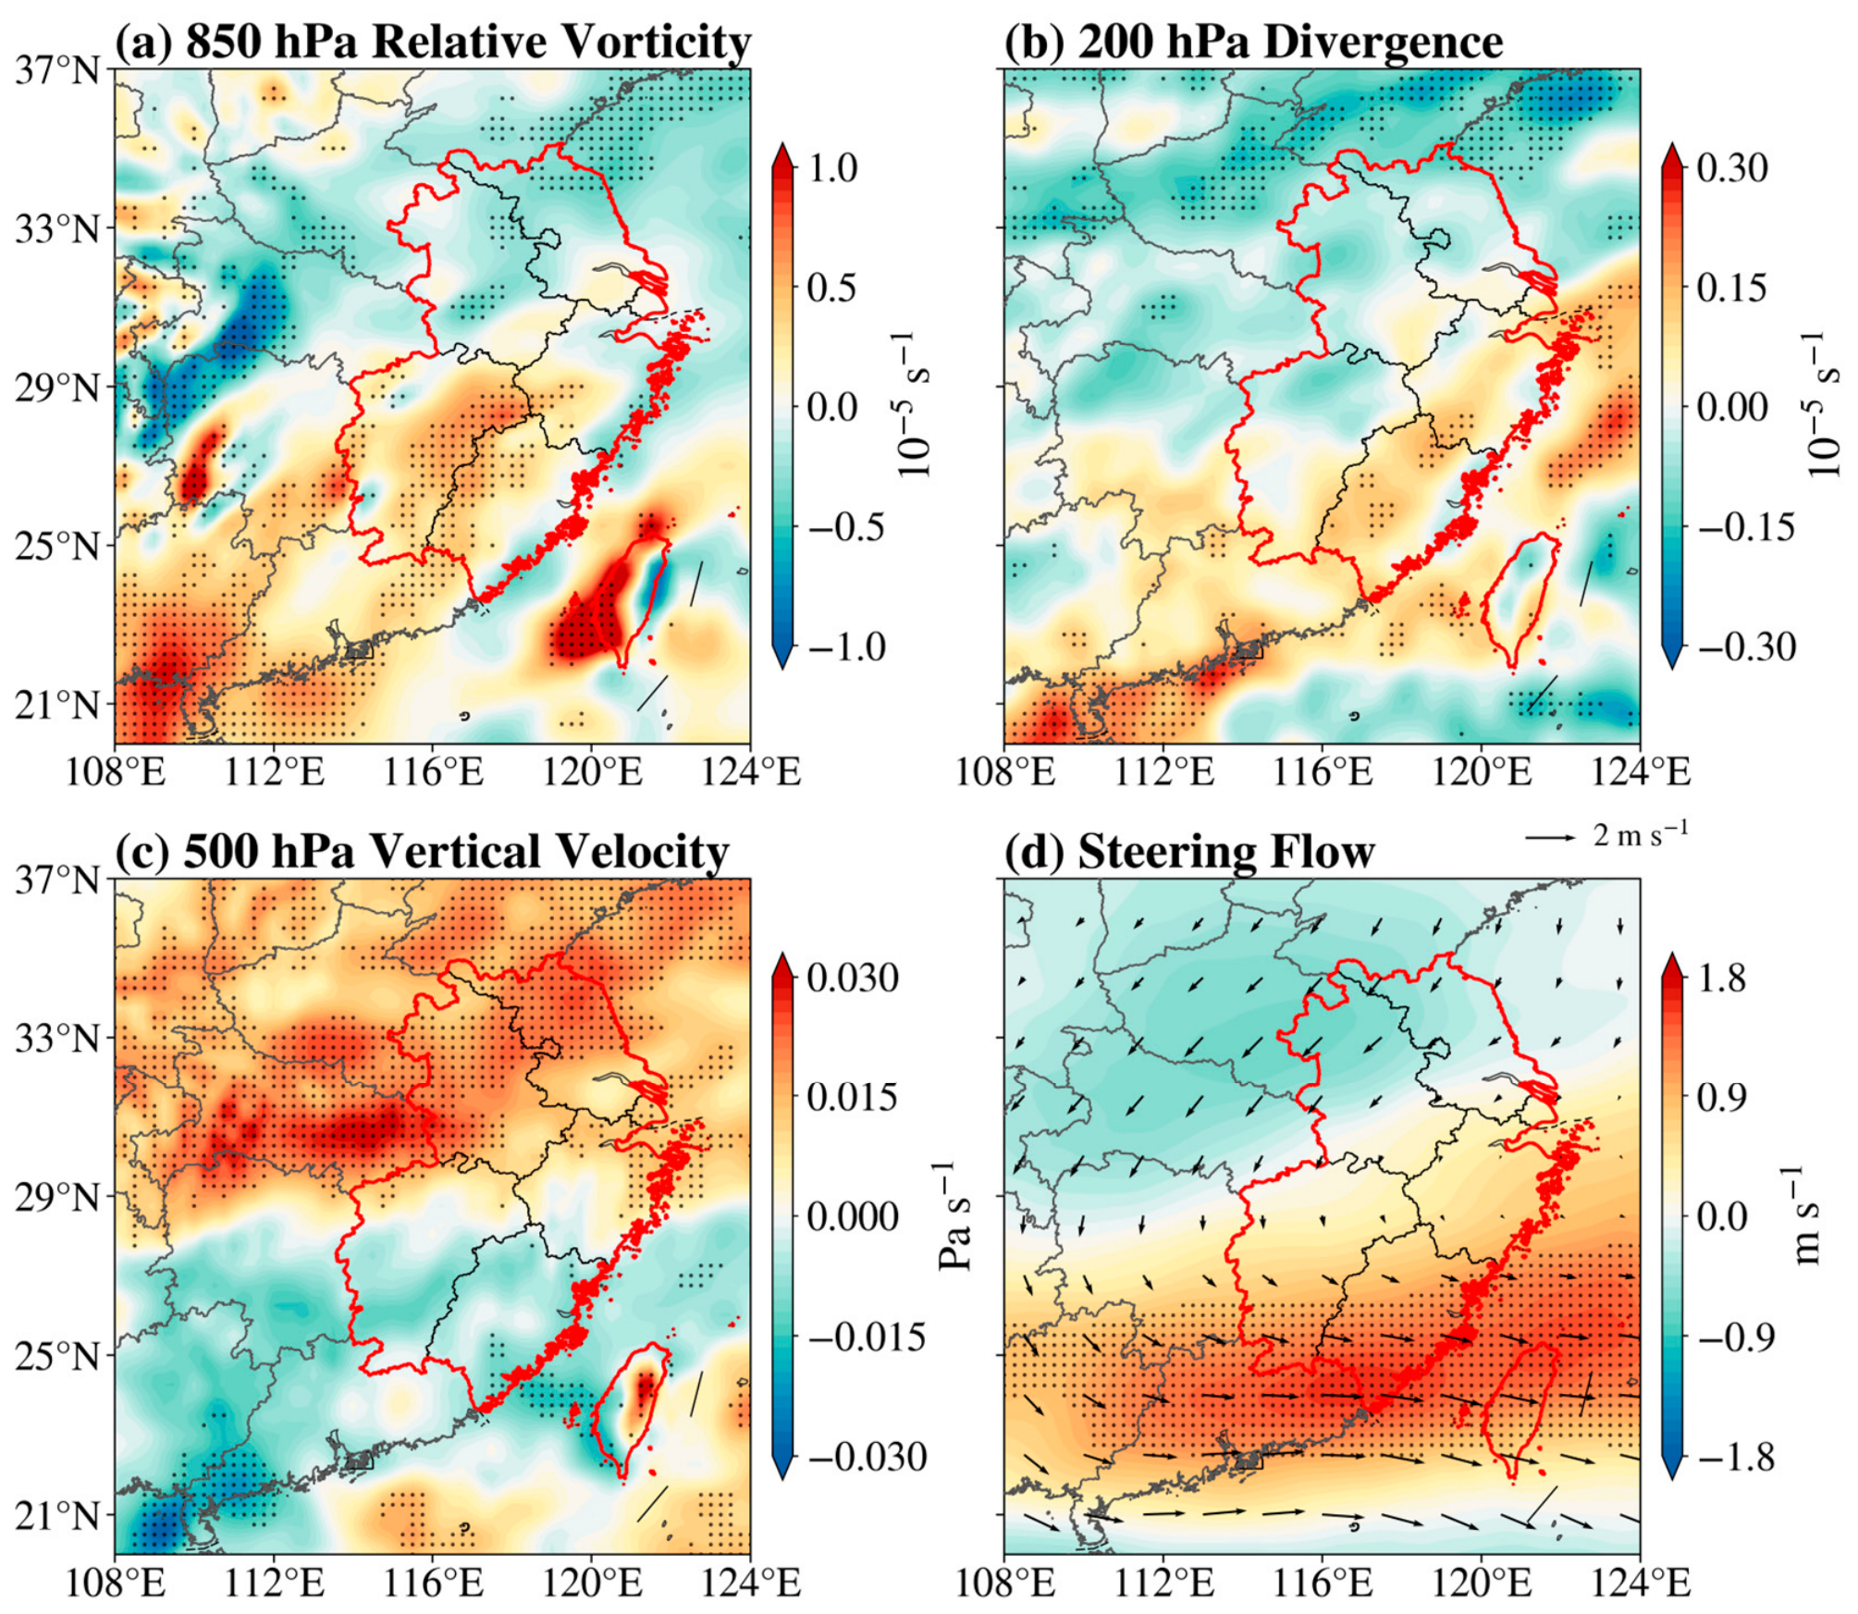
Previous studies have shown that TC activity affecting the South China coast is associated with large-scale circulation, including low-level cyclonic anomalies, steering flow, and moisture-related environmental conditions [46]. To examine environmental conditions associated with TC precipitation differences in East China under different ENSO phases, we calculated composite differences in low-level vorticity, upper-level divergence, mid-level vertical velocity, and steering flow between El Niño and La Niña years.
Compared with the La Niña composite, the El Niño composite shows positive 850 hPa relative-vorticity differences along the South China coast, offshore Fujian, and around Taiwan (Figure 7a). Positive 200 hPa divergence differences occur along the Fujian–Zhejiang coast, over the western East China Sea, and around Taiwan (Figure 7b). Stronger mid-level ascent is evident near the southern coast of East China and Taiwan, whereas relative subsidence occurs over northern East China and some inland areas (Figure 7c). These spatial differences are broadly consistent with the regional precipitation composite differences. Steering flow differences are also evident near South China, Taiwan, and the southeastern coast, with anomalous flow components directed toward southern East China and adjacent offshore areas (Figure 7d). Together, these composite environmental differences are consistent with the observed regional precipitation contrasts between ENSO phases.

4.2. TC-Centric Dynamic and Thermodynamic Conditions Associated with Precipitation Redistribution

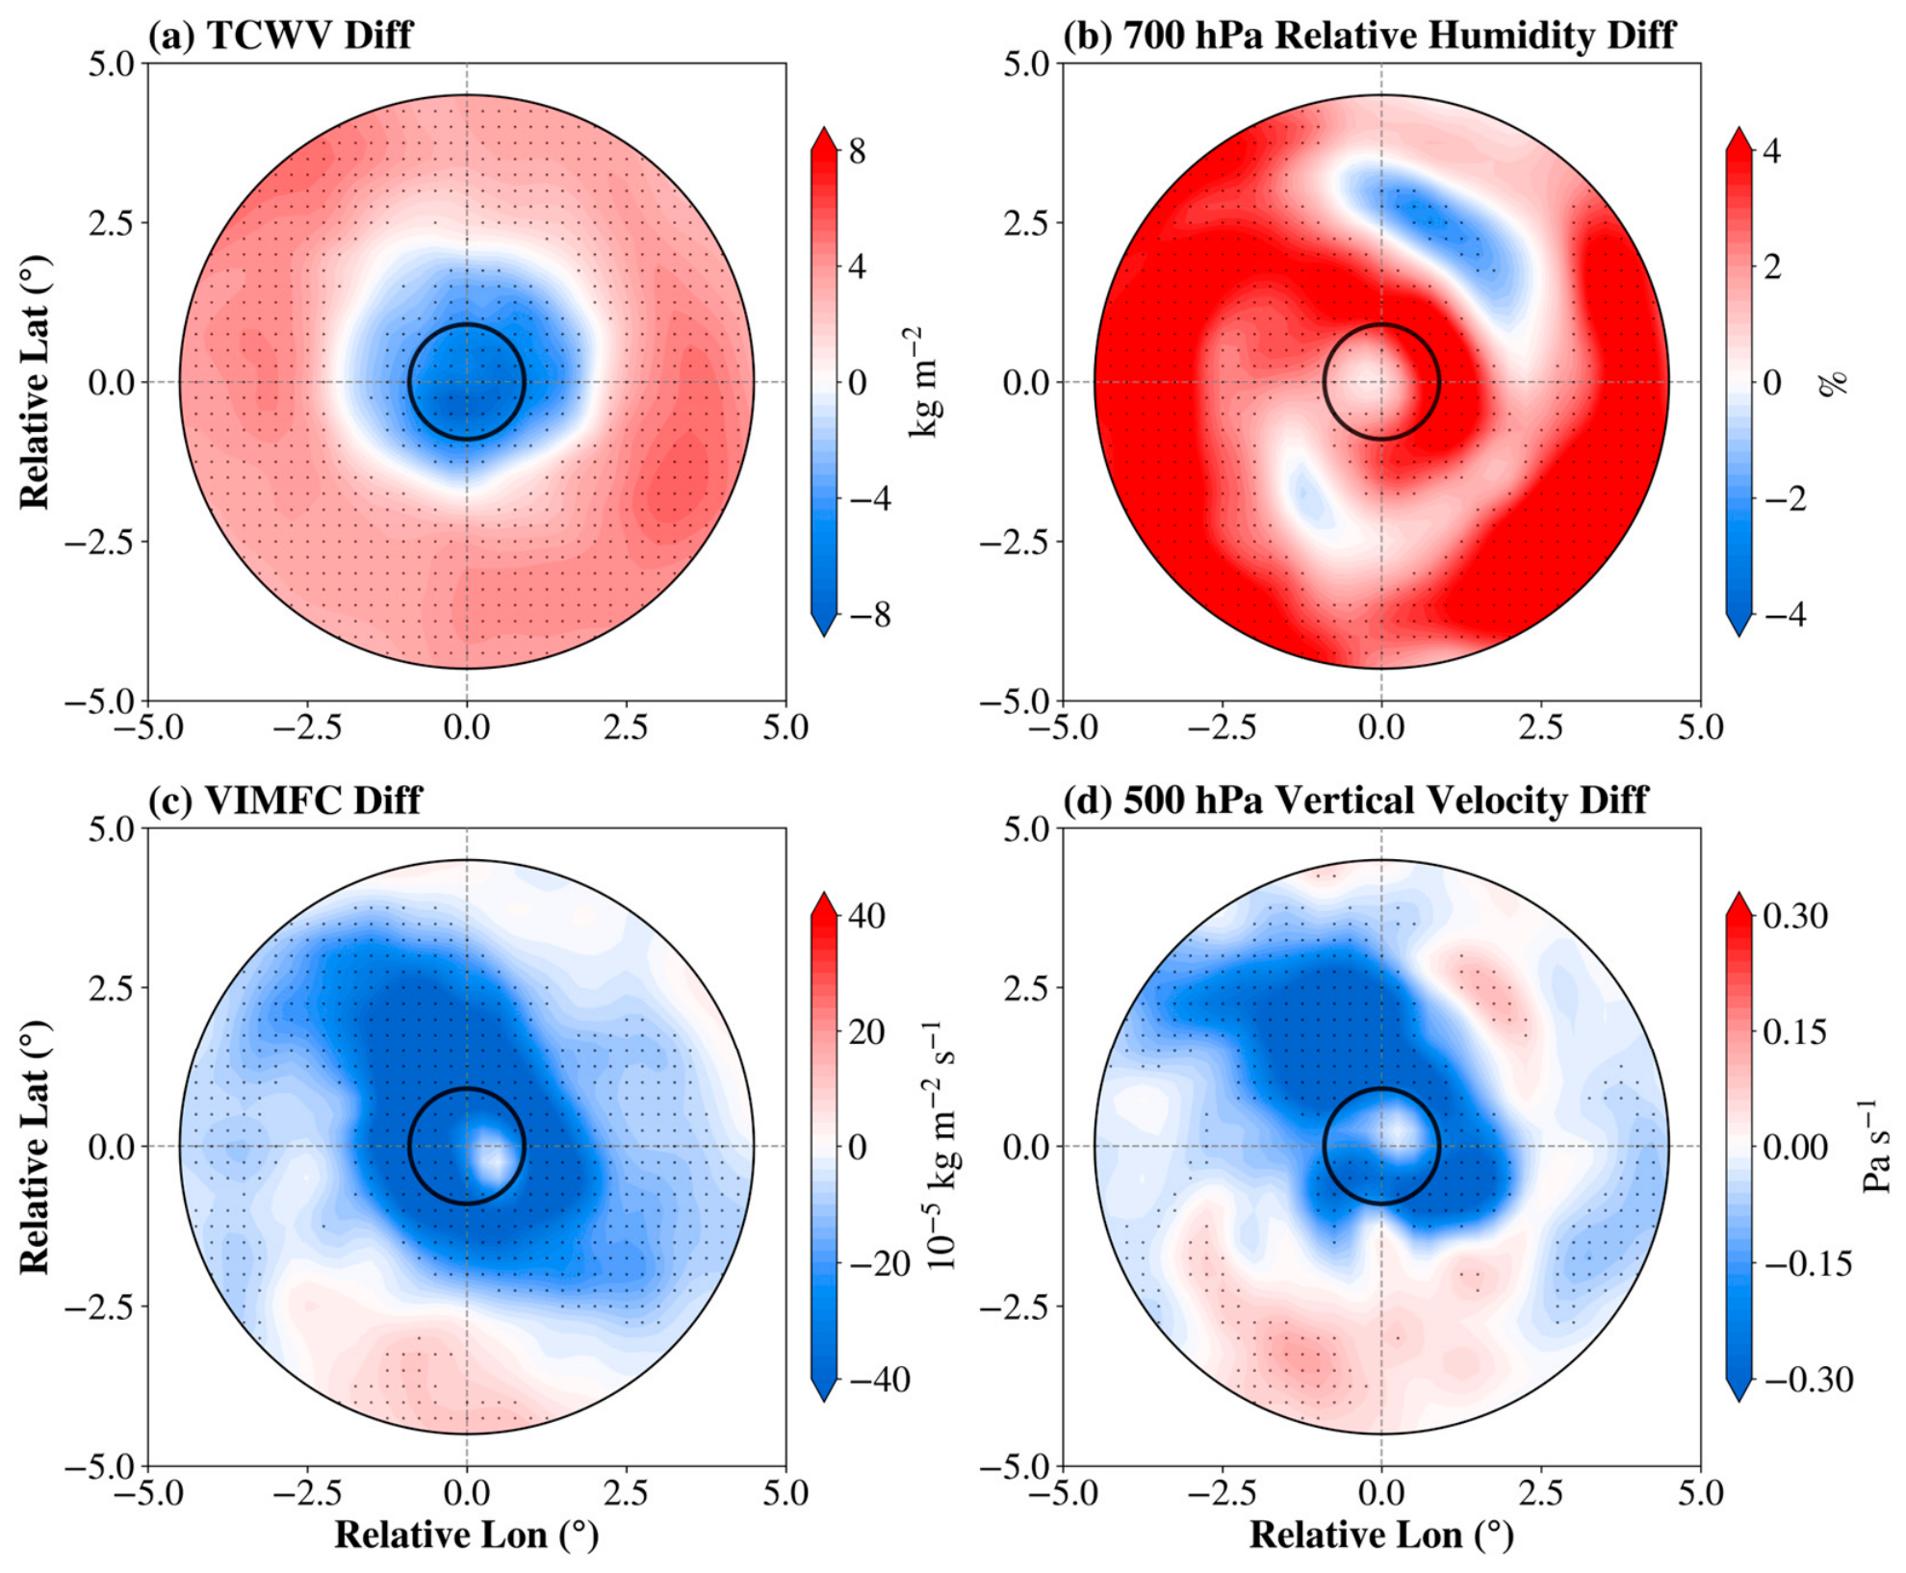
TC-centric diagnostics show ENSO phase-associated differences in dynamic and thermodynamic conditions that coincide with the inner-core and outer-rainband precipitation contrast (Figure 8, Table 1). The mean intensity of El Niño TCs was 32.0 m s−1, compared with 29.1 m s−1 for La Niña TCs. Mean outer-rainband precipitation within 100–500 km was 1.691 mm h−1 for El Niño TCs and 1.342 mm h−1 for La Niña TCs, corresponding to an estimated relative difference of 26.02%. The bootstrap-estimated 95% confidence interval for this relative difference was −11.02% to 75.51% and included zero, indicating uncertainty associated with the limited number of independent TC events.
The El Niño composite is associated with higher outer-rainband TCWV (3.14%, Figure 8a) and 700 hPa relative humidity (2.65%, Figure 8b). In contrast, inner-core TCWV is lower during El Niño years (55.90 versus 62.05 kg m−2, a decrease of 9.91%, p < 0.01; Table 1). This radial contrast, together with differences in outer-rainband moisture and ascent, suggests a redistribution of moisture and convection rather than uniform moistening throughout the storm. Differences in vertically integrated moisture flux convergence (Figure 8c) and 500 hPa vertical velocity in the outer-rainband region (33.78%, Figure 8d) are also evident. Together, these composite environmental differences are consistent with the observed outer-rainband precipitation contrast and may contribute to it.

5. Summary and Discussion

Based on the IBTrACS best-track dataset, IMERG satellite precipitation observations, and ERA5 reanalysis data from 1998 to 2024, this study examined ENSO-related regional and storm-relative differences in landfalling TC precipitation over East China and the associated environmental conditions.
(1)
The results indicate that landfalling TC precipitation over East China exhibits heterogeneous regional differences between ENSO phases rather than a uniform increase or decrease in precipitation. Compared with La Niña years, positive composite TC precipitation differences occur over Fujian, southern Zhejiang, Taiwan, and adjacent offshore regions during El Niño years, whereas the differences are weaker or negative in parts of northern East China. These results suggest that ENSO phase is associated with spatial differences in regional TC precipitation risk across East China.
(2)
TC-centered composite analyses further show storm-relative differences in precipitation structure between ENSO phases. During El Niño years, precipitation is characterized by a relatively more expansive rainfall structure. Mean outer-rainband precipitation was estimated to be 26.02% higher than during La Niña years; however, the storm-level bootstrap 95% confidence interval included zero, indicating that the quantitative magnitude of this difference remains uncertain. In contrast, precipitation during La Niña years is more concentrated within the inner-core region. Moreover, the El Niño composite shows higher mean TC intensity before landfall and a slower decline in precipitation after landfall.
(3)
The heterogeneous precipitation responses are associated with large-scale environmental conditions and TC-centric dynamic and thermodynamic differences. During El Niño years, southern East China and adjacent offshore regions show higher low-level cyclonic vorticity, upper-level divergence, ascent, and differences in steering flow. At the storm-relative scale, differences in outer-rainband moisture availability, relative humidity, moisture flux convergence, and dynamic lifting are consistent with the observed precipitation structure.
Overall, the results suggest that ENSO phase is associated with heterogeneous regional and structural changes in landfalling TC precipitation over East China rather than uniform changes in rainfall amount, although the quantitative magnitude of the outer-rainband precipitation difference remains uncertain due to the limited number of independent TC events. The combined effects of large-scale circulation anomalies, moisture conditions, and storm-scale precipitation reorganization are associated with pronounced differences in the spatial organization of TC precipitation under different ENSO phases. These findings provide additional evidence for the multiscale modulation of TC precipitation by climate variability and highlight the importance of considering both regional precipitation redistribution and outer-rainband evolution when assessing TC-induced flood risks over East China.
The number of independent landfalling TC events over East China remains limited after ENSO phase classification, which introduces sampling uncertainty into the composite analysis. Although storm-level bootstrap analysis was used to account for the dependence among multiple TC-centered time windows from the same event, the quantitative magnitude of the composite differences may still be affected by the limited number of independent events and by individual heavy-precipitation TCs. After excluding the two TCs with the largest outer-rainband precipitation contributions, the El Niño composite retained approximately 17% higher outer-rainband precipitation than the La Niña composite, although the magnitude of the difference was reduced. In addition, spatial composite differences were evaluated using pointwise local tests without field significance or FDR correction. Accordingly, the significance markers indicate local grid-point significance.
Although the composite environmental differences reveal physically consistent associations between ENSO phases and TC precipitation redistribution, they do not by themselves establish strict causal relationships. ENSO may affect storm track, landfall position, landfall latitude, landfall timing, intensity, translation speed, storm size, and background moisture simultaneously, and storm sample composition may also influence the radial distribution of TC precipitation. Chaudhuri et al. [47,48] showed that TC intensity predictions can vary substantially under different large-scale environmental conditions, further highlighting the sensitivity of TC behavior to background environmental regimes. Meanwhile, the JASO mean ONI classification used in this study does not distinguish ENSO diversity, and different ENSO flavors and intensities, such as eastern Pacific and central Pacific El Niño events or strong and weak ENSO events, may exert different influences on WNP TC tracks and precipitation environments. Due to the limited number of landfalling TC cases over East China, these ENSO subtypes and storm-scale factors were not separately controlled in this study. Other climate variability modes, such as the Pacific Decadal Oscillation, Indian Ocean Dipole, Madden–Julian Oscillation, and monsoon-related variability, may also modulate TC activity and precipitation [49]. The covariability between ENSO and these climate modes was not quantified in the present analysis. Therefore, the observed El Niño–La Niña differences should be interpreted as ENSO phase-associated composite signals that may include contributions from other climate modes, rather than as effects attributable exclusively to ENSO. In addition, the different spatial resolutions of IMERG and ERA5 may introduce uncertainty in local-scale precipitation–environment correspondence, especially near sharp precipitation gradients, the TC inner-core region, and coastal terrain. Future studies using longer records, matched-storm approaches, multivariate statistical methods, moisture budget diagnostics, and convection-permitting numerical sensitivity experiments are needed to further separate these effects and quantify the relative contributions of ENSO-related environmental conditions and storm-scale characteristics to TC precipitation redistribution.
The ENSO-related composite differences in TC precipitation structure may provide diagnostic background information for regional flood risk assessment. The estimated tendency toward higher outer-rainband precipitation in the El Niño composite suggests that TC-related rainfall may extend farther from the storm center and affect broader coastal and inland areas, although the magnitude of this difference remains uncertain. In contrast, precipitation concentrated near the inner-core region may be more closely associated with short-duration heavy rainfall near the landfall area. Therefore, distinguishing between outer-rainband-dominated and inner-core-dominated precipitation structures may help identify the spatial extent and dominant pattern of TC-related flood risk. Although ENSO phase information cannot replace event-scale numerical weather prediction, it can provide seasonal background information for interpreting regional TC precipitation risk, consistent with previous studies showing that satellite observations and climate information can improve TC prediction guidance, such as Chaudhuri et al. [50]. The present analysis does not directly evaluate flood records, hydrological impacts, disaster losses, or operational warning performance. Accordingly, the findings should be regarded as diagnostic background information for interpreting ENSO-related differences in regional TC precipitation risk and should be used together with event-scale forecasts, hydrological information, and local exposure assessments in practical risk management.

Supplementary Materials

The following supporting information can be downloaded at: https://www.mdpi.com/article/10.3390/w18151849/s1, Table S1: The sensitivity of composite mean outer-rainband precipitation to the TC precipitation radius and inner-core threshold. The relative difference is calculated as (El Niño − La Niña)/La Niña × 100%.

Author Contributions

Conceptualization, S.T., S.L.; methodology, S.Z. and Y.T.; validation, S.Z. and Y.T.; formal analysis, S.Z.; investigation, S.Z.; data curation, S.Z.; writing—original draft preparation, S.Z.; writing—review and editing, S.T., S.L., M.L. and J.X.; visualization, S.Z. and Y.T.; supervision, S.T.; funding acquisition, S.L. and S.T. All authors participated in the discussion of the results presented in the manuscript. All authors have read and agreed to the published version of the manuscript.

Funding

This research was jointly supported by the Key Laboratory of High Impact Weather (special), China Meteorological Administration (2024-G-08), the “Pioneer” and “Leading Goose” Research & Development Program of Zhejiang (2025C02258), the Program for Scientific Research Start-up Funds of Guangdong Ocean University (060302032304), Guangdong Ocean University Research Funding of Air–Sea Interaction and Data Assimilation (E16188), and Science Foundation of Donghai Laboratory (Grants No. L24QH006).

Data Availability Statement

The data presented in this study are available from publicly accessible repositories. These data were derived from the following resources available in the public domain. IBTrACS dataset is obtained from https://www.ncei.noaa.gov/data/international-best-track-archive-for-climate-stewardship-ibtracs/v04r01/access/csv/ (accessed on 5 March 2025). IMERG Final Run satellite precipitation dataset is obtained from https://disc.gsfc.nasa.gov/datasets/GPM_3IMERGHH_07/summary (accessed on 17 June 2025). ERA5 reanalysis is obtained from https://cds.climate.copernicus.eu/datasets (accessed on 10 December 2025), and HadISST1 global sea ice and sea surface temperature dataset from https://www.metoffice.gov.uk/hadobs/hadisst/data/download.html (accessed on 20 January 2026). The processed data generated during the current study are available from the corresponding author upon reasonable request.

Acknowledgments

We gratefully acknowledge the NOAA National Centers for Environmental Information (NOAA/NCEI), the NASA Global Precipitation Measurement (GPM) mission, the European Centre for Medium-Range Weather Forecasts (ECMWF), the Copernicus Climate Change Service (C3S), and the Met Office Hadley Centre for providing the datasets used in this study.

Conflicts of Interest

The authors declare no conflicts of interest relevant to this study.

References

  1. Zhang, Q.; Wu, L.; Liu, Q. Tropical cyclone damages in China 1983–2006. Bull. Am. Meteorol. Soc. 2009, 90, 489–496. [Google Scholar] [CrossRef]
  2. Li, R.C.; Zhou, W.; Shun, C.M.; Lee, T.C. Change in destructiveness of landfalling tropical cyclones over China in recent decades. J. Clim. 2017, 30, 3367–3379. [Google Scholar] [CrossRef]
  3. Zhang, S.; Zheng, Y.; Liu, C.; Huang, Z.; Weng, H.; Xu, J.; Tu, S. Climatology of Different Classifications of Tropical Cyclones Landfalling in Guangdong Province of China during 1951–2020. Atmosphere 2022, 13, 1306. [Google Scholar] [CrossRef]
  4. Zhang, Q.; Gu, X.; Li, J.; Shi, P.; Singh, V.P. The impact of tropical cyclones on extreme precipitation over coastal and inland areas of China and its association to ENSO. J. Clim. 2018, 31, 1865–1880. [Google Scholar] [CrossRef]
  5. Yan, F.; Shan, K.; Zhao, H.; Yu, X. Growing threat of tropical cyclone disasters in inland areas of East China. Geophys. Res. Lett. 2024, 51, e2024GL111877. [Google Scholar] [CrossRef]
  6. Lai, Y.; Gu, X.; Wei, L.; Wang, L.; Slater, L.; Li, J. Slower-decaying tropical cyclones produce heavier precipitation over China. npj Clim. Atmos. Sci. 2024, 7, 99. [Google Scholar] [CrossRef]
  7. Yu, Z.; Wang, Y.; Xu, H.; Davidson, N.; Chen, Y.; Chen, Y.; Yu, H. On the relationship between intensity and rainfall distribution in tropical cyclones making landfall over China. J. Appl. Meteorol. Climatol. 2017, 56, 2883–2901. [Google Scholar] [CrossRef]
  8. Zhang, J.; Wu, L.; Ren, F.; Cui, X. Changes in tropical cyclone rainfall in China. J. Meteorol. Soc. Jpn. Ser. II 2013, 91, 585–595. [Google Scholar] [CrossRef]
  9. Wang, L.; Yang, Z.; Gu, X.; Li, J. Linkages between tropical cyclones and extreme precipitation over China and the role of ENSO. Int. J. Disaster Risk Sci. 2020, 11, 538–553. [Google Scholar] [CrossRef]
  10. Liu, L.; Wang, Y. Trends in landfalling tropical cyclone-induced precipitation over China. J. Clim. 2020, 33, 2223–2235. [Google Scholar] [CrossRef]
  11. Tian, Y.; McBride, J.L.; Ren, F.; Li, G.; Feng, T. Changes in typhoon regional heavy precipitation events over China from 1960 to 2018. Adv. Atmos. Sci. 2022, 39, 272–283. [Google Scholar] [CrossRef]
  12. Zhao, Y.; Chen, W.; Xu, J.; Wu, D.; Tu, S. Tropical cyclone disasters and crop sensitivity in Guangdong, China: Why are food crops more vulnerable? Environ. Res. Commun. 2025, 7, 105031. [Google Scholar] [CrossRef]
  13. Wang, F.; Zhao, J.; Zhan, R.; Yuan, C.; Feng, X.; Tan, Y. Seasonal contrasts in the trends of landfalling tropical cyclone track density in China (1949–2023). Geophys. Res. Lett. 2025, 52, e2024GL114482. [Google Scholar] [CrossRef]
  14. Wang, H.; Liang, C.; Lin, F.; Jin, W. Interdecadal variability of tropical cyclone intensification rates in the western North Pacific. npj Clim. Atmos. Sci. 2025, 8, 123. [Google Scholar] [CrossRef]
  15. Wang, B.; Chan, J.C.L. How strong ENSO events affect tropical storm activity over the western North Pacific. J. Clim. 2002, 15, 1643–1658. [Google Scholar] [CrossRef]
  16. Chia, H.H.; Ropelewski, C.F. The interannual variability in the genesis location of tropical cyclones in the northwest Pacific. J. Clim. 2002, 15, 2934–2944. [Google Scholar] [CrossRef]
  17. Wu, L.; Wang, B.; Geng, S. Growing typhoon influence on East Asia. Geophys. Res. Lett. 2005, 32, L18703. [Google Scholar] [CrossRef]
  18. Camargo, S.J.; Robertson, A.W.; Gaffney, S.J.; Smyth, P.; Ghil, M. Cluster analysis of typhoon tracks. Part II: Large-scale circulation and ENSO. J. Clim. 2007, 20, 3654–3676. [Google Scholar] [CrossRef]
  19. Zhao, H.; Wu, L.; Zhou, W. Assessing the influence of the ENSO on tropical cyclone prevailing tracks in the western North Pacific. Adv. Atmos. Sci. 2010, 27, 1361–1371. [Google Scholar] [CrossRef]
  20. Pan, L.; Wang, X.; Chen, J.; Zhan, H. Distinct features of tropical cyclone landfall over East Asia during various types of El Niño. J. Clim. 2024, 37, 4989–5008. [Google Scholar] [CrossRef]
  21. Tu, S.; Chan, J.C.L.; Xu, J.; Zhou, W. Opposite changes in tropical cyclone rain rate during the recent El Niño and La Niña years. Geophys. Res. Lett. 2022, 49, e2021GL097412. [Google Scholar] [CrossRef]
  22. Hong, C.C.; Li, Y.H.; Li, T.; Lee, M.Y. Impacts of central Pacific and eastern Pacific El Niños on tropical cyclone tracks over the western North Pacific. Geophys. Res. Lett. 2011, 38, L16712. [Google Scholar] [CrossRef]
  23. Lau, K.M.; Zhou, Y.P.; Wu, H.T. Have tropical cyclones been feeding more extreme rainfall? J. Geophys. Res. Atmos. 2008, 113, D23113. [Google Scholar] [CrossRef]
  24. Prat, O.P.; Nelson, B.R. Mapping the world’s tropical cyclone rainfall contribution over land using the TRMM Multi-satellite Precipitation Analysis. Water Resour. Res. 2013, 49, 7236–7254. [Google Scholar] [CrossRef]
  25. Li, R.C.; Zhou, W. Interdecadal changes in summertime tropical cyclone precipitation over southeast China during 1960–2009. J. Clim. 2015, 28, 1494–1509. [Google Scholar] [CrossRef]
  26. Kim, D.; Ho, C.H.; Murakami, H.; Park, D.S.R. Assessing the influence of large-scale environmental conditions on the rainfall structure of Atlantic tropical cyclones: An observational study. J. Clim. 2021, 34, 2093–2106. [Google Scholar] [CrossRef]
  27. Kim, D.; Park, D.S.R.; Matyas, C.J. Spatial variations in tropical cyclone rainfall over the western North Pacific according to ENSO phase. J. Clim. 2023, 36, 1697–1710. [Google Scholar] [CrossRef]
  28. Yu, Z.; Wang, Y.; Xu, H. Observed rainfall asymmetry in tropical cyclones making landfall over China. J. Appl. Meteorol. Climatol. 2015, 54, 117–136. [Google Scholar] [CrossRef]
  29. Yu, Z.; Wang, Y.; Yu, H.; Duan, Y. The relationship between the inner-core size and the rainfall distribution in landfalling tropical cyclones over China. Geophys. Res. Lett. 2022, 49, e2021GL097576. [Google Scholar] [CrossRef]
  30. Yu, Z.; Chen, P.; Ren, F.; Tang, L.; Wang, W.; Yu, H.; Zhao, K. Recent advances in landfalling tropical cyclone asymmetric rainfall mechanism and forecast verification over China. Trop. Cyclone Res. Rev. 2024, 13, 33–40. [Google Scholar] [CrossRef]
  31. Frank, W.M.; Ritchie, E.A. Effects of environmental flow upon tropical cyclone structure. Mon. Weather Rev. 1999, 127, 2044–2061. [Google Scholar] [CrossRef]
  32. Corbosiero, K.L.; Molinari, J. The effects of vertical wind shear on the distribution of convection in tropical cyclones. Mon. Weather Rev. 2002, 130, 2110–2123. [Google Scholar] [CrossRef]
  33. Chen, S.S.; Knaff, J.A.; Marks, F.D., Jr. Effects of vertical wind shear and storm motion on tropical cyclone rainfall asymmetries deduced from TRMM. Mon. Weather Rev. 2006, 134, 3190–3208. [Google Scholar] [CrossRef]
  34. Jiang, H.; Halverson, J.B.; Zipser, E.J. Influence of environmental moisture on TRMM-derived tropical cyclone precipitation over land and ocean. Geophys. Res. Lett. 2008, 35, L17806. [Google Scholar] [CrossRef]
  35. Li, L.; Chakraborty, P. Slower decay of landfalling hurricanes in a warming world. Nature 2020, 587, 230–234. [Google Scholar] [CrossRef] [PubMed]
  36. Knapp, K.R.; Kruk, M.C.; Levinson, D.H.; Diamond, H.J.; Neumann, C.J. The International Best Track Archive for Climate Stewardship (IBTrACS): Unifying tropical cyclone data. Bull. Am. Meteorol. Soc. 2010, 91, 363–376. [Google Scholar] [CrossRef]
  37. Gahtan, J.; Knapp, K.R.; Schreck, C.J.; Diamond, H.J.; Kossin, J.P.; Kruk, M.C. International Best Track Archive for Climate Stewardship (IBTrACS) Project, Version 4r01; NOAA National Centers for Environmental Information: Asheville, NC, USA, 2024. [CrossRef]
  38. Chen, F.; Wang, R.; Liu, P.; Yu, L.; Feng, Y.; Zheng, X.; Gao, J. Evaluation of GPM IMERG and error sources for tropical cyclone precipitation over eastern China. J. Hydrol. 2023, 627, 130384. [Google Scholar] [CrossRef]
  39. Gaona, M.F.R.; Villarini, G.; Zhang, W.; Vecchi, G.A. The added value of IMERG in characterizing rainfall in tropical cyclones. Atmos. Res. 2018, 209, 95–102. [Google Scholar] [CrossRef]
  40. Khouakhi, A.; Villarini, G.; Vecchi, G.A. Contribution of tropical cyclones to rainfall at the global scale. J. Clim. 2017, 30, 359–372. [Google Scholar] [CrossRef]
  41. Huang, D.; Liu, S.; Huang, X.; Zeng, S.; Zhong, Q.; Yan, Y.; Wu, D.; Xu, J.; Tu, S. Decrease in the spatial inhomogeneity of tropical cyclone rainfall in China. Environ. Res. Lett. 2026, 21, 024006. [Google Scholar] [CrossRef]
  42. Hersbach, H.; Bell, B.; Berrisford, P.; Biavati, G.; Horányi, A.; Muñoz Sabater, J.; Nicolas, J.; Peubey, C.; Radu, R.; Rozum, I.; et al. ERA5 Hourly Data on Pressure Levels from 1940 to Present. Copernicus Climate Change Service Climate Data Store; European Union: Brussels, Belgium, 2023. [Google Scholar] [CrossRef]
  43. Rayner, N.A.; Parker, D.E.; Horton, E.B.; Folland, C.K.; Alexander, L.V.; Rowell, D.P.; Kaplan, A. Global analyses of sea surface temperature, sea ice, and night marine air temperature since the late nineteenth century. J. Geophys. Res. Atmos. 2003, 108, 4407. [Google Scholar] [CrossRef]
  44. Banacos, P.C.; Schultz, D.M. The use of moisture flux convergence in forecasting convective initiation: Historical and operational perspectives. Weather Forecast. 2005, 20, 351–366. [Google Scholar] [CrossRef]
  45. Zhao, D.; Yu, Y.; Chen, L. Impact of the monsoonal surge on extreme rainfall of landfalling tropical cyclones. Adv. Atmos. Sci. 2021, 38, 771–784. [Google Scholar] [CrossRef]
  46. Chen, W.; Yang, S.; Wu, Z.; Cai, F. Large-scale atmospheric features favoring the tropical cyclone activity affecting the Guangdong–Hong Kong–Macao Greater Bay Area of China. Environ. Res. Lett. 2022, 17, 104017. [Google Scholar] [CrossRef]
  47. Chaudhuri, S.; Dutta, D.; Goswami, S.; Middey, A. Intensity forecast of tropical cyclones over North Indian Ocean using multilayer perceptron model: Skill and performance verification. Nat. Hazards 2013, 65, 97–113. [Google Scholar] [CrossRef]
  48. Chaudhuri, S.; Dutta, D.; Goswami, S.; Middey, A. Track and intensity forecast of tropical cyclones over the North Indian Ocean with multilayer feed forward neural nets. Meteorol. Appl. 2015, 22, 563–575. [Google Scholar] [CrossRef]
  49. Dai, Y.; Jin, C.; Wei, N.; Song, J.; Duan, Y. What controls the quasi-decadal variability of tropical cyclone genesis in the western North Pacific in recent decades. Environ. Res. Lett. 2026, 21, 044013. [Google Scholar] [CrossRef]
  50. Chaudhuri, S.; Goswami, S.; Middey, A. Medium-range forecast of cyclogenesis over North Indian Ocean with multilayer perceptron model using satellite data. Nat. Hazards 2014, 70, 173–193. [Google Scholar] [CrossRef]
Figure 1. A schematic diagram illustrating the methodological framework used to investigate ENSO-induced heterogeneous responses of landfalling TC precipitation over East China. The workflow includes TC selection from IBTrACS, ENSO classification based on JASO mean ONI, IMERG precipitation extraction, storm-relative coordinate transformation, radial precipitation partitioning, composite analysis, environmental diagnostics from ERA5, and statistical uncertainty assessment.
Water 18 01849 g001
Figure 2. The characteristics of the tracks, frequency, and intensity of TCs making landfall in East China under different ENSO phases: (a) track distribution of landfalling TCs during El Niño years; (b) track distribution of landfalling TCs during La Niña years. Track colors indicate TC intensity levels, including Tropical Depression (TD), Tropical Storm (TS), and Category 1–5 TCs (Cat1–Cat5). Black dots denote TC genesis locations, and the red boundary indicates the East China region. (c) The annual frequency of landfalling East China TCs under different ENSO phases from 1998 to 2024. Red, gray, and blue bars represent El Niño, Neutral, and La Niña years, respectively; (d) boxplot of maximum sustained wind speeds of landfalling TCs in East China under different ENSO phases. The box represents the interquartile range, the horizontal line indicates the median, the diamond represents the mean, and the whiskers indicate the range of the data distribution.
Water 18 01849 g002
Figure 3. Interannual variation and spatial distribution characteristics of TC precipitation over East China from 1998 to 2024: (a) Interannual variation in mean precipitation intensity of landfalling TCs in East China under different ENSO phases. The y-axis denotes the mean precipitation rate (mm h−1). Black, red, and blue lines represent all years, El Niño years, and La Niña years, respectively, with dashed lines indicating the linear trends for the corresponding samples. (b) Interannual variation in annual accumulated TC precipitation over East China under different ENSO phases. The y-axis denotes annual accumulated TC precipitation (mm). (c) Spatial distribution of multi-year mean TC precipitation over East China from 1998 to 2024, with units in mm yr−1. (d) Spatial distribution of linear trends in TC precipitation over East China from 1998 to 2024, with units in mm decade−1. The color scale indicates the magnitude of the trend, with warm colors representing increasing precipitation and cool colors representing decreasing precipitation.
Water 18 01849 g003
Figure 4. Spatial distribution differences in annual TC precipitation over East China under different ENSO phases: (a) spatial distribution of annual mean TC precipitation over East China during El Niño years; (b) spatial distribution of annual mean TC precipitation over East China during La Niña years; (c) the distribution of TC precipitation differences between El Niño and La Niña years (El Niño minus La Niña). Units are mm yr−1, with warm colors indicating higher TC precipitation during El Niño years than during La Niña years, and cool colors indicating lower TC precipitation during El Niño years than during La Niña years. Black dots indicate grid points at which the pointwise local differences are significant at the 95% confidence level based on a two-sided Mann–Whitney U test.
Water 18 01849 g004
Figure 5. Differences in the precipitation structure of landfalling TCs in East China under different ENSO phases: (a) composite spatial distribution of precipitation for landfalling TCs in East China during El Niño years; (b) composite spatial distribution of precipitation for landfalling East China TCs during La Niña years; (c) the distribution of composite precipitation differences between El Niño and La Niña years (El Niño minus La Niña). In (a) and (b), shading indicates the mean precipitation intensity (mm h−1) in a TC-relative coordinate system, black arrows indicate the direction of the composite VWS, and the values adjacent to the arrows represent the mean VWS intensity under the corresponding phase. In (c), black dots indicate grid points at which the pointwise local differences are significant at the 95% confidence level based on a two-sided Mann–Whitney U test. (d) Radial mean profiles of TC precipitation under different ENSO phases. The x-axis denotes the distance from the TC center, the y-axis denotes the azimuthally averaged precipitation intensity, and shading indicates the range of sample dispersion. (e) Azimuthal distribution of precipitation in the TC inner-core region. (f) Azimuthal distribution of precipitation in the TC outer-rainband region. Red and blue curves represent El Niño and La Niña years, respectively.
Water 18 01849 g005
Figure 6. The evolution of the intensity and precipitation structure of landfalling TCs in East China before and after landfall under different ENSO phases: (a) temporal evolution of TC maximum sustained wind speed during the 24 h period before and after landfall (m s−1); (b) temporal evolution of TC mean precipitation rate (mm h−1); (c) temporal evolution of mean precipitation rate in the TC inner-core region, in mm h−1; (d) temporal evolution of mean precipitation rate in the TC outer-rainband region (mm h−1). The x-axis denotes the time relative to the landfall moment, with 0 h indicating the landfall time. Red curves represent El Niño years, blue curves represent La Niña years, and shading indicates the range of sample dispersion.
Water 18 01849 g006
Figure 7. Spatial distribution of differences in dynamical environmental fields over East China between El Niño and La Niña years: (a) 850 hPa relative vorticity differences (10−5 s−1); (b) 200 hPa divergence differences (10−5 s−1); (c) 500 hPa vertical velocity differences (Pa s−1); (d) large-scale steering flow differences. All variables denote El Niño minus La Niña. The shading in (d) represents the differences in steering flow speed (m s−1), and the arrows represent the differences in steering flow vectors (reference arrow: 2 m s−1). Black dots indicate grid points at which the pointwise local differences are significant at the 95% confidence level based on a two-sided Mann–Whitney U test.
Water 18 01849 g007
Figure 8. Composite differences (El Niño minus La Niña) of TC-centric environmental variables within a 500 km radius: (a) total column water vapor (TCWV, kg m−2); (b) 700 hPa relative humidity (%); (c) Vertically Integrated Moisture Flux Convergence (VIMFC, 10−5 kg m−2 s−1), and (d) 500 hPa vertical velocity (ω, Pa s−1). The black solid circle denotes the inner-core boundary at a 100 km radius. Black dots indicate grid points at which the pointwise local differences are significant at the 95% confidence level based on a two-sided Mann–Whitney U test.
Water 18 01849 g008
Table 1. Composite mean differences in TC-centered thermodynamic and dynamic variables between El Niño and La Niña conditions within the total, inner-core, and outer-rainband regions. Sample size: n(El Niño) = 215 and n(La Niña) = 256 TC-centered windows during the landfall ±24 h period. These windows were used to calculate composite environmental statistics, whereas the effective independent sampling units were the 14 El Niño and 18 La Niña TC events. The same set of TC-centered windows was used for all variables.
FactorsRegionEl NiñoLa NiñaDiffChange (%)p-Value
TCWV (kg m−2)Total59.9858.441.542.63<0.01
Inner55.962.05−6.15−9.91<0.01
Outer60.1458.31.833.14<0.01
RH 700 (%)Total80.7378.672.062.62<0.01
Inner92.8191.171.641.800.01
Outer80.2778.192.082.65<0.01
VIMFC
(10−5 kg m−2 s−1)
Total−38.34−26.3−12.04−45.78<0.01
Inner−139.79−110.16−29.63−26.90<0.05
Outer−34.46−23.09−11.37−49.23<0.01
ω500 (Pa s−1)Total−0.25−0.19−0.06−32.85<0.01
Inner−0.81−0.64−0.17−26.430.02
Outer−0.22−0.17−0.06−33.78<0.01
Disclaimer/Publisher’s Note: The statements, opinions and data contained in all publications are solely those of the individual author(s) and contributor(s) and not of MDPI and/or the editor(s). MDPI and/or the editor(s) disclaim responsibility for any injury to people or property resulting from any ideas, methods, instructions or products referred to in the content.