Article

Hydrogeological Controls and Analytical–Numerical Prediction of Leakage in a Mountainous Pumped-Storage Upper Reservoir

1
PowerChina Northwest Engineering Corporation Limited, Xi’an 710065, China
2
College of Geological Engineering and Geomatics, Chang’an University, Xi’an 710054, China
*
Author to whom correspondence should be addressed.
Water 2026, 18(15), 1803; https://doi.org/10.3390/w18151803
Submission received: 9 June 2026 / Revised: 21 July 2026 / Accepted: 22 July 2026 / Published: 25 July 2026
(This article belongs to the Section Hydrogeology)

Abstract

Mountainous pumped-storage upper reservoirs are commonly affected by high reservoir water levels, adjacent low valleys, fractured rock masses, and local fault-fracture zones, which complicate leakage pathway identification and leakage prediction. This study investigates a two-valley connected mountainous pumped-storage upper reservoir in northwestern China. Groundwater observations, packer tests, analytical calculations, and three-dimensional groundwater flow modeling were integrated to analyze the permeability structure of the reservoir basin, potential leakage pathways, and leakage discharge after impoundment. The results show that the reservoir rock mass is dominated by very weakly to weakly permeable rocks, whereas local moderately permeable zones may form leakage pathways together with dam abutments, ridge saddles, and fault-fracture zones. The summed analytical leakage discharge of the identified pathways was 3069.80 m3/d. Under the normal reservoir water level of 1895 m, the summed analytical leakage discharge of the identified pathways was 3069.80 m3/d, whereas the three-dimensional numerical model predicted a total leakage discharge of 2661.81 m3/d. Both methods indicate that dam foundations and abutments, the western ridge saddle of Reservoir B, and surrounding fault-fracture zones are the main leakage-prone zones. These results suggest that seepage-control boundary determination for similar mountainous upper reservoirs should consider the spatial association among dam-site areas, local permeable zones, ridge saddles, adjacent low valleys, and fault-fracture zones.

1. Introduction

Pumped-storage power stations are an important form of long-duration energy storage for supporting the integration of a high proportion of renewable energy and can provide peak shaving, frequency regulation, reserve capacity, and system regulation functions [1,2,3]. With the development of closed-loop and off-river pumped-storage projects, high-elevation upper reservoirs are increasingly constructed among mountainous valleys, ridges, and local depressions to obtain large hydraulic heads [4,5]. Such reservoir basins are commonly characterized by high normal water levels, strong adjacent-valley incision, short seepage paths, and complex seepage-control boundaries. Leakage may affect not only operational water loss and energy-storage efficiency but also dam-foundation and abutment treatment, reconstruction of the groundwater field around reservoir banks, and long-term operational safety.
Reservoir leakage studies have long focused on dam foundations, abutments, karst conduits, fractured rock masses, and reservoir water–groundwater interactions. Previous studies have shown that leakage discharge is jointly controlled by reservoir water level, groundwater boundary conditions, rock-mass permeability, seepage length, and pathway continuity, and that analytical calculations and groundwater numerical modeling can both be used for leakage assessment [6,7,8,9]. In pumped-storage upper reservoirs, local ridge saddles, adjacent low valleys, weathered and unloaded zones, and fault-fracture zones may form favorable seepage pathways. Existing studies have provided important foundations for seepage-control measures in pumped-storage upper reservoirs, upper-reservoir leakage estimation, and the basic theory of groundwater flow in fractured rocks [10,11,12]. However, the identification of localized leakage pathways and flux partitioning in non-karst crystalline-rock mountainous reservoir basins still requires integrated analysis of topography, groundwater level, permeability structure, and structural connectivity. In particular, where the main reservoir-basin rock mass has low permeability, leakage risk is often governed by local hydraulic windows rather than average rock-mass parameters.
Groundwater flow in fractured rock masses exhibits pronounced heterogeneity and scale effects. Even when the main reservoir-basin rock mass has low permeability, local weathered zones, unloading fractures, abutment rock masses, and fault-fracture zones may still form leakage pathways under high hydraulic gradients [13,14,15,16,17,18,19]. Groundwater-level observations can constrain the hydraulic-head relationship between reservoir water and the natural groundwater system, whereas packer tests and their interpretation methods can reveal the permeability classification of different weathering zones and fractured rock masses [20,21,22]. Integrating field evidence, analytical calculations, and three-dimensional numerical modeling can identify major leakage-prone zones and verify leakage-discharge magnitudes from different methods while maintaining parameter traceability, thereby improving the reliability of leakage assessment for mountainous upper reservoirs.
This study investigates the upper reservoir of a pumped-storage power station in the West Qinling Mountains, China. The upper reservoir was formed by constructing dams in two valleys and excavating the intervening ridge to connect the two reservoir basins. The normal water level is 1895 m, the dead water level is 1880 m, and the regulating storage capacity is 10.76 million m3. The reservoir-basin rock mass is dominated by very weakly to weakly permeable rocks, whereas local ridge saddles, adjacent low valleys, low-groundwater-level zones, and fault-fracture zones provide hydrogeological conditions for leakage-pathway formation. By integrating groundwater observations, packer tests, analytical calculations, and three-dimensional seepage modeling, this study establishes a pathway-oriented assessment that quantifies leakage through dam foundations, abutments, ridge saddles, and fault-fracture zones. Unlike conventional assessments focused mainly on dam-site seepage, it identifies localized hydraulic windows outside the dam area and provides a basis for defining seepage-control boundaries in mountainous upper reservoirs.

2. Study Area and Hydrogeological Setting

2.1. Engineering Layout and Topographic Conditions

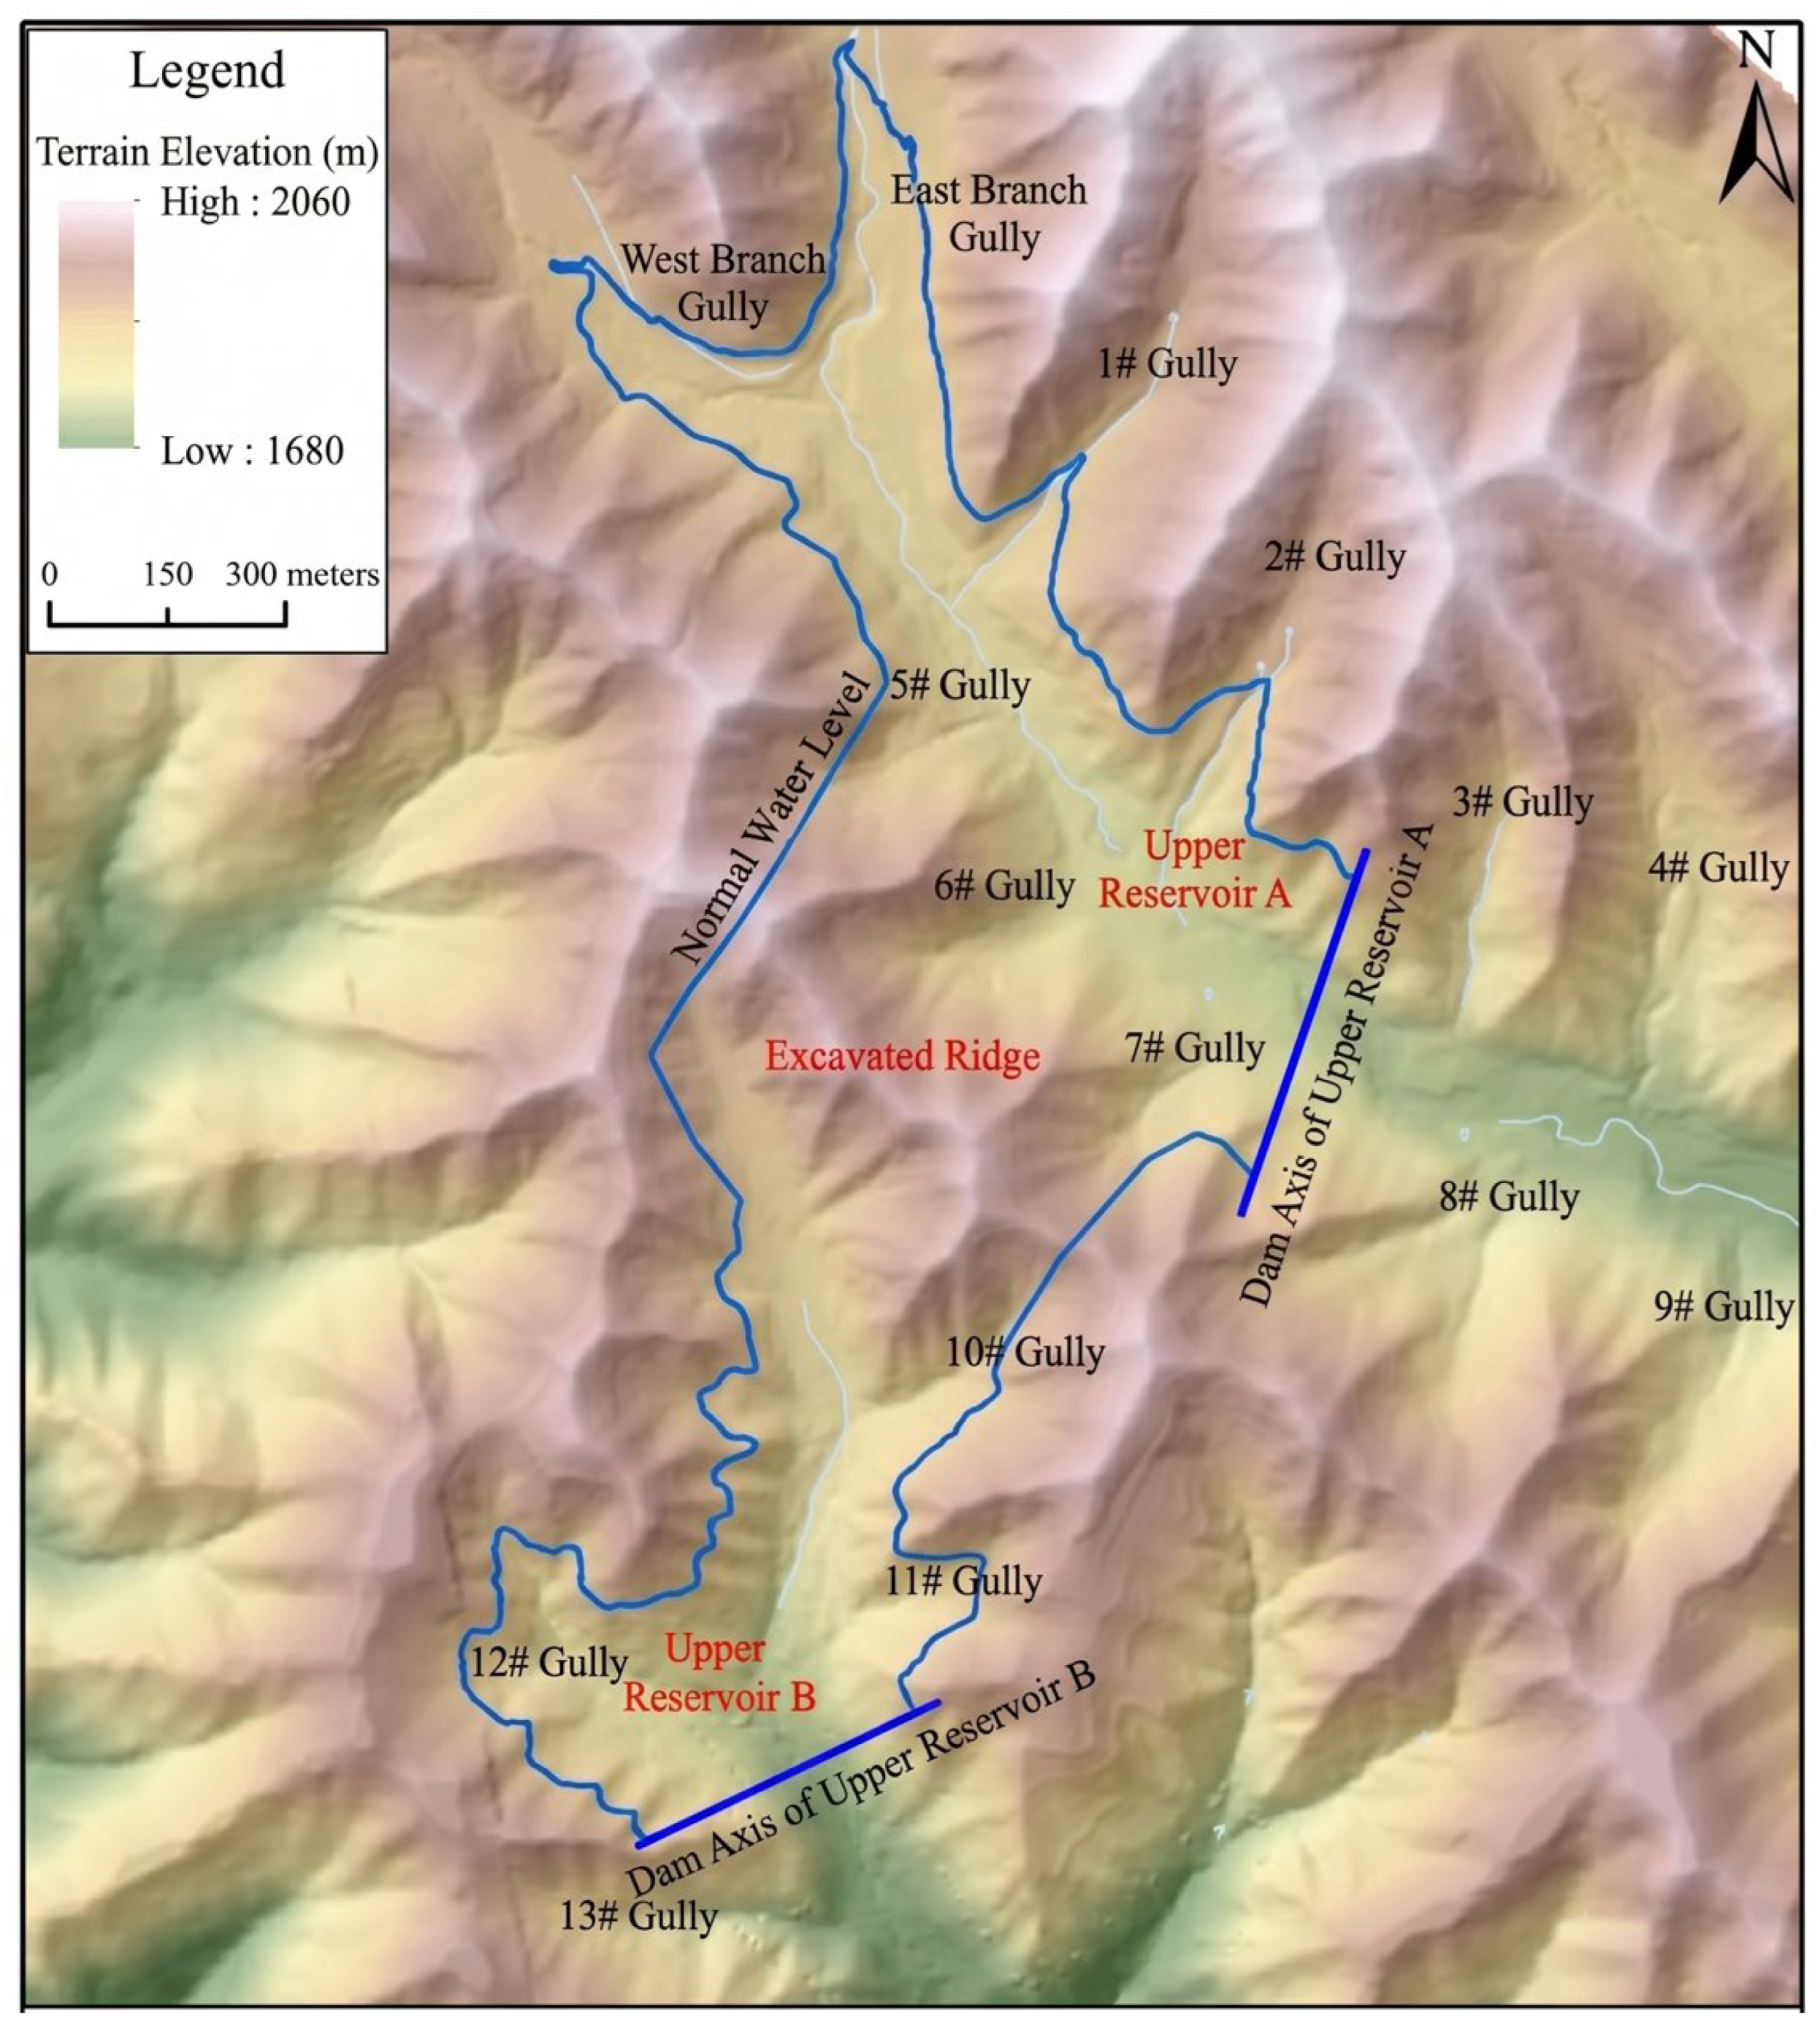
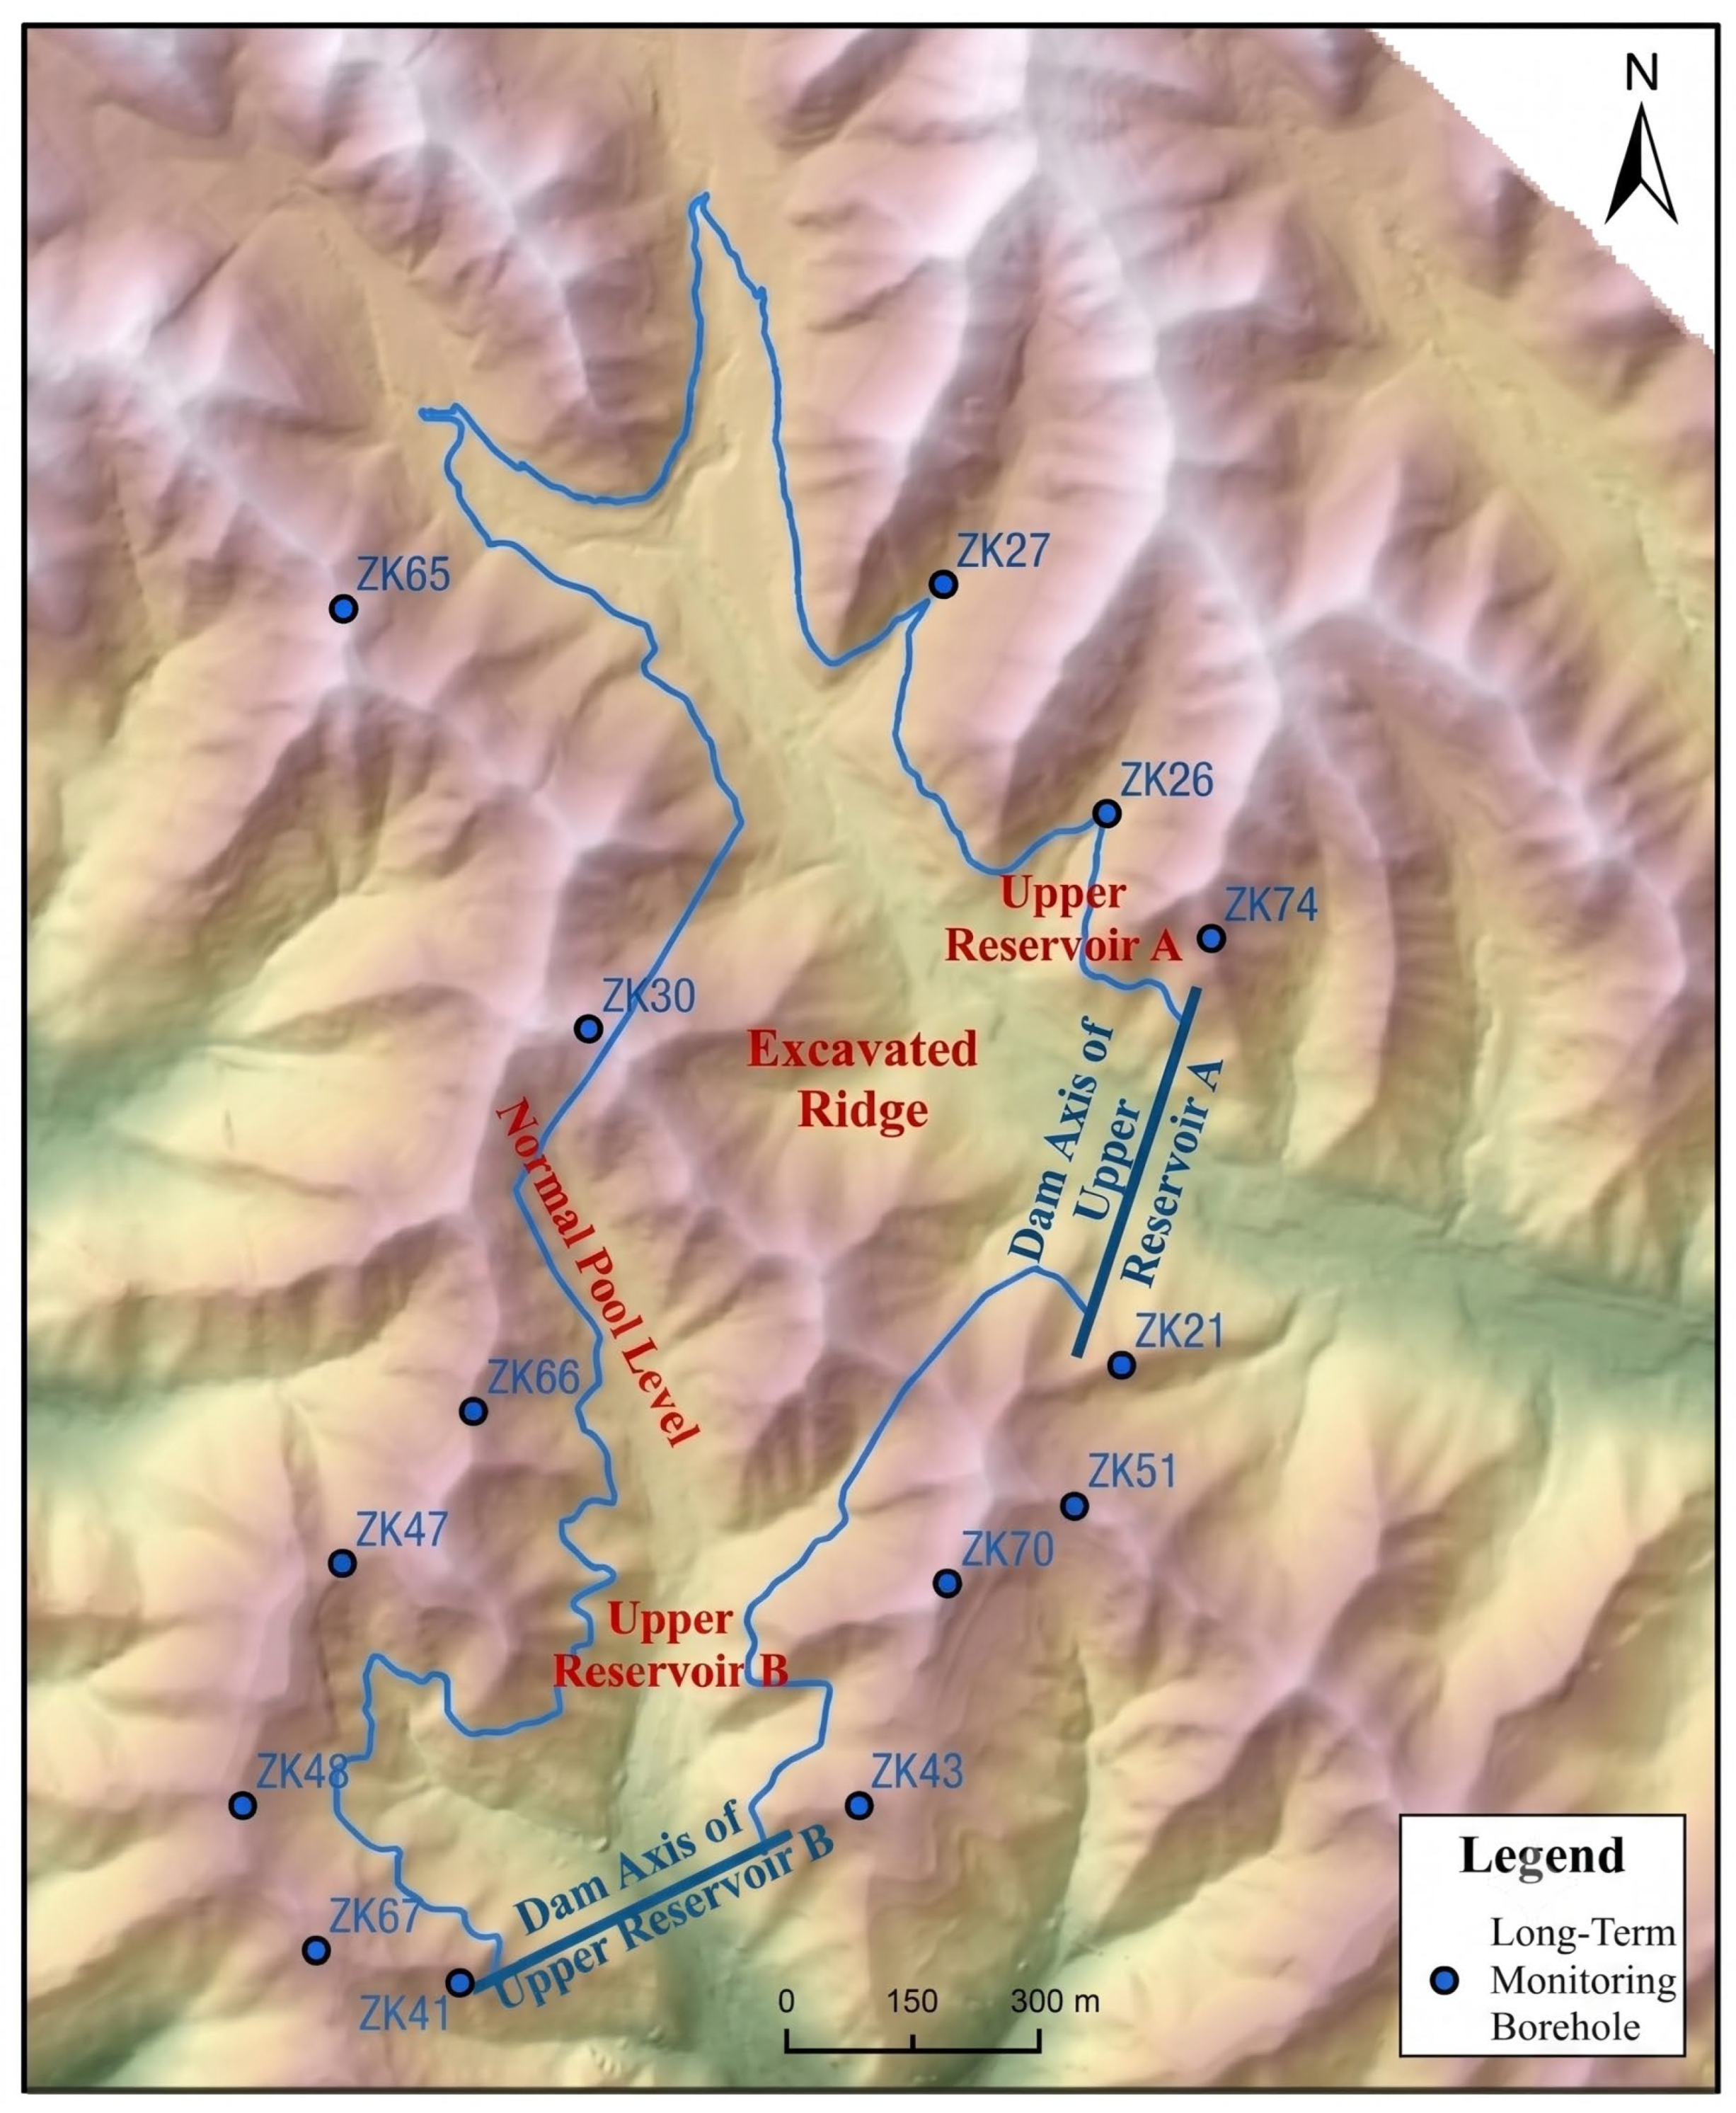
The upper reservoir investigated in this study is located in a mountainous region of northwestern China. It was formed by constructing dams in two valleys, hereafter referred to as Valley A and Valley B, and by excavating the intervening ridge to connect the two reservoir basins. Valley A forms Reservoir A, whereas Valley B forms Reservoir B. The normal reservoir water level is 1895 m, the dead water level is 1880 m, and the regulating storage capacity is 10.76 million m3. The reservoir is characterized by a high-elevation mountainous layout with two dammed valleys connected through an excavated ridge. This engineering layout determines the spatial relationships among dam foundations, abutments, ridge saddles, adjacent valleys, and groundwater levels, which provide the basic conditions for leakage analysis (Figure 1).
The upper reservoir is located in a structural-denudation middle- to low-mountain area with strong topographic incision. The main channel of Valley A, where Reservoir A is located, is approximately 2.2 km long, with a valley-floor elevation of 1798–1870 m, a valley-bottom width of 10–90 m, and an average longitudinal gradient of 3.3%. The slopes on both sides are approximately 100–120 m high, with slope angles generally ranging from 30° to 45°. The main channel of Valley B, where Reservoir B is located, is approximately 1.9 km long, with a valley-floor elevation of 1794–1895 m, a valley-bottom width of 10–80 m, and an average longitudinal gradient of 5.3%. The slopes on both sides are approximately 90–140 m high, with slope angles generally ranging from 28° to 48°. Most reservoir-bank slopes are covered by Quaternary deposits, with local bedrock exposures. Nine tributary gullies are developed in the dam-site and reservoir areas of Valley A, and four tributary gullies are developed in the dam-site and reservoir areas of Valley B. The incision of gullies and the distribution of ridges jointly control the potential outward drainage directions of the reservoir basin (Table 1).
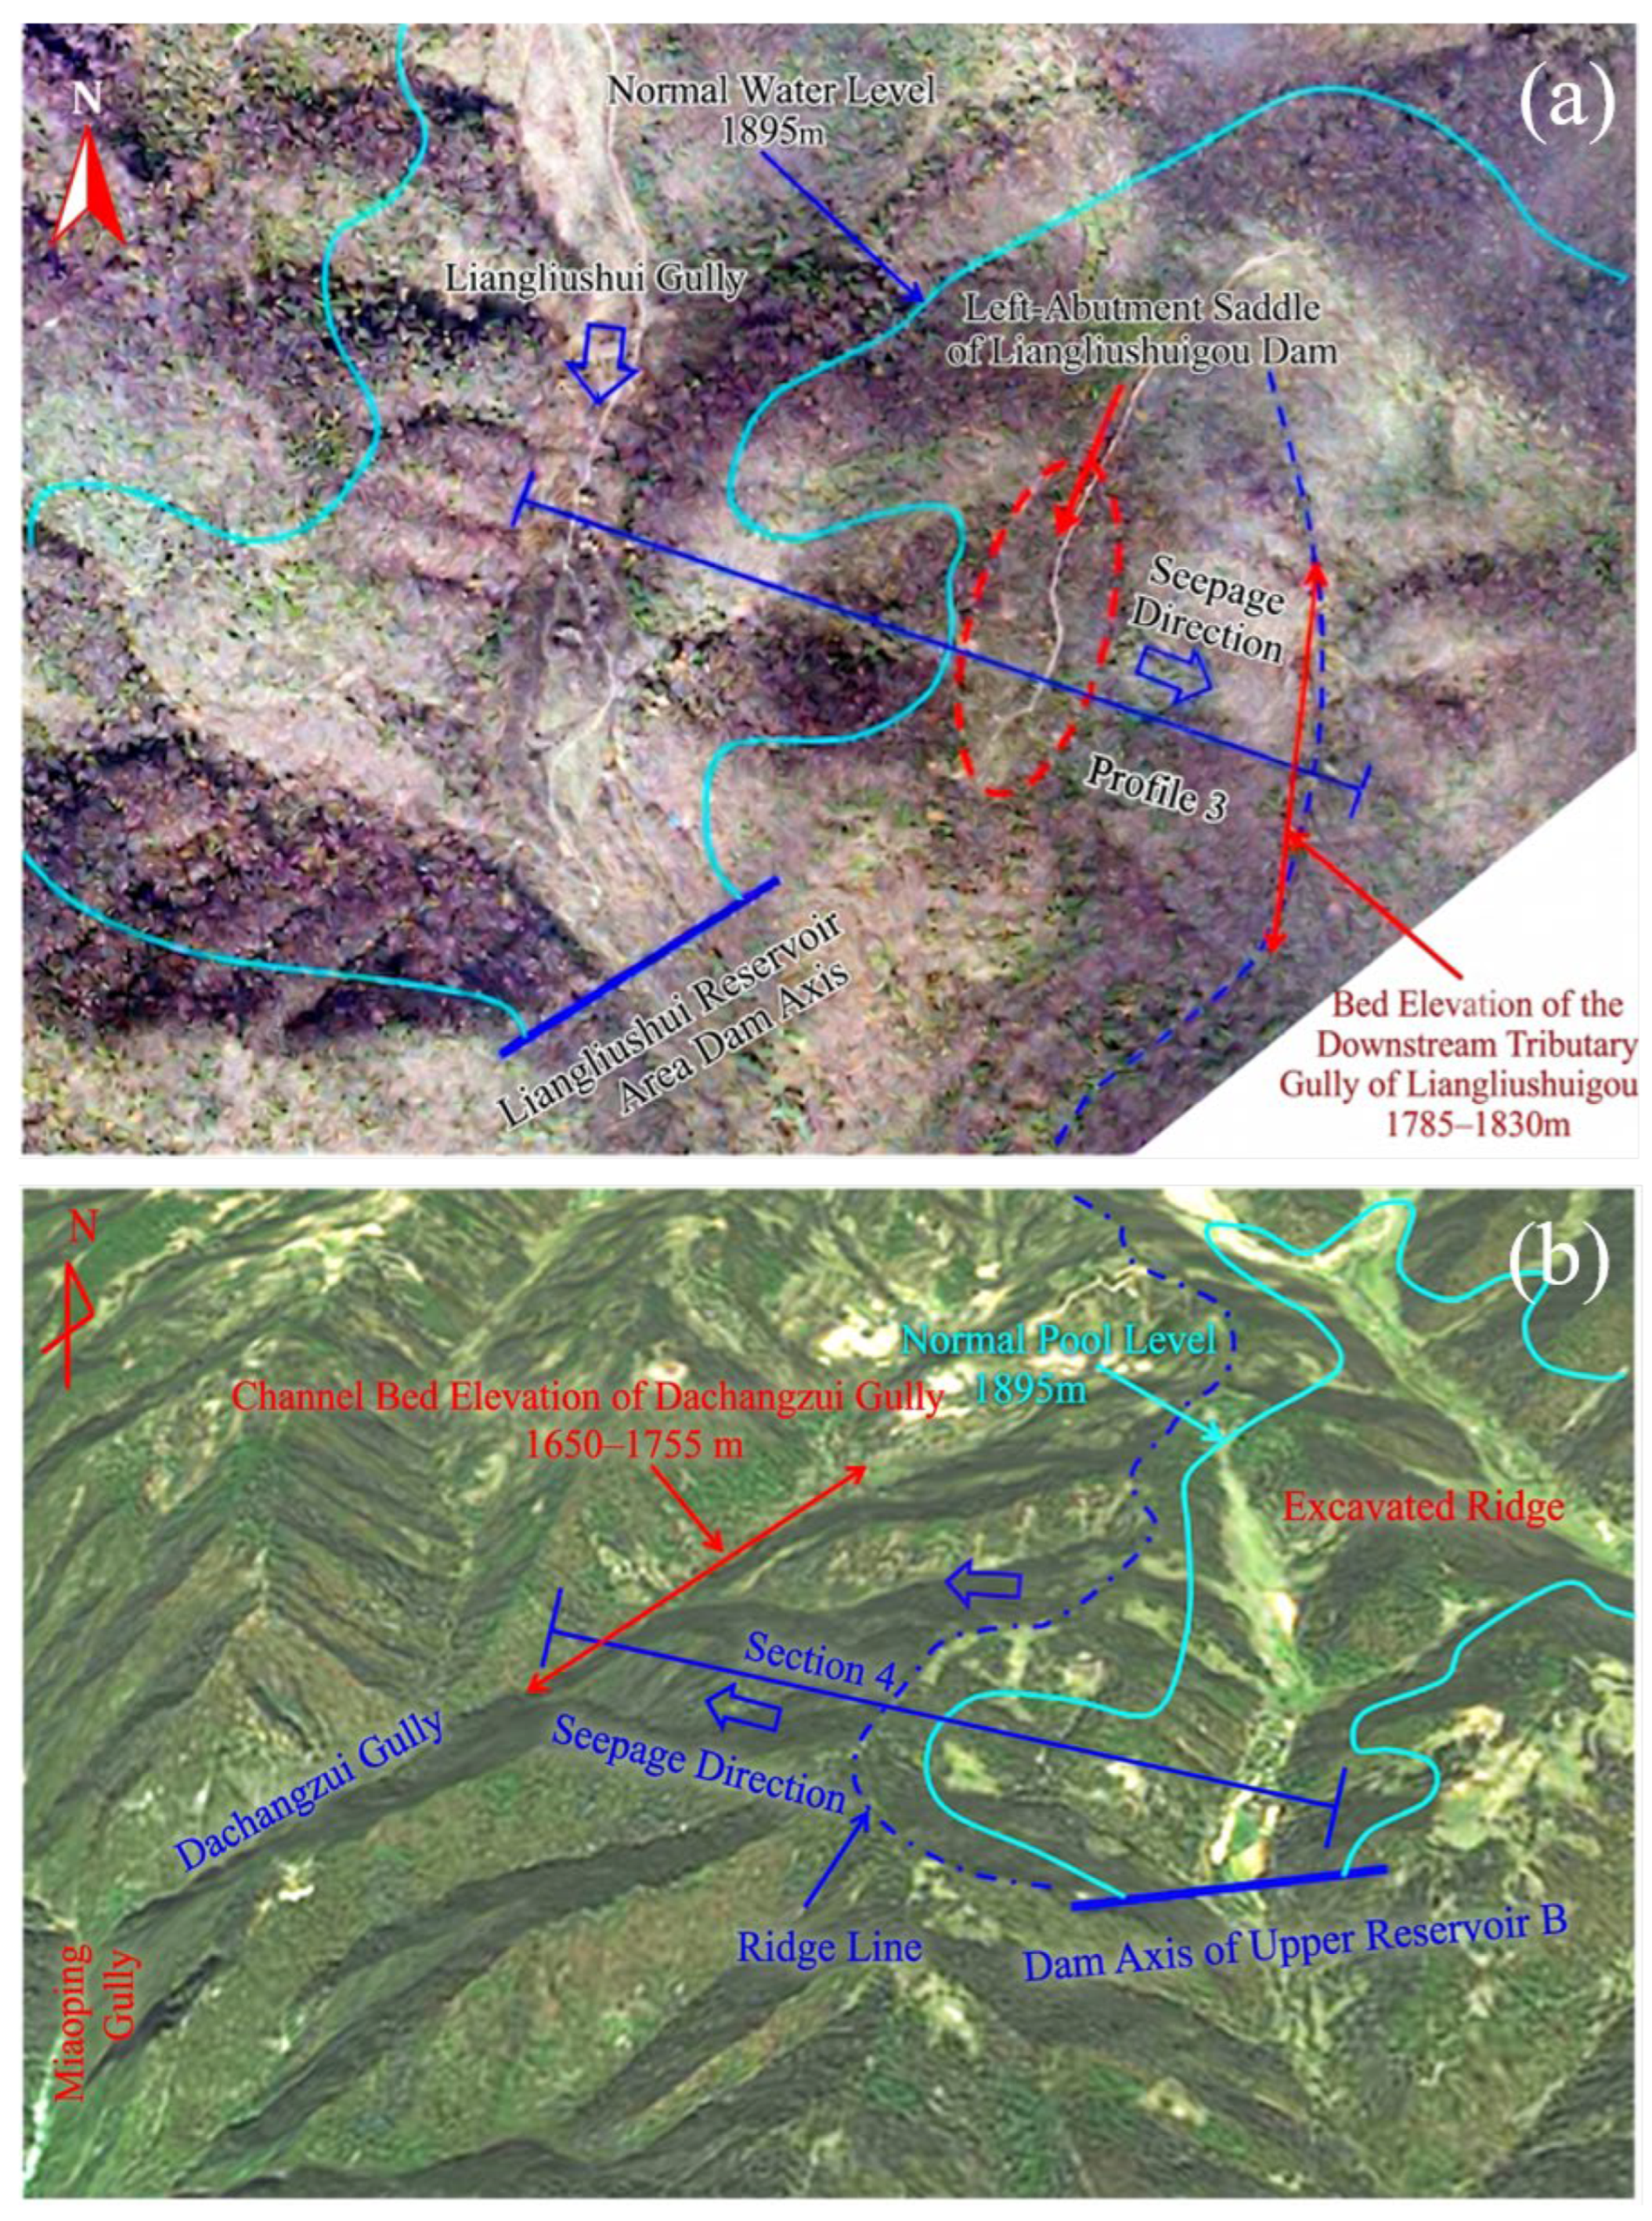
The mountains on both sides of Valley A are generally thick. At the normal reservoir water level, the ridge widths are approximately 530–760 m on the left bank and 235–435 m on the right bank. The nine tributary gullies terminate within or near the reservoir-bank slopes, do not cut through the surrounding ridges, and do not form saddles lower than 1895 m. The four tributary gullies around Reservoir B similarly do not cut through the ridges; the ridge thickness is approximately 235–660 m on the left bank and 250–320 m on the right bank in the gully-affected sections. Therefore, no independent trans-ridge leakage pathway controlled by these tributary gullies was identified. Local seepage along weathered gully margins may occur, but it was incorporated into the corresponding reservoir-bank and ridge hydrogeological units rather than classified as a separate pathway. In contrast, distinct ridge saddles and adjacent low valleys occur around Reservoir B outside these tributary gullies and can provide drainage boundaries for reservoir-water leakage (Figure 2). Thus, Reservoir B requires particular attention to the hydraulic connection among ridge saddles, thin ridges, and adjacent low valleys.

2.2. Stratigraphy, Geological Structures, and Permeability Background

The bedrock in the reservoir area is dominated by Devonian biotite plagiogneiss, with local Hercynian granite and related dikes. The ground surface is covered by Quaternary residual-slope deposits, diluvial deposits, and alluvial-proluvial loose deposits. Quaternary loose deposits are mainly distributed on slope surfaces, ridges, slope toes, and valley floors. The residual-slope deposits have an average thickness of approximately 9.62 m, whereas the alluvial-proluvial deposits in the main gullies have an average thickness of approximately 10.3 m. Although these deposits are more permeable than the underlying bedrock, the available geological mapping and hydrogeological sections did not identify a continuous Quaternary body crossing a reservoir-bank watershed and directly connecting the reservoir with an external low-valley boundary. They were therefore treated as shallow components of the reservoir-bank and ridge seepage systems rather than as an independent leakage-pathway type. Bedrock fissure water mainly occurs in weathered fissure zones and structural fractures. The gneiss and granite are generally relatively intact, but the permeability of the rock mass is controlled by weathering zoning, unloading fractures, and structural fracture zones, resulting in pronounced spatial variability. Below the normal reservoir water level, the rock mass is dominated by very weakly to weakly permeable zones, whereas local strongly weathered zones, deep fractured intervals within weakly weathered rocks, and structural fracture zones may form relatively permeable zones.
Packer-test data indicate that the rock mass below the normal reservoir water level is generally very weakly to weakly permeable. Relatively higher permeability mainly occurs in strongly weathered zones, fractured intervals, abutment unloading zones, and local structural fracture zones. This permeability pattern indicates that the reservoir basin does not have the rock-mass conditions for extensive uniform outward leakage. However, local permeable intervals may still form leakage pathways under the combined effects of high reservoir water level and external drainage boundaries.
Several structural fracture zones are developed in and around the reservoir area. Some local structural zones cut through or approach the ridges around Reservoir B and may be hydraulically connected with adjacent low valleys. The hydrogeological role of structural fracture zones is controlled by their width, filling condition, fracture connectivity, and contact relationship with the reservoir-water boundary. In this study, structural fracture zones that may be hydraulically connected with adjacent-valley drainage boundaries around Reservoir B are treated as an independent type of leakage pathway (Table 2).

2.3. Groundwater Conditions

Groundwater in the upper reservoir area mainly includes pore water in Quaternary loose deposits, weathered fissure water, and bedrock fissure water. It is jointly controlled by topographic incision, rock-mass weathering degree, structural fractures, and gully drainage conditions. Quaternary loose deposits are mainly distributed on reservoir-bank slopes, ridges, and slope toes, with relatively large thicknesses at local gully mouths and slope toes. Bedrock fissure water mainly occurs in the weathered fissures and structural fractures of gneiss and granite. Groundwater is generally recharged by atmospheric precipitation infiltration and discharges toward low-lying gullies along valleys, slope toes, and local fracture zones.
Pre-impoundment field investigations show that spring discharge in the reservoir area is generally small. Only springs in the upper tributary gullies of Valley A have relatively large discharge, with maximum values of 5–6 L/s. Some spring outlets and gully drainage boundaries are lower than the normal reservoir water level, indicating that local areas around the reservoir have the hydraulic-head conditions for drainage from the reservoir basin toward external gullies.
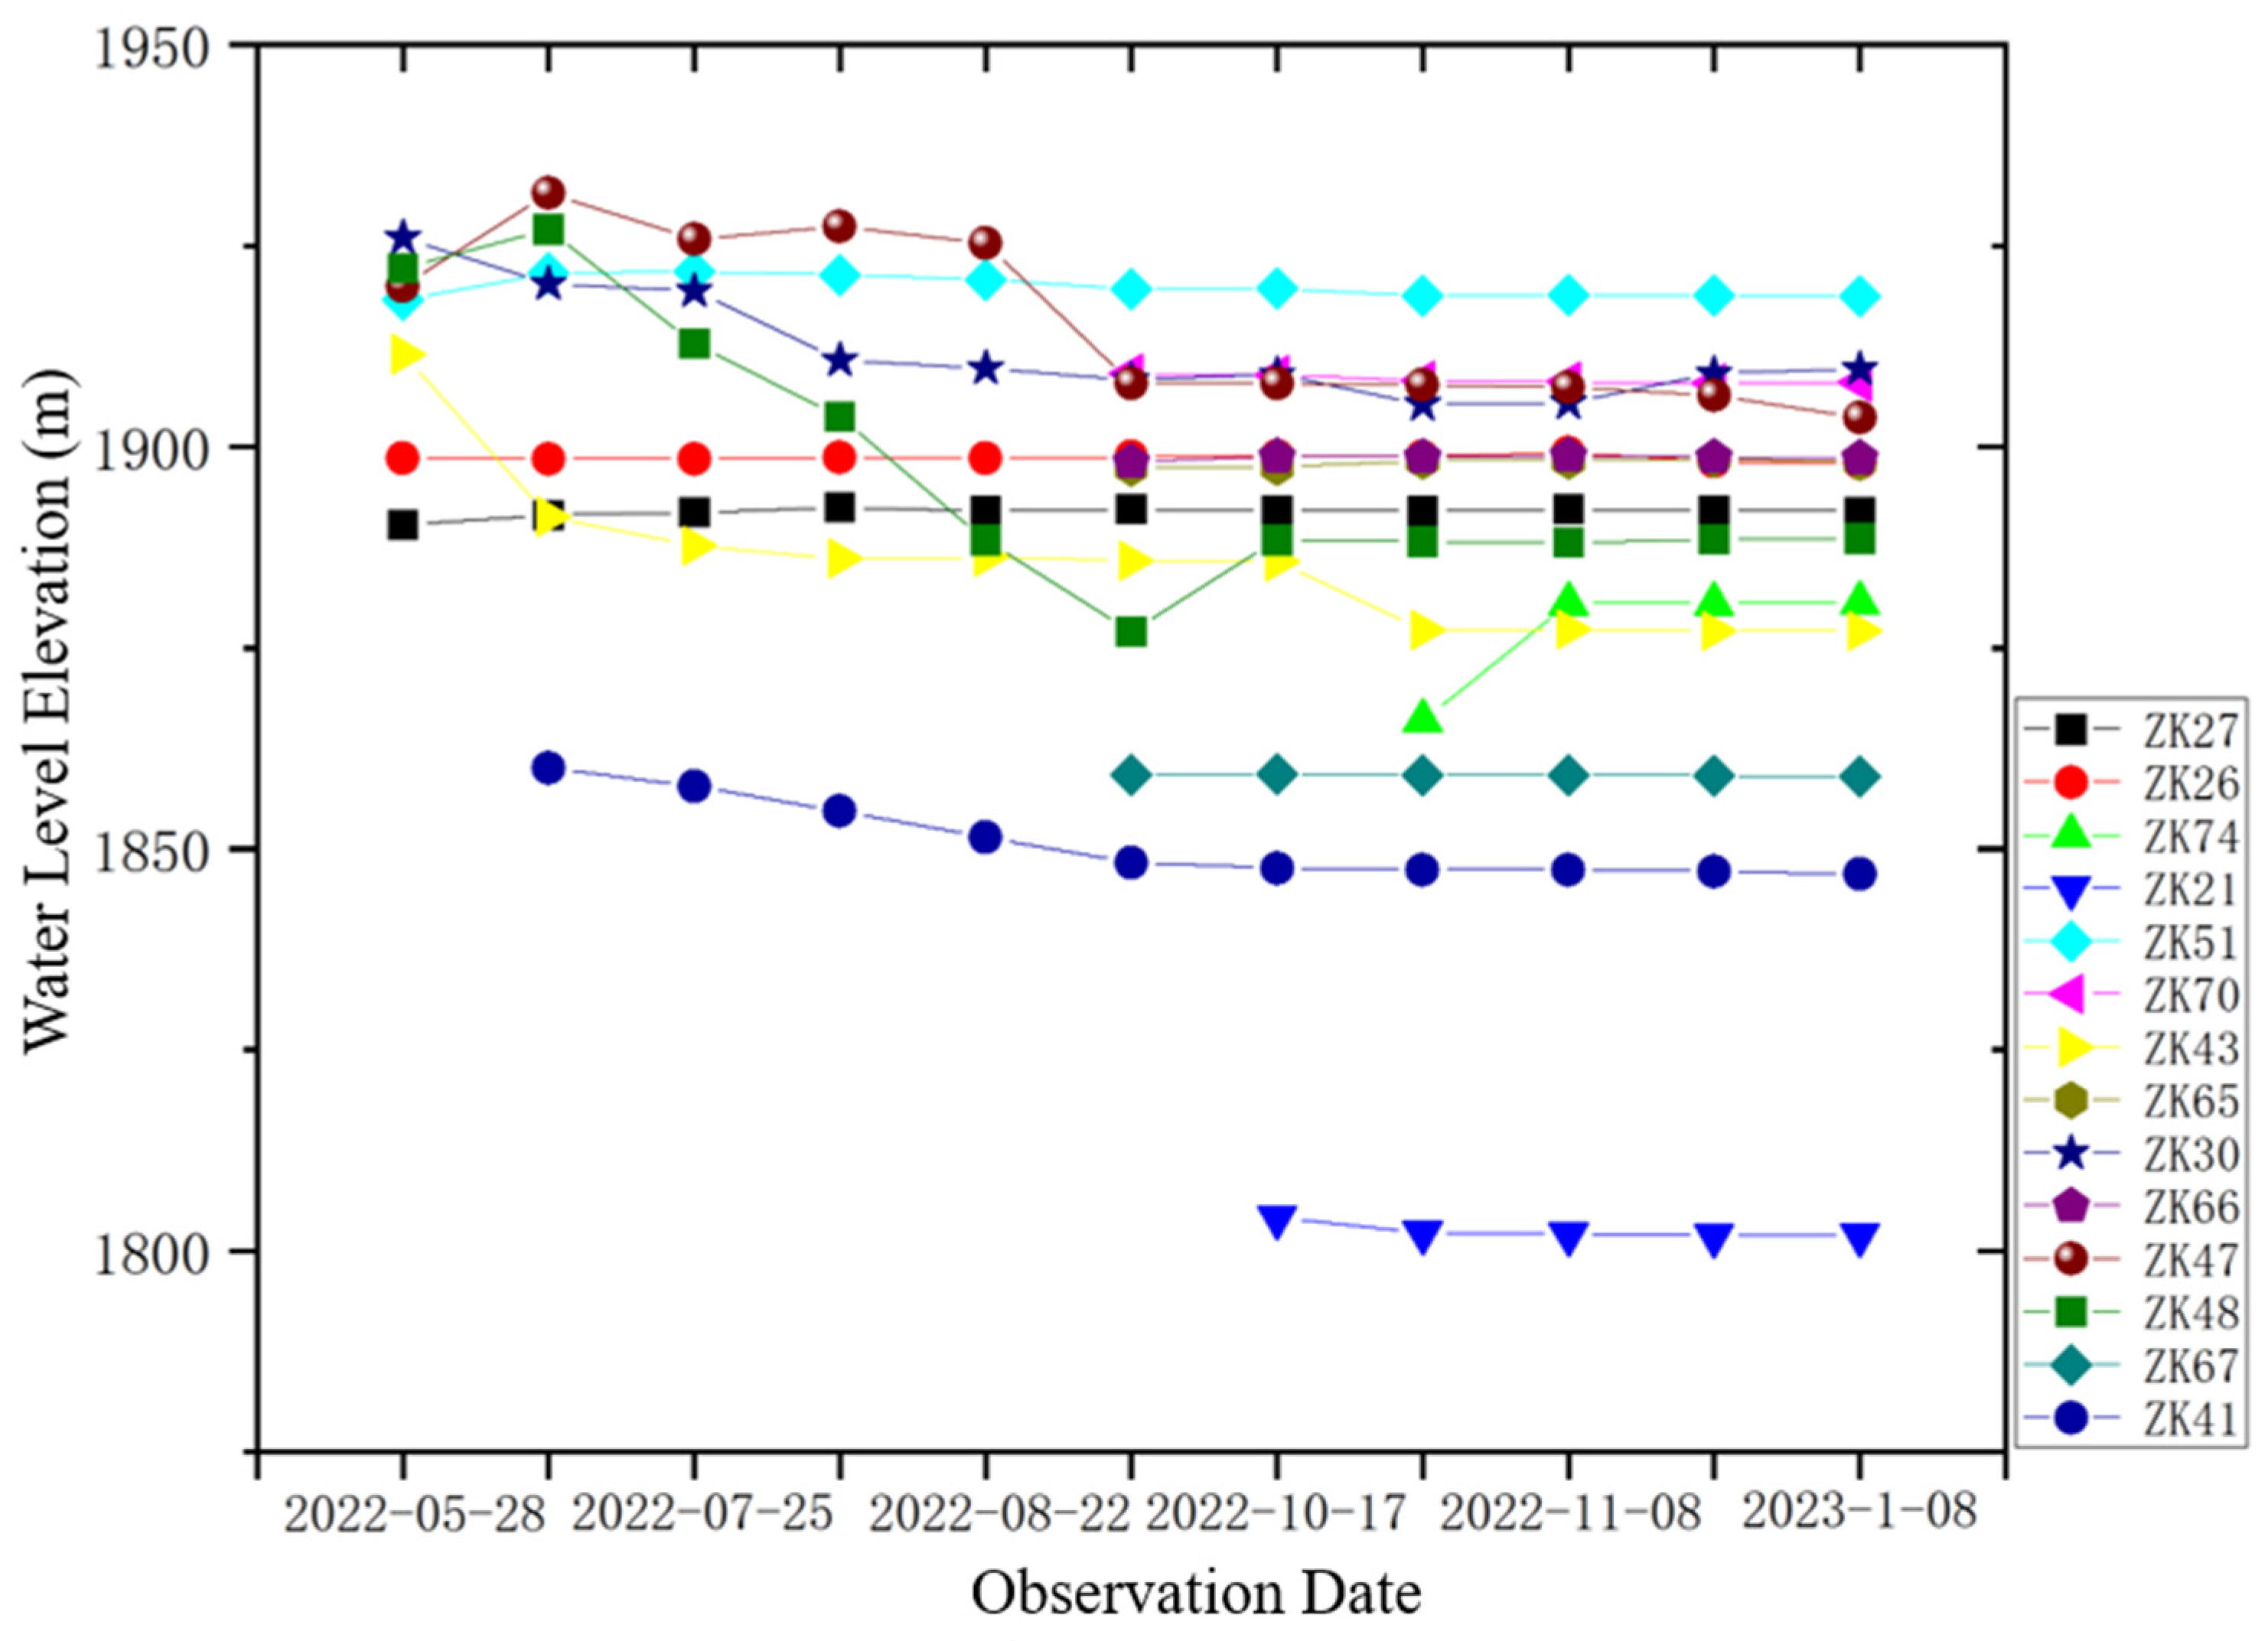
To constrain the natural groundwater field, 14 long-term groundwater observation boreholes were used, including 3 on the eastern reservoir bank, 4 on the southern reservoir bank, and 7 on the western reservoir bank (Figure 3). The available monitoring network was spatially uneven, with no borehole directly located on the northern bank or within the western ridge saddle. Therefore, groundwater conditions at the western saddle were constrained indirectly by nearby western-bank observations, hydrogeological sections, and the adjacent low-valley drainage boundary, and remain less certain than those in the monitored dam and abutment areas. The observations show that groundwater levels in most boreholes fluctuate only slightly and are generally stable. In contrast, the groundwater levels in ZK30, ZK43, ZK41, ZK48, and ZK47 vary more markedly and tend to stabilize after October 2022 (Figure 4). Among them, the groundwater level in ZK43 decreased from the initial observation value of 1911.5 m to approximately 1877 m, and that in ZK48 decreased from 1922 m to approximately 1888 m. Both values are lower than the normal reservoir water level of 1895 m. These groundwater-level characteristics indicate that hydraulic-head conditions exist for drainage from local ridge saddles toward adjacent low valleys outside the reservoir. These spring measurements provide pre-impoundment baseline data only, because post-impoundment observations were not available during the study period.
Groundwater levels, spring-outlet conditions, and adjacent low valleys collectively indicate that local areas of the reservoir basin have the hydraulic conditions for discharge toward the downstream dam area or adjacent valleys. Combined with the topographic boundaries, rock-mass permeability, and development of structural fracture zones described above, the dam foundations and abutments, ridge saddles around Reservoir B, and local structural fracture zones constitute the main hydrogeological targets for subsequent leakage-pathway identification and leakage-discharge prediction.

3. Data and Methods

3.1. Leakage Pathway Classification and Analytical Estimation

Potential leakage pathways were classified into four types according to hydraulic-head conditions, drainage boundaries, seepage media, and spatial connectivity. Dam-foundation leakage refers to reservoir water discharging downstream through the dam-foundation rock mass under the normal reservoir water level. Abutment bypass leakage refers to reservoir water discharging downstream along the left and right abutment rock masses and local permeable zones that bypass the seepage-control boundary. Ridge-saddle leakage refers to reservoir water discharging toward adjacent low valleys through thin ridges or saddles. Fault-fracture-zone leakage refers to reservoir water discharging toward external gullies along structural fracture zones that are connected with the reservoir basin and have certain hydraulic continuity. These four types were defined according to the outlet location, hydraulic-head relationship, and spatial connectivity of each pathway rather than solely according to the seepage medium. Quaternary deposits and weathered zones were treated as constituent media within the relevant dam-abutment or ridge-saddle pathways. The Quaternary cover was explicitly represented as a hydrogeological unit in the three-dimensional model, and its thickness and hydraulic conductivity were included in the equivalent conductivity of the analytical ridge-saddle pathways. The four pathway types therefore provide unified leakage units for analytical calculation and numerical simulation without excluding the contribution of the Quaternary cover or weathered gully margins.
Analytical estimation was performed under the assumptions of steady saturated Darcy flow and equivalent continuous seepage media. For packer-test intervals with q < 10 Lu and laminar pressure–flow responses, hydraulic conductivity was calculated as
K = Q p 2 π H t L t ln ( L t r 0 )
where Q p is the injection rate, H t is the test head, L t is the test-section length, and r 0 is the borehole radius. For intervals with q ≥ 10 Lu, hydraulic conductivity was estimated from the empirical Lu–K relationship adopted in the project investigation. The test results were grouped according to location, depth, and weathering grade rather than assigning a single K value to each Lu class. For layered media, the equivalent conductivities parallel and normal to the layers were calculated as
K = K i M i M i ,   K = M ( M i / K i )
Dam-foundation leakage was calculated using the finite-depth foundation model
Q f = K d B H M 2 b + M
Abutment bypass leakage was calculated as
Q a = 0.366 K ( H 1 2 H 2 2 ) l o g 10 ( B r 0 )
Ridge-saddle and fault-fracture-zone leakage were calculated using
Q h = K A H 1 H 2 L
The geometric parameters were determined from boreholes, hydrogeological profiles, and topographic sections. These analytical models provide first-order estimates for identifiable seepage pathways but do not explicitly represent three-dimensional flow redistribution or discrete-fracture connectivity. To evaluate the sensitivity of leakage to reservoir water level, the analytical calculations were repeated at the dead water level of 1880 m, while the hydraulic conductivity, seepage geometry, and external outlet heads were kept unchanged.
Analytical estimation was performed using an equivalent seepage-pathway approach. For dam-foundation leakage, the permeable rock mass beneath the dam was equivalent to a multilayer medium, and the main calculation parameters included the equivalent hydraulic conductivity, thickness of the permeable layer, upstream–downstream hydraulic-head difference, dam-bottom width, and dam length. For abutment bypass leakage, the left and right abutments were generalized as bypass seepage paths around the dam, and the calculation parameters included the hydraulic conductivity of the abutment rock mass, hydraulic-head difference, bypass seepage length, bypass seepage width, and equivalent flow section. For ridge-saddle leakage, thin ridges or saddles were generalized as equivalent seepage pathways connecting the reservoir basin and adjacent low valleys, with calculation parameters including hydraulic conductivity, normal reservoir water level, external outlet elevation, seepage length, and flow section area. For fault-fracture-zone leakage, local structural fracture zones around Reservoir B were generalized as belt-like seepage media, with calculation parameters including the hydraulic conductivity of the fault-fracture zone, outlet elevation, seepage length, and equivalent flow section.
The representative locations and analytical parameters of different leakage pathways are listed in Table 2. For the southern left-abutment ridge saddle of Reservoir B, the parameters were K = 0.048856 m/d, H1 = 1895 m, H2 = 1810 m, L = 348 m, and A = 19,000 m2. For the western ridge saddle of Reservoir B, the parameters were K = 0.037626 m/d, H1 = 1895 m, H2 = 1655 m, L = 800 m, and A = 43,000 m2. Leakage through fault-fracture zones around Reservoir B was calculated using equivalent belt-like seepage pathways. The hydraulic conductivity was set to K = 0.432 m/d, and the outlet elevation, seepage length, and flow section area of different calculation sections were determined according to the spatial relationship between the fault-fracture zones and external gullies.

3.2. Three-Dimensional Groundwater Flow Modeling

Three-dimensional groundwater flow modeling was used to analyze groundwater-level changes, dominant seepage directions, and flux partitioning among different leakage-prone zones after reservoir impoundment. The model was developed using the MODFLOW finite-difference groundwater flow code. The study area was discretized into three-dimensional computational cells, and the hydraulic head at each cell center was used to represent the groundwater level. The model domain was divided into hydrogeological units according to lithology, borehole data, weathering zoning, and the distribution of fault-fracture zones. The main units included Quaternary cover, completely weathered rock, strongly weathered rock, weakly weathered rock, fresh to slightly weathered rock, fault-fracture zones, dam-body materials, and reservoir-bottom backfill.
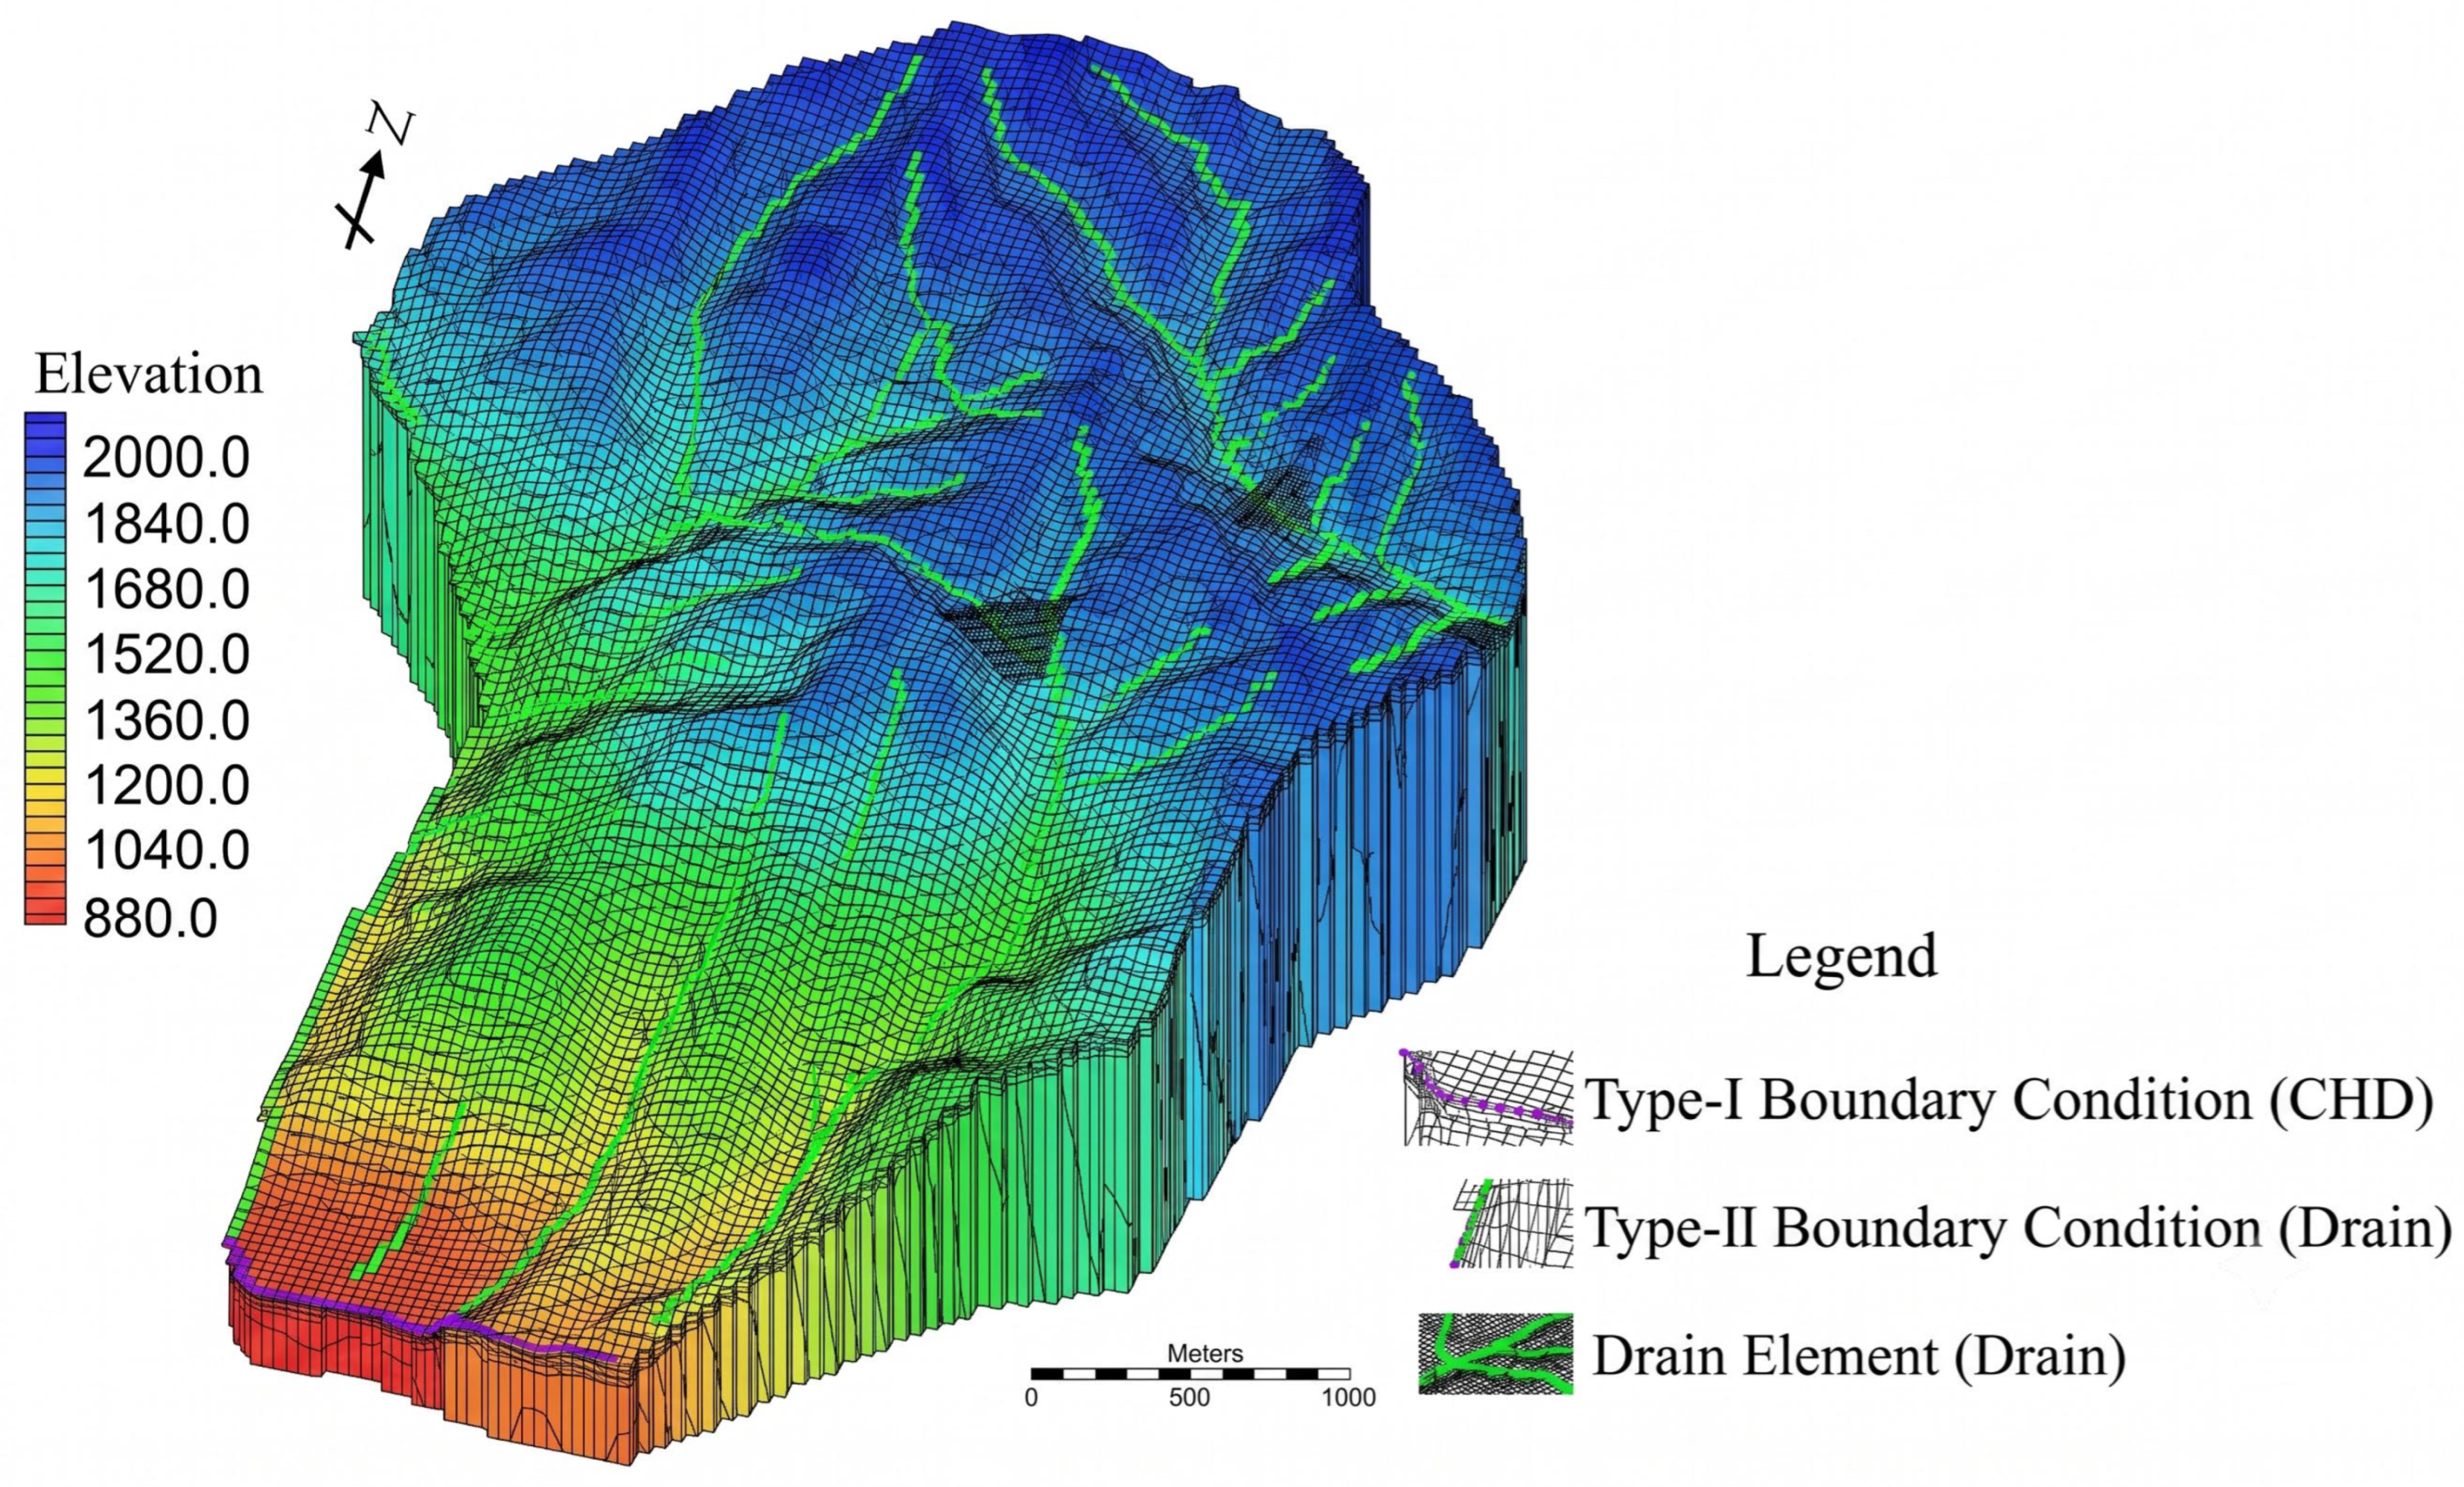
The model domain covered the upper reservoir, dam-site areas, and adjacent low-valley drainage boundaries. The northern and eastern watershed divides were assigned as no-flow boundaries. The southern regional drainage boundary was assigned as a constant-head boundary, whereas the western low-valley boundary was represented by head-dependent drain cells. The lower model surface at an elevation of 880 m was treated as a no-flow boundary representing deep low-permeability bedrock. Because this boundary lies approximately 775 m below the western valley outlet at 1655 m, its direct influence on shallow leakage near the western ridge saddle is expected to be limited; however, a formal sensitivity test of the lower-boundary depth was not conducted. The model had a maximum east–west length of approximately 4000 m, a maximum north–south length of approximately 5800 m, and an elevation range of 880–2000 m (Figure 5). The initial groundwater level was determined based on groundwater observations and hydrogeological conditions. The impoundment simulation used the normal reservoir water level of 1895 m as the reservoir-water boundary condition. The meteorological record for 1981–2010 indicates a mean annual precipitation of 553.1 mm, of which approximately 68% occurs from June to September. The maximum and minimum mean monthly precipitation are 108.1 mm in August and 3.9 mm in December, respectively. Rainfall infiltration and evaporation were incorporated into the model as recharge and discharge boundaries using the long-term meteorological data adopted in the project investigation. However, the available project documentation does not report the specific infiltration coefficient or the spatial distribution of recharge. The model therefore represents long-term average seepage conditions and does not resolve seasonal recharge variation, snowmelt, or individual extreme rainfall events.
The model input parameters included the horizontal hydraulic conductivity, vertical hydraulic conductivity, specific storage, specific yield, and effective porosity of each hydrogeological unit. Parameter values were determined based on packer-test results, rock-mass weathering zoning, engineering geological analogy, and relevant hydrogeological investigation specifications. The input parameters for different hydrogeological units are listed in Table 3.
Before simulating reservoir impoundment, the natural groundwater-flow model was calibrated using 120 paired groundwater-head observations from 14 monitoring boreholes collected between May 2022 and January 2023. The initial groundwater-head field was generated by interpolation of borehole observations and hydrogeological profiles, and the hydraulic parameters were adjusted within the ranges constrained by the field investigations. Model performance was evaluated using the mean error (ME), mean absolute error (MAE), root mean square error (RMSE), and maximum absolute residual. As summarized in Table 4, the ME, MAE, and RMSE were approximately −3.6, 3.6, and 4.0 m, respectively, and the maximum absolute residual was approximately 6.9 m. The negative ME indicates a slight systematic underestimation of groundwater heads. Independent post-impoundment validation was not possible because the reservoir had not been impounded during the study period. The model outputs included the groundwater-level field after impoundment, seepage near the dam foundations and abutments, adjacent-valley leakage through the ridge saddles around Reservoir B, and leakage through fault-fracture zones. Outflow discharge was then calculated for each leakage pathway. The simulation results were compared with the analytical estimates to evaluate the consistency of the identified major leakage pathways and leakage-discharge magnitudes.

4. Results and Analysis

4.1. Permeability Structure and Leakage-Prone Zones

Packer-test results show that the rock mass in the upper reservoir area is dominated by very weakly to weakly permeable rocks, whereas moderately permeable intervals account for only a small proportion but are closely related to leakage-prone zones. According to the rock-mass permeability classification adopted in GB 50287-2016 [23], test sections with q < 1 Lu account for 70.5% and are classified as very weakly permeable; sections with 1 q < 10 Lu account for 19.5% and are classified as weakly permeable; and sections with q 10 Lu account for 10.0% and are classified as moderately permeable (Table 5). The 1 Lu boundary is used here only for hydrogeological permeability classification and should not be interpreted as a grouting-treatment or acceptance threshold. The analytical calculations were based on continuous hydraulic-conductivity values derived from the packer tests rather than the categorical Lu classes. This distribution indicates that the reservoir-basin rock mass has generally low permeability and does not provide conditions for extensive uniform leakage. Local moderately permeable intervals reflect the relatively high permeability of weathering fractures, abutment unloading fractures, and structural fracture zones, and are important for identifying localized leakage pathways.
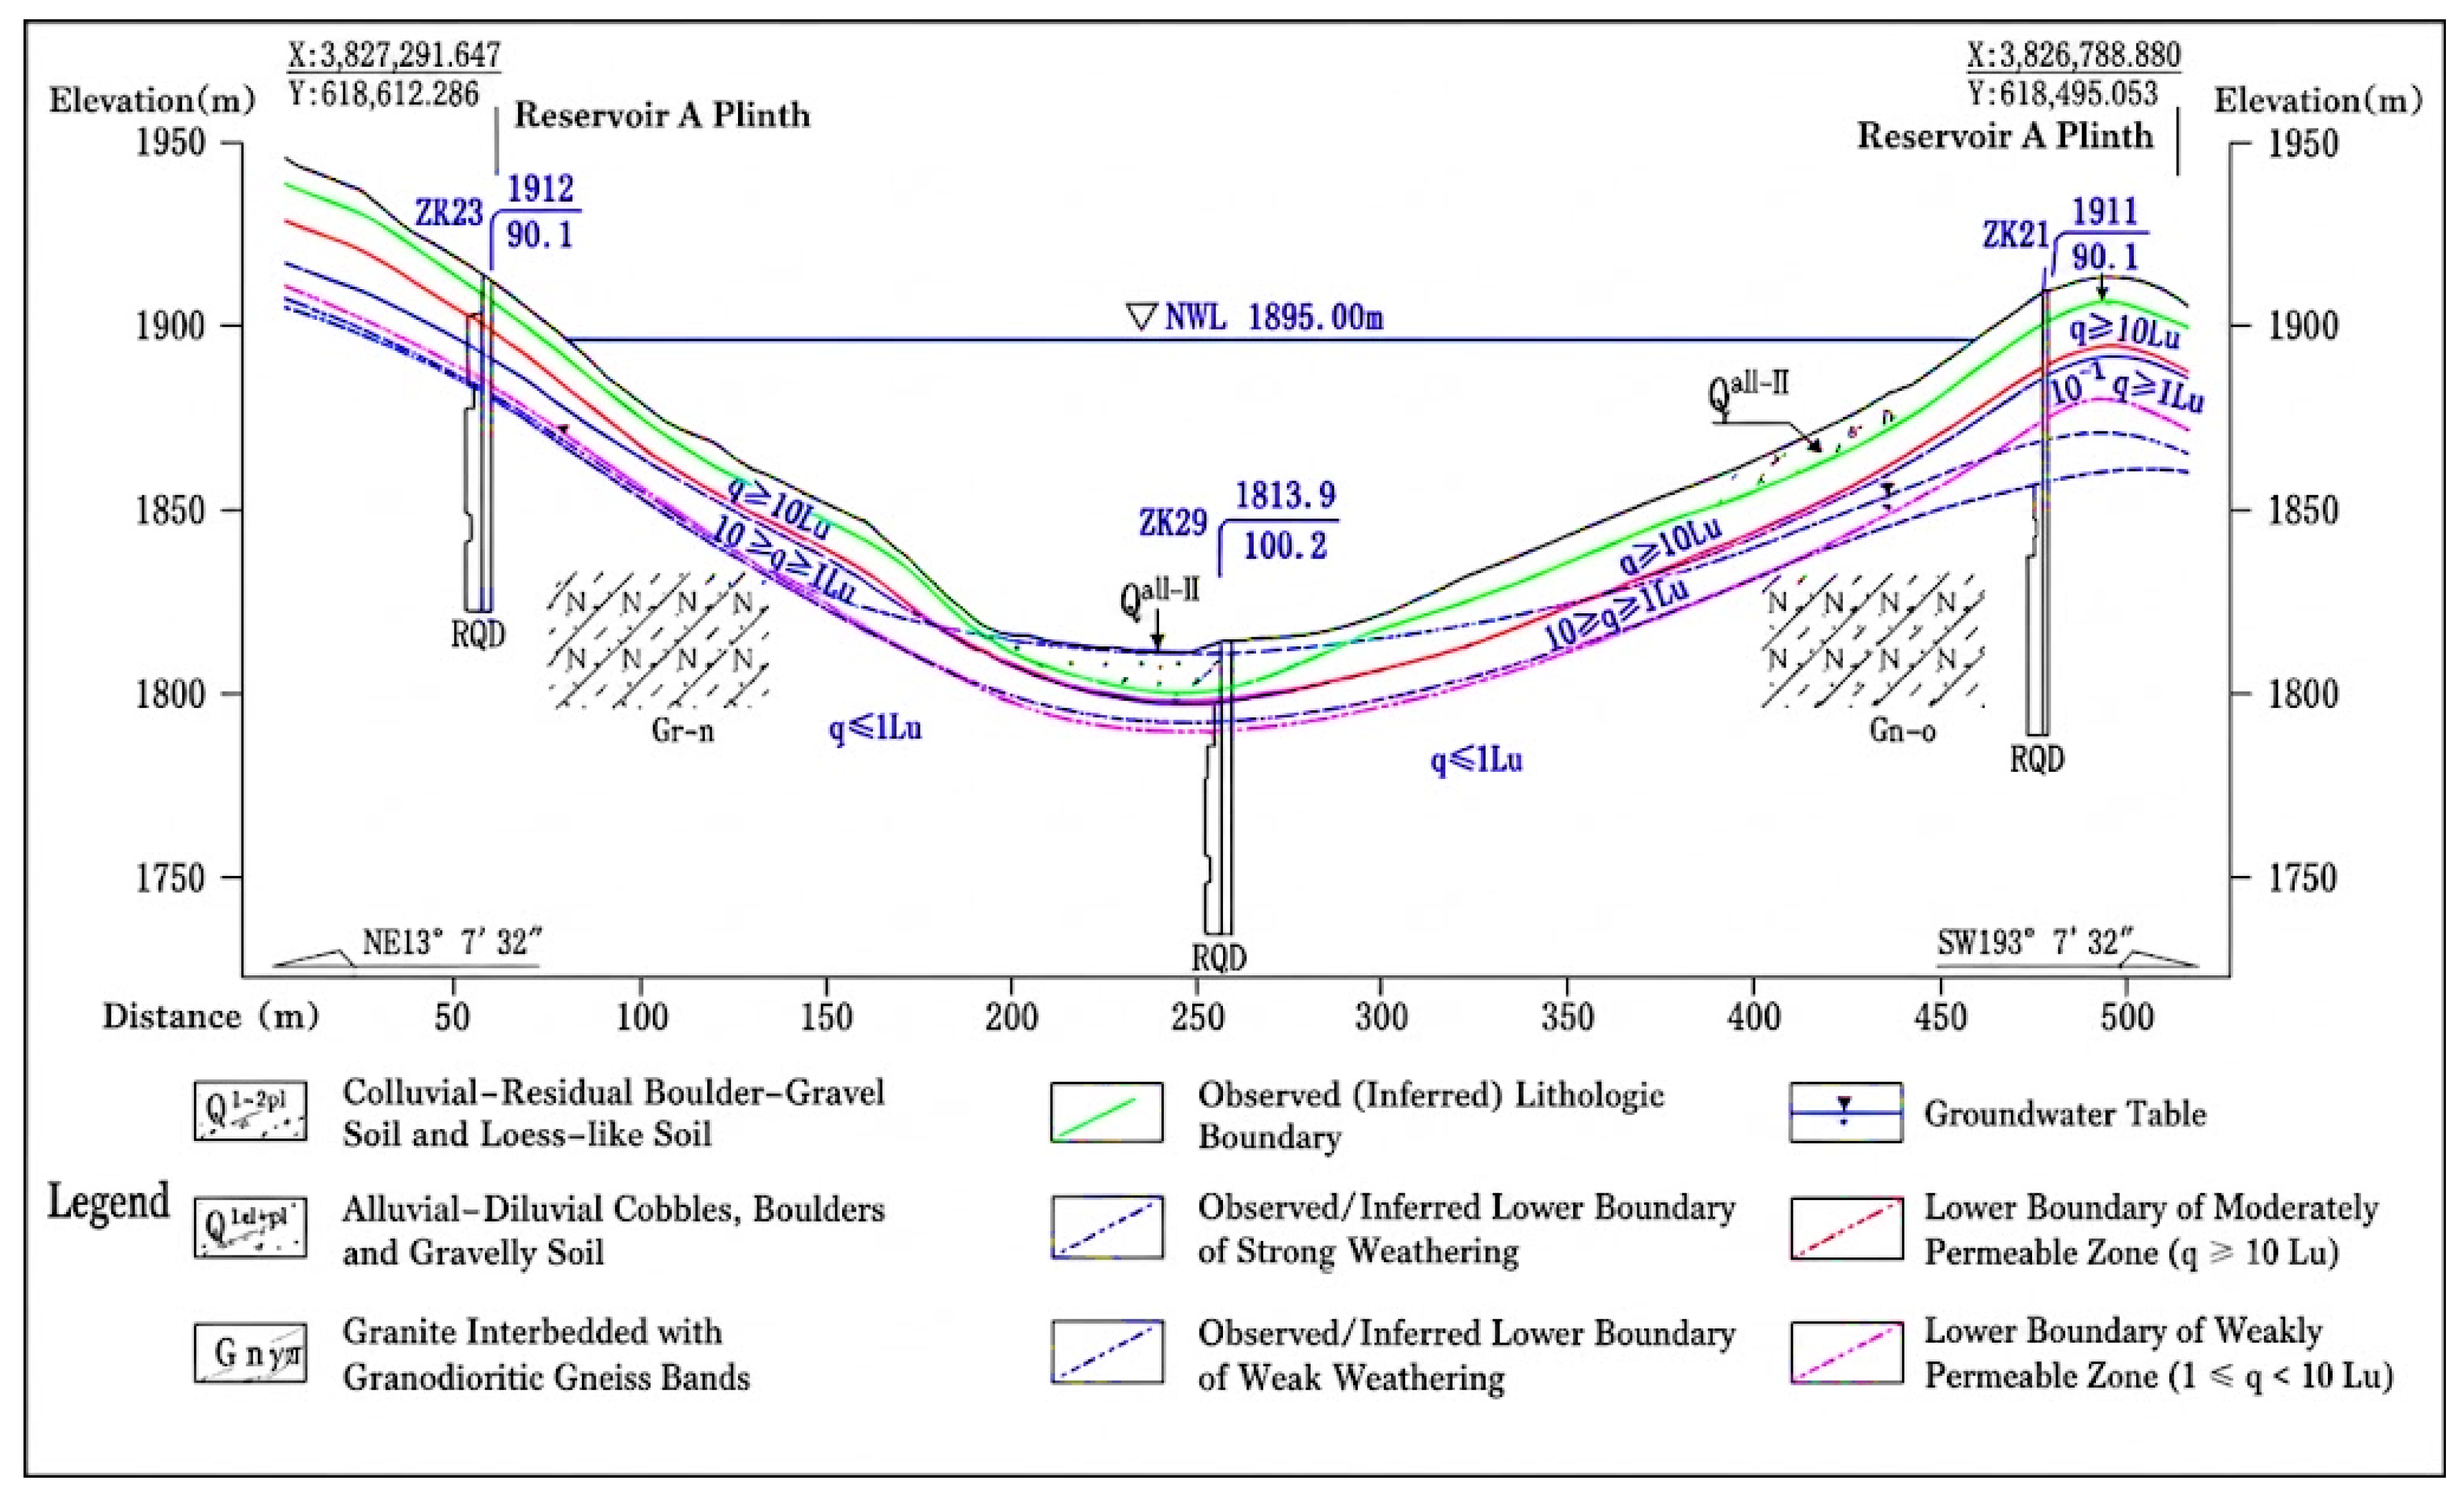
The hydrogeological section along the dam axis of Reservoir A shows a clear correspondence between the permeability structure of the dam foundation and abutment rock masses and the weathering zones (Figure 6). Moderately permeable zones mainly occur within shallow strongly weathered rocks, and their lower boundary is generally consistent with the lower boundary of the strongly weathered zone. Weakly permeable zones are mainly distributed within weakly weathered rocks, and their lower boundary is generally consistent with the lower boundary of the weakly weathered zone. Fresh to slightly weathered rocks are mostly very weakly permeable. This structure indicates that the leakage-prone zones in Reservoir A are mainly concentrated in the shallow weathered fissure zones of the dam foundation and local weakly permeable zones in the two abutments. Combined with the thick mountains on both sides of Reservoir A and the absence of adjacent low valleys or low saddles, its potential leakage mainly occurs as dam-foundation leakage and abutment bypass leakage.
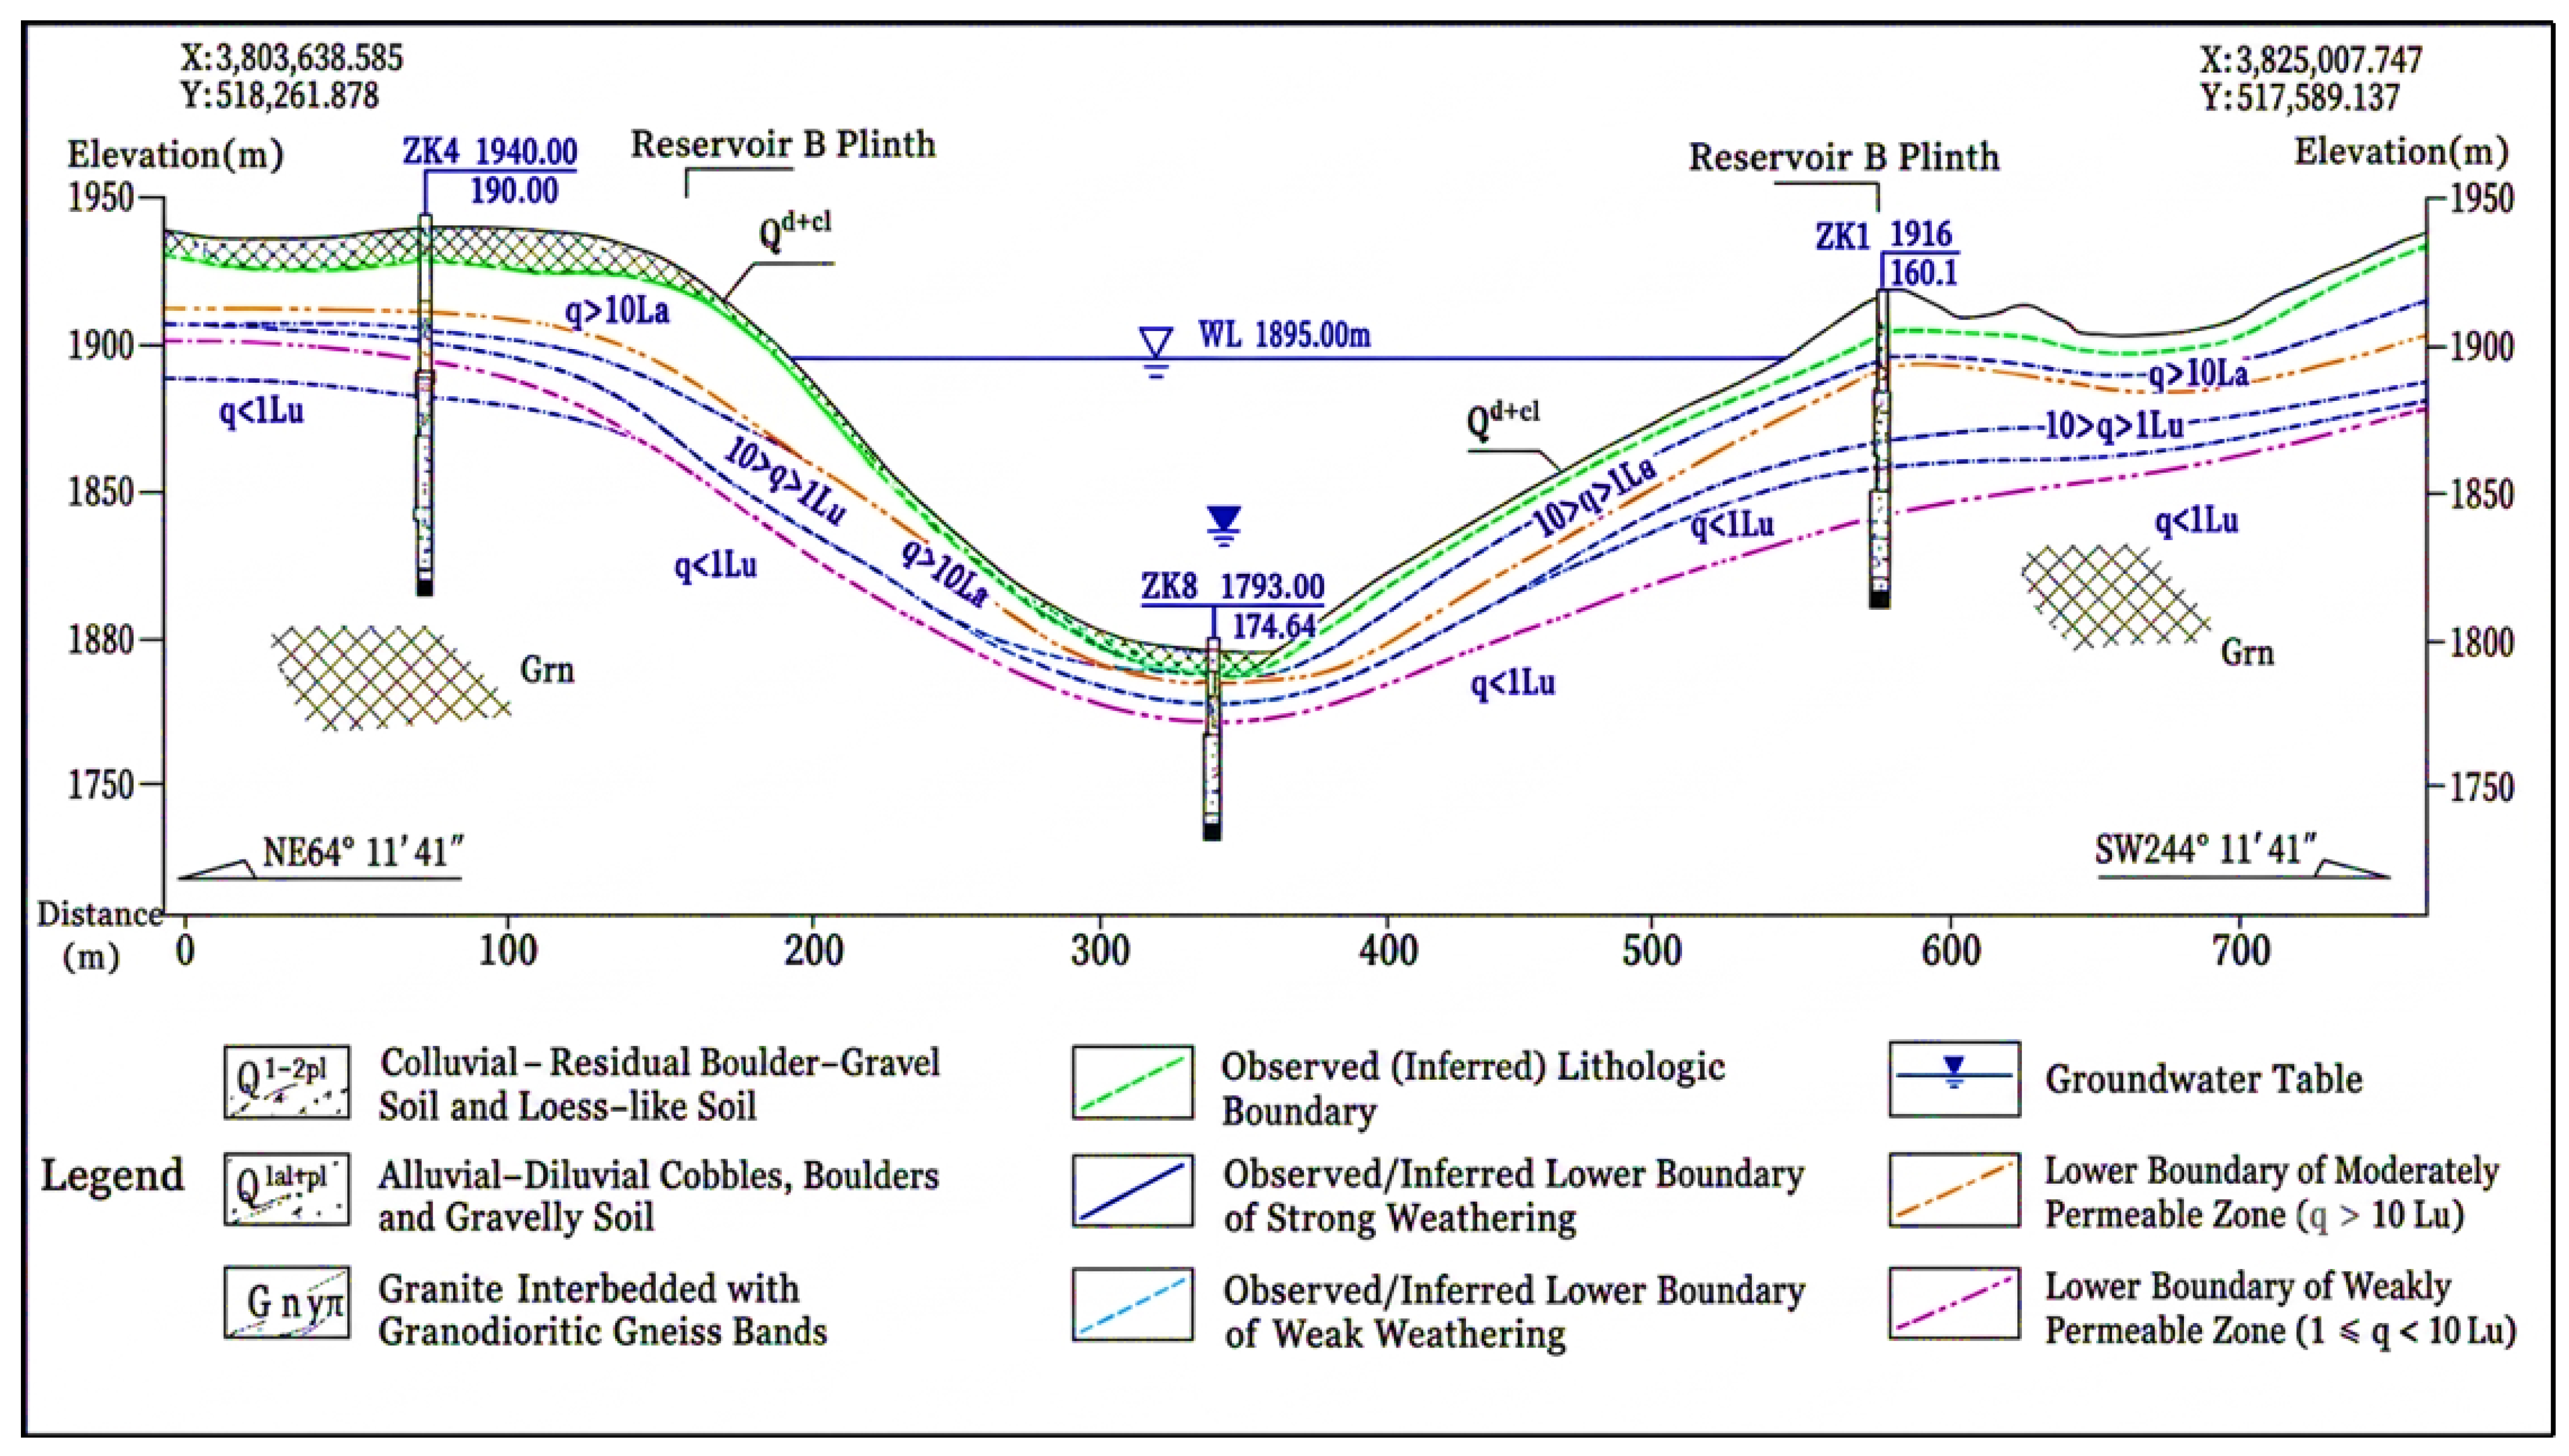
The dam-axis section of Reservoir B shows a more complex permeability structure (Figure 7). Moderately permeable zones are generally controlled by the strongly weathered zone, but their lower boundary can locally extend slightly below the lower boundary of the strongly weathered zone. On the left-bank slope, the weakly permeable zone is generally consistent with the lower boundary of the weakly weathered zone, whereas in the ridge area and locally on the right bank, it can extend approximately 10–20 m below the lower boundary of the weakly weathered zone. This feature indicates that local weakly permeable rocks in Reservoir B extend to greater depths, making the abutments and ridge areas more likely to form continuous or semi-continuous seepage paths. Compared with Reservoir A, the potential leakage zones of Reservoir B are not limited to the dam foundation and abutments; local ridge saddles, thin ridges, and structural fracture zones may also contribute to reservoir-water leakage.
Combining Table 5 with Figure 6 and Figure 7 indicates that leakage-prone zones in the upper reservoir are mainly controlled by rock-mass permeability classification, weathering-zone thickness, the extension of weakly permeable zones in the abutments, and local structural fracture zones. Reservoir A has a relatively simple permeability structure, and its leakage susceptibility is mainly concentrated in the dam foundation and shallow weathered fissure zones of the abutments. Reservoir B has a more complex permeability structure, with local weakly permeable zones extending to greater depths and interacting with ridge saddles, adjacent low valleys, and structural fracture zones to form potential leakage-prone zones. These results indicate that the overall low permeability of the reservoir basin can limit extensive leakage, whereas local moderately permeable intervals and specific topographic boundaries may still control the spatial distribution of the main leakage pathways.

4.2. Analytical Leakage Estimates by Pathway

The analytical results show that, without considering seepage-control treatment, the total leakage discharge of the corresponding pathway-specific leakage components in the upper reservoir is 3069.80 m3/d. In terms of pathway composition, dam-foundation leakage and abutment bypass leakage constitute the main leakage sources. The analytical leakage discharges from the dam-foundation and abutment zones of Reservoir A and Reservoir B are 761.96 m3/d and 858.95 m3/d, respectively. Ridge saddles and structural fracture zones around Reservoir B also contribute substantially to leakage. The analytical leakage discharges from the southern left-abutment ridge saddle, the western ridge saddle, and the surrounding structural fracture zones of Reservoir B are 226.73 m3/d, 495.49 m3/d, and 726.67 m3/d, respectively. The analytical results for each leakage pathway are summarized in Table 6.
For Reservoir A, the analytical leakage discharge from the dam foundation is 169.04 m3/d, while the leakage discharges from the left and right abutments are 285.49 m3/d and 307.43 m3/d, respectively. The total leakage discharge from the dam-foundation and abutment zones is 761.96 m3/d. The combined abutment bypass leakage is 592.92 m3/d, approximately 3.5 times the dam-foundation leakage, indicating that analytical leakage in Reservoir A is mainly concentrated in the abutment bypass pathways. This result is consistent with the relatively thick mountains on both sides of Reservoir A and the absence of external saddles lower than the normal reservoir water level. The leakage pathways are mainly controlled by the permeability structure of the dam foundation and abutment rock masses.
The analytical leakage discharge from the dam-foundation and abutment zones of Reservoir B is 858.95 m3/d, which is higher than that of Reservoir A. The dam-foundation leakage is 285.46 m3/d, while the leakage discharges from the left and right abutments are 355.96 m3/d and 217.53 m3/d, respectively. Compared with Reservoir A, Reservoir B has a higher dam-foundation leakage discharge, and the left-abutment bypass leakage accounts for a relatively large proportion of the dam-zone leakage. This indicates that dam-zone leakage in Reservoir B is jointly controlled by the permeability structure of the dam foundation and left-abutment bypass seepage, and both the dam foundation and abutments are major leakage units in the analytical calculation.
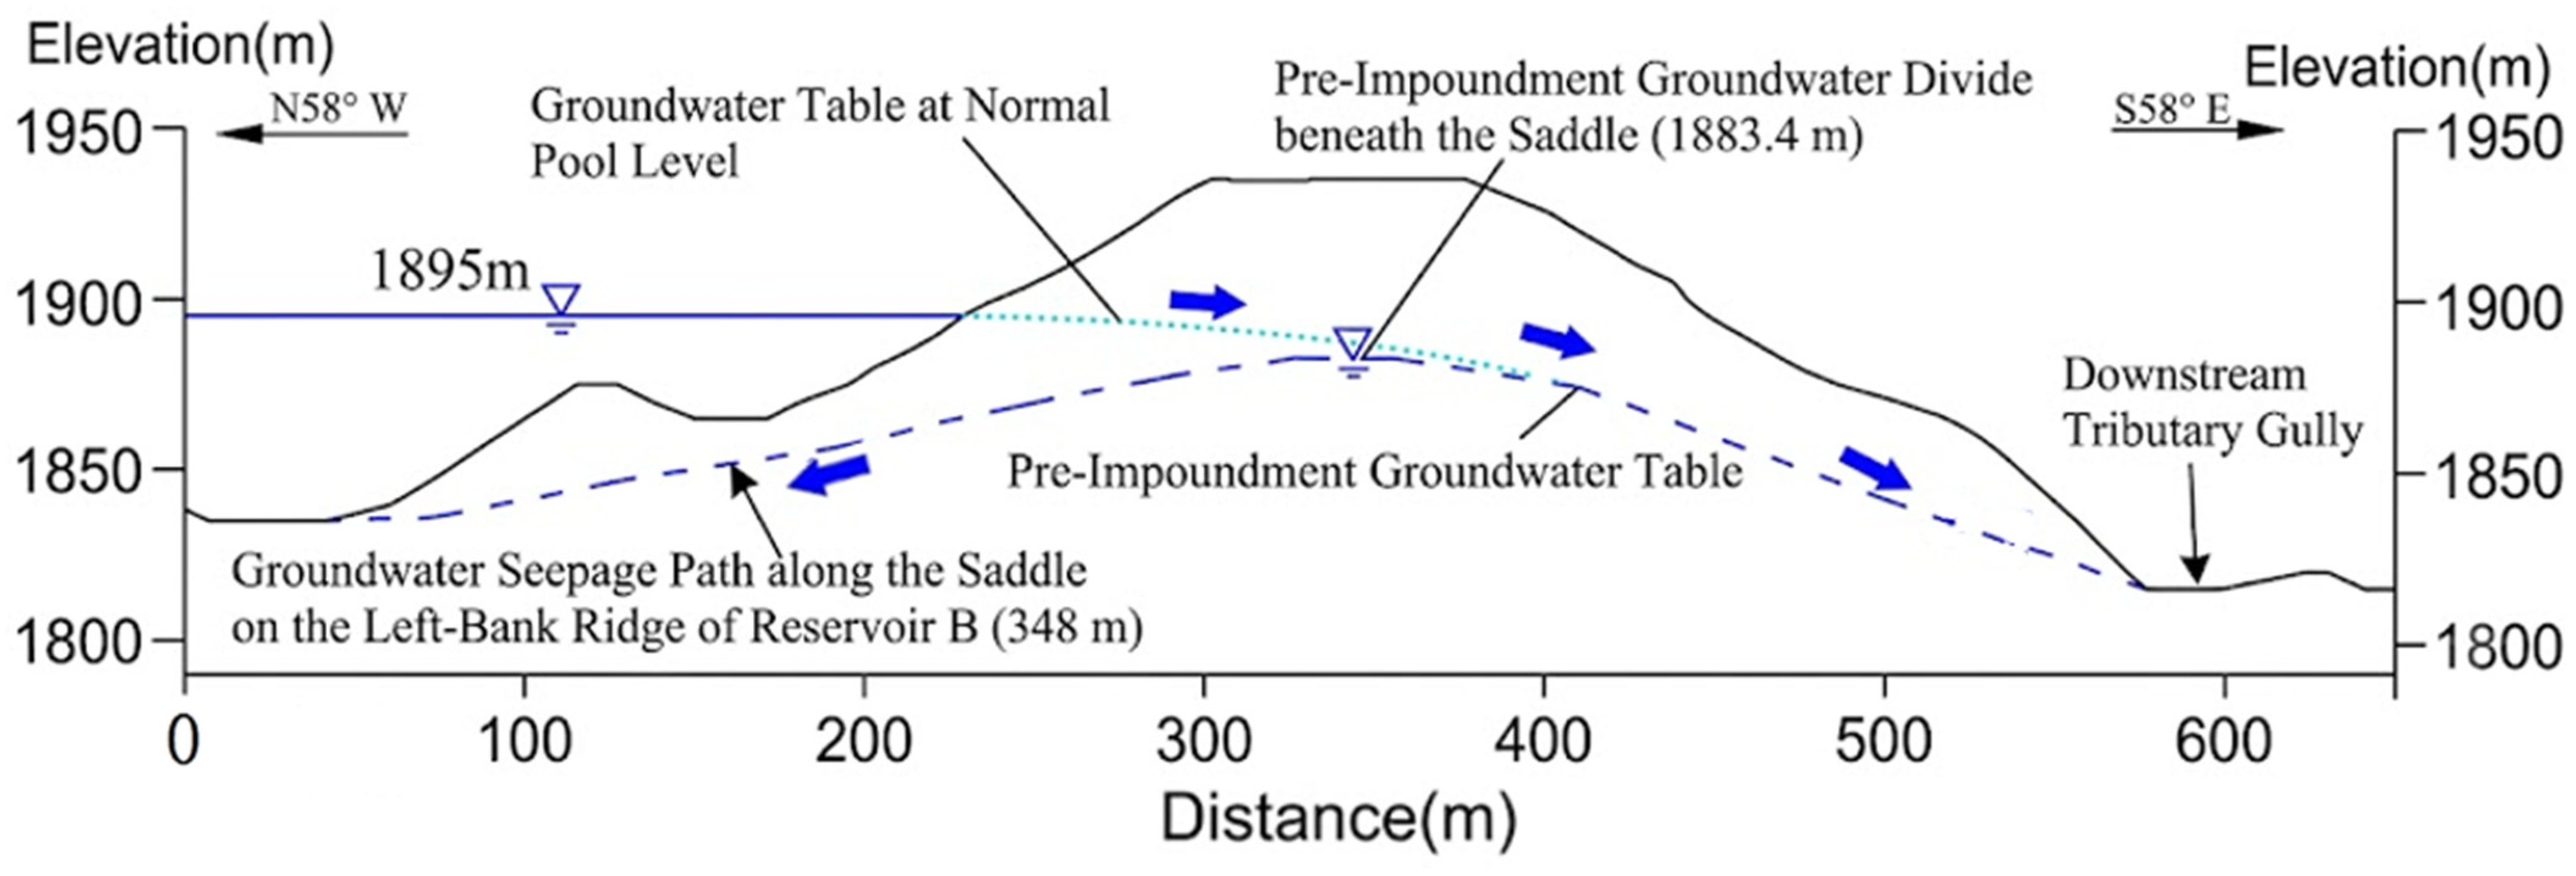
Ridge-saddle leakage is mainly concentrated around Reservoir B. The analytical leakage discharge from the southern left-abutment ridge saddle is 226.73 m3/d. This section is located between the reservoir basin and a downstream branch gully, with a normal reservoir water level of 1895 m, an external outlet elevation of 1810 m, a seepage length of 348 m, and a flow section area of 19,000 m2 (Figure 8). These parameters indicate that this saddle has a short seepage length and a distinct hydraulic-head difference, making it a representative adjacent-valley leakage zone on the southern side of Reservoir B.
The analytical leakage discharge from the western ridge saddle of Reservoir B is 495.49 m3/d, which is higher than that from the southern left-abutment ridge saddle. This pathway corresponds to several low-saddle sections on the western side, with an average external outlet elevation of approximately 1655 m, an average seepage length of approximately 800 m, and a flow section area of approximately 43,000 m2. Although this pathway has a longer seepage length, the external adjacent low valley is substantially lower than the normal reservoir water level, and the equivalent flow section is larger, resulting in a higher analytical leakage discharge.
The analytical leakage discharge from the structural fracture zones around Reservoir B is 726.67 m3/d, which is of the same order as the ridge-saddle leakage of Reservoir B. This value is close to the dam-zone leakage discharge of Reservoir A, indicating that local structural fracture zones cannot be ignored in the leakage distribution of the upper reservoir. According to the analytical results, ridge-saddle leakage and structural-fracture-zone leakage outside the dam zone of Reservoir B together exceed 1400 m3/d, making them an important component of local outward leakage in this reservoir basin.
Overall, the analytical calculations reveal clear spatial differences in potential leakage from the upper reservoir. Leakage in Reservoir A is mainly concentrated in the dam foundation and abutments. In Reservoir B, in addition to dam-foundation and abutment leakage, the southern left-abutment ridge saddle, western ridge saddle, and surrounding structural fracture zones all produce quantifiable leakage. These results indicate that Reservoir B has the most complex leakage pathway system and the most concentrated pathway-specific contributions in the analytical calculation. Its local leakage is controlled not only by dam-zone rock masses but also by adjacent low valleys, ridge saddles, and structural fracture zones. The analytical calculations were further repeated at the dead water level of 1880 m. As shown in Table 7, the estimated total leakage discharge decreases from 3069.80 m3/d at the normal water level to 2617.02 m3/d at the dead water level, corresponding to a reduction of 14.75%. Leakage from the dam foundations, abutments, and southern ridge saddle is relatively more sensitive to the water-level decrease, whereas leakage through the western ridge saddle and fault-fracture zones decreases by less than 10%. Because the dead water level remains higher than the corresponding external outlet elevations, the identified leakage pathways remain active. These two steady scenarios do not represent groundwater-storage effects or response lag during short-period operating cycles.

4.3. Numerical Simulation of Leakage After Impoundment and Comparison with Analytical Estimates

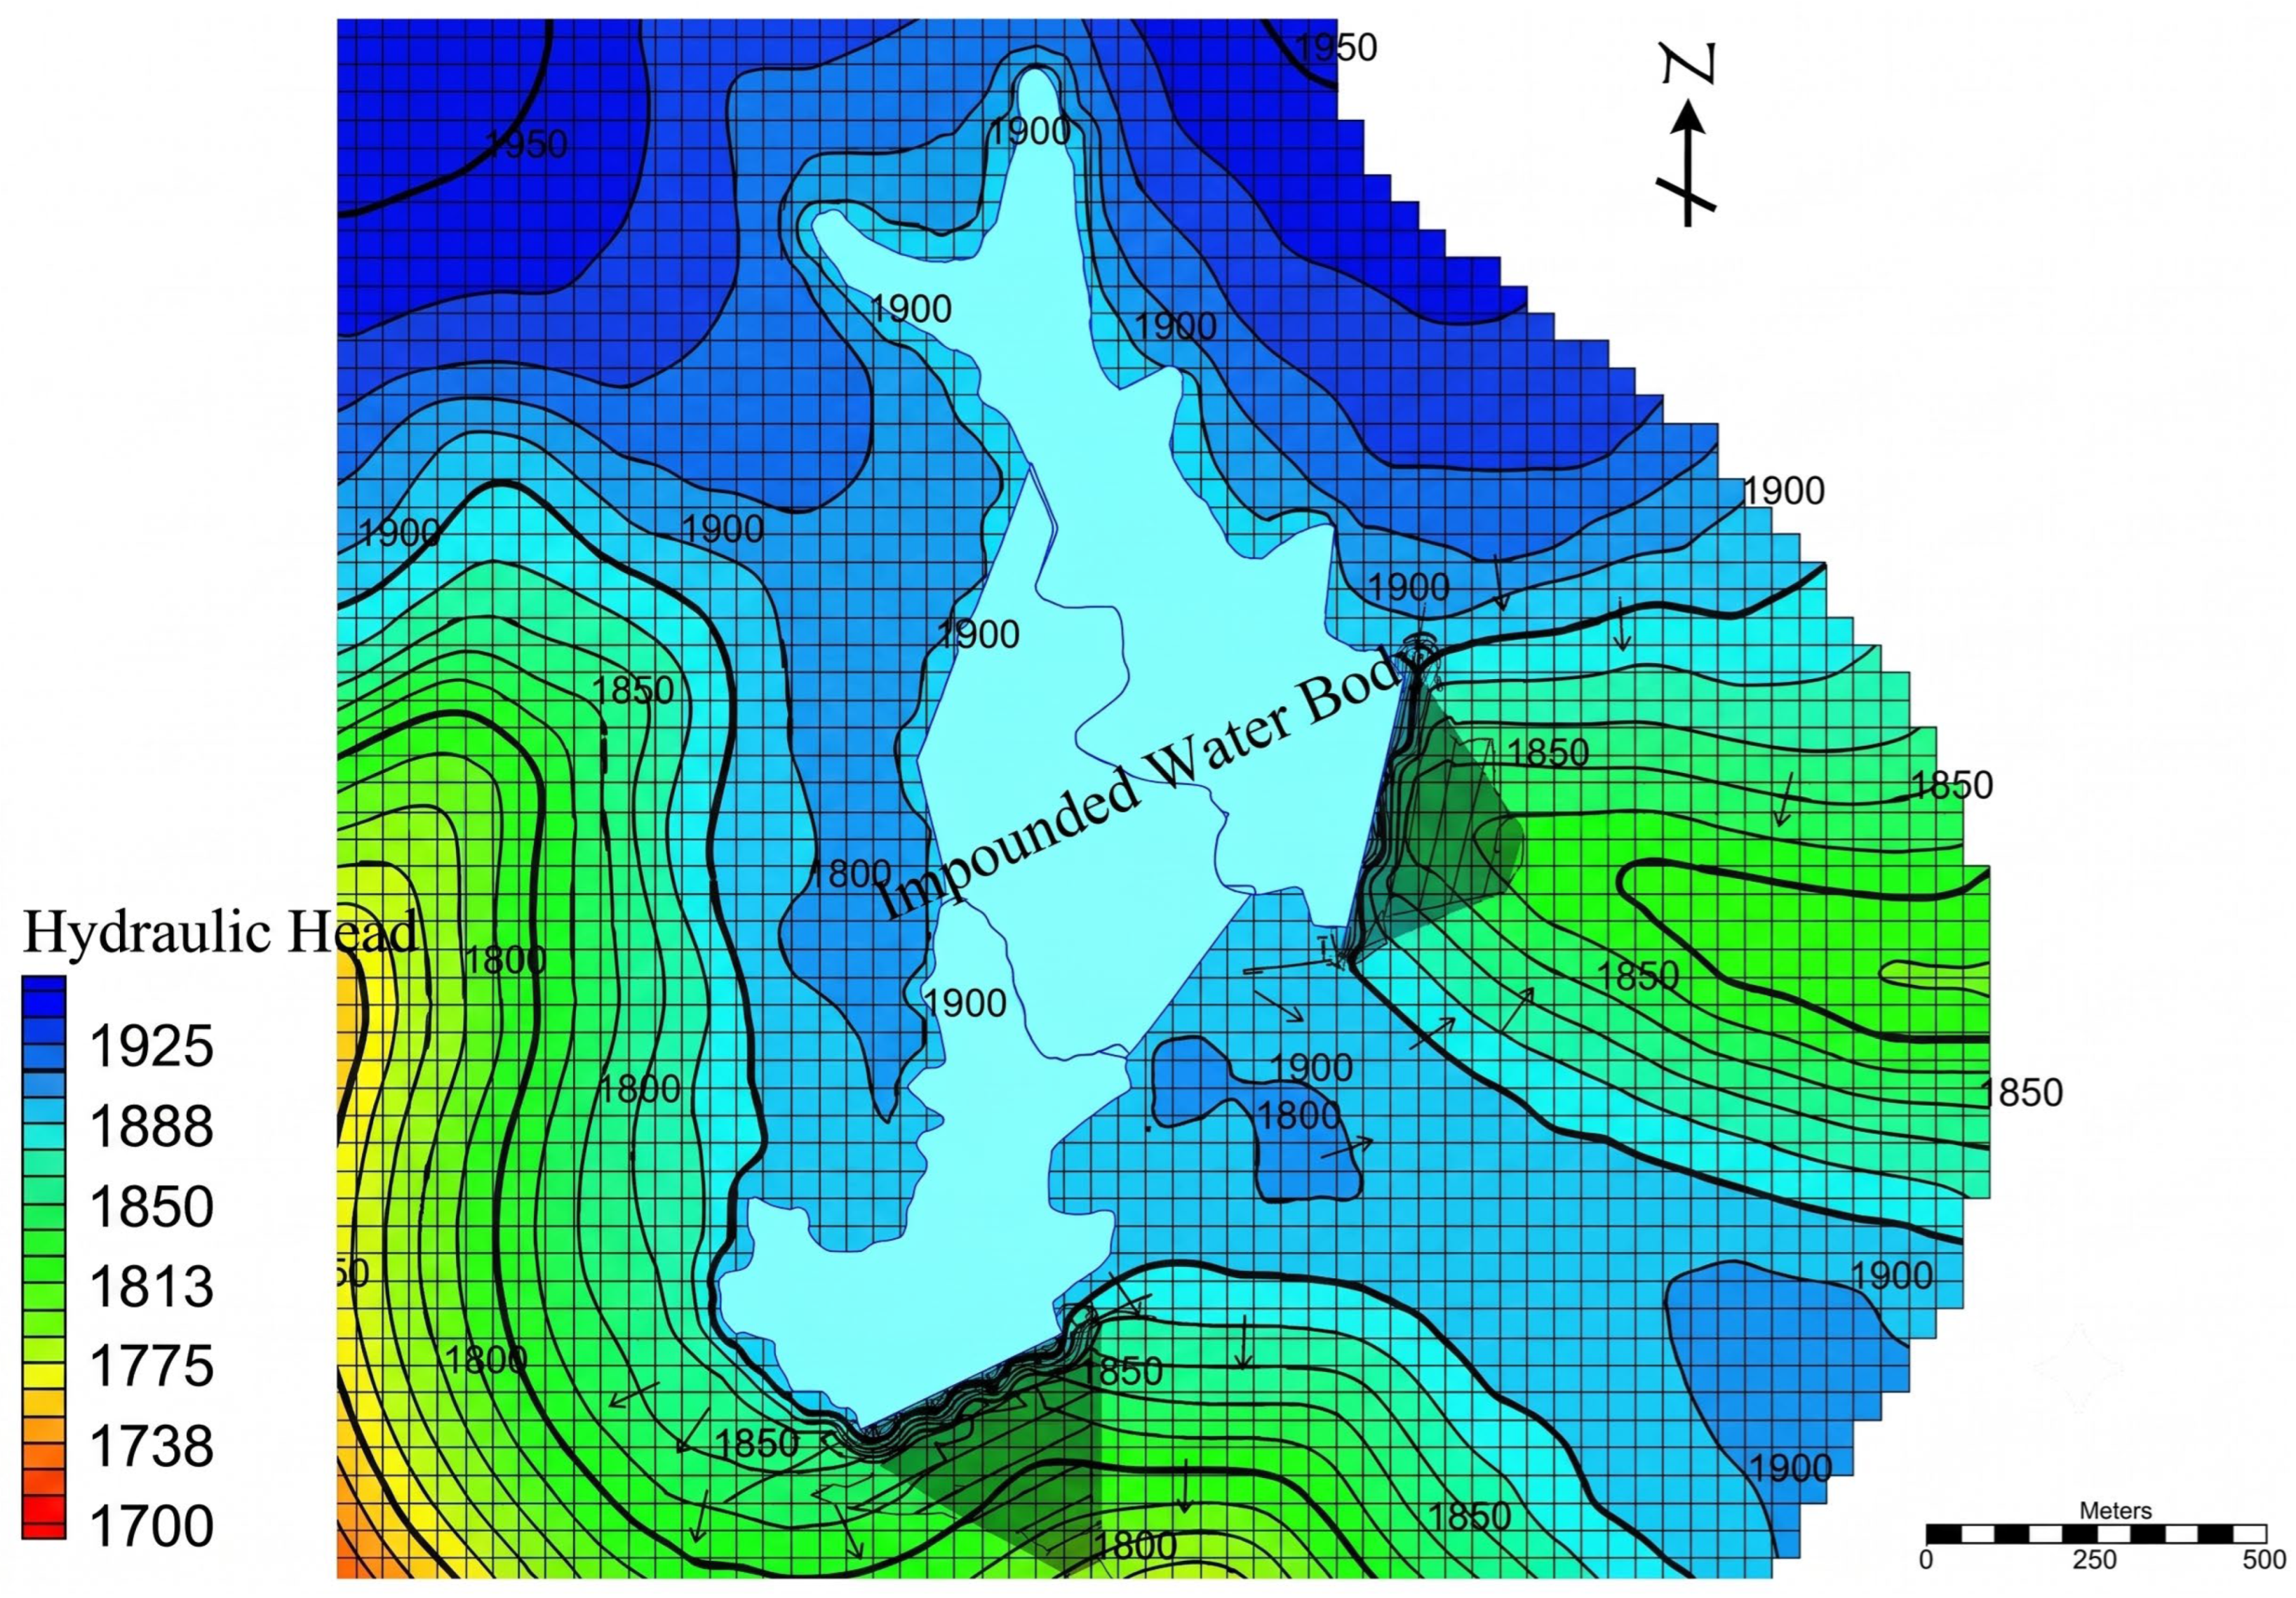
The three-dimensional numerical simulation results show that, after the normal reservoir water level reached 1895 m and the groundwater-level field became stable, the groundwater flow field around the reservoir basin was markedly adjusted. Reservoir-water recharge increased the hydraulic head near the dam foundations, abutments, and local ridge saddles. Groundwater generally discharged from the reservoir basin toward the downstream dam area, adjacent low valleys, and local structural fracture zones. The simulated seepage was not uniformly distributed along the entire reservoir boundary, but was concentrated near the dam foundations and abutments, the southern left-abutment ridge saddle of Reservoir B, the western ridge saddle of Reservoir B, and structural fracture zones around Reservoir B.
The simulation results near the dam foundations and abutments indicate that dam-foundation leakage and abutment bypass leakage occur in both Reservoir A and Reservoir B (Figure 9). The numerical leakage discharge from the dam foundation and abutments of Reservoir A was 727.45 m3/d, including 158.42 m3/d from the dam foundation, 275.17 m3/d from the left abutment, and 293.86 m3/d from the right abutment. The numerical leakage discharge from the dam foundation and abutments of Reservoir B was 674.27 m3/d, including 199.83 m3/d from the dam foundation, 255.48 m3/d from the left abutment, and 191.96 m3/d from the right abutment. The combined leakage discharge from the dam zones of the two reservoirs was 1401.72 m3/d, accounting for the major part of the total numerical leakage discharge, indicating that the dam foundations and abutments remain the main seepage discharge zones after reservoir impoundment.
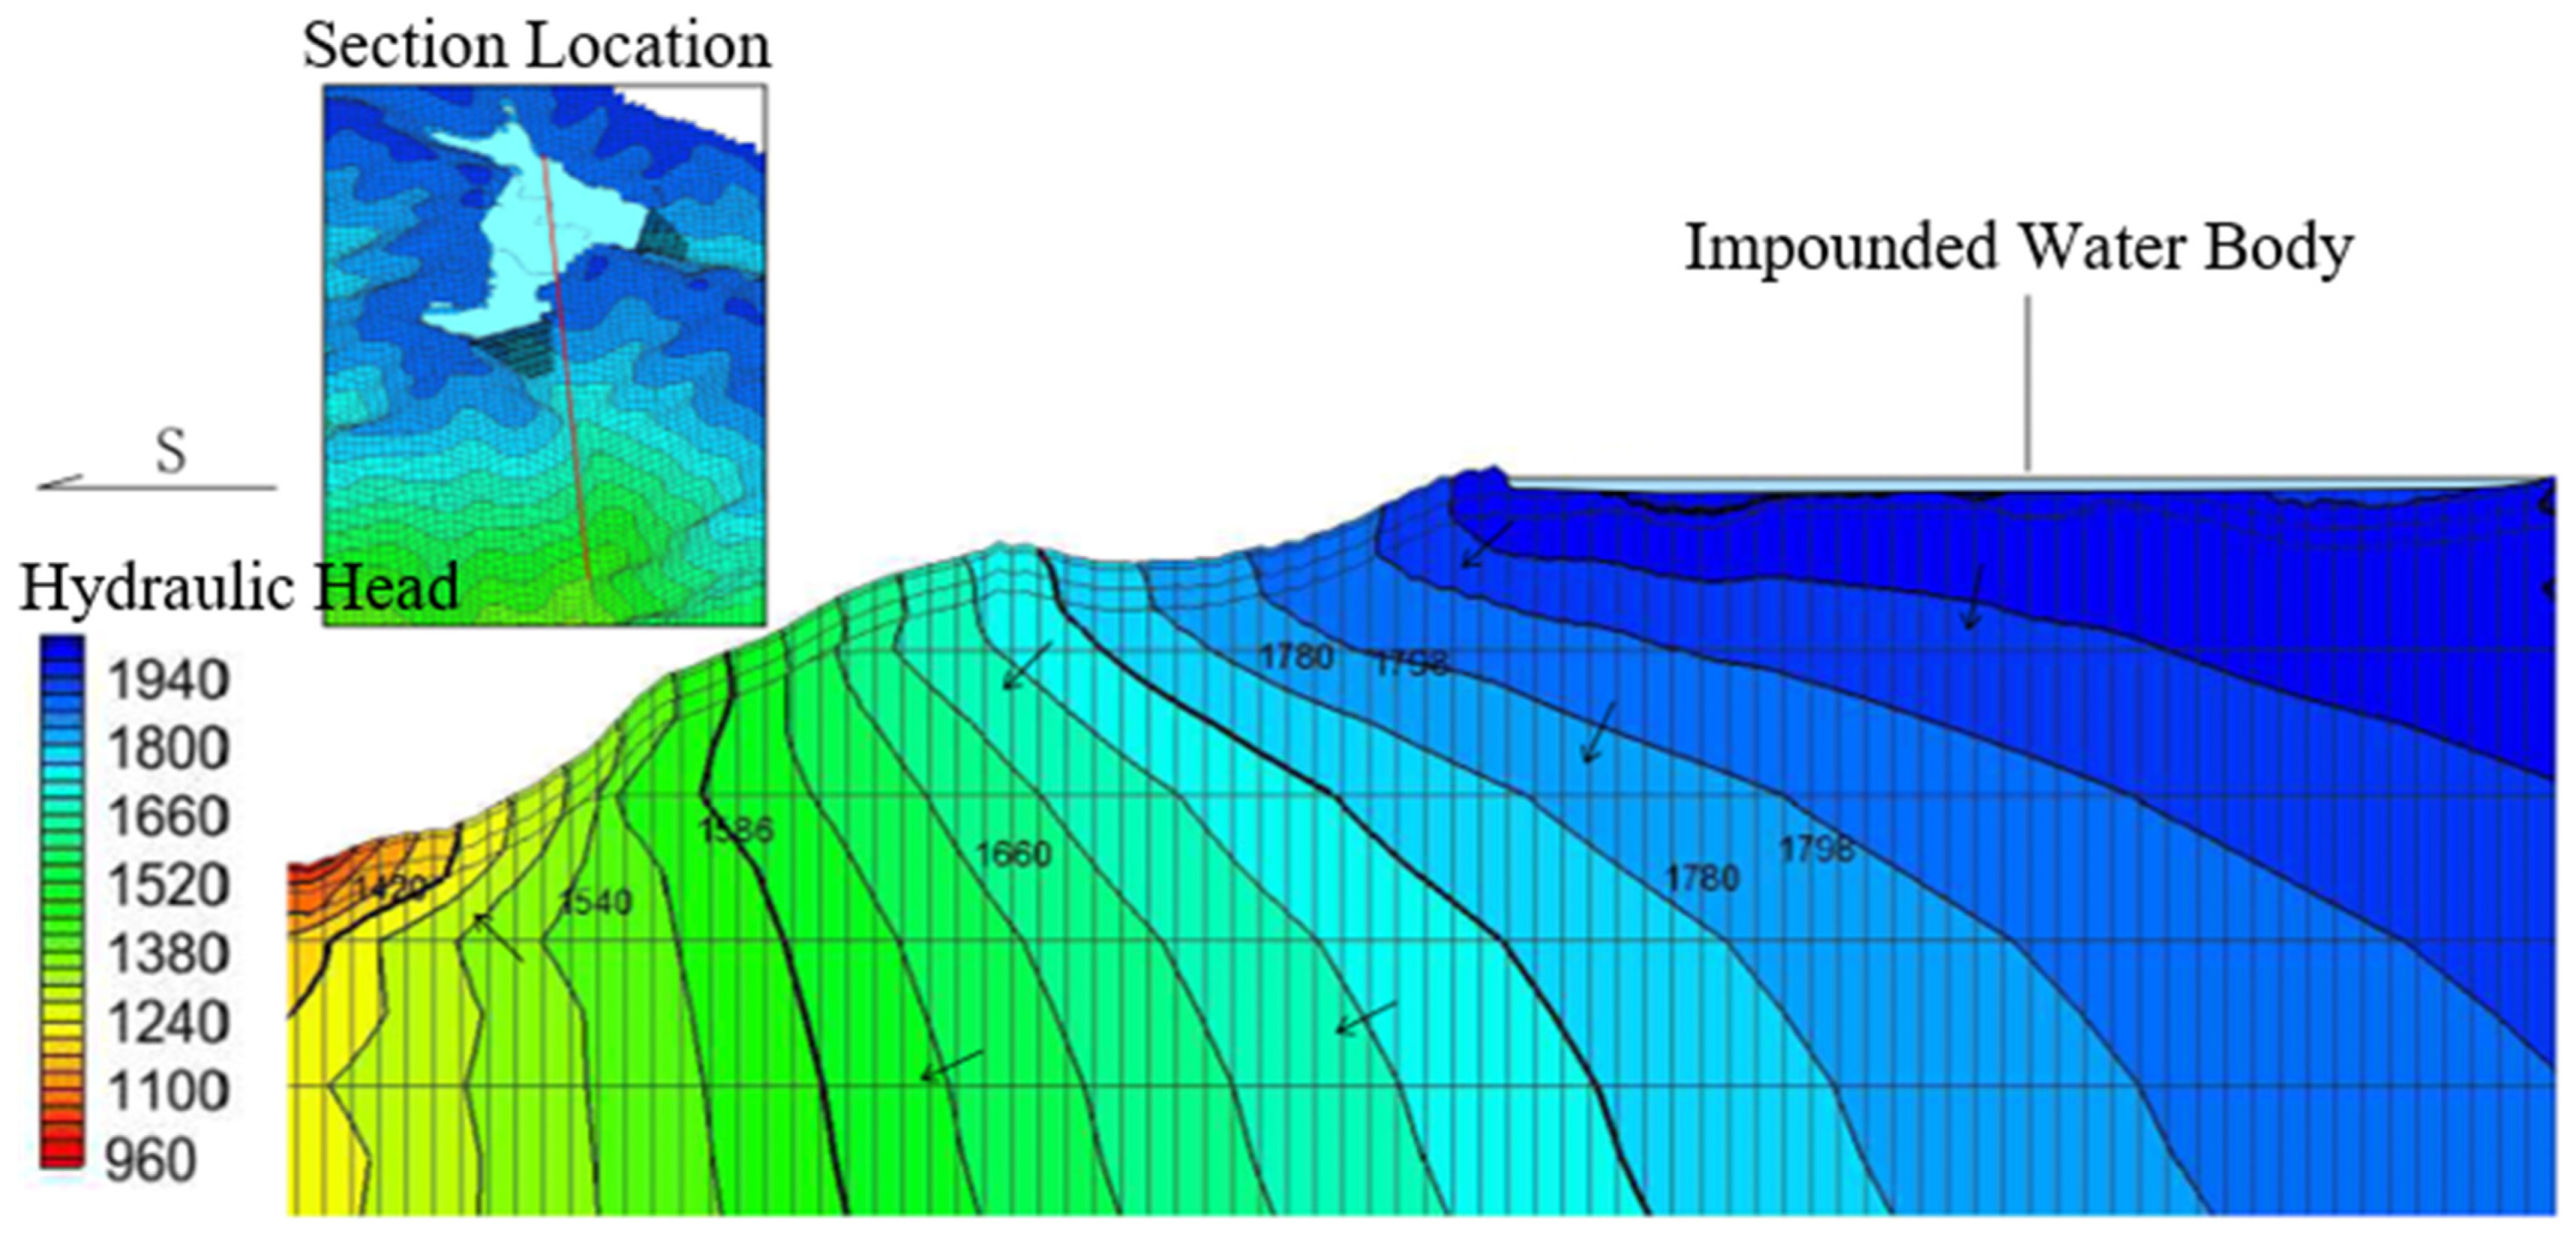
The numerical simulation of the southern left-abutment ridge saddle of Reservoir B shows that, after impoundment, the hydraulic head on the reservoir side increased, and groundwater discharged along the ridge saddle toward the downstream branch gully (Figure 10). The numerical leakage discharge from this zone was 172.09 m3/d, lower than the analytical estimate of 226.73 m3/d. The lower value obtained from the numerical simulation is related to three-dimensional groundwater flow partitioning, boundary constraints, and local head loss. This result indicates that although the southern left-abutment ridge saddle is not the largest leakage pathway, it can form a stable adjacent-valley seepage path under the normal reservoir water level.
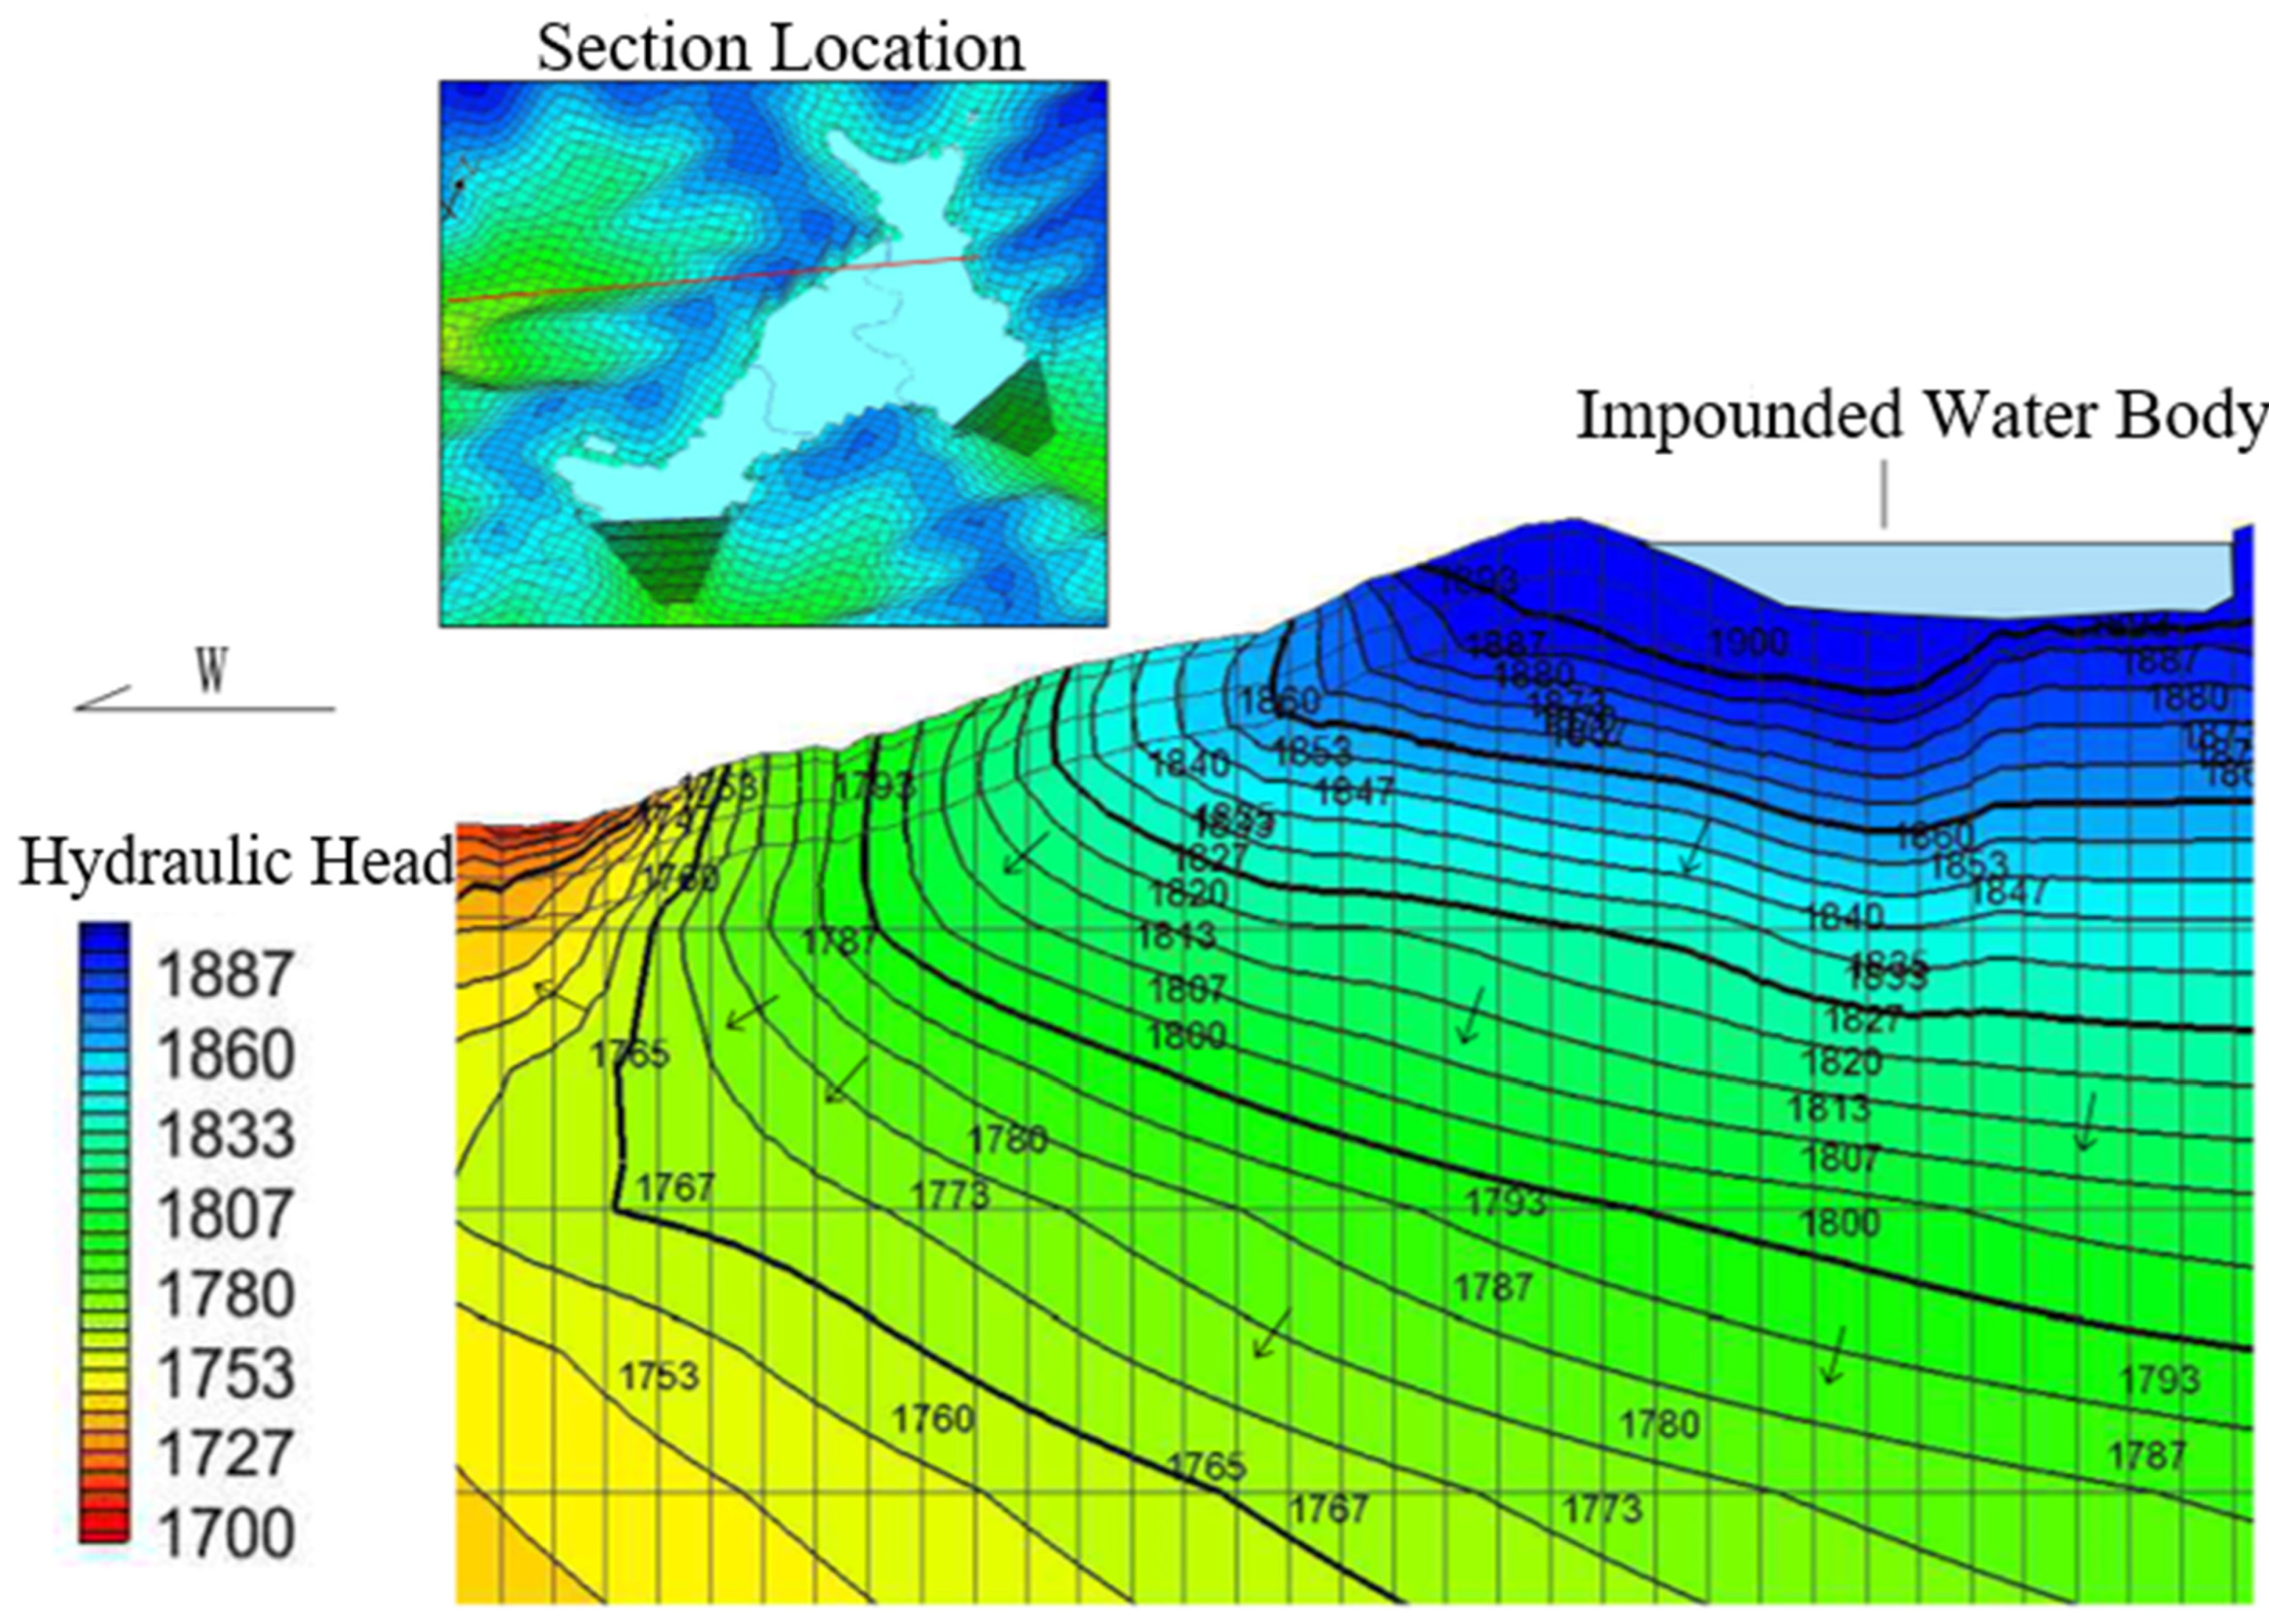
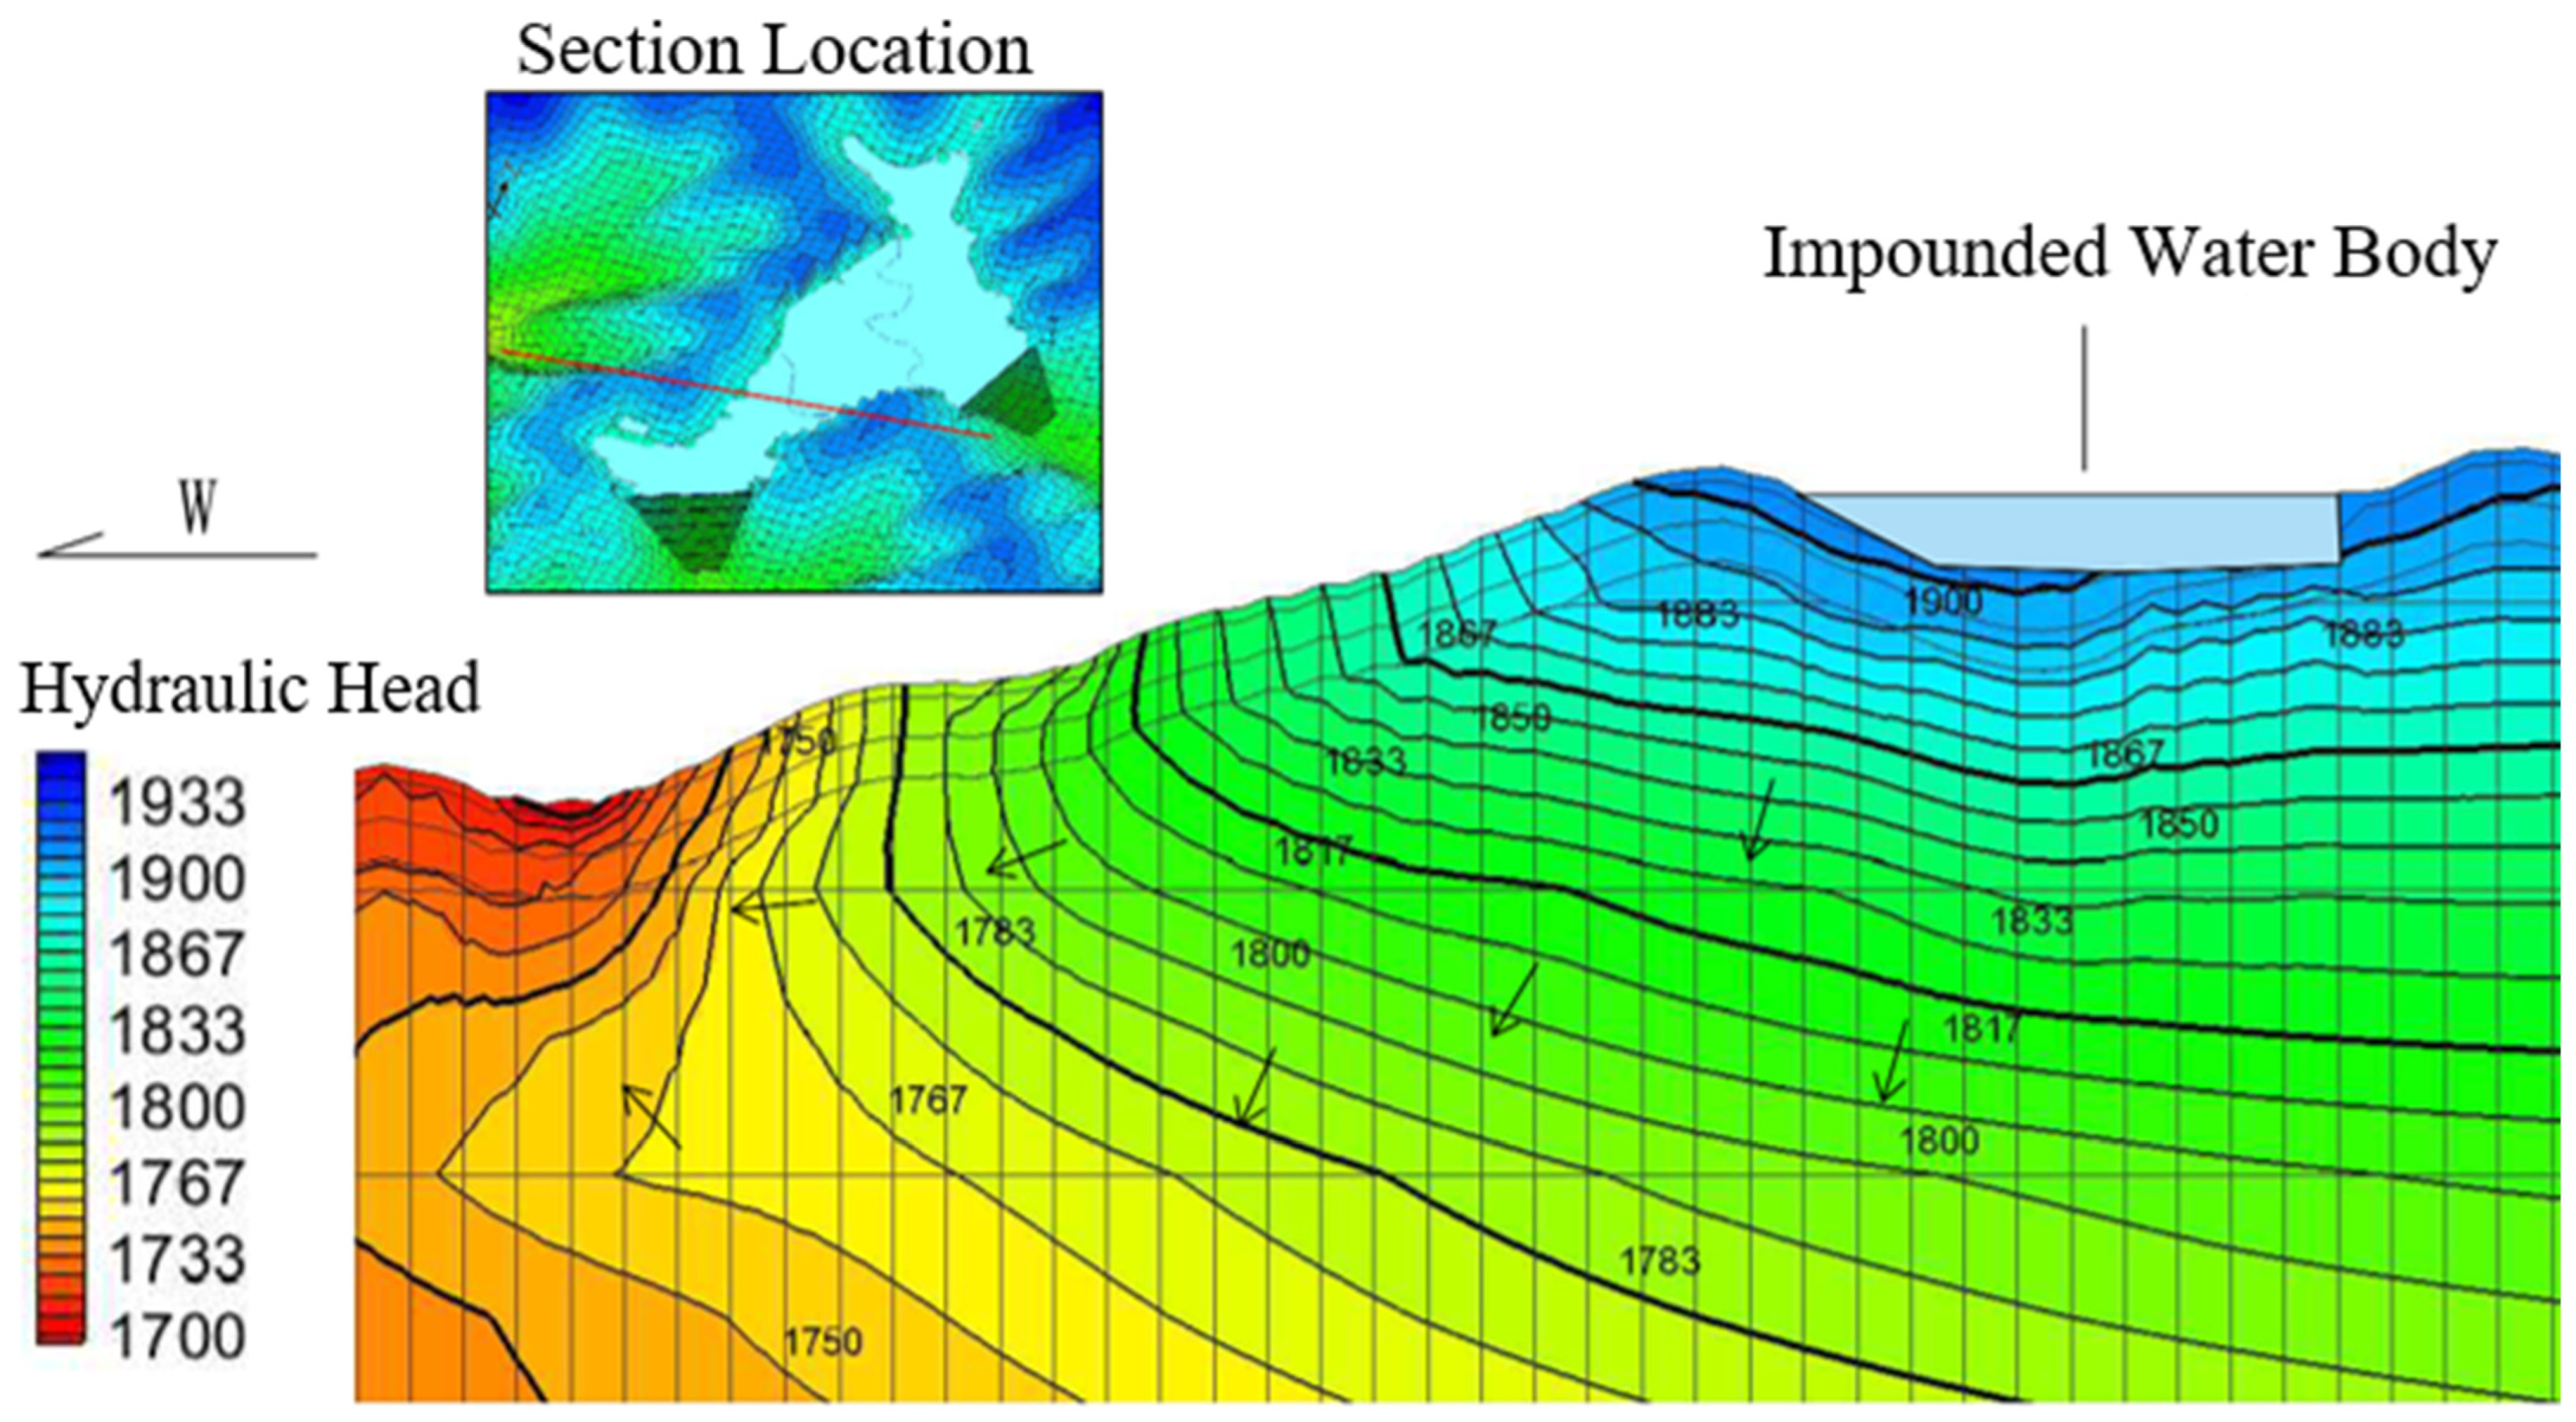
The numerical simulation of the western ridge saddle of Reservoir B shows that groundwater discharged from the reservoir side toward the western adjacent low valley, and that the low-valley boundary exerted a clear control on the seepage direction (Figure 11). The numerical leakage discharge from this zone was 540.28 m3/d, slightly higher than the analytical estimate of 495.49 m3/d. Compared with the southern left-abutment ridge saddle, the western ridge saddle is associated with a lower external valley elevation and a larger seepage section, resulting in a higher adjacent-valley leakage discharge in the numerical simulation. This pathway is also one of the most important non-dam leakage zones around Reservoir B in the numerical results.
The numerical leakage discharge from the structural fracture zones around Reservoir B was 547.72 m3/d, lower than the analytical estimate of 726.67 m3/d. The leakage discharge from the structural fracture zones was of the same order as that from the western ridge saddle, indicating that local structural fracture zones play an important role in seepage partitioning around the reservoir. Because the numerical model simultaneously considers three-dimensional boundary conditions, adjacent hydrogeological units, and groundwater-level redistribution, the simulated outflow from the structural fracture zones was lower than the analytical estimate. Nevertheless, these zones remain important local leakage pathways around Reservoir B.
The total leakage discharge simulated for the reservoir area was 2661.81 m3/d. In terms of pathway composition, leakage from the dam foundation and abutments of Reservoir A, the dam foundation and abutments of Reservoir B, the southern left-abutment ridge saddle of Reservoir B, the western ridge saddle of Reservoir B, and the structural fracture zones around Reservoir B accounted for 27.33%, 25.33%, 6.46%, 20.30%, and 20.58% of the total numerical leakage discharge, respectively (Figure 12). Dam-zone leakage accounted for more than half of the total leakage discharge, whereas ridge-saddle leakage and structural-fracture-zone leakage around Reservoir B together accounted for approximately 47.34%, indicating that non-dam local leakage around Reservoir B contributes substantially to the total leakage discharge.
To ensure comparability between the analytical calculations and numerical simulations, Table 6 groups the results from both methods according to the same leakage pathways. The summed analytical leakage discharge was 3069.80 m3/d, whereas the total numerical leakage discharge was 2661.81 m3/d, corresponding to a relative difference of 13.29%. The pathway-specific differences reflect differences in geometric representation, hydraulic-boundary treatment, and flow redistribution. For the dam foundation and abutments of Reservoir A, the difference was only 4.53%, indicating relatively consistent representation of this comparatively simple leakage zone. For the dam zone of Reservoir B and the southern left-abutment ridge saddle, the numerical results were 21.50% and 24.10% lower than the analytical estimates, respectively. The analytical models assume uniform equivalent flow sections and direct hydraulic gradients, whereas the three-dimensional model accounts for local head loss, heterogeneous media, and flow partitioning toward surrounding drainage boundaries. The numerical estimate for the fault-fracture zones was 24.63% lower because the analytical belt-like model assumes continuous hydraulic connectivity, while the numerical model also represents the confining effect of the surrounding lower-permeability rock mass. In contrast, the numerical leakage through the western ridge saddle was 9.04% higher than the analytical estimate, suggesting that three-dimensional convergence toward the adjacent low-valley drainage boundary was not fully represented by the single equivalent seepage path.
The analytical and numerical results define a method-based prediction range of 2661.81–3069.80 m3/d under the normal reservoir water level. The absolute pathway-specific differences range from 4.53% to 24.63%. This range characterizes uncertainty associated with model formulation and pathway generalization, rather than a statistical confidence interval. Despite the quantitative differences, both methods consistently identify the dam foundations and abutments, the western ridge saddle of Reservoir B, and the surrounding fault-fracture zones as the principal leakage-prone zones. Thus, the combined results are more reliable for identifying pathway locations and relative importance than for providing a single precise leakage discharge.


5. Discussion

The results indicate that leakage assessment for mountainous pumped-storage upper reservoirs should not focus solely on the overall permeability of the reservoir-basin rock mass. The spatial association among local permeable intervals, adjacent low-valley drainage boundaries, and high reservoir water levels is also important. Packer-test results show that the reservoir-basin rock mass is generally very weakly to weakly permeable, whereas local moderately permeable intervals may still form leakage pathways together with abutment unloading fractures, ridge saddles, and structural fracture zones. Groundwater flow in fractured rock masses commonly exhibits strong heterogeneity and scale effects, and fracture connectivity exerts an important control on local seepage pathways [14,15]. Therefore, for non-karst crystalline-rock mountainous reservoir basins, the overall rock-mass permeability can be used to characterize the regional leakage background, while the coupling between local permeable structures and external drainage boundaries provides a key basis for identifying specific leakage pathways.
This finding has direct implications for determining seepage-control boundaries in mountainous upper reservoirs. Conventional leakage assessment commonly emphasizes dam-foundation and abutment conditions, while high-elevation valley-type upper reservoirs also require attention to ridge saddles, thin ridges, and adjacent low valleys. The results from Reservoir B show that when a clear hydraulic-head difference exists between a ridge saddle and an adjacent low valley, and when the local rock mass has a certain permeability, non-dam leakage can become an important component of total leakage discharge. Previous studies on pumped-storage upper reservoirs have shown that fractured-rock heterogeneity and seepage-control boundary arrangement significantly influence leakage control [10,11]. The present results further indicate that adjacent-valley drainage conditions and ridge-saddle geometry should be incorporated into seepage-control boundary identification for mountainous upper reservoirs, rather than relying only on the permeability of rock masses near the dam site or on the reservoir-basin outline. The hydraulic conductivity of 0.432 m/d represents the untreated fault-fracture zones. For preliminary seepage-control design, their permeability should be reduced to at least the level of the surrounding weakly weathered rock, corresponding to approximately K 0.062 m/d or q 3 Lu. The curtain should penetrate the fractured zone and terminate in continuous rock with q < 1 Lu, which generally occurs at depths of approximately 75–80 m, although locally greater depths may be required where faulting deepens the permeable zone. The final depth and acceptance criterion should be determined through verification boreholes and grouting tests.
The combined use of analytical calculations and three-dimensional numerical modeling provides a clear assessment framework for similar projects. The analytical method generalizes dam foundations, abutments, ridge saddles, and structural fracture zones into traceable equivalent seepage pathways, making it suitable for early identification of major leakage-prone zones and estimation of leakage-discharge magnitudes. The three-dimensional numerical model further accounts for the effects of complex topography, heterogeneous media, and boundary conditions on groundwater-level redistribution. Reservoir leakage simulation is sensitive to reservoir-water boundaries, groundwater boundaries, and medium parameters [6,7,8]. Comparison of the two methods therefore provides a method-based prediction envelope rather than eliminating uncertainty. In this study, the resulting range of 2661.81–3069.80 m3/d constrains the likely leakage magnitude under the normal reservoir water level, while the consistent identification of the principal leakage pathways supports the application of the combined framework to leakage screening and seepage-control boundary optimization.
This study has several limitations. First, the rock-mass permeability parameters were mainly derived from packer tests, weathering zoning, and engineering geological analogy. Borehole-scale results cannot fully characterize the spatial connectivity and anisotropy of fracture networks, and the interpretation of packer tests can also be affected by test-section length, fracture development, and test pressure [20,21]. Second, structural fracture zones were generalized as equivalent belt-like seepage pathways in the analytical calculation. This treatment can satisfy leakage-magnitude estimation, but it simplifies the hydraulic differences among fault cores, damage zones, and filling materials [16,17]. Accordingly, the reported range of 2661.81–3069.80 m3/d represents method-related uncertainty only; additional uncertainty associated with hydraulic-conductivity variability, fracture-network connectivity, anisotropy, and boundary conditions was not quantified probabilistically. In addition, the current numerical simulation mainly focused on a steady or quasi-steady seepage state under the normal reservoir water level. Seasonal recharge, snowmelt, individual extreme-rainfall events, and short-period operational water-level fluctuations were not explicitly represented. Their effects on near-bank groundwater response and transient leakage processes require further analysis. Future work should use post-impoundment monitoring data, including groundwater levels, spring discharge, abutment drainage, and seepage pressure, to calibrate model parameters and verify leakage-discharge predictions. The uneven monitoring network, the absence of a borehole directly within the western ridge saddle, and the untested lower-boundary depth remain sources of model uncertainty. In addition, because the reservoir had not been impounded, the predicted groundwater response and spring discharge could not be independently validated. Post-impoundment monitoring should therefore focus on the western ridge saddle, adjacent low valleys, and the existing spring outlets.

6. Conclusions

This study addresses leakage identification and prediction for a mountainous pumped-storage upper reservoir affected by high reservoir water level, adjacent low valleys, fractured rock masses, and local structural fracture zones. Taking an upper reservoir in northwestern China as the study object, groundwater observations, packer tests, analytical calculations, and three-dimensional groundwater flow modeling were integrated to analyze the permeability structure of the reservoir basin, potential leakage pathways, and leakage discharge after impoundment. The main conclusions are as follows:
(1)
The rock mass in the upper reservoir area is dominated by very weakly to weakly permeable rocks and does not provide conditions for extensive uniform leakage. Packer-test results show that very weakly permeable, weakly permeable, and moderately permeable test sections account for 70.5%, 19.5%, and 6.8%, respectively. Local moderately permeable intervals are mainly associated with strongly weathered zones, abutment unloading fractures, and structural fracture zones, and provide important hydrogeological conditions for localized leakage pathway formation.
(2)
The leakage-control conditions differ markedly between Reservoir A and Reservoir B. Reservoir A is bounded by relatively thick mountains, and adjacent low valleys or low saddles are not developed; therefore, its potential leakage is mainly concentrated in the dam foundation and abutments. In contrast, Reservoir B has a more complex permeability structure and topographic boundary conditions. In addition to dam foundations and abutments, the southern left-abutment ridge saddle, western ridge saddle, and surrounding structural fracture zones also provide conditions for localized leakage pathway formation.
(3)
Analytical calculations indicate that the total leakage discharge of the pathway-specific components is 3069.80 m3/d. The analytical leakage discharges from the dam zones of Reservoir A and Reservoir B are 761.96 m3/d and 858.95 m3/d, respectively. The analytical leakage discharges from the southern left-abutment ridge saddle, western ridge saddle, and surrounding structural fracture zones of Reservoir B are 226.73 m3/d, 495.49 m3/d, and 726.67 m3/d, respectively. These results indicate that non-dam localized leakage around Reservoir B contributes substantially to the total leakage discharge, and that ridge saddles and structural fracture zones should not be neglected.
(4)
Three-dimensional numerical simulation shows that, under the normal reservoir water level of 1895 m, the total leakage discharge from the reservoir area is 2661.81 m3/d. The numerical simulation and analytical calculation are generally consistent in identifying the main leakage-prone zones, both indicating that dam foundations and abutments, the western ridge saddle of Reservoir B, and structural fracture zones around Reservoir B are the main leakage pathways. For similar mountainous pumped-storage upper reservoirs, seepage-control boundary determination should consider dam-site areas, ridge saddles, adjacent low valleys, and local structural fracture zones, rather than relying only on the overall permeability of the reservoir basin or the dam-site area.

Author Contributions

Conceptualization, S.W.; methodology, S.W.; software, Z.K. and K.L.; validation, K.L.; formal analysis, Z.K.; investigation, Z.K.; data curation, Z.K.; writing—original draft preparation, Z.K. and K.L.; writing—review and editing, S.W.; visualization, Z.K. and K.L.; supervision, S.W.; project administration, S.W.; funding acquisition, S.W. All authors have read and agreed to the published version of the manuscript.

Funding

The authors declare that this study received funding from the Key Research Project of PowerChina Northwest Engineering Corporation Limited, grant number RD14047-01-DKY-dkydzgces-gszz. The funder was not involved in the study design, collection, analysis, interpretation of data, the writing of this article or the decision to submit it for publication.

Data Availability Statement

The raw data supporting the discussion and conclusions of this article will be made available by the authors on request.

Acknowledgments

The authors appreciate the constructive suggestions from anonymous reviewers and editors, which helped improve the quality of the manuscript.

Conflicts of Interest

Author Zhentao Kou was employed by PowerChina Northwest Engineering Corporation Limited. The remaining authors declare that the research was conducted in the absence of any commercial or financial relationships that could be construed as a potential conflict of interest.

References

  1. Rehman, S.; Al-Hadhrami, L.M.; Alam, M.M. Pumped hydro energy storage system: A technological review. Renew. Sustain. Energy Rev. 2015, 44, 586–598. [Google Scholar] [CrossRef]
  2. Barbour, E.; Wilson, I.A.G.; Radcliffe, J.; Ding, Y.; Li, Y. A review of pumped hydro energy storage development in significant international electricity markets. Renew. Sustain. Energy Rev. 2016, 61, 421–432. [Google Scholar] [CrossRef]
  3. Blakers, A.; Stocks, M.; Lu, B.; Cheng, C. A review of pumped hydro energy storage. Prog. Energy 2021, 3, 022003. [Google Scholar] [CrossRef]
  4. Lu, B.; Stocks, M.; Blakers, A.; Anderson, K. Geographic information system algorithms to locate prospective sites for pumped hydro energy storage. Appl. Energy 2018, 222, 300–312. [Google Scholar] [CrossRef]
  5. Stocks, M.; Stocks, R.; Lu, B.; Cheng, C.; Blakers, A. Global atlas of closed-loop pumped hydro energy storage. Joule 2021, 5, 270–284. [Google Scholar] [CrossRef]
  6. Fenske, J.P.; Leake, S.A.; Prudic, D.E. Simulating reservoir leakage in ground-water models. Ground Water 1997, 35, 895–897. [Google Scholar] [CrossRef]
  7. Harbaugh, A.W. MODFLOW-2005, The U.S. Geological Survey Modular Ground-Water Model—The Ground-Water Flow Process; U.S. Geological Survey Techniques and Methods 6-A16; U.S. Geological Survey: Reston, VA, USA, 2005. [CrossRef]
  8. Anderson, M.P.; Woessner, W.W.; Hunt, R.J. Applied Groundwater Modeling: Simulation of Flow and Advective Transport, 2nd ed.; Academic Press: San Diego, CA, USA, 2015. [Google Scholar]
  9. Li, P.; Lu, W.X.; Long, Y.Q.; Yang, Z.P.; Li, J. Seepage analysis in a fractured rock mass: The upper reservoir of Pushihe pumped-storage power station in China. Eng. Geol. 2008, 97, 53–62. [Google Scholar] [CrossRef]
  10. Miao, K.; Bai, Z.; Huang, Y.; Huang, Y.; Su, Y. Research on seepage control of Jurong Pumped Storage Hydroelectric Power Station. Water 2022, 14, 141. [Google Scholar] [CrossRef]
  11. Yang, W.J.; Huang, Y.; Dong, X.S.; Zhu, X.F.; Yu, Z.B.; Miao, K.H. A novel approach for quantifying upper reservoir leakage. Water Sci. Eng. 2024, 17, 397–405. [Google Scholar] [CrossRef]
  12. National Research Council. Rock Fractures and Fluid Flow: Contemporary Understanding and Applications; National Academies Press: Washington, DC, USA, 1996. [Google Scholar] [CrossRef] [PubMed]
  13. Viswanathan, H.S.; Ajo-Franklin, J.; Birkholzer, J.T.; Guglielmi, Y.; Hyman, J.D.; Karra, S.; Pyrak-Nolte, L.J.; Rajaram, H.; Srinivasan, G.; Tartakovsky, D.M. From fluid flow to coupled processes in fractured rock: Recent advances and new frontiers. Rev. Geophys. 2022, 60, e2021RG000744. [Google Scholar] [CrossRef]
  14. Neuman, S.P. Trends, prospects and challenges in quantifying flow and transport through fractured rocks. Hydrogeol. J. 2005, 13, 124–147. [Google Scholar] [CrossRef]
  15. Singhal, B.B.S.; Gupta, R.P. Applied Hydrogeology of Fractured Rocks, 2nd ed.; Springer: Dordrecht, The Netherlands, 2010. [Google Scholar] [CrossRef]
  16. Caine, J.S.; Evans, J.P.; Forster, C.B. Fault zone architecture and permeability structure. Geology 1996, 24, 1025–1028. [Google Scholar] [CrossRef]
  17. Bense, V.F.; Gleeson, T.; Loveless, S.E.; Bour, O.; Scibek, J. Fault zone hydrogeology. Earth Sci. Rev. 2013, 127, 171–192. [Google Scholar] [CrossRef]
  18. Scibek, J. Multidisciplinary database of permeability of fault zones and surrounding protolith rocks at world-wide sites. Sci. Data 2020, 7, 95. [Google Scholar] [CrossRef] [PubMed]
  19. Zhou, C.B.; Chen, Y.F.; Hu, R.; Yang, Z.B. Groundwater flow through fractured rocks and seepage control in geotechnical engineering: Theories and practices. J. Rock Mech. Geotech. Eng. 2023, 15, 1209–1230. [Google Scholar] [CrossRef]
  20. Preene, M. Design and interpretation of packer permeability tests for geotechnical purposes. Q. J. Eng. Geol. Hydrogeol. 2019, 52, 182–200. [Google Scholar] [CrossRef]
  21. Quinn, P.M.; Cherry, J.A.; Parker, B.L. Quantification of non-Darcian flow observed during packer testing in fractured sedimentary rock. Water Resour. Res. 2011, 47, W09533. [Google Scholar] [CrossRef]
  22. Chen, Y.F.; Hu, S.H.; Hu, R.; Zhou, C.B. Estimating hydraulic conductivity of fractured rocks from high-pressure packer tests with an Izbash’s law-based empirical model. Water Resour. Res. 2015, 51, 2096–2118. [Google Scholar] [CrossRef]
  23. GB 50287-2016; Code for Hydropower Engineering Geological Investigation. China Planning Press: Beijing, China, 2016.
Figure 1. Engineering layout of the upper reservoir. (Thin blue line: normal water level boundary; thick blue lines: dam axes; red text: key engineering structures and reservoirs; black text: gully names).
Water 18 01803 g001
Figure 2. Topographic setting of the two adjacent-valley leakage zones around Reservoir B: (a) Southern left-abutment ridge saddle and downstream branch gully; (b) Western ridge saddle and the Dachangzuigou valley. (Cyan lines: normal water level contours; thick blue lines: dam axes; thin blue lines: section lines; blue dashed lines: ridge lines; blue block arrows: seepage directions; red text/arrows: key elevation ranges).
Water 18 01803 g002
Figure 3. Distribution of groundwater observation boreholes. (Thick blue lines: dam axes; thin blue line: normal pool level boundary; red text: key engineering components and reservoirs).
Water 18 01803 g003
Figure 4. Groundwater-level variations in observation boreholes.
Water 18 01803 g004
Figure 5. Numerical model domain and boundary conditions.
Water 18 01803 g005
Figure 6. Hydrogeological section along the dam axis of Reservoir A.
Water 18 01803 g006
Figure 7. Hydrogeological section along the dam axis of Reservoir B.
Water 18 01803 g007
Figure 8. Leakage section through the left-abutment ridge saddle of Reservoir B. (Blue solid line: normal reservoir pool level; cyan dotted line: post-impoundment groundwater table; blue dashed line: pre-impoundment groundwater table; blue arrows: groundwater seepage directions).
Water 18 01803 g008
Figure 9. Simulated groundwater flow field around the dam foundations and abutments after impoundment.
Water 18 01803 g009
Figure 10. Simulated groundwater flow section through the left-abutment ridge saddle of Reservoir B after impoundment.
Water 18 01803 g010
Figure 11. Simulated groundwater flow section through the western ridge saddle of Reservoir B after impoundment.
Water 18 01803 g011
Figure 12. Numerical leakage discharge by pathway.
Water 18 01803 g012
Table 1. Topographic–groundwater–leakage-prone conditions of the upper reservoir.
Reservoir ZoneMain Geomorphic UnitKey Elevation RelationGroundwater/Valley ConditionLeakage-Prone Implication
Reservoir ABeiyugou valley, dam foundation and abutmentsNormal water level: 1895 m; main valley floor: 1798–1870 mAdjacent ridges are relatively thick; no saddle lower than the normal water level is identified along the main ridgeLeakage assessment focuses on dam foundation and abutment bypass seepage
Reservoir BLiangliushuigou valley, dam foundation and abutmentsNormal water level: 1895 m; main valley floor: 1794–1895 mValley incision and local abutment conditions are more complexDam-foundation and abutment leakage require separate evaluation
Southern left-abutment saddle of Reservoir BRidge saddle and adjacent low valleyExternal gully bed locally lower than the normal water levelGroundwater divide and adjacent low valley may create outward hydraulic gradientPotential thin-ridge and saddle leakage
Western ridge saddle of Reservoir BWestern ridge and Dachangzuigou low valleyExternal low valley lower than the normal water levelLow external drainage boundary and local ridge saddle coexistPotential adjacent-valley leakage
Fault-fracture zones around Reservoir Bf4, f6 and f8 fault-fracture zonesFaults intersect or approach leakage-prone reservoir marginsFault-fracture zones may provide preferential flow paths if hydraulically connectedPotential fault-fracture-zone leakage
Table 2. Classification and analytical parameters of leakage pathways.
Leakage PathwayRepresentative Leakage SectionAnalytical ModelKey Input Parameters
Dam-foundation leakageDam foundation of Reservoir AEquivalent seepage through layered foundation rock K d = 0.06614 m/d; M = 63 m; H = 100 m; 2b = 430 m; B = 200 m
Dam-foundation leakageDam foundation of Reservoir BEquivalent seepage through layered foundation rock K d = 0.096539 m/d; M = 55 m; H = 175 m; 2b = 596 m; B = 200 m
Abutment bypass leakageLeft and right abutments of Reservoir AEquivalent bypass seepage around abutmentsK = 0.0972 m/d; H 1 = 165 m; H2 = 80 m; B = 65 m and 51 m; r0 = 25 m and 21 m
Abutment bypass leakageLeft and right abutments of Reservoir BEquivalent bypass seepage around abutmentsK = 0.1471 m/d; H 1 = 160 m; H 2 = 75 m; B = 37.6 and 52.5 m; r 0 = 23.6 and 24.5 m
Thin-ridge and saddle leakageSouthern left-abutment ridge saddle of Reservoir BEquivalent seepage through ridge saddleK = 0.048856 m/d; H 1 = 1895 m; H 2 = 1810 m; L = 348 m; A = 19,000 m2
Thin-ridge and saddle leakageWestern ridge saddle of Reservoir BEquivalent seepage through western ridge saddleK = 0.037626 m/d; H 1 = 1895 m; H 2 = 1655 m; L = 800 m; A = 43,000 m2
Fault-fracture-zone leakageWestern fault-fracture zones around Reservoir BEquivalent seepage along fault-fracture zonesK = 0.432 m/d; H 1 = 1895 m; H 2 = 1700–1760 m; L = 700–990 m; A = 2100–3200 m2
Note: K is the hydraulic conductivity of the leakage medium; K d is the equivalent hydraulic conductivity of the dam-foundation rock mass; H is the hydraulic head difference used in dam-foundation leakage calculation; H 1 is the reservoir water level under the normal impoundment condition; H 2 is the outlet or seepage-exposure elevation; L is the seepage length; A is the equivalent flow section area; M is the thickness of the permeable foundation layer; 2b is the dam-bottom width; B is the dam length or equivalent seepage width, depending on the analytical model; and r0 is the equivalent radius used in abutment bypass leakage calculation.
Table 3. Hydrogeological parameters used in the three-dimensional groundwater flow model.
Hydrogeological Unit K v (m/d) K h (m/d) S s S y n e
Quaternary cover0.3673.6661.00 × 10−20.300.35
Completely weathered rock0.0660.6598.00 × 10−30.260.30
Strongly weathered rock0.0260.2856.00 × 10−30.240.28
Weakly weathered rock0.0060.0624.00 × 10−30.200.25
Fresh to slightly weathered rock0.0030.0322.00 × 10−30.150.20
Fault-fracture zone0.0430.4327.00 × 10−30.250.29
Dam body and reservoir-bottom backfill0.0010.0101.00 × 10−30.150.15
Table 4. Comparison between observed and simulated groundwater heads at the monitoring.
BoreholePaired ObservationsObserved Head Range (m)Simulated Head Range (m)Mean Residual (m)RMSE (m)
ZK2151801.1–1803.11797.8–1800.4−2.93.1
ZK26111897.0–1898.21890.6–1894.8−4.34.6
ZK27111890.7–1892.61886.2–1891.0−3.13.4
ZK30111905.5–1926.61902.0–1924.9−3.53.9
ZK41101847.2–1860.11842.9–1858.2−3.53.9
ZK43111876.9–1911.91873.5–1910.3−3.53.8
ZK47111903.9–1931.81903.0–1929.7−3.43.9
ZK48111877.0–1927.61874.1–1925.2−3.64.0
ZK51111918.4–1921.91913.9–1919.7−3.43.9
ZK6561897.5–1898.61892.8–1897.5−3.03.3
ZK6661898.2–1899.01894.1–1898.0−3.03.3
ZK6761859.2–1859.41854.7–1858.4−3.03.2
ZK7061908.1–1909.21904.2–1907.4−3.03.3
ZK7441866.0–1881.21862.6–1880.1−2.72.9
Note: The residual was calculated as the simulated groundwater head minus the observed groundwater head. ME is the mean error, MAE is the mean absolute error, and RMSE is the root mean square error.
Table 5. Packer-test-based permeability classification of the reservoir rock mass.
Permeability ClassLu RangeProportion of Test SectionsHydrogeological Implication
Very weakly permeableq < 1 Lu70.5%Dominant low-permeability rock mass in the reservoir basin
Weakly permeable1 Lu ≤ q < 10 Lu19.5%Locally permeable rock mass, commonly related to weathered and fractured zones
Moderately permeableq ≥ 10 Lu10.0%Local permeability windows that may contribute to leakage pathways
Table 6. Analytical and numerical leakage estimates by pathway.
Leakage PathwayAnalytical Estimate (m3/d)Numerical Estimate (m3/d)Difference (m3/d)Relative Difference (%)
Dam-foundation and abutment leakage of Reservoir A761.96727.4534.514.53
Dam-foundation and abutment leakage of Reservoir B858.95674.27184.6821.50
Southern left-abutment ridge saddle leakage of Reservoir B226.73172.0954.6424.10
Western ridge saddle leakage of Reservoir B495.49540.28−44.79−9.04
Fault-fracture-zone leakage around Reservoir B726.67547.72178.9524.63
Total of listed pathways3069.802661.81407.9913.29
Note: Relative difference was calculated as (analytical estimate − numerical estimate)/analytical estimate × 100%. The total analytical leakage is the sum of the listed pathway estimates.
Table 7. Analytical leakage estimates at the normal and dead reservoir water levels.
Leakage Pathway1895 m (m3/d)1880 m (m3/d)Reduction (%)
Dam-foundation and abutment leakage of Reservoir A761.96602.0820.98
Dam-foundation and abutment leakage of Reservoir B858.95703.1318.14
Southern left-abutment ridge-saddle leakage of Reservoir B226.73186.7217.65
Western ridge-saddle leakage of Reservoir B495.49464.526.25%
Fault-fracture-zone leakage around Reservoir B726.67660.579.10
Total3069.802617.0214.75%
Disclaimer/Publisher’s Note: The statements, opinions and data contained in all publications are solely those of the individual author(s) and contributor(s) and not of MDPI and/or the editor(s). MDPI and/or the editor(s) disclaim responsibility for any injury to people or property resulting from any ideas, methods, instructions or products referred to in the content.