Article

Experimental Study on Riverbed Evolution Characteristics of Boulder Bar Reach in Mountain River

1
College of Harbour and Coastal Engineering, Jimei University, Xiamen 361000, China
2
School of Civil Engineering and Architecture, Northeast Electric Power University, Jilin 132012, China
*
Author to whom correspondence should be addressed.
Water 2026, 18(14), 1720; https://doi.org/10.3390/w18141720
Submission received: 26 May 2026 / Revised: 10 July 2026 / Accepted: 11 July 2026 / Published: 16 July 2026

Abstract

Variable sediment supply and widely graded bed materials modify boulder–bar development, sediment transport and bar evolution in mountain mixed-size reaches. To elucidate the evolution characteristics of bars in boulder-strewn mountain river segments, this study conducted flume experiments. By adjusting parameters including discharge, boulder position, and boulder protrusion height, the paper analyzes bed scour and deposition deformations under various conditions. Results show discharge growth intensifies bed deformation: Both bar area and volume increase with rising discharge, with longer downstream bar extension and a positive correlation between bar length–width ratio and velocity. Higher boulder protrusion height and exposure amplify scour depth, expand bars laterally and reduce scour pit width–depth ratios. Boulders at bar heads migrate furthest downstream; moving boulders toward bar tails increases bar area/volume while bar height peaks then declines. Bar scale follows mid-channel bar head > bar tail > side anabranches. Boulder embedding depth linearly rises with exposure, both parameters positively linked to post-scour bar volume loss. The stable co-evolutionary relationship between scour depth and extent (R2 = 0.849) confirms their synchronized development under varying flow and boulder conditions. Boulders limit downstream bar elongation, flat beds boost scour diffusion, and scour pit width–depth ratio positively correlates with flow velocity. This work offers experimental and mechanistic references for mountain river geomorphic prediction.

1. Introduction

Mountain rivers are frequently subjected to extreme geological and hydrological events—including intense rainstorms, floods, landslides, debris flows, glacial activity, and tectonic disturbances—which introduce vast amounts of coarse sediment and large boulders into the channel [1]. The size of these boulders can range from several decimeters to several meters [2], and they exert a first-order control on local hydrodynamics, flow resistance, channel morphology, and sediment transport [3,4]. Moreover, the transport and impact of boulders may cause severe local damage to instream structures [5,6]. Therefore, understanding scour and deposition processes in boulder-affected reaches is of fundamental importance for river engineering and hazard mitigation in mountainous regions.
In parallel with the widespread presence of boulders, mountain rivers commonly exhibit numerous bars due to the high sediment supply from their watersheds. Bars are recognized as ubiquitous instability features in straight channels: Tubino et al. [7] demonstrated that almost all instabilities in straight rivers lead to bar formation. In mountain streams, abrupt fluctuations in discharge and upstream sediment input further amplify channel instability, promoting rapid bar development at various locations. Gladkov [8] found that bedload transport intensifies under unsteady flow conditions caused by daily flow regulation, while Kim [9] described distinct longitudinal riverbed morphodynamics in boulder-free environments. Church et al. [10] characterized single-bar development as primarily driven by lateral accretion. In mountain rivers, bars are typically composed of a mixture of boulders and coarse sand, and field observations indicate that bar heads often accumulate large pebbles and other coarse particles [11].
Recent studies have begun to explore the role of boulders in bar formation [12,13]. Ye et al. [11] demonstrated that, under sediment-supply conditions, boulder-dominated local patches tend to evolve into bars. Li et al. [14] observed that pebble-rich bars exhibit an upstream-migrating (i.e., reverse) development pattern. Flow downstream of submerged boulders is characterized by reverse and decelerated currents [15], which promote longitudinal sediment accumulation immediately downstream of the boulders [16,17]. Tsakiris et al. [18,19] treated boulder intrusions as localized perturbations that alter the surrounding flow field and shear stress distribution. Montgomery et al. [20] reported significant spatial variations in near-boulder shear stress; similarly, Hou and Cao [21,22] found that flow velocity and shear intensity are markedly higher in geometrically steep regions, with transcritical bifurcations and fold breakup occurring under specific conditions. Since sediment transport is strongly dependent on available shear stress, Nitsche et al. [4] concluded that boulders reduce the effective shear stress available for sediment mobilization, thereby suppressing bedload transport. Papanicolaou et al. [17,18] also confirmed that boulders induce substantial changes in local sediment transport rates.
Despite these valuable insights, the existing literature has largely treated boulder effects and bar dynamics separately. Most previous investigations have focused either on boulder-induced scour and turbulence [15,18,20] or on bar formation and migration of alluvial riverbeds [23,24,25,26,27,28,29,30,31,32], with limited attention to the coupled interplay between boulder migration and bar morphodynamic evolution. Specifically, it remains unclear how boulder position (e.g., bar head, side anabranch, or bar tail) and protrusion height jointly modulate bar geometry—including area, volume, height, and length–width ratio—under varying discharges and sediment supply rates. Furthermore, the feedback effect of boulder displacement on bar evolution has not been quantitatively assessed, and systematic comparisons with boulder-free baseline conditions are lacking.
The present study conducts a series of controlled flume experiments that systematically vary discharge, boulder position, and boulder protrusion height. The objectives are to quantify the individual and interactive effects of these factors on bar morphological parameters (area, volume, height, and length–width ratio) under both clear-water scour and sediment-supply conditions, to examine boulder migration behavior and its reciprocal influence on bar development, and to elucidate the underlying physical mechanisms linking boulder-induced turbulence, flow separation, and sediment trapping to bar evolution. The novelty of this work lies in its quantitative, integrated analysis of boulder–bar coupling, which goes beyond previous descriptive or single-factor approaches. The findings are expected to provide a mechanistic basis for river management, flood control, and disaster prevention in boulder bar reaches of mountainous rivers.

2. Experimental Setup

2.1. Flume Experiment

Due to the complex and variable nature of boulder bars in mountainous river areas, their scouring and deposition patterns directly influence navigation capacity, flood control safety, and ecological stability. Therefore, investigating these processes is of significant engineering significance. However, field investigations of boulder bars are often constrained by factors such as heterogeneous particle sizes, unsteady flow conditions, and complex local topography, making it difficult to conduct systematic studies or reveal the underlying mechanisms of boulder bar bed deformation. To isolate the governing mechanisms from the complexities of the natural environment, physical modeling experiments are necessary. In this study, flume experiments were conducted in an acrylic flume (10 m long, 1.5 m wide, and 1.2 m deep, made in Shangshui Information Technology Co., Ltd., Beijing, China) at the Port and Coastal Engineering Comprehensive Laboratory of Jimei University. The flume had a fixed cement bed. To ensure stable and uniform flow in the test section, measurements were taken at the center of the flume. A 5 m long, 0.15 m thick erodible bed was formed using uniform sand (d50 = 1.5 mm).Three representative discharge levels of 40, 60 and 80 L/s were selected to cover a wide range of flow intensities. The total sediment feeding mass was fixed at 60 kg for all test cases. Sediment was intermittently added at a mass of 2 kg every 30 s, corresponding to a constant sediment supply rate of 4 kg/min. To ensure a smooth transition of flow into and out of the erodible section, 0.5 m-long gravel transitions were laid at both ends. The boulder samples used in the experiment were collected from the Baisha River, a tributary of the Minjiang River, with a representative diameter of D = 15.2 cm. The origin of the measurement coordinate system was set at the center of the test section, serving as a reference point for subsequent observations of bed elevation and flow velocity. To ensure the accuracy of the experimental results, each experiment was conducted for more than 24 h until scour equilibrium was attained. The test was terminated when both the water depth and bed elevation remained stable for four consecutive hours.

2.2. Test Conditions

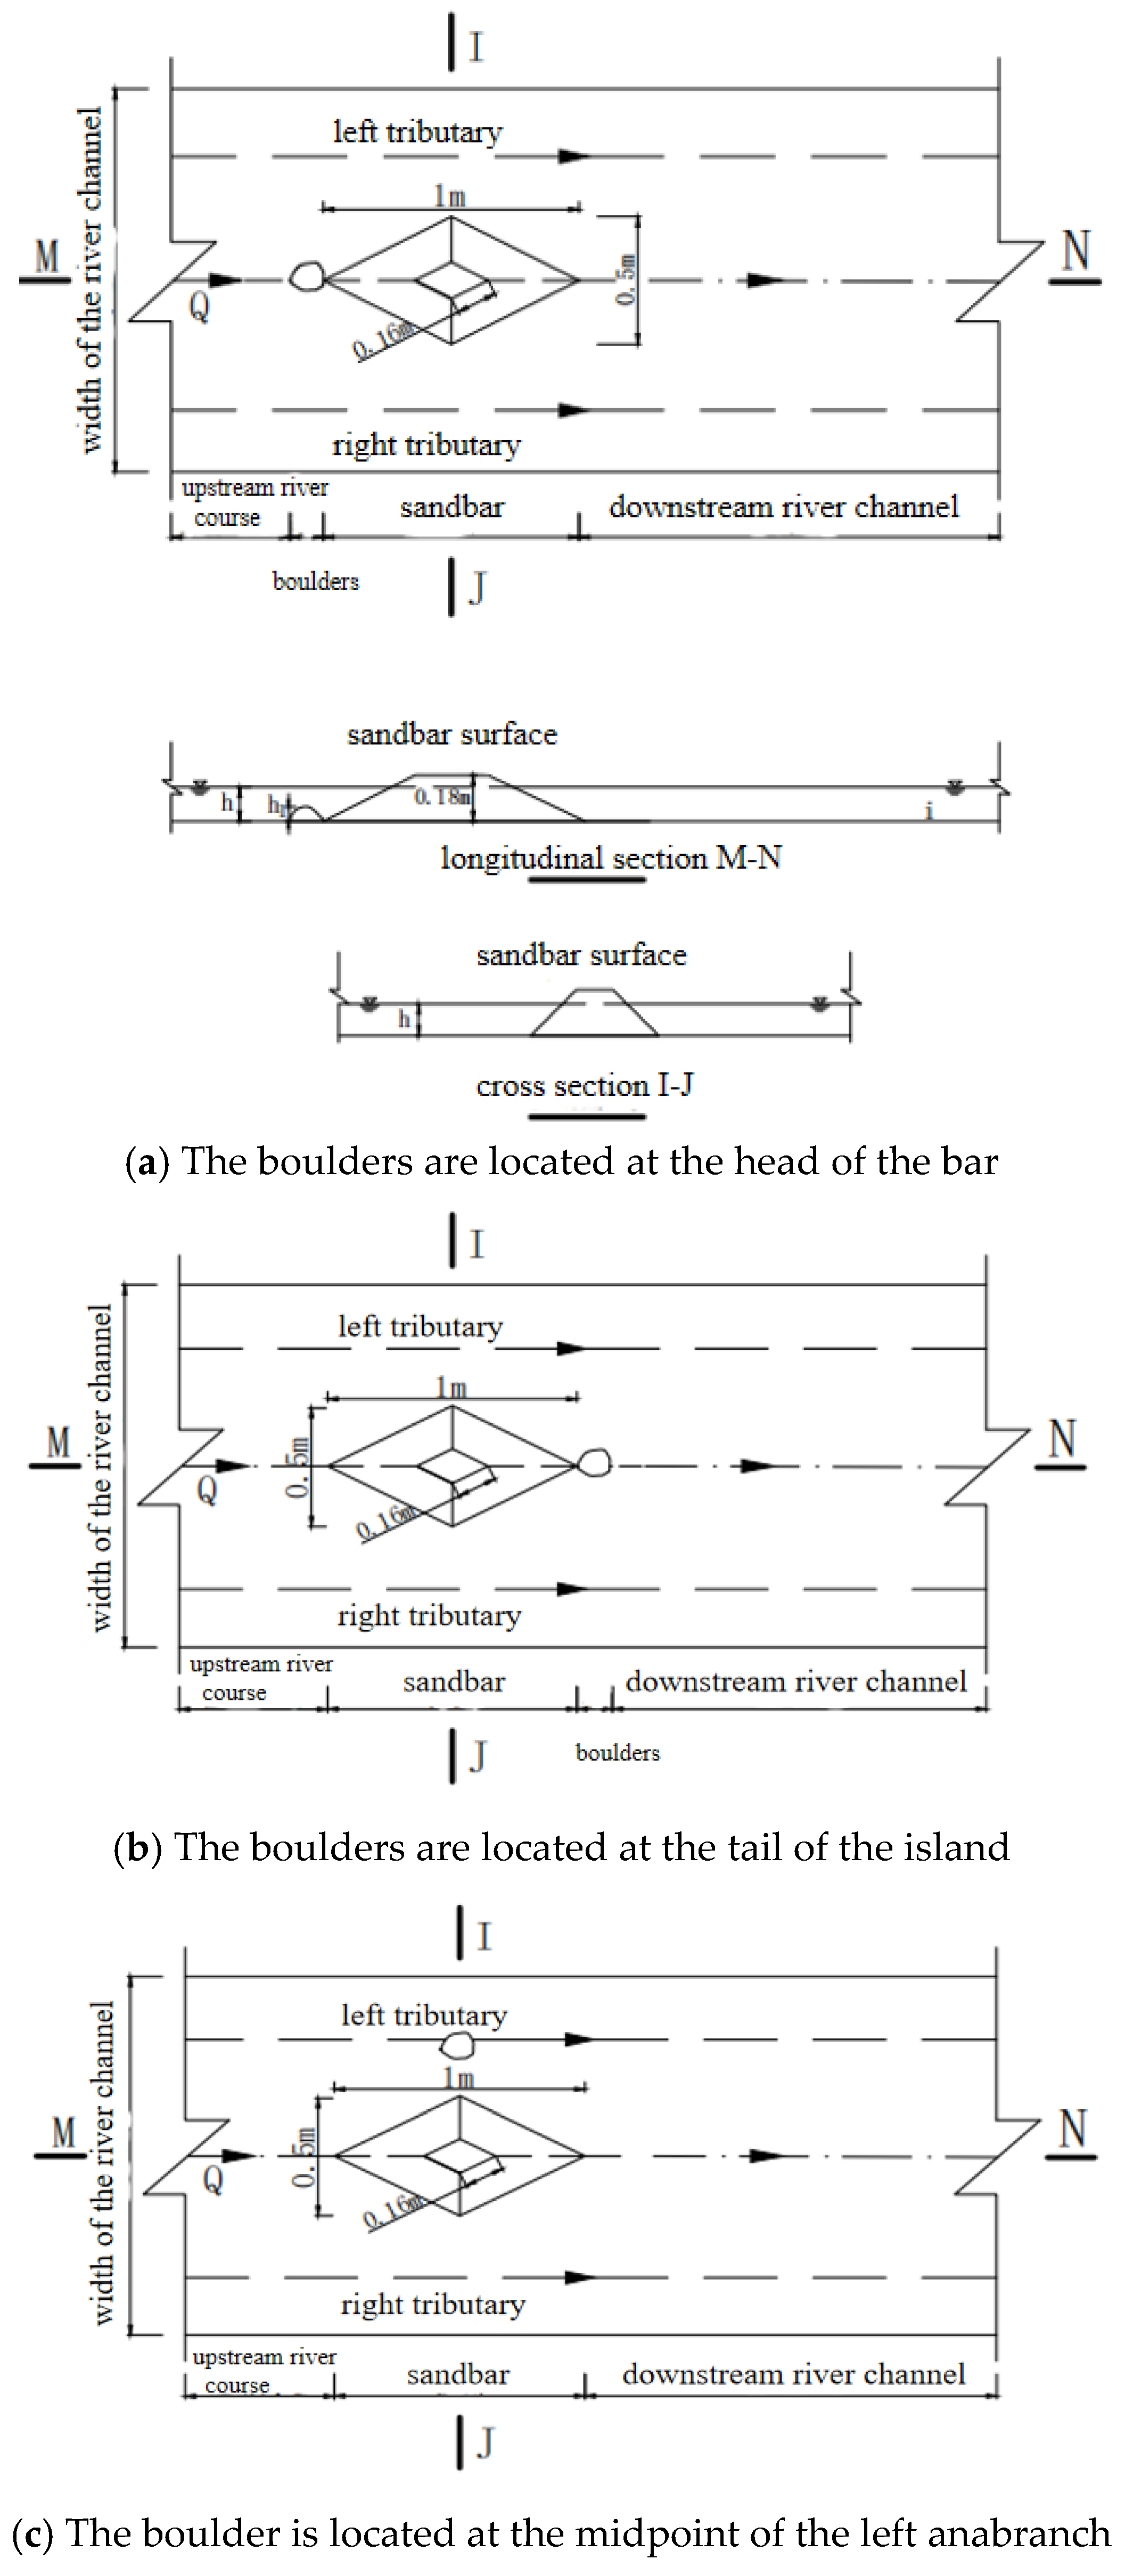
The experimental setup is shown in Figure 1. The physical model in this study is constructed based on the Froude similarity law and geometric scaling, with a scale ratio of 1:30 adopted for the flume. The relative submergence of the boulder protrusion (defined as the ratio of water depth to protrusion height, E = h/Ds) is a key parameter governing the intensity of local flow acceleration and vortex generation. To investigate the regulatory effect of boulders on the evolution of the local riverbed morphology in mountainous areas, and the influence mechanism of different sediment supply conditions on scouring and deposition processes, a total of 17 experimental runs were designed and are summarized in Table 1. These runs were categorized into three series: (R1–R2) clear-water scour over a bed without boulders; (R3–R9, R12–R17) clear-water scour over a bed with boulders placed at different position (as shown in Figure 2); and (R10–R11) experiments with upstream sediment feed over a bed with boulders. The study focused on the impact of boulders on flow structure and bed morphology, as well as the effects of clear-water scour versus sediment supply on riverbed deformation and upstream sediment input on the riverbed morphology of the boulder riverbed. For the sediment feed runs (R10–R11), uniform sand with a particle size range of 1–2 mm (d50 = 1.5 mm) was continuously supplied at the upstream boundary. To capture the dynamic evolution characteristics of the bed morphology under each condition, a 3D underwater ultrasonic topography system was used to survey the bed surface throughout the experiments.
This laboratory study has inherent scale limitations. Experiments were conducted in a 1.5 m-wide flume with 15.2 cm-diameter boulders and uniform bed sediment (D50 = 1.5 mm). These dimensions inevitably differ from those of natural mountain rivers, where boulders can reach several meters in diameter and bed sediment is typically poorly graded, ranging from fine sand to large cobbles. As such, the absolute values reported in this paper (e.g., bar area, scour depth, sediment volume) are not suitable for direct extrapolation to prototype scale without proper scale conversion. Nonetheless, the experimental design ensures key dimensionless parameters stay within the typical ranges of natural boulder rapid reaches. Specifically, the Froude number (Fr ≈ 0.4–0.8), relative submergence (h/D ≈ 0.3–1.2), relative exposure height (p/D ≈ 0.5–1.0) and boulder-to-bed sediment size ratio (Dboulder/D50 ≈ 110) all lie within the ranges representative of typical mountain rivers [11,14,15,16,17,18,33]. Hydraulic parameters of experimental conditions shown in Table 2 With similarity maintained for these dimensionless parameters, the qualitative and mechanistic relationships revealed in this study—including amplified scour with rising exposure height, boulder position effects on bar morphological parameters, and the coupling between boulder transport and bar evolution—are expected to remain valid across scales.
We also acknowledge that using uniform sediment may mask the sorting transport and hiding effects present in naturally graded sediment. To address this limitation, the grain size ratio is included as a relevant dimensionless parameter, and future studies with graded bed sediment are recommended to further validate the generalizability of our conclusions. Despite these simplifications, this work provides a controlled, systematic experimental basis for understanding the fundamental physical processes of boulder–bar interactions, and offers useful mechanistic insights for the regulation and disaster prevention of mountain boulder rapid reaches.

2.3. Definition and Extraction Method of Bar Morphological Parameters

To avoid discrepancies in parametric calculation, unified definitions of bar geometric parameters are provided as follows.

2.3.1. Definition of Bar Characteristic Parameters

Bar boundary: Regions where the post-scour bed elevation is at least 5 mm higher than the initial flat bed surface. This threshold is approximately three times the precision of the topographic measurement system, which eliminates tiny topographic fluctuations induced by measuring noise [14,33].
Bar area: Horizontal projected area enclosed by the defined bar boundary.
Bar volume: Total sediment deposition volume above the initial bed elevation within the bar boundary, calculated via the trapezoidal integration method based on the digital elevation model (DEM).
Bar height: Maximum vertical distance from the initial bed surface to the top of the deposited bar.

2.3.2. Extraction Workflow of Bar Morphological Parameters

An elevation threshold method is adopted to identify the planar outline and quantify geometric indicators of gravel bars. Based on the geomorphic principle that bars are continuous positive depositional landforms elevated above the base bed, a critical elevation threshold is set to separate bar deposits from the natural bed. The detailed procedures are illustrated below:
(1)
Construction of underwater DEM
The Kriging interpolation method is applied to gridding the 3D scattered topographic data measured in flume experiments, generating a uniform underwater digital elevation model (DEM) with a grid resolution of 1 mm × 1 mm. This interpolation scheme fully retains fine geomorphic features such as bar crests and troughs, while removing random noise of raw measuring points and minor local undulations on the bed.
(2)
Determination of critical elevation threshold
The global unified threshold is comprehensively determined by typical topographic profiles and statistical characteristics of bed elevation:
① Representative cross-sectional profiles perpendicular to the bar extension direction are extracted, and inflection points where bar slopes transition to flat base beds are identified to preliminarily constrain the elevation range of bar toes;
② A constraint criterion is introduced: the average elevation of the initial bed plus twice the standard deviation of bed roughness.
Combining the above two conditions, the unified elevation threshold is finalized. This criterion can eliminate pseudo-deposition areas caused by natural undulations of flat beds, and accurately match the actual physical boundary at bar toes.
(3)
Bar range segmentation and parametric extraction
Binary segmentation is performed on DEM raster layers using the critical elevation threshold. All connected raster cells with elevation higher than the threshold are extracted to represent the planar distribution of individual gravel bars.
On this basis, continuous lines connecting the maximum elevation values within each bar region are extracted as bar crests. A series of morphological indicators are further calculated, including bar longitudinal length, transverse width, bar height (difference between crest elevation and threshold elevation), and planar deposition area.

3. Results

3.1. Sedimentation and Scour Phenomena in Boulder Bar Riverbed

For cases without boulders, the initial bed surface was relatively smooth. During clear-water scour, erosion initiated at the upstream end of the bar, specifically at the leading edge of the bar head and along the lateral interfaces between the flow and the bar margins. As the bar width increased, flow velocity in the side channels intensified, further eroding the bar flanks. The bar gradually flattened as sediment was entrained and transported downstream, depositing laterally. Flow velocity at the bar tail was significantly lower than at the bar head, reducing sediment transport capacity. When sediment-laden flow bypassed the bar and converged at the tail, the flow dynamics changed: the channel narrowed, velocity increased, and sediment transport capacity rose, leading to renewed scour at the downstream end.
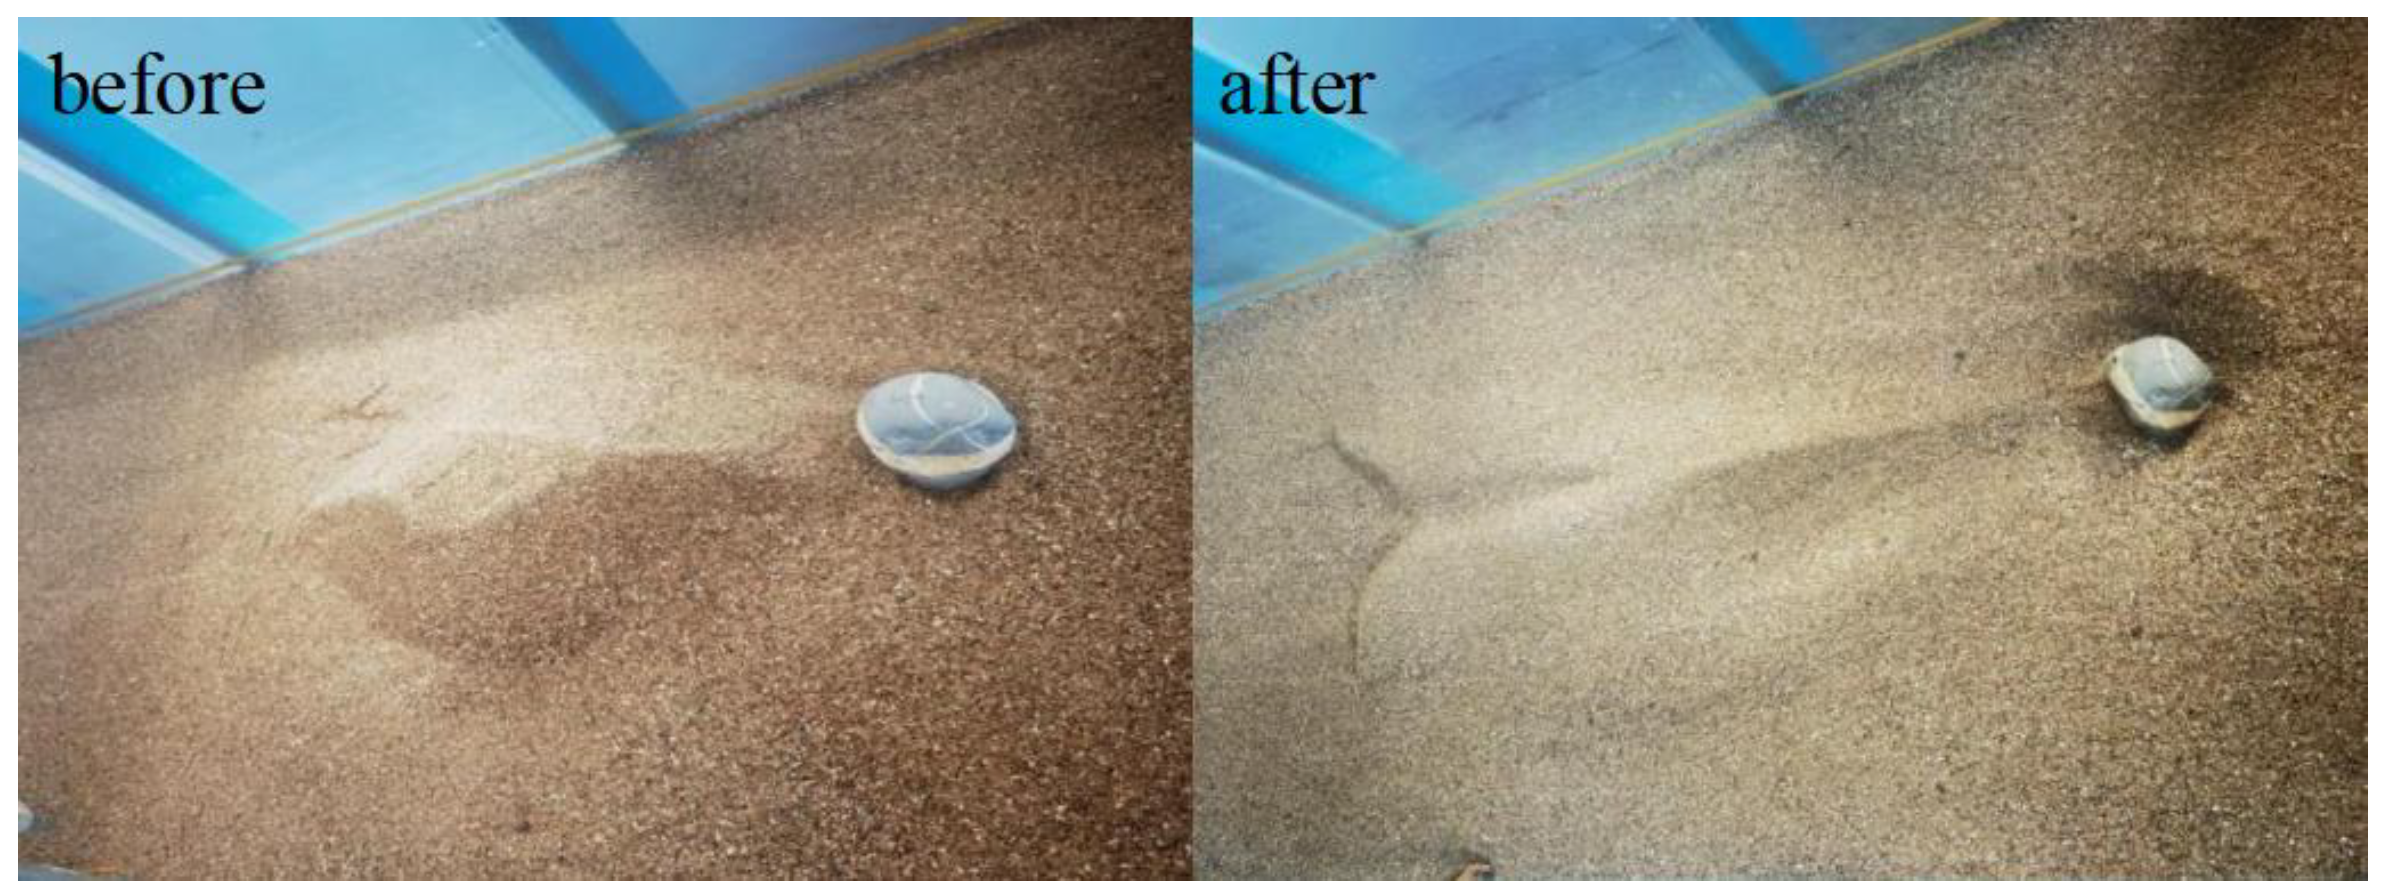
For cases with boulders placed at the bar head (as shown in Figure 3), the boulders induced complex local scour patterns. Upstream of the boulders, flow deflection caused local scouring, while a vortex formed in the lee of the boulders, creating a distinct scour hole. Ye et al. [34] found that in the near-wake region (Δx ≤ 1.5D), both turbulence intensity and dissipation increased sharply. This turbulent flow impacted the bar head, causing erosion and collapse. The eroded sediment was subsequently transported and deposited in the downstream central area. Under the combined effects of flow deflection, local scour around the boulders, and wake-induced scouring, the scour holes expanded and deepened. In some cases, this undercutting led to boulder instability, causing the boulders to settle into the scour holes, which further exacerbated local scour. As flow was diverted around the boulders and scour holes, flow velocity along the bar margins increased, incising channels on both sides of the downstream bar and forming gullies.

3.2. Local Scour and Deposition Characteristics of Boulder Bar Riverbed

To comprehensively and systematically analyze the characteristics and patterns of riverbed deformation and to elucidate the intrinsic mechanisms and spatial differences induced by boulder presence, this study investigates the effects of three key factors—flow discharge, boulder position, and boulder protrusion height—on the local scour and deposition characteristics of boulder bars. Longitudinal topographic profiles were extracted along the transects of maximum scour depth to compare and analyze the variations in scour and deposition under different conditions.

3.2.1. Scour and Deposition Characteristics of the Bar Under Different Flow Conditions

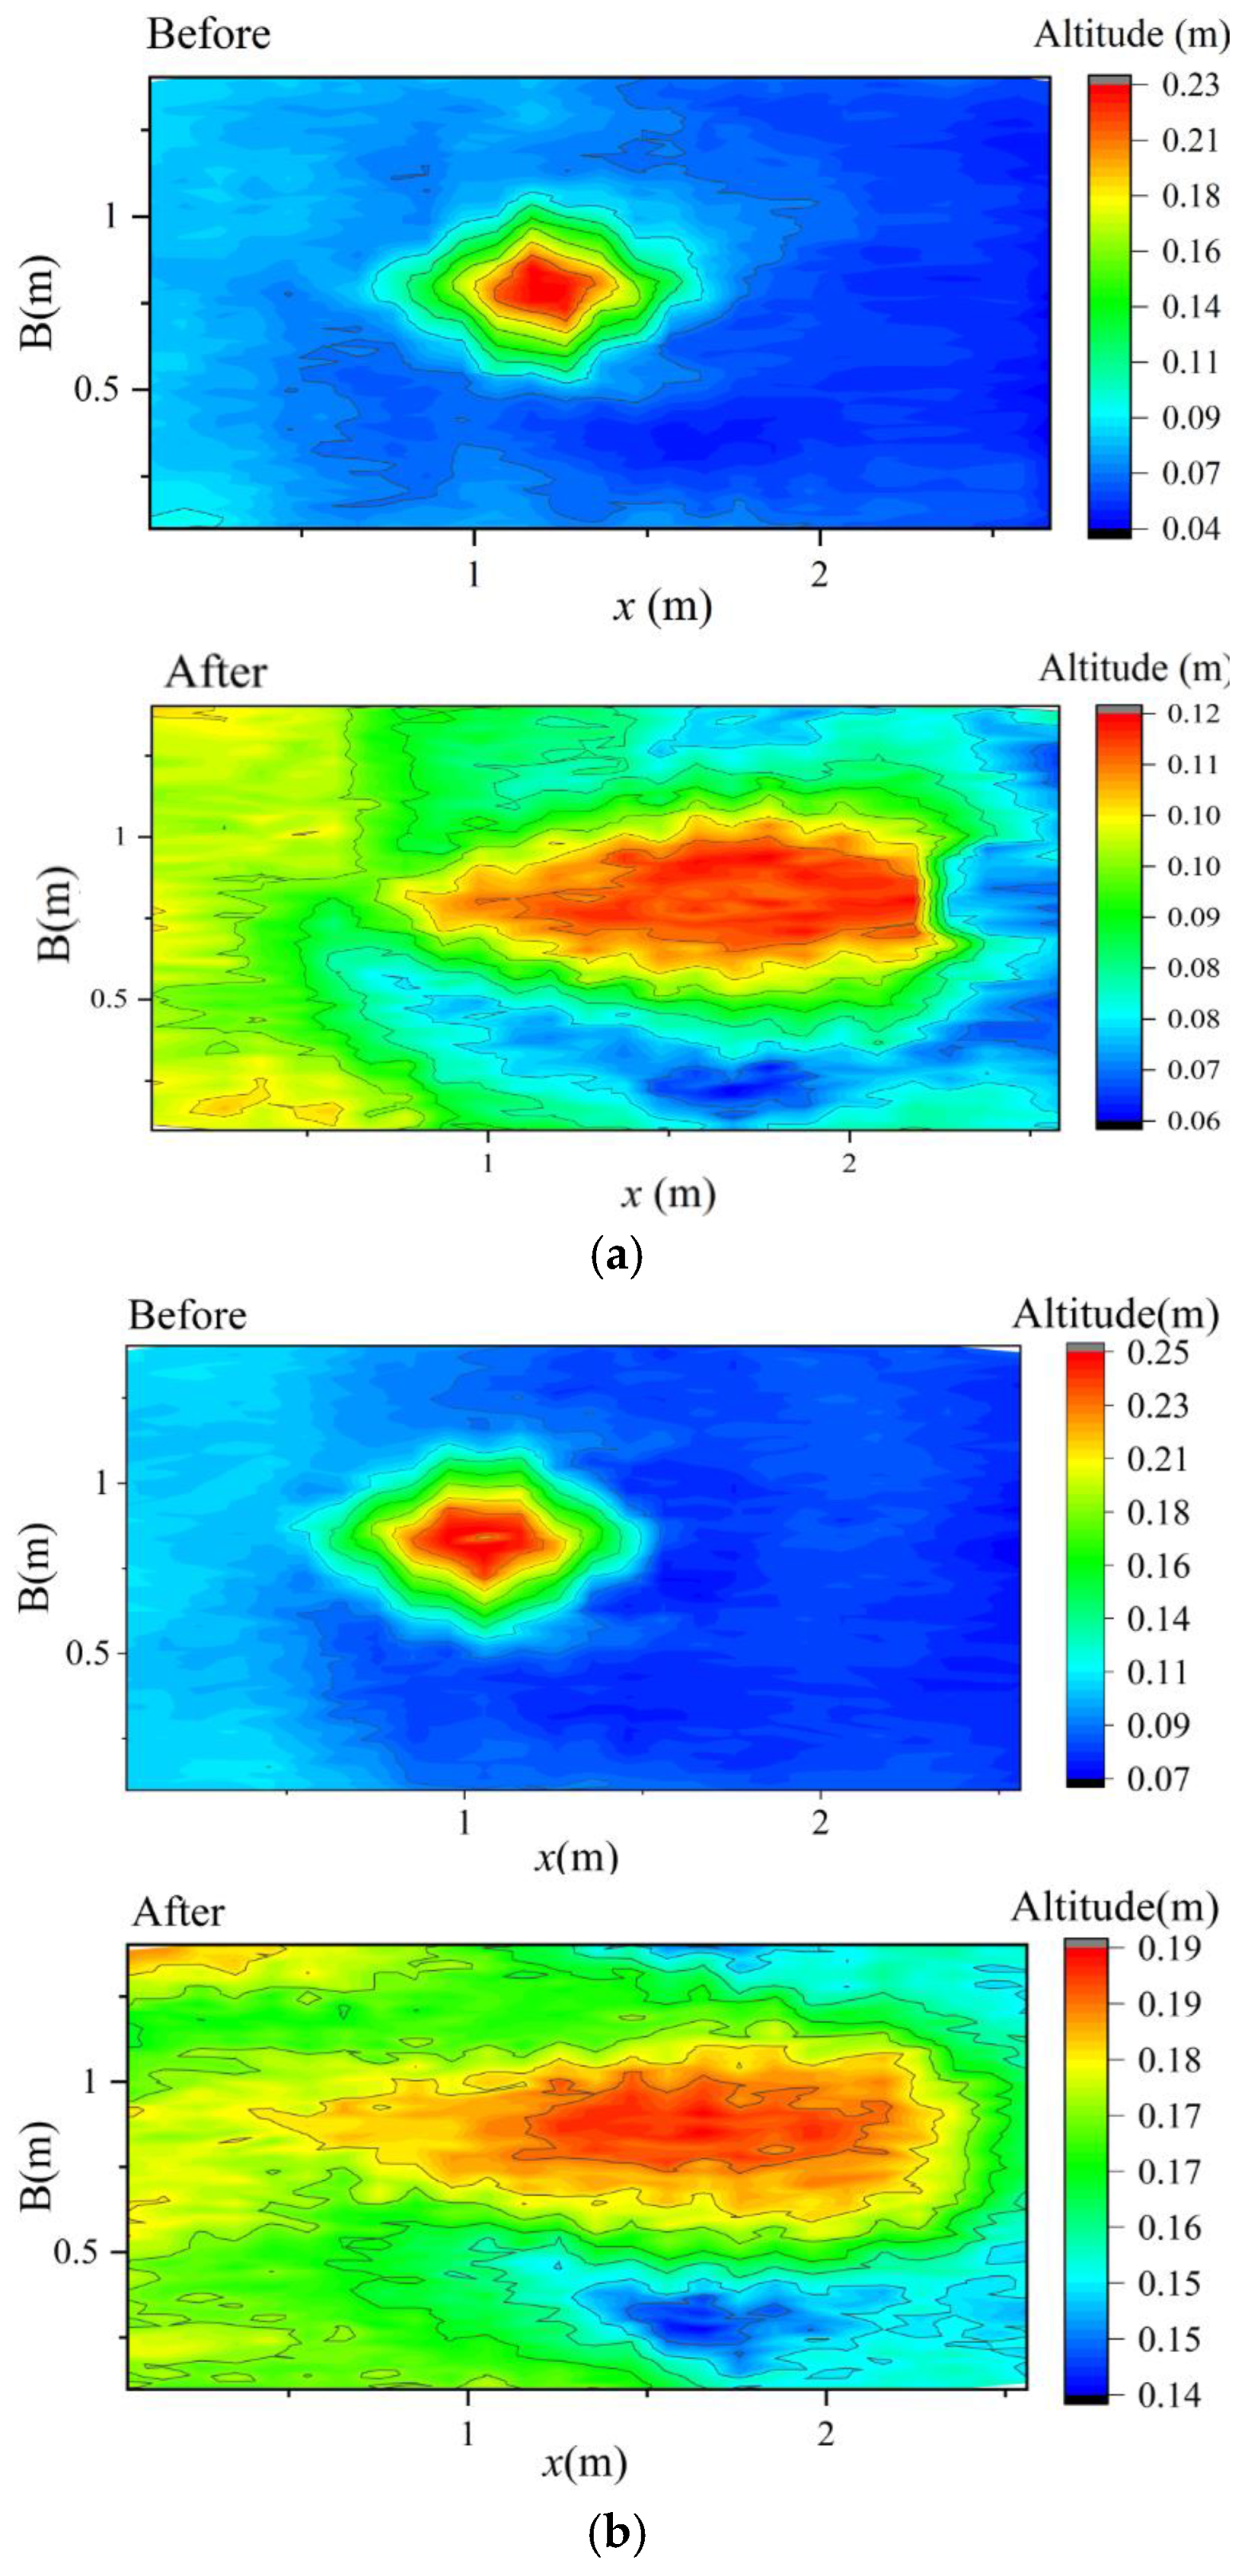
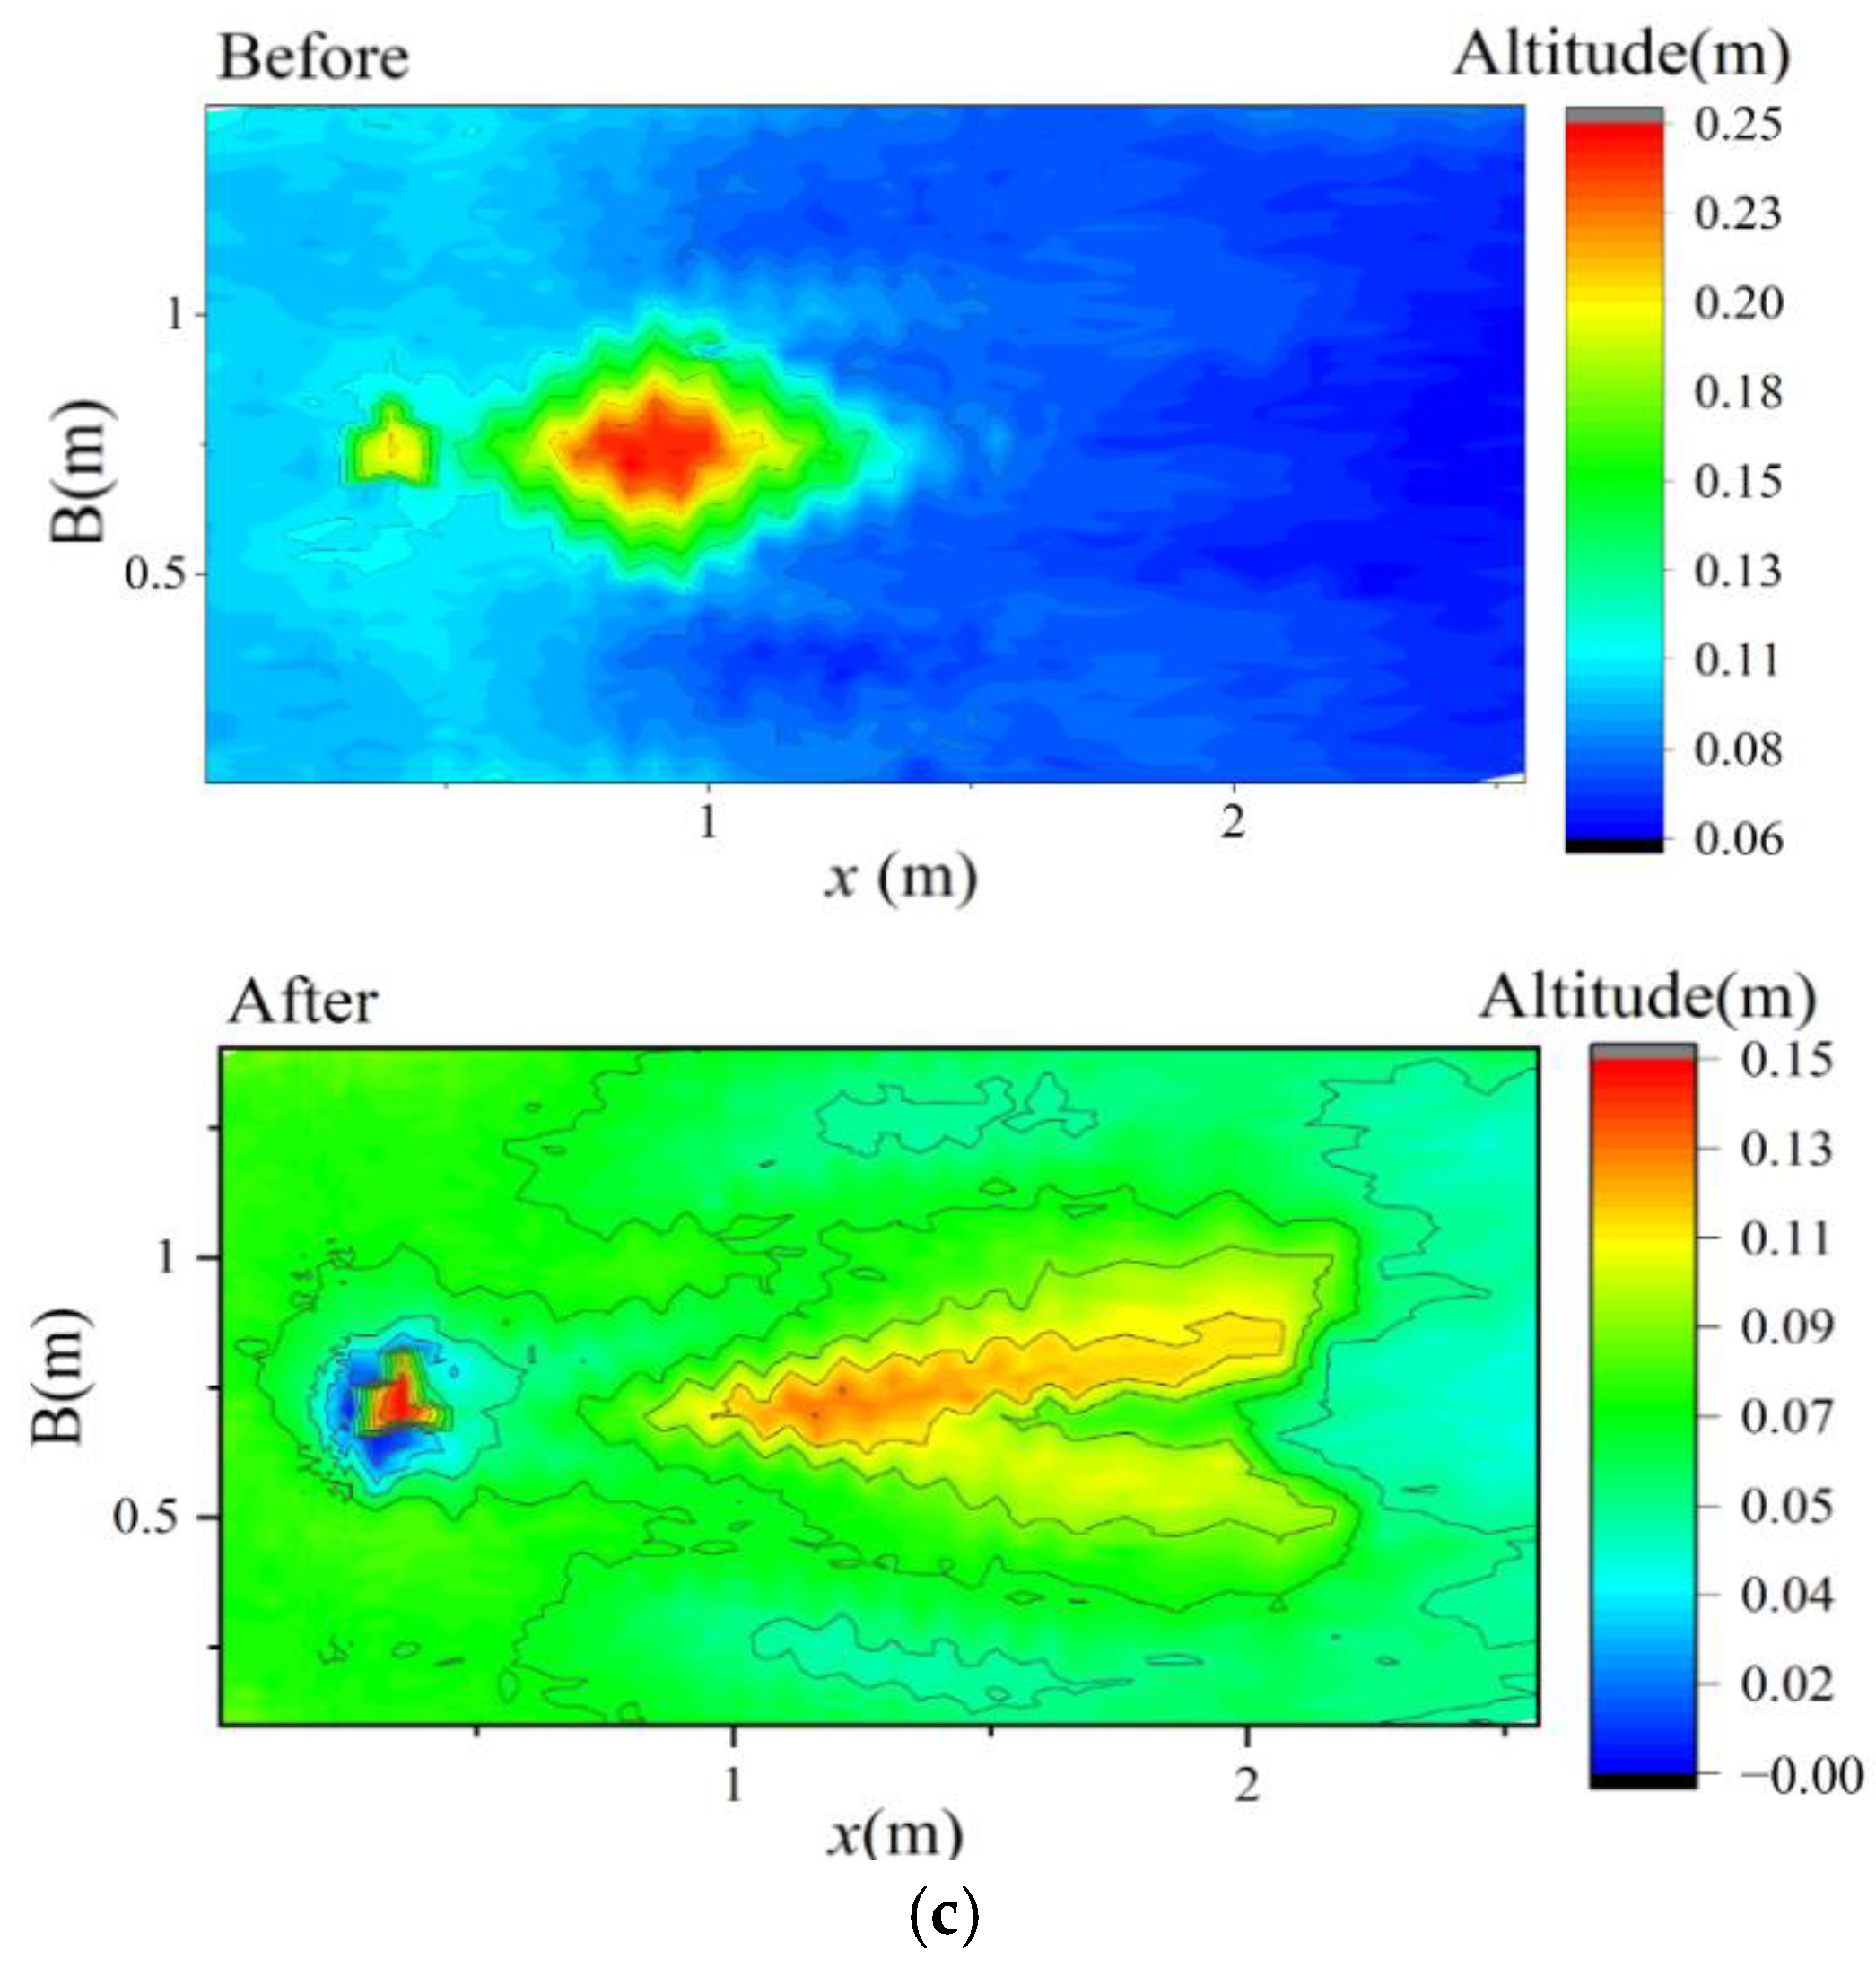
As shown in Figure 4, under the conditions of Q = 40 L/s and a bed slope of i = 2%, the boulder-free bed exhibited downstream scouring, with sediment accumulating laterally and at the bar tail. The overall sediment transport direction was downstream, and the bed surface remained relatively flat, with the bar extending in the downstream direction. When the discharge was increased to Q = 60 L/s (with other conditions held constant), the overall scour and deposition pattern remained similar, but the bed elevation decreased more significantly, and the bar extended further downstream.
When boulders were placed at the bar head (Q = 60 L/s, i = 2%), distinct scour holes formed around the boulders. The bar head retreated considerably, and the overall bed elevation was lower compared to the boulder-free case. While the bar area decreased, accumulation intensified at the bar tail. The maximum bar height increased with discharge: from 0.118 m at Q = 40 L/s to 0.195 m at Q = 60 L/s. However, in the presence of boulders at Q = 60 L/s, the maximum height was reduced to 0.13 m.
The bar area also increased with discharge. After scouring, the bar area increased by approximately 2.42 m2 at Q = 40 L/s and 2.71 m2 at Q = 60 L/s, suggesting a positive correlation between flow discharge and lateral deposition under the tested conditions. However, when boulders were present at Q = 60 L/s, the post-scour area increased by only 0.45 m2, indicating that boulders suppressed the areal expansion of the bar.
Bar volume followed a trend similar to that of area, increasing with discharge due to areal expansion and a wider distribution of deposition heights. At Q = 40 L/s, the post-scour volume increased by approximately 0.07 m3 compared to the initial volume; at Q = 60 L/s, it increased by 0.27 m3. In contrast, with boulders present at Q = 60 L/s, the post-scouring volume increased by only 0.01 m3.
In summary, under the same bed slope, increasing discharge enhanced scour and promoted downstream extension and lateral expansion of the bar, as reflected by increased area and volume. However, the presence of boulders significantly altered this response: boulders induced localized scour, reduced downstream bar extension, and suppressed overall areal and volumetric increases compared to the boulder-free case. Higher discharges tended to redistribute sediment, potentially reducing the peak bar height while expanding the bar footprint.

3.2.2. Sedimentation and Scour Characteristics of Bars Under Different Boulder Position

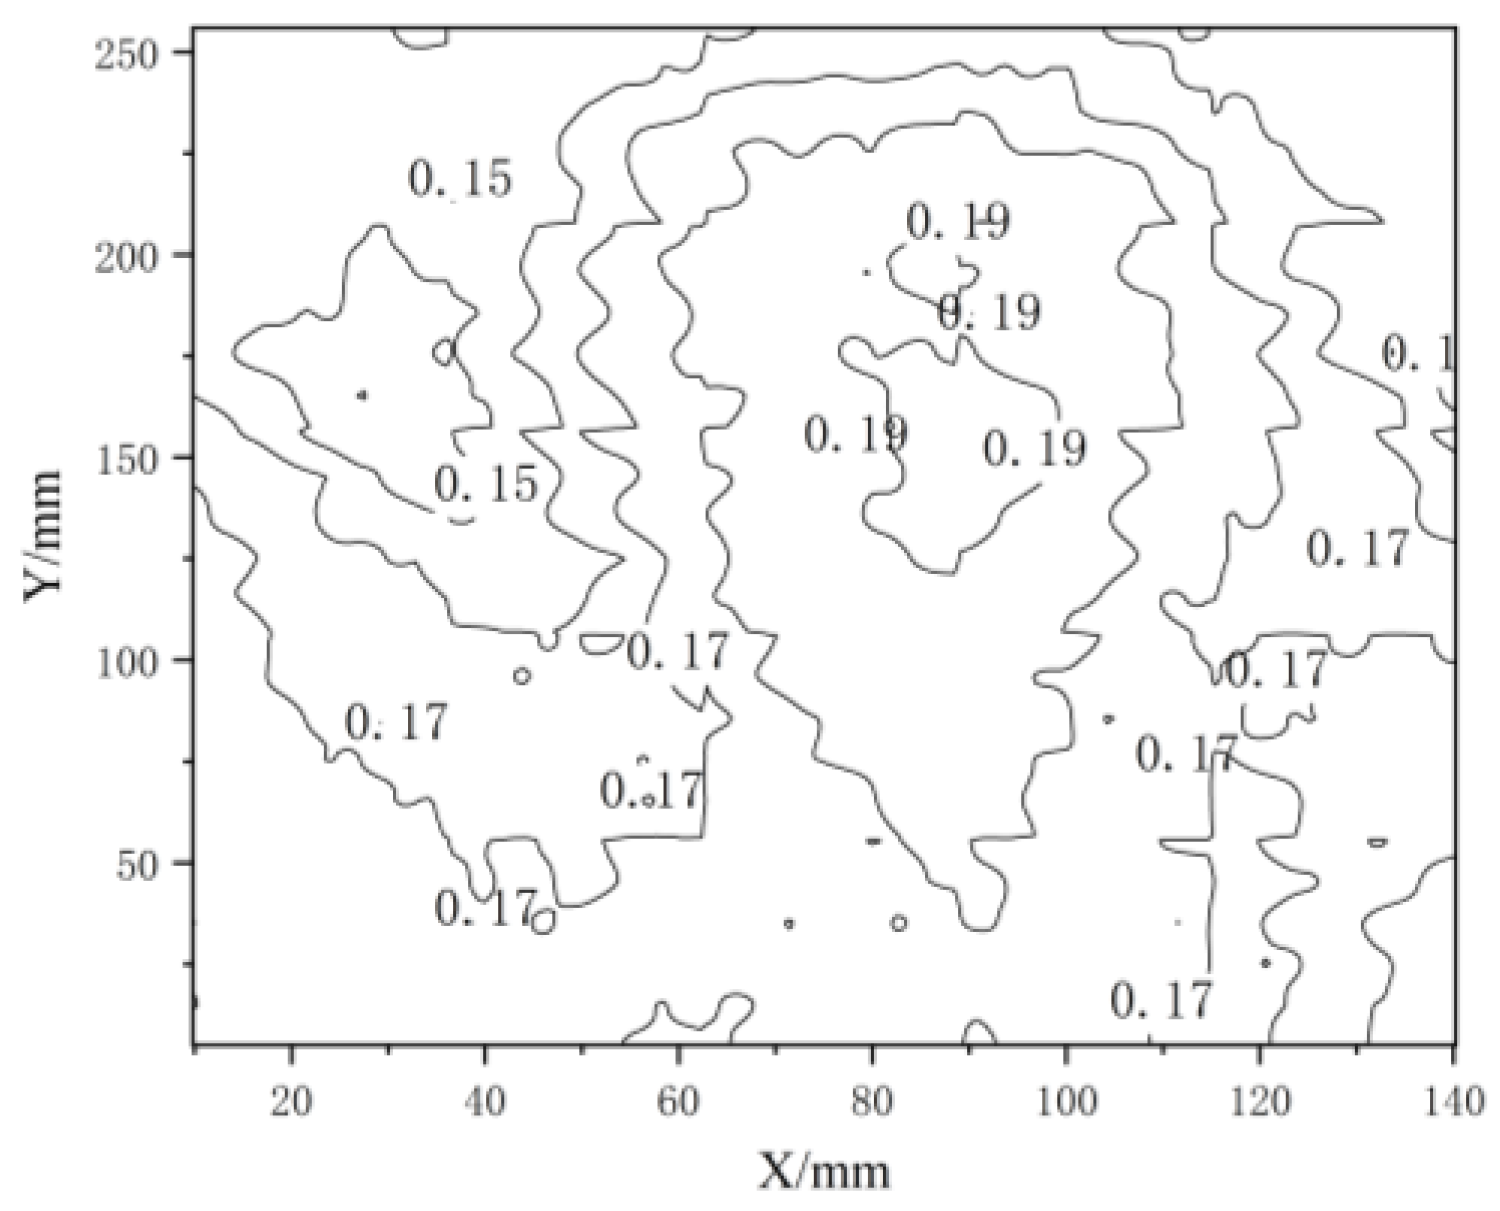
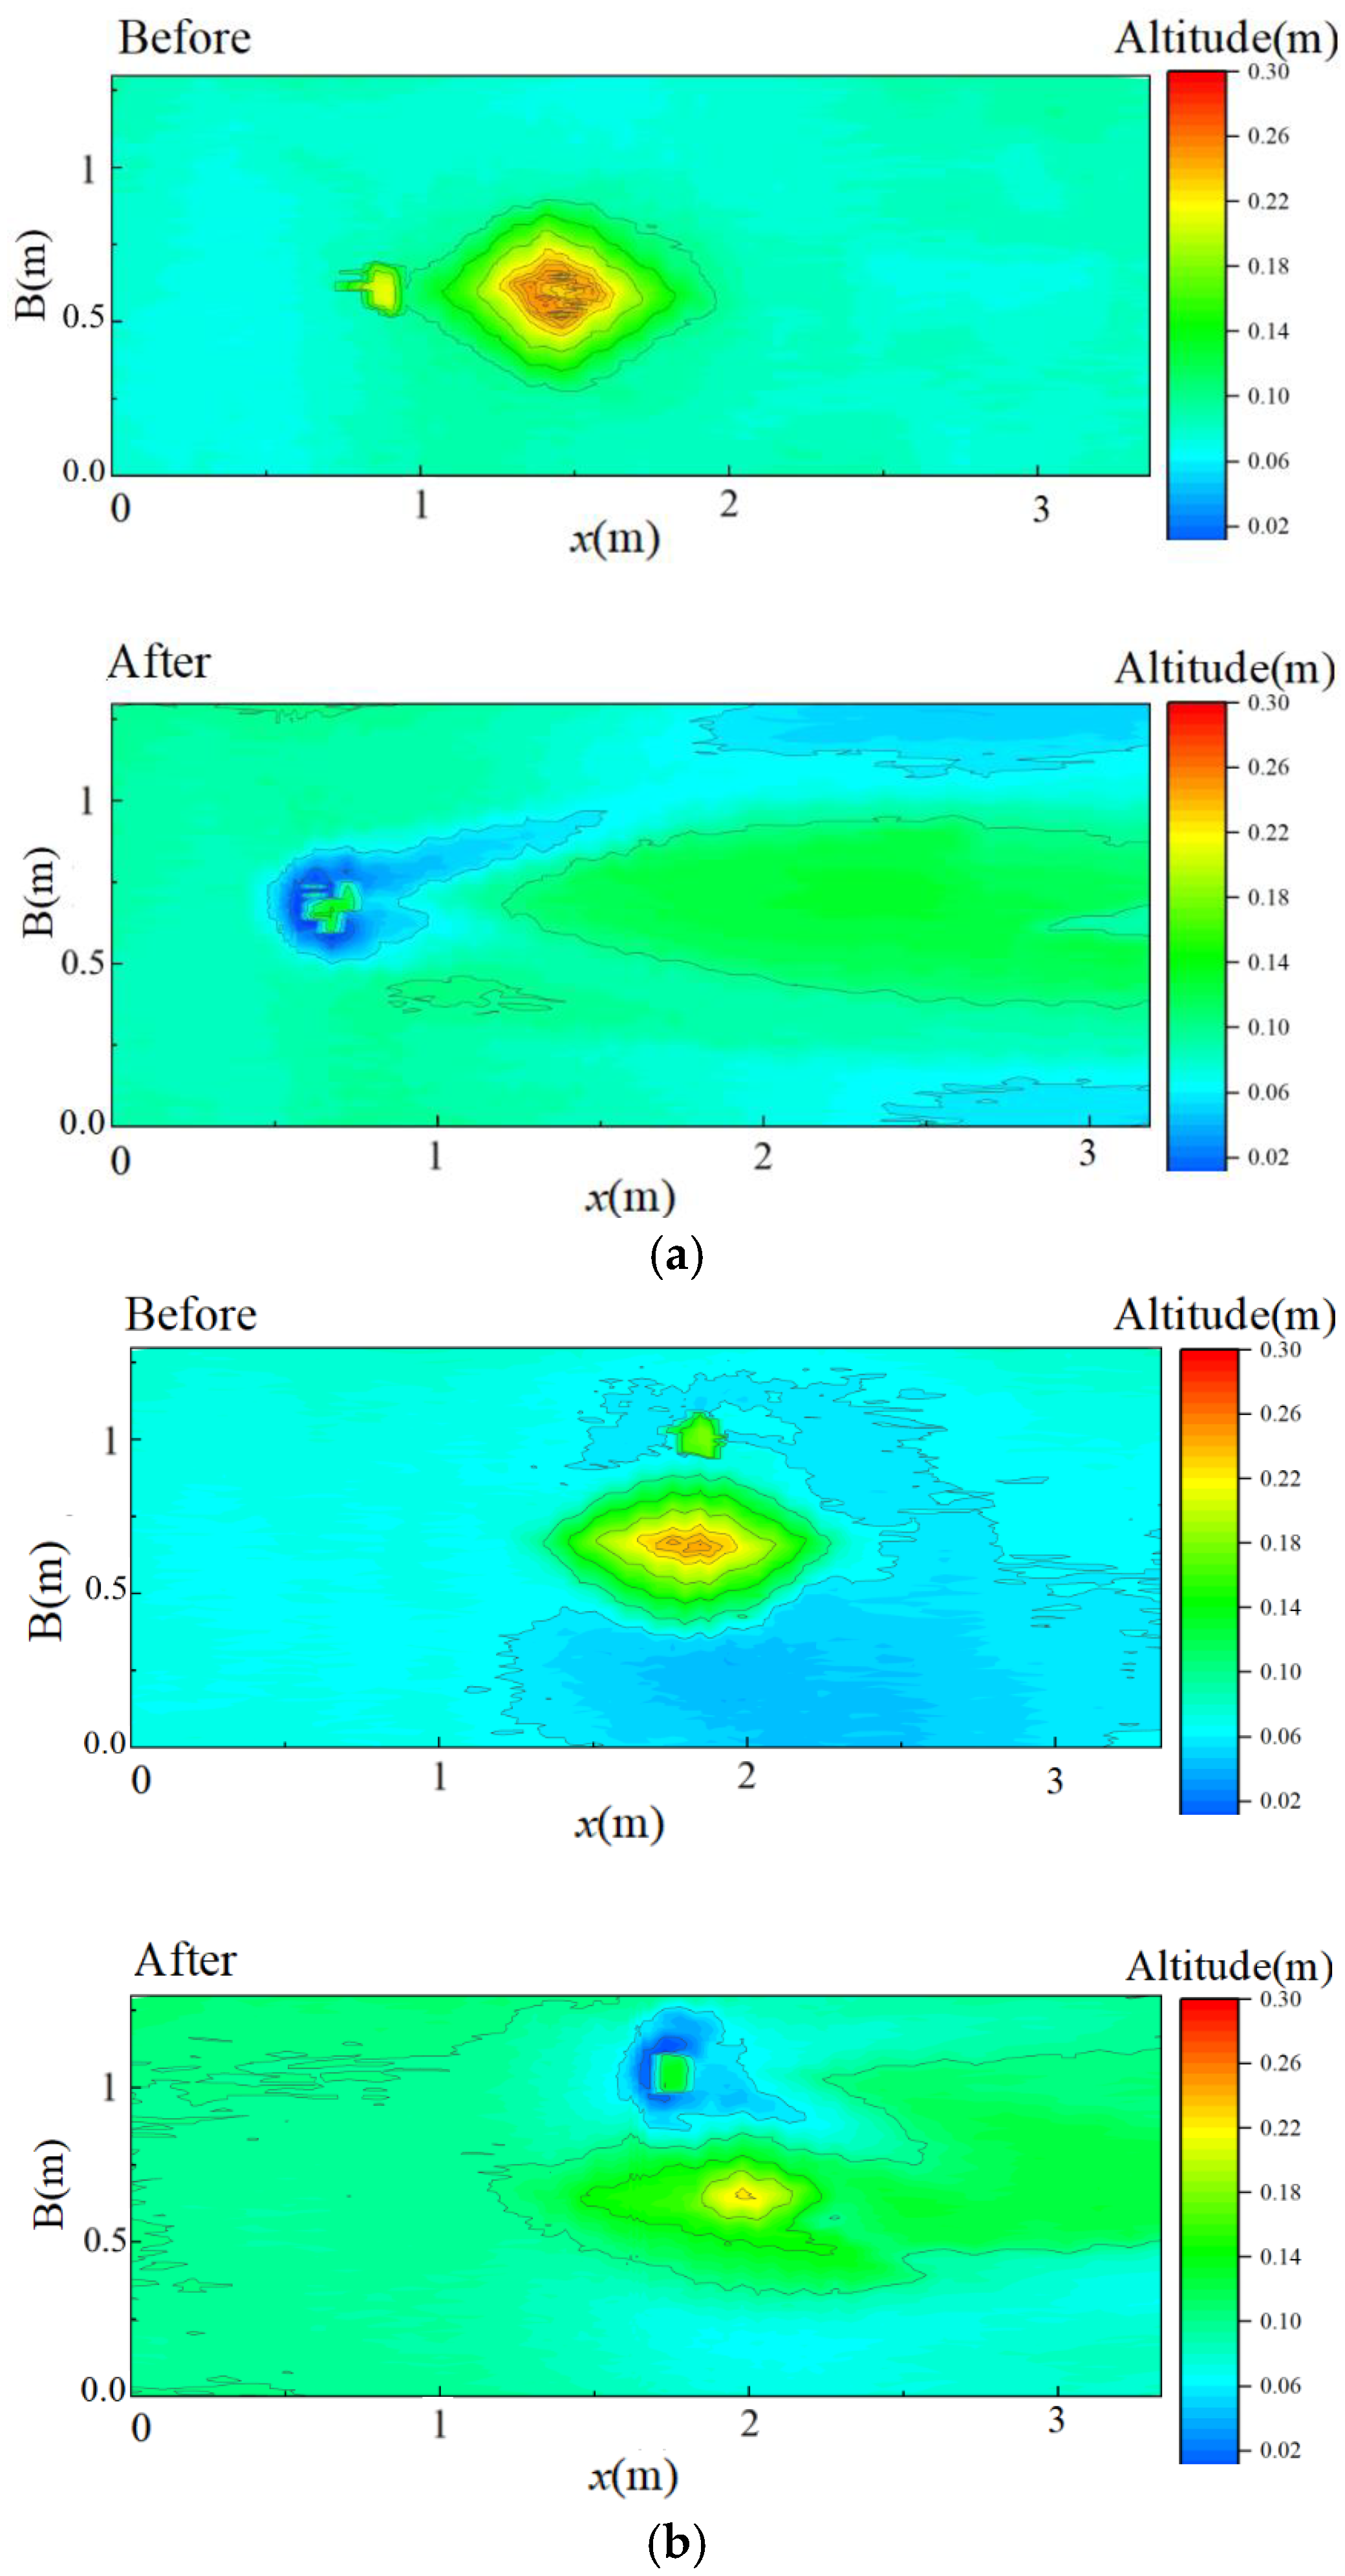
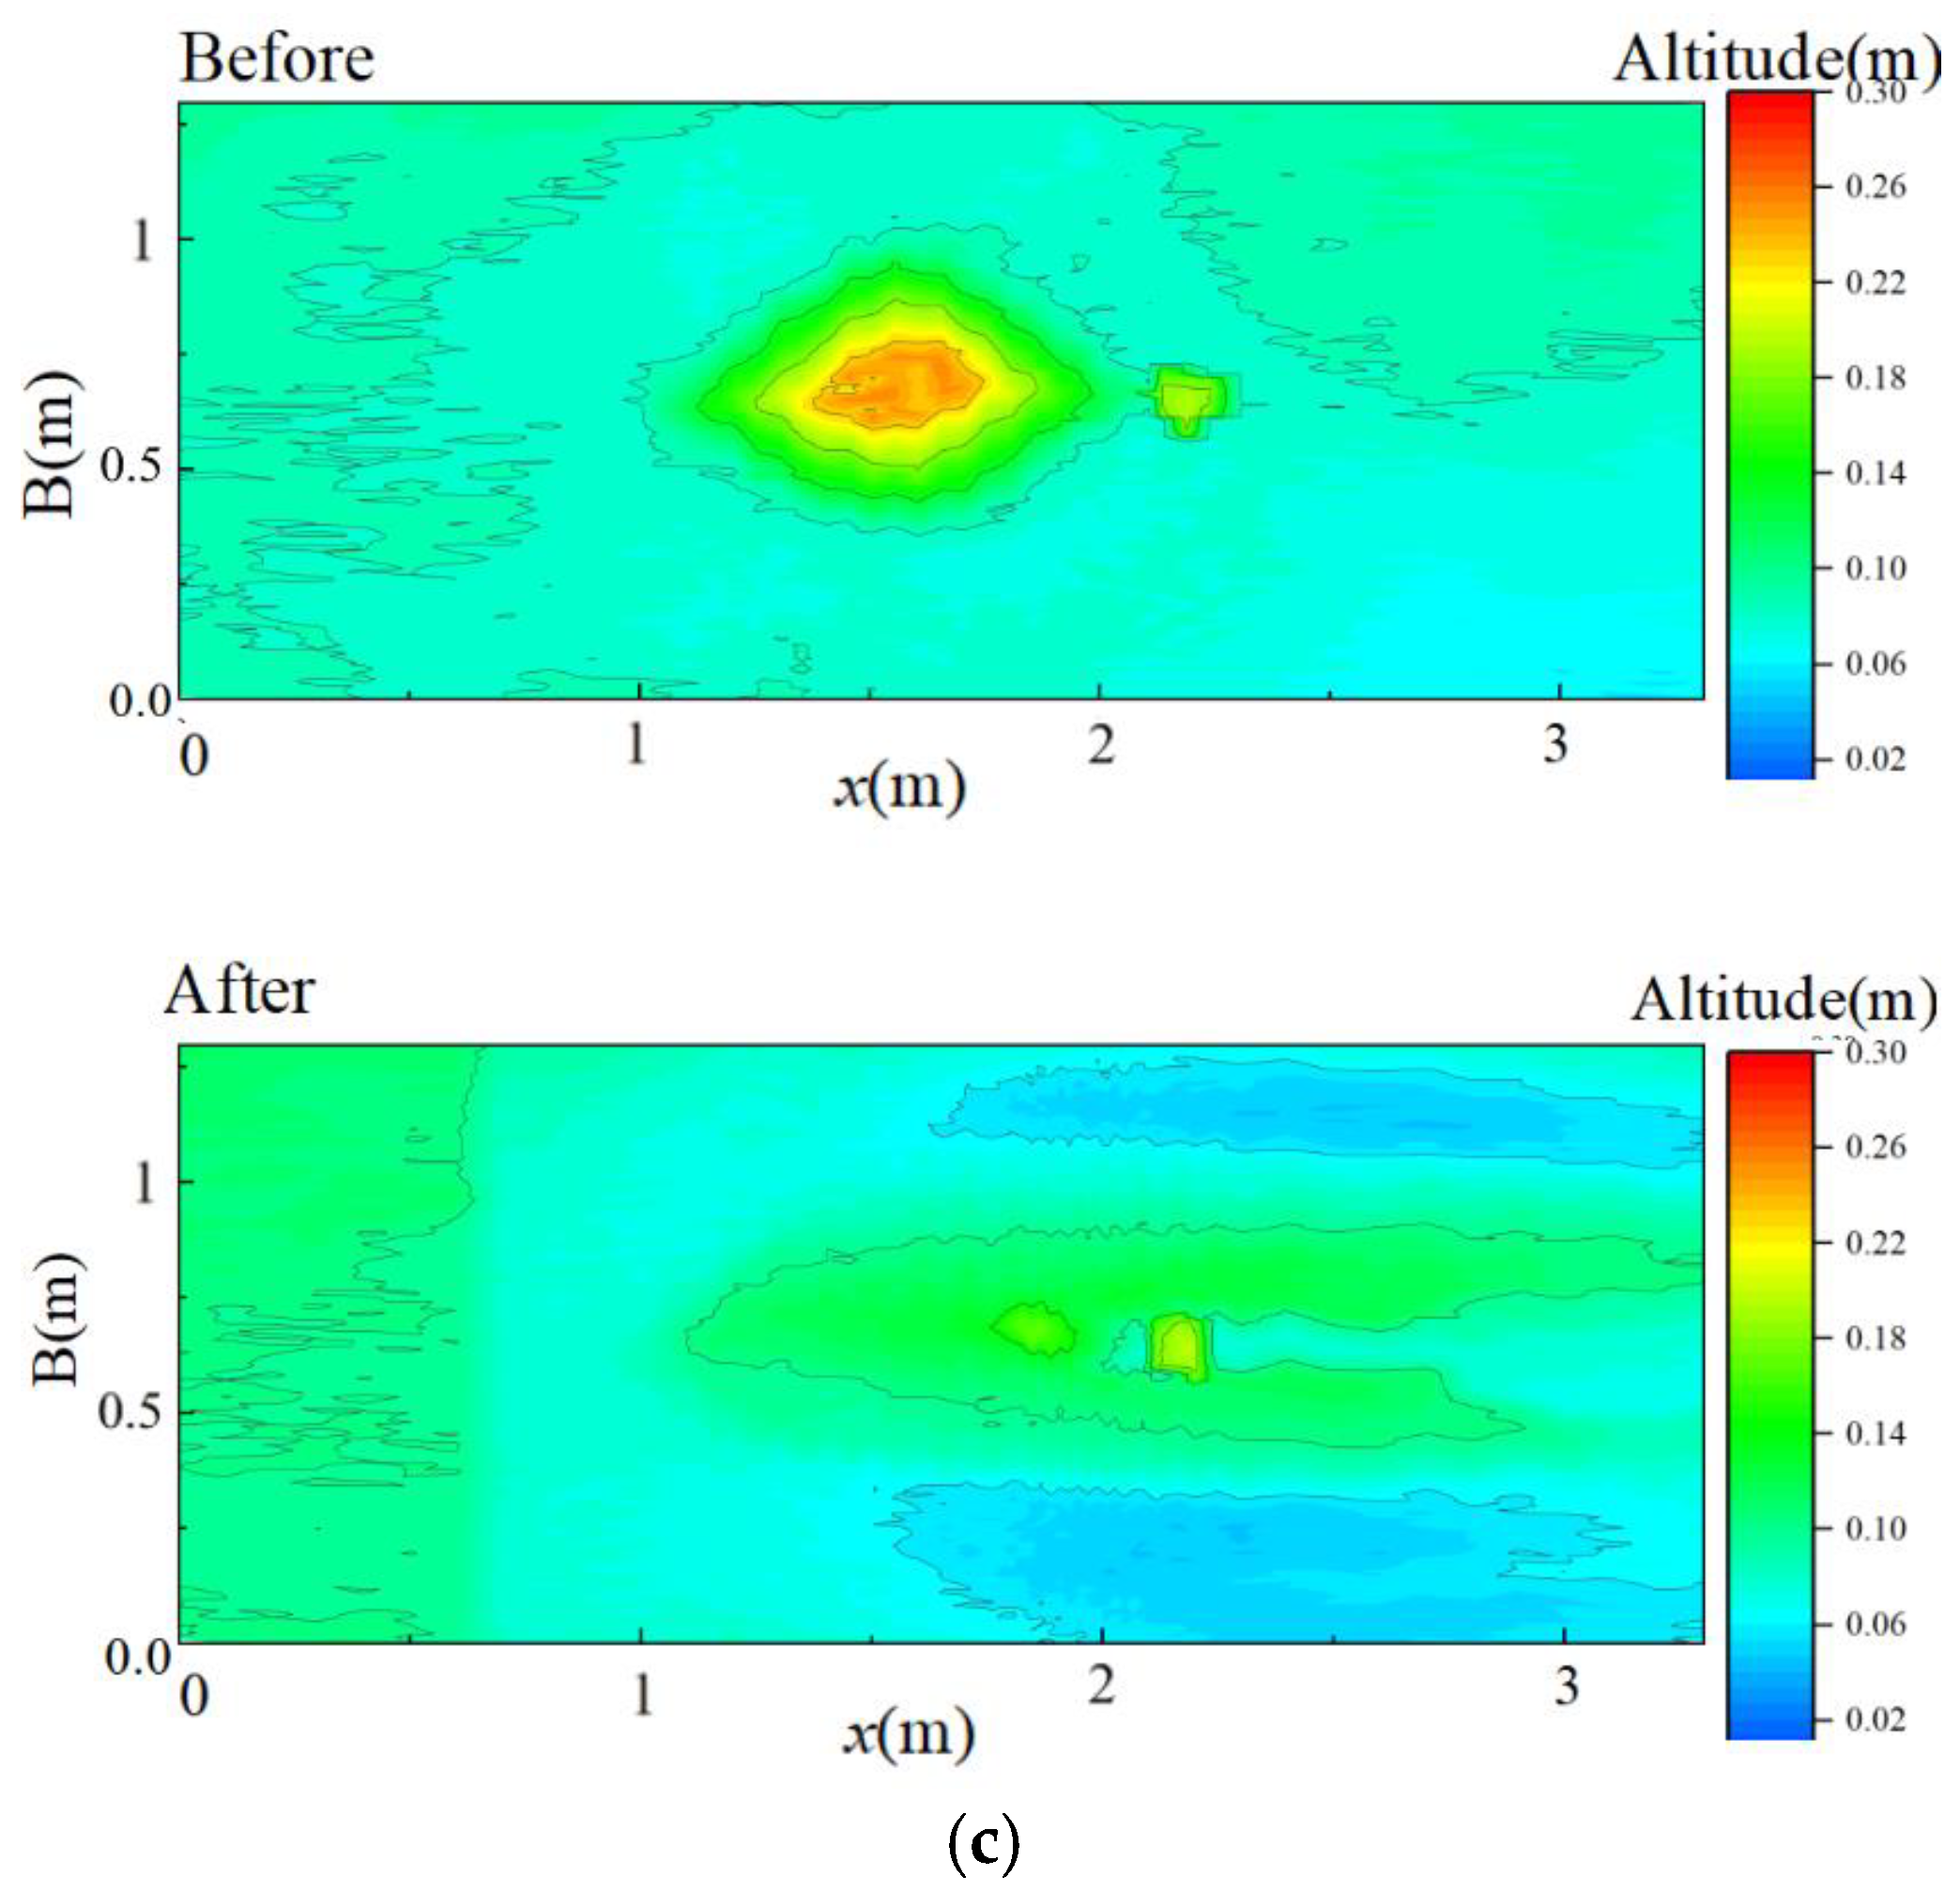
Figure 5 illustrates the influence of boulder position on riverbed morphology under the conditions of Q = 40 L/s, i = 0, and a boulder diameter of Ds = 15.2 cm. When the boulder was placed at the bar head, it obstructed the incoming flow, resulting in relatively uniform scouring. When the boulder was positioned at the midpoint of the left anabranch, sediment was diverted into the left anabranch, forming a wider bar with notable variations in bed elevation. When the boulder was located at the bar tail, sediment accumulated on both sides, causing the bar to extend downstream. These observations indicate that boulder position plays a key role in regulating the overall migration trend of the bar.
The maximum bar height varied with boulder position: 0.18 m at the head, 0.21 m at the midpoint, and 0.19 m at the tail. This non-linear pattern may be attributed to flow dispersion at the bar tail, which reduced peak deposition. As the boulder position shifted from the head to the midpoint to the tail, the plan-view bar morphology transitioned from a compact, concentrated form to a more laterally expanded and downstream-extended shape. This reflects the influence of boulder position on the flow field and its regulation of sedimentation patterns: boulders at the head promote local accumulation, boulders at the midpoint enhance lateral expansion, and boulders at the tail encourage downstream extension.
The bar area increased progressively as the boulder moved downstream: 0.5 m2 at the head, 0.7 m2 at the midpoint, and 0.9 m2 at the tail. This suggests a strong correlation between boulder position and downstream bar development. Bar volume followed a similar increasing trend: 0.06 m3 at the head, 0.12 m3 at the midpoint, and 0.15 m3 at the tail. This positive correlation indicates that as the boulder position shifts downstream, its influence on sedimentation transitions from localized to reach-scale, promoting overall deposition.
In summary, under identical hydraulic conditions, boulder position influences the flow field and local scour and deposition intensity, thereby controlling bar area, volume, and height. Increases in velocity amplify these effects, promoting accumulation at the bar head and downstream development of the entire bar structure. As the boulder moves from the head to the tail of the bar, both bar area and volume increase progressively, while bar height peaks at the midpoint position.
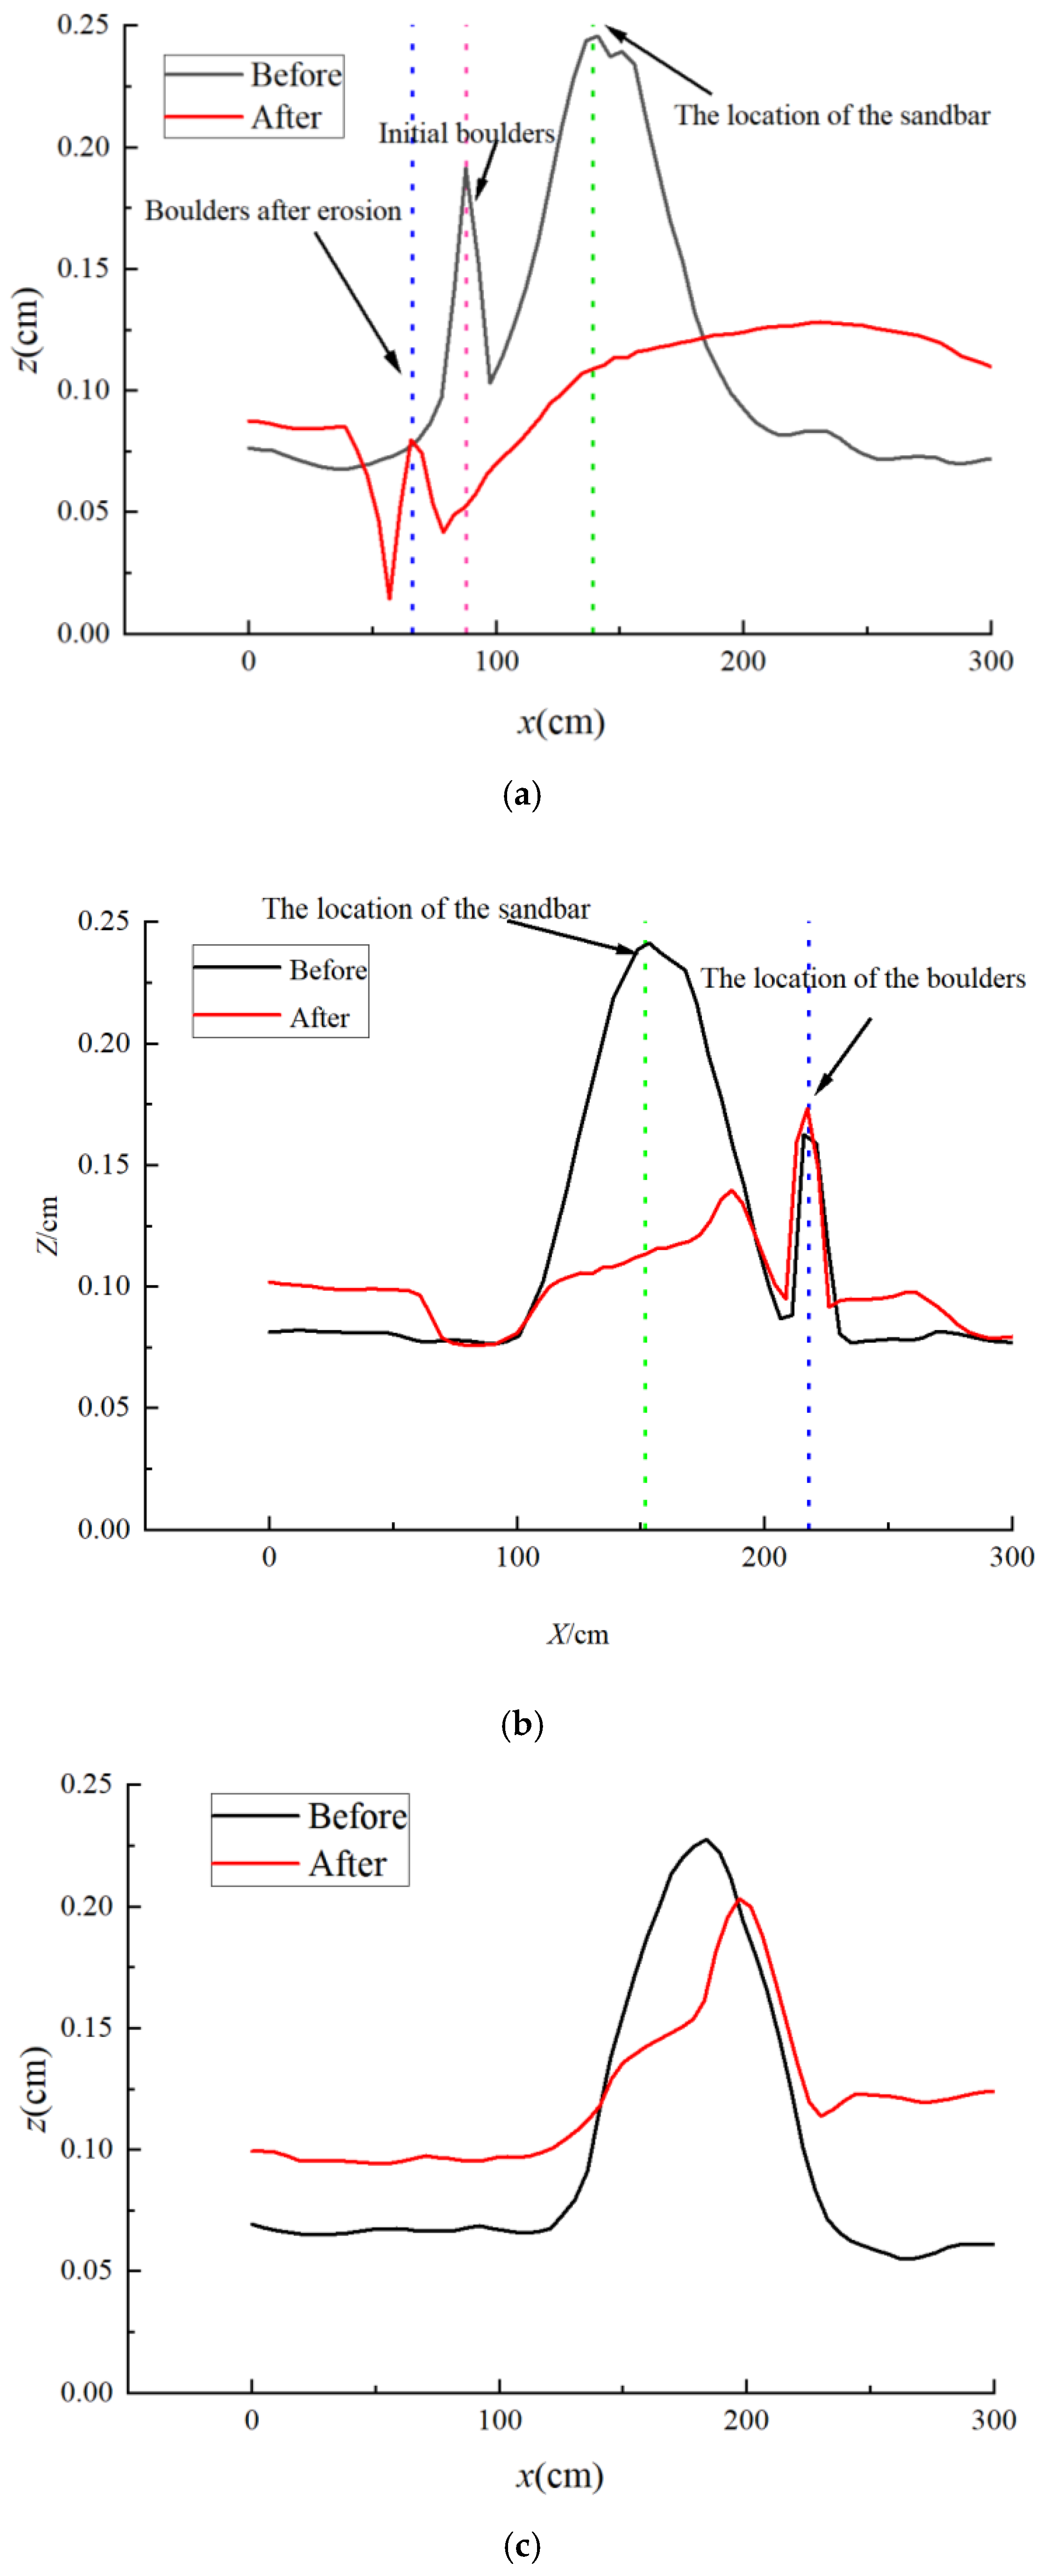
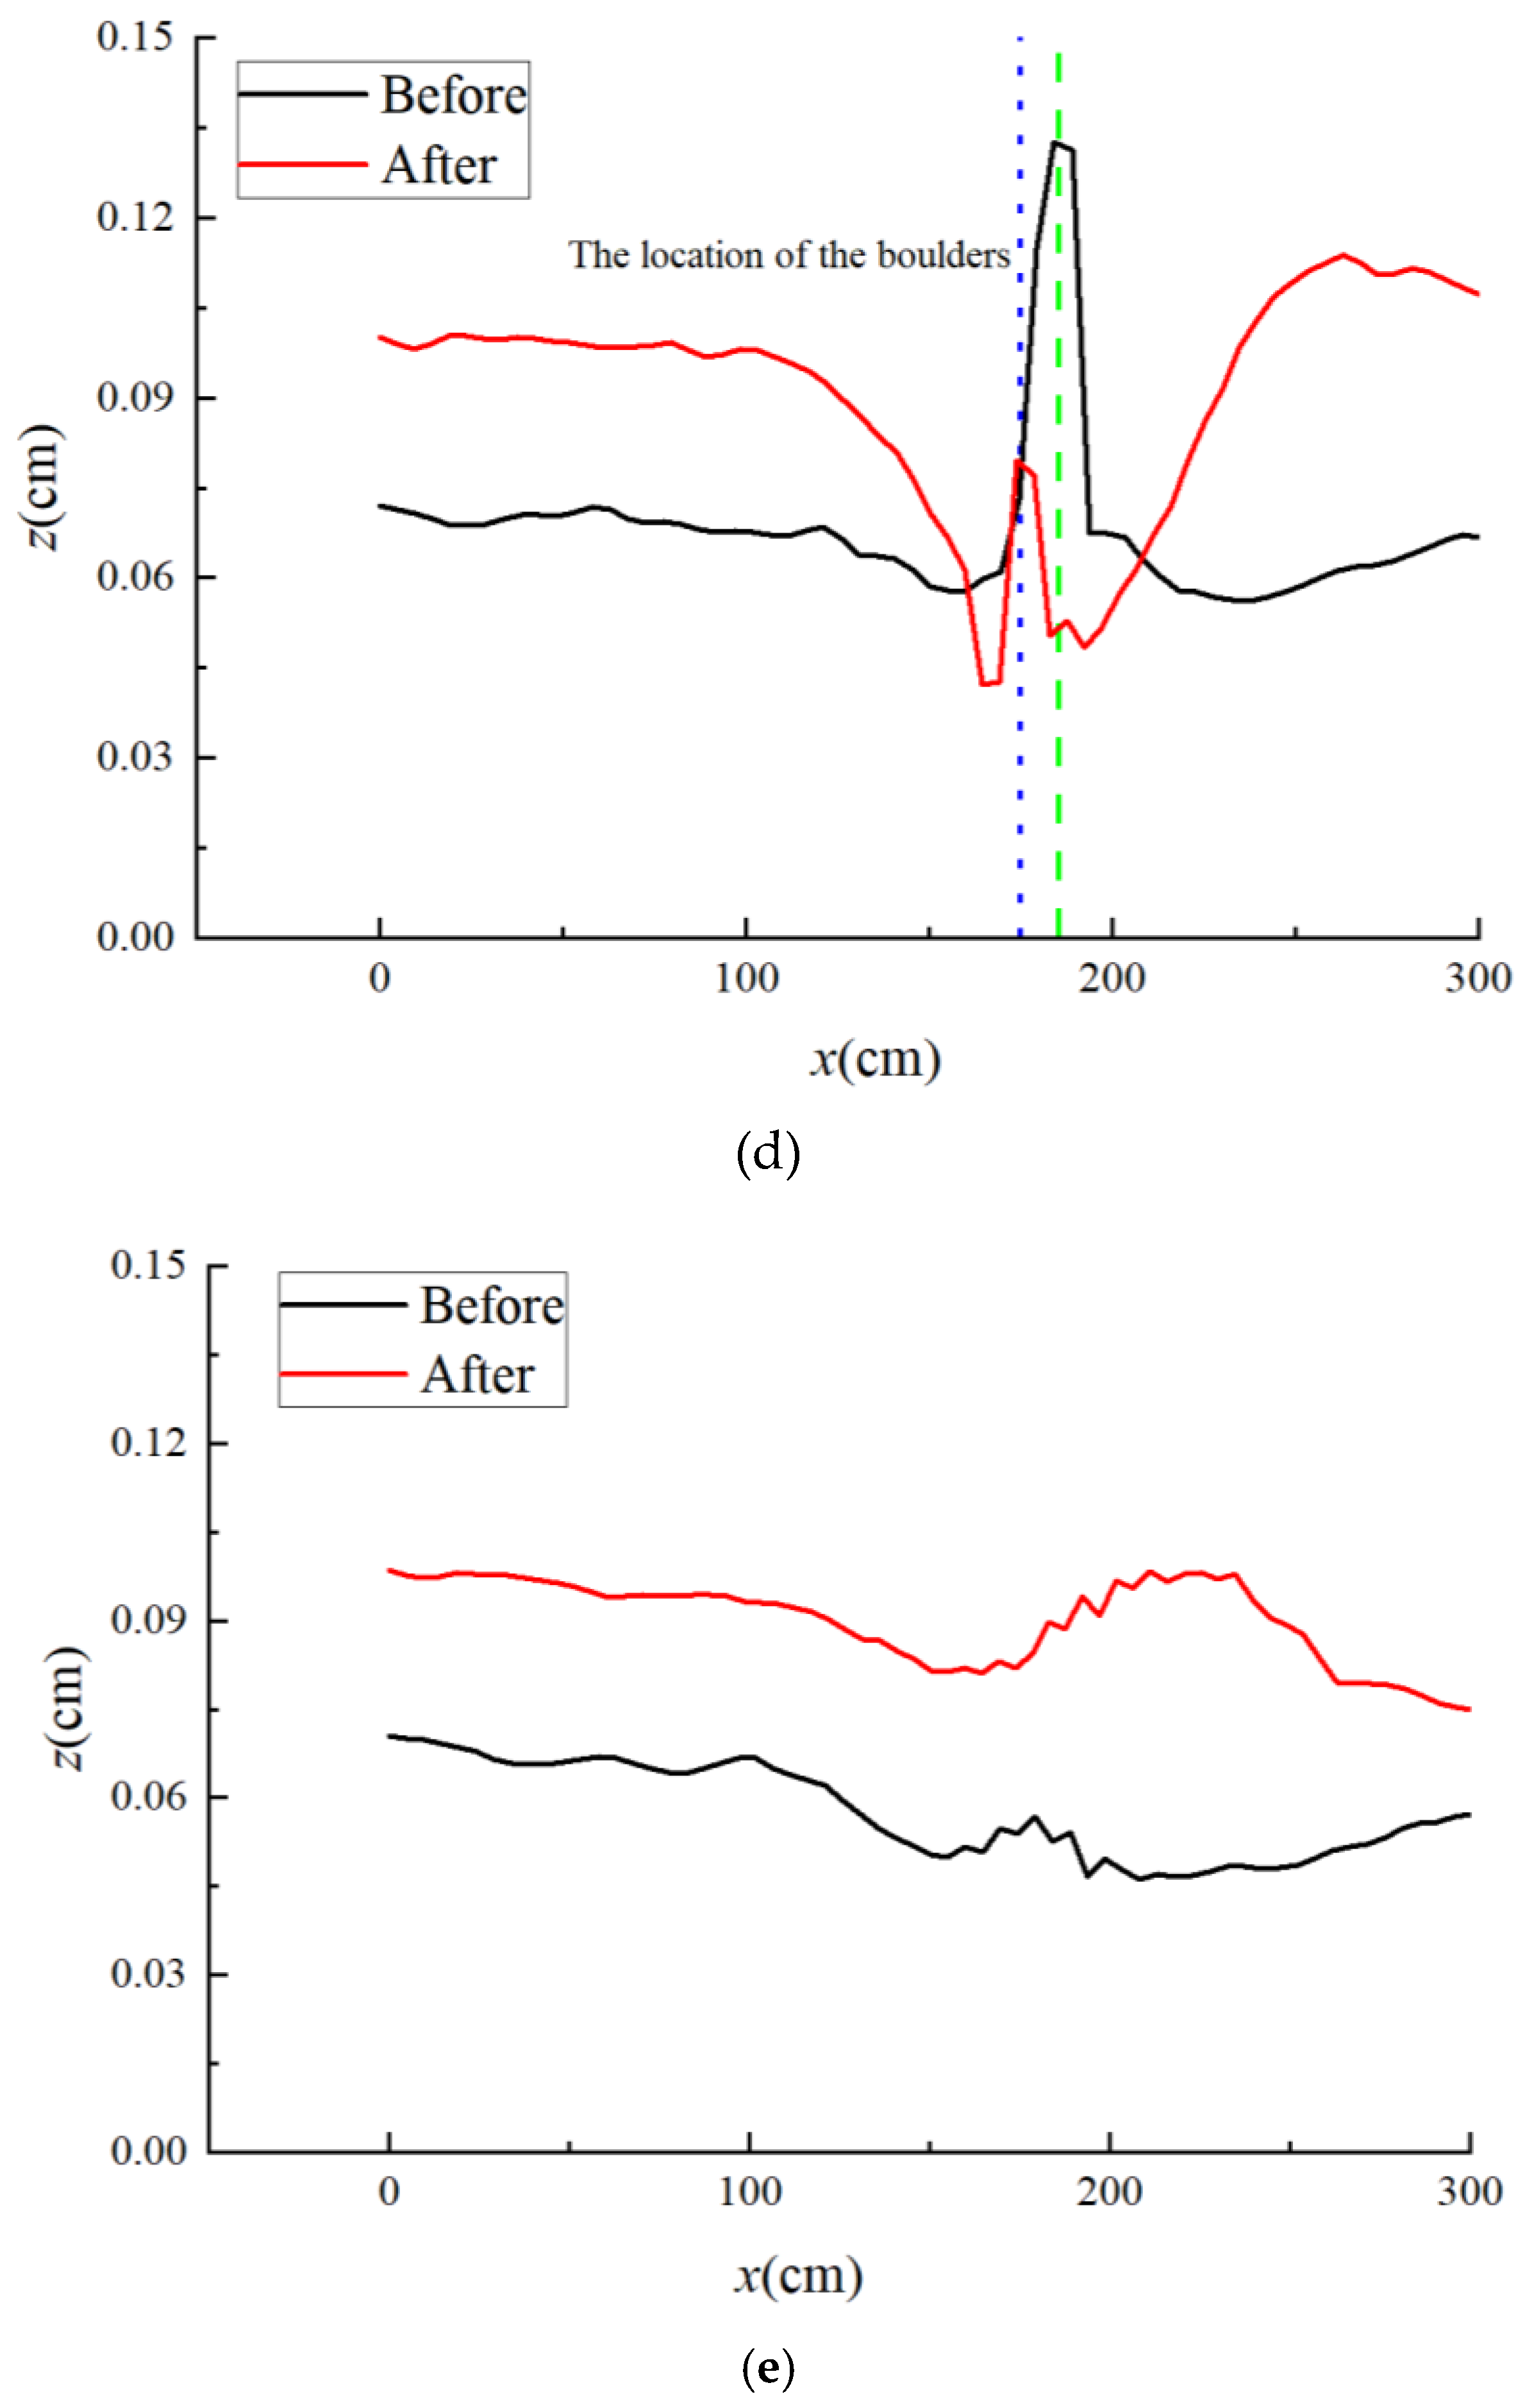
Figure 6 shows changes in riverbed elevation under constant-flow conditions (Q = 40 L/s, i = 0) with boulders placed at different position within the channel. Although bed elevation decreased significantly after scouring in all cases, the magnitude of this elevation drop exhibited distinct spatial differences depending on boulder location.
When the boulder was placed at the bar head (Ds = 15.2 cm), a small depression appeared near the centerline (X ≈ 50 cm) due to local flow diversion around the boulder. Bed elevation then gradually increased to Z ≈ 0.10 m at X ≈ 100 cm, before decreasing to Z ≈ 0.05 m further downstream. Overall, the bed elevation was lower than the initial state, indicating that the boulder induced localized scour at the bar head. At the bar tail, elevation increased to nearly 0.12 m, promoting downstream deposition. Compared to other boulder position, the scour effect was most pronounced when the boulder was at the bar head. This may be attributed to the higher hydraulic head from upstream, which increases turbulence and deepens the scour hole.
When the boulder was placed at the midpoint of the left anabranch, the scour depth at the boulder location reached approximately 0.06 m in the left anabranch, while deposition of about 0.06 m occurred at the bar tail. In the right anabranch, deposition of approximately 0.03 m was observed. This indicates that a boulder placed at the midpoint of the left anabranch indirectly affects the right anabranch, creating an asymmetric flow field that promotes lateral bank development, although the deposition intensity in the right anabranch is lower than that in the left anabranch.
When the boulder was placed at the bar tail, the scour hole around the boulder was less pronounced, with no significant bed lowering. Deposition at the tail was limited, approximately 0.02 m. This may be because the boulder at the bar tail partially blocks the flow, thereby reducing flow velocity at the tail and resulting in relatively shallow scour holes. Moreover, bar stability was enhanced under this configuration, and the boulder itself exhibited little displacement during scouring.
Thus, the spatial distribution of boulders in the channel significantly influences the scour and development characteristics of bars. The scouring effect is most pronounced when boulders are located at the bar head, while boulders in the side anabranch create asymmetric flow fields that affect both anabranches, and boulders at the bar tail have the least impact on bed elevation but may enhance bar stability.

3.2.3. Scour and Deposition Characteristics of Bars Under Different Boulder Protrusion Heights

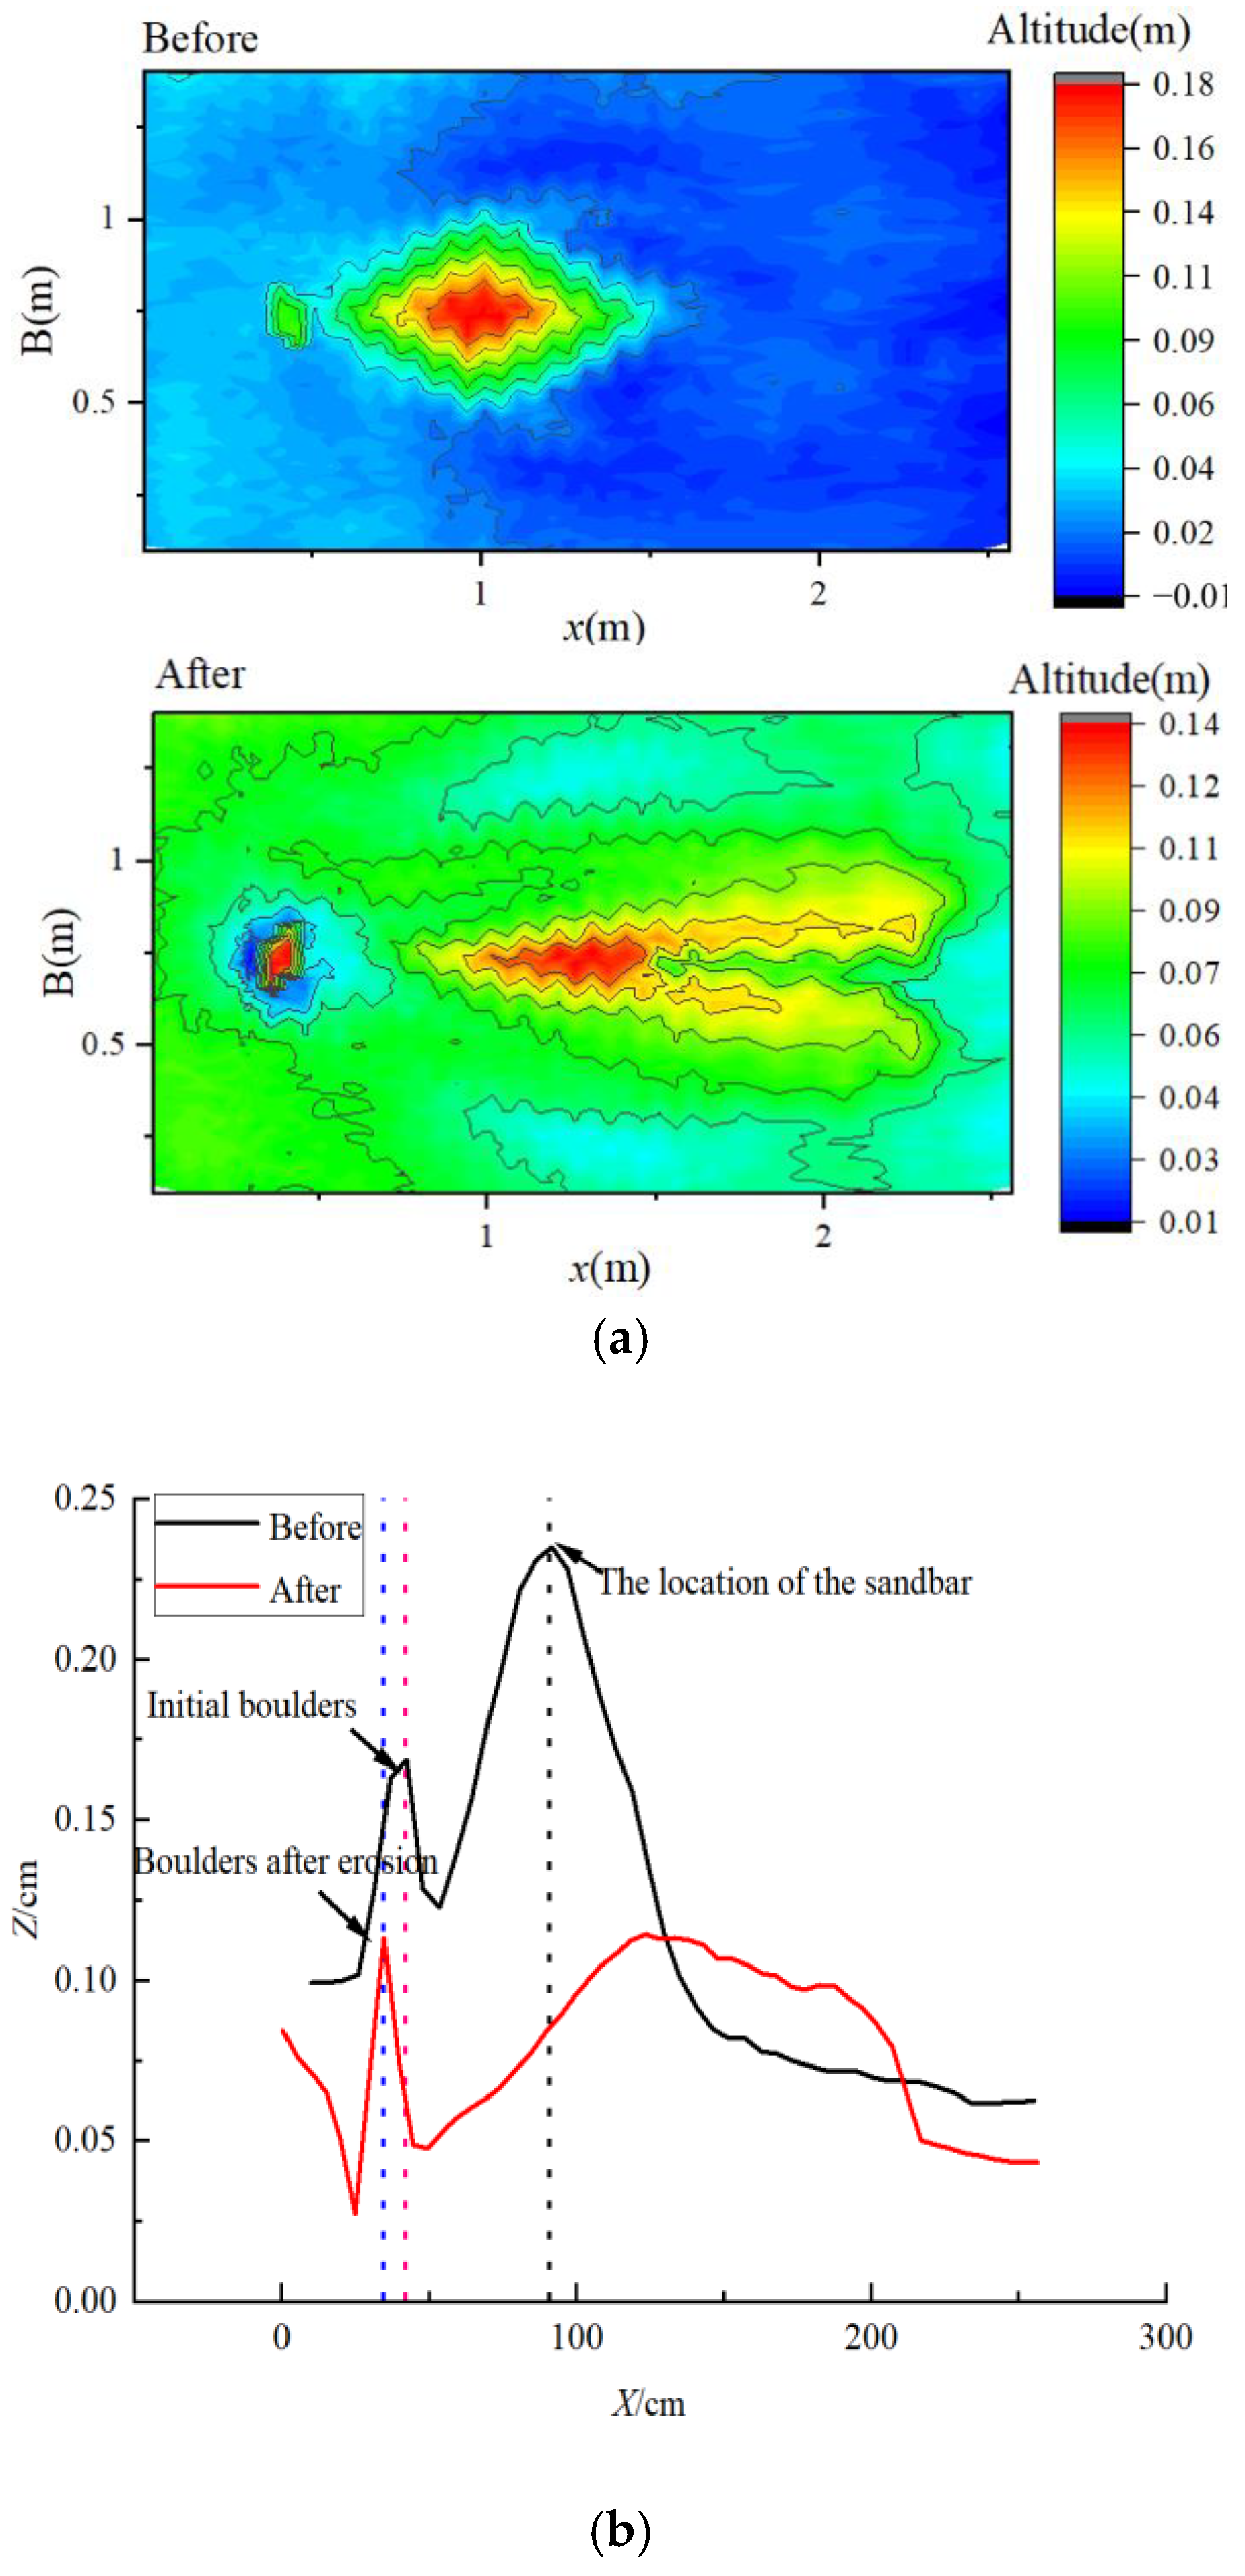
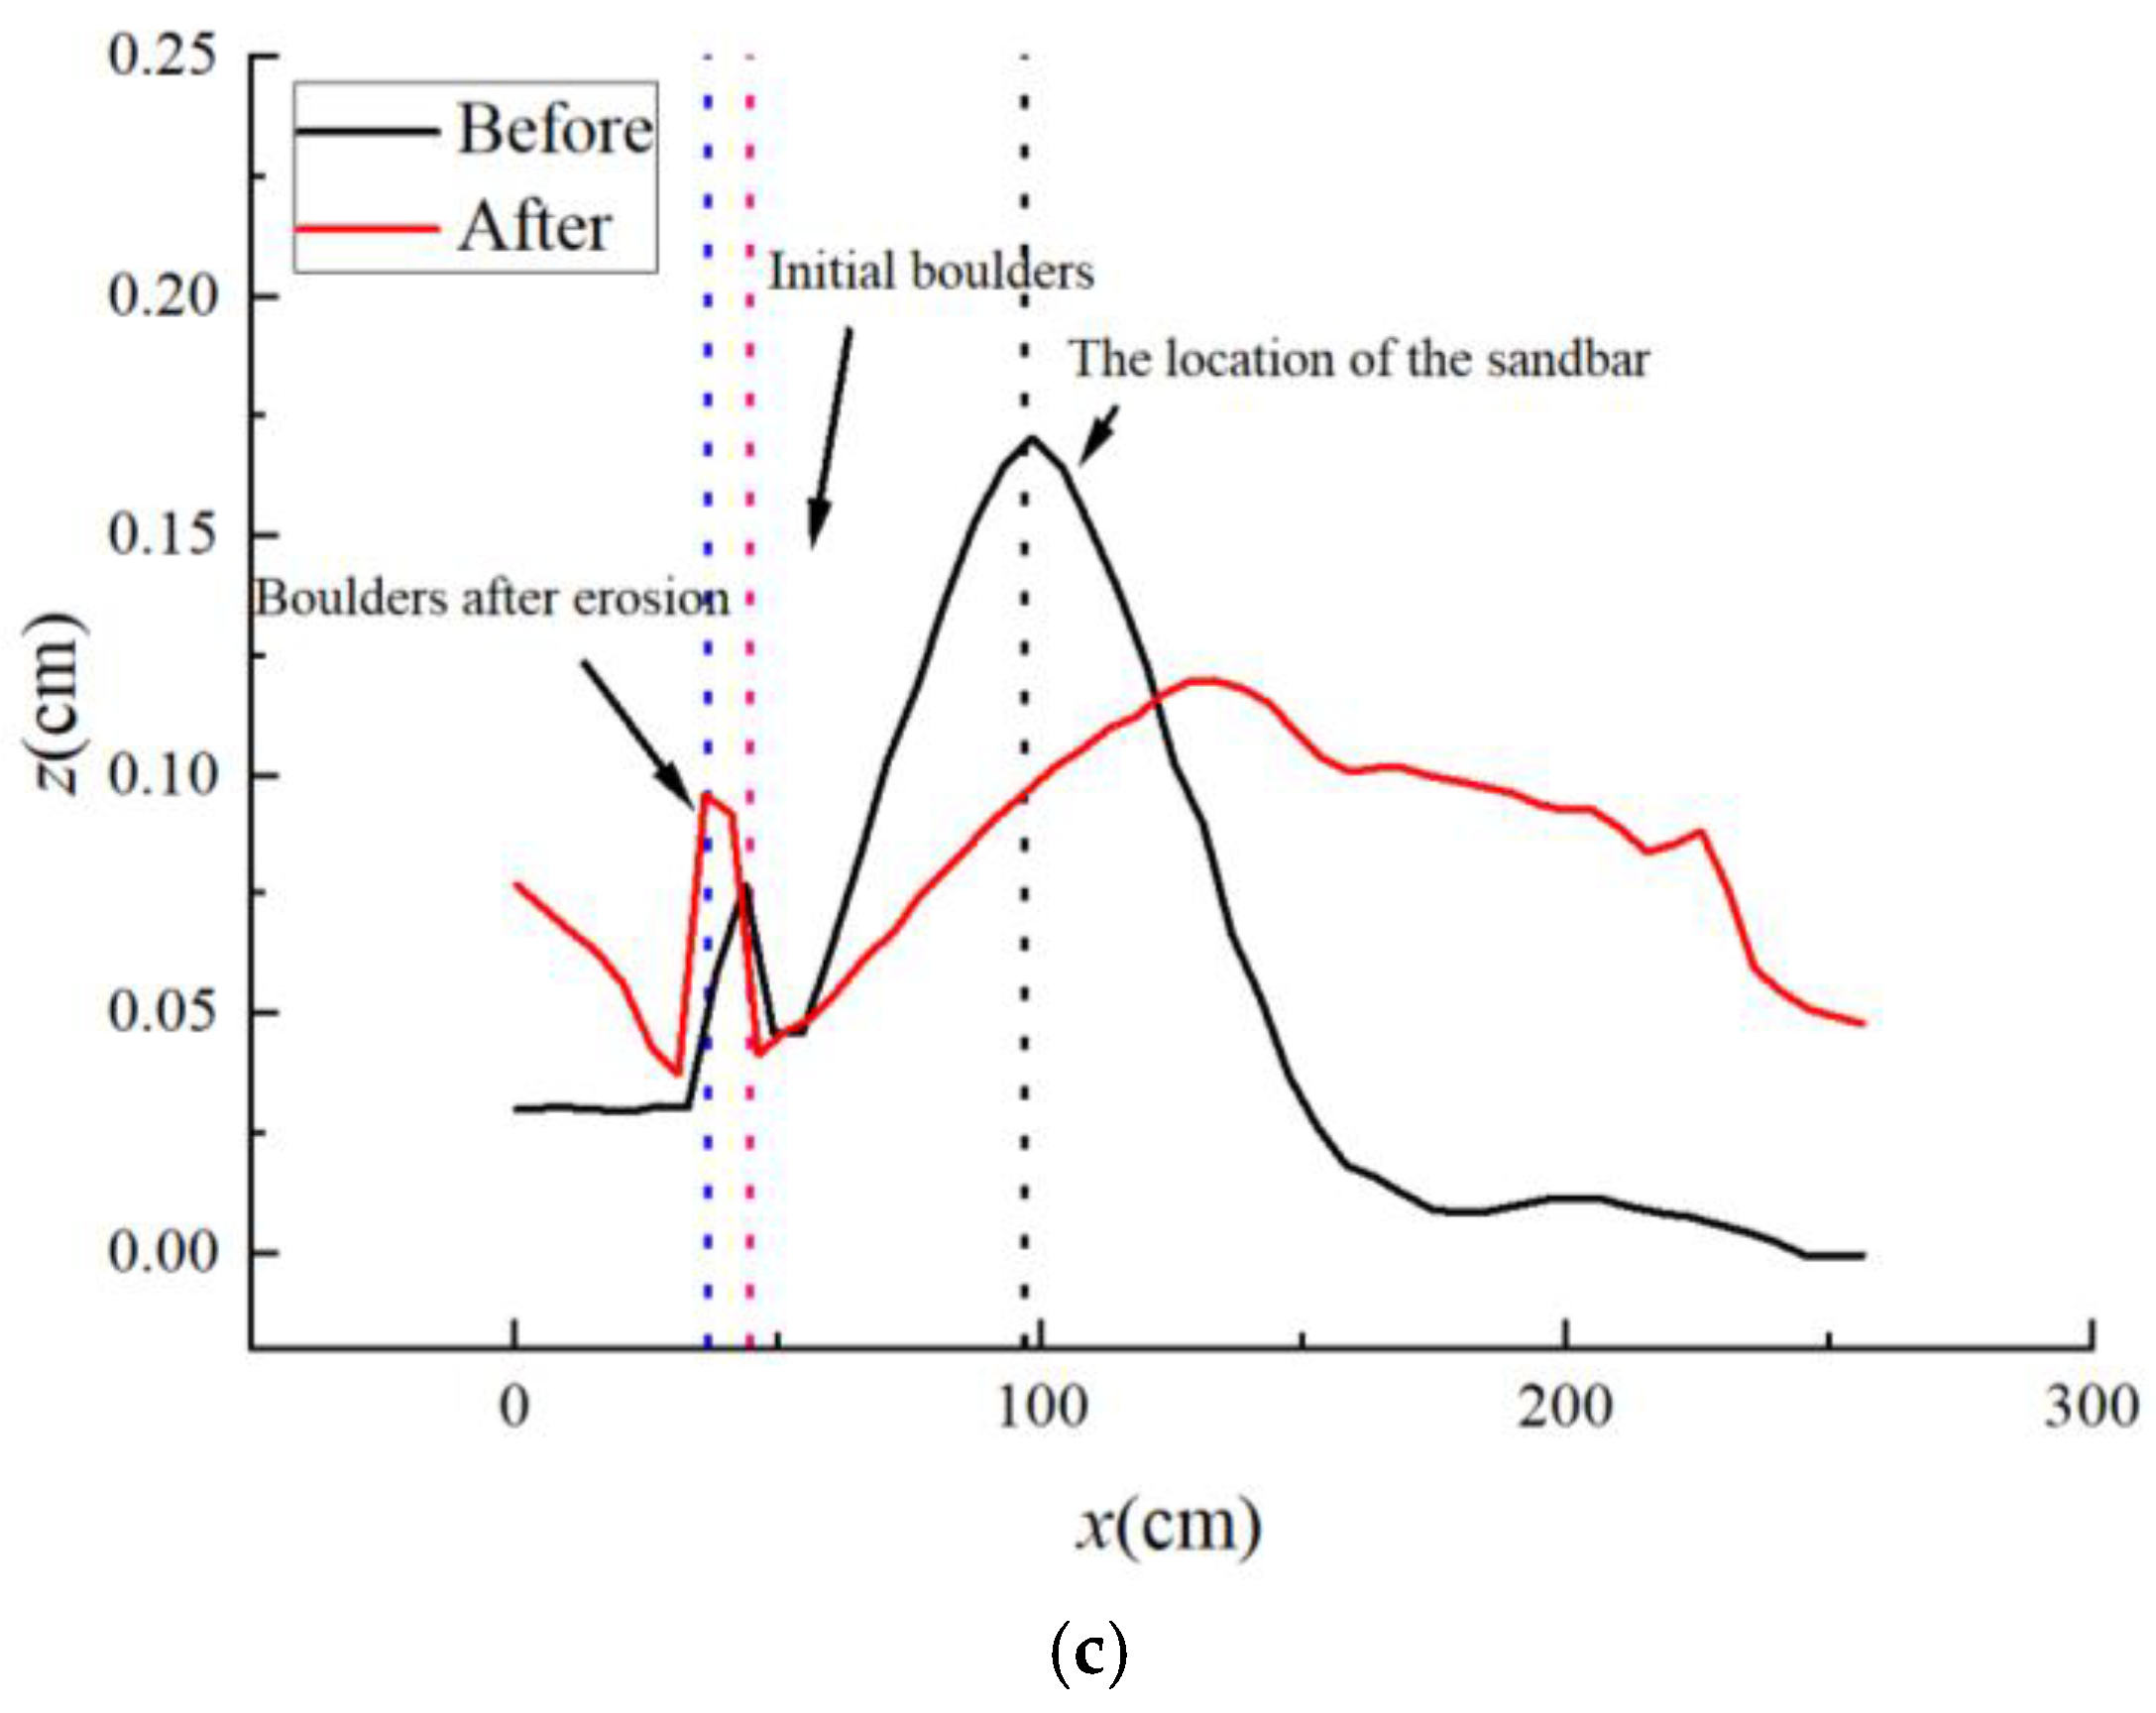
Figure 7 illustrates the effect of boulder protrusion height on riverbed morphology under constant-flow conditions (Q = 60 L/s, i = 2%) with the boulder position fixed at the bar head. After scouring, sediment accumulated locally around the boulder due to its blocking effect, with limited lateral diffusion. The elevation at the bar head exhibited a clear dependence on protrusion height: under Ds = 15.2 cm, the post-scour elevation was 0.12 m, compared to 0.14 m under Ds = 7.6 cm. Correspondingly, the elevation drop at the bar head was 13 cm under Ds = 15.2 cm, approximately 1.86 times the 7 cm drop observed under Ds = 7.6 cm. These results indicate that a greater protrusion height enhances local scour.
In addition to enhanced scour, a larger protrusion height also promoted boulder displacement. All boulders migrated downstream, with greater migration distances observed under Ds = 15.2 cm. This suggests that a higher protrusion height subjects the boulder to greater drag force, making it more susceptible to downstream movement. This finding is consistent with Zi [35], who reported that microtopography induces significant spatial variations in critical shear stress on gravel beds.
The morphological response of the bar further reflects the influence of protrusion height. Both bar area and volume increased with protrusion height. Under Ds = 7.6 cm, the post-scour bar area was approximately 0.4 m2, increasing to 0.8 m2 under Ds = 15.2 cm. Similarly, bar volume increased from 0.04 m3 under Ds = 7.6 cm to 0.10 m3 under Ds = 15.2 cm. These positive correlations suggest that a greater protrusion height promotes downstream sediment diffusion and bar expansion.
In summary, as the boulder protrusion height increased from 7.6 cm to 15.2 cm, the bar expanded laterally, with both area and volume increasing by approximately 100%, although much of the newly deposited area exhibited lower elevations. The greater protrusion height enhanced flow disturbance, thereby promoting downstream deposition and bar extension.

3.2.4. Morphological Changes of Boulder Bars After Scouring

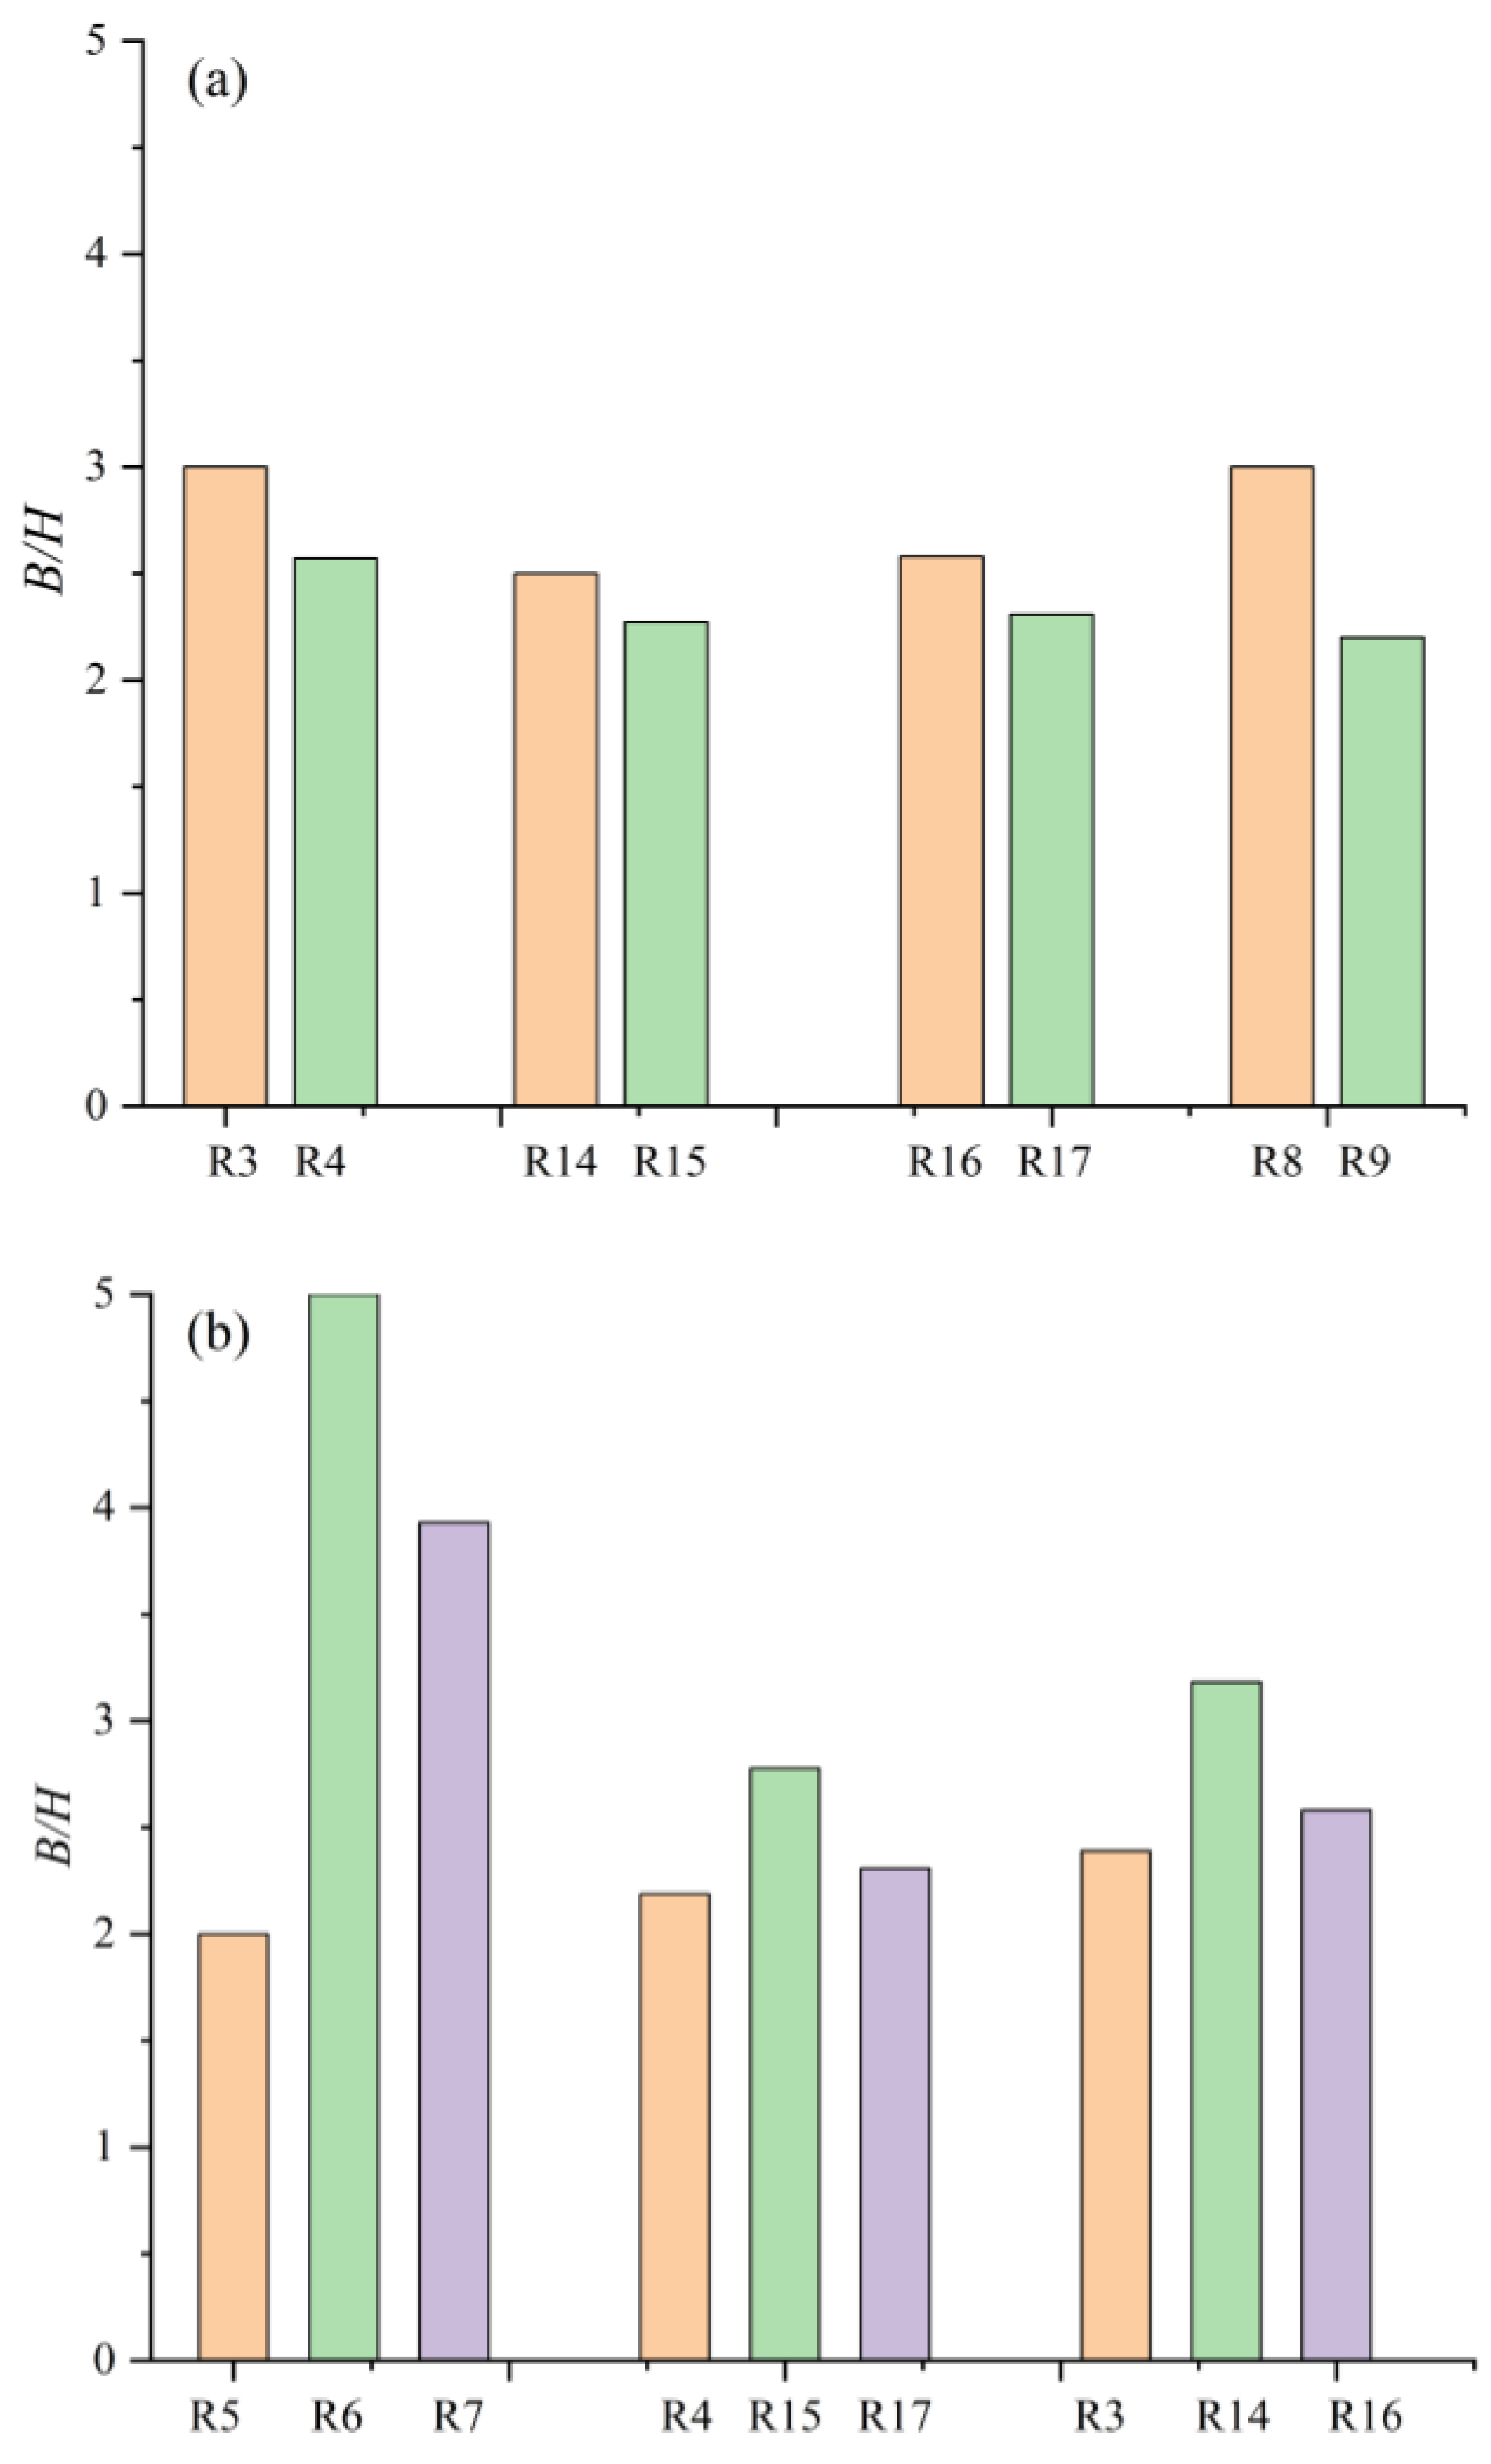
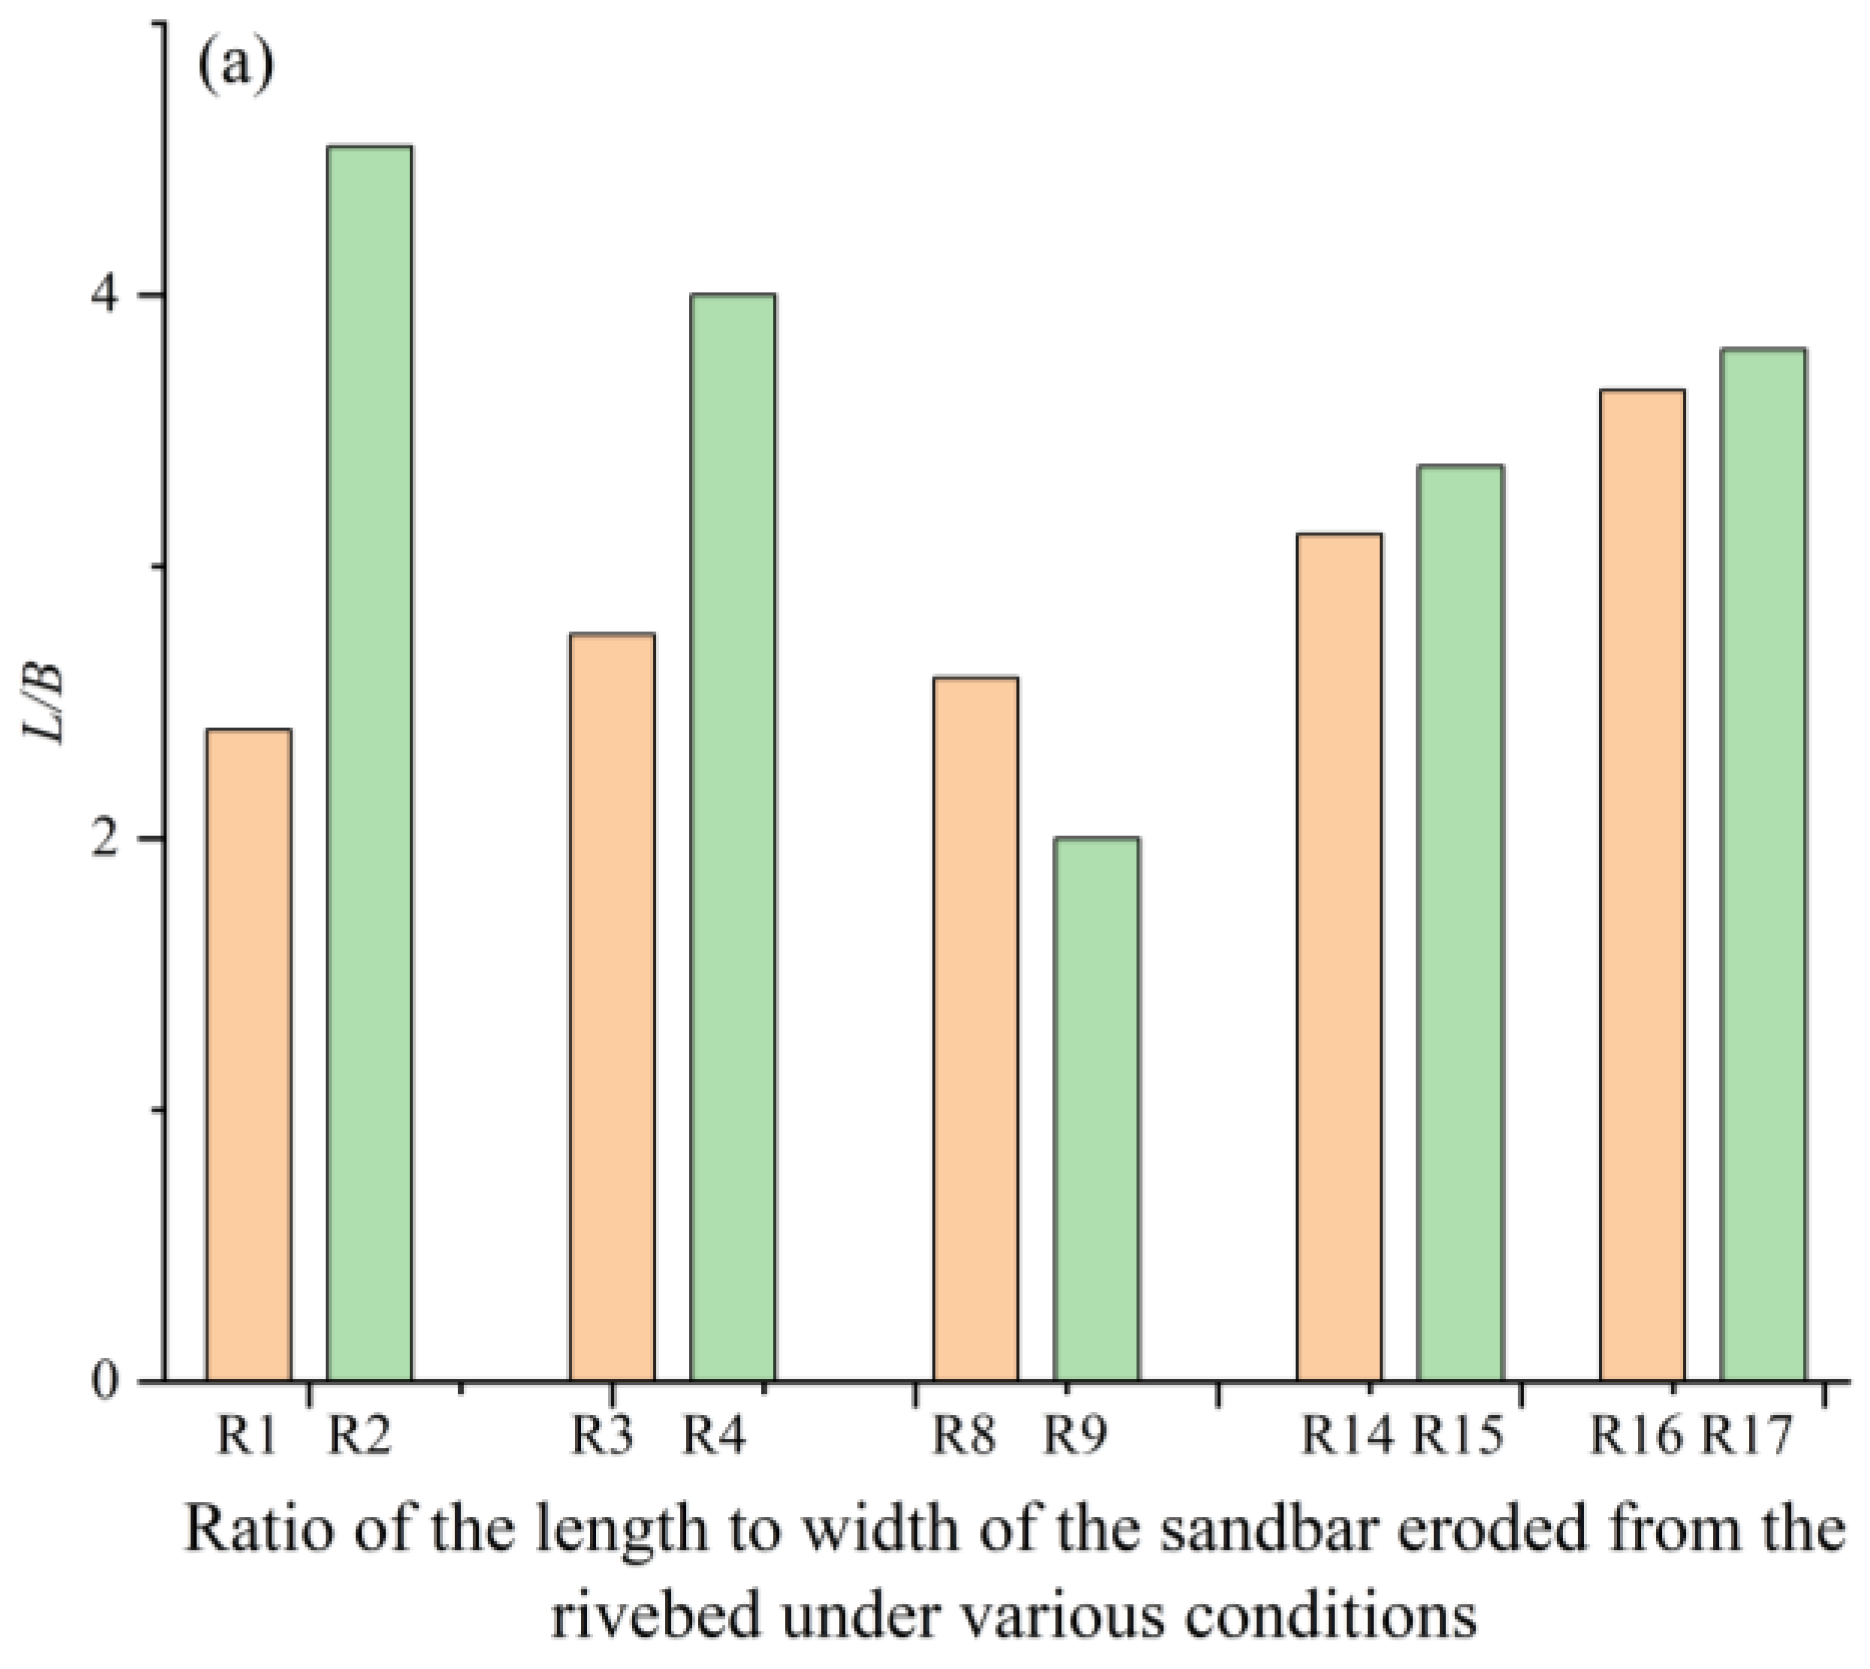
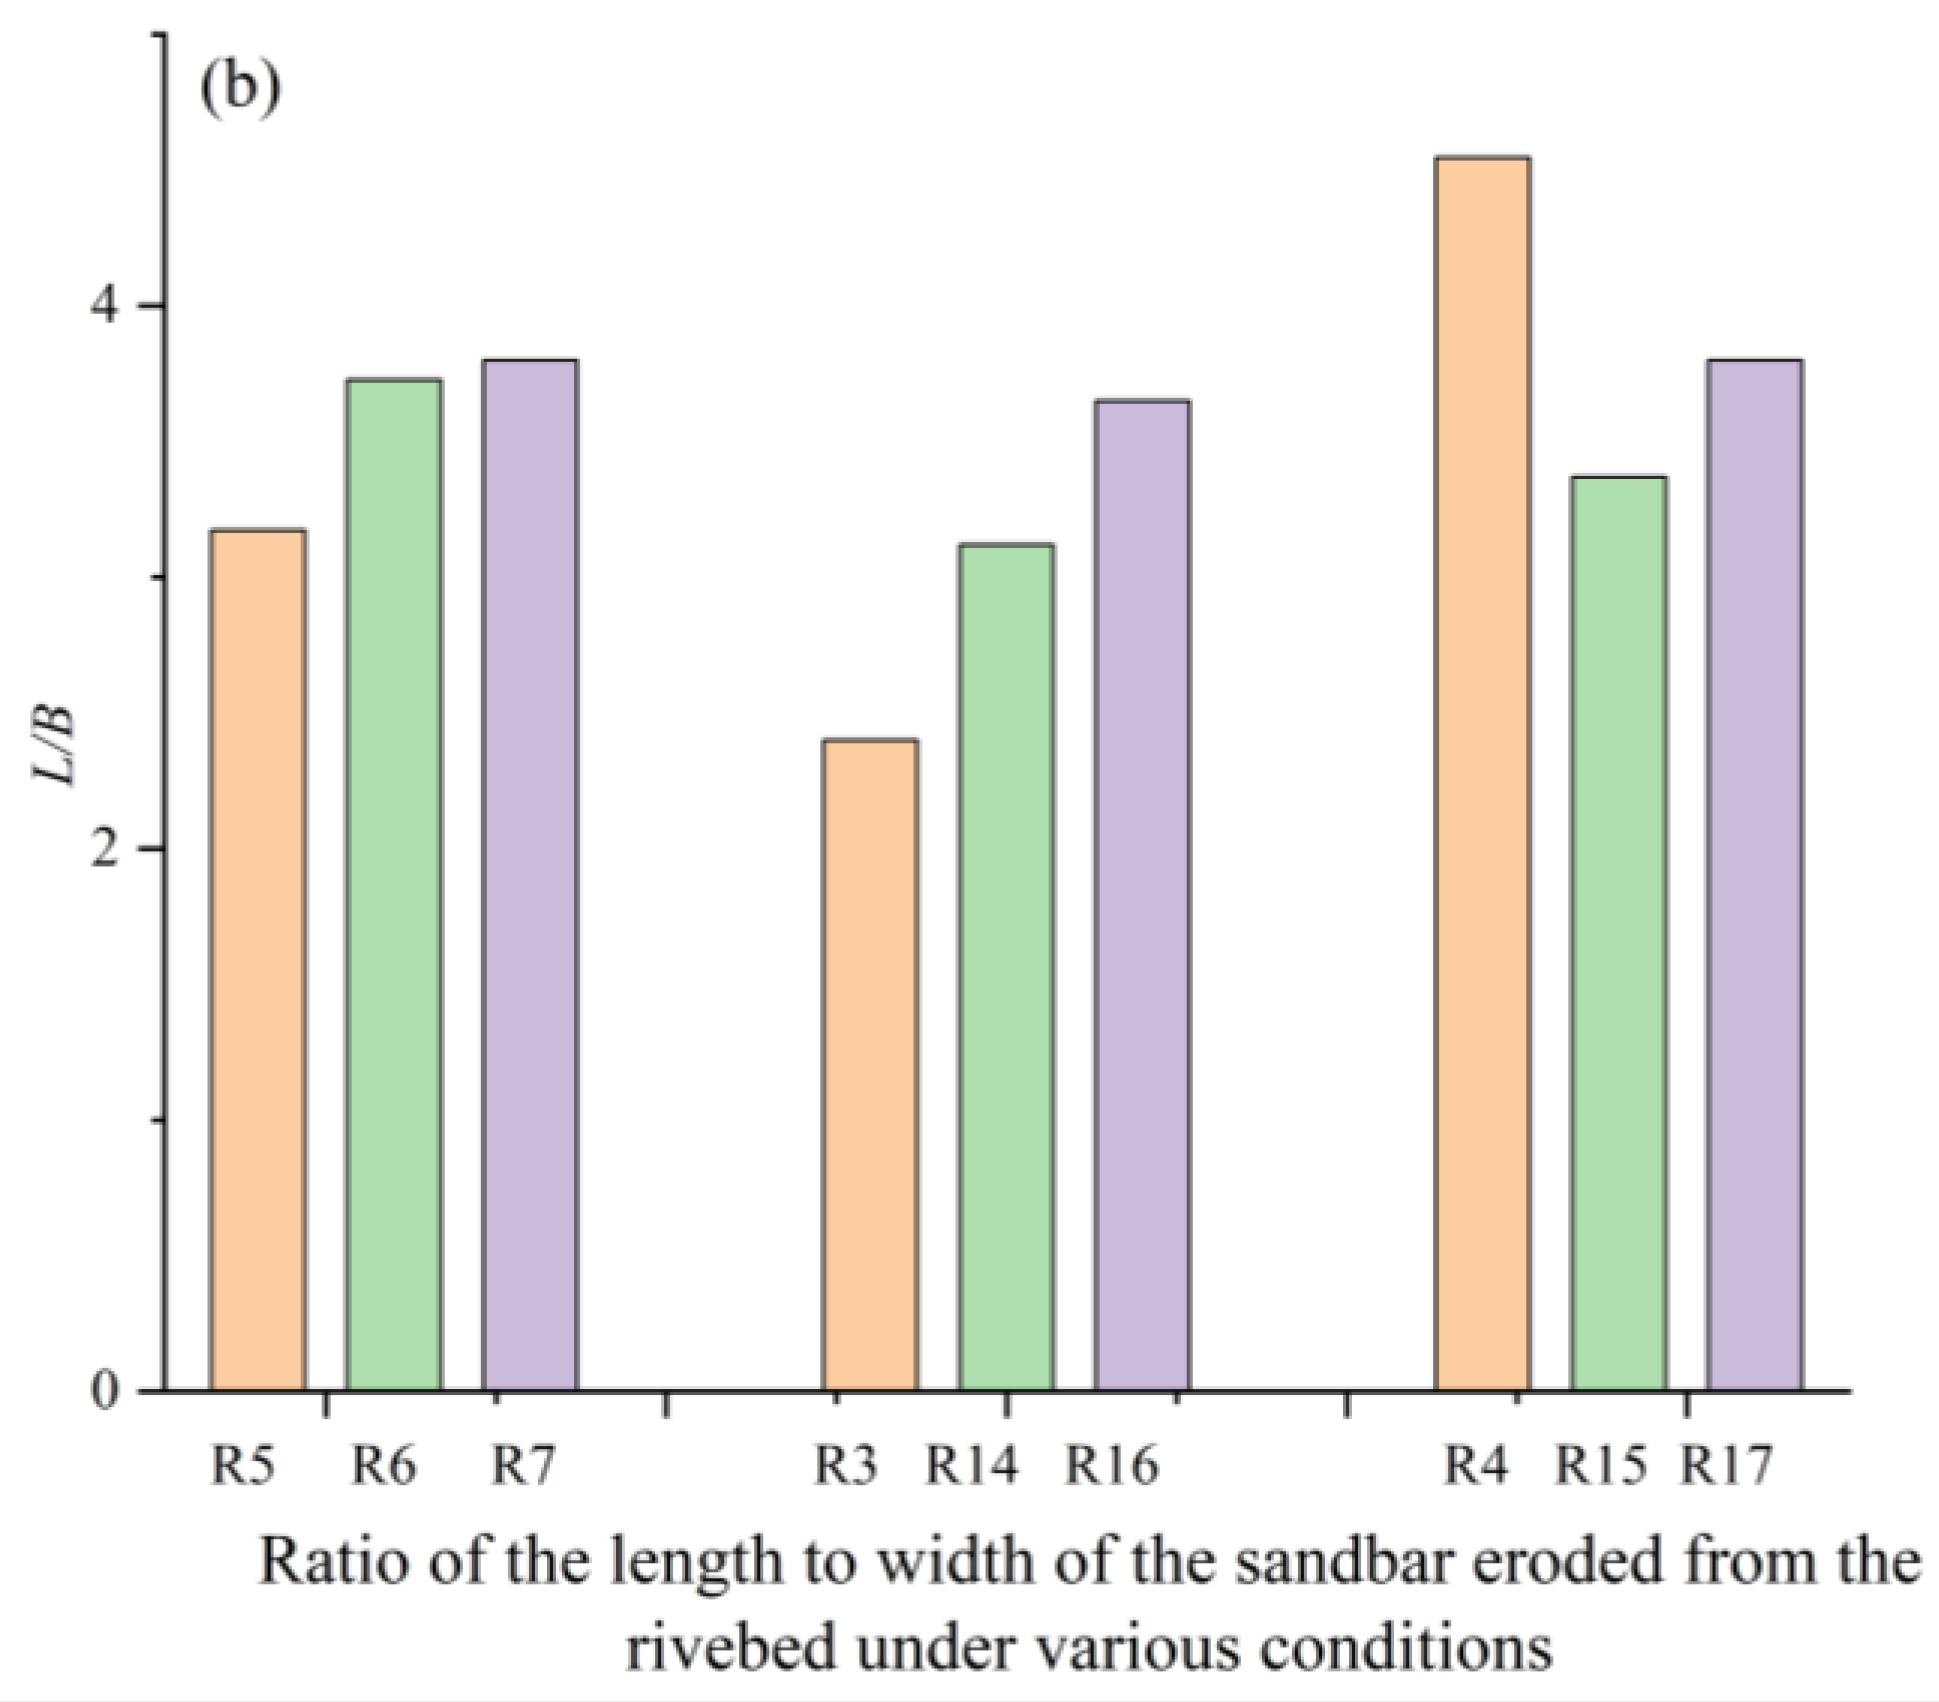
As shown in Figure 8, under the condition of Q = 60 L/s, the length-to-width ratio of the bar was the largest among all tested cases. This relatively high discharge, combined with the absence of boulders, resulted in effective scouring and pronounced bar development, thereby yielding the maximum length-to-width ratio.
Table 3 presents the boulder characteristics and the resulting changes in bar volume and height after scouring. Both bar volume and height increased with increasing boulder protrusion height and burial depth. A larger protrusion height and greater burial depth intensify the turbulent region and wake deposition zone generated by flow around the boulder. This enhances local scour while promoting sediment accumulation in the wake zone, ultimately leading to bar expansion and aggradation.
The influence of boulder position on bar morphology is also significant. When the boulder was placed in the side anabranch, the post-scour bar volume and height were substantially greater than when it was placed at the bar head or bar tail. This difference arises because the side anabranch is a flow division zone characterized by a high velocity gradient, where the boulder enhances water–sediment exchange and promotes substantial sediment accumulation. In contrast, the flow dynamics at the bar head (upstream scour zone) and bar tail (wake zone) differ markedly from those in the side anabranch; however, the magnitudes of sediment accumulation at these two position are comparable, resulting in similar post-scour heights.
Bar volume and height exhibit opposing correlations with flow discharge. Bar volume is positively correlated with flow discharge: higher discharges increase sediment transport capacity, leading to horizontal bar expansion and thickening. In contrast, bar height is negatively correlated with flow discharge: larger flows exert stronger shear stress on the bed, promoting vertical scour and lowering the overall bar elevation. This contrasting behavior reflects a pattern of “horizontal expansion and vertical reduction” in response to increasing flow discharge.
Table 4 summarizes the effects of discharge, boulder characteristics, and boulder position on bar elevation reduction. In the absence of boulders, increasing the discharge from 40 L/s to 60 L/s resulted in an elevation reduction of approximately 67%. Under the same discharge (Q = 60 L/s) with boulders placed at the bar head, increasing the protrusion height from 7.6 cm to 15.2 cm increased the elevation reduction by approximately 85.7%, which was substantially greater than the reduction observed in the boulder-free case (0.038 m under Q = 60 L/s). This indicates that highly exposed boulders intensify local turbulence and significantly enhance bed lowering at the bar head. Under the same discharge (Q = 40 L/s) and protrusion height (Ds = 15.2 cm), the elevation reduction varied with boulder position: it was greatest at the bar head (0.05 m), where the upstream scour zone develops; smaller at the midpoint of the left anabranch (0.02 m); and slightly higher at the bar tail (0.03 m) due to sediment deposition in the wake zone.

4. Discussion

4.1. Characteristics of the Boulder-Induced Scour Hole

As shown in Figure 9, the geometry of scour holes varies considerably with boulder position, discharge, and protrusion height. When the boulder is placed at the bar head under conditions of R9 (Ds = 7.6 cm and Q = 60 L/s), the scour hole exhibits the smallest width-to-depth ratio. The high discharge imparts greater kinetic energy to the incoming flow, and the presence of a bed slope further promotes deeper scour. These conditions typically produce deep, narrow scour holes characterized by a minimal width-to-depth ratio. In contrast, when the boulder is placed at the bar tail under conditions of R6 (Ds = 15.2 cm and Q = 40 L/s), the tail corresponds to a low-energy region with lower flow velocities. This observation is consistent with Qiu [36], who demonstrated that damage caused by jet dynamic pressure decreases with increasing impingement distance. Consequently, scouring is weak, and the scour hole remains extremely shallow. Additionally, scouring of the bar transports sediment downstream, providing sediment replenishment to the scour hole formed by flow obstruction around the boulder. As a result, the scour hole becomes relatively wide and shallow, leading to a larger width-to-depth ratio under such conditions. Periodic vortex sweeping intensifies sediment transport, resulting in the immediate formation of a deep local scour hole immediately downstream of the boulder. Further downstream (1D–1.5D), a recirculation zone with substantially diminished longitudinal flow velocity functions as a sediment trap: suspended and bedload sediments entrained by the main flow lose their transport capacity and accumulate continuously, thereby driving the formation of boulder-associated sand bars. A larger protrusion height Ds corresponds to a greater upstream-facing projected area of the boulder and higher scour intensity at the boulder leading edge. This both amplifies local scouring and elevates the sediment trapping efficiency in the wake zone, which accounts for the observed increase in sand bar volume.
Furthermore, boulder protrusion height also influences scour hole geometry. As protrusion height increases, the boulder is subjected to greater hydrodynamic forces, resulting in increased scour depth. However, sediment transport capacity on both sides of the boulder decreases simultaneously, leading to a reduction in the width-to-depth ratio of the scour hole.
As E (relative submergence) decreases, the obstruction effect on the incident flow becomes more pronounced, the horseshoe vortex on the upstream face intensifies, and the wake recirculation downstream also becomes more prominent [36,37]. This is consistent with the present observations: a reduction in relative submergence enhances the vertical turbulent component and deepens the scour hole.
The Froude number also exerts a dominant influence on the scour geometry around similar rock obstacles. Under relatively low submergence depths, Papanicolaou et al. [37,38] demonstrated that when Fr < 1, sediment tends to deposit at the leading edge of the boulder; whereas when Fr > 1, deposition shifts to the boulder sidewalls controlled by local free-surface wave crests. In this study, higher discharge (Q = 60 L/s vs. 40 L/s, corresponding to a higher Fr) produces deeper scour pits (a 25% increase in depth), which also confirms the aforementioned scaling relationship.
Yager et al. [39,40] further showed that under low relative submergence conditions common in mountain streams, the form drag on large stationary particles reduces the shear stress available for sediment transport, thereby effectively increasing the apparent critical shear stress. These findings indicate that in the boulder sand bar reach, the Shields number exhibits significant spatial variability, and the threshold for sediment motion is locally modulated by the flow structures formed by the boulder—a mechanism consistent with the phenomena of scouring at the sand bar head and deposition at the sand bar tail observed in this experiment. The relative submergence depth (h/Ds) further influences the scour pattern.
As shown in Table 5, when the boulder was placed at the bar head and the discharge increased from 40 L/s to 60 L/s, the width of the scour hole increased by 87.5% and the depth increased by 25%. This finding is consistent with the conclusions of Li et al. [41,42,43]. Under the same discharge (Q = 60 L/s), when the boulder was placed at the bar head and the protrusion height increased from 7.6 cm to 15.2 cm, the depth of the scour hole increased by 25%. The highly exposed boulder enhanced the vertical turbulent component of the flow, similar to scouring around the upper part of piles [44,45,46], thereby strengthening vertical scour and deepening the scour hole. This result is also supported by Tang and Peng [47,48].
Under the same discharge (Q = 40 L/s) and protrusion height (Ds = 15.2 cm), the scour hole depth varied with boulder position: it was greatest at the bar head (0.04 m), followed by the midpoint of the left anabranch (0.033 m), and smallest at the bar tail (0.02 m). The bar head serves as the upstream impact zone, where flow dynamics are strongest and local scour is most intense. This aligns with Jiang [49], who investigated gully head scouring. The midpoint of the left anabranch is a flow division zone characterized by weaker flow velocity and turbulence, resulting in a lower degree of scour hole development.
Turbulent kinetic energy enhances sediment incipient motion and amplifies local scouring. The turbulent dissipation rate in the wake zone is far higher than that over a flat bed, and vertical and lateral fluctuating velocities drastically lift near-bed sediment. When the boulder is located at the front of the sand bar, the incident flow is deflected by the protruding boulder, forming a well-developed horseshoe vortex at its base and generating an extended wake region downstream. The downward flow and rotational shear of this horseshoe vortex significantly intensify the shear stress at the boulder leading edge, which is the primary cause of the deep scour hole at the sand bar head. This mechanism is consistent with the classical scour formula for cylindrical obstacles summarized by Dey [15]. In contrast, when the boulder is placed in the side branch channel, the flow diversion effect of the main sand bar body reduces the flow velocity around the boulder, thereby attenuating the strength of the horseshoe vortex and wake turbulence.
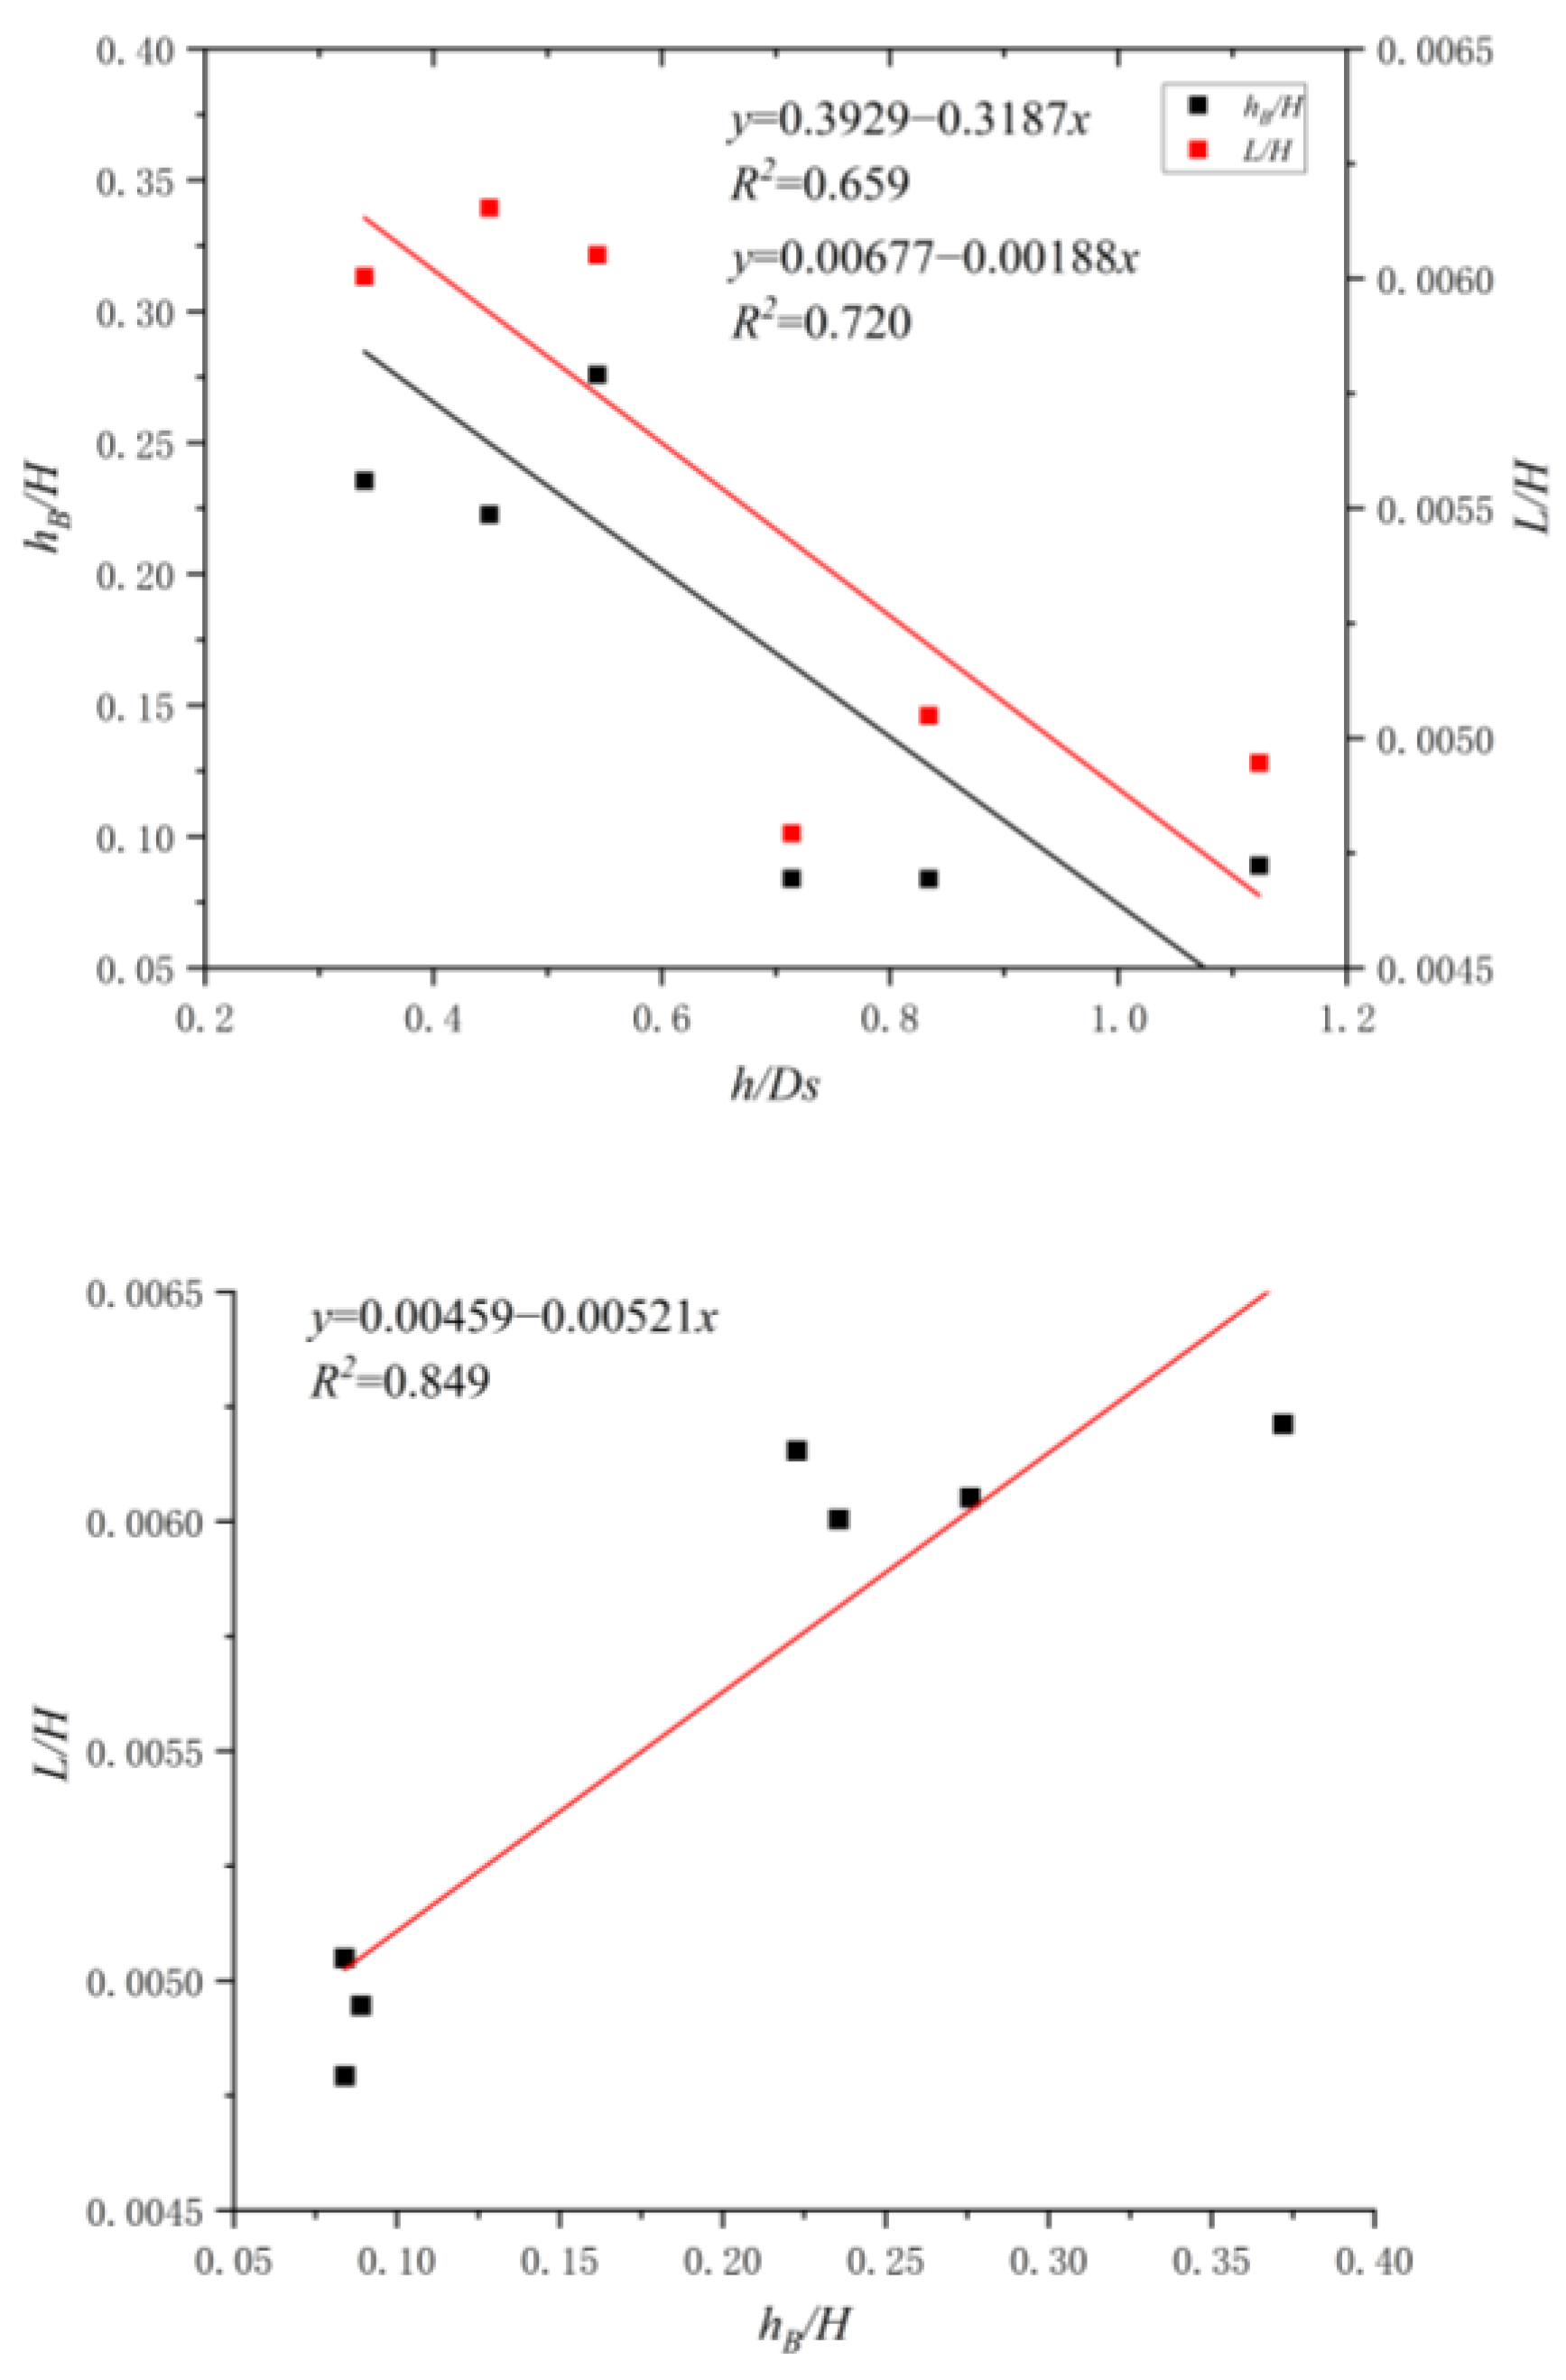
Collectively, these observations indicate that discharge, boulder protrusion height, and boulder position all exert significant control over the development of local scour holes. To further investigate the quantitative relationships among the relative submergence (h/Ds), the local scour depth around the boulder (hB) and the longitudinal extent of the scour hole (L), dimensionless analysis is performed on the experimental data, with the results presented in Table 5. The results show that h/Ds exhibits a favorable linear negative correlation with both hB/H and L/H: as h/Ds increases, hB/H and L/H decrease gradually. Although L/H and hB/H vary in a coupled manner, the magnitude of decrease in hB/H is smaller than that in L/H. Therefore, the relative water depth exerts a far greater influence on the longitudinal extent of the scour hole than on the scour depth.
Under identical bed sediment conditions, a lower relative submergence corresponds to a higher degree of boulder protrusion above the bed surface, greater local bed resistance, stronger flow around the boulder and downcutting effects, and more fully developed scour holes. When flow passes the boulder, a high-pressure stagnation zone forms on the upstream face, driving downward flow to erode the bed surface. Meanwhile, the downstream wake vortices have strong sediment entrainment capacity, resulting in deeper scour holes with wider longitudinal extents. As relative submergence increases, the proportion of discharge flowing over the boulder crest rises, and the intensity of near-bed flow around the upstream face weakens. Accordingly, the scale of the horseshoe vortex and the downcutting driving force decrease, the scour capacity of the downward flow diminishes, turbulence intensity in the wake zone attenuates, and bed sediment transport intensity weakens, leading to synchronous contraction of both scour depth and longitudinal extent. This conclusion is also validated by the results of Schlömer et al. [39,47].
The development of scour depth is more strongly constrained by the incipient motion threshold of bed sediment, and the scour rate slows down after reaching a certain depth. In contrast, the longitudinal extent of the scour hole is jointly affected by upstream headward erosion and downstream depositional extension, and is more sensitive to changes in flow conditions. Hence, its variation amplitude with relative submergence is more pronounced.
As shown in Figure 10, further analysis of the internal correlation between hB/H and L/H reveals a significant linear relationship between the two, with a coefficient of determination (R2) of 0.849. This indicates that scour depth and longitudinal extent feature stable co-evolution characteristics. A larger scour depth reflects stronger local flow scour capacity, a longer extension distance of upstream headward erosion, and a wider influence range of the downstream wake, driving a synchronous increase in the overall scale of the scour hole.

4.2. Movement Characteristics of the Boulder

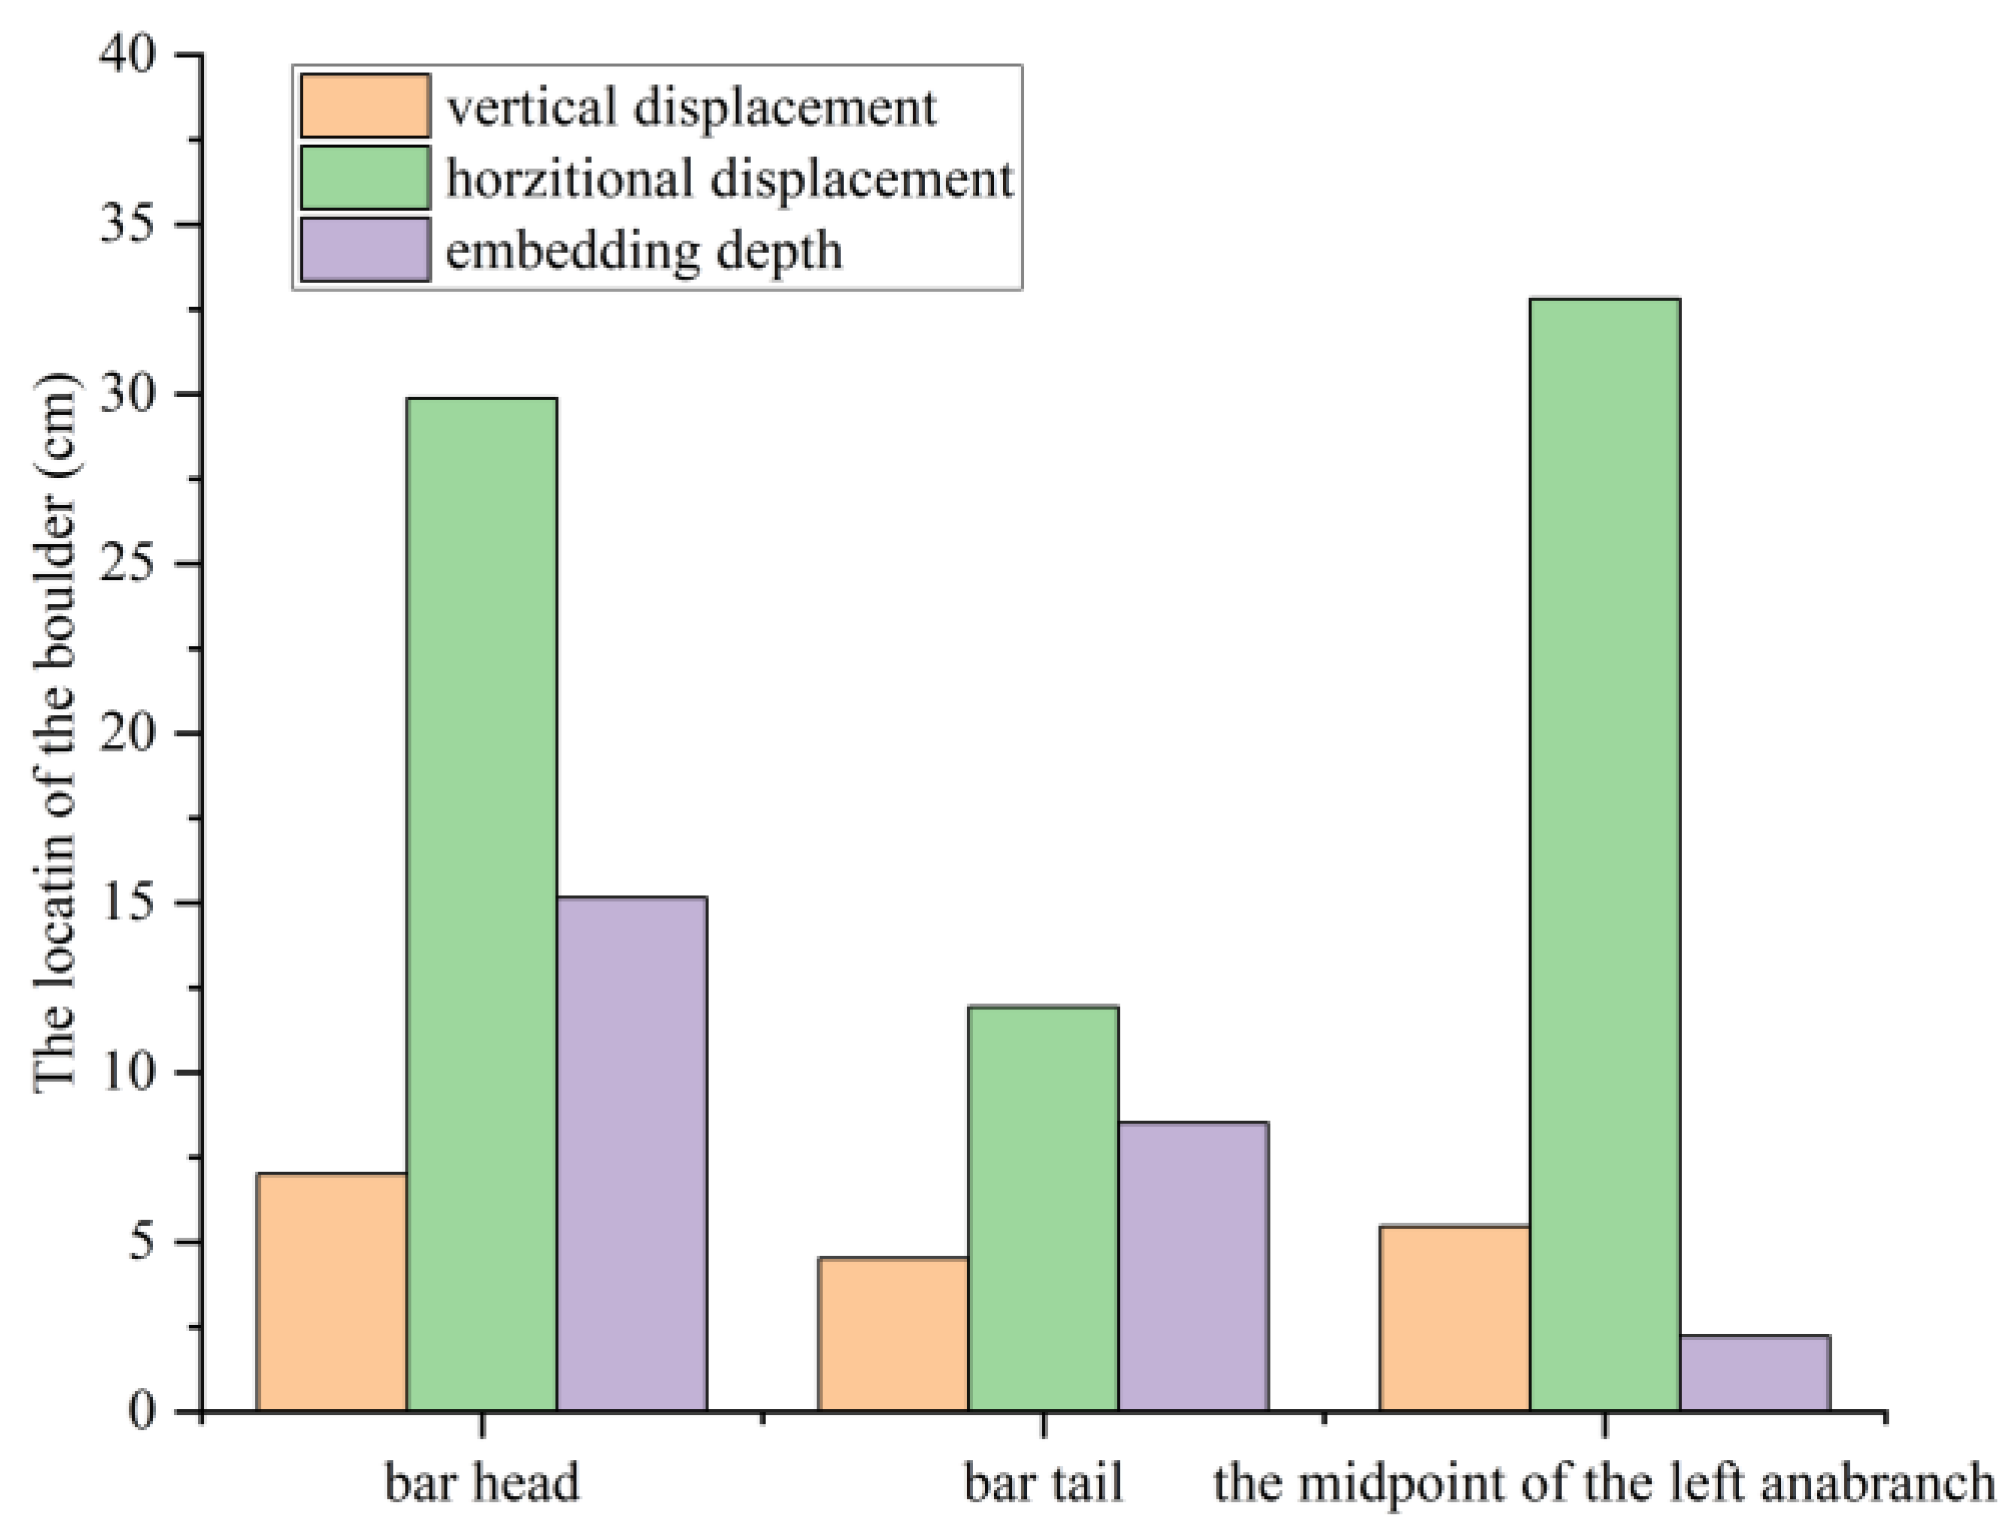
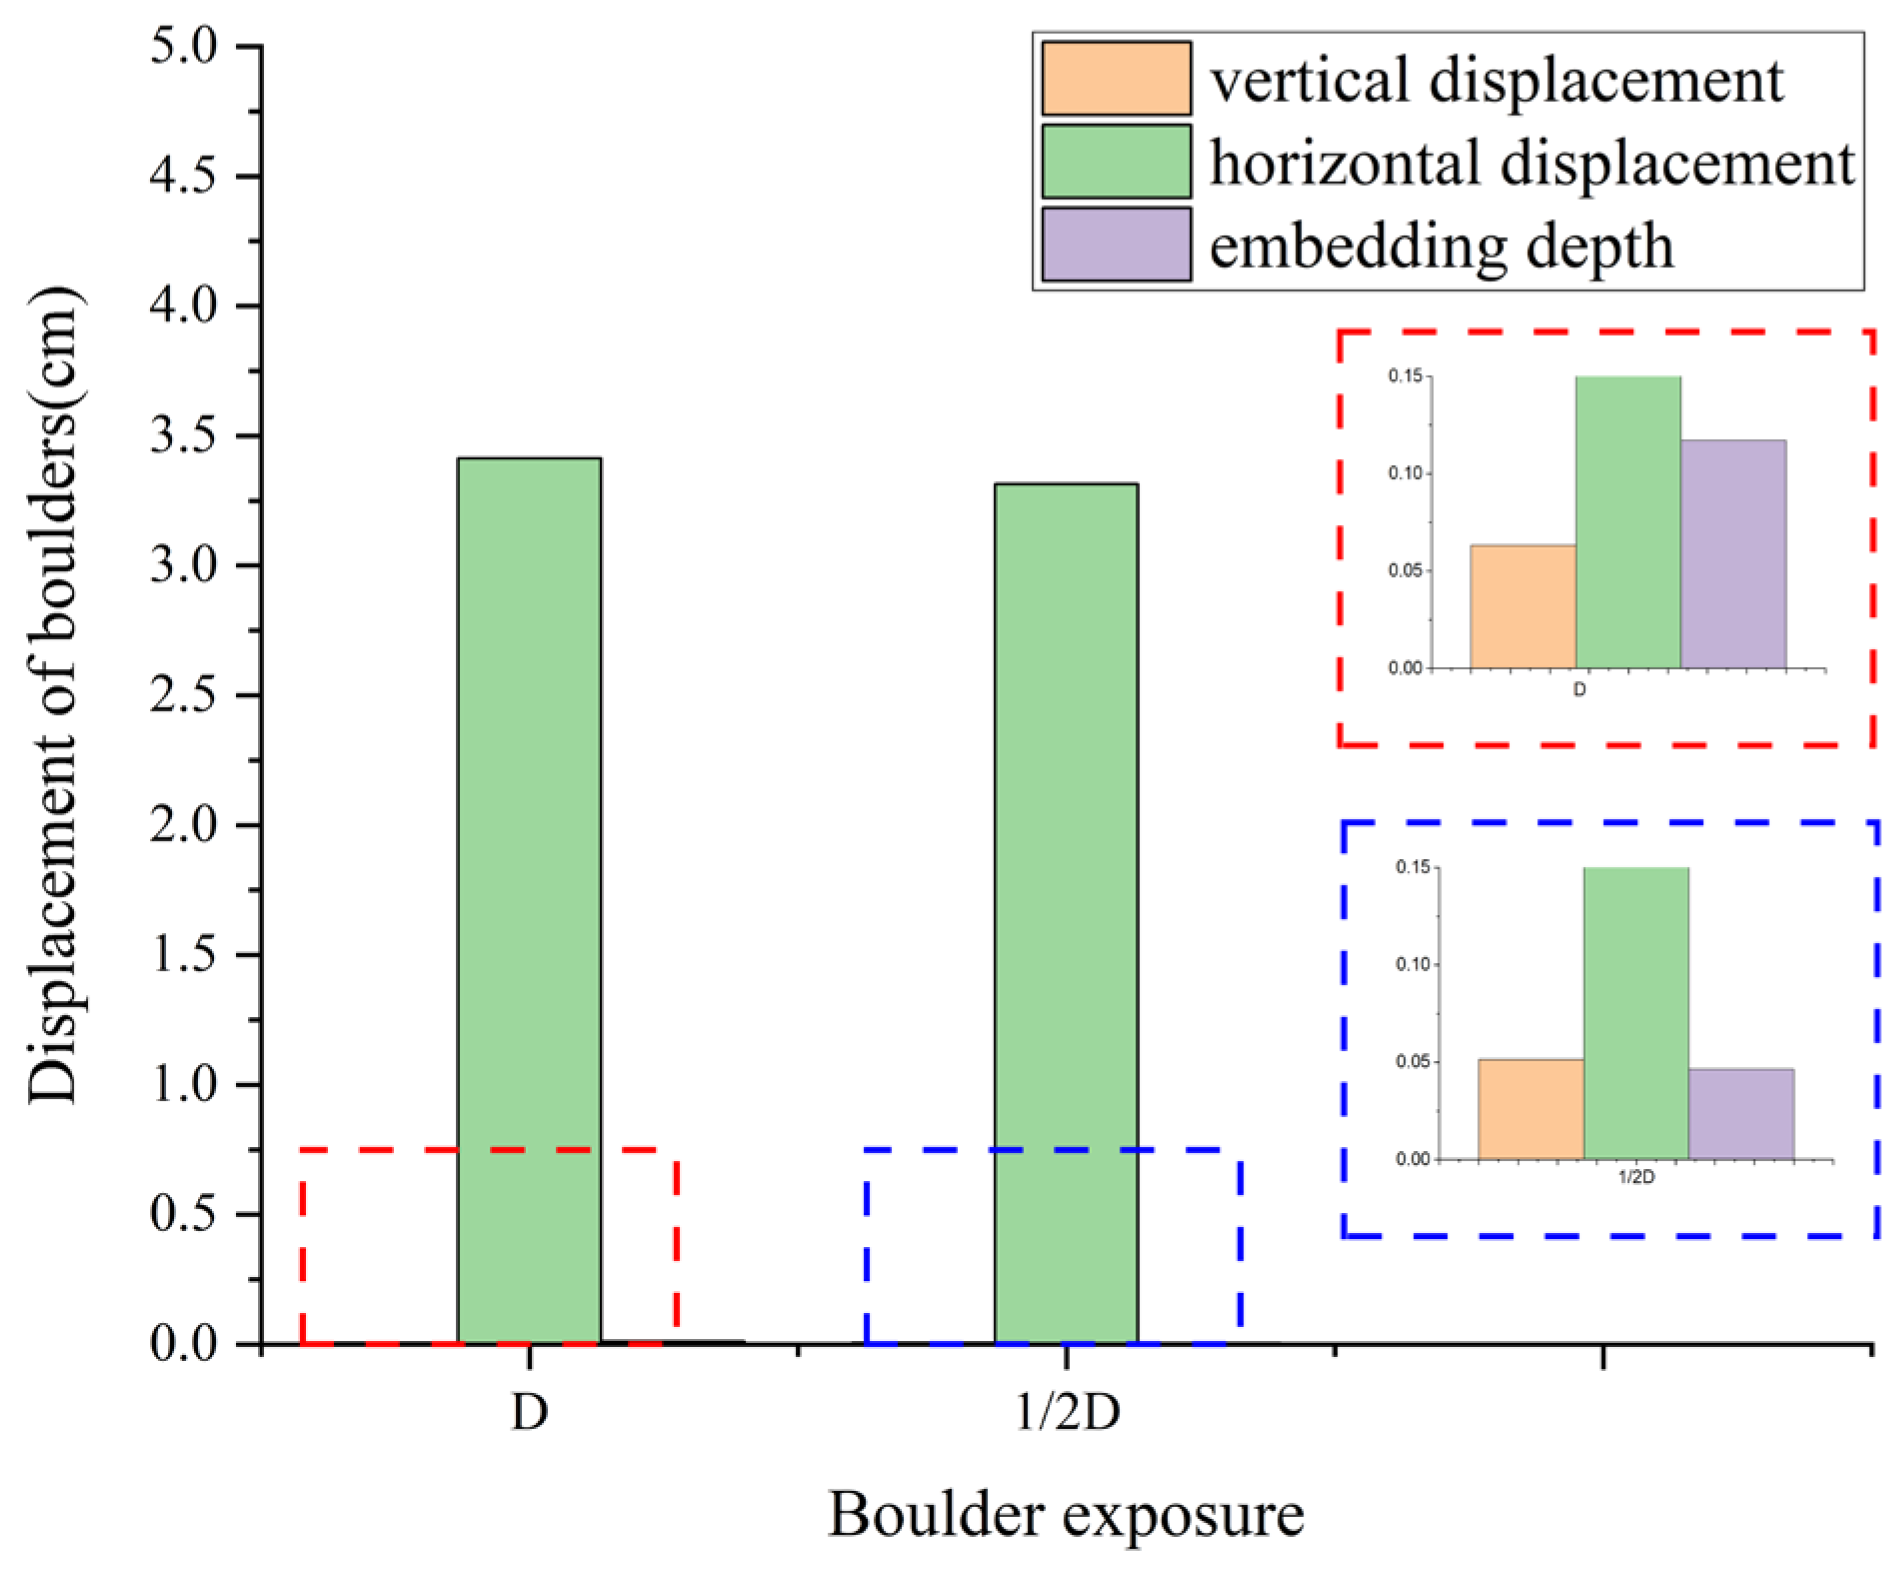
As shown in Figure 11 and Figure 12, the embedded depth of boulders exhibits a positive linear correlation with their protrusion s, and this correlation shows distinct spatial differentiation. Specifically, embedded depth is greatest when boulders are located at the bar head, followed by those at the bar tail, and smallest when boulders are placed in the side anabranch. This observation is supported by Golpira [50], who investigated the influence of submergence ratio on surrounding flow structures. Additionally, boulder protrusion height is positively correlated with the post-scour reduction in bar volume and height, from which it can be inferred that the embedded depth of boulders is also proportional to these reductions. Furthermore, the scour holes formed around boulders exhibit significant spatial differences: the widths and areas of scour holes at the bar head and in the side anabranch are comparable and are significantly larger than those at the bar tail, while both the width and area of scour holes are also proportional to the protrusion height of the boulders.

4.3. Limitations and Future Research

This study not only validates established mechanisms, including hydraulic pressure attenuation and scouring intensification induced by vertical turbulence, but also quantified the influence of discharge and protrusion height on the scouring size, and revealed the spatial differentiation patterns. These understandings have improved the local scouring theory of riverbed troughs in mountainous areas, and can provide scientific basis and parameter support for riverbank protection, gully head erosion control, and anti-scour design of water conservancy projects. However, the experiments were conducted under specific indoor conditions and did not involve non-steady flow, turbulent fluctuations, and changes in sediment supply in natural rivers, which may lead to deviations when the results are extrapolated to the field. Mountain riverbeds feature a broad sediment size distribution with pronounced sorting and hiding effects. However, constrained by the scope of this work, no comparative experiments targeting sediment gradation were conducted. As boulder sizes span a wide range, future studies may incorporate multi-sized boulders, unsteady flow, variable sediment supply, varied sediment gradations and other factors to bring experimental conditions closer to natural scenarios, thus further enhancing the reliability and engineering applicability of the research findings.

5. Conclusions

Based on field investigations of boulder-bearing rivers and flume experiments, this paper systematically analyzes the relationships between boulder position, protrusion height, and the deformation characteristics and development mechanisms of boulder bars under varying inflow and sediment supply conditions. The main conclusions are as follows:
  • Both bar area and volume increase with rising discharge, with longer downstream bar extension and a positive correlation between bar length–width ratio and velocity. The presence of boulders induces localized topographic features and suppresses the downstream diffusion of the bar, whereas a flat bed facilitates scouring and sediment diffusion. When boulders are moved from the bar head to the tail, both bar area and volume increase progressively, while bar height peaks at the midpoint position. A higher boulder protrusion height intensifies bed scouring and significantly enhances flow forces, thereby promoting lateral bar expansion.
  • The length-to-width ratio of the bar is positively correlated with discharge. In the absence of boulders, scouring is more effective and bar development is more complete, resulting in a marked increase in this ratio. The post-scour volume and height of the bar are positively correlated with both the protrusion height and the embedded depth of boulders. Bar scale follows side anabranches> bar head > bar tail. Greater protrusion and deeper embedding intensify the turbulent zone and wake deposition zone around boulders, which not only enhance local scour but also promote sediment accumulation, ultimately contributing to an increase in bar volume and elevation. In particular, highly exposed boulders significantly increase elevation loss at the bar head by strengthening local turbulence.
  • Scour hole geometry is governed by discharge, boulder position, and protrusion height. Higher discharge increases scour hole width to a greater extent than depth, resulting in a reduced width-to-depth ratio. Scour holes at the bar head are deeper and narrower than those at the bar tail, where lower flow energy produces wider and shallower scour features. As boulder protrusion height increases, scour depth increases while the width-to-depth ratio decreases. The relative submergence (h/Ds) is negatively correlated with both relative scour depth (hB/H) and relative scour extent (L/H), with the latter exhibiting greater sensitivity to changes in submergence. The stable co-evolutionary relationship between scour depth and extent (R2 = 0.849) confirms their synchronized development under varying flow and boulder conditions. Increasing discharge widens erosion holes to a greater extent than the depth, thereby reducing the width-to-depth ratio.

Author Contributions

Conceptualization, C.Y. and M.L.; methodology, C.Y. and M.L.; validation, C.Y., R.G. and M.L.; resources, C.Y.; data curation, C.Y., J.X. and R.G.; writing—original draft preparation, C.Y.; writing—review and editing C.Y. and R.G. visualization C.Y. and R.G.; supervision, M.L.; funding acquisition, C.Y. All authors have read and agreed to the published version of the manuscript.

Funding

National Natural Science Foundation of China 52309081 and Natural Science Foundation of Fujian Province 2024J01720.

Data Availability Statement

The original contributions presented in this study are included in the article. Further inquiries can be directed to the corresponding author.

Acknowledgments

The authors acknowledge the financial support provided by the National Natural Science Foundation of China (52309081) and Fujian Provincial Natural Science Foundation (2024J01720). We sincerely thank the editors and all reviewers for their constructive and excellent reviews that helped improve the manuscript.

Conflicts of Interest

The authors declare that they have no known competing financial interests or personal relationships that could have appeared to influence the work reported in this paper.

References

  1. Shobe, C.M.; Bennett, G.L.; Tucker, G.E.; Roback, K.; Miller, S.R.; Roering, J.J. Boulders as a lithologic control on river and landscape response to tectonic forcing at the Mendocino triple junction. Geol. Soc. Am. Bull. 2021, 133, 647–662. [Google Scholar] [CrossRef] [Scilit]
  2. Bennett, G.L.; Miller, S.R.; Roering, J.J.; Schmidt, D.A. Landslides, threshold slopes, and the survival of relict terrain in the wake of the Mendocino Triple Junction. Geology 2016, 44, 363–366. [Google Scholar] [CrossRef] [Scilit]
  3. Carling, P.A.; Hoffmann, M.; Blatter, A.S. Initial motion of boulders in bedrock channels. In Proceedings of the 2nd International Paleoflood Conference, Beijing, China, 10–13 September 2002. [Google Scholar]
  4. Nitsche, M.; Rickenmann, D.; Turowski, J.M.; Badoux, A.; Kirchner, J.W. Evaluation of bedload transport predictions using flow resistance equations to account for macro-roughness in steep mountain streams. Water Resour. Res. 2011, 47. [Google Scholar] [CrossRef] [Scilit]
  5. Li, X.; Li, B.; Qie, L.; Li, Y.; Wang, H. Dynamic Response of a Frame Structure Impacted by Debris Flow Containing Large Boulders. Structures 2025, 74, 108543. [Google Scholar] [CrossRef] [Scilit]
  6. Sha, S.; Dyson, A.P.; Kefayati, G.; Tolooiyan, A. Modelling of Debris Flow-Boulder-Barrier Interactions Using the Coupled Eulerian Lagrangian Method. Appl. Math. Model. 2024, 127, 143–171. [Google Scholar] [CrossRef] [Scilit]
  7. Tubino, M.; Repetto, R.; Zolezzi, G. Free bars in rivers. J. Hydraul. Res. 1999, 37, 759–775. [Google Scholar] [CrossRef] [Scilit]
  8. Gladkov, G.; Katolikov, V.; Belyakov, P.; Rzhakovskaya, P.; Zamyshlyaev, V. Hydraulics and bedload in unsteady flow: Example of the Volga River. Int. J. Sediment Res. 2024, 392, 209–221. [Google Scholar] [CrossRef] [Scilit]
  9. Kim, H.; Yoo, H.; Paik, K.; Kim, D.-H. Qualitative assessment model for longitudinal riverbed erosion and deposition based on suspended sediment impacts and hydraulic geometry relationship. J. Hydrol. 2025, 657, 133049. [Google Scholar] [CrossRef] [Scilit]
  10. Church, M.; Rice, S.P. Form and growth of barsbar in a wandering gravel-bed river. Earth Surf. Processes Landf. 2009, 34, 1422–1432. [Google Scholar] [CrossRef] [Scilit]
  11. Ye, C.; Wang, X.K. Experimental Study on Characteristics of Bouder Bars Evolution in Mountainous Sediment-laden River. Adv. Eng. Sci. 2023, 55, 102–109. (In Chinese) [Google Scholar] [CrossRef]
  12. Sawyer, A.M.; Pasternack, G.B.; Moir, H.J.; Fulton, A.A. Riffle-pool maintenance and flow convergence routing observed on a large gravel-bed river. Geomorphology 2010, 114, 143–160. [Google Scholar] [CrossRef] [Scilit]
  13. White, J.Q.; Pasternack, G.B.; Mori, H.J. Valley width variation influences riffle-pool location and persistence on a rapidly incising gravel-bed river. Geomorphology 2010, 121, 206–221. [Google Scholar] [CrossRef] [Scilit]
  14. Li, Z.W.; Wang, Z.Y.; Yu, G.A. Development mechanism of gravel-cobble bars. J. Hydroelectr. Eng. 2014, 33, 126–132+49. (In Chinese) [Google Scholar]
  15. Dey, S.; Sarkar, S.; Bose, S.K.; Tait, S.; Castro-Orgaz, O. Wall-Wake Flows Downstream of a Sphere Placed on a Plane Rough Wall. J. Hydraul. Eng. 2011, 137, 1173–1189. [Google Scholar] [CrossRef] [Scilit]
  16. Papanicolaou, A.N.; Tsakiris, A.G.; Wyssmann, M.A.; Kramer, C.M. Boulder Array Effects on Bedload Pulses and Depositional Patches. J. Geophys. Res. Earth Surf. 2018, 123, 2925–2953. [Google Scholar] [CrossRef] [Scilit]
  17. Papanicolaou, A.N.; Tsakiris, A.G. Boulder Effects on Turbulence and Bedload Transport. In Gravel Bed Rivers Processes Disasters; John Wiley & Sons Ltd.: Hoboken, NJ, USA, 2017; pp. 33–72. [Google Scholar] [CrossRef] [Scilit]
  18. Papanicolaou, A.N.; Kramer, C.M.; Tsakiris, A.G.; Stoesser, T.; Bomminayuni, S.; Chen, Z. Effects of a fully submerged boulder within a boulder array on the mean and turbulent flow fields: Implications to bedload transport. Acta Geophys. 2012, 60, 1502–1546. [Google Scholar] [CrossRef] [Scilit]
  19. Shobe, C.M.; Turowski, J.M.; Nativ, R.; Glade, R.C.; Bennett, G.L.; Dini, B. The Role of Infrequently Mobile Boulders in Modulating Landscape Evolution and Geomorphic Hazards. Earth-Sci. Rev. 2021, 220, 103717. [Google Scholar] [CrossRef] [Scilit]
  20. Montgomery, D.R.; Buffington, J.M. Channel-reach morphology in mountain drainage basins. Geol. Soc. Am. Bull. 1997, 109, 596–611. [Google Scholar]
  21. Hou, Y.; Miao, C.; Zhu, D.; Li, Z.; Du, F.; Wang, W.; Yang, X.; Cao, Z. Flow mechanism of grouting slurry in rough fracture based on CFD-DEM coupling method. Processes 2026, 14, 1307. [Google Scholar] [CrossRef] [Scilit]
  22. Cao, Z.; Miao, C.; Du, F.; Zhu, D.; Teng, T.; Xue, Y. A bifurcation dynamical analysis of a non-darcy seepage system in post-failure rock based on a novel truncated spectral method. Processes 2026, 14, 1468. [Google Scholar] [CrossRef] [Scilit]
  23. Wang, X.K.; Liu, X.N.; Zhou, J.W. Research Framework and Anticipated Results of Flash Flood Disasters Under the Mutation of Sediment Supply. Adv. Eng. Sci. 2019, 51, 1–10. (In Chinese) [Google Scholar] [CrossRef]
  24. Xia, J.Q.; Deng, S.S.; Zhou, M.R.; Lv, J.Y. Effects of the Three Gorges Project operation on the recent variation inbankfull channel geometry of the Jingjiang Reach. Adv. Water Sci. 2016, 27, 385–391. (In Chinese) [Google Scholar] [CrossRef]
  25. Xia, J.; Deng, S.; Lu, J.; Xu, Q.; Zong, Q.; Tan, G. Dynamic channel adjustments in the Jingjiang Reach of the Middle Yangtze River. Sci. Rep. 2016, 6, 22802. [Google Scholar] [CrossRef] [Scilit] [PubMed]
  26. Jia, D.D.; Xia, H.F.; Chen, C.Y.; Zhang, X.N. 3-D numerical simulation of the influences of bank erosion processeson navigation conditions: Case study of the Taipingkou Waterway on the middle Yangtze River. Adv. Water Sci. 2017, 28, 223–230. (In Chinese) [Google Scholar] [CrossRef]
  27. Xia, J.Q.; Lin, F.F.; Zhou, M.R.; Zheng, S.S.; Peng, Y.M. Bank retreat processes and characteristics in the Jingjiang Reachafter the Three Gorges Project operation. Adv. Water Sci. 2017, 28, 543–552. (In Chinese) [Google Scholar] [CrossRef]
  28. Xia, J.Q.; Zhou, M.R.; Lin, F.F.; Deng, S.; Lu, J. Variation in reach-scale bankfull discharge of the Jingjiang Reach undergoing upstream and downstream boundary controls. J. Hydrol. 2017, 547, 534–543. [Google Scholar] [CrossRef] [Scilit]
  29. Li, S.X.; Li, Y.T.; Yuan, J.; Zhang, W.; Chai, Y.; Ren, J. The impacts of the Three Gorges Dam upon dynamic adjustment mode alterations in the Jingjiang reach of the Yangtze River, China. Geomorphology 2018, 318, 230–239. [Google Scholar] [CrossRef] [Scilit]
  30. Luo, M.; Tong, L.; Zhang, J.; Guo, Y.; Wang, H.; Chen, N. Experimental Study of Hydrodynamics and Soil Responses around a Sandbar and Their Effects on Bed-Level Evolution. Ocean Eng. 2026, 352, 124564. [Google Scholar] [CrossRef] [Scilit]
  31. Xue, X.H.; Chang, S.; Song, E.P. Evolution of floodplains and bars at the Jingjiang reach of YangtzeRiver, China in response to Three Gorges Reservoir impoundment. Acta Geogr. Sin./Dili Xuebao 2018, 73, 1714–1727. (In Chinese) [Google Scholar] [CrossRef]
  32. Wang, J.; Dai, Z.J.; Mei, X.F.; Lou, Y.; Wei, W.; Ge, Z. Immediately downstream effects of Three Gorges Dam on channel sandbars morphodynamics between Yichang-Chenglingji Reach of the Changjiang River, China. J. Geogr. Sci. 2018, 28, 629–646. [Google Scholar] [CrossRef] [Scilit]
  33. Ye, C.; Ze, X.X.; Guan, J.C.; Fang, C.M.; Wang, X.K. Experimental Study on Characteristics of Water and Sediment Movement in Vegetated Beach of Mountainous Rivers. Adv. Eng. Sci. 2020, 52, 75–81. (In Chinese) [Google Scholar] [CrossRef]
  34. Ye, C.; Wang, H.Z.; Zheng, Y.Y.; Dong, X.; Wang, X.K. Influence of the Boulders on Bed Deformation and Bottom Flow Structure in Mountain Rivers. Adv. Eng. Sci. 2017, 49, 22–28. [Google Scholar] [CrossRef]
  35. Zi, R.; Han, Z.; Chen, T.; Fang, F.; Fang, Q.; Peng, L.; Qian, X.; Yin, X.; Zhao, L. Quantifying the effects of rock fragments embedding vs. Covering on soil erosion in karst sloping cropland. CATENA 2024, 244, 108234. [Google Scholar] [CrossRef] [Scilit]
  36. Qiu, Y.; Lan, X.; Yang, Z.; Wang, G.; Liu, J. Study on the mechanism of soil erosion by submerged water jet vertical scouring in cohesive soils. Ocean Eng. 2024, 311, 118919. [Google Scholar] [CrossRef] [Scilit]
  37. Euler, T.; Herget, J.; Schlömer, O.; Benito, G. Hydromorphological processes at submerged solitary boulder obstacles in streams. CATENA 2017, 157, 250–267. [Google Scholar] [CrossRef] [Scilit]
  38. Schlömer, O.; Herget, J. Geometry of Local Scour Holes at Boulder-like Obstacles during Unsteady Flow Conditions and Varying Submergence. Water 2023, 15, 958. [Google Scholar] [CrossRef] [Scilit]
  39. Schlömer, O.; Herget, J.; Euler, T. Boundary condition control of fluvial obstacle mark formation–framework from a geoscientific perspective. Earth Surf. Process. Landf. 2020, 45, 189–206. [Google Scholar] [CrossRef] [Scilit]
  40. Yager, E.M.; Schmeeckle, M.W.; Badoux, A. Resistance is not futile: Grain resistance controls on observed critical shields stress variations. J. Geophys. Res. Earth Surf. 2018, 123, 3308–3322. [Google Scholar] [CrossRef] [Scilit]
  41. Li, L.; Li, H.; Zhang, G.; Liu, D.; Xiao, Y.; Liu, Y.; Zou, J. A coupled model of surface water-groundwater interaction with the effect of riverbed deformation in the alluvial channel. CATENA 2025, 257, 109193. [Google Scholar] [CrossRef] [Scilit]
  42. Zhang, W.; Zhao, L.; Wang, Z.; Wu, G.; Zhao, X.; Lv, M. The development law of silt suction pit morphology under the action of pipeline suction and drainage. Ain Shams Eng. J. 2026, 17, 103807. [Google Scholar] [CrossRef] [Scilit]
  43. Chen, H.; Zhang, J.; Zhao, J.; Zhang, Y.; Guo, Y.; Hu, H.; Ji, Y.; Wang, Y. On seabed scour around the vertical-axis tidal turbine under unidirectional flow loading. Mar. Struct. 2026, 107, 104007. [Google Scholar] [CrossRef] [Scilit]
  44. Liu, C.L.; Ai, Z.Y.; Tang, M.X.; Hu, H.S.; Wang, L.J. Scour effects on the vertical dynamic response of single piles in transversely isotropic soils. Ocean Eng. 2023, 280, 114535. [Google Scholar] [CrossRef] [Scilit]
  45. Lin, M.; Jiang, C. Analysis for the effect of scour on pile lateral behavior in sand under combined loads considering additional stress and coupling effect of lateral-vertical load. Comput. Geotech. 2024, 173, 106507. [Google Scholar] [CrossRef] [Scilit]
  46. Zhou, W.; Cheng, Y.; Zhang, J. Preventing scour of monopile foundations using a vertical rotation device. Ocean Eng. 2024, 311, 118879. [Google Scholar] [CrossRef] [Scilit]
  47. Tang, Z.; Li, Y.P. Vertical contraction scour beneath solid and porous obstacles in steady currents: A numerical and theoretical study. Coast. Eng. 2026, 205, 104936. [Google Scholar] [CrossRef] [Scilit]
  48. Peng, Y.; OuYang, H.; Qin, W.; Gong, W.; Dai, G. Lateral and vertical bearing characteristics of monopile and pile groups under scour condition: Model test and calculation method. Ocean Eng. 2025, 331, 121232. [Google Scholar] [CrossRef] [Scilit]
  49. Jiang, C.; Jin, Z.; Fan, W.; Yu, N.; Liu, E. Experimental study of rainfall and inflow characteristics effects on gully head erosion on the Loess Plateau. Geoderma 2026, 466, 117682. [Google Scholar] [CrossRef] [Scilit]
  50. Golpira, A.; Baki, A.B.; Ghamry, H.; Katopodis, C. Influence of Boulder Submergence Ratio on Local Flow Field: Implications for Sediment and Fish Instream Habitat. Ecol. Eng. 2023, 193, 106997. [Google Scholar] [CrossRef] [Scilit]
Figure 1. Schematic diagram of the experimental setup.
Water 18 01720 g001
Figure 2. Typical hypsographic map.
Water 18 01720 g002
Figure 3. Bar scour processes with and without a boulder.
Water 18 01720 g003
Figure 4. Bar topography under varying discharge conditions. (a) Q = 40 L/s, i = 2%, without a boulder; (b) Q = 60 L/s, i = 2%, without a boulder; (c) Q = 60 L/s, i = 2%, with a boulder placed at the bar head, protrusion height Ds = 15.2 cm.
Water 18 01720 g004aWater 18 01720 g004b
Figure 5. Bar topographic map for different boulder positions. (a) Q = 40 L/s, i = 0, with a boulder placed at the bar head, protrusion height Ds = 15.2 cm; (b) Q = 40 L/s, i = 0, with a boulder placed at the midpoint of the left anabranch, protrusion height Ds = 15.2 cm; (c) Q = 40 L/s, i = 0, with a boulder placed at the tail of the bar, protrusion height Ds = 15.2 cm.
Water 18 01720 g005aWater 18 01720 g005b
Figure 6. Longitudinal midline profile map of bar with different boulder positions. (a) Boulder placed at the bar head, along the central longitudinal section of the bar; (b) boulder placed at the bar tail, along the central longitudinal section of the bar; (c) boulder placed at the midpoint of the left anabranch, along the central longitudinal section of the bar; (d,e) boulder placed at the midpoint of the left anabranch, the longitudinal section of the bar centerline, and the centerline section of the left anabranch.
Water 18 01720 g006aWater 18 01720 g006b
Figure 7. Longitudinal profiles of the bar at different boulder protrusion heights. (a) Boulder placed at the bar head, protrusion height Ds = 7.6 cm; (b) boulder 15.2 cm, along the central longitudinal section of the bar; (c) boulder placed at the bar head, protrusion height Ds = 7.6 cm, along the central longitudinal section of the bar.
Water 18 01720 g007aWater 18 01720 g007b
Figure 8. Bar length-to-width ratio under different operating conditions. (a) Boulder protrusion height varies; (b) different boulder positions.
Water 18 01720 g008aWater 18 01720 g008b
Figure 9. Scour hole width-to-depth ratio under different operating conditions. (a) Boulder protrusion height varies. (b) When Q = 40 L/s, the position of the boulders is different.
Water 18 01720 g009
Figure 10. Relationship between relative submergence, relative scour depth (hB/H), and relative longitudinal scour extent (L/H).
Water 18 01720 g010
Figure 11. The linkage relationship of the boulders in different positions.
Water 18 01720 g011
Figure 12. The linkage relationship of the boulder protrusion height.
Water 18 01720 g012
Table 1. Summary of experimental conditions for all runs.
Operating ConditionDischarge Q/L/sBoulder Size D/mmBoulder PositionBoulder Protrusion Height/mmSlopeSediment Supply Ms/kgSediment Size d/mm
R1402%0
R2602%0
R340152bar head1522%0
R440152bar head762%0
R540152bar head15200
R640152bar tail15200
R740152the midpoint of the left anabranch15200
R860152bar head1522%0
R960152bar head762%0
R1040152bar head1520601.5
R1160152bar head1520601.5
R1280152bar head15200
R1380152bar head1522%0
R1440152bar tail1522%0
R1540152bar tail762%0
R1640152the midpoint of the left anabranch1522%0
R1740152the midpoint of the left anabranch762%0
Note: Q—discharge; D—Boulder size; d—The size of sand; Ms—sediment supply.
Table 2. Hydraulic parameters of experimental conditions.
Operating Conditionh/mv/
m/s
Incipient Velocity u*/
m/s
Shields Numberh/DsFr
R10.5410.4920.3230.1230.676
R20.7730.5170.3430.1210.593
R30.6820.3900.3360.0720.4490.478
R40.6330.4200.3320.0850.8340.534
R50.5260.5060.3220.1310.3460.705
R60.5050.5280.3200.1440.3320.750
R70.5310.5020.3220.1280.3490.695
R80.8260.4840.3470.1030.5440.538
R90.8080.4940.3460.1081.1230.555
R100.5200.5120.3210.1350.3420.718
R110.7410.5390.3410.1330.4870.633
R120.8980.5930.3520.1510.5910.632
R130.8450.6310.3480.1740.5550.693
R140.5850.4550.3280.1020.3850.602
R150.5410.4920.3230.1230.7120.676
R160.5160.5160.3210.1370.3390.726
R170.5420.4910.3240.1220.7140.674
Table 3. Bar volume and height in relation to boulder characteristics and discharge.
Relevant
Parameters
Protrusion HeightBoulders Embedded to a Certain DepthBoulders LocationDischarge
bar volume after scouringPositive correlationPositive correlationthe midpoint of the left anabranch > bar head > bar tailPositive correlation
bar height after scouringPositive correlationPositive correlationthe midpoint of the left anabranch> bar head > bar tailNegative correlation
Table 4. Bar height reduction in relation to boulder characteristics and discharge.
Elevation Reduction AmountDischargeProtrusion Height (m)Boulders Position
0.11540//
0.03860//
0.131600.152bar head
0.070600.76bar head
0.050400.152bar head
0.020400.152the midpoint of the left anabranch
0.060400.152bar tail
0.103800.152bar head
0.010400.76the midpoint of the left anabranch
Table 5. Scour hole width and depth in relation to boulder characteristics and flow rate.
Operating ConditionWidth of the Scouring Hole
L/m
L/HDepth of the Scouring Hole
hB/m
hB/HProtrusion Height/mBoulder Position
R30.100.2230.0420.0060.152bar head
R40.070.0840.0320.0050.076bar head
R50.080.2310.0400.0080.152bar head
R60.110.3310.0200.0040.152bar tail
R70.130.3720.0330.0060.152the midpoint of the left anabranch
R80.150.2760.0500.0060.152bar head
R90.100.0890.0450.0050.076bar head
R140.070.1820.0220.0040.152bar tail
R150.050.070.0180.0030.076bar tail
R160.080.2360.0310.0060.152the midpoint of the left anabranch
R170.060.0840.0260.0050.076the midpoint of the left anabranch
Disclaimer/Publisher’s Note: The statements, opinions and data contained in all publications are solely those of the individual author(s) and contributor(s) and not of MDPI and/or the editor(s). MDPI and/or the editor(s) disclaim responsibility for any injury to people or property resulting from any ideas, methods, instructions or products referred to in the content.