Article

Decoupling Industrial Growth from Water Withdrawal in the Middle East and North Africa Region

1
Interdisciplinary Research Center for Membranes and Water Security, King Fahd University of Petroleum & Minerals (KFUPM), Academic Belt Road, Dhahran 31261, Saudi Arabia
2
Department of Agricultural and Resource Economics, Kangwon National University, Chuncheon-si 24341, Gangwon-do, Republic of Korea
3
Geosciences Department, College of Petroleum Engineering & Geosciences, King Fahd University of Petroleum & Minerals (KFUPM), Dhahran 31261, Saudi Arabia
4
Arusha Climate and Environmental Research Centre, Aga Khan University, Arusha 23201, Tanzania
5
School of Resource and Environmental Management, Simon Fraser University, Burnaby, BC V5A 1S6, Canada
6
Department of Agricultural and Biosystems Engineering, University of Ilorin, Ilorin 240003, Kwara State, Nigeria
*
Authors to whom correspondence should be addressed.
Water 2026, 18(13), 1624; https://doi.org/10.3390/w18131624
Submission received: 24 April 2026 / Revised: 12 June 2026 / Accepted: 2 July 2026 / Published: 4 July 2026

Abstract

Water scarcity is redefining the limits of industrial development across the Middle East and North Africa (MENA), yet the regional dynamics of industrial water withdrawal remain poorly quantified. In this study, industrial water withdrawal was examined for 18 MENA countries over the period 1995–2022 using four seven-year periods, integrating spatio-temporal assessment, hierarchical clustering, Tapio decoupling, and Logarithmic Mean Divisia Index (LMDI) decomposition. The results showed that industrial water withdrawal per capita was highly concentrated: Iraq exceeded 300 m3/person/year between 1995 and 2001, and then declined to roughly 150–200 m3/person/year by 2002–2008, while Lebanon rose to 150–200 m3/person/year and became the highest-intensity case in the period 2009–2015 and 2016–2022. In addition, clustering identified four groups, with Egypt and Iraq forming a distinct pair and Saudi Arabia remaining structurally unique. Decoupling analysis presented favorable decoupling states most clearly in the 2002–2008 period, but became mixed after 2009. Decomposition further showed that population growth and economic development were the most persistent positive drivers of industrial water withdrawal, whereas technical change was the most variable counterforce. These results show that industrial water withdrawal in MENA is concentrated, structurally uneven, and increasingly shaped by country-specific interactions between growth, demography, technology, and industrial structure. The findings provide actionable evidence for policymakers, industrial planners, and water managers seeking to align industrial growth with water security in the MENA region.

1. Introduction

Water scarcity is now a first-order constraint on development across the Middle East and North Africa (MENA), where industrial expansion, population growth and economic restructuring are unfolding within some of the world’s most water-stressed environments [1,2]. Under these conditions, industrial water use is no longer a secondary sectoral concern. It has become a strategic question for economic policy, environmental governance and long-term development planning, because the sustainability of industrial growth increasingly depends on whether production can be decoupled from rising water withdrawals. Recent studies have therefore begun to treat the water-economy relationship in MENA as an analytical and policy priority, particularly considering mounting scarcity and ambitious growth agendas [3,4].
In many MENA countries, industrial activity must compete with municipal demand, agricultural withdrawals and ecological requirements, while also adjusting to climatic stress, groundwater depletion and rising dependence on non-conventional water sources [5,6]. This makes industrial water use qualitatively different from more general industrial resource questions. Water is spatially fixed, physically constrained and institutionally contested in ways that energy and carbon are not. As a result, the sustainability of industrial growth in MENA cannot be assessed adequately through aggregate development narratives alone; it must be evaluated in relation to water use efficiency, structural change and the drivers of withdrawal over time. Studies from the region have increasingly emphasized the need for integrated water management, improved water productivity and stronger investment in water-saving technologies, underscoring that industrial water demand is critical to broader sustainability debates. Yet the regional evidence base remains uneven. Existing work has generated important national and sector-specific insights, particularly on industrial water demand, water footprints, reclamation potential and water stress in countries such as Jordan [7], Morocco [8], and Saudi Arabia [9]. These studies have improved understanding of industrial water use at the country scale and have shown that water-saving measures, demand management and sectoral analysis are essential for sustainable water governance. Even so, the dominant pattern remains fragmented. Many analyses are country-specific, cross-sectional or focused on adjacent questions rather than on industrial water withdrawal as a regional dynamic linked explicitly to economic growth. Consequently, MENA still lacks a coherent regional assessment of how industrial water use has changed across countries and periods, whether those changes are consistent with economic transformation, and how far industrial growth has been separated from water demand.
A substantial body of scholarship around the world has examined how water use and economic growth interact, using analytical lenses like the Environmental Kuznets Curve (EKC), Tapio decoupling models, Logarithmic Mean Divisia Index (LMDI), input–output models and simultaneous-equation models. These studies ask important questions about whether water use rises, is fixed, or declines with economic changes, and how much change occurs as economies become more technologically advanced, structurally diversified, and institutionally better equipped to manage resource demand. So far, there has been mixed evidence with findings showing highly heterogeneous patterns, including inverted-U, N-shaped, monotonic, and region-specific relationships. Specifically, Mexican regional data show an N-shaped EKC in water withdrawal relative to economic growth, implying a rise-fall-rise pattern of water use, as economic growth continues [10]; per capita income and water consumption relationship in the USA and Spain follow inverted-U patterns, indicating a rise in water use during early economic growth, and then a decline after a turning point [11,12]; and some Chinese regions show monotonic increases in water use with rising GDP [13]. Studies applying the Tapio decoupling model have reported the occurrences of weak and strong decoupling between water consumption and GDP [14,15]. Some studies applying the LMDI reported water-use efficiency and economic effects as the main driving factors for water use [16,17]. While the Tapio decoupling model and the LMDI can be used individually, several studies combine both analyses to improve rigor [18,19,20]. Also, studies applying input–output models [21,22] and simultaneous-equation models [23,24] have all reported mixed findings. These findings are important because they show that the relationship between economic growth and water use is neither linear nor universal. Instead, it depends on how growth is produced, how efficiently water is used, and whether structural transformation is sufficient to moderate rising demand.
Against this broader background, the Tapio decoupling analysis and the LMDI have become well-established tools for investigating the relationship between economic growth and environmental pressure [25]. However, their direct application to industrial water use in the MENA region remains limited. The regional review shows that most Tapio- and LMDI-based studies in MENA still concentrate on carbon emissions, energy use or broader environmental indicators rather than on industrial water withdrawal [26,27]. Where water is addressed, the analysis often concerns footprints, demand estimation or water stress rather than the combined use of decoupling and decomposition to explain the drivers of industrial withdrawal. This matters because it leaves unanswered a central question for water-scarce industrializing economies: are changes in industrial water use being driven primarily by technological progress, by industrial restructuring, by macroeconomic expansion, or by demographic pressure? Without such distinction, policy responses risk remaining generic rather than targeted. A robust regional study must therefore do more than document rising or falling withdrawals. It must determine whether water use and industrial economic growth are moving synchronously or divergently, and it must identify the mechanisms behind that relationship. Tapio’s elasticity framework is especially useful in this regard because it captures whether changes in resource use are occurring faster or slower than changes in economic output, generating a spectrum of decoupling and coupling states rather than a simple binary outcome. The LMDI framework complements this by decomposing aggregate change into interpretable drivers [28], allowing technology, industrial structure, economic development and population to be considered simultaneously. Previous applications outside MENA have shown the value of this combined approach, with evidence that population and economic development often exert upward pressure on water use, whereas structural adjustment and technological change can reduce it [3]. Water-use intensity and industrial structure, in particular, repeatedly emerge as central drivers of decoupling outcomes, while population and income growth tend to exert incremental effects on withdrawals.
This analytical architecture is particularly relevant to MENA because the region is economically heterogeneous but hydrologically constrained. Countries differ markedly in industrial composition, fiscal capacity, water infrastructure, technological capability and exposure to scarcity, yet they are often discussed as though they share a single development-water trajectory. A regional comparative framework can reveal whether such an assumption is justified. It can show whether countries with similar GDP profiles display different industrial water-use patterns, whether apparent efficiency gains reflect real technological progress or merely sectoral shifts, and whether structural drivers differ between resource-rich and resource-constrained economies. The ability to identify clusters of countries with similar water-economy profiles is therefore not only analytically useful but also policy-relevant, because it enables differentiated interpretation rather than one-size-fits-all regional prescriptions. Previous work has shown that coupling decoupling analysis with decomposition and hierarchical clustering can provide precisely this kind of mechanistic and comparative insight, revealing regional patterns and policy-relevant groupings that descriptive statistics alone cannot capture.
The lack of a quantitative analysis that incorporates spatio-temporal assessment, Tapio decoupling, and LMDI decomposition to explain industrial water use dynamics in the MENA region is significant because MENA’s water crisis is increasingly bound up with industrial strategy, yet the evidence base for understanding this relationship remains thinner than the policy stakes would require. This study therefore addresses that gap by examining industrial water withdrawal across MENA through a unified analytical framework designed to capture both patterns and mechanisms. Specifically, the study: (i) tracks the spatial and temporal evolution of industrial water use across four seven-year periods (between 1995 and 2022) and groups countries according to similarities in industrial water withdrawal and GDP; (ii) evaluates the extent to which industrial water use has decoupled from economic growth; and (iii) decomposes the observed changes into technical, industrial structure, economic development and population effects. In doing so, the study responds to the central need identified in the literature: direct, quantitative and regionally comparable evidence on industrial water use as distinct from broader resource-use indicators. Such an approach is needed not simply to improve description, but to clarify whether industrial growth in MENA is becoming less water-intensive, which countries are diverging from that trajectory, and which drivers are most responsible for those outcomes.
The significance of this contribution is both empirical and strategic. Empirically, it moves the discussion beyond isolated country cases toward a regional comparative assessment capable of detecting common tendencies and national divergences. Strategically, it provides a basis for more differentiated water policy: where technological effects dominate, efficiency upgrading becomes central; where industrial structure is decisive, sectoral transformation becomes more important; where economic development or population effects are strongest, broader growth planning and demand management must be brought into the analysis. In a region where water scarcity increasingly defines the outer boundary of feasible development, understanding these distinctions is essential. The remaining sections of this paper are organized as follows: the materials and methods are described in Section 2; Section 3 and Section 4 present the results and discussion; Section 5 provides the study limitations, and Section 6 provides our main conclusions.

2. Materials and Methods

2.1. Study Area

This study covers 18 countries in the Middle East and North Africa (MENA): Algeria, Bahrain, Egypt, Iran, Iraq, Israel, Jordan, Kuwait, Lebanon, Libya, Morocco, Oman, Qatar, Saudi Arabia, the Syrian Arab Republic, Tunisia, the United Arab Emirates, and Yemen. Collectively, these countries span North Africa, the Levant, the Arabian Peninsula and the Iranian Plateau, thereby capturing a wide range of hydro-climatic settings, development pathways and industrial structures within one of the world’s most water-constrained regions. The study area includes oil- and gas-based economies, diversified industrializing economies, import-dependent states, and countries experiencing protracted political and infrastructural stress. This regional breadth is analytically important because industrial water use in MENA is shaped not only by scarcity but also by differences in industrial composition, population size, economic scale, infrastructure, and the balance between conventional and non-conventional water resources [29,30].
The present study evaluates industrial water withdrawal across multiple periods, allowing changes in industrial water use and its drivers to be examined over time. Four seven-year periods were analyzed over 1995–2022: 1995–2001, 2002–2008, 2009–2015, and 2016–2022. Summary statistics of industrial water withdrawal across these periods in the studied region are presented in Appendix A (Table A1). In addition, the study adopts the AQUASTAT definition of industrial water withdrawal, which is the annual quantity of water withdrawn for industrial purposes from surface water or groundwater sources. Table 1 summarizes the countries included in the analysis, their subregional location, population, and total renewable water resources per capita in 2022.

2.2. Decoupling Analysis

Decoupling analysis was used to assess whether changes in industrial water withdrawal occurred more slowly or more rapidly than changes in industrial economic output. In sustainability analysis, decoupling refers to a non-synchronous relationship between economic growth and environmental pressure [31,32]. In the present study, this framework was applied to examine whether industrial growth in MENA became progressively less dependent on industrial water withdrawal over time. The analysis employed Tapio’s elasticity-based decoupling index [33], which can measure the ratio between the relative change in industrial water withdrawal and the relative change in industrial economic output [15]. The decoupling elasticity for country i in a given period was calculated as:
d i = Δ W / W 0 Δ G / G 0
where di is the decoupling elasticity, W is industrial water withdrawal, and G is industrial economic output. In this study, industrial economic output was represented by industry value added. The subscripts 0 and t denote the initial and final years of each analytical period, respectively. Hence,
Δ W = W t W 0
and
Δ G = G t G 0
so that Equation (1) can be expanded as:
d i = ( W t W 0 ) / W 0 ( G t G 0 ) / G 0
This elasticity expresses the responsiveness of industrial water withdrawal to changes in industrial output. To interpret the elasticity values, each country-period observation was classified according to Tapio’s eight-state decoupling framework [33], presented in Table 2. This classification combines the sign of the change in industrial water withdrawal Δ W , the sign of the change in industrial output Δ G , and the magnitude of the elasticity d i .
In interpretive terms, strong decoupling represents the most favorable outcome because industrial output expands while industrial water withdrawal declines. Weak decoupling is also considered desirable, since industrial growth is accompanied by a proportionally smaller increase in water withdrawal. Expansive coupling indicates that industrial water use is growing in step with output, while expansive negative decoupling indicates a deterioration in water-use performance because industrial water withdrawal grows faster than industrial output. When industrial output declines, the remaining four states distinguish whether water withdrawal also contracts and whether that contraction is slower, similar to, or faster than the contraction in output. Among these, strong negative decoupling is the least desirable because industrial activity contracts while industrial water withdrawal still rises. The classification therefore provides a richer interpretation than simple growth rates, allowing the quality of the water-growth relationship to be assessed across countries and periods.

2.3. Cluster Analysis and Principal Component Analysis

To identify countries with similar industrial water-use and economic profiles, hierarchical cluster analysis was performed using industrial water withdrawal and GDP for the terminal year of the study period, 2022. Before clustering, the variables were standardized using z-scores so that differences in scale and magnitude would not dominate the classification. Standardization ensured that both variables contributed comparably to the clustering solution. The clustering procedure followed Ward’s minimum-variance hierarchical method with Euclidean distance as the similarity metric. Ward’s method was selected because it minimizes within-cluster variance while maximizing between-cluster separation, making it well suited to cross-country comparative analysis [34]. A recent water-use application is provided by Kipkirui et al. [3]. Euclidean distances among countries were computed from the standardized variables and visualized using a dendrogram.
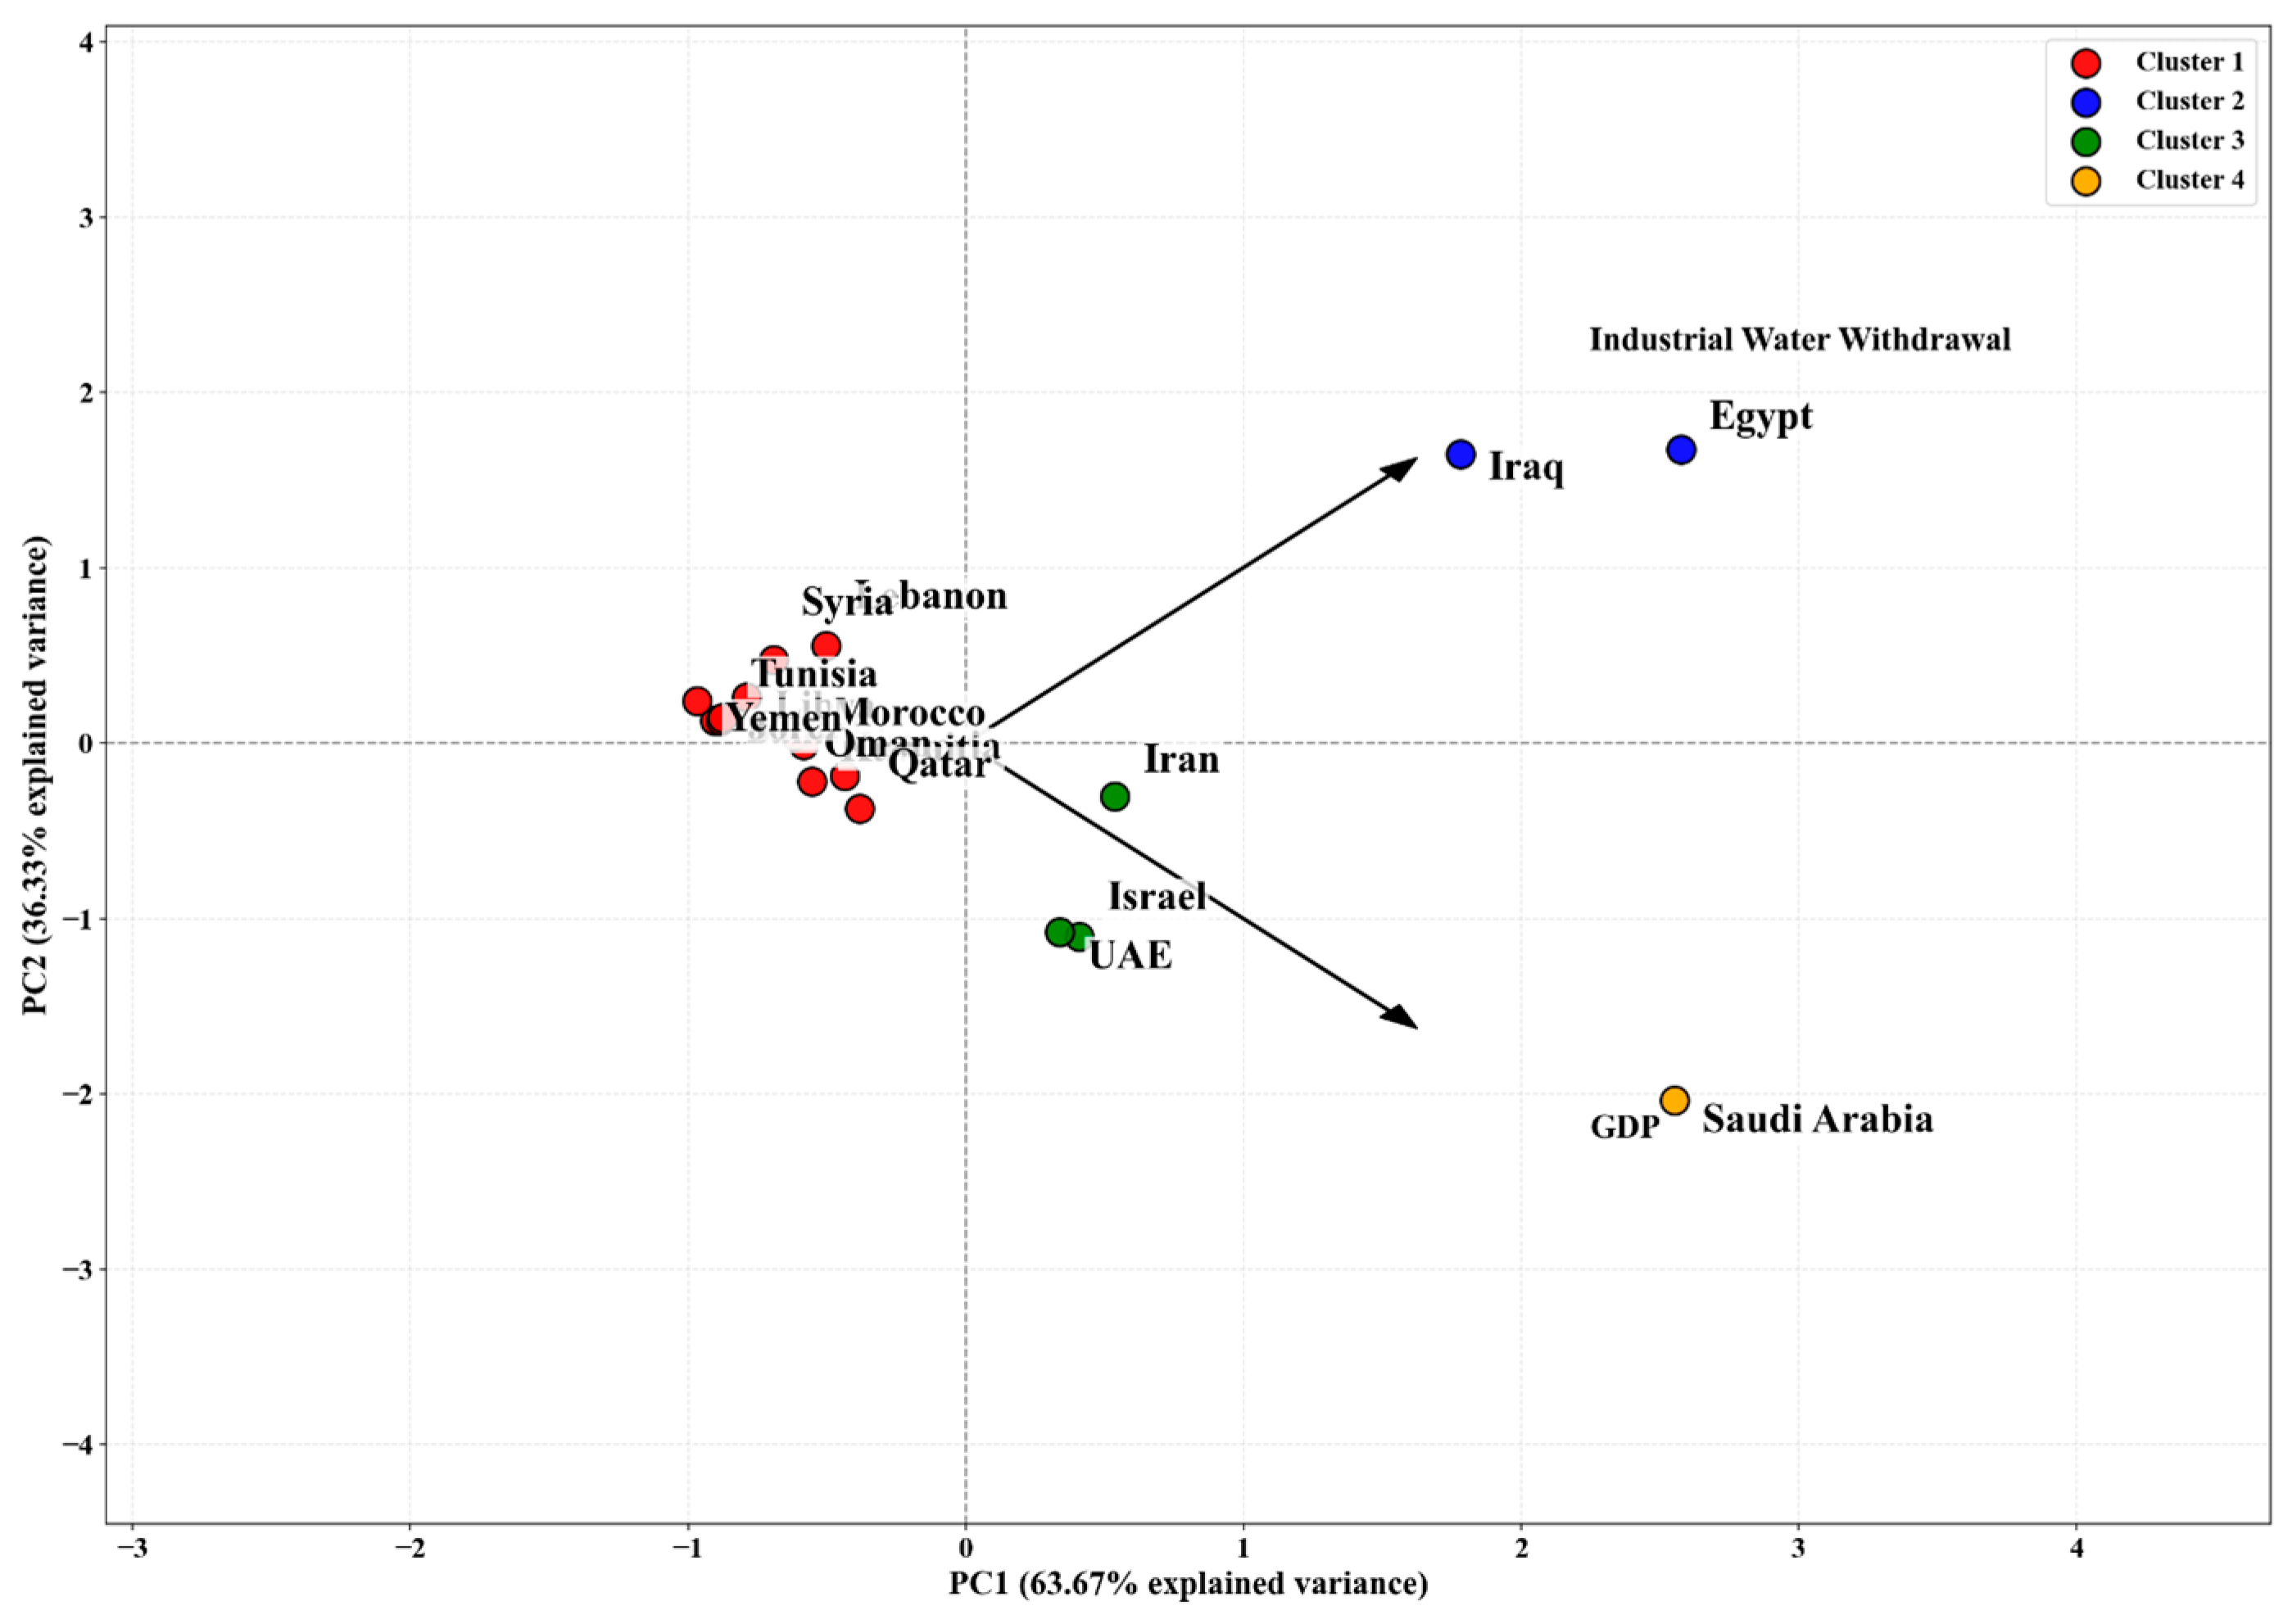
Additionally, principal component analysis (PCA) was used as a complementary multivariate ordination tool to visualize the relative position of countries in reduced-dimensional space and to assess whether the cluster solution was supported by the dominant structure of the data. PCA was applied to the same standardized variables used in the cluster analysis. The first two principal components were retained for visualization because they captured the largest share of the total variance in the data. Country scores were plotted in the PC1–PC2 plane and colored by cluster membership, while loading vectors were used to indicate the relative contribution of GDP and industrial water withdrawal to the ordination pattern.

2.4. Decomposition Analysis

To identify the forces driving changes in industrial water withdrawal, the LMDI decomposition method was applied, following the practical formulation proposed by Ang [35]. Decomposition analysis separates the change in an aggregate indicator into a set of interpretable explanatory components, thereby revealing the contribution of different structural, technological, and other related drivers [36]. Among available index decomposition approaches, LMDI is particularly suitable because it is mathematically consistent, easy to implement, robust, accurate in attributing observed changes to underlying drivers, and can be expressed without a residual term [37]. In studies of water use, this feature is advantageous because it enables the observed change in withdrawal to be attributed directly to a limited number of clearly defined factors. The decomposition was based on a Kaya-type identity in which total industrial water withdrawal is expressed as the product of four factors:
W = W V   ·   V G   ·   G P   ·   P
where W denotes industrial water withdrawal, V denotes industry value added, G denotes GDP, and P denotes population. The four multiplicative terms correspond to the drivers analyzed in this study:
W t e c = W V
W s t r = V G
W e c o = G P
W p o p = P
Substituting these terms into Equation (5) yields:
W = W t e c   ·   W s t r   ·   W e c o   ·   W p o p
In this formulation, W t e c represents the technical effect, defined as industrial water withdrawal per unit of industry value added. It captures the water intensity of industrial production and therefore reflects technological efficiency and water-saving performance. W s t r represents the industrial structure effect, defined as the share of industry value added in total GDP, and captures the extent to which shifts in the composition of the economy influence industrial water withdrawal. W e c o represents the economic development effect, expressed as GDP per capita, and reflects the contribution of rising average economic output to industrial water demand. Finally, W p o p represents the population scale term in the Kaya-type identity, and its contribution to industrial water withdrawal is captured through the decomposition component Δ W p o p , which measures how changes in population affect the overall scale of withdrawal over time.
The additive LMDI decomposition of the change in industrial water withdrawal between the initial year 0 and final year t is then written as:
Δ W = W t W 0
Δ W = Δ W t e c + Δ W s t r + Δ W e c o + Δ W p o p + Δ W r
where Δ W t e c , Δ W s t r , Δ W e c o , and Δ W p o p are the contributions of technical change, industrial structure, economic development and population, respectively, and Δ W r is the decomposition residual. In the standard LMDI additive form, the residual is theoretically zero [38], which is one of the main advantages of the method over simpler decomposition approaches.
The contribution of each factor was calculated using the logarithmic mean weight function. For the technical effect, the additive contribution is:
Δ W t e c = L W t ,   W 0   ·   I n   W t e c , t W t e c , 0
For the industrial structure effect:
Δ W s t r = L W t ,   W 0   ·   I n   W s t r , t W s t r , 0
For the economic development effect:
Δ W e c o = L W t ,   W 0   ·   I n   W e c o , t W e c o , 0
And for the population effect:
Δ W p o p = L W t ,   W 0   ·   I n   W p o p , t W p o p , 0
where the logarithmic mean function L ( W t , W 0 ) is defined as:
L W t ,   W 0   =   W t W 0 ln W t ln W 0 W t W 0 ,   W t > 0 ,   W 0 > 0
and, when Wt = W0,
L W t , W 0 = W t = W 0
Using these expressions, the total change in industrial water withdrawal can be decomposed fully into the four driver effects:
Δ W = Δ W t e c + Δ W s t r + Δ W e c o + Δ W p o p
with the residual term approaching zero:
Δ W r = Δ W Δ W t e c + Δ W s t r + Δ W e c o + Δ W p o p = 0
The sign of each contribution has a direct interpretation. A positive contribution indicates that the corresponding factor increased industrial water withdrawal over the period, whereas a negative contribution indicates that it reduced industrial water withdrawal. The decomposition analysis was performed for four study periods of 1995–2001, 2002–2008, 2009–2015, and 2016–2022.

2.5. Data Sources

For this study, we employed industrial water withdrawal data from FAO AQUASTAT (available: https://data.apps.fao.org/aquastat/?lang=en; accessed on 18 March 2026). The Industrial Water Withdrawal dataset is available as Table S1 in the attached Supplementary material.
In addition, GDP, industry value added, and total population data were obtained from the World Bank database (available: https://data.worldbank.org/; accessed on 18 March 2026). Annual country-level data for the 18 MENA countries were compiled for the four study periods already described above. Although the extracted AQUASTAT series provided annual country-level entries for all 18 countries over 1995–2022, some country records contained repeated values over consecutive years, indicating that not all annual entries necessarily reflected independently updated national observations. This was particularly evident for conflict-affected cases such as the Syrian Arab Republic and Yemen, whose reported industrial water withdrawal values remained unchanged over extended periods in the downloaded series. Accordingly, the analysis used the AQUASTAT values exactly as reported and did not infer unobserved year-to-year variation. Furthermore, data processing, statistical analysis and visualization were conducted in Python (v3.13.0) using the Spyder integrated development environment (Version 6). After drafting, Grammarly web-based editor (available: https://app.grammarly.com/) was used for language editing and improvement, after which the authors read and confirmed the final manuscript.

3. Results

3.1. Spatio-Temporal Distribution of Industrial Water Withdrawal per Capita in MENA

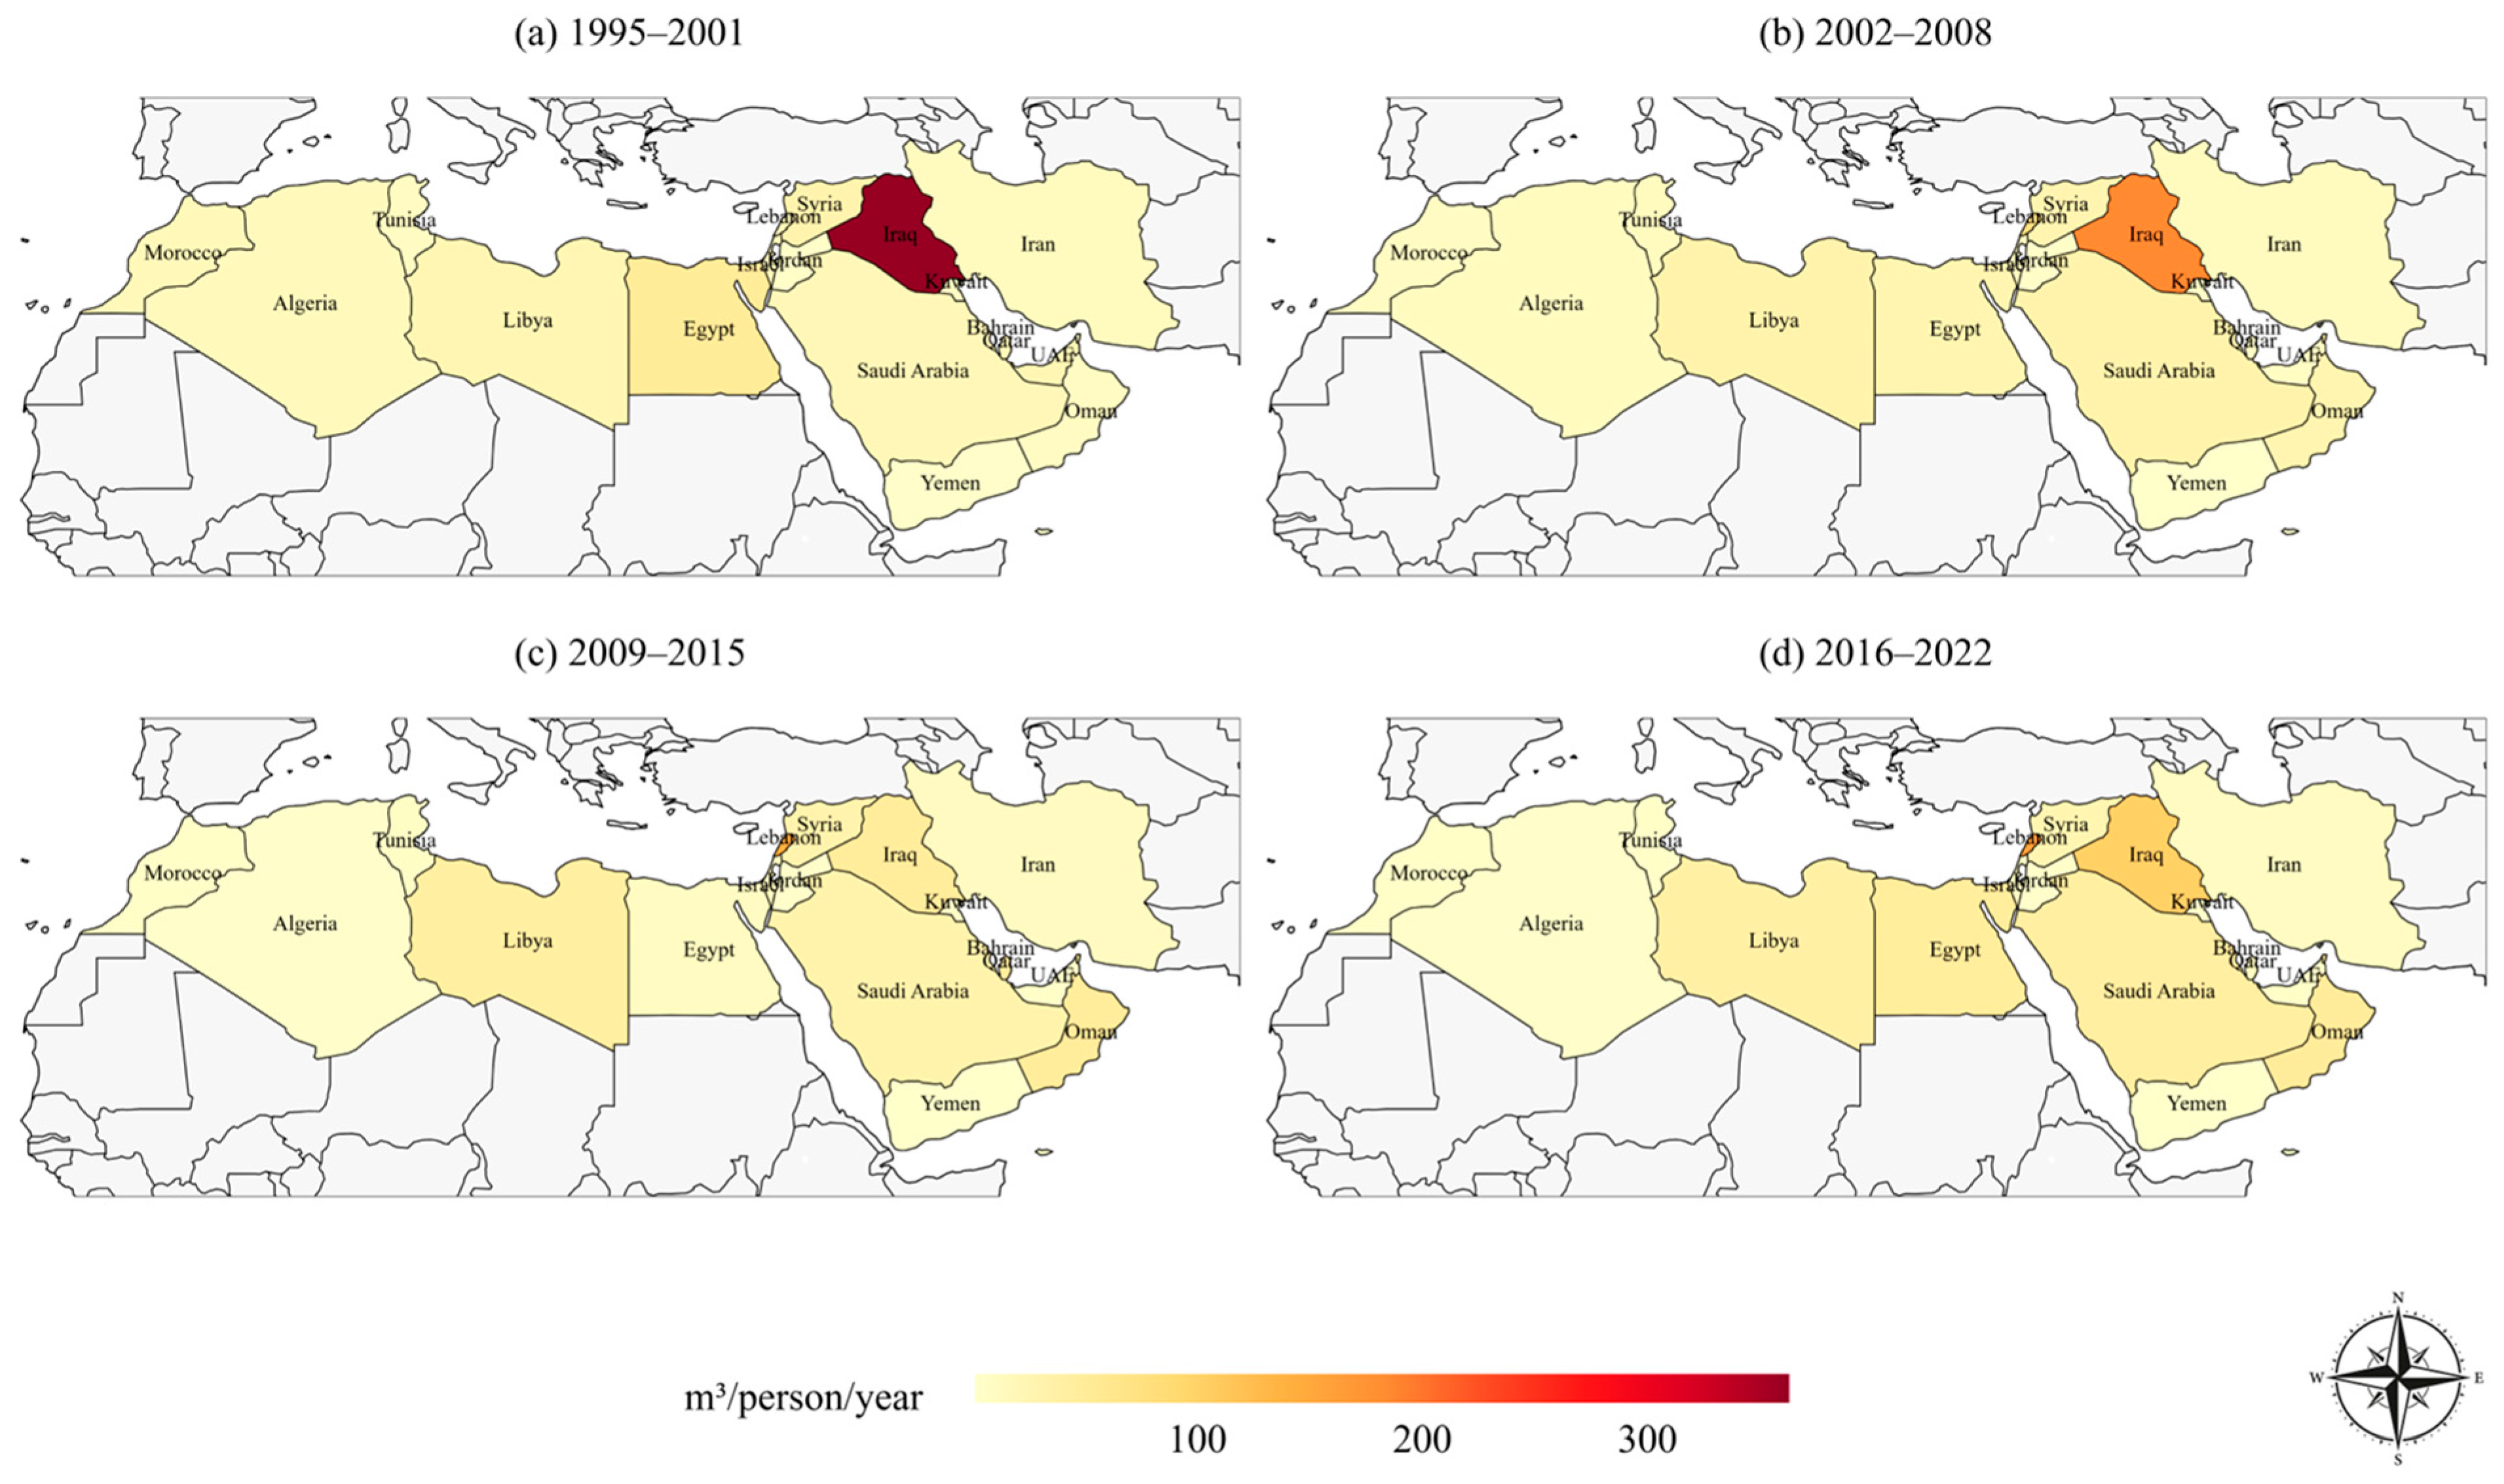
Industrial water withdrawal per capita in MENA was highly concentrated, with a narrow upper tier clearly separated from a much larger group of low-intensity countries (Figure 1). The strongest concentration occurred in Iraq during 1995–2001, when withdrawal intensity exceeded 300 m3/person/year, whereas most of the region remained below 100 m3/person/year. This means Iraq’s level was at least three times the dominant regional range. Some redistribution occurred in 2002–2008. While Iraq still recorded the highest withdrawal intensity, its level fell sharply to between ~150–200 m3/person/year, implying a reduction of 40–50% relative to 1995–2001. At the same time, there was some marked increase in industrial water withdrawal for nations like Lebanon, Libya, Saudi Arabia, and Oman, with withdrawal ranging between ~100–110 m3/person/year. The pattern in 2009–2015 became more differentiated. Withdrawal intensities for Lebanon had reached the range of 150–200 m3/person/year, making the nation the highest-intensity spot in the region. Below that uppermost tier, Libya, Iraq, Saudi Arabia, Bahrain, Qatar, and Oman converged within a similar intermediate range (~100–120 m3/person/year), indicating that the regional structure was no longer dominated by a single extreme case alone. This matters because it reveals a broader upper-middle grouping of countries with elevated industrial water withdrawal per capita, even though Lebanon remained the most intense case. The rest of MENA stayed concentrated in lower ranges (below 100 m3/person/year), reinforcing the contrast between a very limited set of high-intensity countries and the broader regional baseline. In 2016–2022, Lebanon again remained slightly higher than Iraq, even though Iraq intensified relative to the previous period. Both countries occupied the highest regional range, approximately 150–200 m3/person/year, but Lebanon still retained the uppermost position. A second grouping was also evident in this final period: Libya, Egypt, Saudi Arabia and Oman occupied a similar intermediate range below the Lebanon–Iraq pair. This indicates that the late-period pattern combined persistent upper-tail concentration with the emergence of a more clearly defined secondary band of moderate-to-high intensity countries. The remaining countries consistently occupied lower ranges across the four periods. This observation implies that the regional pattern was therefore not one of generalized escalation, but of repeated concentration in a limited number of national cases.

3.2. Cross-Country Clustering of Industrial Water Use and Economic Performance in MENA

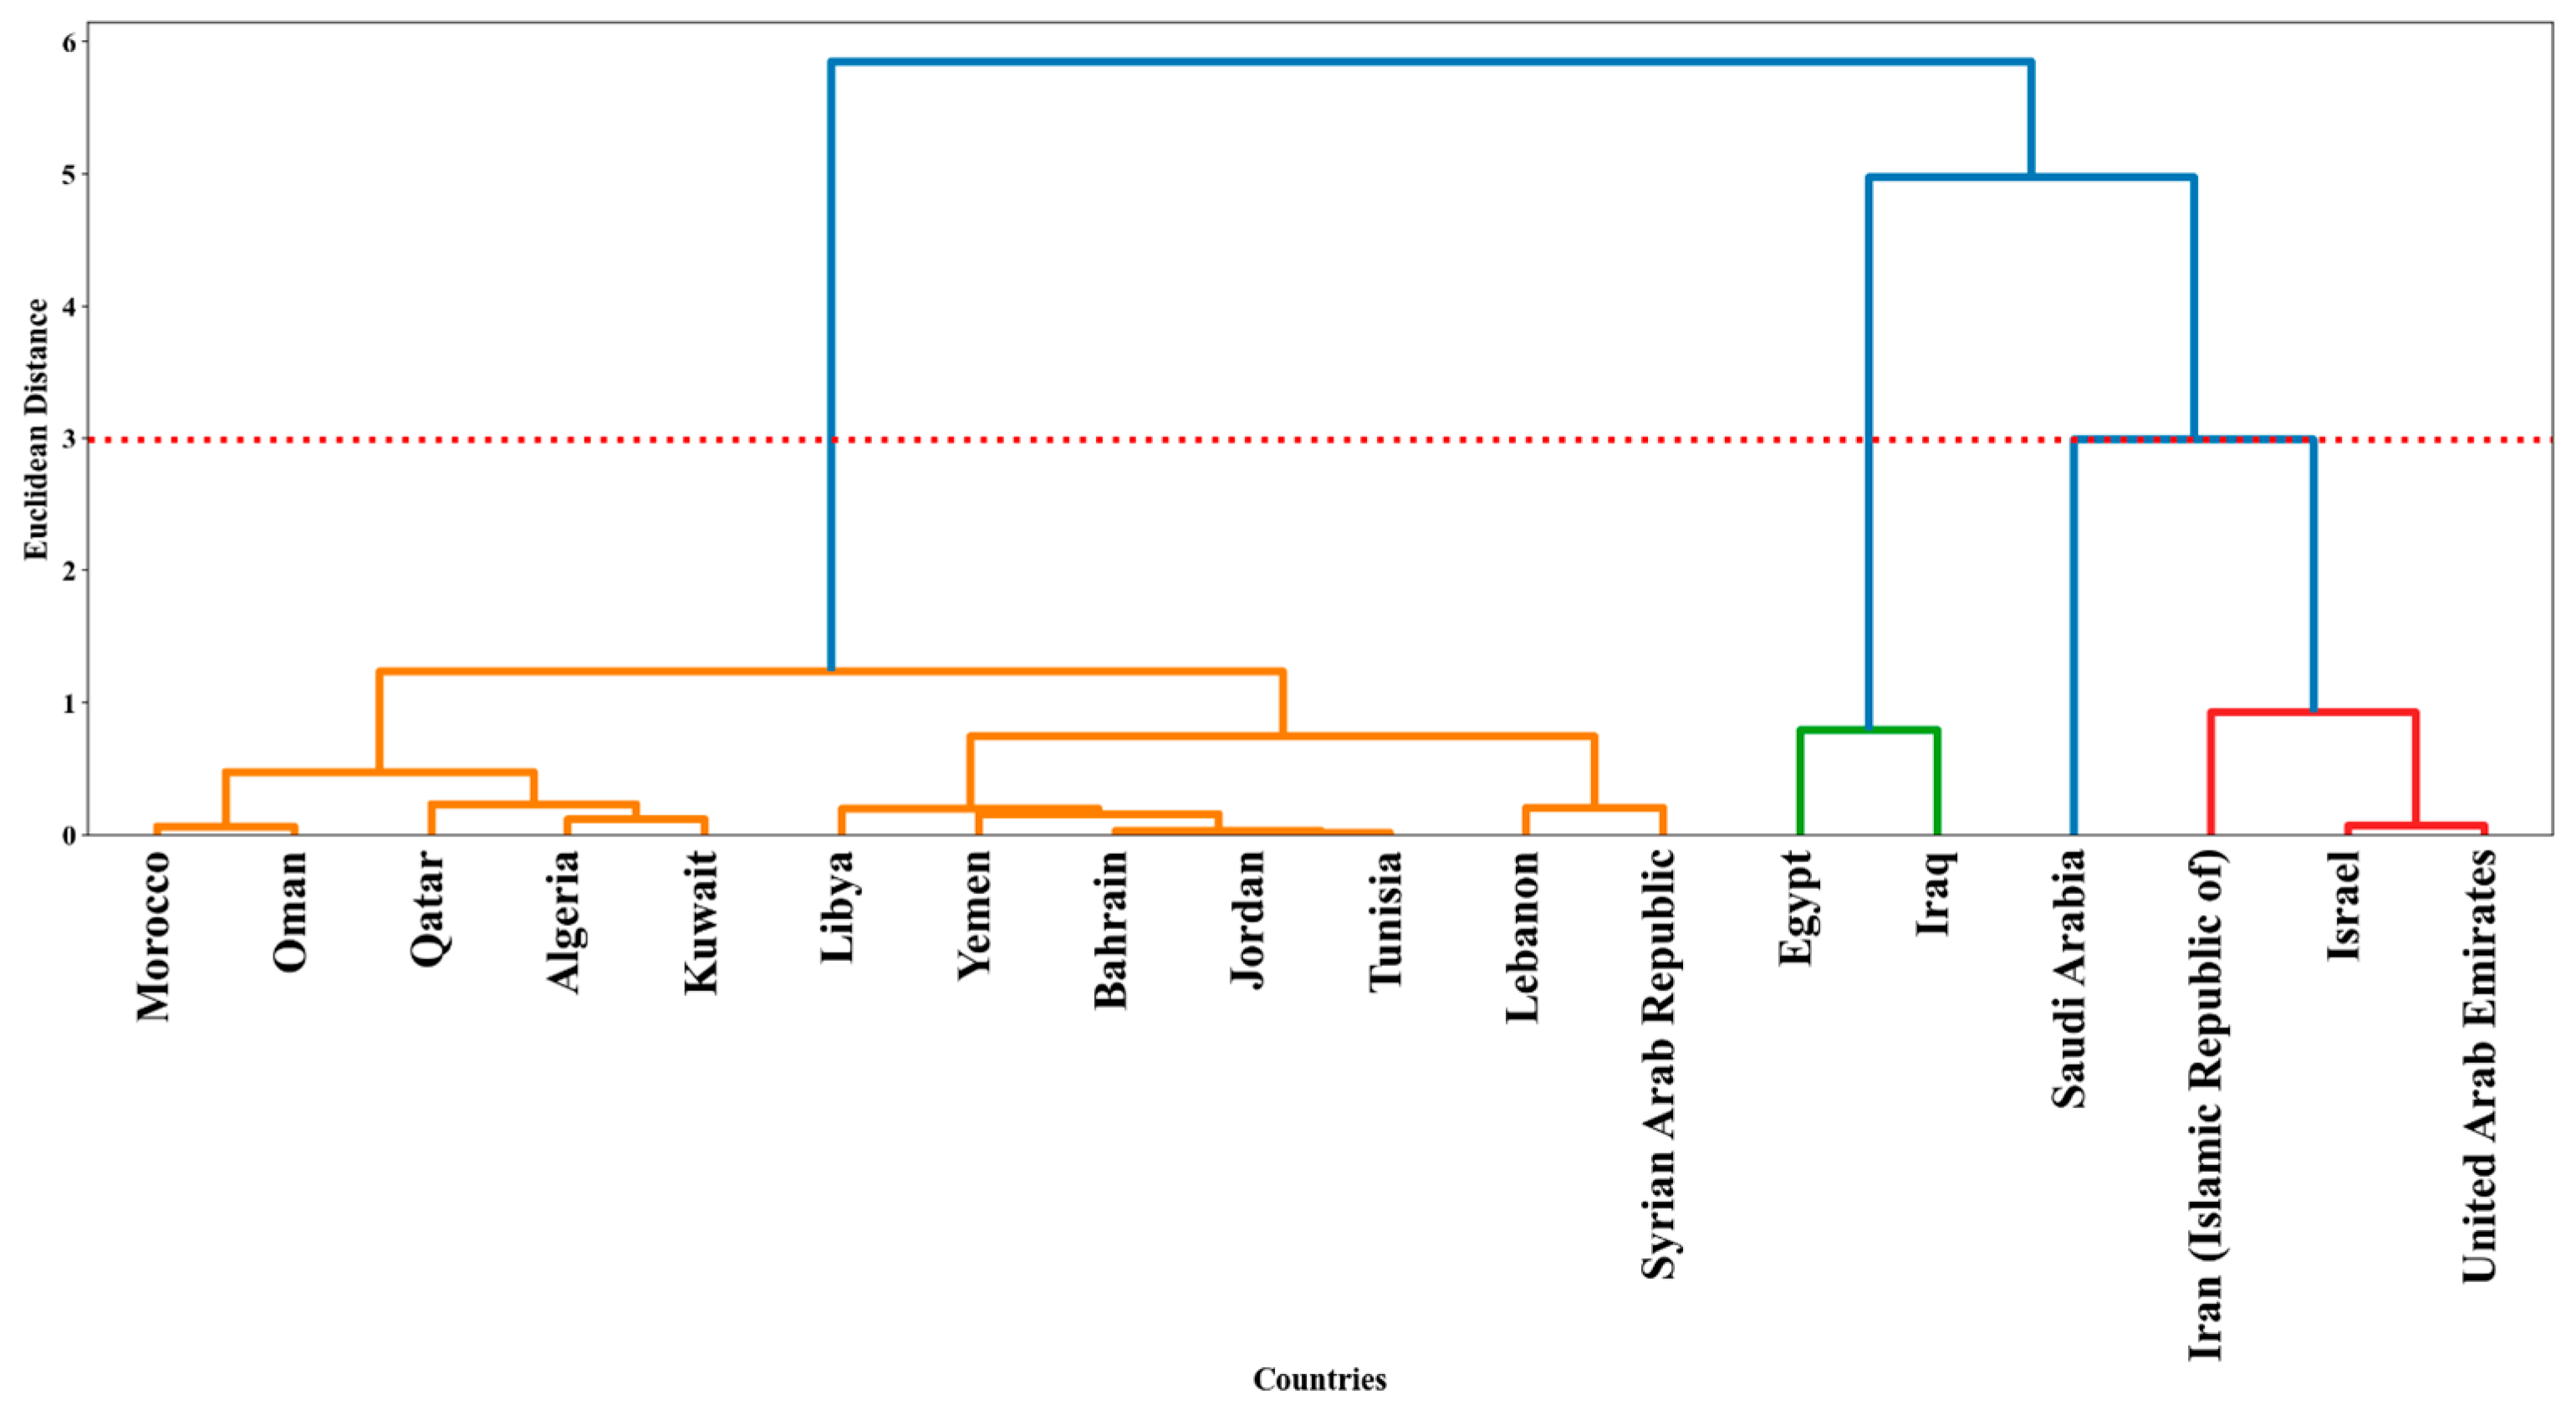
The 2022 country profiles resolve into four distinct clusters, supporting the structural segmentation of the regional pattern observed in Section 3.1. The clustering was driven by differences in the countries’ combined 2022 industrial water withdrawal and GDP profiles, with countries in the same cluster showing greater similarity across these two variables. At a Euclidean distance of 3.0, one large cluster, two smaller groups, and one standalone case are clearly distinguished (Figure 2). The dominant cluster includes Morocco, Oman, up to the Syrian Arab Republic. These countries merge at relatively low distances, mostly below about 1.3, indicating strong internal similarity. This cluster represents the broad regional middle, where neither GDP nor industrial water withdrawal is sufficiently extreme to separate countries from the main body of the sample. A second cluster is formed by Egypt and Iraq, which merge at a very low distance of 0.8 but remain separated from the large baseline cluster until around 5.0. This indicates a close two-country relationship combined with strong dissimilarity from the rest of MENA. A third cluster groups Iran, Israel and the United Arab Emirates. Within this group, Israel and the UAE form the tightest pair, with Iran joining at a somewhat higher distance. This cluster differs from both the Egypt–Iraq group and the large baseline group, indicating that these countries have a different balance between industrial water use and economic development. The fourth cluster consists only of Saudi Arabia, which remains isolated until the cut-off distance. Its late fusion with the Iran–Israel–UAE group indicates that its profile is structurally unique in the regional dataset. This is important because Saudi Arabia did not occupy the highest per capita withdrawal tier in Section 3.1, yet it remains distinct once GDP and industrial water withdrawal are considered jointly.
The PCA confirms this structure (Figure 3). PC1 explains 63.67% of the total variance, and PC2 explains 36.33%, so the two axes capture the full clustering pattern. Egypt and Iraq lie far in the positive direction associated with industrial water withdrawal, which explains their separate grouping. Saudi Arabia is positioned furthest along the GDP direction, confirming that its isolation is driven primarily by economic scale. Iran, Israel and the UAE occupy an intermediate position between these two poles, while the large baseline cluster remains concentrated near the origin. These results support the spatial interpretation in Section 3.1. The clustering shows that once GDP is introduced, Iraq remains structurally distinct, whereas Lebanon is absorbed into the broad middle cluster, indicating that its per capita intensity does not translate into the same overall economic water profile. This further confirms that the regional structure is defined not only by withdrawal intensity but by the balance between industrial water use and economic scale.

3.3. Water–Growth Decoupling Trajectories Across MENA

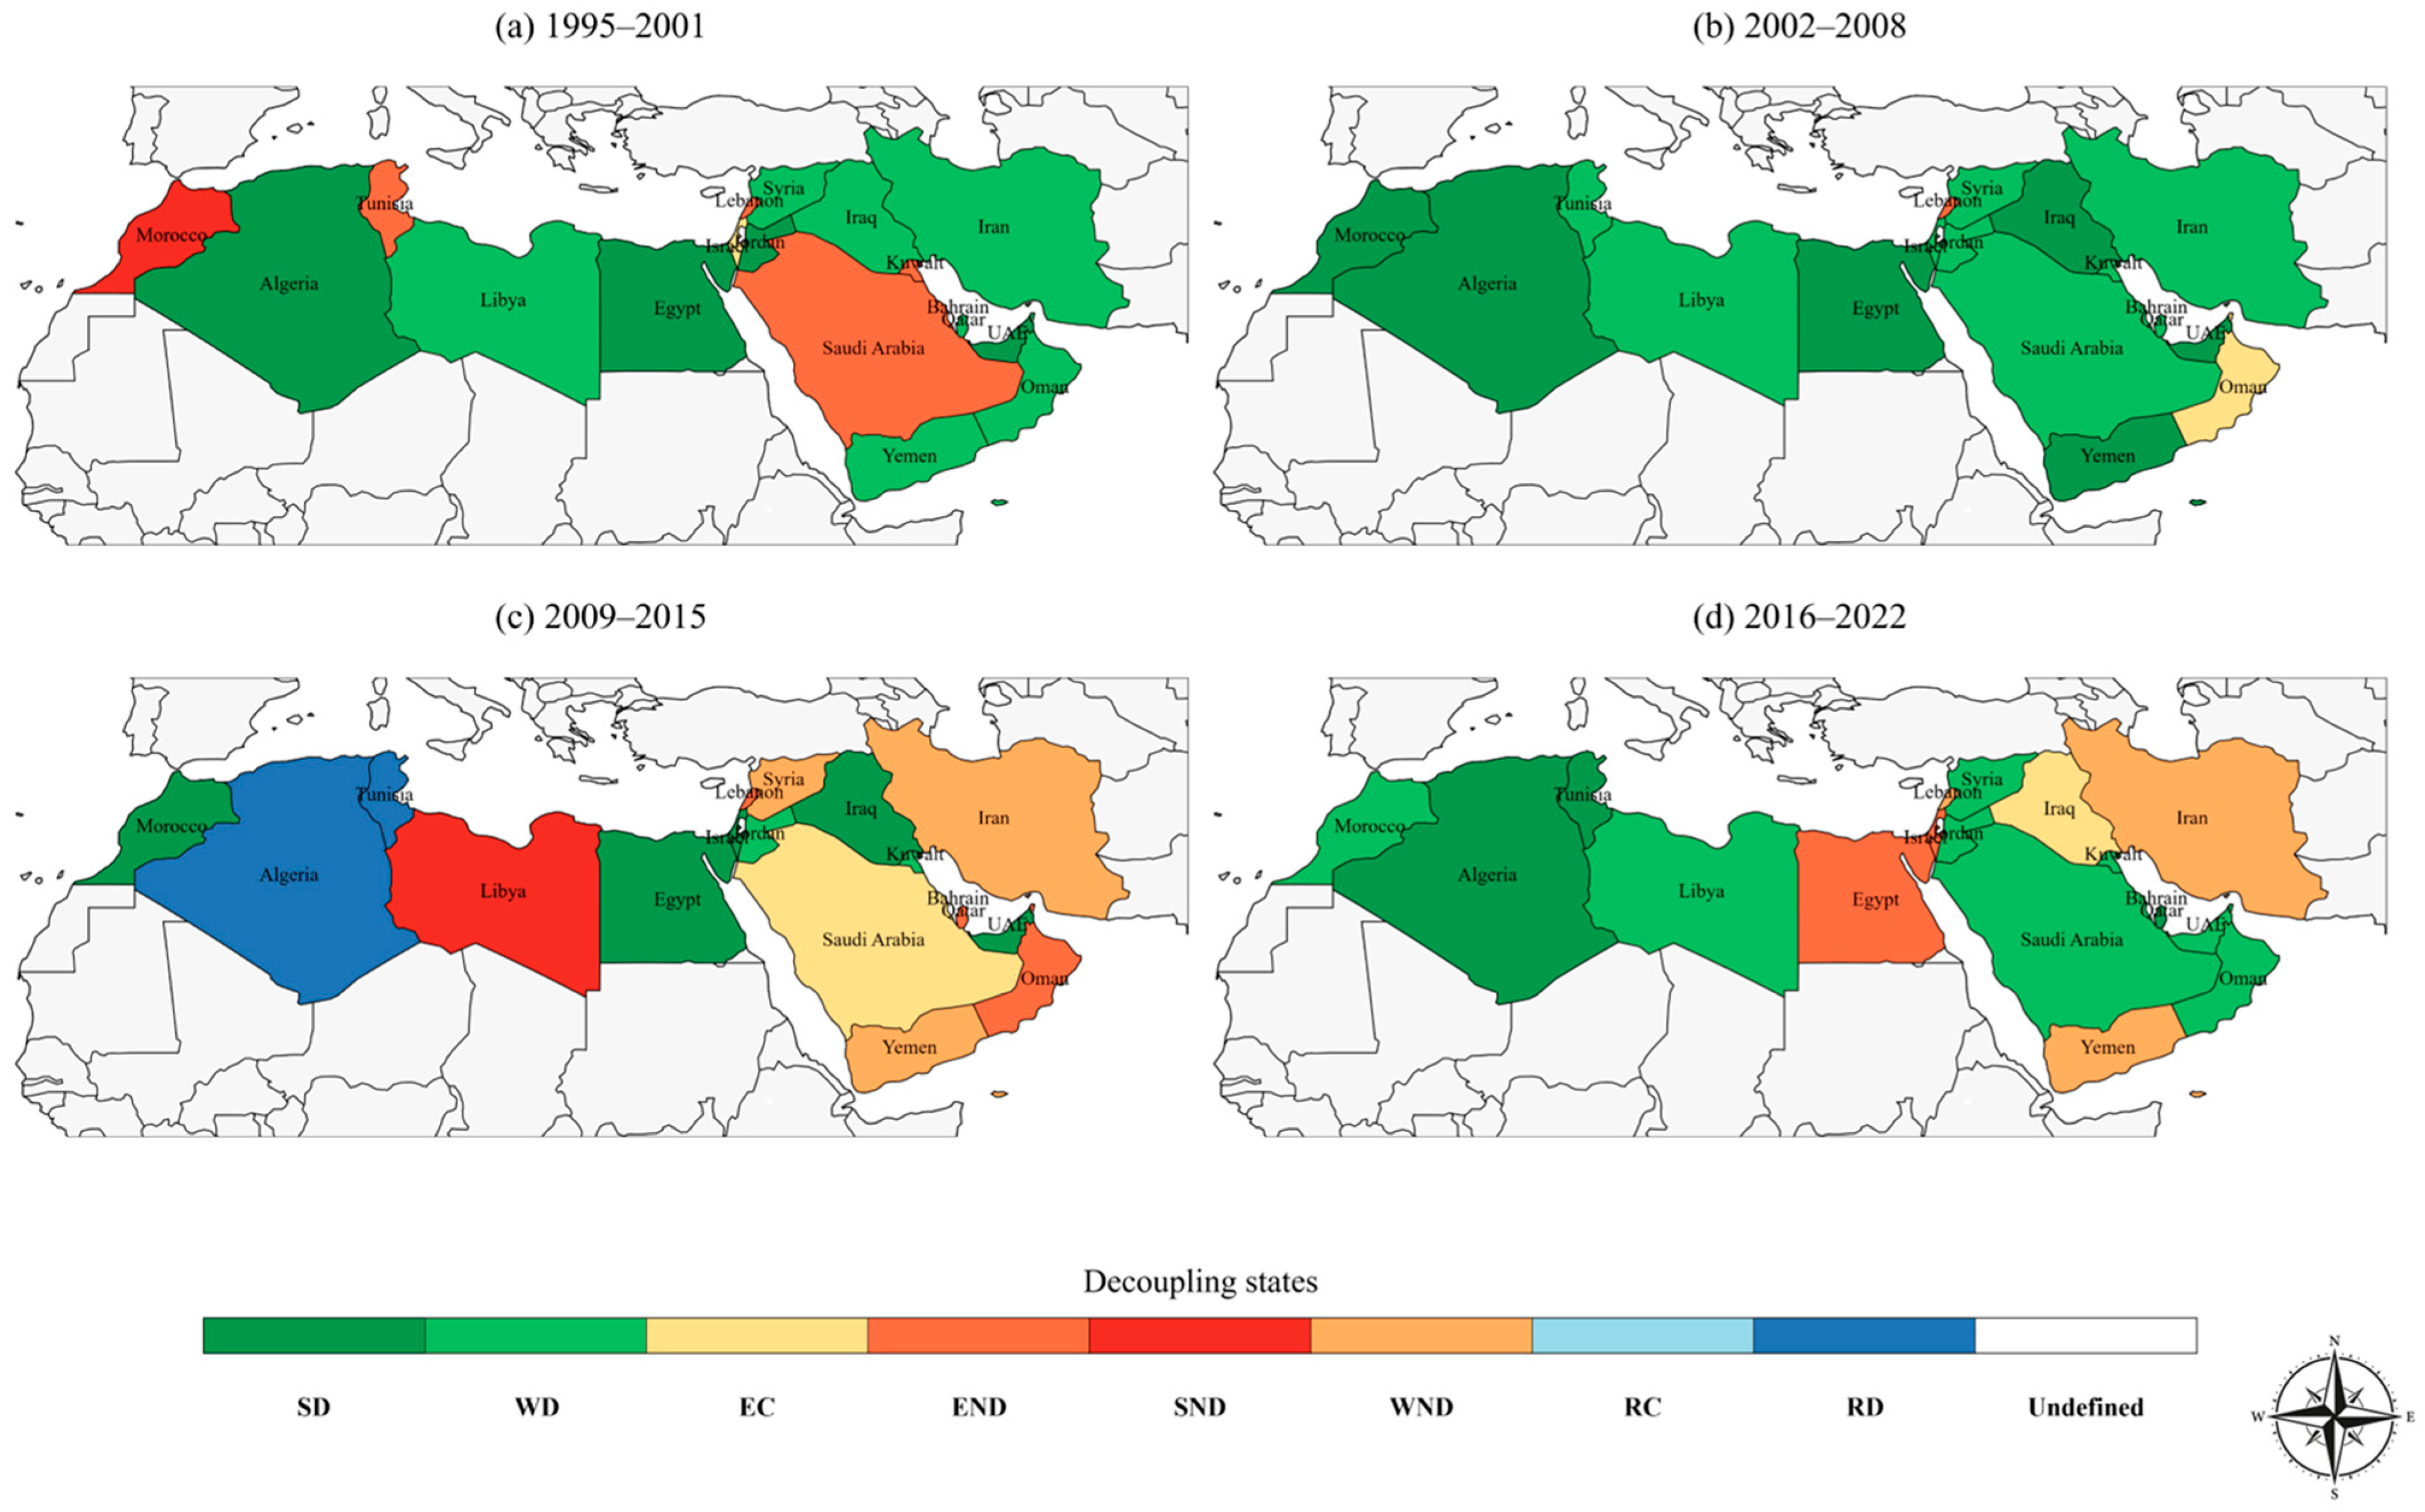
The decoupling pattern across MENA evolved in three clear stages: an uneven starting configuration in 1995–2001, a short phase of broad improvement in 2002–2008, and a distinctly mixed regional regime from 2009 onward (Figure 4). In 1995–2001, Strong decoupling (SD) was achieved by Algeria, Egypt, Jordan, and the UAE, indicating that industrial water withdrawal declined even as industrial output increased. A second group, including Libya, Syria, Iraq, Iran, Qatar, Oman, and Yemen, recorded weak decoupling (WD), meaning that water withdrawal still rose, but more slowly than industrial economic growth. This relatively positive structure was offset by clear adverse cases: Tunisia, Lebanon, Kuwait, and Saudi Arabia entered expansive negative decoupling (END), while Morocco registered strong negative decoupling (SND), the most unfavorable outcome in the period.
The most coherent improvement occurred between 2002 and 2008. At this stage, SD expanded to Morocco, Algeria, Egypt, Iraq, the UAE, and Yemen, while Tunisia, Libya, Syria, Israel, Jordan, Kuwait, Bahrain, Qatar, Saudi Arabia, and Iran remained in WD. In effect, most of the region was either reducing industrial water withdrawal outright or allowing it to grow more slowly than industrial output. Oman was the clearest exception, shifting to expansive coupling (EC), where industrial water withdrawal and industrial output increased at broadly similar rates.
That coherence disappeared in 2009–2015, when the region became markedly heterogeneous. Morocco, Egypt, Israel, Iraq, and the UAE remained in SD, but several countries deteriorated sharply. Algeria and Tunisia shifted to recessive decoupling (RD), Libya moved into SND, Iran, Syria, and Yemen entered weak negative decoupling (WND), Saudi Arabia moved into EC, and Oman and Lebanon shifted further into END.
The period 2016–2022 retained that mixed structure, although with some redistribution of outcomes. Algeria and Tunisia returned to SD, while Morocco, Libya, Syria, Jordan, Saudi Arabia, Kuwait, Bahrain, Qatar, the UAE, and Oman were in WD, indicating renewed but incomplete improvement in several parts of the region. At the same time, Egypt and Israel shifted into END, Iran, Lebanon, and Yemen remained in WND, and Iraq moved into EC. Thus, even though some of the more severe outcomes observed in 2009–2015 receded, the region did not return to the broad decoupling alignment realized in the 2002–2008 period.

3.4. Drivers of Change in Industrial Water Withdrawal Across MENA

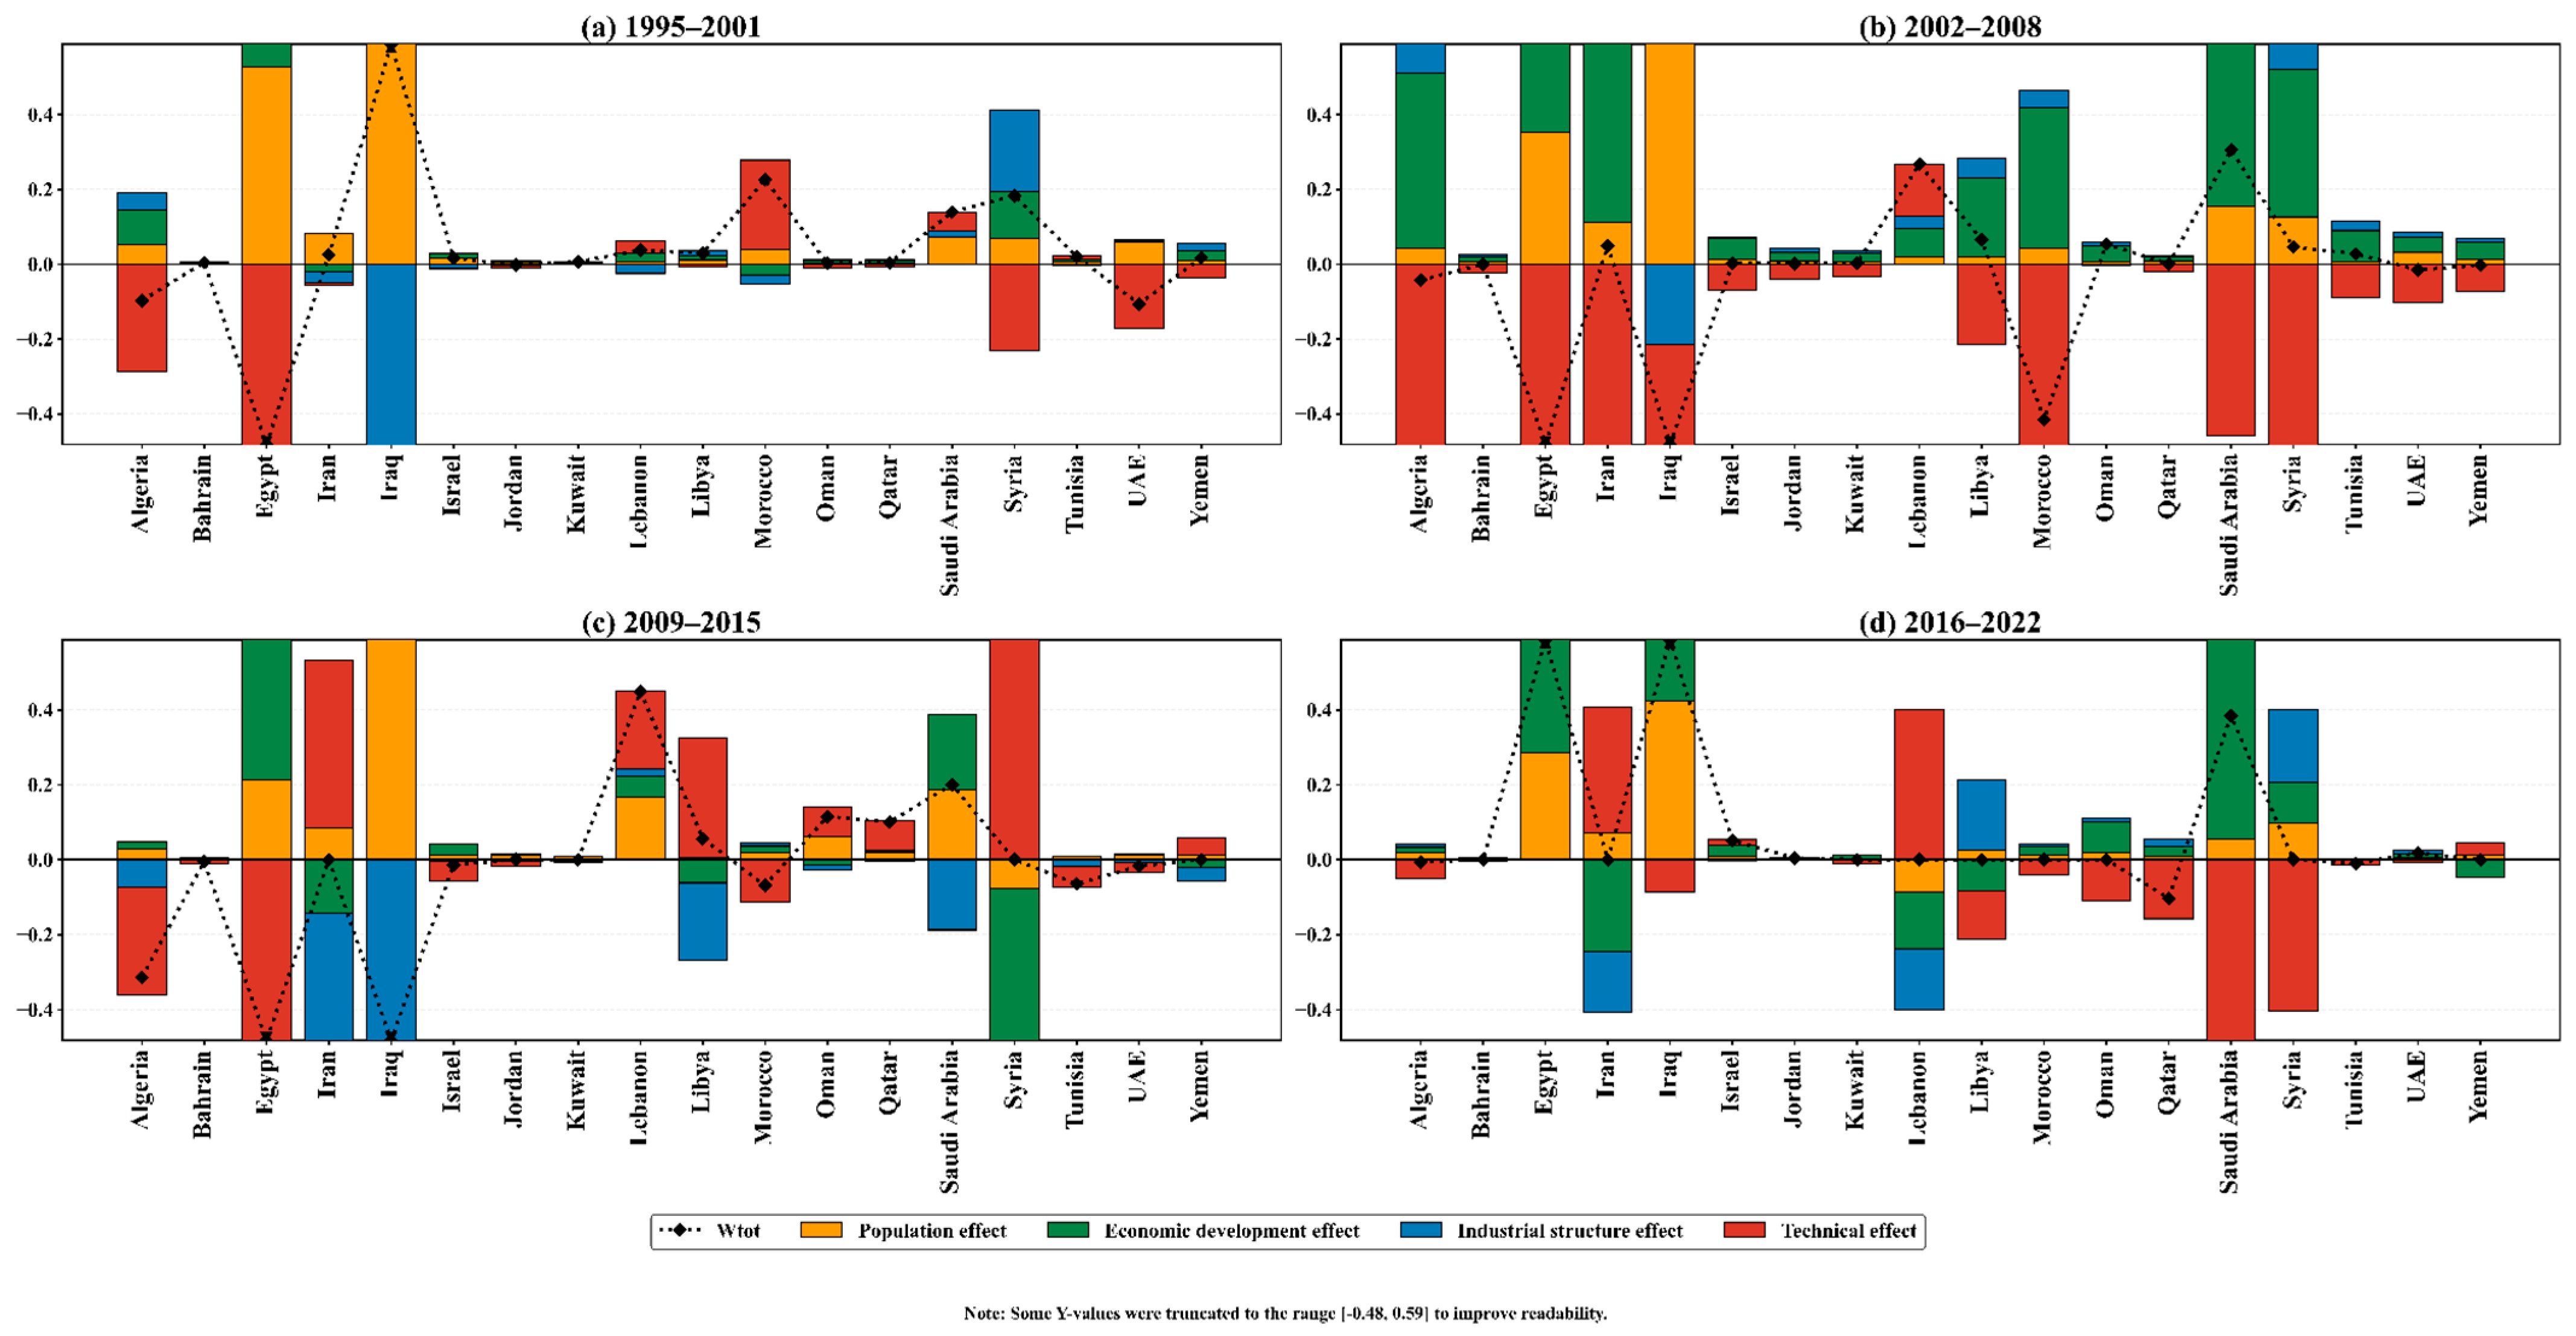
The decomposition results show that changes in industrial water withdrawal were driven mainly by the interaction between population growth, economic development, and a highly variable technical effect, while the industrial structure effect acted more selectively (Figure 5). In most cases, the aggregate effect (Wtot) was not controlled by a single driver, but by the extent to which expansionary demographic and economic pressures were either reinforced or offset by technical and structural change.
In the period 1995–2001, the strongest positive aggregate occurred in Iraq, where Wtot reached the upper truncation threshold of 0.59. This increase was driven overwhelmingly by the population effect, while a strongly negative industrial structure effect partly offset the gain. Positive aggregates were also evident in Morocco (∼0.23), Syria (∼0.19), and Saudi Arabia (∼0.12). In Morocco, the increase was dominated by the technical effect, whereas in Syria, the main positive contribution came from the industrial structure effect (about 0.35), despite a substantial negative technical contribution. By contrast, Egypt recorded the sharpest decline, with Wtot reaching the lower truncation threshold of −0.48. There, a very large positive population effect was more than canceled by a strongly negative technical effect. Negative aggregates were also visible in Algeria (∼−0.10) and the United Arab Emirates (∼−0.12).
In 2002–2008, the center of positive change shifted. The largest positive aggregates were recorded in Saudi Arabia (∼0.30) and Lebanon (∼0.27), followed by Libya (∼0.08). Saudi Arabia’s increase was driven mainly by economic development, which rose to 0.50, together with a smaller positive population effect, although both were partly offset by a large negative technical effect. Lebanon was the clearest case of cumulative positive contributions, with all four effects adding to the total. At the negative end, Egypt and Iraq both fell to the −0.48 truncation limit, while Morocco dropped to about −0.42. In all three cases, strong negative technical effects outweighed positive demographic and economic contributions. Thus, by the second period, the technical effect had become the main source of contraction in several countries, even where population and economic growth were still pushing upward.
The period 2009–2015 was the most polarized. Lebanon recorded the largest positive aggregate, at about 0.44, while Saudi Arabia followed at roughly 0.20; Oman and Qatar were also positive but smaller, around 0.10. Lebanon’s result was driven by the combined action of population, economic development, and technical change, each contributing positively. At the same time, Egypt and Iraq again reached the lower truncation threshold of −0.48, and Algeria also remained strongly negative at about −0.33. Two countries illustrate the extent of internal offsetting particularly well. In Syria, a very large positive technical effect reached the upper truncation threshold of 0.59, but this was almost fully counterbalanced by a strongly negative economic development effect close to −0.48, leaving the total effect near zero. In Iran, a positive technical effect of about 0.43 was offset by a negative industrial structure effect of −0.41 and a further negative economic development effect, again producing an aggregate close to zero. The 2009–2015 period, therefore, stands out as the clearest example of sharply competing drivers within the same national systems.
A different configuration emerged in 2016–2022. The largest positive aggregates were observed in Egypt and Iraq, both of which reached the upper truncation threshold of 0.59, followed by Saudi Arabia at approximately 0.39. In Egypt, the increase was driven by a strong population effect (0.29) combined with a large positive economic development effect. Iraq showed a similar structure, with the population effect rising to 0.41, reinforced by a strong positive economic-development component. In Saudi Arabia, the total remained clearly positive because a very large economic development effect outweighed a strongly negative technical effect that fell to the −0.48 truncation limit. Iran, Lebanon, Libya, and Syria all showed near-neutral totals, while Qatar and Oman were slightly negative, with their totals held down by adverse technical contributions.
Three results are clear from this analysis. First, population and economic development were the most persistent positive drivers of industrial water withdrawal. Second, the technical effect was the most volatile factor and frequently determined whether the aggregate became positive or negative. Third, the industrial structure effect was periodically important, highly negative in some countries, strongly positive in others, but it was less consistently directional than the demographic and economic drivers.

4. Discussion

The results show industrial water withdrawal in MENA as a problem of concentrated industrial water pressure. The country-level deviations can be interpreted through specific national contexts. For instance, Iraq’s early dominance and later renewed increase are consistent with the water-intensive role of oil production and refining [39], the expansion of industrial demand, and the pressure of population growth [40], while periods of conflict, sanctions, and damaged infrastructure help explain why its trajectory is irregular [41]. For the case of a country like Lebanon, its late-period high per capita withdrawal is plausibly linked to the strong dependence of industry on groundwater, limited industrial water recycling, and weak incentives to reduce direct abstraction where groundwater remains relatively accessible [42,43]. Also, Egypt’s later increase is consistent with a broader national pattern in which population growth, economic expansion, and rising industrial demand have intensified pressure on a Nile-dependent water system [44]. In contrast, Saudi Arabia’s distinct position is less about per capita withdrawal intensity and more about economic scale, downstream refining, petrochemical expansion, and large water-supply infrastructure, including desalination [45,46]. These country-specific contexts depict that the observed deviations among all analyzed countries are a function of different combinations of industrial composition, resource dependence, infrastructure conditions, demographic pressure, and economic development status. Accordingly, industrial water withdrawal in MENA is not only a matter of how much water the industry uses, but of how that use interacts with economic magnitude and industrial structure. This distinction is important because it clarifies what industrial water withdrawal actually signifies in a water-scarce region. High withdrawal intensity does not automatically imply the same kind of structural pressure everywhere. In some countries, industrial water withdrawal is high because the water intensity of production remains elevated; in others, it becomes important because it is embedded in a much larger economic system. That is precisely why the regional pattern cannot be reduced to a single “high-use versus low-use” narrative. The evidence instead points to at least three types of industrial water trajectory: (i) countries with high withdrawal intensity, (ii) countries with large economic scale but more complex water-use balances, and (iii) a broad middle group where industrial water withdrawal remains moderate but potentially vulnerable to future expansion.
The decoupling results show that the relationship between industrial water withdrawal and industrial growth was neither stable nor progressively improving across the whole region. The strongest regional phase of separation occurred between the period 2002 and 2008, when most countries achieved strong or weak decoupling. After 2008, however, that pattern gave way to a more heterogeneous regime in which favorable and unfavorable decoupling states coexisted. This is a consequential result. It suggests that industrial water withdrawal in MENA does not follow a linear transition toward lower water dependence. Decoupling proved possible, but it also proved fragile. Once demographic pressure, industrial expansion, technical performance and structural change began to diverge more sharply across countries, the region ceased to move in a common direction. The key implication is that industrial water withdrawal in MENA is governed by an unstable balance between growth and restraint, not by a one-way efficiency transition.
The decomposition analysis explains why this balance is unstable. Across the four periods, population growth and economic development were the most persistent positive drivers of industrial water withdrawal. Their effect is straightforward: as economies expand and populations grow, industrial activity scales up, and industrial water withdrawal tends to rise unless offset by strong countervailing forces. This mechanism was especially visible in the later period, when Egypt, Iraq and Saudi Arabia showed the largest positive totals. These results are consistent with the broader expectation that population and income growth exert incremental upward pressure on water demand, use, and resources [47,48,49]. In MENA, however, that pressure is more consequential because it operates under already constrained hydrological conditions. Industrial water withdrawal therefore becomes not just a by-product of growth, but one of the channels through which macroeconomic expansion encounters physical limits. Set against these expansionary forces, the technical effect was the most volatile and often the most decisive factor. In some countries and periods it sharply reduced industrial water withdrawal, while in others it weakened or even acted in the opposite direction. That volatility is central to interpreting the mixed decoupling pattern after 2008. These interpretations should, however, be read with caution, especially for conflict-affected countries like the Syrian Arab Republic and Yemen, whose industrial withdrawal series remained unchanged over extended periods. While such cases reflected stability in the reported database values, it did not necessarily mean continuous annual observation of unchanged industrial water withdrawal. Where technical improvement was strong enough to offset demographic and economic pressures, industrial water withdrawal was restrained and decoupling remained favorable. Where technical improvement was weak, inconsistent or reversed, water withdrawal rose more quickly or ceased to separate from growth. This indicates that technological change in MENA has not operated as a steady regional trend toward lower industrial water intensity. Rather, it has functioned as an uneven and intermittent counterforce. That observation carries strong policy implications: industrial water sustainability in MENA depends less on broad efficiency rhetoric than on whether technical gains are deep, continuous and large enough to outrun growth-driven increases in withdrawal.
The industrial structure effect was more selective, but it remains analytically important because it shows that all industrial growth does not have the same water implications. In some countries, structural shifts reduced industrial water withdrawal, suggesting movement toward a less water-intensive industrial composition or a declining industrial share within GDP. In others, structural change amplified water demand. This means that industrial water withdrawal in MENA is not governed only by how fast industry grows, but by what type of industry expands. The differences among countries may also reflect variation in industrial subsectors, electricity-generation pathways, and process technologies, all of which have been reported to shape national patterns of water withdrawal [50,51,52]. That distinction is essential in a region where industrial policy increasingly emphasizes diversification, downstream processing and new manufacturing capacity [53,54]. If diversification proceeds toward water-intensive industrial forms, industrial water withdrawal will rise even under otherwise favorable macroeconomic conditions. If it proceeds toward less water-intensive sectors and is combined with technical upgrading, the water burden of industrial growth can be moderated. The results therefore argue for an industrial water policy that is sector-sensitive, not merely aggregate.
This interpretation is also consistent with the wider decoupling and decomposition literature on industrial water use, while revealing features that are distinctive to MENA (see Table A2). Reported studies from Hubei [55] and the Yangtze River Economic Belt [56] generally show that technological change and water-use intensity are the principal forces improving decoupling. Similar evidence has also been reported for energy-intensive industries in the Yellow River Basin, where intensity effects reduced water use [57], and for Africa, where population, economic development and industrial structure were identified as major drivers of industrial water-use change [3]. In this respect, our present results align closely with previous work in that population growth and economic development emerged as the most persistent positive drivers of industrial water withdrawal, while the technical effect acted as the main restraining force. The MENA pattern differs, however, in the degree of post-2009 instability. Rather than moving progressively toward stronger decoupling, the region shifted into a mixed regime in which favorable and unfavorable states coexisted, indicating that technological and structural gains were not sufficiently stable to offset the rising pressure from growth and demography across all countries.
Put broadly, the findings suggest that the central issue in MENA is not industrial water withdrawal alone, but the quality of industrial water withdrawal growth. Two countries may record rising industrial water withdrawal for very different reasons: one because economic and population growth are outpacing technical progress, another because industrial structure is shifting toward more water-intensive activities. Likewise, high industrial water withdrawal is not necessarily synonymous with poor performance if technical and structural improvements are substantial enough to reduce water intensity over time. In addition, the study results show that industrial water withdrawal in MENA is simultaneously a magnitude problem, an efficiency problem, and a structural problem. Any interpretations that isolate only one of these dimensions risks missing how industrial water pressure is actually produced.

5. Study Limitations

This study should be interpreted in light of some data-related limitations. Firstly, although annual country-level industrial water withdrawal entries were available for all 18 MENA countries for the period 1995–2022, the data series for some countries contained repeated values over extended periods. This was particularly evident for countries such as the Syrian Arab Republic and Yemen. As a result, changes in industrial water withdrawal for such cases reflect changes in the reported source data rather than confirmed year-by-year variation in actual withdrawals. Secondly, the study considered industrial water withdrawal but did not account for return flows, and thus does not represent actual consumptive use by industries. Thirdly, the national-scale analysis masks important sub-national and sector-specific differences in industrial structure, water-use efficiency, and access to water resources, while aggregate industrial water withdrawal data do not distinguish variation in industrial subsectors, electricity mix, or renewable-energy transitions, and therefore cannot show whether observed changes were driven by a few large industrial centers or by broader economy-wide shifts. Fourthly, the study relies on harmonized international databases, which improve regional comparability but may also introduce uncertainty associated with differences in national reporting practices, temporal updating, and underlying estimation procedures. This limitation is particularly relevant for countries affected by conflict, institutional disruption, or weak statistical continuity. And finally, the decoupling and decomposition analyses were based on period endpoints, not continuous annual transitions. While this approach is appropriate for comparative multi-country assessment, it may smooth short-term fluctuations and understate temporary shocks. These limitations, however, do not invalidate the findings, but they suggest that the reported patterns should be interpreted as robust regional tendencies rather than exact annual representations of industrial water dynamics.

6. Conclusions

This study demonstrates that industrial water withdrawal in MENA is best understood as a differentiated regional challenge shaped by distinct national development pathways, rather than as a uniform consequence of water scarcity. The analysis shows that the region contains a small set of countries in which industrial water pressure is disproportionately concentrated, while the larger regional pattern remains comparatively moderate. At the same time, the linkage between industrial water withdrawal and economic growth is neither linear nor regionally stable, in the sense that periods of improvement were followed by more fragmented trajectories, indicating that gains in water-use performance can be achieved but are not automatically sustained.
A central contribution of the study is the identification of the key factors behind these divergent outcomes. Population growth and economic development emerged as the most persistent upward pressures on industrial water withdrawal, whereas technical change acted as the principal restraining force, though unevenly across countries and periods. Industrial structure also mattered, but in a more selective way. The sustainability of industrial growth in MENA therefore depends not simply on reducing water use in absolute terms, but on whether technological upgrading and structural adjustment can proceed faster than the demand generated by demographic and economic expansion. These findings underscore the need for country-specific industrial water strategies. Policies that are effective in one national context may be inadequate in another if the dominant driver differs. Future progress will therefore depend on embedding industrial water efficiency, sectoral planning, and demand management more firmly within broader economic transformation agendas across the region. Building on this territorial assessment, future research should also examine how export and import flows redistribute industrial water pressure through approaches like virtual water trade, input–output linkages, and consumption-based industrial water-footprint accounting, particularly in MENA economies with strongly export-oriented (e.g., Qatar) or import-dependent (e.g., Morocco) industrial systems.

Supplementary Materials

The following supporting information can be downloaded at: https://www.mdpi.com/article/10.3390/w18131624/s1, Table S1: Industrial Water Withdrawal across MENA during the study period (1995–2022).

Author Contributions

Conceptualization, G.O.; methodology, G.O., S.E.A., M.B., and B.A.; validation, G.O., S.E.A., M.B., and B.A.; formal analysis, G.O., S.E.A., M.B., and B.A.; resources, G.O., S.E.A., M.B., and B.A.; data curation, G.O., S.E.A., M.B., and B.A.; writing—original draft preparation, G.O., S.E.A., M.B., and B.A.; writing—review and editing, G.O., S.E.A., M.B., and B.A.; supervision, G.O. and B.A. All authors have read and agreed to the published version of the manuscript.

Funding

This research received no funding.

Data Availability Statement

The data presented in this study are available in FAO at https://data.apps.fao.org/aquastat/?lang=en; accessed on 18 March 2026 and in the World Bank at https://data.worldbank.org/; accessed on 18 March 2026.

Acknowledgments

During the preparation of this work, the authors used Grammarly (web-based edition) to improve the readability, grammar, punctuation, and clarity of expression in the manuscript. The tool was used only for language refinement and editorial improvement. The prompts/instructions used for this purpose included: “Improve it,” “Modify it,” “Improve highlighted section,” and “Re-write it.” After using the tool, the authors reviewed and edited the content as needed and take full responsibility for the content of the published article.

Conflicts of Interest

The authors declare no conflicts of interest.

Appendix A

Table A1. Summary statistics of industrial water withdrawal (billion m3) across MENA by study period.
Study PeriodMinimumMeanMedianMaximum
1995–20010.0090.8630.1179.700
2002–20080.0080.7900.1388.614
2009–20150.0140.5220.1874.814
2016–20220.0140.7990.2125.490
Table A2. Comparison of findings with other studies.
TitleRegionPeriodMethod AppliedKey FindingReference
Decoupling Water Consumption from Economic Growth in Inner Mongolia, ChinaInner Mongolia, China2004–2023Tapio decouplingIndustrial areas showed strong decoupling; agricultural zones remained weakly decoupled; pandemic caused major disruption[58]
Decoupling Industrial Development from Wastewater DischargeChina2000–2015Tapio + LMDI + attributionWater intensity drove decoupling; wastewater discharge coefficient shifted from negative to positive influence after 2005[59]
Decoupling Urban Economic Growth and Water Consumption China2003–2019Tapio + causal-chain decompositionIndustrial water decoupled weakly to strongly; population growth was main inhibiting factor[14]
Decoupling in China’s Mining Industrial DevelopmentChina2002–2015Tapio + input–outputMining water use exhibited strong negative decoupling; strong sectoral variation[60]
Decoupling of Industrial Water Consumption in YREBYREB, China11th–13th Five-Year plansTapio + LMDIShift from weak to strong decoupling; technological effect dominant, structural effect emerging[56]
Decreasing Water Dependency for Economic Growth Xi’an, China2008–2018Tapio + LMDIIndustrial decoupling stable but weaker than agriculture; technology drove decoupling[61]
Decoupling of Economic Growth and Industrial Water Use in HubeiHubei, China2004–2019Tapio + LMDIIndustrial structure and intensity effects were dominant decoupling drivers[55]
Spatio-Temporal Assessment of Industrial Water Use in AfricaAfrican countries1987–2017Tapio decoupling + HCAIndustrial water use showed expansive negative decoupling; population, economy, structure major drivers[3]
Water Conservation Potential in Energy-Intensive IndustriesYellow River Basin2015–2030LMDI decompositionScale, structure, and intensity effects decomposed; intensity effects reduced water use[57]
Current studyMENA1995–2022Tapio + LMDIPopulation growth and economic development are the primary factors driving increased industrial water withdrawal; decoupling analysis presented mixed states after 2009

References

  1. Allouhi, A.; Rami, Y.; Allouhi, H.; Hamrani, A.; Tabet Aoul, K.A. Comprehensive Assessment of Clean Energy and Water Production in MENA: A 4-E Analysis Based on Two High-Performance Solar Photovoltaics. Desalination 2025, 615, 119226. [Google Scholar] [CrossRef]
  2. Mohammed Qasem, R.H.; Scholz, M. Climate Change Impact on Resources in the MENA Region: A Systematic and Critical Review. Phys. Chem. Earth Parts A/B/C 2025, 139, 103936. [Google Scholar] [CrossRef]
  3. Kipkirui, E.; Zhao, J.; Lu, S.; Mbuge, D.O.; Wang, T. A Spatio-Temporal Assessment of Industrial Water Use in African Countries. Water 2025, 17, 3313. [Google Scholar] [CrossRef]
  4. Saidan, M.N. Estimation of Industrial Water Demand and Reclamation in Jordan: A Cross-Sectional Analysis. Water Resour. Ind. 2020, 23, 100129. [Google Scholar] [CrossRef]
  5. Siyal, A.W.; Gerbens-Leenes, P.W.; Vaca-Jiménez, S.D. Freshwater Competition among Agricultural, Industrial, and Municipal Sectors in a Water-Scarce Country. Lessons of Pakistan’s Fifty-Year Development of Freshwater Consumption for Other Water-Scarce Countries. Water Resour. Ind. 2023, 29, 100206. [Google Scholar] [CrossRef]
  6. Liu, J.; Zhou, Y.; Chen, L.; Wang, L. Assessing the Impact of Climate Change on Water Usage in Typical Industrial Enterprises. Sustainability 2023, 15, 10141. [Google Scholar] [CrossRef]
  7. Darwish, H.H.; Talozi, S. Assessment of Water Footprint in the Jordanian Industrial Sector as a Means for Sustainable Water Resources Management. Nafta-Gaz 2024, 80, 450–468. [Google Scholar] [CrossRef]
  8. El Haddadi, M.; Lahjouji, H.; Tabaa, M. The Nexus Between Economic Growth and Water Stress in Morocco: Empirical Evidence Based on ARDL Model. Sustainability 2025, 17, 6990. [Google Scholar] [CrossRef]
  9. Kerrouche, N.; Zehri, C. Economic Growth, Welfare, and Sustainability Outcomes of Integrated Water, Energy, and Food Investments in Saudi Arabia. Sustain. Futures 2025, 10, 100932. [Google Scholar] [CrossRef]
  10. Dávila-Sandoval, T.A.; Navarro-Guerrero, R.; Tovar-García, E.D. Economic Growth’s Impact on Water Use and Pollution in Mexican Regions. Water Air Soil Pollut. 2024, 235, 678. [Google Scholar] [CrossRef]
  11. Frontuto, V.; Felici, T.; Dalmazzone, S.; Falsetti, B.; Ignaccolo, R.; Laio, F.; Bagliani, M.M. Unsustainable Global Freshwater Consumption Driven by Economic Growth. World Dev. 2025, 196, 107185. [Google Scholar] [CrossRef]
  12. Sesma-Martín, D.; Puente-Ajovín, M. The Environmental Kuznets Curve at the Thermoelectricity-Water Nexus: Empirical Evidence from Spain. Water Resour. Econ. 2022, 39, 100202. [Google Scholar] [CrossRef]
  13. Han, X.; He, X.; Xiong, W.; Shi, W. Effects of Urbanization on CO2 Emissions, Water Use and the Carbon-Water Coupling in a Typical Dual-Core Urban Agglomeration in China. Urban Clim. 2023, 49, 101572. [Google Scholar] [CrossRef]
  14. Gong, Q.; Guo, G.; Li, S.; Liang, X. Decoupling of Urban Economic Growth and Water Consumption in Chongqing and Chengdu from the “Production-Living-Ecological” Perspective. Sustain. Cities Soc. 2021, 75, 103395. [Google Scholar] [CrossRef]
  15. Kong, Y.; He, W.; Yuan, L.; Zhang, Z.; Gao, X.; Zhao, Y.; Mulugeta Degefu, D. Decoupling Economic Growth from Water Consumption in the Yangtze River Economic Belt, China. Ecol. Indic. 2021, 123, 107344. [Google Scholar] [CrossRef]
  16. Wang, Y.; Huang, X.; Zhou, X. The Relationship between Water Consumption and Economic Growth at the National, Regional, and Provincial Levels in China. J. Water Resour. Plan. Manag. 2025, 151, 05024018. [Google Scholar] [CrossRef]
  17. Kong, Y.; He, W.; Yuan, L.; Shen, J.; An, M.; Degefu, D.M.; Gao, X.; Zhang, Z.; Sun, F.; Wan, Z. Decoupling Analysis of Water Footprint and Economic Growth: A Case Study of Beijing–Tianjin–Hebei Region from 2004 to 2017. Int. J. Environ. Res. Public Health 2019, 16, 4873. [Google Scholar] [CrossRef] [PubMed]
  18. Shi, C.; Yuan, H.; Pang, Q.; Zhang, Y. Research on the Decoupling of Water Resources Utilization and Agricultural Economic Development in Gansu Province from the Perspective of Water Footprint. Int. J. Environ. Res. Public Health 2020, 17, 5758. [Google Scholar] [CrossRef] [PubMed]
  19. Hu, M.; Hu, Y.; Yuan, J.; Lu, F. Decomposing the Decoupling of Water Consumption and Economic Growth in Jiangxi, China. J. Water Reuse Desalin. 2019, 9, 94–104. [Google Scholar] [CrossRef]
  20. Wang, S.; Li, R. Toward the Coordinated Sustainable Development of Urban Water Resource Use and Economic Growth: An Empirical Analysis of Tianjin City, China. Sustainability 2018, 10, 1323. [Google Scholar] [CrossRef]
  21. Serrano, A.; Valbuena, J. Production and Consumption-Based Water Dynamics: A Longitudinal Analysis for the EU27. Sci. Total Environ. 2017, 599–600, 2035–2045. [Google Scholar] [CrossRef] [PubMed]
  22. Reutter, B.; Lant, P.A.; Lane, J.L. Direct and Indirect Water Use within the Australian Economy. Water Policy 2018, 20, 1227–1239. [Google Scholar] [CrossRef]
  23. Hao, Y.; Hu, X.; Chen, H. On the Relationship between Water Use and Economic Growth in China: New Evidence from Simultaneous Equation Model Analysis. J. Clean. Prod. 2019, 235, 953–965. [Google Scholar] [CrossRef]
  24. Duarte, R.; Pinilla, V.; Serrano, A. Is There an Environmental Kuznets Curve for Water Use? A Panel Smooth Transition Regression Approach. Econ. Model. 2013, 31, 518–527. [Google Scholar] [CrossRef]
  25. Wang, Q.; Wang, X. Moving to Economic Growth without Water Demand Growth—A Decomposition Analysis of Decoupling from Economic Growth and Water Use in 31 Provinces of China. Sci. Total Environ. 2020, 726, 138362. [Google Scholar] [CrossRef] [PubMed]
  26. Engo, J. Driving Forces and Decoupling Indicators for Carbon Emissions from the Industrial Sector in Egypt, Morocco, Algeria, and Tunisia. Environ. Sci. Pollut. Res. 2021, 28, 14329–14342. [Google Scholar] [CrossRef] [PubMed]
  27. Feng, C.; Zheng, C.-J.; Shan, M.-L. The Clarification for the Features, Temporal Variations, and Potential Factors of Global Carbon Dioxide Emissions. J. Clean. Prod. 2020, 255, 120250. [Google Scholar] [CrossRef]
  28. Zhang, R.; Li, P.; Kong, X.; Zhong, S.; Shen, L. Revealing the Transfer and Impacts of Ecological Footprint Embodied in Interprovincial Trade across China’s Metacoupled System. Environ. Impact Assess. Rev. 2026, 118, 108329. [Google Scholar] [CrossRef]
  29. Zekri, S.; Al-Maamari, A. An Overview of the Water Sector in MENA Region. In Water Policies in MENA Countries; Springer: Berlin/Heidelberg, Germany, 2020; pp. 1–17. [Google Scholar]
  30. Al-Saidi, M. Are We Cloning Water Reforms for Different Problems? Institutional Change in the Water Sector under the IWRM Paradigm. Environ. Sci. Policy 2026, 179, 104373. [Google Scholar] [CrossRef]
  31. Xu, Y.L.; Cao, J.X.; Xu, Z.S.; Dou, B.Q. Regional Transportation Carbon Emission Prediction and Decarbonization Pathway Analysis Based on LASSO-BWO-ELM Hybrid Heuristic Algorithm. Energy 2026, 352, 140924. [Google Scholar] [CrossRef]
  32. Shen, Y.; Zuo, Z.; He, W. Driving Mechanisms and Peak Prediction of Industrial Carbon Emissions in the Yangtze River Delta Region from a Comprehensive Model Perspective. Sustain. Futur. 2026, 11, 101853. [Google Scholar] [CrossRef]
  33. Tapio, P. Towards a Theory of Decoupling: Degrees of Decoupling in the EU and the Case of Road Traffic in Finland between 1970 and 2001. Transp. Policy 2005, 12, 137–151. [Google Scholar] [CrossRef]
  34. Ward, J.H. Hierarchical Grouping to Optimize an Objective Function. J. Am. Stat. Assoc. 1963, 58, 236–244. [Google Scholar] [CrossRef]
  35. Ang, B.W. The LMDI Approach to Decomposition Analysis: A Practical Guide. Energy Policy 2005, 33, 867–871. [Google Scholar] [CrossRef]
  36. Li, Y.; Luo, H.; Wang, S.; Liu, Y.; Yang, Z.; Meng, X.; Yang, X. Energy-Related Carbon Emissions in the Building Sector: Drivers, Forecasting, and Multi-Scenario Analysis. Energy Rep. 2026, 15, 109128. [Google Scholar] [CrossRef]
  37. Barrahmoune, A.; Matanle, P. Changes in Japan’s Food Consumption Footprints under Human Depopulation. Clean. Responsible Consum. 2026, 21, 100418. [Google Scholar] [CrossRef]
  38. Tang, L.; Verburg, P.H.; Ke, X.; Wang, C.; Wu, S.; Li, W.; Zhu, J. Spatio-Temporal Changes in Cropland System and Its Impacts on Grain Production in China. Agric. Syst. 2026, 232, 104573. [Google Scholar] [CrossRef]
  39. Mona Ali, D. The Effect of the Tigris River in Settlement Big Oil Refineries in Iraq. Al-Adab. J. 2019, 1, 527–548. [Google Scholar] [CrossRef]
  40. Al-Furaiji, M.H.O.; Karim, U.F.A.; Augustijn, D.C.M.; Waisi, B.I.H.; Hulscher, S.J.M.H. Evaluation of Water Demand and Supply in the South of Iraq. J. Water Reuse Desalin. 2016, 6, 214–226. [Google Scholar] [CrossRef]
  41. Zeitoun, M.; Elaydi, H.; Dross, J.; Talhami, M.; de Pinho-Oliveira, E.; Cordoba, J. Urban Warfare Ecology: A Study of Water Supply in Basrah. Int. J. Urban Reg. Res. 2017, 41, 904–925. [Google Scholar] [CrossRef]
  42. Merheb, M.; Moussa, R.; Abdallah, C.; Halwani, J.; Cudennec, C. The Water Resources of Lebanon—A Review to Support Water Security. Phys. Chem. Earth Parts A/B/C 2024, 136, 103683. [Google Scholar] [CrossRef]
  43. Geara-Matta, D.; Moilleron, R.; El Samarani, A.; Lorgeoux, C.; Chebbo, G. State of Art about Water Uses and Wastewater Management in Lebanon. In Proceedings of the World Wide Workshop for Young Environmental Scientists: 2010 (No. WWW-YES-2010-13), Arcueil, France, 31 May–4 June 2010. [Google Scholar]
  44. Nikiel, C.A.; Eltahir, E.A.B. Past and Future Trends of Egypt’s Water Consumption and Its Sources. Nat. Commun. 2021, 12, 4508. [Google Scholar] [CrossRef] [PubMed]
  45. Al-Addous, M.; Bdour, M.; Rabaiah, S.; Boubakri, A.; Schweimanns, N.; Barbana, N.; Wellmann, J. Innovations in Solar-Powered Desalination: A Comprehensive Review of Sustainable Solutions for Water Scarcity in the Middle East and North Africa (MENA) Region. Water 2024, 16, 1877. [Google Scholar] [CrossRef]
  46. Caldera, U.; Bogdanov, D.; Afanasyeva, S.; Breyer, C. Role of Seawater Desalination in the Management of an Integrated Water and 100% Renewable Energy Based Power Sector in Saudi Arabia. Water 2017, 10, 3. [Google Scholar] [CrossRef]
  47. Liao, R.; Farkas, J.Z.; Török, Á.; Liu, R.; Koh, K. Managing Water Use in Coffee Expansion: System-Based Insights from Yunnan, China. J. Clean. Prod. 2025, 535, 147048. [Google Scholar] [CrossRef]
  48. Zhou, Y.; Li, Y.; Huang, G.; Shen, Z.; Zhang, Y. Bayesian-Factorial Analysis for Unveiling Multi-Factor Interactive Effect on Water Demand in Central Asia. Environ. Model. Softw. 2026, 197, 106806. [Google Scholar] [CrossRef]
  49. Andreoni, V. Drivers of Water Use Change: A Multiscale Integrated Analysis for 13 European Countries. Environ. Sci. Policy 2025, 170, 104117. [Google Scholar] [CrossRef]
  50. Gacek, K. Who Pulls, Who Pushes? Mapping Poland’s 2020 Water Footprint and Key Sectors via Input-Output Backward/Forward Linkages. Water Resour. Ind. 2026, 35, 100368. [Google Scholar] [CrossRef]
  51. Chi, K.H.-K.; McCracken, M. Water Usage in Cooling Systems for Electricity Production: An Event Study of Retrofitted Coal-Fired Power Plants in the United States. Environ. Res. Lett. 2024, 19, 104018. [Google Scholar] [CrossRef]
  52. Wang, B.; Zhang, J.; Wang, X.; Zhang, X.; Liu, Z.; Shang, M. Impact of Adaptive Water-Saving and Phaseout Strategies on Water Withdrawal in China’s Coal-Fired Power Industry under Carbon Constraints. Water-Energy Nexus 2023, 6, 46–63. [Google Scholar] [CrossRef]
  53. Nassar, A.K. Strategic Energy Transition in the Gulf Cooperation Council: Balancing Economic, Social, Political, and Environmental Dynamics for Sustainable Development. Int. J. Green Energy 2025, 22, 1570–1586. [Google Scholar] [CrossRef]
  54. Qanas, J.; Sawyer, M. Navigating the Energy Transition in the Gulf Cooperation Council (GCC) States: The Role of Industrial Policies in Fostering Sustainable Economic Competitiveness. Rev. Polit. Econ. 2025, 1–23. [Google Scholar] [CrossRef]
  55. Chu, Y.; Wang, Y.; Zhang, Z.; Dai, S. Decoupling of Economic Growth and Industrial Water Use in Hubei Province: From an Ecological–Economic Interaction Perspective. Sustainability 2022, 14, 13338. [Google Scholar] [CrossRef]
  56. Gong, X.; Liu, S.; Ye, W.; Liu, L. Decoupling of Industrial Water Consumption and Economic Expansion in the Yangtze River Economic Belt: A Comparative Analysis across Three Five-Year Plans. Sci. Rep. 2025, 15, 21186. [Google Scholar] [CrossRef] [PubMed]
  57. Ma, C.; Liu, W.; Gou, H.; Huang, W.; Zhang, R. Water Conservation Potential of Energy-Intensive Industries under Clean Energy and Electricity Substitution: A Case Study of Nine Provinces along the Yellow River Basin. J. Environ. Manag. 2024, 371, 123256. [Google Scholar] [CrossRef] [PubMed]
  58. Wang, D.; Zhou, Y.; Wang, F. Decoupling Water Consumption from Economic Growth in Inner Mongolia, China. Water 2025, 17, 3073. [Google Scholar] [CrossRef]
  59. Xing, Z.; Wang, J.; Feng, K.; Hubacek, K. Decomposition and Attribution Analysis for Assessing the Progress in Decoupling Industrial Development from Wastewater Discharge in China. J. Clean. Prod. 2020, 266, 121789. [Google Scholar] [CrossRef]
  60. Li, Y.; Zhang, Y.; Yang, L.; Du, F.; Sai, L.; Zhang, B. Decoupling Analysis of China’s Mining Industrial Development and Water Usage: Based on Production-Based and Consumption-Based Perspectives. J. Clean. Prod. 2023, 385, 135668. [Google Scholar] [CrossRef]
  61. Lu, N.; Zhu, J.; Tang, Z.; Zhang, J.; Chi, H. Decreasing Water Dependency for Economic Growth in Water-Scarce Regions by Focusing on Water Footprint and Physical Water: A Case Study of Xi’an, China. Sustain. Cities Soc. 2022, 85, 104092. [Google Scholar] [CrossRef]
Figure 1. Industrial water withdrawal per capita across the MENA region from 1995 to 2022.
Water 18 01624 g001
Figure 2. Hierarchical organization of MENA countries by industrial water use and GDP in 2022.
Water 18 01624 g002
Figure 3. Principal component ordination of MENA countries by industrial water withdrawal and economic scale in 2022. Note: The upward arrow indicates the direction of increasing industrial water withdrawal, while the downward arrow indicates the direction of increasing GDP.
Water 18 01624 g003
Figure 4. Spatio-temporal dynamics of decoupling states between industrial water withdrawal and industrial economic growth across MENA between 1995 and 2022.
Water 18 01624 g004
Figure 5. Period-specific contributions of the drivers of industrial water withdrawal across the MENA region.
Water 18 01624 g005
Table 1. Description of the study area.
CountrySubregional LocationPopulation in 2022
(Million)
Total Renewable Water Resources per Capita in 2022 (m3/Inhab/Year)
AlgeriaNorth Africa45.48256.55
BahrainGulf1.5375.65
EgyptNorth Africa112.62510.57
IranIranian Plateau/West Asia89.521530.81
IraqMesopotamia/West Asia44.072039.00
IsraelLevant9.10195.54
JordanLevant11.2683.24
KuwaitGulf4.594.36
LebanonLevant5.74783.88
LibyaNorth Africa7.2296.90
MoroccoNorth Africa37.33776.87
OmanGulf/Arabian Peninsula4.73295.97
QatarGulf2.8920.05
Saudi ArabiaArabian Peninsula32.1874.59
Syrian Arab RepublicLevant22.46748.01
TunisiaNorth Africa12.12380.80
United Arab EmiratesGulf10.2414.65
YemenArabian Peninsula38.2254.94
Note: Source: World Bank database; FAO AQUASTAT Dissemination System.
Table 2. Decoupling standards for making judgments in Tapio’s model.
Decoupling or Coupling State(ΔW)(ΔG)Decoupling Elasticity (di)Interpretation
Strong decoupling (SD)<0>0<0Industrial output increases while industrial water withdrawal decreases.
Weak decoupling (WD)>0>00 < di < 0.8Both industrial output and industrial water withdrawal increase, but water withdrawal grows more slowly than output.
Expansive coupling (EC)>0>00.8 ≤ di ≤ 1.2Industrial water withdrawal and industrial output grow at approximately the same rate.
Expansive negative decoupling (END)>0>0>1.2Industrial water withdrawal increases faster than industrial output.
Strong negative decoupling (SND)>0<0<0Industrial output declines while industrial water withdrawal increases.
Weak negative decoupling (WND)<0<00 < di < 0.8 Both industrial output and industrial water withdrawal decline, but water withdrawal decreases more slowly than output.
Recessive coupling (RC)<0<00.8 ≤ di ≤ 1.2 Industrial water withdrawal and industrial output decline at approximately the same rate.
Recessive decoupling (RD)<0<0>1.2Industrial water withdrawal declines faster than industrial output.
Disclaimer/Publisher’s Note: The statements, opinions and data contained in all publications are solely those of the individual author(s) and contributor(s) and not of MDPI and/or the editor(s). MDPI and/or the editor(s) disclaim responsibility for any injury to people or property resulting from any ideas, methods, instructions or products referred to in the content.