1. Introduction
Climate change has intensified hydrological cycles by altering precipitation regimes, air temperatures, evapotranspiration processes, runoff generation events, and the frequency of extreme hydrological events [
1,
2,
3]. These changes directly affect river systems through variations in streamflow quantity, water temperature, pollutant transport, nutrient cycling, algal productivity, organic matter decomposition, and in-stream self-purification processes [
4,
5,
6]. In monsoon-dominated watersheds, where annual precipitation is highly seasonal and concentrated during summer rainfall events, climate-driven changes in rainfall intensity and dry period duration can strongly modify both nonpoint source runoff and low-flow water quality vulnerability. Consequently, integrated assessments of future streamflow and water quality have become essential for watershed management, pollutant load control, and climate adaptation planning.
Organic matter has traditionally been managed using biochemical oxygen demand (BOD) and chemical oxygen demand (COD), which represent the biodegradable or chemically oxidizable fractions of organic pollution. However, these indicators do not fully represent the persistence, origin, or transformation of organic carbon in aquatic systems. Therefore, total organic carbon (TOC), which directly quantifies organic carbon content, has become increasingly important for river water quality management, particularly in systems where refractory organic matter, algal-derived organic carbon, sediment resuspension, and natural organic matter from forested areas contribute substantially to observed concentrations [
7,
8,
9,
10]. In addition, TOC is closely related to drinking water treatment concerns, including the demand for chlorine and the potential formation of disinfection byproducts, because organic carbon acts as a precursor material during oxidation and disinfection [
11,
12]. Hence, managing TOC is increasingly being recognized as a necessary complement to conventional BOD- and nutrient-based water quality control strategies.
Recent studies have increasingly emphasized watershed-scale and source-water TOC or natural organic matter management rather than only global carbon-budget analysis. For example, recent assessments have linked climate-driven changes in temperature, hydrological pathways, wet/dry sequences, and extreme events to increased dissolved organic matter or natural organic matter export, altered treatability, and increased uncertainty in source-water quality management [
13,
14,
15]. These studies indicate that TOC should be evaluated not only as a biogeochemical carbon-cycle variable but also as a practical watershed-management indicator connected to pollutant delivery, water-quality classification, and downstream treatment considerations.
Climate change can further complicate TOC dynamics in rivers. Increased temperature may increase biological activity, algal growth, organic matter mineralization, and internal carbon cycling, whereas intensified rainfall can increase watershed-derived organic matter export through surface runoff, soil erosion, and nonpoint source pollution [
4,
5,
16]. Conversely, prolonged drought and reduced streamflow can decrease the dilution capacity, increase the hydraulic residence time, and promote algal accumulation or sediment–water interactions, leading to elevated organic carbon concentrations even when external pollutant loads are reduced. These mechanisms indicate that future TOC pollution cannot be evaluated solely from present discharge-load conditions; instead, a process-based framework that links climate scenarios, watershed hydrology, pollutant generation, delivery processes, and in-stream water quality responses is needed.
Watershed-scale hydrological and water quality models are useful tools for assessing these coupled processes. Among these models, the hydrological simulation program–FORTRAN (HSPF), which is incorporated in the BASINS system of the United States Environmental Protection Agency, has been widely applied to simulate long-term watershed hydrology, sediment transport, nutrient content, organic matter, and water quality responses under changing land use, pollutant load, and climate conditions [
17,
18,
19,
20]. The HSPF model represents pervious land, impervious land, and stream reaches through continuous simulation, and it can be used to reproduce surface runoff, interflow, groundwater flow, pollutant wash-off, in-stream transport, and transformation processes. Because TOC behavior is affected by both watershed runoff and in-stream retention or attenuation, the use of the HSPF model is suitable for evaluating long-term TOC delivery loads and future water quality changes under various climate change scenarios.
Bias correction of climate model outputs is essential for climate impact assessment because raw climate projections often contain systematic errors in the magnitude, frequency, and distribution of precipitation [
21,
22]. Quantile mapping (QM) has been widely used to correct distributional bias, but conventional QM may distort the climate change signals embedded in future projections. Quantile delta mapping (QDM) was developed to overcome this limitation by correcting distributional bias while preserving quantile-specific projected changes, making it particularly useful for hydrological applications that are sensitive to rainfall extremes and seasonal precipitation patterns [
23]. Therefore, coupling QDM-corrected shared socioeconomic pathway (SSP) climate scenarios with watershed-scale hydrological and water quality models can provide a reliable basis for future streamflow and TOC assessments.
The Tamjin River Basin, which is located in the southwestern part of the Republic of Korea, is a climate-sensitive medium-sized watershed characterized by forested upstream areas, agricultural and partially urbanized mid- and downstream areas, strong monsoon seasonality, and the Jangheung Dam, which influences downstream flow regulation. Previous investigations have reported spatial and temporal variations in organic matter and pollutant loads in the Tamjin River system, indicating that both natural watershed characteristics and anthropogenic sources influence water quality [
24]. Recent observations have shown that the behavior of the basin is associated with increasing concern regarding TOC: although BOD and total phosphorus (T–P) may decrease following external load-control efforts, TOC can remain elevated because of refractory organic matter, algal-derived carbon, and altered hydrological conditions. These observations suggest that future water-quality management in the Tamjin River may benefit from complementing conventional BOD- and T-P-based controls with direct consideration of TOC and refractory organic matter.
Despite the growing importance of TOC, previous studies have generally focused on one part of the assessment chain, such as HSPF-based hydrological or water quality simulation, statistical bias correction of climate scenario data, or pollutant-load estimation based mainly on conventional BOD- and COD-centered management [
23,
25,
26,
27]. However, few studies have quantitatively connected bias-corrected future climate forcing with process-based HSPF streamflow and TOC simulations and then translated the outputs into TOC-specific delivered loads, delivery ratios, exceedance frequencies, and load-reduction targets for long-term total load management. The novelty of this study therefore lies in integrating HSPF, QDM, and TOC-based load management into a continuous climate-to-management framework that can evaluate not only future TOC concentration changes but also the effectiveness of practical 20% and 30% watershed load-reduction strategies. Addressing this gap is important for establishing scientific evidence to support future TOC total load control, climate adaptation, and watershed management policies. Therefore, the objectives of this study were to (1) construct and calibrate an HSPF-based streamflow and TOC water quality model for the Tamjin River Basin; (2) apply QDM bias correction to SSP climate scenario data for future hydrological and water quality simulations; (3) estimate TOC discharge loads, delivered loads, and delivery ratios for the 2020s, 2030s, and 2040s; and (4) evaluate the implications of future climate change and watershed load changes for TOC load management. The results provide a scientific basis for climate-resilient TOC management and for developing long-term water quality control strategies in climate-vulnerable river basins.
2. Materials and Methods
2.1. Study Area in the Tamjin River Basin
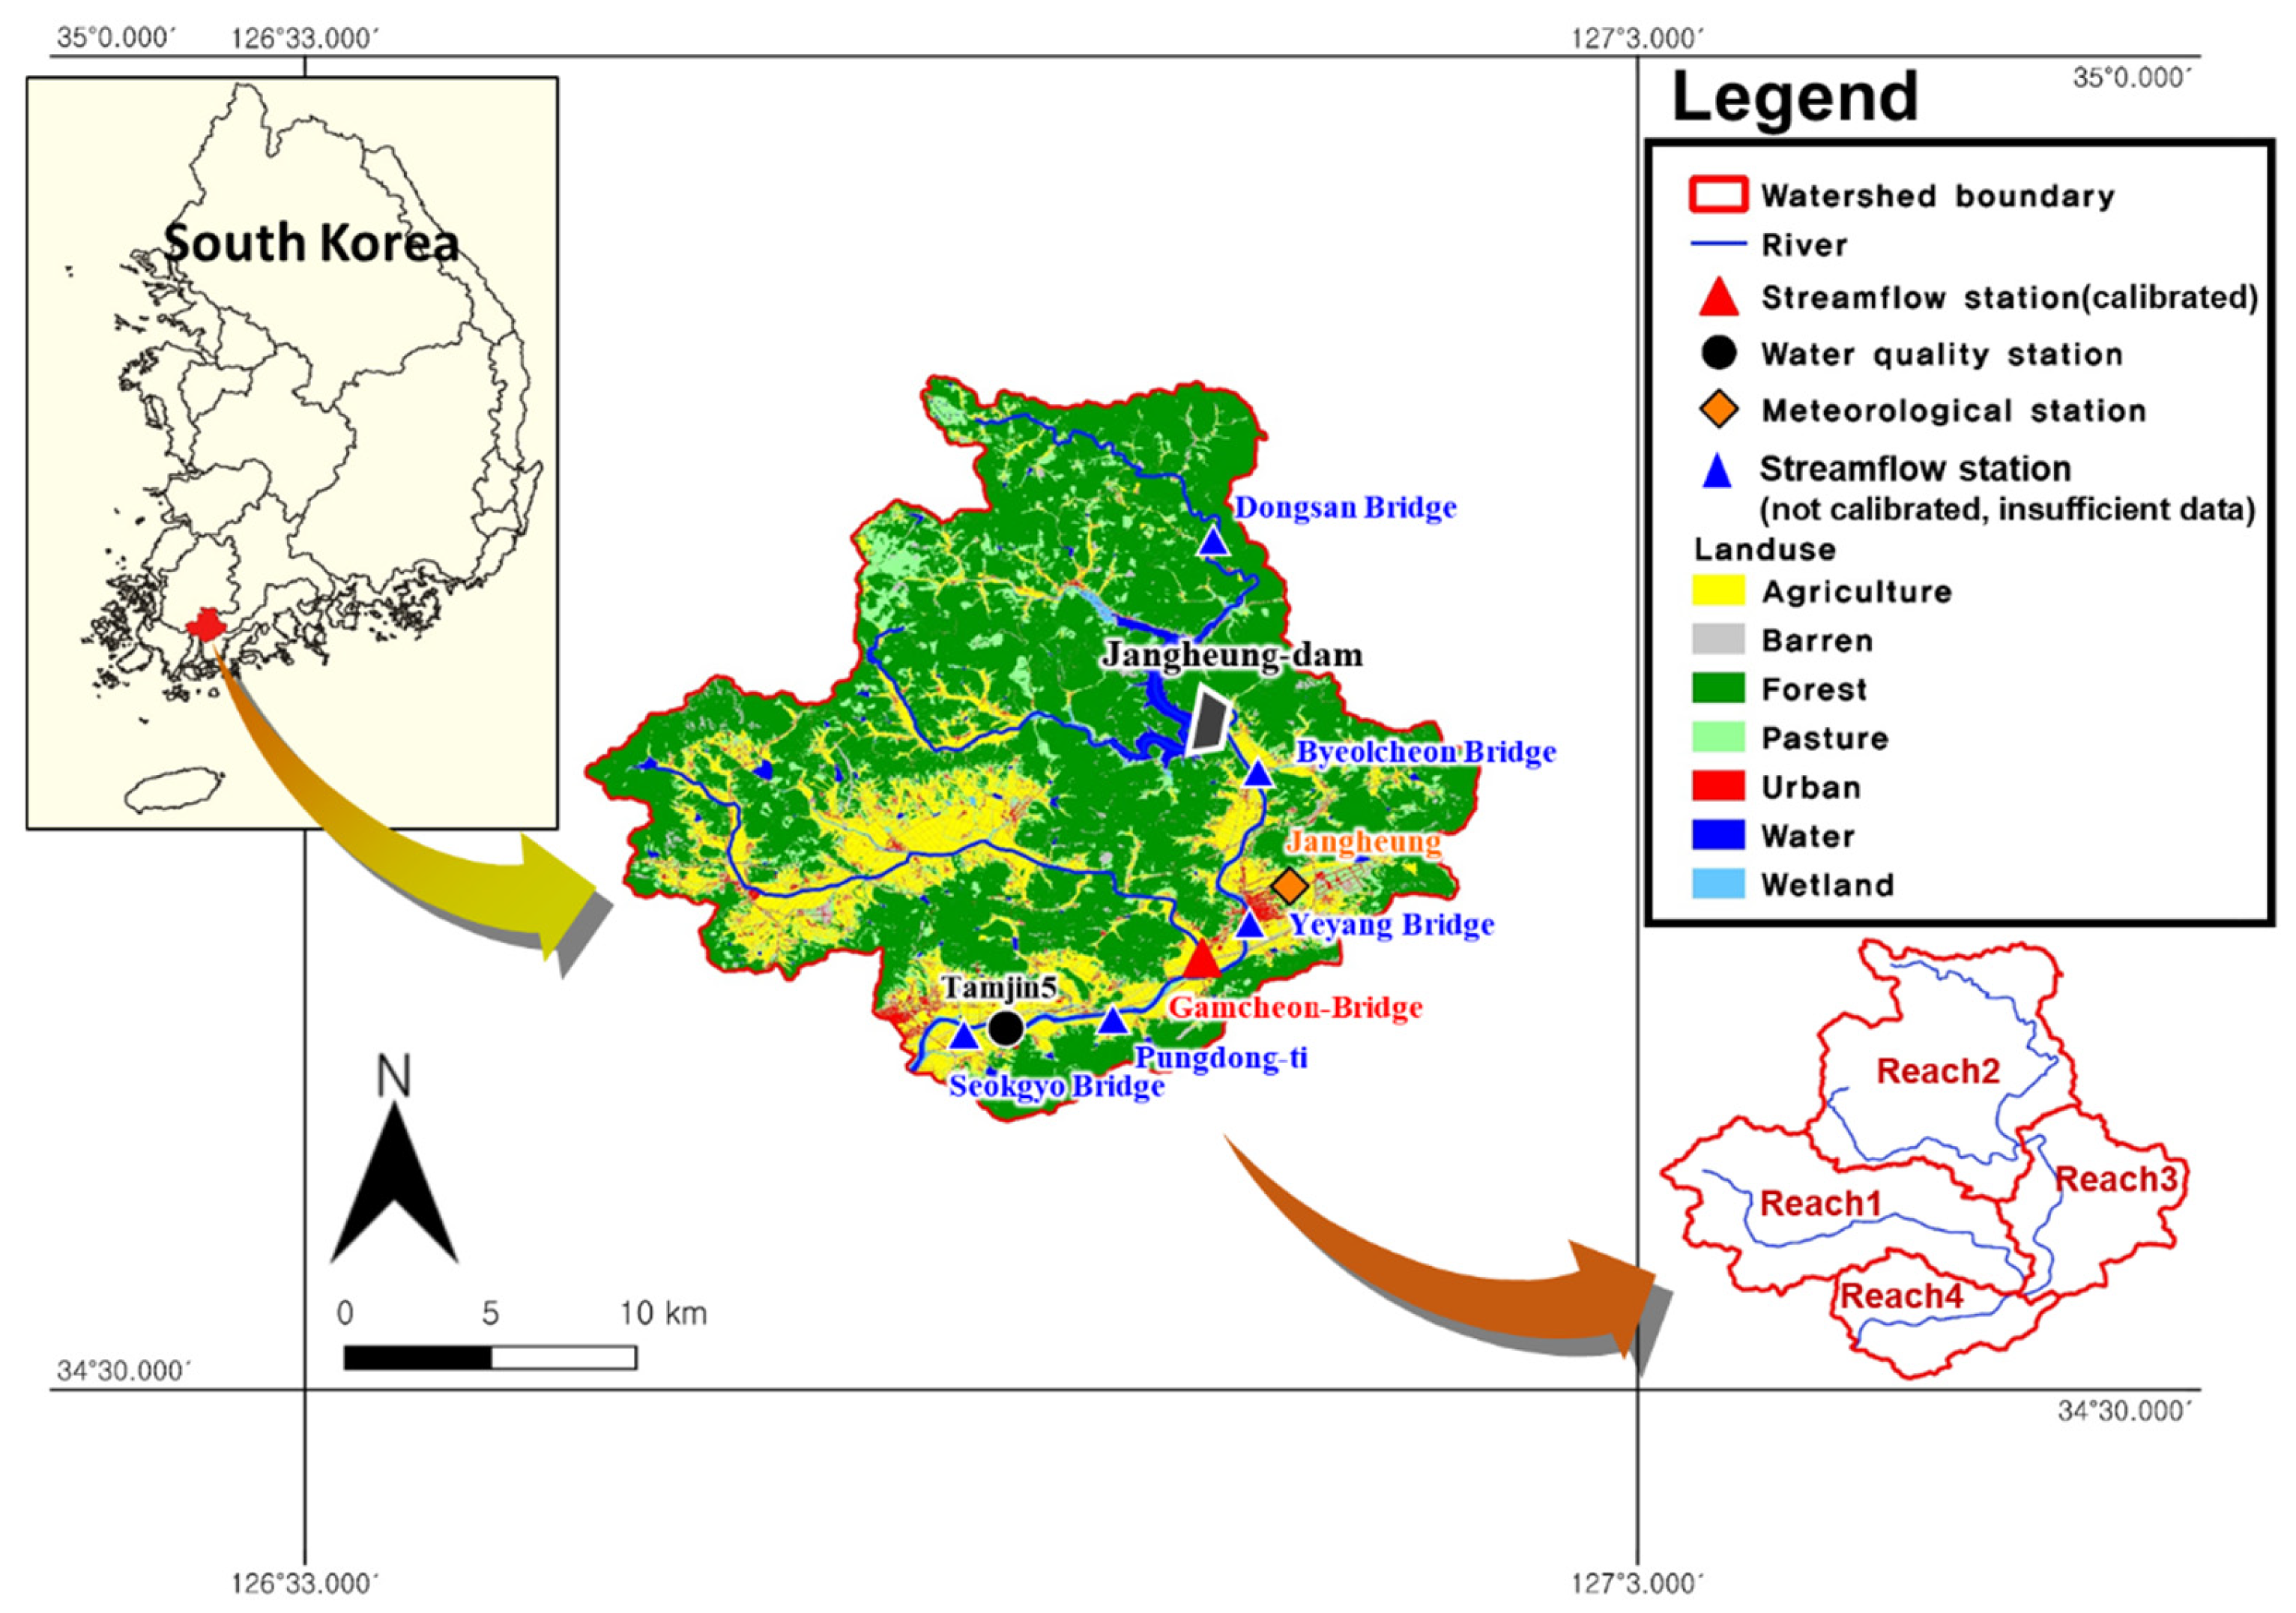
The Tamjin River Basin, which is located in the southwestern region of the Republic of Korea, is a medium-sized watershed that drains into the South Sea and encompasses parts of Jangheung-gun and Gangjin-gun in Jeollanam-do Province. The basin is characterized by a mixed land use pattern, including forested uplands in the upstream region and agricultural and partially urbanized areas in the middle and downstream reaches. A key hydraulic structure within the basin is the Jangheung Dam, completed in 2006, which plays a critical role in water supply, flow regulation, and downstream water quality management. The watershed area is approximately 564 km
2, according to the national river master plan [
28]. The basin is characterized by a mixed topography, with relatively steep mountainous terrain in the upstream regions transitioning to low-gradient alluvial plains downstream, resulting in an average slope of approximately 18° to 22°. Land use is predominantly forested, accounting for approximately 60% of the total area, followed by agricultural land (21%) and urban and other land uses (19%), as reported in national river planning data and the Korea Water Resources Management Information System (WAMIS) (
Figure 1). Climatically, the basin is influenced by a humid temperate monsoon regime, with a mean annual precipitation of approximately 1350 to 1450 mm and a mean annual air temperature of approximately 13 °C, based on long-term observations (2001–2020) from the Korea Meteorological Administration. The strong seasonality of precipitation, which is concentrated during the summer monsoon period, combined with the topographic and land use characteristics of the basin, leads to significant hydrological variability, including rapid runoff generation in upstream areas and increased flow residence time downstream. These features influence both water quantity and quality, with forested areas contributing to natural organic matter loads and agricultural land acting as a major source of nonpoint pollutants, thereby making the Tamjin River Basin a suitable study area for integrated hydrological and water quality modeling [
10,
29]. Furthermore, the high proportion of forest cover suggests a substantial contribution of natural organic matter to river systems, which is particularly relevant for TOC dynamics. Moreover, agricultural land contributes to nutrient and organic pollutant loads through nonpoint source runoff. These combined factors make the basin a representative site for evaluating the interactions among climate variability, land use, and water quality.
2.2. Input Data for the Modeling Setup
2.2.1. Hydrological and Water Quality
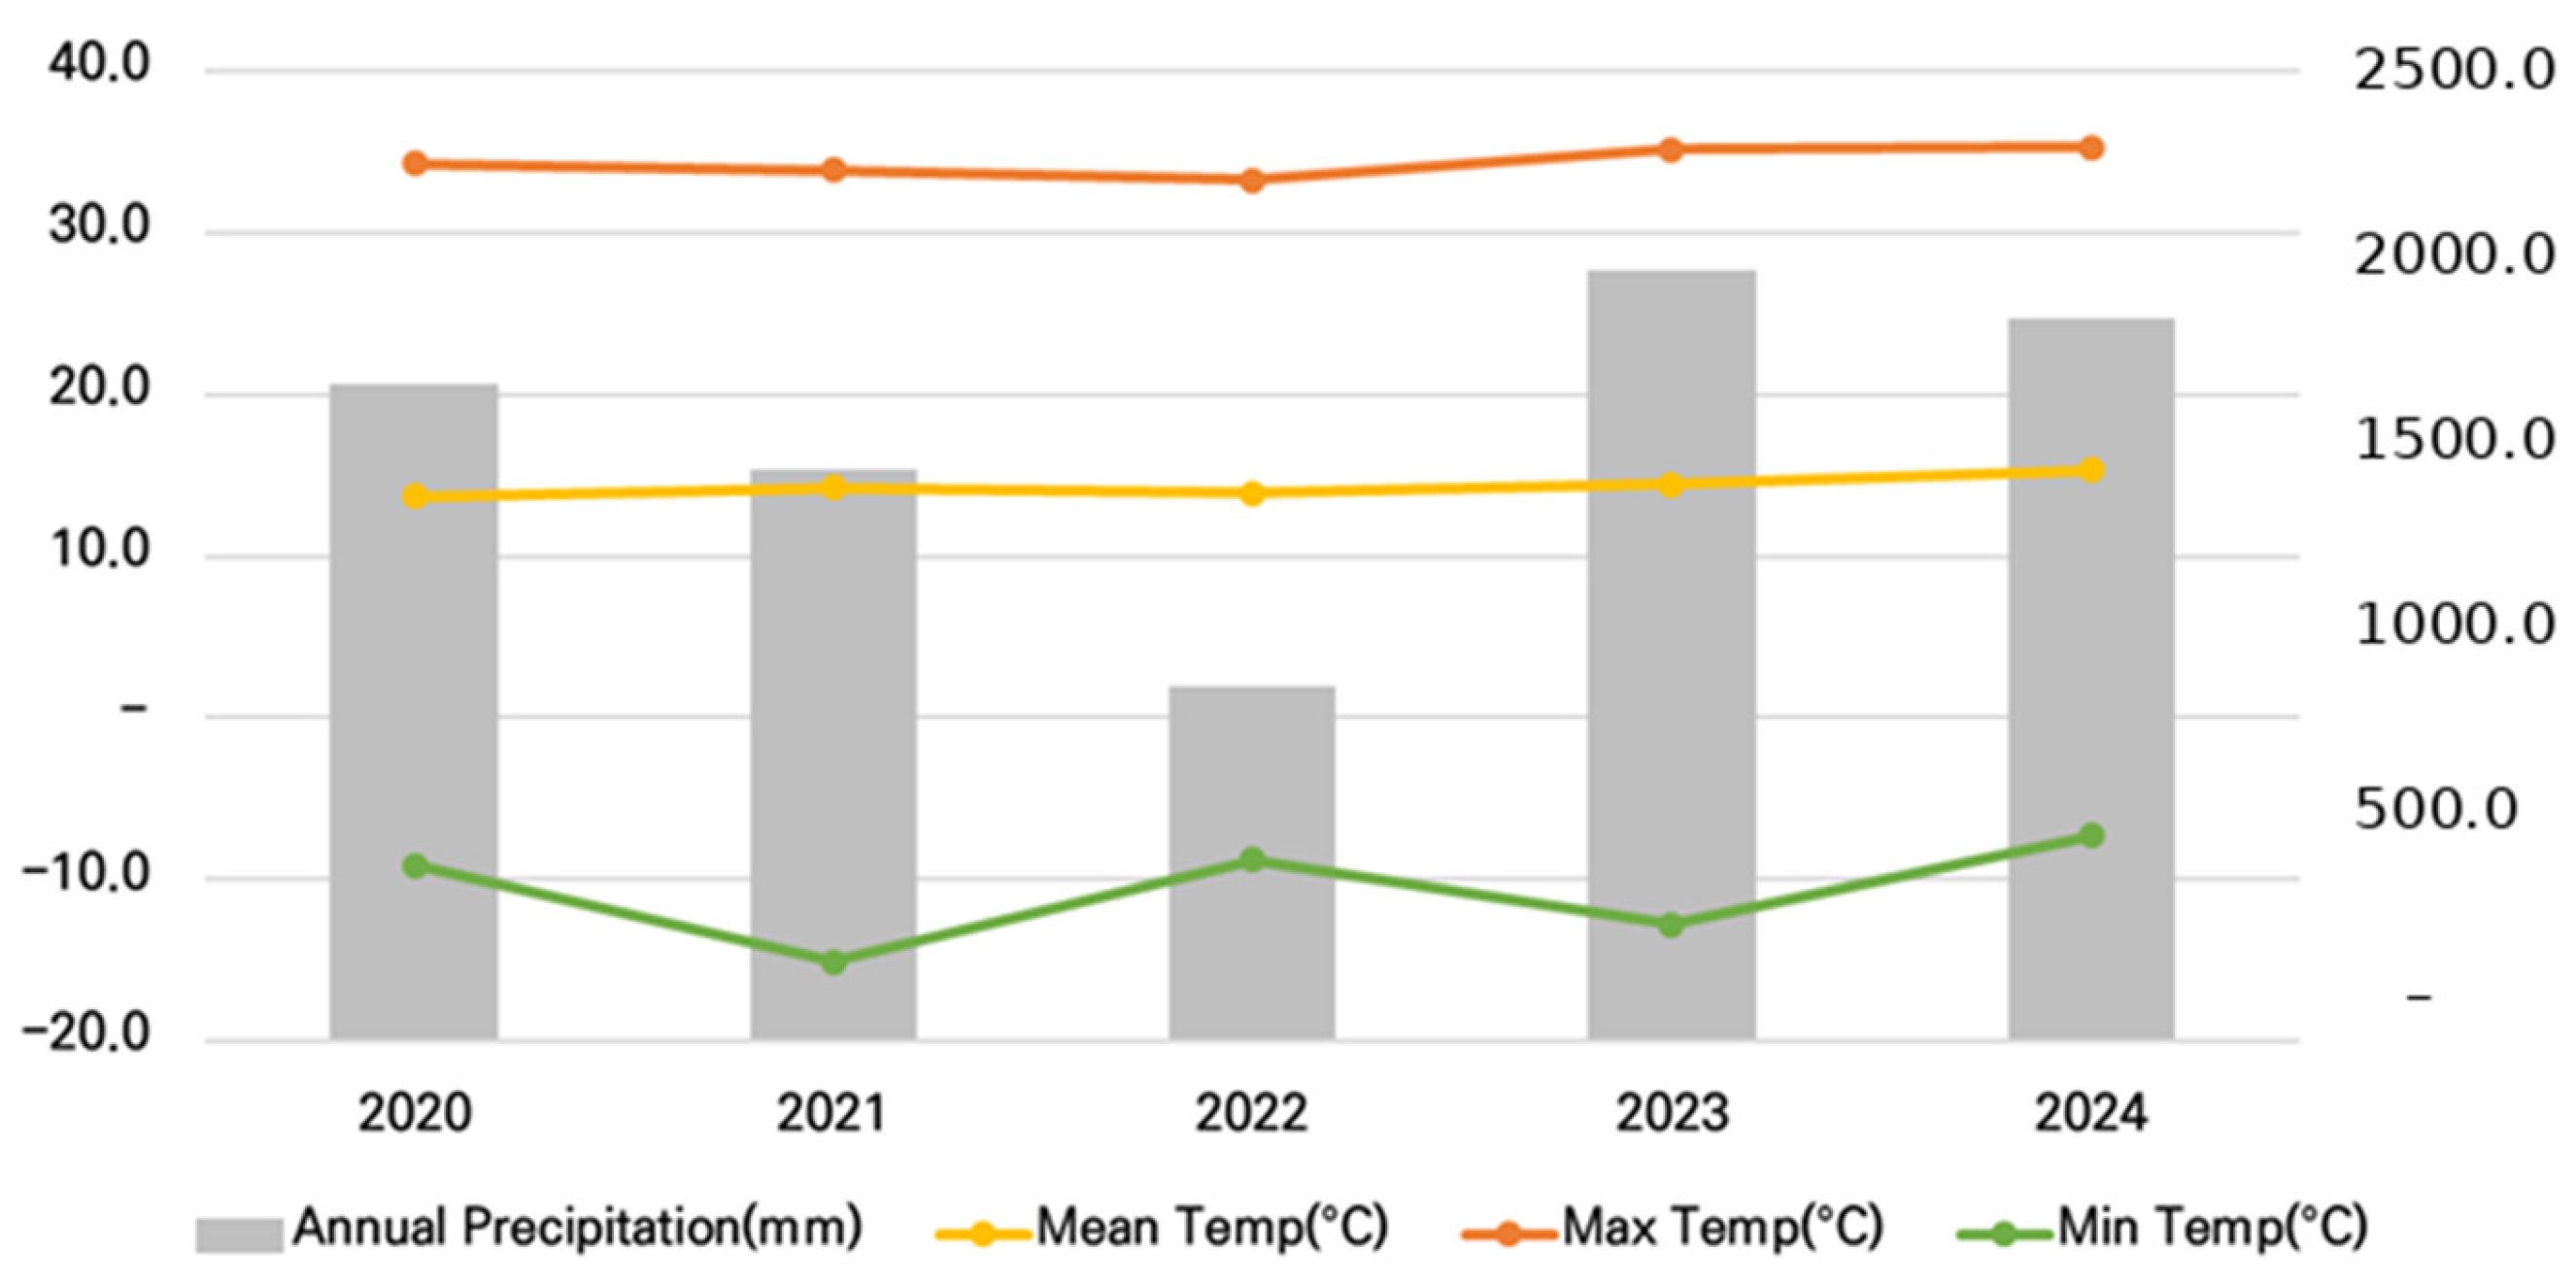
Meteorological data (2020–2024) from the Tamjin River Basin (Gangjin and Jangheung) revealed a distinct warming trend, with the annual mean temperature increasing by approximately 1.6 °C in both regions. Furthermore, precipitation exhibited extreme interannual variability; compared with the severe drought in 2022, rainfall in 2023 increased by 116% (1985.1 mm) in Jangheung, with the maximum occurring within the observation period (
Figure 2). These results indicate that extreme fluctuations in precipitation intensify with regional warming. Meteorological data were obtained from the Korea Meteorological Administration (KMA) data portal [
29].
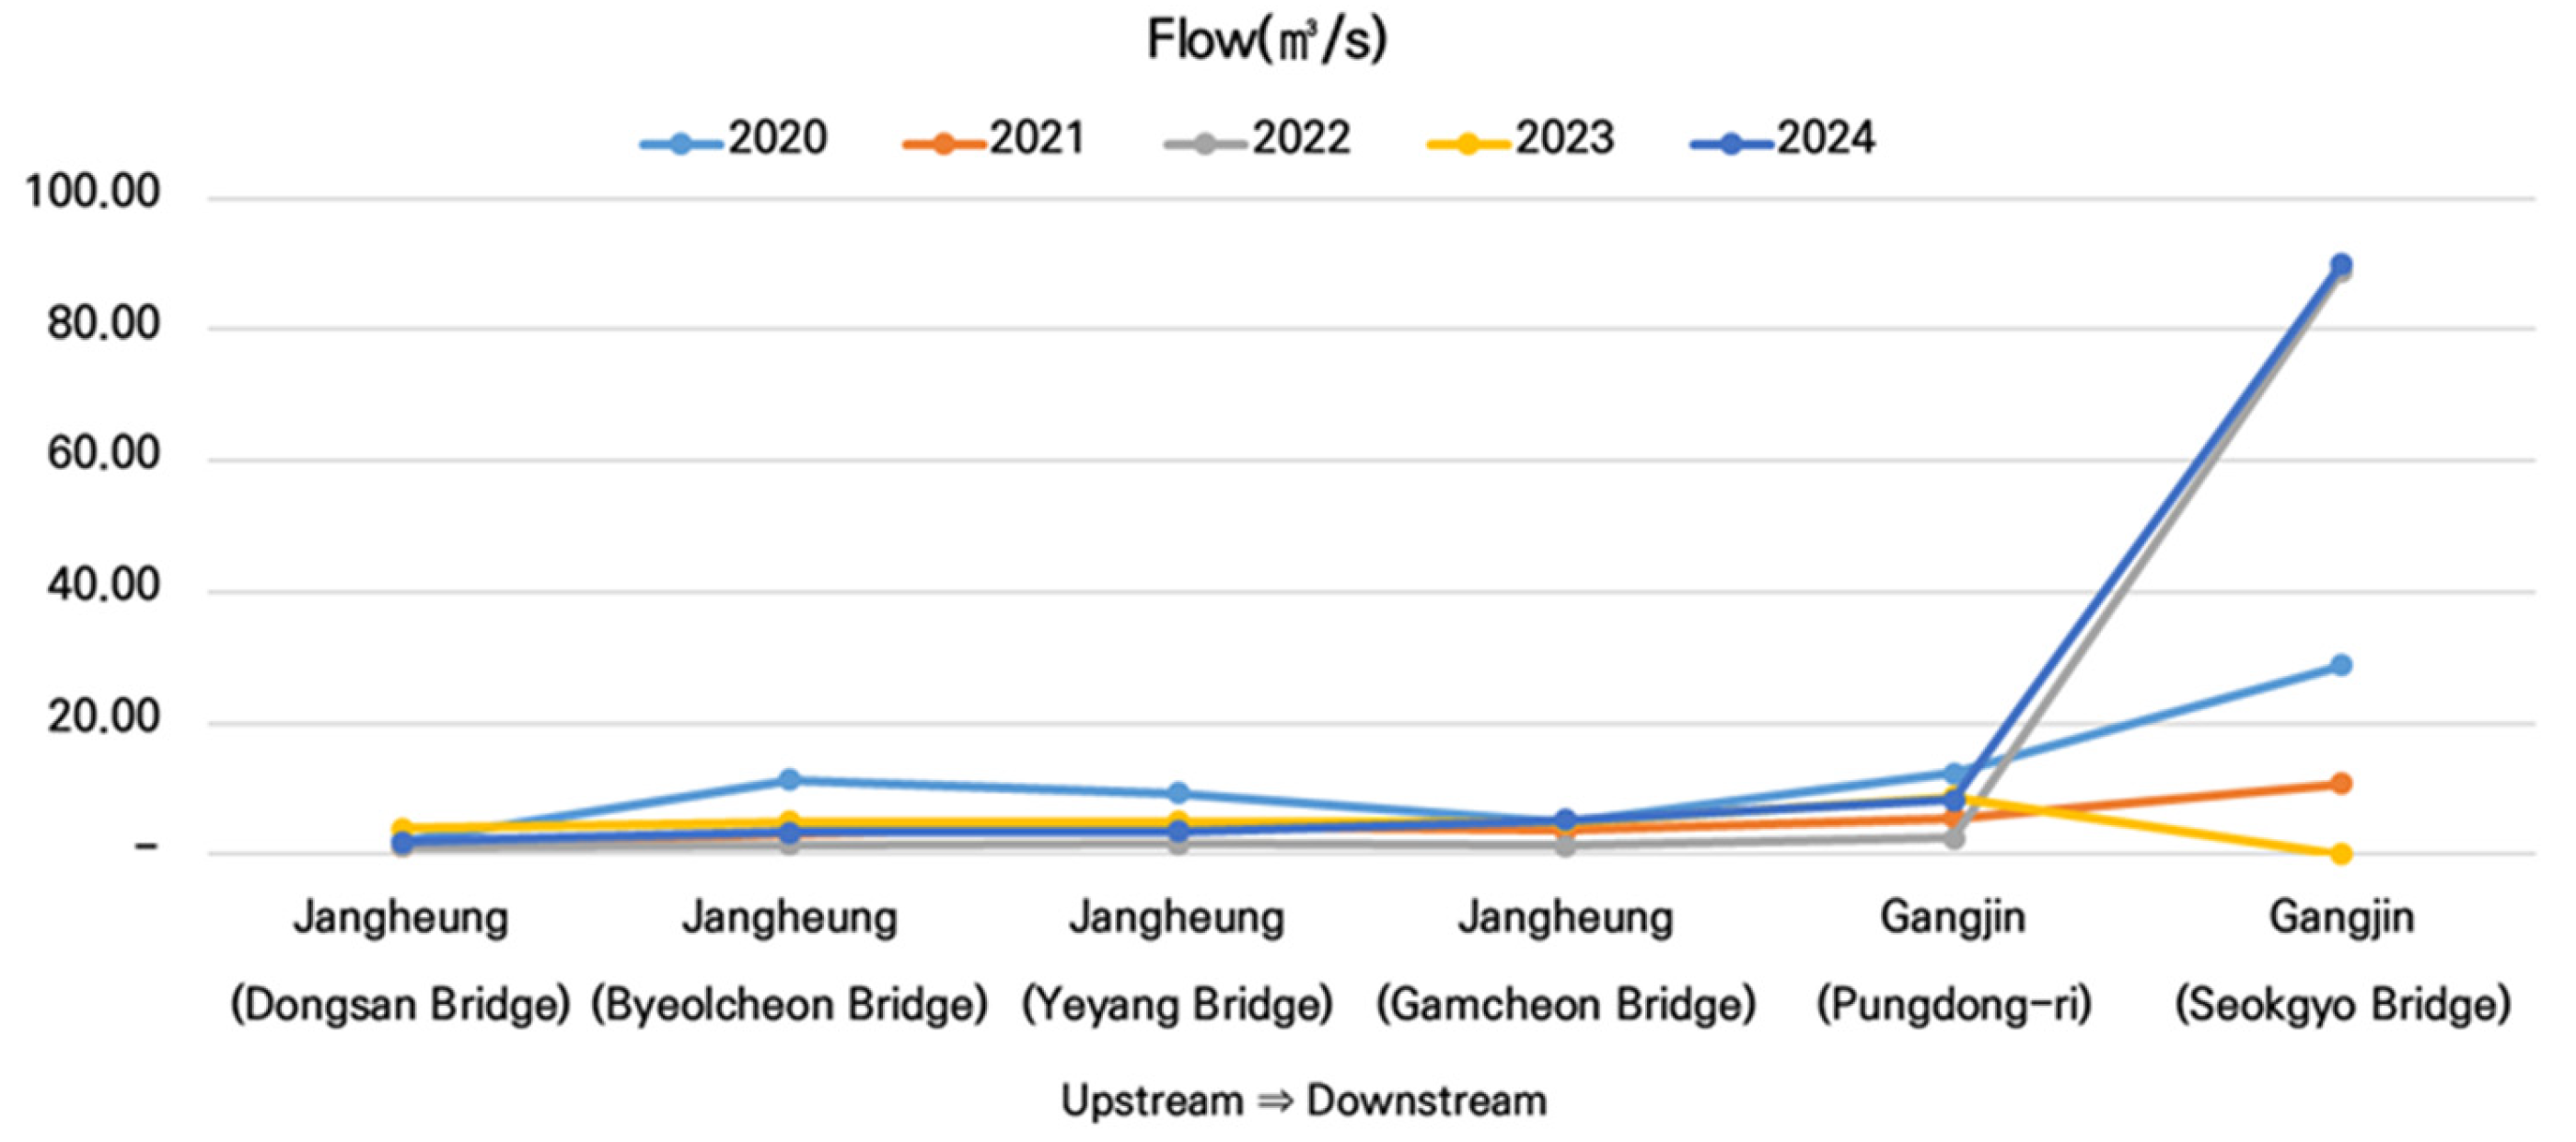
To understand the hydrological characteristics of the Tamjin River Basin, streamflow data from six monitoring stations were analyzed sequentially from upstream to downstream: the Dongsan, Byeolcheon, Yeyang, and Gamcheon bridges in Jangheung and the Pungdong-Ri and Seokgyo bridges in Gangjin. The river system exhibits a typical longitudinal profile, with discharge gradually increasing downstream because of continuous tributary inflows. The uppermost station, Dongsan Bridge, maintained a relatively stable baseflow, which averaged 1.86 m
3/s throughout the analysis period. In contrast, the lowermost station, the Seokgyo Bridge, experienced a dramatic expansion in streamflow. Notably, in 2022 and 2024, the discharge at this site reached 89.02 m
3/s and 90.16 m
3/s, respectively (
Figure 3).
Water quality data were obtained from the water environment information system (WEIS) data portal of the Ministry of Environment (ME) [
28]. Analysis of organic matter and nutrient dynamics in the Tamjin River revealed a distinct mechanistic shift in water pollution characteristics. From 2020 to 2022, the TOC concentration exhibited a strongly synchronized upward trend with both the BOD and T–P, particularly in the highly polluted downstream reaches at Tamjin5. This concurrent peak implies that water quality degradation during this period was driven primarily by the influx of untreated, cosourced pollutants (e.g., raw sewage and livestock wastewater) rich in biodegradable organics and phosphorus.
Before the model input files were generated, all meteorological, hydrological, and water-quality datasets were screened for duplicated dates, missing records, negative or physically impossible values, unit inconsistencies, and abrupt outliers. Short gaps in meteorological data were filled using neighboring KMA station records or linear interpolation when event continuity was not affected, whereas longer gaps and missing water-quality observations were not interpolated for calibration but were excluded from paired metric calculations. All time series were converted to a consistent daily output scale and aligned with the HSPF Water Data Management (WDM) format. This preprocessing was intended to prevent artificial bias in QDM correction, flow calibration, TOC/BOD conversion, and scenario comparison.
However, post-2023 data demonstrated clear decoupling between the TOC content and conventional water quality indicators. In 2024, while downstream BOD levels plummeted by approximately 50% (to 1.8–1.9 mg/L) and T–P continued to decline, which indicated notable water quality improvement, TOC concentrations remained persistently elevated at 3.3–3.6 mg/L. This difference suggests that despite the reduction in external pollutant loads, the contribution of autochthonous organic matter significantly increased, which was likely driven by the release of algal metabolites from rising water temperatures and sediment resuspension. These observations suggest that future water-quality management in the Tamjin River may benefit from complementing conventional BOD- and T-P-based controls with direct consideration of TOC and refractory organic matter (
Figure 4).
2.2.2. Climate Change SSP Scenario
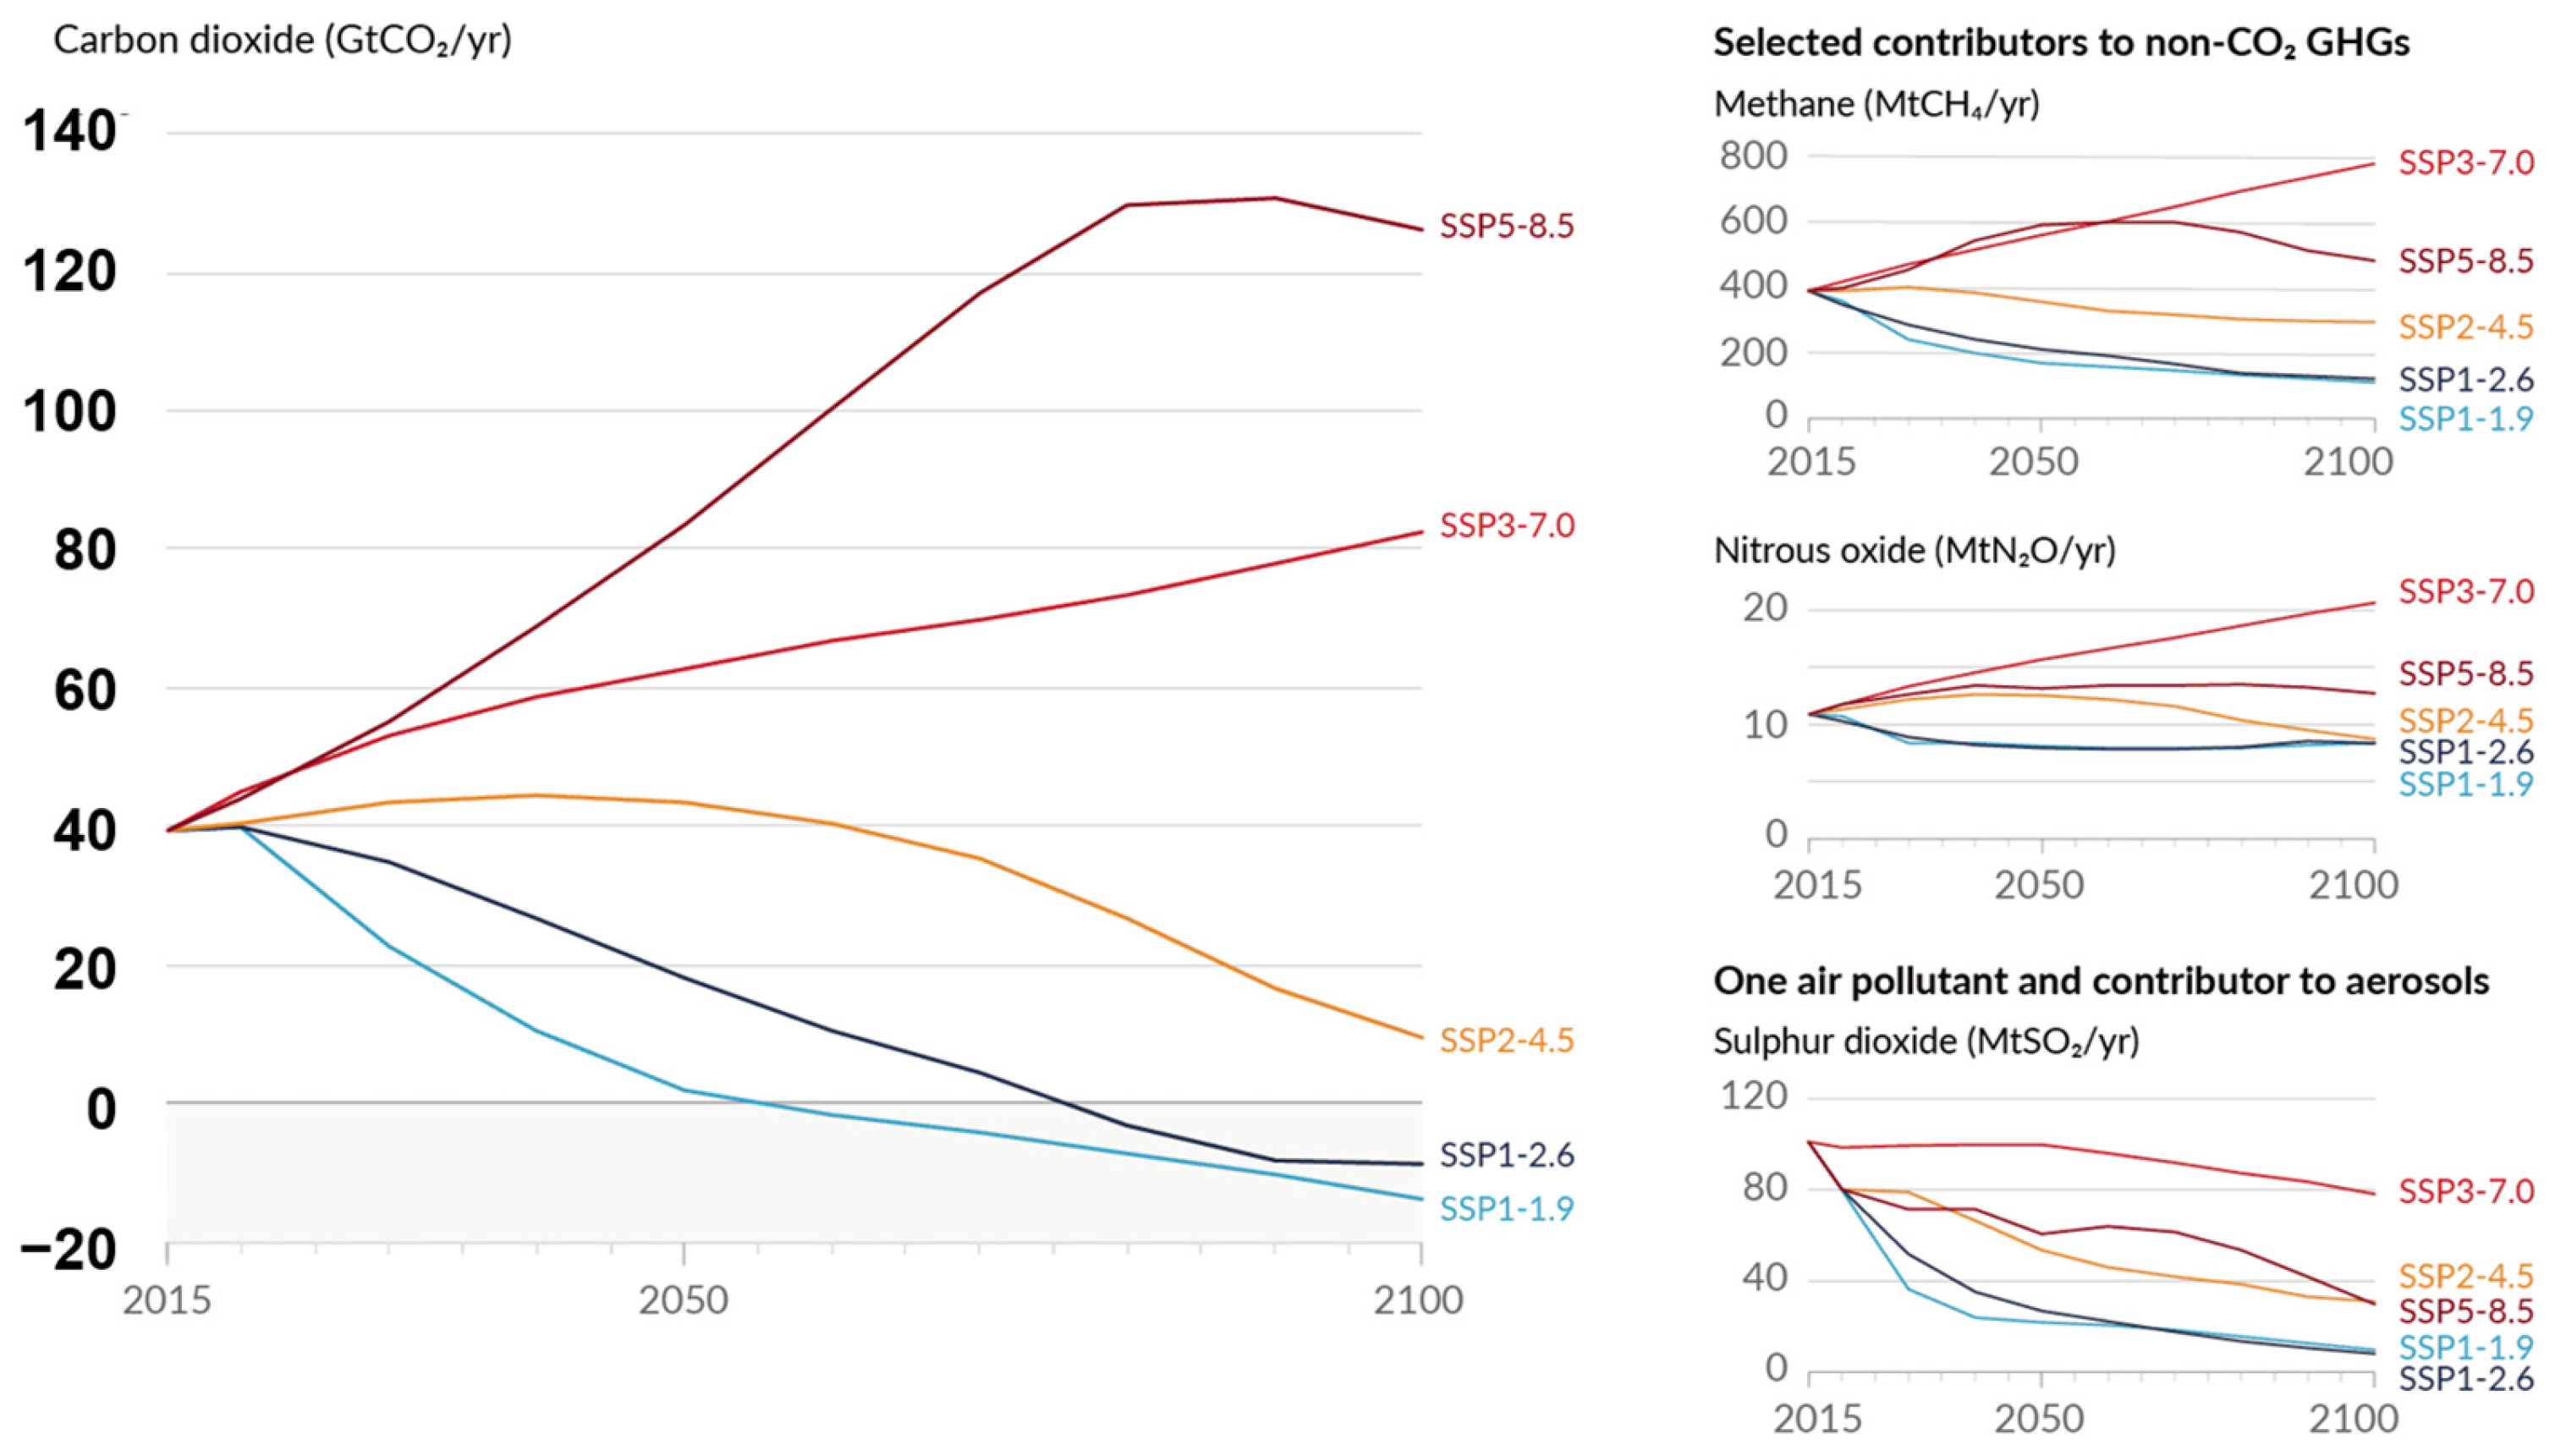
SSP scenarios are frameworks proposed by the Intergovernmental Panel on Climate Change (IPCC) that reflect future socioeconomic development pathways. These scenarios are based on assumptions regarding population growth, economic development, technological progress, and policy directions and are widely used to assess climate change impacts, adaptation, and mitigation. By combining socioeconomic pathways with radiative forcing trajectories, SSP scenarios provide quantitative projections of future climate conditions and serve as a standard framework for climate change analysis. The SSP scenarios are categorized into SSP1-2.6, SSP2-4.5, SSP3-7.0, and SSP5-8.5, and they are based on different levels of radiative forcing. A comparison of greenhouse gas emission pathways and the corresponding levels of climate change for each SSP scenario is presented in
Figure 5 [
1], which clearly illustrates the differences in emission characteristics and climate forcing among the scenarios. As a representative framework for projecting future climate change, SSP scenarios incorporate both socioeconomic development pathways and greenhouse gas emission levels and can be classified into low-emission (SSP1-2.6), intermediate-emission (SSP2-4.5), and high-emission (SSP3-7.0 and SSP5-8.5) scenarios.
In this study, SSP scenario data provided by the climate information portal of the Korea Meteorological Administration [
29] were utilized and processed in accordance with the objectives of the analysis. As the raw scenario data were provided as gridded outputs from climate models, preprocessing procedures, including unit conversion, temporal resolution adjustment, spatial correction, and bias correction, were performed to reconstruct the data into a form suitable for hydrological and climate analysis. With respect to the characteristics of each scenario, SSP1-2.6 represents a pathway in which greenhouse gas emissions are continuously reduced through the expansion of renewable energy and improvements in resource efficiency. According to the data, the atmospheric CO
2 concentration is projected to reach approximately 432 ppm by 2100, with a global mean temperature increase of approximately +1.9 °C by the end of the 21st century. The decreasing trend in CO
2 emissions over time under SSP1-2.6 is shown in
Figure 1, indicating effective climate mitigation. SSP2-4.5 represents an intermediate pathway in which current socioeconomic development trends continue, with greenhouse gas emissions increasing to a certain level before stabilizing. The CO
2 concentration is projected to be approximately 567 ppm, with a temperature increase of approximately +3.0 °C, and emissions show a gradual increase followed by stabilization or a slight decline. SSP3-7.0 represents a pathway characterized by weakened international cooperation and delayed technological development, resulting in continuously increasing greenhouse gas emissions. The CO
2 concentration is projected to reach approximately 834 ppm, with a temperature increase of approximately +4.3 °C. Furthermore, emissions exhibit a persistent upward trend. SSP5-8.5 represents a fossil fuel-driven development pathway, with the highest level of greenhouse gas emissions being assumed. The CO
2 concentration is projected to reach approximately 1089 ppm, with a global mean temperature increase of approximately +5.2 °C, and emissions show the steepest increasing trend among all the scenarios.
SSP5-8.5 was selected as the primary climate forcing scenario because the objective of this study was not to compare all possible emission pathways, but to quantify TOC responses and the pollutant-load reduction required under an upper-bound climate stress condition for long-term water quality management. In the Korean water-environment management context, pollutant load-reduction plans are generally translated into specific reduction amounts, implementation measures, schedules, and follow-up monitoring; therefore, evaluating whether proposed reduction measures remain effective under the most adverse climate condition is important for precautionary planning. Accordingly, SSP5-8.5 was used here as a conservative planning and stress-test scenario rather than as a probabilistic prediction of the most likely future. A full multi-scenario comparison across SSP1-2.6, SSP2-4.5, SSP3-7.0, and SSP5-8.5 would provide a broader uncertainty range and is recommended for future research; however, the single-scenario design adopted in this study is consistent with the management-oriented purpose of deriving robust TOC reduction requirements under a high-risk climate pathway.
2.3. Theory of the HSPF Model
The HSPF model, developed by the United States Environmental Protection Agency (Washington, DC, USA), was designed to simulate the quantity and quality of runoff from a watershed. The model inputs comprise meteorological data (e.g., precipitation, temperature, wind speed, solar radiation, evaporation, dew point temperature, and cloud cover) and topographical data (e.g., digital elevation modeling and land use mapping). The HSPF model simulates hydrological circulation and water quality by dividing the river sections of the target watershed into multiple sub-watersheds based on user definition and by classifying each sub-watershed into three modules: permeable area, impervious area, and river [
10,
11,
12,
16]. The impervious area module generates surface runoff. The permeable area module analyzes all three main processes: surface runoff, interflow, and groundwater. This module analyzes all the processes related to soil infiltration, soil moisture, underground water, and baseflow separation. Consequently, the HSPF model can predict the hydrological circulation and water quality of a watershed [
10,
17,
18,
19,
20]. Additionally, HSPF is a semidistributed long-term runoff model applicable to various fields of watershed management, such as assessing the effects of water quality improvement and changes in pollutant sources within the watershed through hydraulics, hydrology, and water quality simulation [
30]. The HSPF model can simulate individual runoff due to rainfall and nonpoint pollution sources in pervious areas, where surface runoff, intermediate runoff, and base runoff occur, as well as in impervious areas, where only surface runoff occurs [
17].
In this study, the Tamjin River HSPF model was implemented using BASINS 4.5/HSPF (United States Environmental Protection Agency, Washington, DC, USA) with WDM input files for meteorological, streamflow, and water-quality time series. The watershed was divided into Reach 1-Reach 4 according to the stream network and standard sub-watershed boundaries. PERLND, IMPLND, and RCHRES modules were used for pervious areas, impervious areas, and stream reaches, respectively. Hydrological parameters were first adjusted to reproduce daily flow at Jangheung Dam and Gamcheon Bridge, and water-quality parameters related to biomass carbon conversion and refractory organic matter settling were then calibrated for TOC at Tamjin5. Parameter selection was based on HSPF guidance ranges, previous applications in Korean watersheds, and sensitivity checks in which parameters controlling infiltration, interflow/baseflow separation, and organic matter settling were sequentially adjusted.
2.4. QDM Bias Correction
QM, a widely used bias correction method, adjusts the cumulative distribution function of model outputs to match that of observational data, thereby effectively reducing errors across the entire distribution. However, the QM directly applies bias correction relationships derived from historical data to future projections, which may distort relative changes or long-term trends associated with future climate change. In particular, for variables such as extreme precipitation and high temperature, where the change signal itself is critical, simple distribution matching may not sufficiently preserve future characteristics.
To overcome these limitations, the QDM approach is adopted in this study. QDM retains the quantile-based correction framework while incorporating the projected change signals of future scenarios, thereby preserving the relative increases or decreases suggested by climate models after bias correction. As a result, QDM not only corrects distributional biases but also more consistently maintains the magnitude and direction of future climate change. This characteristic makes QDM a suitable method for applying SSP scenario data to hydrological analyses and impact assessments. Such advantages are particularly important for variables with high variability and extreme behavior, such as precipitation, as the QDM approach ensures both the preservation of climate change signals and the realism of observational consistency [
22,
23].
QDM is a bias-correction method in which the quantile position of a future simulated value within the future modeled distribution is first identified; a correction factor is then derived from the relationship between observed and historical modeled data at the corresponding quantile. Unlike conventional QM, which directly maps future values onto the observed distribution, QDM corrects bias while preserving the projected change signal at each quantile. The QDM technique is designed to preserve quantile-specific relative changes in ratio variables such as precipitation.
For precipitation, the QDM can be expressed as follows:
where
where
is the future simulated precipitation,
) is the bias-corrected future precipitation,
is the cumulative distribution function (CDF) of the future modeled data,
is the quantile function of the observed data during the reference period, and
is the quantile function of the modeled data during the reference period. Thus, the quantile position
of a future simulated value is first determined from the future distribution. The ratio between the observed and historical modeled quantiles at the same level is applied to the future value. This formulation enables bias correction of the historical distribution while preserving the quantile-specific relative change signal in future precipitation.
In this study, the QDM approach was applied to the SSP5-8.5 scenario through the following steps. First, the observed reference series and historical model series were used to estimate quantile-specific correction factors. Second, future scenario data were converted into their corresponding quantile positions based on the future modeled distribution. Third, correction factors were interpolated at the matched quantiles and applied to the future modeled values using a multiplicative framework for precipitation. Finally, the bias-corrected scenario series were used for subsequent hydrological analysis. To reduce discontinuities in the corrected values, quantile interpolation was applied between adjacent empirical quantiles. In practical applications, the correction could be performed separately by month or season to reflect regular differences in precipitation characteristics.
For comparison with the QDM approach, conventional quantile mapping (QM) was also applied to the same precipitation dataset. In QM, each modeled precipitation value is assigned to a probability level in the modeled reference-period CDF and then replaced by the corresponding observed quantile. This approach is effective for reproducing the observed precipitation distribution during the reference period; however, because future values are directly mapped to the observed historical distribution, the relative climate-change signal can be modified. By contrast, QDM applies a quantile-specific correction factor while preserving the modeled relative change signal. Therefore, QM and QDM were compared using the overlap period of 2021–2024 to evaluate distributional bias correction, cumulative precipitation bias, wet-day frequency, and quantile-level sensitivity.
2.5. Integrated HSPF-QDM-TOC Load Management Framework
The integration of HSPF, QDM, and TOC-based load management was implemented as a sequential climate-to-management assessment framework. First, QDM-corrected SSP5-8.5 meteorological series were generated to preserve future climate change signals while reducing distributional bias. Second, the corrected climate inputs were used to drive the calibrated HSPF model and simulate future streamflow and TOC responses under changing hydrological conditions. Third, the simulated TOC outputs were converted into management indicators, including daily load, annual average daily load, discharge load, delivered load, delivery ratio, TOC threshold exceedance frequency, and 20% and 30% load-reduction scenarios. This procedure differs from conventional single-purpose modeling applications by directly linking climate forcing, watershed processes, and TOC total load management decisions within one quantitative framework.
In this framework, external load effects and internal TOC generation processes were conceptually separated to clarify the interpretation of the load-reduction scenarios. External load effects refer to watershed-derived organic carbon and associated pollutants transported to the river through point sources, agricultural runoff, livestock and domestic wastewater, stormwater runoff, soil erosion, and forest- or riparian-derived organic matter. These external inputs were represented by discharge loads, delivered loads, delivery ratios, and the 20% and 30% watershed load-reduction scenarios. In contrast, internal TOC generation processes refer to organic carbon produced, transformed, or retained within the river system itself, including algal and microbial production, decomposition of aquatic biomass, sediment-water exchange, resuspension of particulate organic carbon, and the release of refractory dissolved organic matter. Therefore, the load-reduction scenarios were interpreted primarily as reductions in external watershed loads, whereas the residual TOC response after load reduction was considered to reflect internal TOC generation, in-stream transformation, and hydrological retention processes.
3. Results and Discussion
3.1. Estimation of Delivered Loads Considering Discharge Loads for the 2020s, 2030s, and 2040s
In this study, the final TOC discharge loads and delivered TOC loads were estimated to support TOC pollution management in the Tamjin River Basin. The year 2023 was selected as the baseline year representing the 2020s. Because the National Pollution Source Survey provides final discharge loads primarily on a BOD basis and does not directly provide corresponding TOC-based final discharge loads, basin-specific empirical TOC/BOD conversion factors were developed and applied to estimate the final TOC discharge loads.
In general, a TOC/BOD conversion factor is derived from paired TOC and BOD concentrations measured at the same monitoring site and sampling time. For each valid paired observation, the TOC/BOD ratio was calculated as follows.
where
is the TOC/BOD ratio for observation
monitoring site
, and
and
are the corresponding TOC and BOD concentrations measured at the same site and sampling time, respectively. Missing observations and paired data with invalid or extremely low BOD concentrations were excluded because division by values close to zero can produce unrealistically high TOC/BOD ratios.
For this study, paired BOD and TOC monitoring data were compiled from representative water-quality monitoring sites in each sub-watershed. The distributions and central tendencies of the valid TOC/BOD ratios were examined together with the water-quality characteristics of the corresponding sub-watersheds to establish representative basin-specific empirical TOC/BOD conversion factors. A conversion factor of 1.3 was assigned to the Jangheung Dam sub-watershed, whereas a factor of 1.5 was assigned to the Geumgang Stream and the middle and lower Tamjin River sub-watersheds. These factors represent empirical TOC/BOD relationships observed within the study basin and should not be interpreted as universal constants applicable to other watersheds or individual pollution-source effluents.
To improve transparency in the TOC/BOD conversion procedure, the paired observations were matched by monitoring site and sampling date, and only valid pairs with non-missing TOC and BOD values were retained. The ratio distributions were reviewed by sub-watershed to identify unrealistic values caused by near-zero BOD concentrations or incomplete paired observations. The selected factors were therefore used as basin-specific empirical conversion coefficients for reconstructing TOC-based management loads from the available BOD-based pollution-source inventory. They were not used to calibrate daily TOC concentrations directly; instead, the HSPF TOC simulation was evaluated independently against observed TOC concentrations at Tamjin5.
For the 2023 baseline year, the final TOC discharge load was calculated by multiplying the BOD-based final discharge load obtained from the National Pollution Source Survey by the corresponding basin-specific empirical TOC/BOD conversion factor.
where
is the estimated final TOC discharge load for sub-watershed
in 2023 (kg
),
is the BOD-based final discharge load obtained from the National Pollution Source Survey (kg
), and
is the basin-specific empirical TOC/BOD conversion factor.
For the 2030s and 2040s, the projected BOD-based final discharge loads were first developed by reflecting the projected changes in population, land use, and pollution-source characteristics. The projected BOD loads were subsequently converted into final TOC discharge loads using the same sub-watershed-specific conversion factors applied to the 2023 baseline year.
where
represents the 2023 baseline year, the 2030s, or the 2040s. Applying the same conversion factors to all periods ensured methodological consistency among the present and future scenarios. This approach represents a simplifying scenario assumption that the empirical relationship between the BOD-based and TOC-based final discharge loads remains unchanged over time. Therefore, possible future changes in treatment efficiency, pollution-source composition, and the biodegradability of organic matter were not explicitly reflected in the conversion factors.
The delivered TOC loads were obtained from the daily TOC load time series simulated by the HSPF water-quality model and stored in the corresponding WDM output files. The annual average daily delivered load (AADL) was used as the representative indicator of annual load behavior and was calculated as follows.
where
is the annual average daily delivered TOC load for sub-watershed
(kg
),
is the daily TOC load delivered from sub-watershed
on day
, and
is the number of simulation days in the corresponding year.
The TOC delivery ratio was calculated by comparing the annual average daily delivered load with the corresponding final TOC discharge load.
where
is the TOC delivery ratio for sub-watershed
(%)
is the annual average daily delivered TOC load, and
is the corresponding final TOC discharge load.
To ensure consistent terminology, the final discharge load refers to the estimated TOC load released from pollution sources before watershed transport, retention, and attenuation processes. The delivered load refers to the portion of the final discharge load transported to the corresponding modeled stream reach after the watershed delivery processes represented in HSPF. Total load is used as a broader term referring to the management-load budget established for TOC total load control. The delivered TOC loads entering the modeled stream reaches were used as the baseline loads for constructing the 20% and 30% load-reduction scenarios.
For the 2023 baseline year, the TOC delivery ratios among the sub-watersheds ranged from 15.5% to 20.1%. This result indicates that approximately one-sixth to one-fifth of the estimated final TOC discharge load was delivered to the corresponding modeled stream reaches. Relatively high delivery ratios were observed in the Jangheung Dam and middle-reach sub-watersheds, whereas the lowest ratio was observed in the lower Tamjin River sub-watershed. These spatial differences may be associated with variations in topography, runoff conditions, flow pathways, transport distance, hydraulic retention, and the retention, transformation, and attenuation of organic matter within the watershed and stream network. The corresponding values are summarized in
Table 1.
The comparison between the final TOC discharge loads and delivered TOC loads showed a positive relationship across the sub-watersheds, with higher final discharge loads generally corresponding to higher delivered loads. This relationship indicates that increases in organic loads released from pollution sources are accompanied by increases in the loads transported to the modeled stream reaches. However, the delivered loads represented only a limited proportion of the corresponding final discharge loads, which may reflect the retention, transformation, and attenuation processes represented in the model.
The long-term scenario analysis from 2023 to 2040 showed that the final TOC discharge loads were projected to increase across the sub-watersheds as a result of the assumed changes in population, land use, and pollution-source characteristics. However, the projected increases in delivered TOC loads were relatively smaller than those in the final discharge loads, resulting in decreasing delivery ratios in several sub-watersheds. For example, the TOC delivery ratio for Geumgang Stream was projected to decrease from 17.70% in 2023 to 15.07% in 2040. Similarly, the delivery ratio for the lower Tamjin River was projected to decrease from 15.51% to 13.99% over the same period.
The decreasing delivery ratios indicate that the simulated delivered loads did not increase at the same rate as the projected final discharge loads. This pattern may reflect differences in hydrological transport, retention, transformation, and attenuation under the future simulation conditions. However, it should not be interpreted as direct evidence that future pollution-reduction policies or the self-purification capacity of the river will necessarily offset increases in final discharge loads. The projected delivery ratios are influenced by the assumptions used to estimate future discharge loads, the application of constant basin-specific empirical TOC/BOD conversion factors, and the representation of organic-matter transport and attenuation processes in HSPF. Overall, the simulated TOC load dynamics indicate both spatial differences associated with watershed and hydrological characteristics and temporal changes resulting from the projected pollution loads and modeled transport processes. The projected 2030 and 2040 results are summarized in
Table 2.
3.2. Impact of the QDM SSP5-8.5 Scenario for the Tamjin River Basin
The analysis of temporal changes in precipitation under the SSP5-8.5 scenario (
Figure 6) indicates a clear seasonal concentration of precipitation during the summer months. In all the periods, the monthly precipitation increased beginning in spring and peaked in July and August, after which it decreased from September onward. Compared with the baseline period, the future period generally had greater summer precipitation, with the most pronounced increases occurring in July and August. Although the magnitude of monthly precipitation varied among the 2040 results, the overall seasonal pattern remained similar, indicating that summer precipitation continued to dominate the annual distribution under future climate conditions.
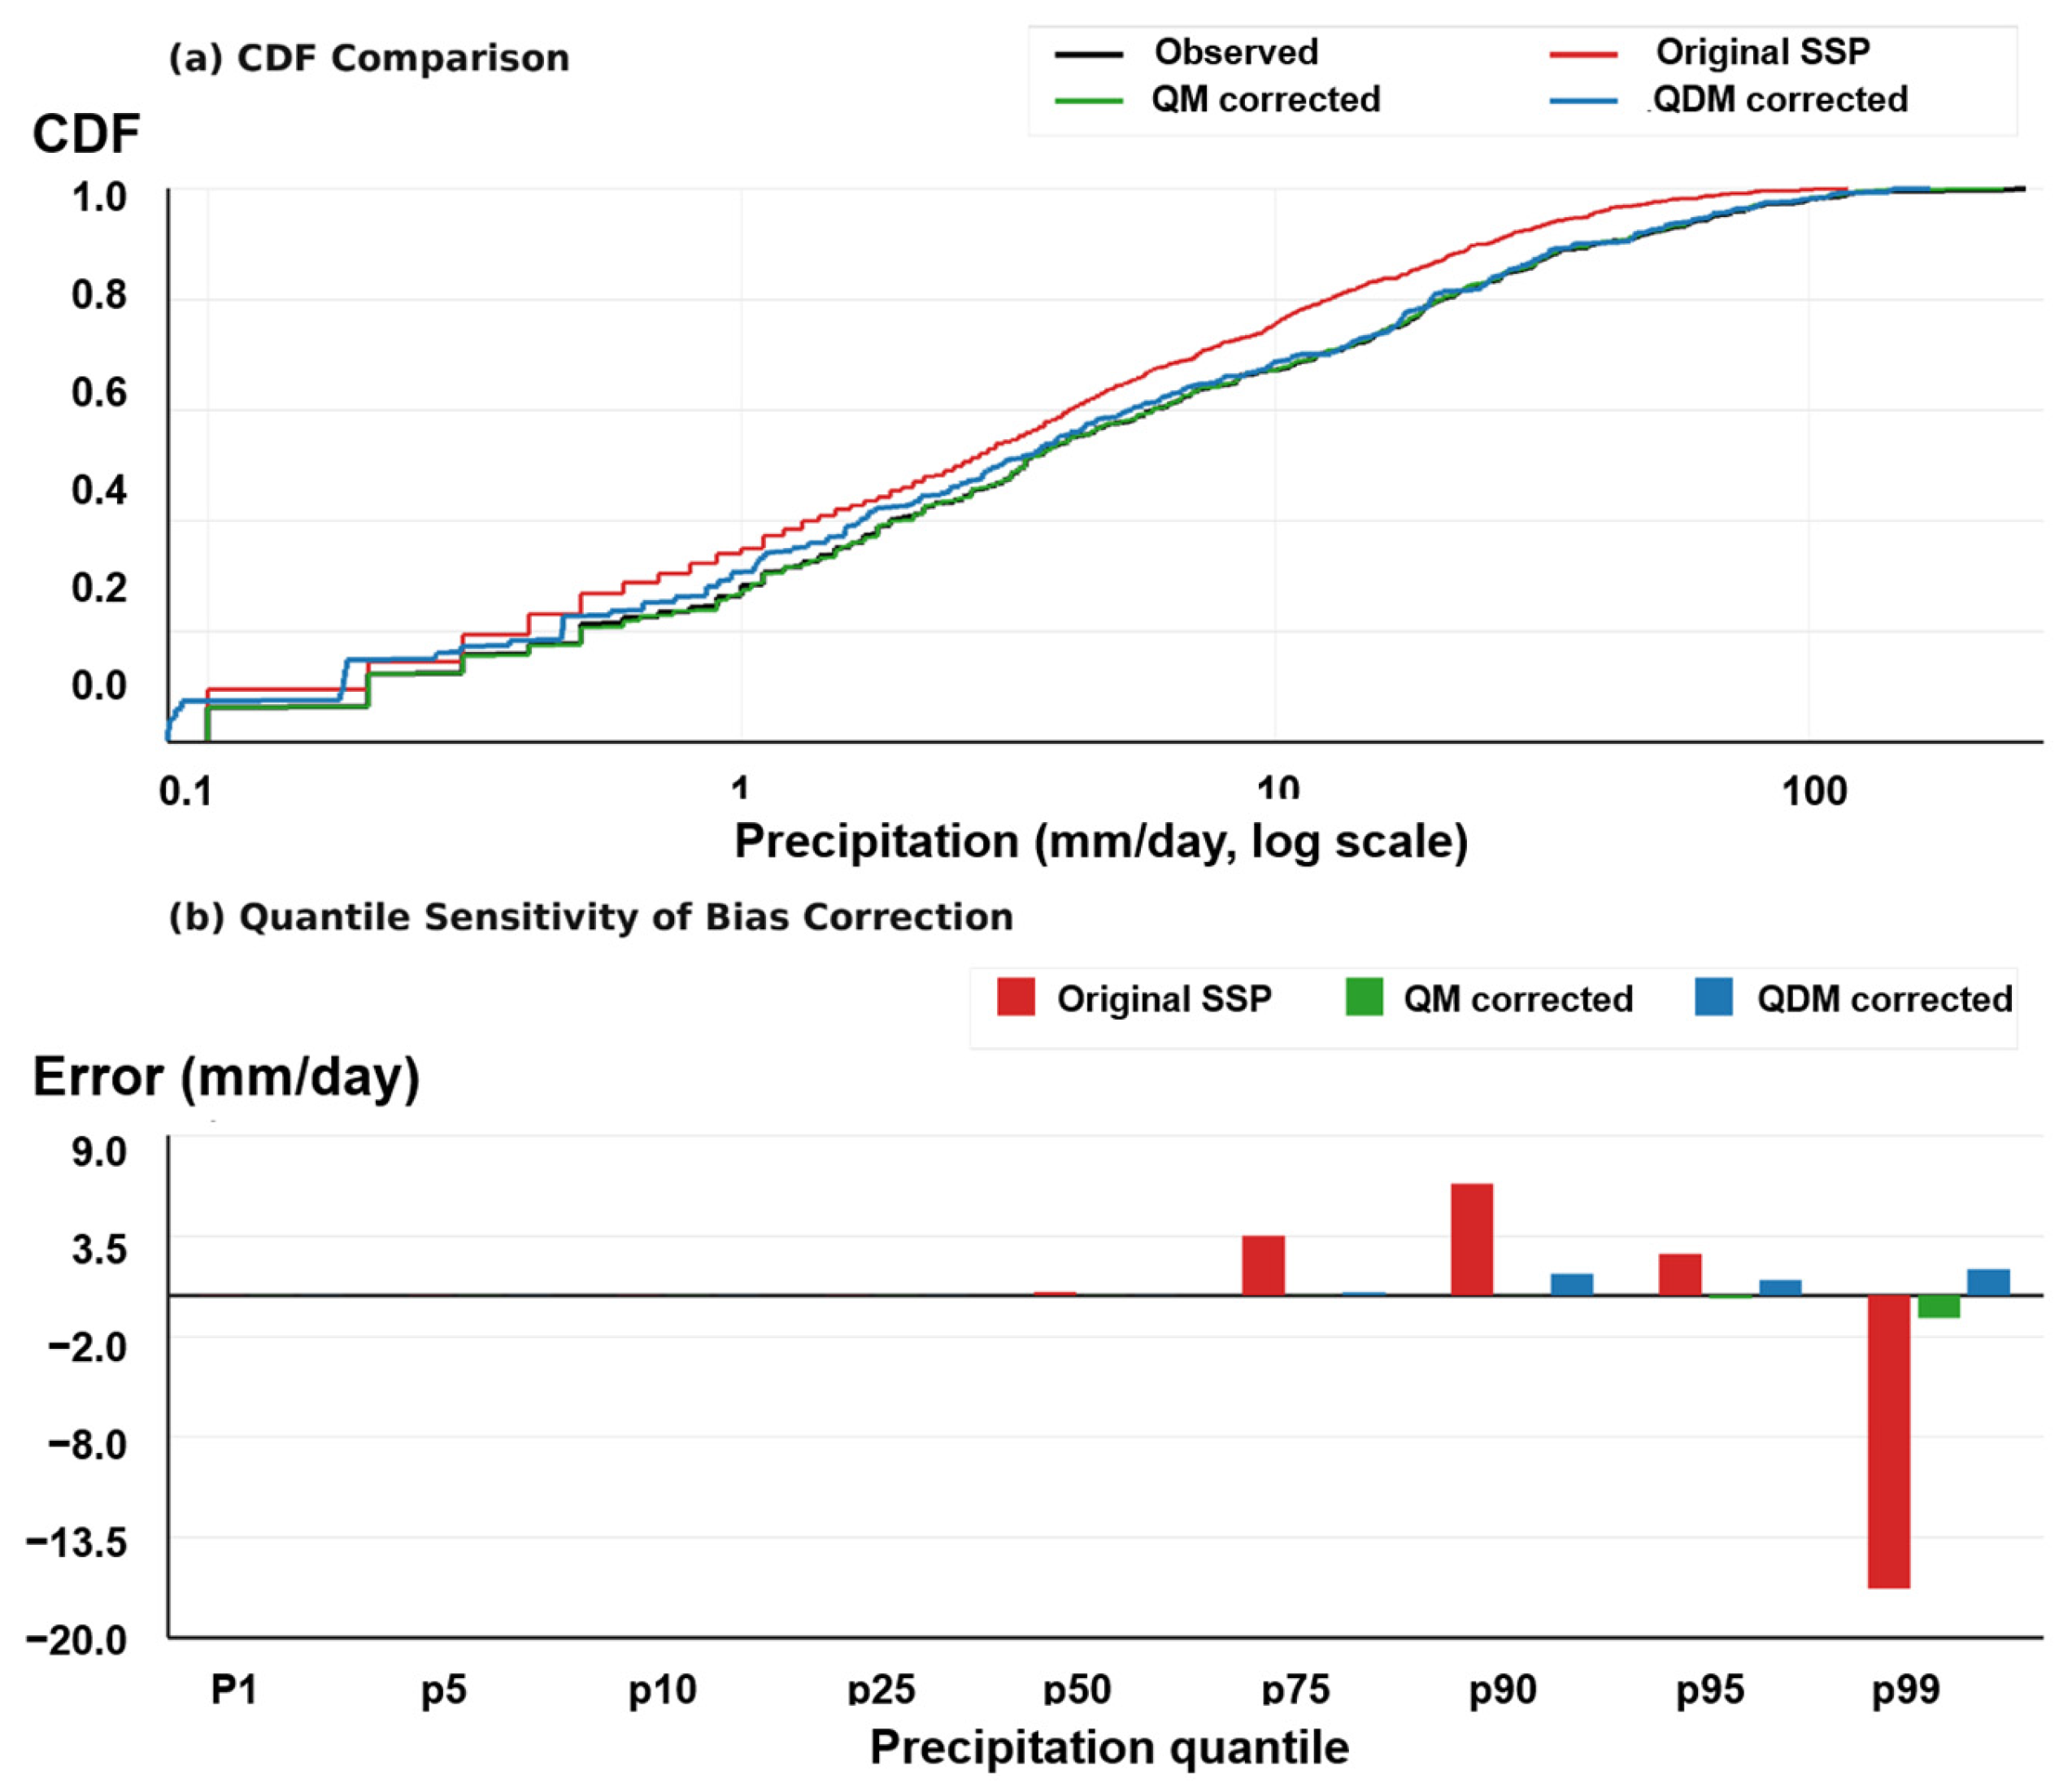
To evaluate the performance and sensitivity of the bias-correction procedure, the precipitation data for the overlap period of 2021–2024 were compared with the observed records using both time-series and cumulative distribution function (CDF) analyses.
Figure 6 compares the observed precipitation, original SSP5-8.5 precipitation, QM-corrected precipitation, and QDM-corrected precipitation. The time-series comparison shows that the original SSP precipitation did not sufficiently reproduce the temporal variability and magnitude of observed rainfall events, especially low-to-moderate rainfall occurrences and several heavy precipitation periods. After bias correction, both QM and QDM improved the representation of event-scale precipitation relative to the original SSP data, although discrepancies remained for some extreme events.
This improvement is more clearly shown in the CDF comparison. The original SSP precipitation for the reference period substantially deviated from the observed distribution, especially in the low-precipitation range. For example, at approximately 0.1 mm, the cumulative probability of the original SSP data was approximately 0.43–0.48, whereas the observed and QDM-corrected values were both close to 0.70–0.72. Similarly, near 1 mm, the original SSP cumulative probability remained lower at approximately 0.62–0.64, whereas the observed and corrected series were nearly identical at approximately 0.78–0.80. At approximately 10 mm, the original SSP curve still underestimated the cumulative probability by approximately 0.86–0.88, compared with approximately 0.90–0.91 for the observed and corrected data. Above 30–50 mm, the discrepancy between the original and observed distributions decreased, and the QDM-corrected curve almost overlapped with the observed curve across most of the high-precipitation range. Overall, these results indicate that the QDM effectively reduced the systematic bias in the original SSP5-8.5 precipitation data and successfully reproduced the observed distribution over a wide range of rainfall magnitudes (
Figure 6). Although some underestimations remained for the most extreme events, the corrected series strongly agreed with the observations in terms of both time series behavior and cumulative probability. This improvement is particularly important because hydrological and water quality simulations are highly sensitive to precipitation frequency, magnitude, and distribution. Therefore, the QDM-corrected precipitation dataset was considered suitable for subsequent streamflow and TOC water quality simulations under future climate scenarios for the 2040s.
The CDF comparison and quantitative sensitivity indicators further clarify the differences between QM and QDM. For the 2021–2024 overlap period, the original SSP precipitation had a cumulative volume bias (DV) of 14.35%, whereas QM and QDM reduced the DV to −3.69% and −0.25%, respectively. QM showed the smallest CDF quantile MAE (0.16 mm), indicating the closest reproduction of the observed reference-period distribution. QDM also substantially reduced distributional error (CDF quantile MAE = 0.40 mm) and provided the smallest cumulative precipitation bias. Wet-day frequency error was reduced from 28.13 percentage points in the original SSP series to 0.00 percentage points for QM and −0.48 percentage points for QDM. In the quantile sensitivity analysis, the original SSP series showed large positive errors around the 75th to 95th percentiles and a pronounced negative error at the 99th percentile, whereas QM and QDM markedly reduced these quantile-level errors. These results indicate that QM is effective for matching the observed CDF, whereas QDM provides a better balance between distributional correction, cumulative precipitation bias reduction, and preservation of quantile-specific relative climate-change signals. Therefore, QDM was selected for subsequent HSPF streamflow and TOC simulations (
Figure 6).
3.3. Model Construction, Verification, and Calibration
3.3.1. Flow Calibration and Validation Results
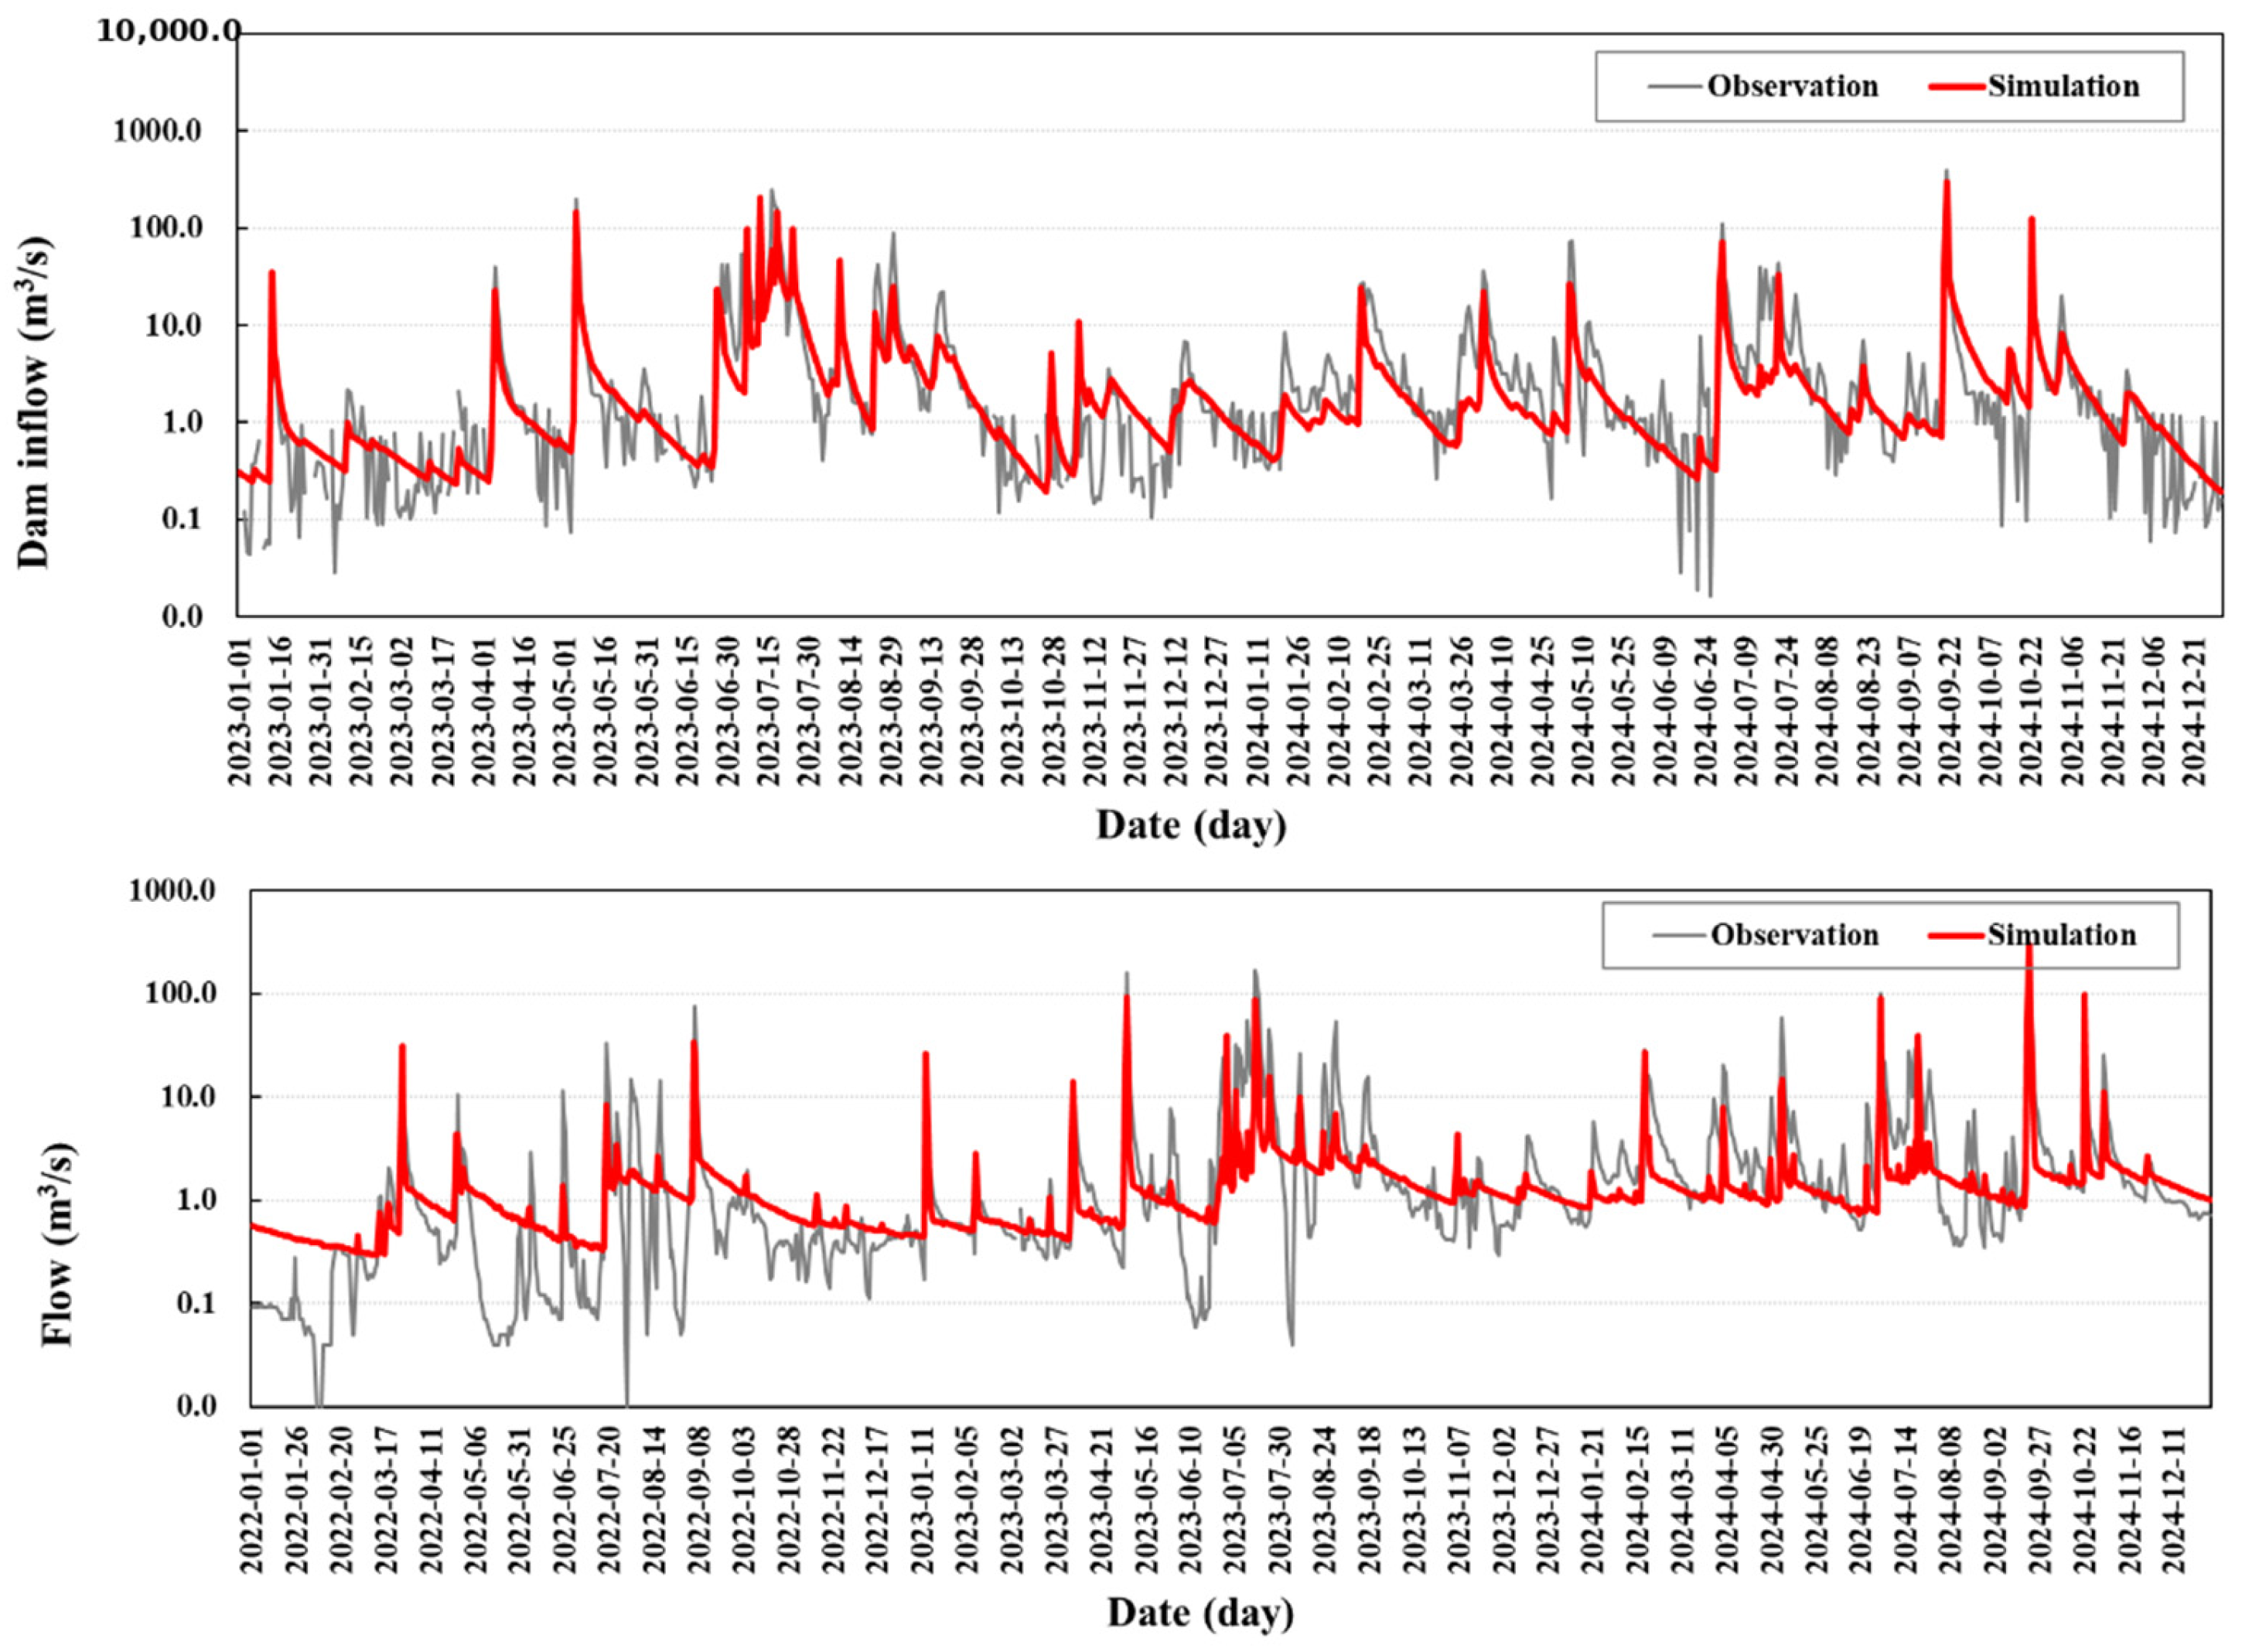
The HSPF model was calibrated and validated for the Jangheung Dam and Gamcheon Bridge (Jangheung-gun), and the key parameters were adjusted, as shown in
Table 3, to reflect the hydrological response characteristics of the watershed. As a result of these parameter adjustments, the model improved the representation of the timing and magnitude of peak discharge, the recession process after rainfall events, and the characteristics of baseflow. In particular, the use of different parameter sets for each station reflected variations in soil properties, topographic conditions, and hydrological responses among sub-watersheds, resulting in a more realistic simulation of the observed temporal variability in flow.
Calibration and validation of the HSPF model were conducted for the 2023–2024 period at Jangheung Dam and for the 2022–2024 period at Gamcheon Bridge (Jangheung-gun). At Jangheung Dam, the simulated flow reasonably reproduced the overall runoff variability and timing of peak discharge, although slight discrepancies were observed for some peak and recession periods. At the Gamcheon Bridge, the model showed satisfactory agreement with the observed flow pattern, particularly in terms of recession behavior and baseflow conditions, while some peak fluctuations were not fully captured. Overall, the HSPF model adequately represented the general flow characteristics and major runoff responses at both stations, indicating its applicability for subsequent hydrological and water quality simulations in the study area (
Figure 7).
To evaluate the model performance, the Nash–Sutcliffe efficiency (NSE) and the coefficient of determination (R
2) were employed. The NSE is a metric that quantifies the agreement between observed and simulated values, where values closer to “1” indicate better model performance and values below “0” suggest that the model performs worse than the mean of the observations. The coefficient of determination (R
2) represents the correlation between the observed and simulated values, with values closer to 1 indicating a stronger linear relationship between the two [
31,
32].
The NSEs at Jangheong Dam and Gamcheon Bridge were 0.67 and 0.68, respectively. Additionally, the R2 values at Jangheong Dam and Gamcheon were 0.70. The NSE and R2 values reflect this tendency, indicating that the model reasonably explains the variability of the observed data. Therefore, the HSPF model developed in this study is considered to have acceptable performance and is suitable for analyzing hydrological characteristics and conducting subsequent hydrological and water quality simulations in the study area.
3.3.2. TOC of Water Quality Calibration and Validation Results
The HSPF water quality model was calibrated and validated for Tamjin5 in Reach 4 for the period 2022–2024, and key water quality parameters were adjusted to reproduce the behavior of TOC, as shown in
Table 4. The main parameters applied in this study include CVBPC, BPCNTC, and REFSET. Through the adjustment of these parameters, the model could more reasonably represent the processes of TOC generation, transformation, settling, and retention in the aquatic system. In particular, CVBPC and BPCNTC directly affected the sensitivity of carbon-based organic matter concentration calculations, thereby contributing to the regulation of overall TOC concentration levels. REFSET improved the representation of long-term concentration persistence and declining trends by accounting for the settling behavior of refractory organic matter. Therefore, the parameter set applied in this study was considered a key calibration factor for reflecting the organic matter dynamics in the Tamjin River Basin.
To strengthen the validation of the TOC module, a temporal split-sample strategy was additionally applied to the available Tamjin5 TOC observations. Because an independent long-term TOC dataset from another station or watershed was not available for the same modeling period, the observed TOC record was divided temporally into a calibration period and an independent validation period. Specifically, the 2022–2023 observations were used for TOC parameter calibration, whereas the 2024 observations were withheld and used only for validation without further parameter adjustment. This split-sample procedure was used to evaluate whether the calibrated TOC parameter set could reproduce independent temporal behavior rather than only matching the full calibration period. Given the relatively sparse monitoring frequency of TOC compared with daily streamflow, the validation focused on long-term concentration level, cumulative bias represented by deviation of volume (DV), seasonal tendency, and residual-based uncertainty, rather than relying only on point-to-point correlation metrics.
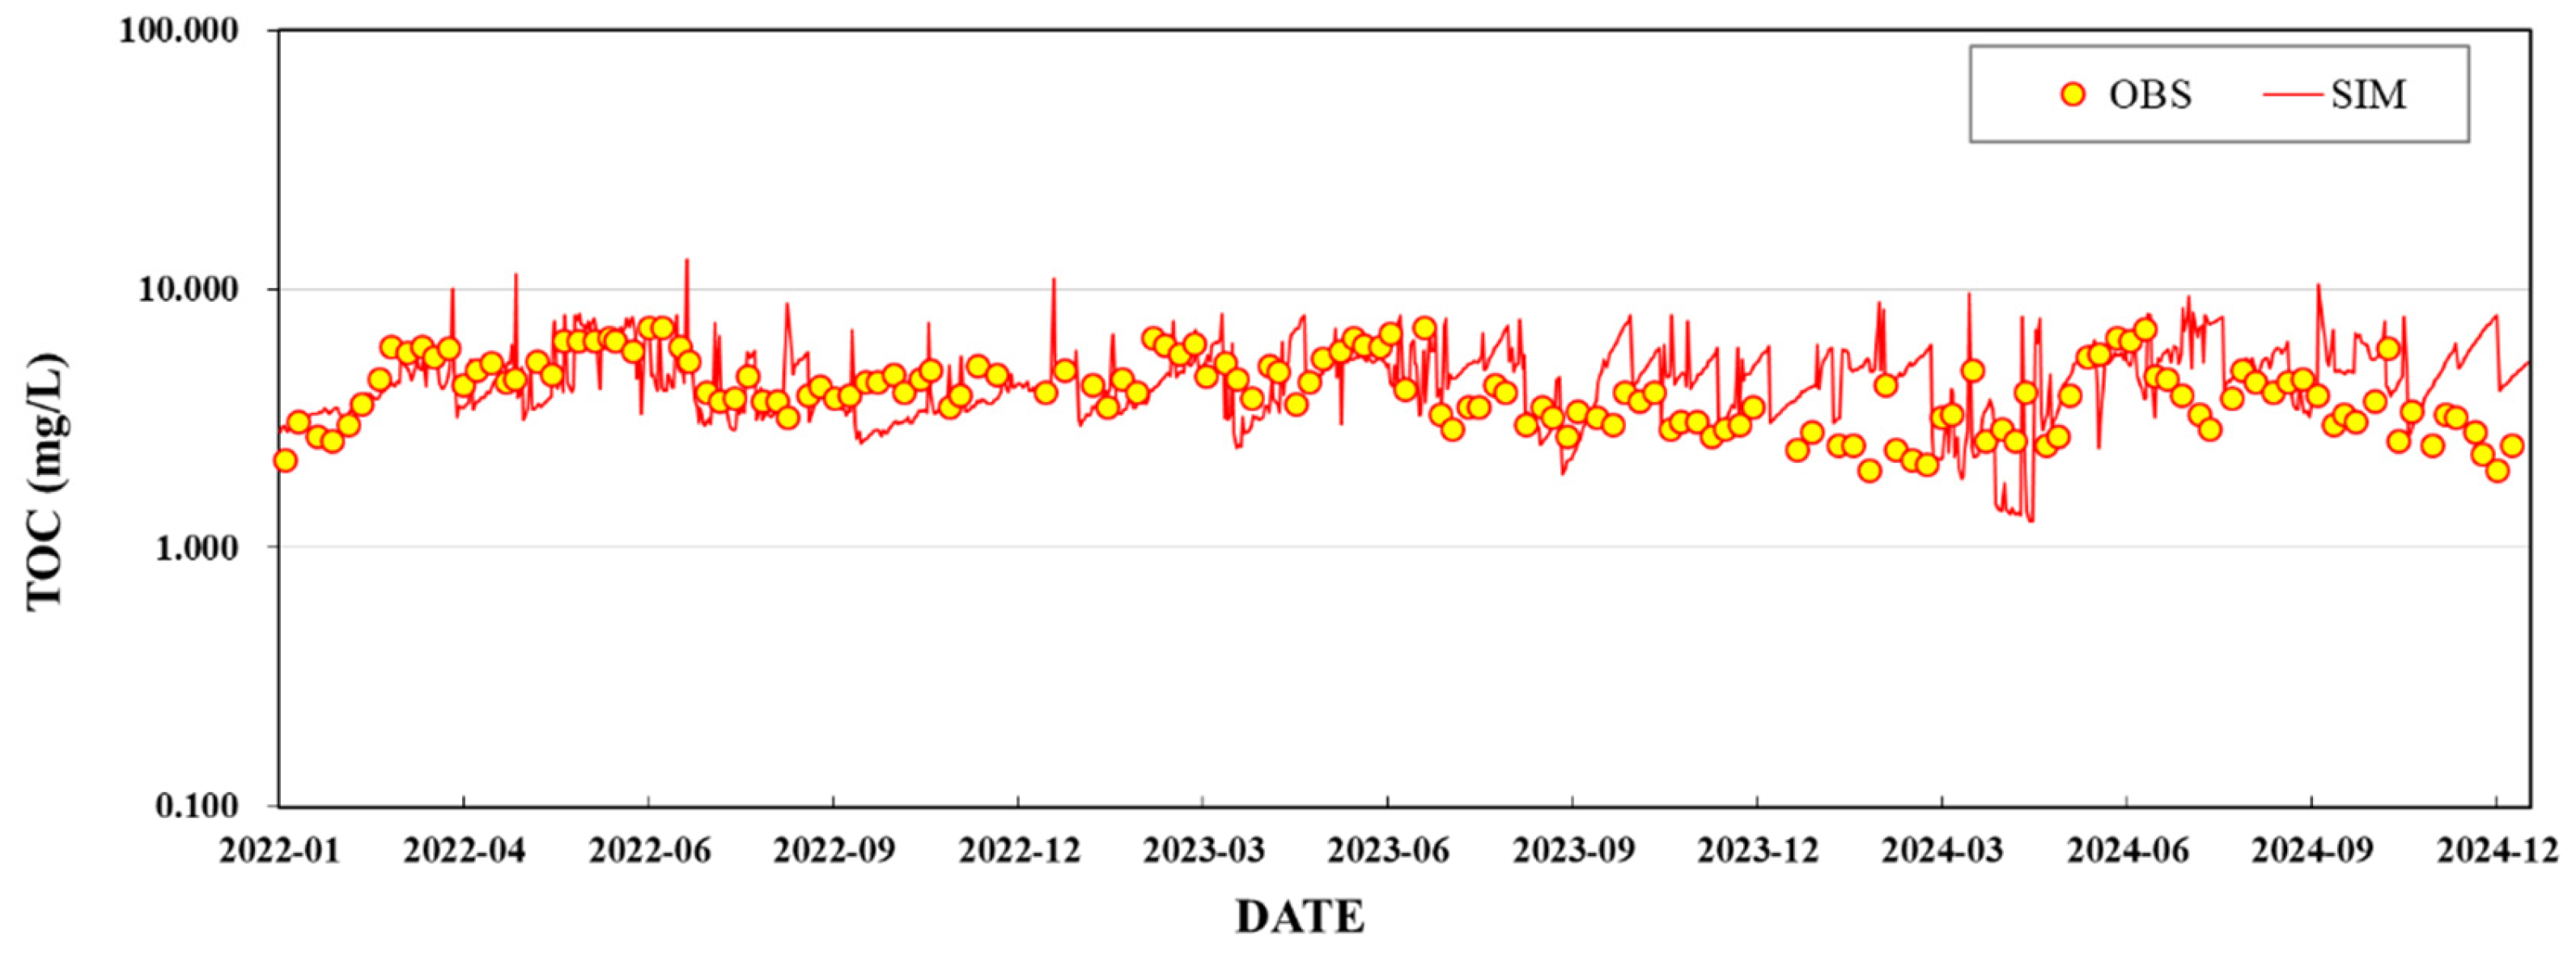
The calibration and validation results for the TOC indicate that the simulated values generally reproduced the temporal variability and concentration levels of the observed data, as shown in
Figure 8. The observed TOC concentrations ranged from approximately 2 to 8 mg/L, and the simulated results followed a similar range while the long-term increasing and decreasing trends were consistently captured. In particular, the seasonal variations and overall time series patterns from 2022 to 2024 were reasonably well represented, indicating that the model adequately reflected the TOC dynamics in the study watershed.
The model performance of the TOC was evaluated using the deviation of volume (DV; %), which expresses the cumulative difference between observed and simulated values as a percentage and is useful for assessing whether the model reproduces the total magnitude of TOC over a given evaluation period. In the split-sample evaluation, the DV for the 2022–2023 calibration period was 7.83%, indicating that the calibrated model reproduced the cumulative TOC magnitude with an acceptable level of bias during the parameter adjustment period. For the independent 2024 validation period, the DV decreased to −13.8%, indicating that the calibrated parameter set also reproduced the withheld validation-year TOC magnitude with only a minor cumulative deviation. From this validation, mean DV during total periods (2022 to 2024) was 0.6%. The results support the applicability of the HSPF TOC module for long-term load-management assessment in the Tamjin River Basin.
The split-sample validation provided an additional check on the temporal transferability of the calibrated TOC parameters. Although no external independent TOC dataset was available, the 2024 observations were not used for parameter calibration and therefore served as an independent temporal validation subset. The comparison of the calibration-period DV (7.83% for 2022–2023) and the validation-period DV (−13.8% for 2024) indicates that the model did not simply fit the calibration period but also maintained cumulative mass-balance performance during the withheld validation year. Nevertheless, short-term point-to-point deviations remained because TOC observations were relatively sparse and because organic carbon dynamics are affected by nonlinear algal production, refractory organic matter, sediment interaction, and event-driven runoff processes. Therefore, the TOC model was considered suitable for evaluating long-term scenario-level load management responses, although it should not be interpreted as a tool for exact short-term TOC concentration forecasting (
Figure 8).
3.3.3. Uncertainty Analysis for Hydrological and Water Quality Simulations
To address the uncertainty associated with both the hydrological and water quality simulations, a residual-based 95% prediction uncertainty analysis was additionally performed using paired observed and simulated values. Because this study used one deterministic HSPF simulation rather than a multi-parameter ensemble, the uncertainty interval was estimated as the simulated value ±1.96 times the standard deviation of the residuals. Therefore, the interval should be interpreted as prediction uncertainty derived from model residuals rather than as a full parameter, input, or structural uncertainty analysis.
To avoid relying only on DV for TOC performance evaluation, model skill was additionally assessed using R2, NSE, RMSE, residual standard deviation, P-factor, and R-factor. The DV used for the split-sample TOC evaluation represents cumulative percent bias in the simulated TOC magnitude and was interpreted as a PBIAS-equivalent indicator for long-term mass-balance performance. Because the available TOC observations were relatively sparse, these metrics were interpreted together rather than using a single statistic as the sole basis for model acceptance.
For streamflow, the P-factor values were 96.4% at Gamcheon Bridge and 96.9% at Jangheung Dam, indicating that most observed values were bracketed by the residual-based 95% prediction intervals. The corresponding R-factor values were 1.85 and 2.20, respectively, showing that the uncertainty bands became relatively wide during high-flow or regulated-flow periods. These results are consistent with the acceptable NSE and R2 values obtained for the hydrological simulations, while also indicating that peak-flow timing and magnitude remain important sources of uncertainty.
For TOC, the P-factor was 94.6%, which is close to the nominal 95% coverage. However, the R-factor was 3.34, and the NSE and R
2 values were acceptable, indicating that the TOC uncertainty band was much wider relative to the observed variability than those of the flow simulations. This larger uncertainty is attributable to sparse water quality observations, nonlinear organic carbon generation and transport, seasonal algal and refractory organic matter effects, and the difficulty of representing short-term TOC fluctuations with a deterministic watershed model. Accordingly, the future TOC scenario results should be interpreted primarily as long-term, scenario-level responses for load management rather than exact short-term concentration predictions (
Table 5).
The split-sample validation and residual-based uncertainty analysis together indicate that the TOC simulation has greater uncertainty than the streamflow simulation. This uncertainty was explicitly considered when interpreting the future scenarios; consequently, the scenario results were used to compare relative changes among no-action and load-reduction conditions, rather than to claim precise daily TOC predictions.
3.4. Future TOC Pollution Under Climate Change and Load-Reduction Scenarios
The effects of pollutant load reduction strategies were evaluated in the future climate scenario by comparing the no-action scenario with the 20% and 30% load reduction scenarios. Analysis was conducted for Reach 4, which corresponds to the calibration and validation points of the Tamjin5 watershed. The results indicate that climate change could substantially increase the risk of organic pollution, whereas proactive load reduction strategies could partially mitigate the deterioration of river water quality. These scenarios therefore represent policy-based watershed management targets derived from domestic statutory planning, rather than arbitrary sensitivity levels, and were used to test whether legally grounded reduction levels could offset climate-driven TOC deterioration [
33,
34,
35].
Under the SSP5-8.5 no-action scenario for the 2040s, the mean streamflow decreased from 6.546 m3/s in the baseline period to 4.382 m3/s, corresponding to a 33.1% reduction. In contrast, the mean TOC concentration increased from 2.534 to 4.479 mg/L, representing a 76.8% increase. The mean BOD and TN concentrations increased by 112.9% and 73.3%, respectively. These results suggest that future climate conditions could reduce the dilution and assimilative capacity of the river, thereby increasing the persistence of organic and nutrient pollution. Similar mechanisms have been reported in previous studies, which have shown that climate-driven changes in streamflow, precipitation regimes, and temperature could alter riverine organic carbon and nutrient dynamics.
The results indicate that the projected TOC increase cannot be explained solely by changes in external pollutant loads. Under the SSP5-8.5 no-action scenario, increases in BOD and TN suggest enhanced watershed-derived pollutant export and reduced dilution capacity, which are primarily related to external load effects. However, the persistence of elevated TOC concentrations even under the 20% and 30% load-reduction scenarios indicates that internal TOC generation and retention processes may also contribute to future TOC deterioration. These internal processes may include algal-derived organic matter production, microbial decomposition of aquatic biomass, sediment-water exchange, resuspension of particulate organic carbon, and the release of refractory dissolved organic matter. Such processes can be intensified under higher temperature, lower streamflow, and longer hydraulic residence time conditions. Therefore, although external load reduction is effective in decreasing TOC concentrations, TOC management under climate change should also consider internal carbon production and in-stream transformation processes.
The load-reduction scenarios showed clear mitigation effects. Under the 20% load reduction scenario, the mean TOC concentration decreased from 4.479 to 3.821 mg/L, corresponding to a 14.7% reduction compared with that in the no-action future scenario. Under the 30% load reduction scenario, the mean TOC concentration further decreased to 3.159 mg/L, corresponding to a 29.5% reduction. In terms of climate impact compensation, the 20% and 30% load reduction scenarios offset approximately 33.8% and 67.9% of the climate-driven increase in TOC, respectively. Therefore, the 30% reduction scenario was more effective at maintaining future TOC concentrations close to the baseline water quality level (
Table 6).
To test whether the simulated scenario differences were statistically supported, paired Wilcoxon signed-rank tests were applied to the paired daily TOC series for Reach 4. The increase from the baseline period to the SSP5-8.5 no-action scenario was statistically significant (p < 0.001), and the decreases from the no-action scenario to the 20% and 30% load-reduction scenarios were also statistically significant (p < 0.001). These results indicate that the projected TOC deterioration and the load-reduction effects were not limited to differences in annual mean values, but were consistently reflected across the daily TOC distribution.
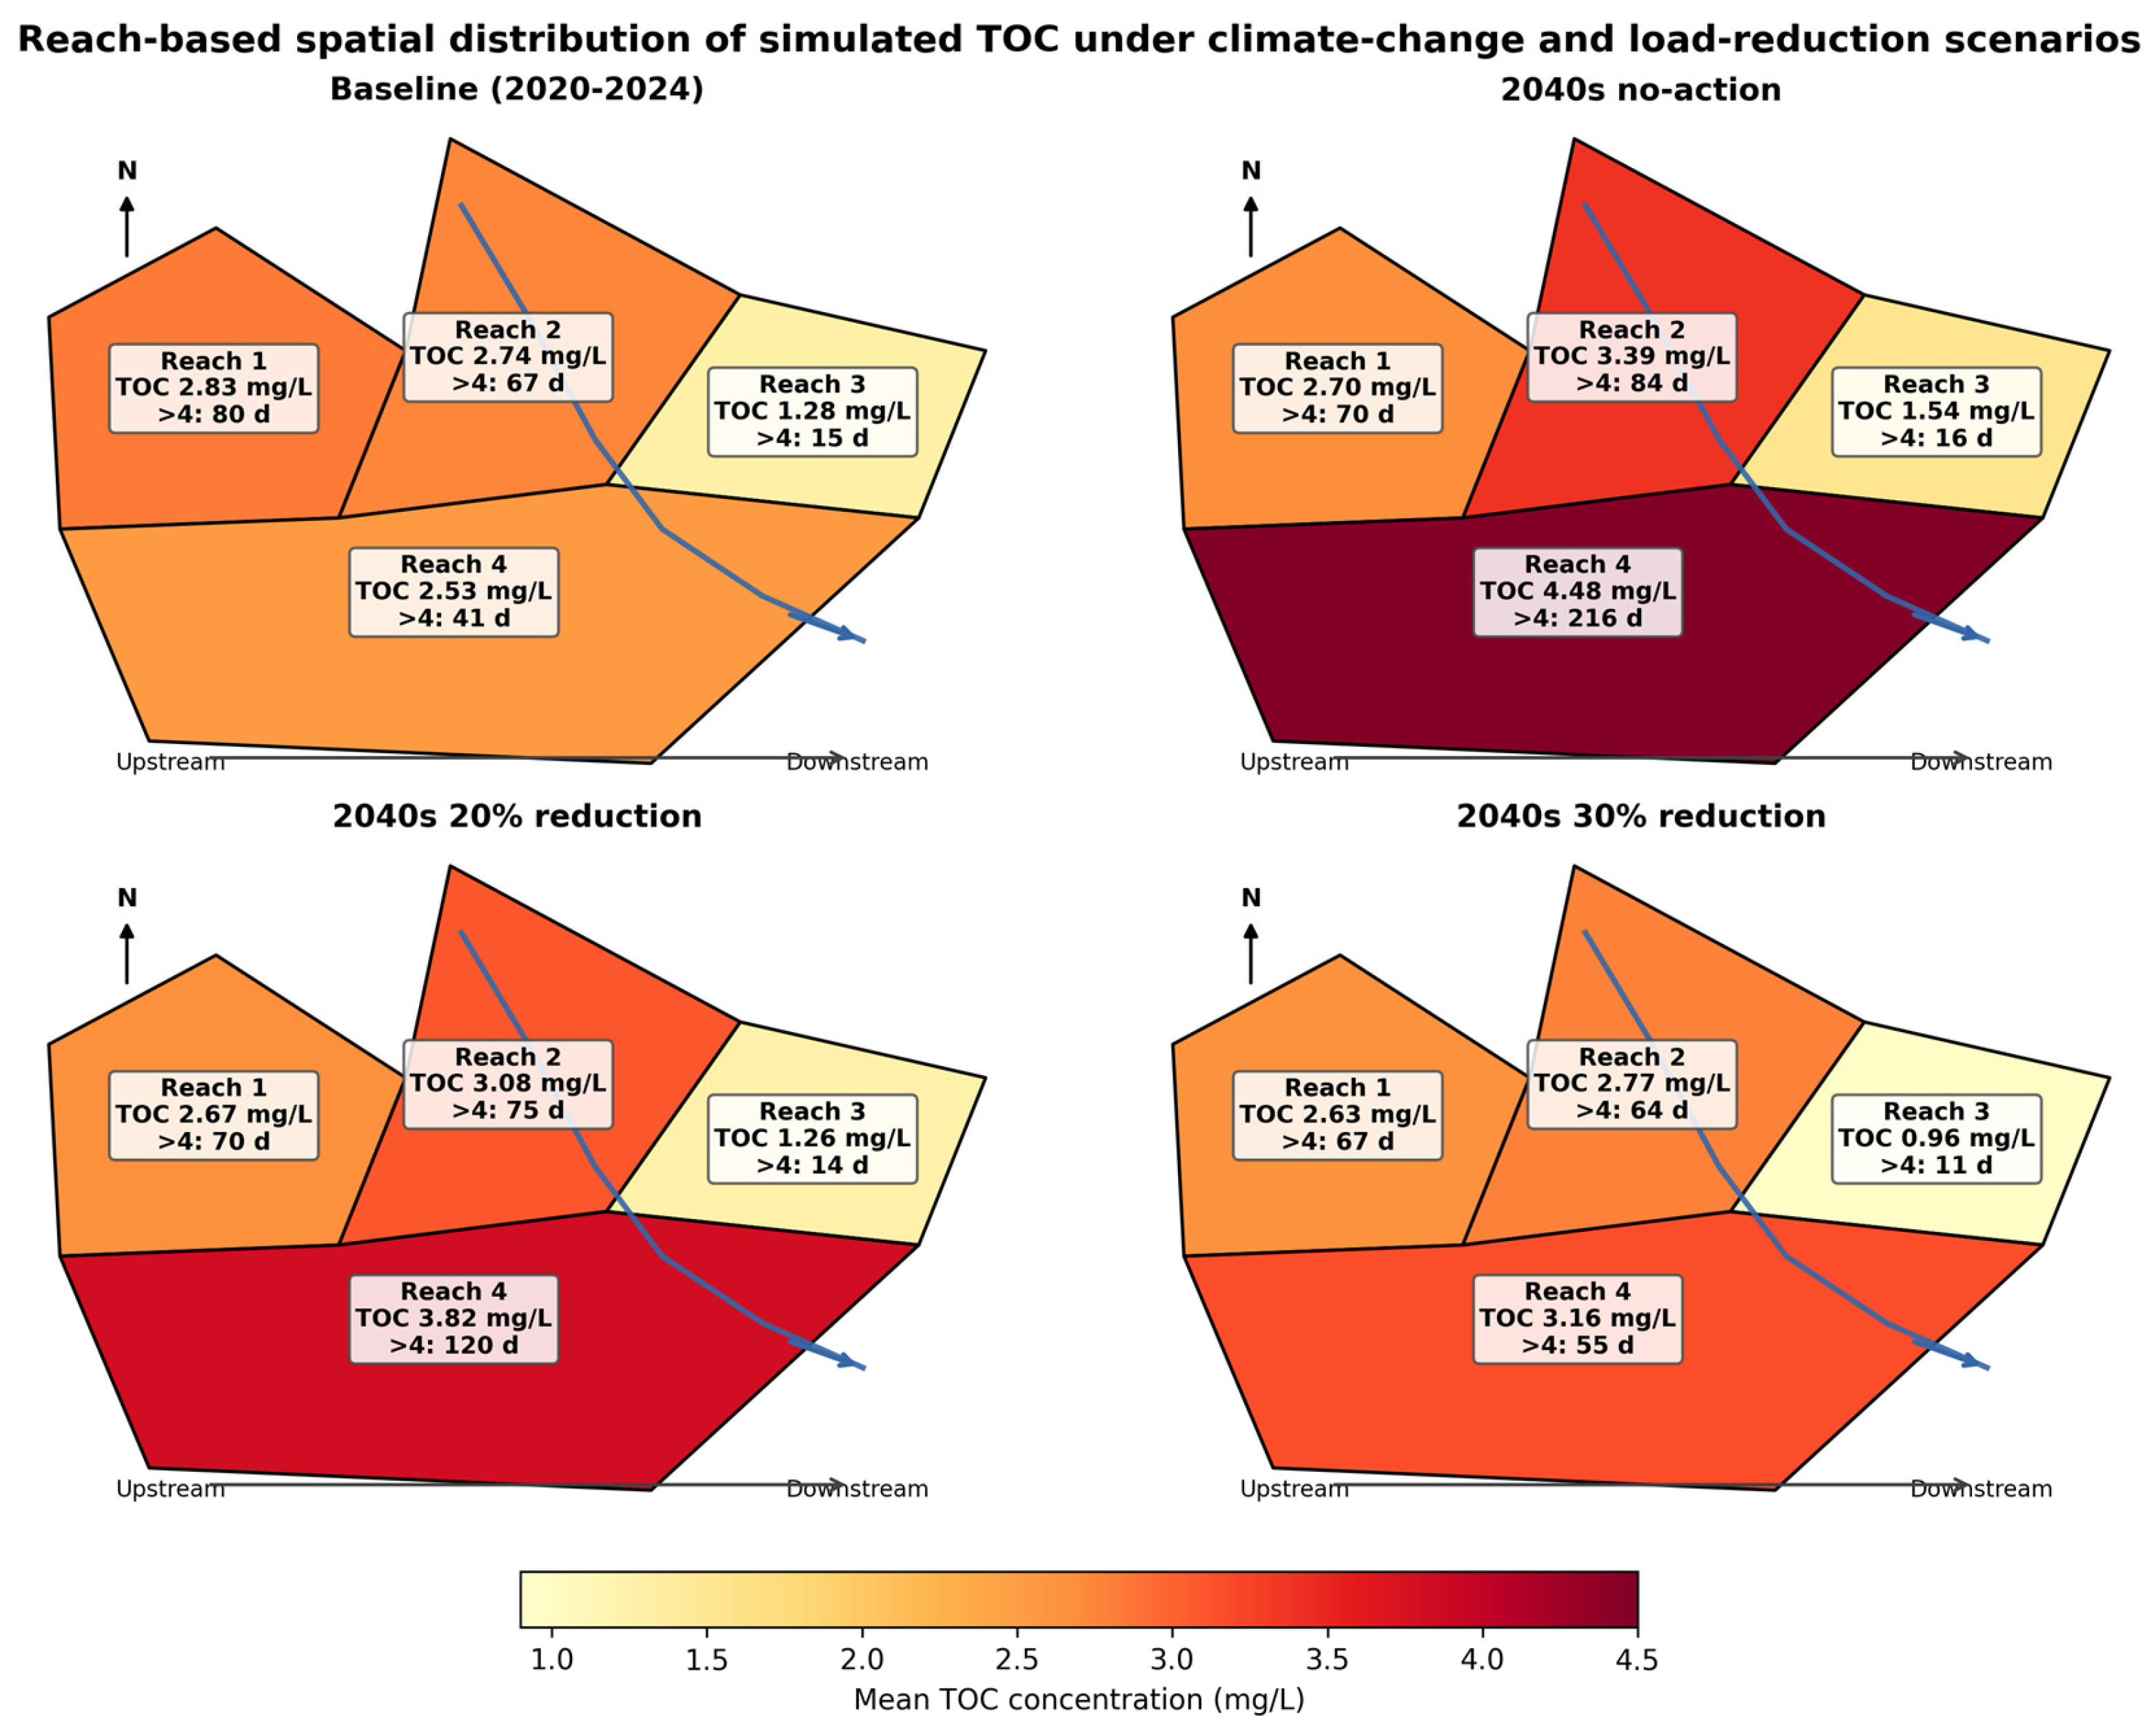
To improve the spatial representation of the sub-watershed results, the daily HSPF outputs for Reach 1-Reach 4 were linked to the modeled reach polygons and visualized as reach-based GIS distribution maps (
Figure 9). The spatial distribution shows that the downstream Reach 4 had the highest climate-driven deterioration: the mean TOC concentration increased from 2.534 mg/L in the baseline period to 4.479 mg/L under the 2040s no-action scenario, and the number of days exceeding 4 mg/L increased from 41 to 216 days yr
−1. Reach 2 also showed a clear increase from 2.744 to 3.388 mg/L, whereas Reach 3 remained relatively low despite a 20.0% increase. The 30% load-reduction scenario reduced the mean TOC concentration in Reach 4 to 3.159 mg/L and the >4 mg/L exceedance frequency to 55 days yr
−1, demonstrating that reach-specific load management is particularly important in downstream and midstream reaches where hydrological retention and cumulative pollutant delivery are more pronounced.
These maps indicate that basin-average statistics alone can obscure spatially concentrated TOC risk. Therefore, future TOC total load management in the Tamjin River Basin should prioritize Reach 4 and Reach 2, where the combined effects of cumulative upstream delivery, reduced dilution capacity, and in-stream retention produced the highest future TOC concentrations and exceedance frequencies.
4. Discussion
The exceedance thresholds of 4, 5, and 6 mg/L were selected based on the Korean river water-quality standards for the living environment, where these TOC values correspond to the upper limits of Class II (slightly good), Class III (fair), and Class IV (slightly poor), respectively, under the Enforcement Decree of the Framework Act on Environmental Policy. Therefore, the exceedance frequency represents the number of days crossing key regulatory and ecological water-quality class boundaries rather than arbitrary concentration cutoffs. The exceedance frequency analysis further emphasizes the effectiveness of pollutant load reduction. Under the SSP5-8.5 no-action scenario for the 2040s, the number of days exceeding 4 mg/L TOC increased to 216 days yr
−1, compared with 41 days yr
−1 during the baseline period. However, this frequency decreased to 120 days yr
−1 under the 20% reduction scenario and to 55 days yr
−1 under the 30% reduction scenario. Similarly, the number of days exceeding 5 mg/L TOC decreased from 101 days yr
−1 under the no-action scenario to 39 and 27 days yr
−1 under the 20% and 30% reduction scenarios, respectively. These results indicate that load reduction strategies are effective in reducing not only the annual mean TOC concentration but also the frequency of high-TOC events. These threshold-based results are summarized in
Table 7.
The integrated results also clarify the methodological novelty and management relevance of the proposed framework. Previous applications of HSPF have often emphasized current hydrological or conventional water quality responses and BMP-based pollutant-load reduction [
36,
37], whereas climate bias-correction studies have frequently ended at corrected meteorological or streamflow projections [
23]. Similarly, previous TOC modeling has demonstrated rainfall- and temperature-driven TOC load dynamics at the watershed scale [
25], but it has rarely been connected to bias-corrected future climate forcing and practical TOC total load reduction scenarios. In contrast, the present study connects QDM-corrected SSP5-8.5 climate forcing to HSPF-based TOC simulation and then converts the simulated outputs into management-oriented indicators, including delivered load, delivery ratio, water quality class deterioration, high-TOC exceedance frequency, and load-reduction effectiveness. This linkage enables the effect of climate-driven hydrological change to be interpreted directly in terms of TOC total load control rather than only as a change in flow or concentration (
Table 7).
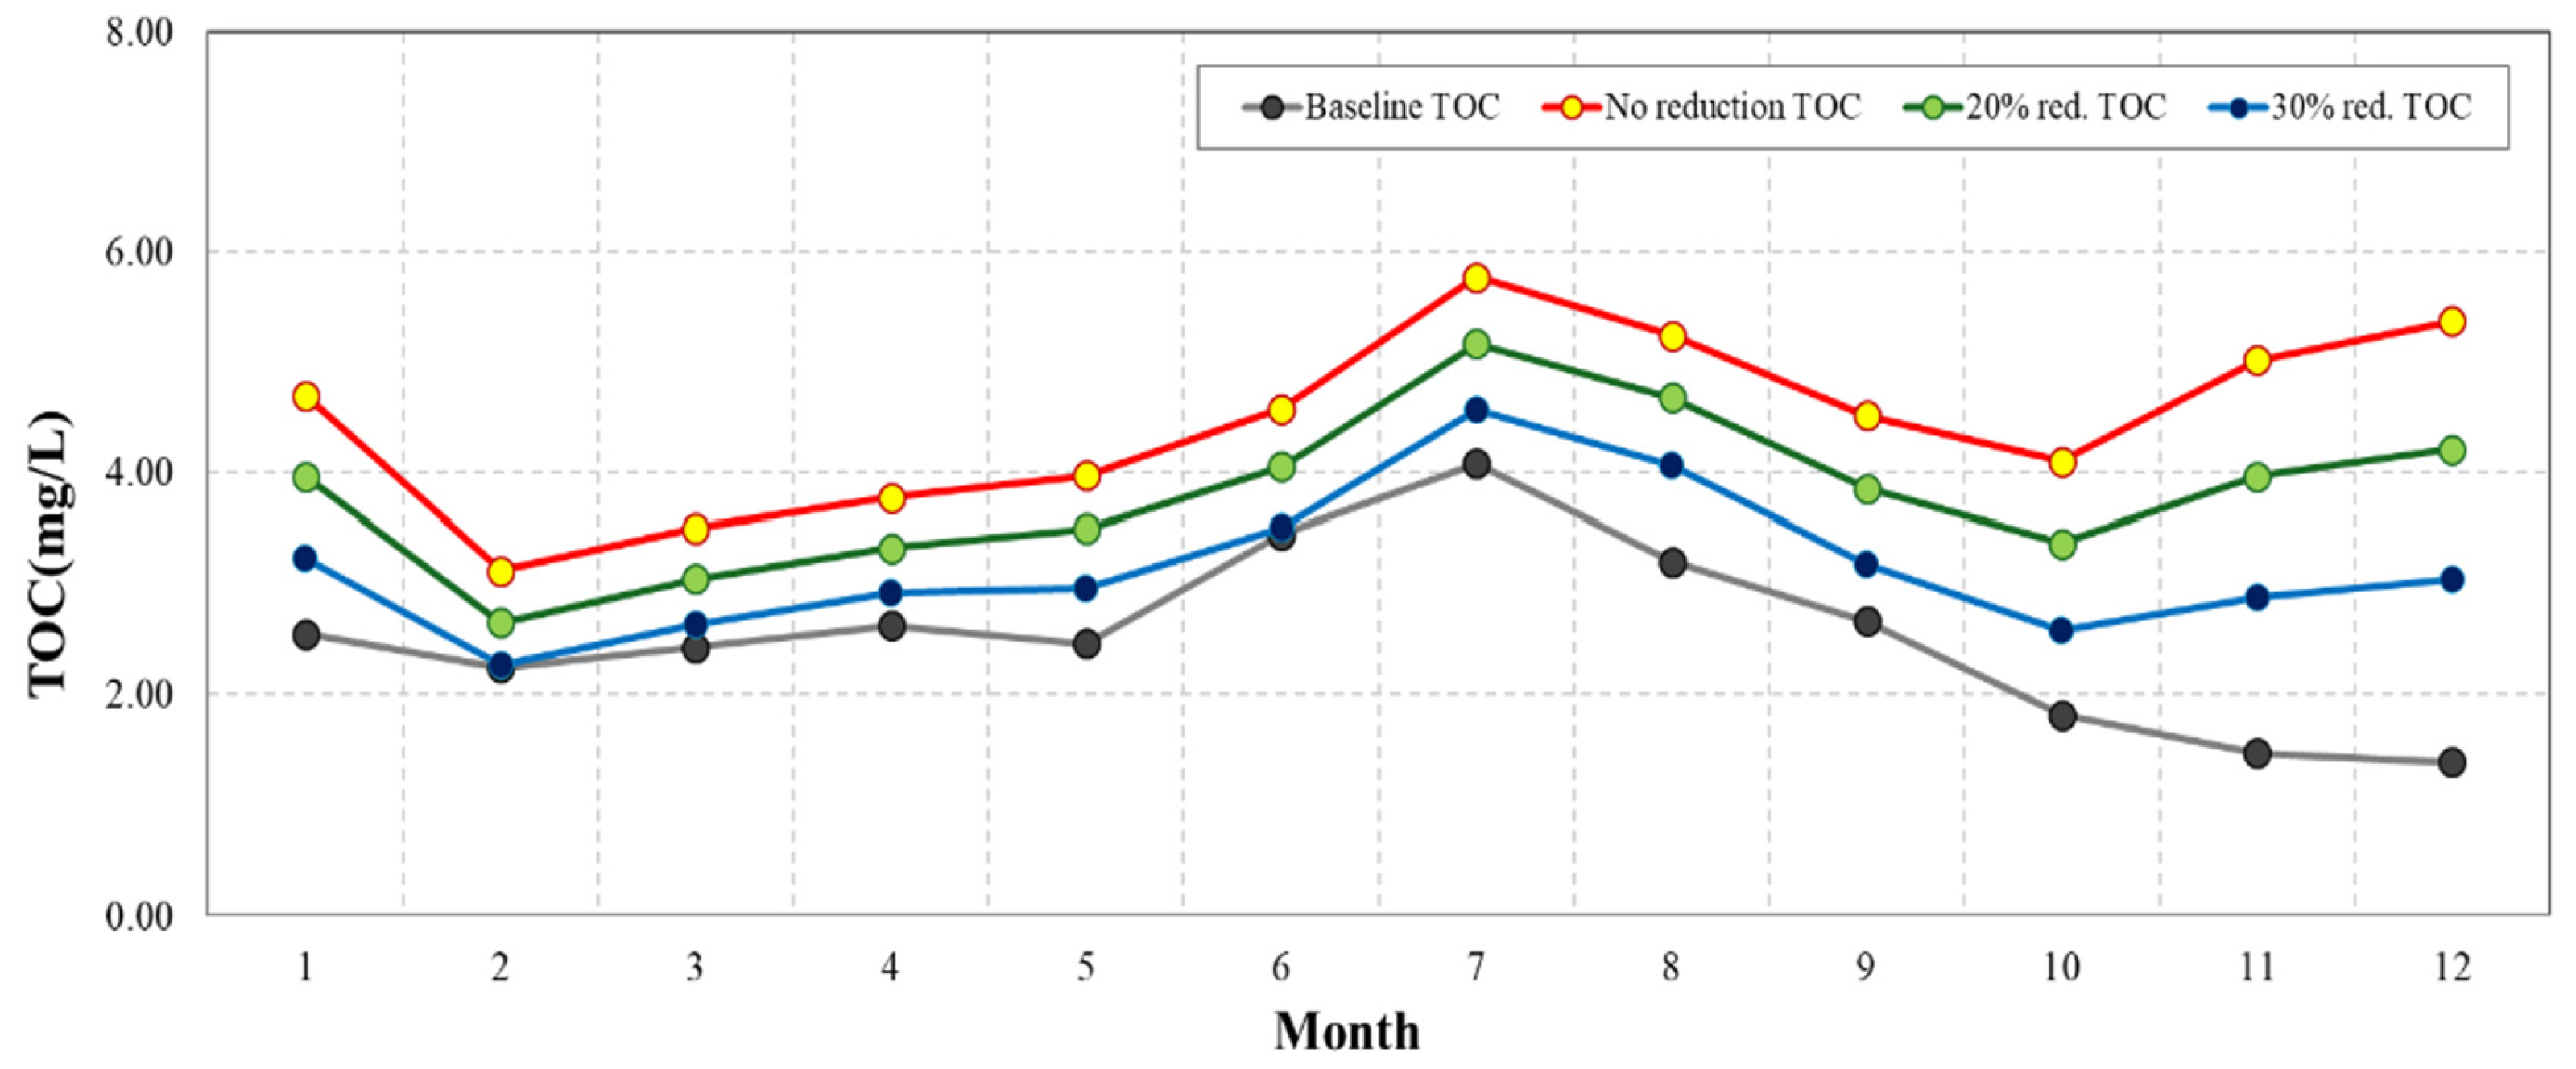
The seasonal results indicate that the effects of climate change and load reduction vary by season. In the no-action scenario, the summer TOC concentration increased to 5.203 mg/L, while the autumn and winter TOC concentrations increased markedly to 4.541 and 4.425 mg/L, respectively. These results suggest that future TOC pollution risk may not be limited to the summer monsoon season but may also extend to low-flow and transitional seasons. The 30% reduction scenario reduced the autumn TOC concentration from 4.541 to 2.875 mg/L and the winter TOC concentration from 4.425 to 2.864 mg/L, indicating that reducing the pollutant load could be particularly effective in improving organic water quality during low-flow periods (
Figure 10).
The seasonal variability in TOC can be explained by the interaction of monsoon-driven external organic matter delivery, temperature-dependent biological activity, and low-flow retention processes. During summer, concentrated rainfall can increase surface runoff, soil erosion, agricultural wash-off, and the transport of forest- and riparian-derived dissolved organic matter, while higher water temperature can simultaneously enhance algal production, microbial decomposition, and in-stream organic carbon transformation. Therefore, the summer TOC increase reflects not only a direct concentration response but also the combined effect of external organic matter pulses and accelerated internal carbon cycling under warm and wet conditions [
4,
5,
10,
16]. By contrast, the elevated TOC concentrations in autumn and winter, despite lower rainfall, suggest the importance of reduced dilution, longer hydraulic residence time, weaker flushing, sediment-water interaction, and the persistence of refractory dissolved organic matter during low-flow periods. This interpretation is consistent with previous observations in the Tamjin River system, where seasonal pollutant-load changes and basin-specific source characteristics were reported, and with studies showing that climate-induced changes in runoff pathways and dry-period duration can alter dissolved organic matter concentration and treatability [
24]. Thus, the monthly TOC pattern should be interpreted as a process-based seasonal response rather than a simple descriptive trend: summer peaks are mainly associated with runoff-driven external inputs and biological production, whereas autumn and winter risks are linked to low-flow concentration, internal retention, and refractory organic matter persistence.
On the basis of the Korean TOC-based river water quality classification, the baseline mean TOC concentration corresponds to class Ib, whereas the no-action future scenario deteriorates to class III. The 20% and 30% load reduction scenarios increase the mean TOC level to class II, indicating that reducing the pollutant load can prevent severe degradation of the river’s organic pollution status under climate change. TOC-based water quality management has been emphasized in Korean river management studies because compared with conventional oxygen demand indicators alone, TOC can represent organic matter pollution more comprehensively.
In addition to the deterioration of river water quality classes, the projected increase in TOC may have implications for downstream water treatment. TOC represents a broad pool of natural and anthropogenic organic matter, including refractory compounds, algal-derived organic matter, and watershed-derived dissolved organic matter. These organic carbon fractions can affect coagulation, oxidation, filtration, and disinfection processes. However, treatment cost, chlorine demand, disinfection-byproduct concentrations, and health risks were not directly evaluated in this study. Therefore, these treatment-related implications should be interpreted as potential management considerations rather than direct outcomes of the present modeling analysis.
This issue is particularly relevant under future climate conditions because climate change can alter both the concentration and the characteristics of dissolved organic matter through increased temperature, modified runoff pathways, longer dry periods, and more intense rainfall events [
15,
27]. Elevated TOC or dissolved organic matter can react with chlorine and other disinfectants during drinking water treatment, leading to the formation potential of disinfection byproducts such as trihalomethanes and haloacetic acids [
11,
12,
38,
39,
40]. Thus, maintaining lower TOC concentrations may contribute to reducing potential downstream treatment challenges. However, the magnitude of these effects depends on the composition and treatability of the organic matter and was not directly quantified in this study.
Overall, the results demonstrate that the Tamjin River watershed is vulnerable to future TOC pollution under the SSP5-8.5 climate scenario, mainly because of reduced streamflow and increased organic and nutrient concentrations. However, the 20% and 30% load reduction scenarios substantially alleviate this impact. Among these scenarios, the 30% reduction scenario shows a more robust adaptation effect because it reduces the mean TOC concentration, decreases the frequency of high-concentration events, and maintains the seasonal TOC concentration at values close to the baseline condition. Therefore, future climate adaptation strategies for the Tamjin River should include TOC-based pollutant load reduction targets, strengthened watershed-scale organic matter management, water quality protection during low-flow periods, and additional nutrient-specific measures.
5. Conclusions
In this study, an integrated HSPF-QDM-TOC load management framework was developed to assess future TOC pollution and load-reduction effects in the climate-vulnerable Tamjin River Basin. The main novelty of this approach is that QDM bias correction was not used only as a climate-data preprocessing step, and HSPF was not used only as a stand-alone watershed model; instead, the two methods were linked to TOC-specific discharge-load, delivered-load, delivery-ratio, exceedance-frequency, and load-reduction indicators. This framework provided an integrated basis for evaluating how future hydrological changes could influence organic carbon dynamics and practical river water quality management.
The results indicate that future climate change may substantially increase the risk of TOC pollution in the Tamjin River Basin. Under the SSP5-8.5 no-action scenario for the 2040s, reduced streamflow and weakened dilution capacity lead to a marked increase in the mean TOC concentration and the high-TOC exceedance frequency. These findings suggest that TOC deterioration under climate change is not simply a pollutant load issue but is closely linked to changes in hydrological conditions, retention time, and in-stream organic matter processes. The load reduction scenarios demonstrate that proactive watershed management can effectively mitigate future TOC deterioration. In particular, the 30% load-reduction scenario shows a stronger adaptation effect because it reduces the mean TOC concentration, decreases the number of high-concentration events, and improves water quality during low-flow seasons. These findings indicate that climate-resilient TOC management should prioritize basin-scale organic matter reduction, low-flow season protection, and integration with nutrient and wastewater management strategies.
Accordingly, future TOC management in the Tamjin River should combine external load-control measures, such as agricultural runoff, livestock wastewater, and domestic wastewater management, with measures that reduce internal TOC persistence, including algal-growth control, sediment and riparian-zone management, and low-flow water quality protection. This dual approach is particularly necessary because conventional BOD or nutrient-load reductions may not fully remove refractory or internally generated organic carbon.
Because SSP5-8.5 was intentionally applied as a conservative stress-test pathway, the projected TOC responses should be interpreted as upper-bound management requirements rather than as a probabilistic forecast across all SSPs. Future work should apply the same HSPF-QDM-TOC framework to low-, intermediate-, and high-emission SSPs to quantify scenario uncertainty and to compare adaptive load-reduction targets under different mitigation pathways.
The validation approach was improved by applying a split-sample evaluation in which 2022–2023 was used for calibration and 2024 was used as an independent temporal validation period. The calibration-period DV was 7.83%, and the withheld 2024 validation-period DV was 0.6%, supporting the use of the calibrated TOC model for long-term load-management scenario assessment. However, the lack of an additional independent long-term TOC monitoring dataset remains a limitation. Future studies should incorporate independent monitoring stations, higher-frequency TOC observations, or cross-basin validation to further test the transferability of the HSPF TOC parameterization.
Elevated TOC concentrations may also have implications for downstream water treatment because organic matter can affect coagulation, oxidation, filtration, and disinfection processes. Previous studies have reported relationships between source-water organic matter, chemical demand, and disinfection-byproduct formation potential. However, treatment costs, chlorine demand, disinfection-byproduct concentrations, and health risks were not directly evaluated in this study. Therefore, the treatment-related implications discussed here should be regarded as potential management considerations rather than direct outcomes of the present modeling analysis.
Overall, this study indicates that conventional BOD-based water-quality management may be strengthened by incorporating TOC as a complementary indicator, particularly under climate conditions associated with reduced streamflow and increased organic-matter persistence. By translating QDM-corrected climate signals and HSPF-simulated hydrological and water quality responses into TOC load-management indicators, the proposed approach can support the establishment of climate-adaptive TOC reduction targets and provide a scientific basis for long-term water quality management in the Tamjin River Basin and other climate-sensitive watersheds.