Article

Uncovering the Drivers of Greenhouse Gas Emissions from Hydropower Reservoirs in China Based on Machine Learning

1
Sichuan Provincial Ecological Environment Monitoring Centre, Chengdu 610091, China
2
College of Environmental Sciences, Sichuan Agricultural University-Chengdu Campus, Chengdu 611130, China
*
Author to whom correspondence should be addressed.
Water 2026, 18(13), 1610; https://doi.org/10.3390/w18131610
Submission received: 12 May 2026 / Revised: 17 June 2026 / Accepted: 29 June 2026 / Published: 2 July 2026
(This article belongs to the Section Water and Climate Change)

Abstract

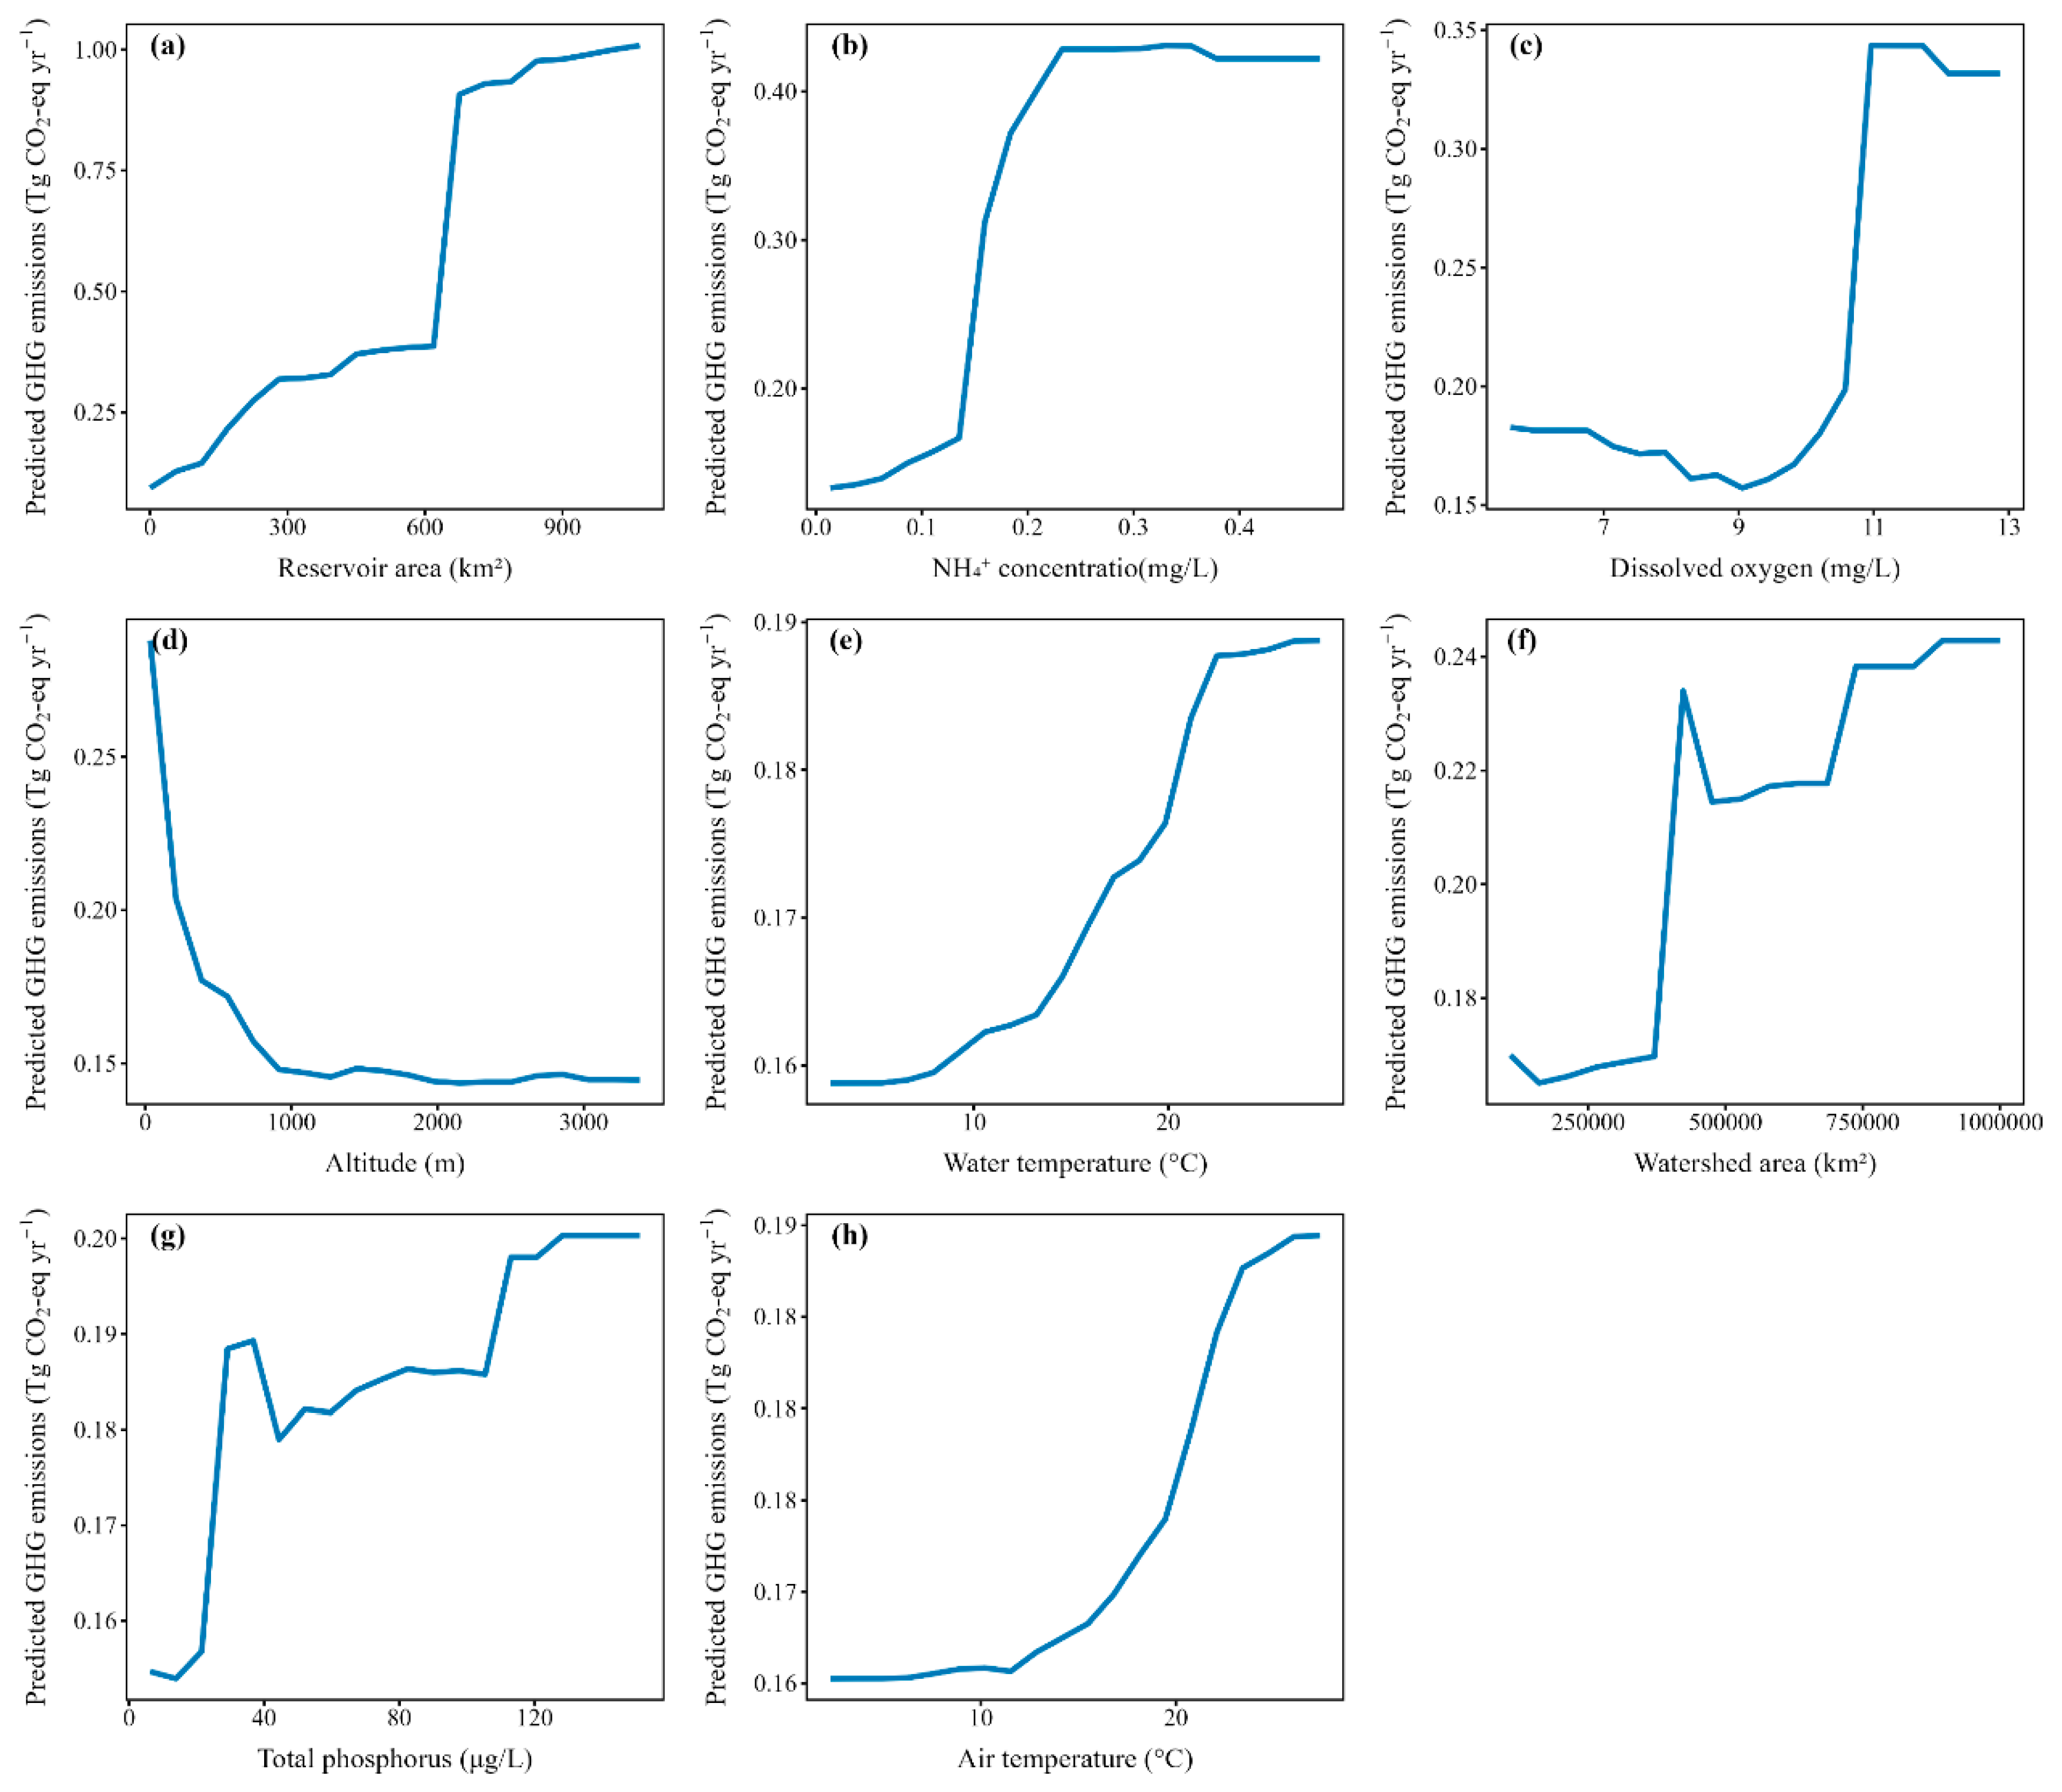
China is expanding hydropower capacity as a key climate change mitigation strategy, yet greenhouse gas (GHG) emissions from reservoirs can substantially offset this benefit. The influence of specific environmental drivers on these emissions remains poorly understood, and previous studies have rarely quantified their relative importance under multifactorial conditions. To fill this gap, this study quantifies CO2, CH4, and N2O emissions from 79 major hydroelectric reservoirs across China—representing over 60% of national hydropower generation—by integrating the G-res model and the IMAGE-DGNM model. We then employ a random forest (RF) model to evaluate the significance and marginal effects of 15 environmental drivers. Results show that reservoir-specific properties collectively explain 40.37% of the variance in total GHG emissions, and reservoir area emerges as the overwhelmingly dominant driver (MDI importance score = 1.41), far exceeding other key variables such as NH4+ concentration, dissolved oxygen, altitude, water temperature, catchment area, total phosphorus, and air temperature (all with MDI importance > 0.5). Partial dependence analysis further reveals that emissions rise sharply with expanding reservoir area, NH4+ concentrations above 0.15–0.2 mg/L, and catchment areas in the 360,000–680,000 km2 range, while elevated dissolved oxygen (6–9 mg/L) and higher altitude suppress emissions. This study moves beyond simple emission inventories by providing a national-scale, data-driven attribution of reservoir GHG emissions to interacting environmental factors, thereby offering actionable insights for sustainable hydropower planning.

1. Introduction

Hydropower is widely promoted as a climate-friendly energy source [1], yet greenhouse gas (GHG) emissions from its reservoirs can substantially offset its mitigation benefits. China, which possesses roughly 15% of the global technical hydropower potential [2] and is aggressively expanding capacity to meet carbon neutrality goals, epitomizes this tension. By comparison, Brazil generates over 60% of its electricity from hydropower and faces similarly intense debate over reservoir GHG balances [3], highlighting that the tension between hydropower expansion and emission mitigation is a global concern. At the global scale, reservoirs emit an estimated 328 Tg CO2, 22 Tg CH4, and 24.51 Gg N2O annually [4,5], contributing roughly 1.3% of anthropogenic CO2-equivalent emissions—a magnitude comparable to biomass burning or rice cultivation [6]. This substantial contribution makes it imperative to accurately quantify reservoir emissions and, more importantly, to unravel their drivers so as to design effective mitigation strategies.
Quantification has traditionally relied on either direct measurement techniques (e.g., floating chambers, thin boundary layer models, gas chromatography) [7,8,9,10] or model-based approaches. While field measurements often miss ebullitive fluxes and emissions from deeper waters [11], models are better suited for large-scale systematic assessments [12,13]. and have been increasingly applied at national and global scales [14]. In parallel, several recent studies have explored machine learning approaches for predicting GHG emissions from inland waters and reservoirs. For instance, support vector machines and artificial neural networks have been applied to estimate CO2 and CH4 fluxes from global reservoirs [15], while gradient boosting algorithms (e.g., XGBoost) have been employed to model reservoir CH4 emissions as a function of morphometric and climatic variables [16]. However, these studies have primarily focused on prediction accuracy rather than on systematically decomposing the relative importance of interacting environmental drivers across multiple GHGs. What remains critically lacking, however, is a mechanistic understanding of the spatiotemporal heterogeneity of these emissions.
Several studies have attempted to quantify GHG emissions from reservoirs at regional, national, or global scales. Global assessments based on the G-res framework and related modeling approaches have provided estimates of reservoir CH4, CO2, and N2O emissions and highlighted the importance of climatic conditions, reservoir age, and watershed characteristics in regulating emissions [14,17,18]. In China, previous studies [13,19] have primarily focused on individual reservoirs, specific river basins, or single gases, while national-scale assessments have largely emphasized emission inventories rather than systematic attribution of the environmental controls governing emission variability. Although these studies substantially improved estimates of reservoir GHG budgets, they generally relied on statistical relationships or sensitivity analyses and rarely evaluated the relative importance of multiple interacting drivers across a large number of hydroelectric reservoirs. Consequently, the mechanisms underlying spatial variations in emissions among Chinese reservoirs remain insufficiently understood.
These emissions exhibit pronounced spatiotemporal heterogeneity due to complex interactions among multiple physical and biogeochemical drivers, including depth, water temperature, water level fluctuations, dissolved oxygen, pH, and organic matter loading [20,21,22,23]. Temperature, in particular, can exert both synergistic and antagonistic effects: higher temperatures simultaneously accelerate microbial methanogenesis and enhance primary productivity, which can increase oxygen supply and partially offset CH4 production through aerobic oxidation; the net emission outcome thus depends on the balance between these opposing processes [24]. Current assessments largely depend on correlative analyses between individual environmental factors and observed fluxes, which cannot capture the nonlinear, synergistic, or antagonistic interactions among drivers—such as temperature, substrate supply, redox conditions, and microbial activity—nor can they robustly quantify the relative importance of these interacting factors. This gap is particularly pronounced for hydroelectric reservoirs in China, where a comprehensive, multi-gas quantification combined with a rigorous attribution of emissions to key environmental drivers is still missing, hindering both reliable projections under future climate and land-use scenarios and the design of targeted mitigation measures.
To fill this gap, this study aims to (1) provide a comprehensive quantification of CH4, CO2, and N2O emissions from China’s hydroelectric reservoirs in 2020 using the G-res model and the Integrated Model to Assess the Global Environment–Dynamic Global Nutrient Model (IMAGE-DGNM), and (2) employ a random forest machine learning approach to rigorously assess the significance and relative contribution of key drivers of reservoir GHG emissions, complemented by partial dependence plots to reveal the marginal effects of individual factors. Unlike previous machine learning applications that prioritize predictive performance, this study focuses on interpretable attribution—quantifying both the relative importance and the marginal effects of 15 environmental drivers spanning reservoir properties, climate, soil, and water quality—to move beyond simple correlations toward a mechanistic understanding. To our knowledge, this combination of a nationally comprehensive multi-gas inventory with a machine-learning-based driver attribution is novel for Chinese hydroelectric reservoirs. Finally, implications for GHG emission mitigation are drawn.

2. Methods

2.1. Study Reservoirs

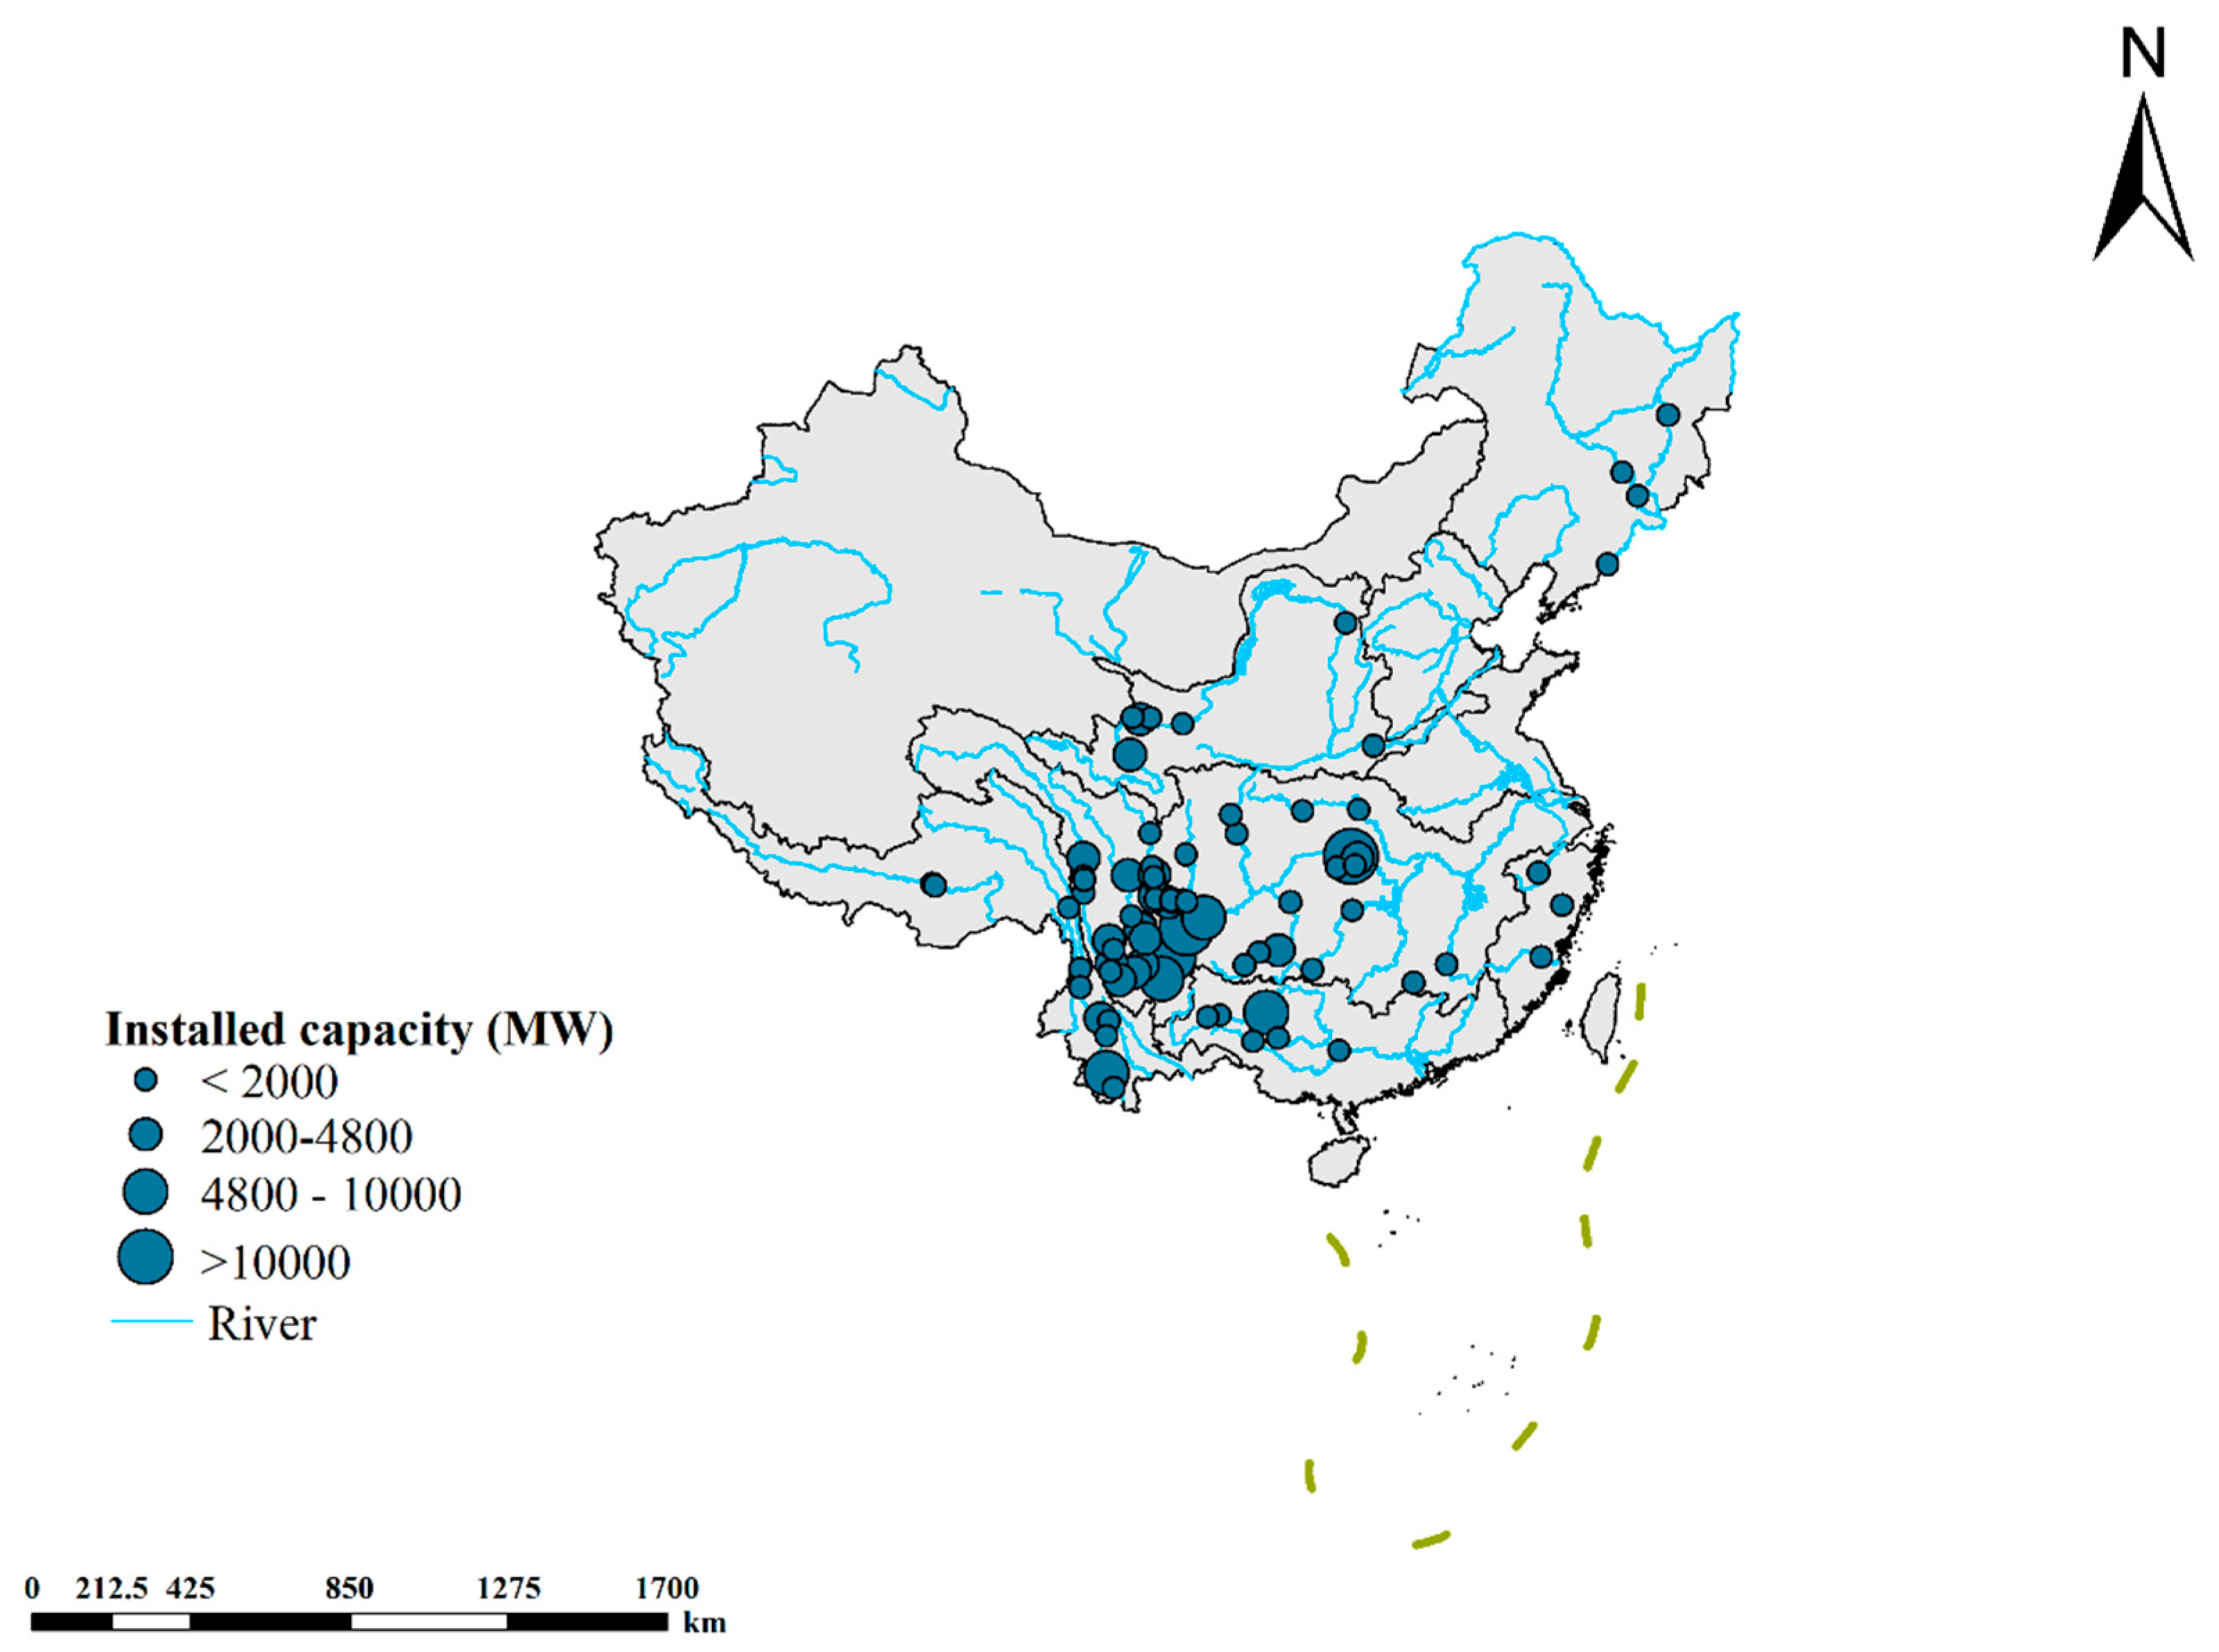
We compiled a national inventory of hydropower stations from the China Electric Power Yearbook or relevant databases and selected reservoirs based on three criteria. First, we retained stations with an installed capacity greater than 500 MW, because large reservoirs contribute disproportionately to GHG emissions and are the dominant component of national hydropower output. Second, we required the availability of key reservoir parameters—including reservoir area, storage capacity, mean depth, geographic coordinates, and annual power generation—needed as inputs for the G-res and IMAGE-DGNM models. Third, we ensured representation across the major river basins of China to capture a wide range of climatic, topographic, and hydrological conditions. After applying these criteria, 79 reservoirs were retained (Figure 1). These 79 reservoirs account for more than 60% of national hydropower generation and over 52% of the total installed capacity [25], confirming that the sample is broadly representative of China’s large hydropower sector. Among them, 42 are located in low-altitude areas (<1000 m) and 37 in high-altitude areas, further covering a substantial environmental gradient.

2.2. Data Source

The list of hydropower stations and their basic attributes were obtained from Zhang et al. [26], and the parameters required for GHG calculations using the G-res and IMAGE-DGNM models are summarized in Table 1 along with their respective sources. As shown in Table 1, nearly all data used to evaluate 2020 emissions correspond to the year 2020, with the exception of NO3 concentrations; because measured NO3 data for the exact study year were not available for all reservoirs, we used values from the literature for the year closest to 2020, following Chen et al. [13]. Key reservoir geometric and operational parameters—including area, capacity, depth, and power generation—were obtained from nationally consistent databases (e.g., the National Energy Administration dam database), ensuring internal consistency across the 79 selected reservoirs. Meteorological variables were sourced from the high-resolution National Tibetan Plateau Data Center product, which has been extensively validated across China, while water quality parameters (temperature, dissolved oxygen, NH4+, total phosphorus, and organic nitrogen) were derived from the China National Environmental Monitoring Centre’s routine monitoring network, thus capturing representative conditions for large reservoirs. Soil carbon content and global radiation data were taken from established global gridded datasets (ISRIC World Soil Information and GISRS, respectively); these introduce some inherent spatial uncertainty but represent the best available data for a national-scale assessment. The NO3 concentrations, although not strictly from 2020 for every reservoir, were drawn from a consistent set of peer-reviewed studies [27,28,29,30,31,32,33,34] and reflect typical interannual variability in Chinese reservoirs. Overall, the assembled multi-source dataset is designed to comprehensively capture the primary physical and biogeochemical drivers of GHG emissions while maintaining transparency regarding its limitations.

2.3. Evaluating GHG from Reservoirs Based on G-Res and IMAGE-DGNM Model

The G-res model, recommended by the IPCC, quantifies CO2 and CH4 emissions from reservoirs by resolving multiple pathways: CO2 diffusion, CH4 diffusion, CH4 bubbling, and CH4 degassing downstream of the dam. By incorporating reservoir-specific properties such as surface area, mean depth, water residence time, and local climatic variables, the model captures the main physical controls on each pathway and avoids the underestimation that can arise when only surface diffusion is measured. The Integrated Model to Assess the Global Environment–Dynamic Global Nutrient Model (IMAGE-DGNM) is a spatially explicit, process-based framework that simulates the coupled cycling of water, carbon, nitrogen, and phosphorus from terrestrial systems to inland waters [37]. In this study, it was used to estimate N2O emissions from reservoirs by tracking nitrogen delivery, transformation, and removal along the land–water continuum. The model accounts for the major nitrogen processes occurring in soils, groundwater, rivers, and reservoirs, including mineralization, nitrification, denitrification, and plant uptake. N2O is produced as a by-product of both nitrification under aerobic conditions and incomplete denitrification under subtoxic conditions, and the model resolves these pathways explicitly as a function of available nitrogen substrates, oxygen concentration, and water temperature [37]. The catchment-to-reservoir routing scheme further captures the downstream transport of dissolved inorganic nitrogen, which can fuel additional N2O production within the reservoir water column. By integrating spatially distributed land-use data, atmospheric deposition, and point sources, IMAGE-DGNM provides reservoir-specific estimates of N2O emissions that are consistent with the national-scale assessment. Together, G-res and IMAGE-DGNM enable a process-based, multi-gas (CO2, CH4, N2O) quantification for all 79 reservoirs, combining physical emission pathways with catchment-driven nutrient dynamics.

2.4. Uncovering the Drivers Based on RF Model

GHG emissions from reservoirs are primarily driven by greater soil organic carbon storage [38]. However, increased elevation [39], lower temperatures [40], and deeper reservoirs [9] exert negative effects on GHG emissions. Concurrently, frequent rainfall events on land [41] and decreased water quality [42] also contribute to enhanced GHG production. To quantify the drivers of CO2, CH4 and N2O, we conducted an analysis of 15 environmental variables categorized into four groups, physical characteristics of reservoirs (Surface area, elevation, catchment area, sediment depth and average depth), climate (Air temperature, cumulative horizontal radiance, annual rainfall), soil properties (Soil carbon content) and water quality (NH4+ concentration, dissolved oxygen, water temperature, total phosphorus, organic nitrogen and nitrate).
RF is a specific implementation of the Bagging architecture within ensemble algorithms. The core idea of ensemble algorithms is to combine multiple models to achieve better learning performance than a single model. The RF algorithm is a nonparametric algorithm developed by Breiman [43] as an extension of the classification and regression tree algorithm to improve its predictive performance [44]. In this study, we implemented the RF model using the RandomForest package in R (version 4.2.0). To evaluate the robustness of the derived variable importance, the dataset of 79 reservoirs was randomly split into a training set (70%, n = 55) and a testing set (30%, n = 24); the stability of variable rankings was confirmed across splits. The number of trees (ntree) was set to 500 to ensure stable importance estimates, and the number of variables randomly sampled at each split (mtry) was tuned via 10-fold cross-validation on the training set, with mtry = 4 yielding the lowest out-of-bag error. After training, variable importance was derived from the mean decrease in impurity (MDI), which is based on the total decrease in node impurity from splitting on the variable, averaged over all trees [45]. The equation is as follows:
M D I ( X j ) = 1 M l = 1 M t T l p n , t L r e g , n j n , t , z n , t
where M D I ( X j ) computes the weighted decrease in impurity corresponding to splits along the variable X j and averages this quantity over all trees, p n , t is the fraction of observations falling in the node t, { T l }1 ≤ l M is the collection of trees in the forest, and j n , t , z n , t is the split that maximizes the empirical criterion in node t.

3. Results and Discussion

3.1. GHG Emissions from Reservoirs

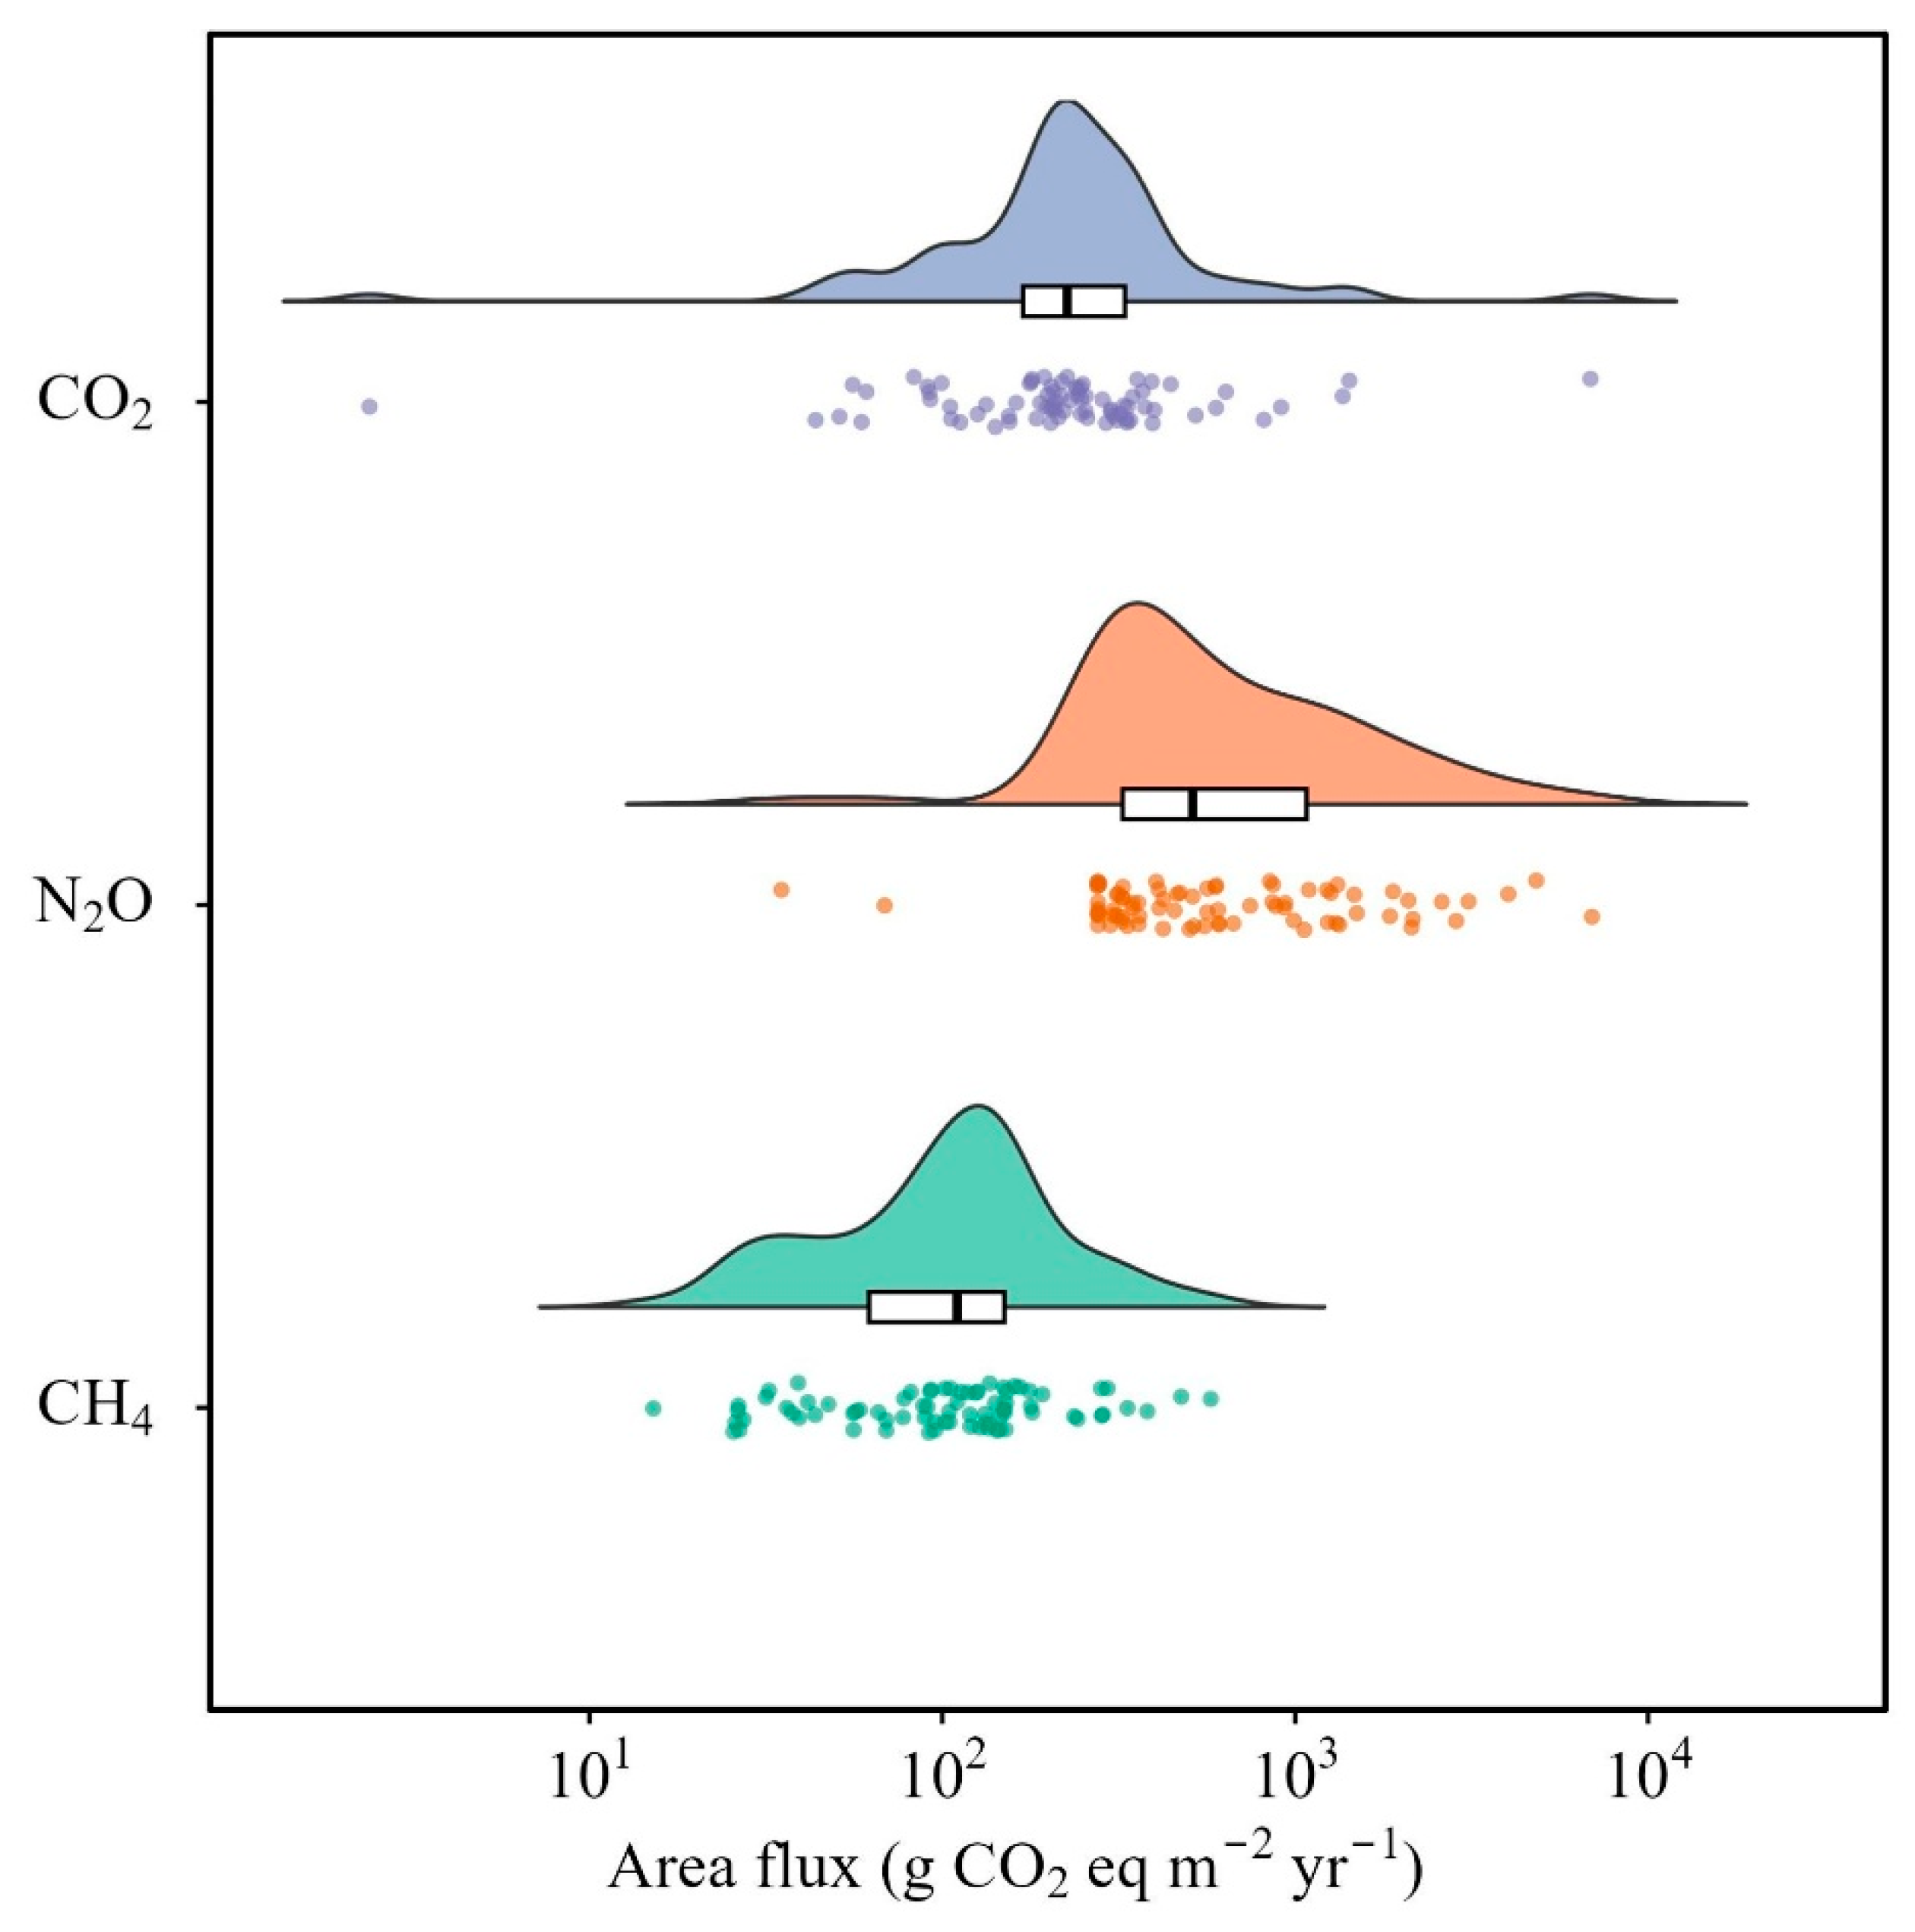
Our analysis of 79 major Chinese hydropower reservoirs revealed substantial GHG emissions. Total emissions in 2020 reached 12.63 Tg CO2 eq, with emissions of individual reservoirs varying greatly, from 0.14 Gg CO2 eq yr−1 to 2.31 Tg CO2 eq yr−1 (average = 0.16 Tg CO2 eq yr−1), as shown in Figure 2. A striking finding was the dominance of N2O, which contributed 74.17% of total CO2-equivalent emissions. CO2 and CH4 accounted for 18.06% and 7.77%, respectively. This N2O predominance was further reflected in areal fluxes. Median N2O areal flux (511.79 g CO2 eq m−2 yr−1) was significantly higher than median CO2 flux (225.85 g CO2 eq m−2 yr−1) and CH4 flux (110.10 g CO2 eq m−2 yr−1), indicating intense per-area N2O. Notably, our estimates for CO2 and CH4 fluxes align broadly with previous observations in China’s reservoirs [19,46].
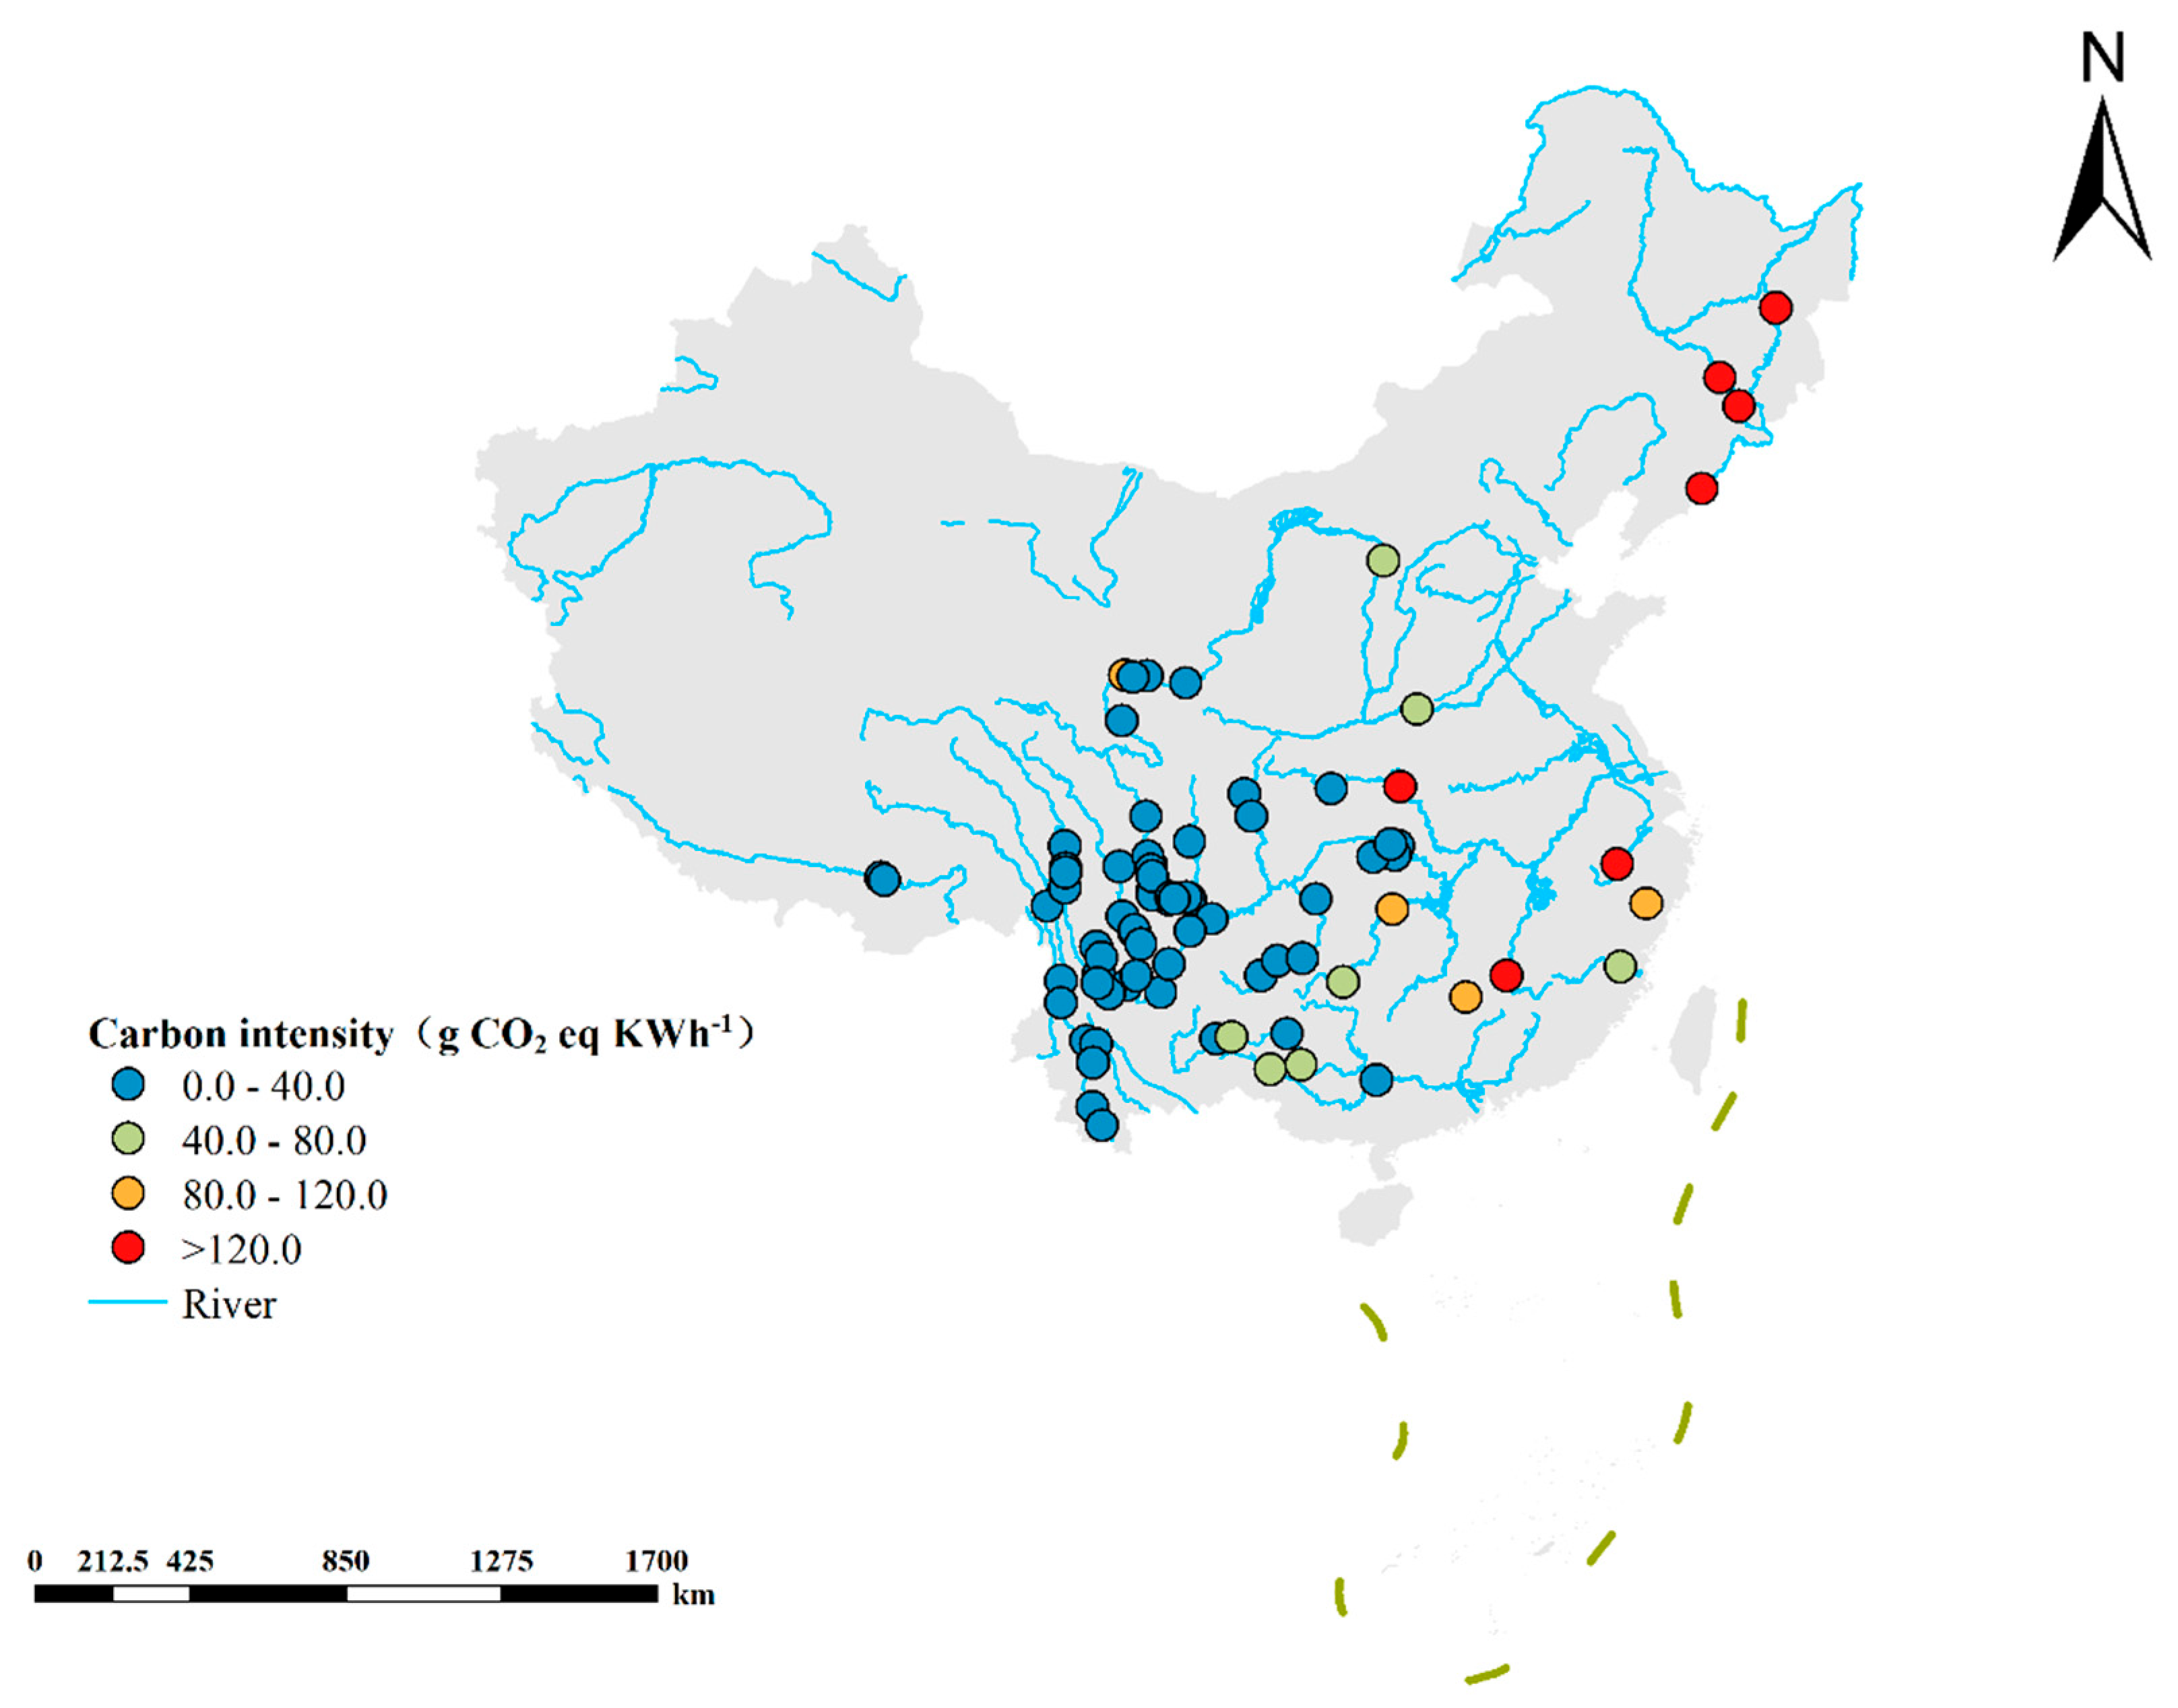
Figure 3 presents the carbon intensities (CIs) of the reservoirs. The values of the studied reservoirs are 0.006 to 586.85 kg CO2 eq MWh−1 (average ± standard deviation = 34.96 ± 88.26 kg CO2 eq MWh−1). The top three hydropower reservoirs with the highest CIs are Danjiangkou reservoir (586.9 kg CO2 eq MWh−1), Xianjiang reservoir (339.8 kg CO2 eq MWh−1), and Wanan reservoir (323.9kg CO2 eq MWh−1). The International Energy Agency (IEA) benchmark suggests that a reservoir CI below 80 kg CO2 eq MWh−1 signifies sustainable electricity generation aligned with UN Sustainable Development Goals [47]. Encouragingly, 74 reservoirs (93.7% of those studied) met this sustainability threshold. However, the remaining 5 reservoirs exhibited a considerably higher average CI of 324.32 kg CO2 eq MWh−1, highlighting a significant target for mitigation efforts to improve the overall climate benefit of China’s hydropower fleet.

3.2. Correlation Analysis of Main Drivers and Carbon Intensity

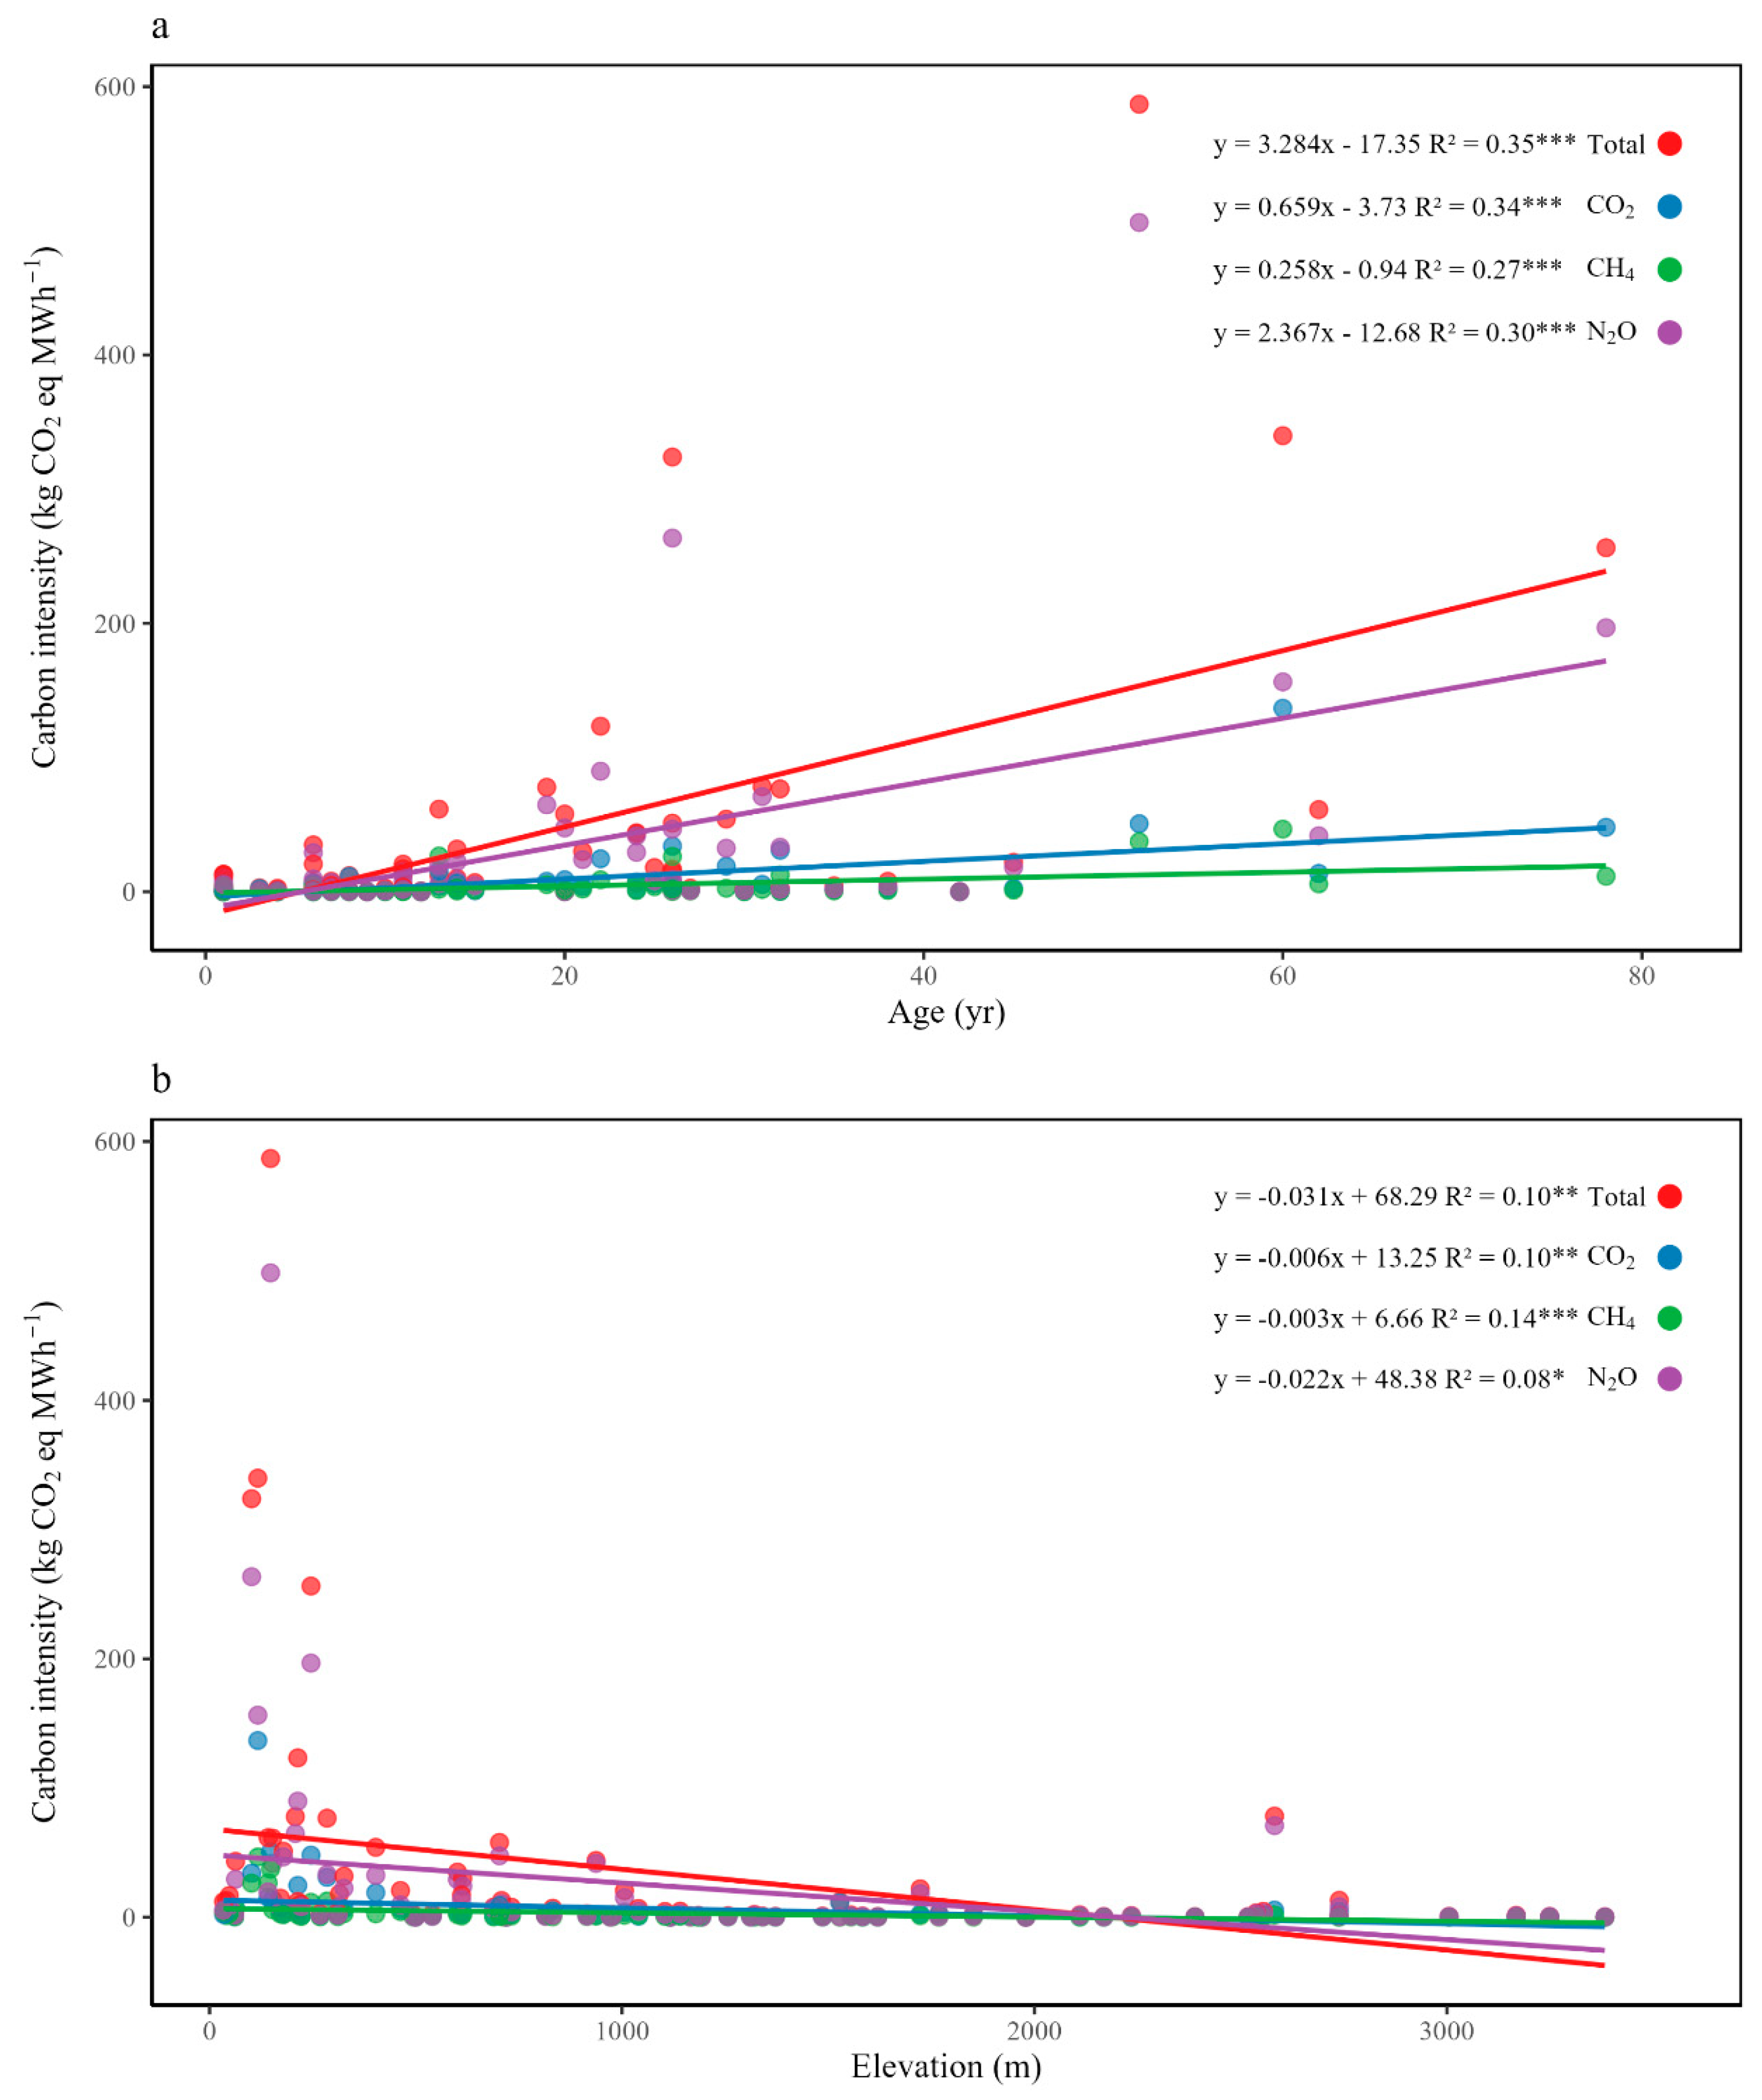
Our analysis revealed that reservoir age and altitude are two key environmental drivers significantly influencing reservoir carbon intensity (CI). Reservoir age exhibited a significant increasing trend with CI (Figure 4a), meaning older reservoirs generally had higher CIs. This pattern is attributable to long-term sediment accumulation reducing reservoir depth, a critical factor governing GHG production and emission efficiency [6], combined with the potential for declining power generation efficiency over the operational lifespan. Conversely, altitude showed a significant decreasing trend with CI (Figure 4b), indicating reservoirs at higher elevations consistently demonstrated lower CIs. This phenomenon is explained by two primary mechanisms: Lower temperatures prevalent at high altitudes strongly suppress microbial activity, particularly methanogenesis, drastically curtailing the production and emission of methane, which is with high global warming potential (GWP); Second, the typically large hydraulic head (elevation drop) associated with high-altitude reservoirs enables extremely efficient electricity generation, maximizing power output per unit of water flow and consequently diluting the associated GHG emissions per unit of electricity generated [48].

3.3. Comparison with Previous Studies

Numerous studies have quantified GHG emissions from hydropower reservoirs; however, most have focused primarily on CO2 and CH4, with N2O often omitted or treated as a minor component [6,49]. By explicitly incorporating N2O emissions, our study provides a more comprehensive assessment of the GHG footprint of China’s hydropower reservoirs. As summarized in Table 2, previous estimates differ substantially from our results because of differences in methodologies, system boundaries, and datasets.
For N2O, our estimated emission intensity is considerably higher than previous model-based and measurement-based estimates. For example, Lauerwald et al. [50], using the approach proposed by Maavara et al. [51], reported a global reservoir N2O emission intensity of only 62.94 g CO2 eq m−2 yr−1, whereas our estimate reached 1665.8 g CO2 eq m−2 yr−1. One important reason is that the previous approach did not explicitly account for N2O production associated with sediment nitrification and denitrification processes, which contributed nearly half of the total N2O emissions in our simulations. Several reservoirs, including Baishan, Guanyinyan, and Lubuge, dominated the national N2O budget, together accounting for more than 65% of total emissions. Previous studies have demonstrated that reservoir sediments can represent an important source of N2O through microbially mediated nitrogen transformations [52,53]. In addition, field-based estimates reported by Deemer et al. [18] and Li et al. [19] were also substantially lower than our results. This discrepancy may partly reflect methodological limitations, as conventional chamber and surface-flux measurements mainly quantify air–water diffusive exchange and may underestimate total N2O emissions from reservoirs [22].
For CO2, our estimated emission intensity is generally consistent with previous model-based assessments, particularly those reported by Hertwich [54] and Deemer et al. [18], supporting the reliability of the G-res-based approach adopted in this study. In contrast, Li et al. [55] estimated CO2 emissions approximately twice as high as ours. A likely explanation is that their analysis did not account for pre-impoundment carbon emissions, whereas the G-res framework explicitly subtracts the baseline emissions that would have occurred prior to reservoir construction. Similarly, the estimates reported by Li et al. [19] exceeded those obtained here, partly because their dataset was dominated by reservoirs located in low-altitude regions. In contrast, many reservoirs included in our study are situated in high-altitude areas that experience prolonged winter ice cover. Ice cover restricts gas exchange across the air–water interface and suppresses microbial activity, thereby reducing CO2 production and emission rates [56].
For CH4, our estimated emissions are higher than those reported by Li et al. [55], primarily because their study did not include degassing emissions downstream of dams. Our results indicate that degassing accounted for 52.5% of total CH4 emissions, highlighting its critical contribution to the overall methane budget. When only diffusive and ebullitive pathways are considered, our estimated CH4 emissions are comparable to those reported by Li et al. [49]. This suggests that the principal source of disagreement between studies arises from the treatment of degassing processes rather than from differences in estimates of surface emissions. The importance of CH4 degassing has also been emphasized in previous reservoir assessments and is recognized as a major component of methane emissions from hydropower systems [54].
Table 2. Comparison of results from earlier studies: Estimates of GHG emissions from hydropower reservoirs.
AreaAreal Flux Source
(106 km2)CO2CH4N2O
g CO2 eq m−2 yr−1
China’s 79 reservoirs0.02362.99132.541665.8This study
China reservoirs0.03712.65169.60173.66[19]
Global reservoirs0.25 62.94[50]
Global reservoirs0.31441.651985.651.28[18]
China reservoirs0.03867.2465.52 [55]
Boreal reservoirs0.089701360 [54]
Temperate reservoirs0.13420288 [54]
Tropical reservoirs0.1212001840 [54]
Temperate reservoirs0.9511248.2 [57]
Tropical reservoirs0.61277.53723 [57]

3.4. Random Forest Assessment Results

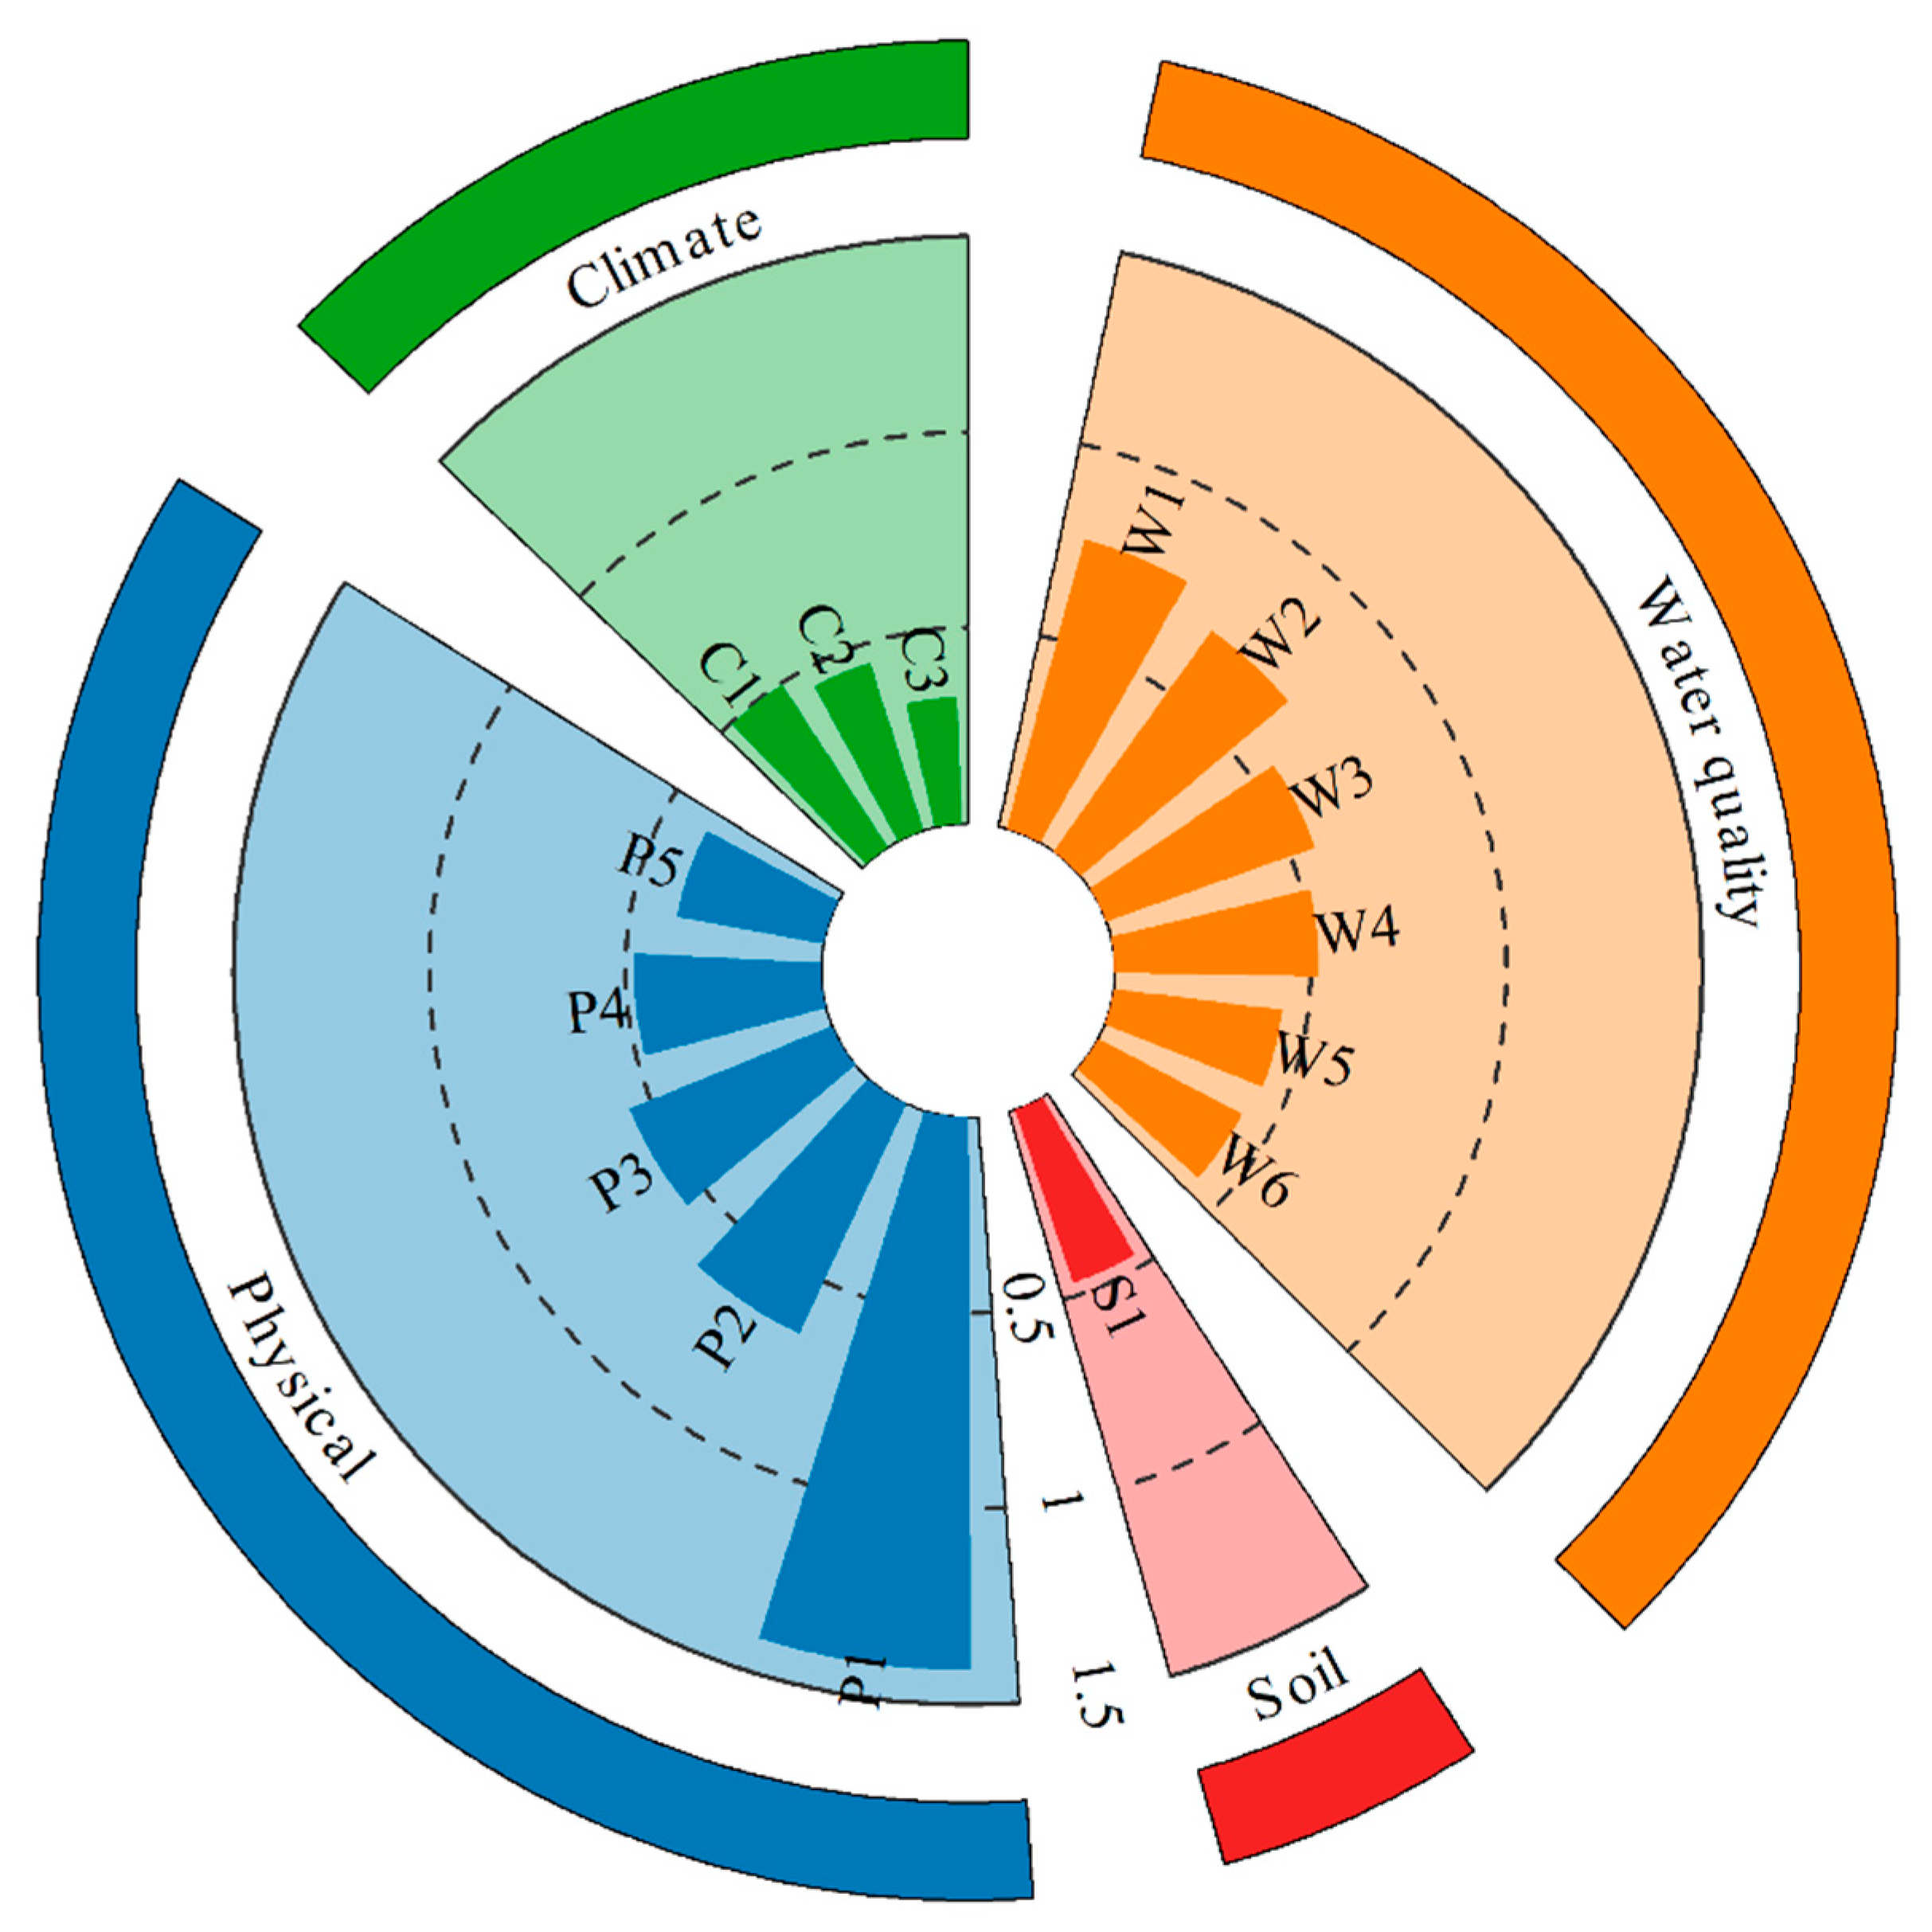
To identify the key environmental drivers of GHG emissions from hydropower stations, the study ranked the importance of 15 environmental factors based on the random forest model, as shown in Figure 5. The importance of environmental variables to CO2, CH4 and N2O emissions is shown in Figure S1, Figure S2 and Figure S3, respectively. The area of hydropower station reservoirs, NH4+ concentration, dissolved oxygen concentration, altitude, water temperature, controlled drainage area, total phosphorus concentration and air temperature are important factors affecting GHG emissions from hydropower station reservoirs (all with an importance exceeding 0.5). Strikingly, reservoir surface area emerged as the paramount driver, with an importance score (1.41) far exceeding all other factors. This underscores its fundamental role in shaping overall reservoir GHG emissions. The sediment depth, soil organic carbon content, reservoir cumulative global horizontal radiance and organic nitrogen concentration of hydropower station reservoirs are all ranked in the middle range in the importance score, indicating that these indicators can influence GHG emissions from hydropower station reservoirs to a certain extent, but are not enough to play a decisive role.
The environmental factors with relatively low importance scores are rainfall, average depth of reservoirs and NO3 concentration, indicating that these variables have a relatively small impact on the GHG emissions of the hydropower station reservoir. The reason might be that the increase in rainfall leads to more organic matter and nitrogen input into the hydropower station reservoir, which promotes microbial decomposition, thereby increasing GHG emissions [58]. But on the other hand, the increase in rainfall is also obvious the biomass of vegetation and the rate of photosynthesis, thereby enhancing the absorption of CO2 [59]. In addition, the increase in rainfall will cause the water level of hydropower station reservoirs to rise, inhibiting the decomposition of organic matter in sediments and thus reducing CH4 emissions [60]. The reason for the relatively low importance of average depth might be that although deep hydropower station reservoirs have less CH4 emissions, they are more likely to form stable temperature stratification, with lower dissolved oxygen in the bottom water [61]. Under the anoxic conditions at the bottom, denitrification is enhanced, which may increase the production of N2O. The reason why the NO3 concentration in the hydropower station reservoir is of relatively low significance might be that the average dissolved oxygen in the hydropower station reservoir in this study was 8.7 mg/L, and denitrification was inhibited by the high dissolved oxygen concentration. Therefore, the N2O emissions from the reservoir mainly come from nitrification. The research results of Wang et al. [12] also confirmed this point. Their findings indicated that the increase in N2O emissions from reservoirs mainly resulted from the enhancement of nitrification and denitrification, with nitrification increasing by over 700 times and denitrification by more than 300 times.

3.5. Single-Factor Partial Dependency Graph

To analyze the impact of environmental factor variables with higher importance (importance greater than 0.5) on GHG emissions from reservoirs, partial dependency graphs are drawn for the variables with higher importance. The partial dependency graph of a certain variable is obtained by keeping the values of other variables unchanged to obtain the model response when the values of this variable are different. As shown in Figure 6, the expansion of reservoir area, the increase in NH4+ concentration (especially after the threshold of 0.15–0.2 mg/L), the increase in drainage area (from 360,000 to 680,000 km2), and the rise in water temperature/air temperature all significantly promote GHG emissions. Partial dependency results of CO2, CH4 and N2O emissions refer to Figure S4, Figure S5 and Figure S6, respectively. This is mainly due to the fact that they enhance the input and retention time of organic matter (area, basin), stimulate microbial metabolism (nutrients, temperature), and provide more substrates [62,63]. The total phosphorus concentration in the reservoir is also crucial for GHG emissions. A low TP concentration (<22 μg/L) is conducive to suppressing the emissions because it limits the activity of organic matter-decomposing enzymes and weakens the efficiency of ammonia-oxidizing bacteria [64,65]. On the contrary, an increase in dissolved oxygen concentration within the range of 6–9 mg/L and an increase in altitude will inhibit emissions, as the former inhibits methanogenic bacteria and promotes methane oxidation [66], while the latter weakens microbial activity and gas diffusion through low temperatures, freezing and strong ultraviolet rays [56]. It is worth noting that when the dissolved oxygen exceeds 9 mg/L, the emissions rebound. It might be due to the enhanced nitrification resulting in N2O emissions [67].

4. Mitigation of GHG Emissions from Hydropower Reservoirs

Although hydropower is generally regarded as a low-carbon energy source compared with fossil-fuel-based electricity generation [68], our results indicate that reservoir-derived GHG emissions represent a non-negligible component of its overall climate footprint. This issue is particularly relevant for China, where hydropower expansion remains a key component of national energy planning. Under the 14th Five-Year Plan, installed hydropower capacity is expected to reach approximately 370 GW by 2030, implying further increases in reservoir area and associated inundated land. Given the strong influence of reservoir surface area on GHG production and the potential amplification of biogeochemical processes under a warming climate, future emissions from hydropower reservoirs may increase if appropriate mitigation measures are not implemented.
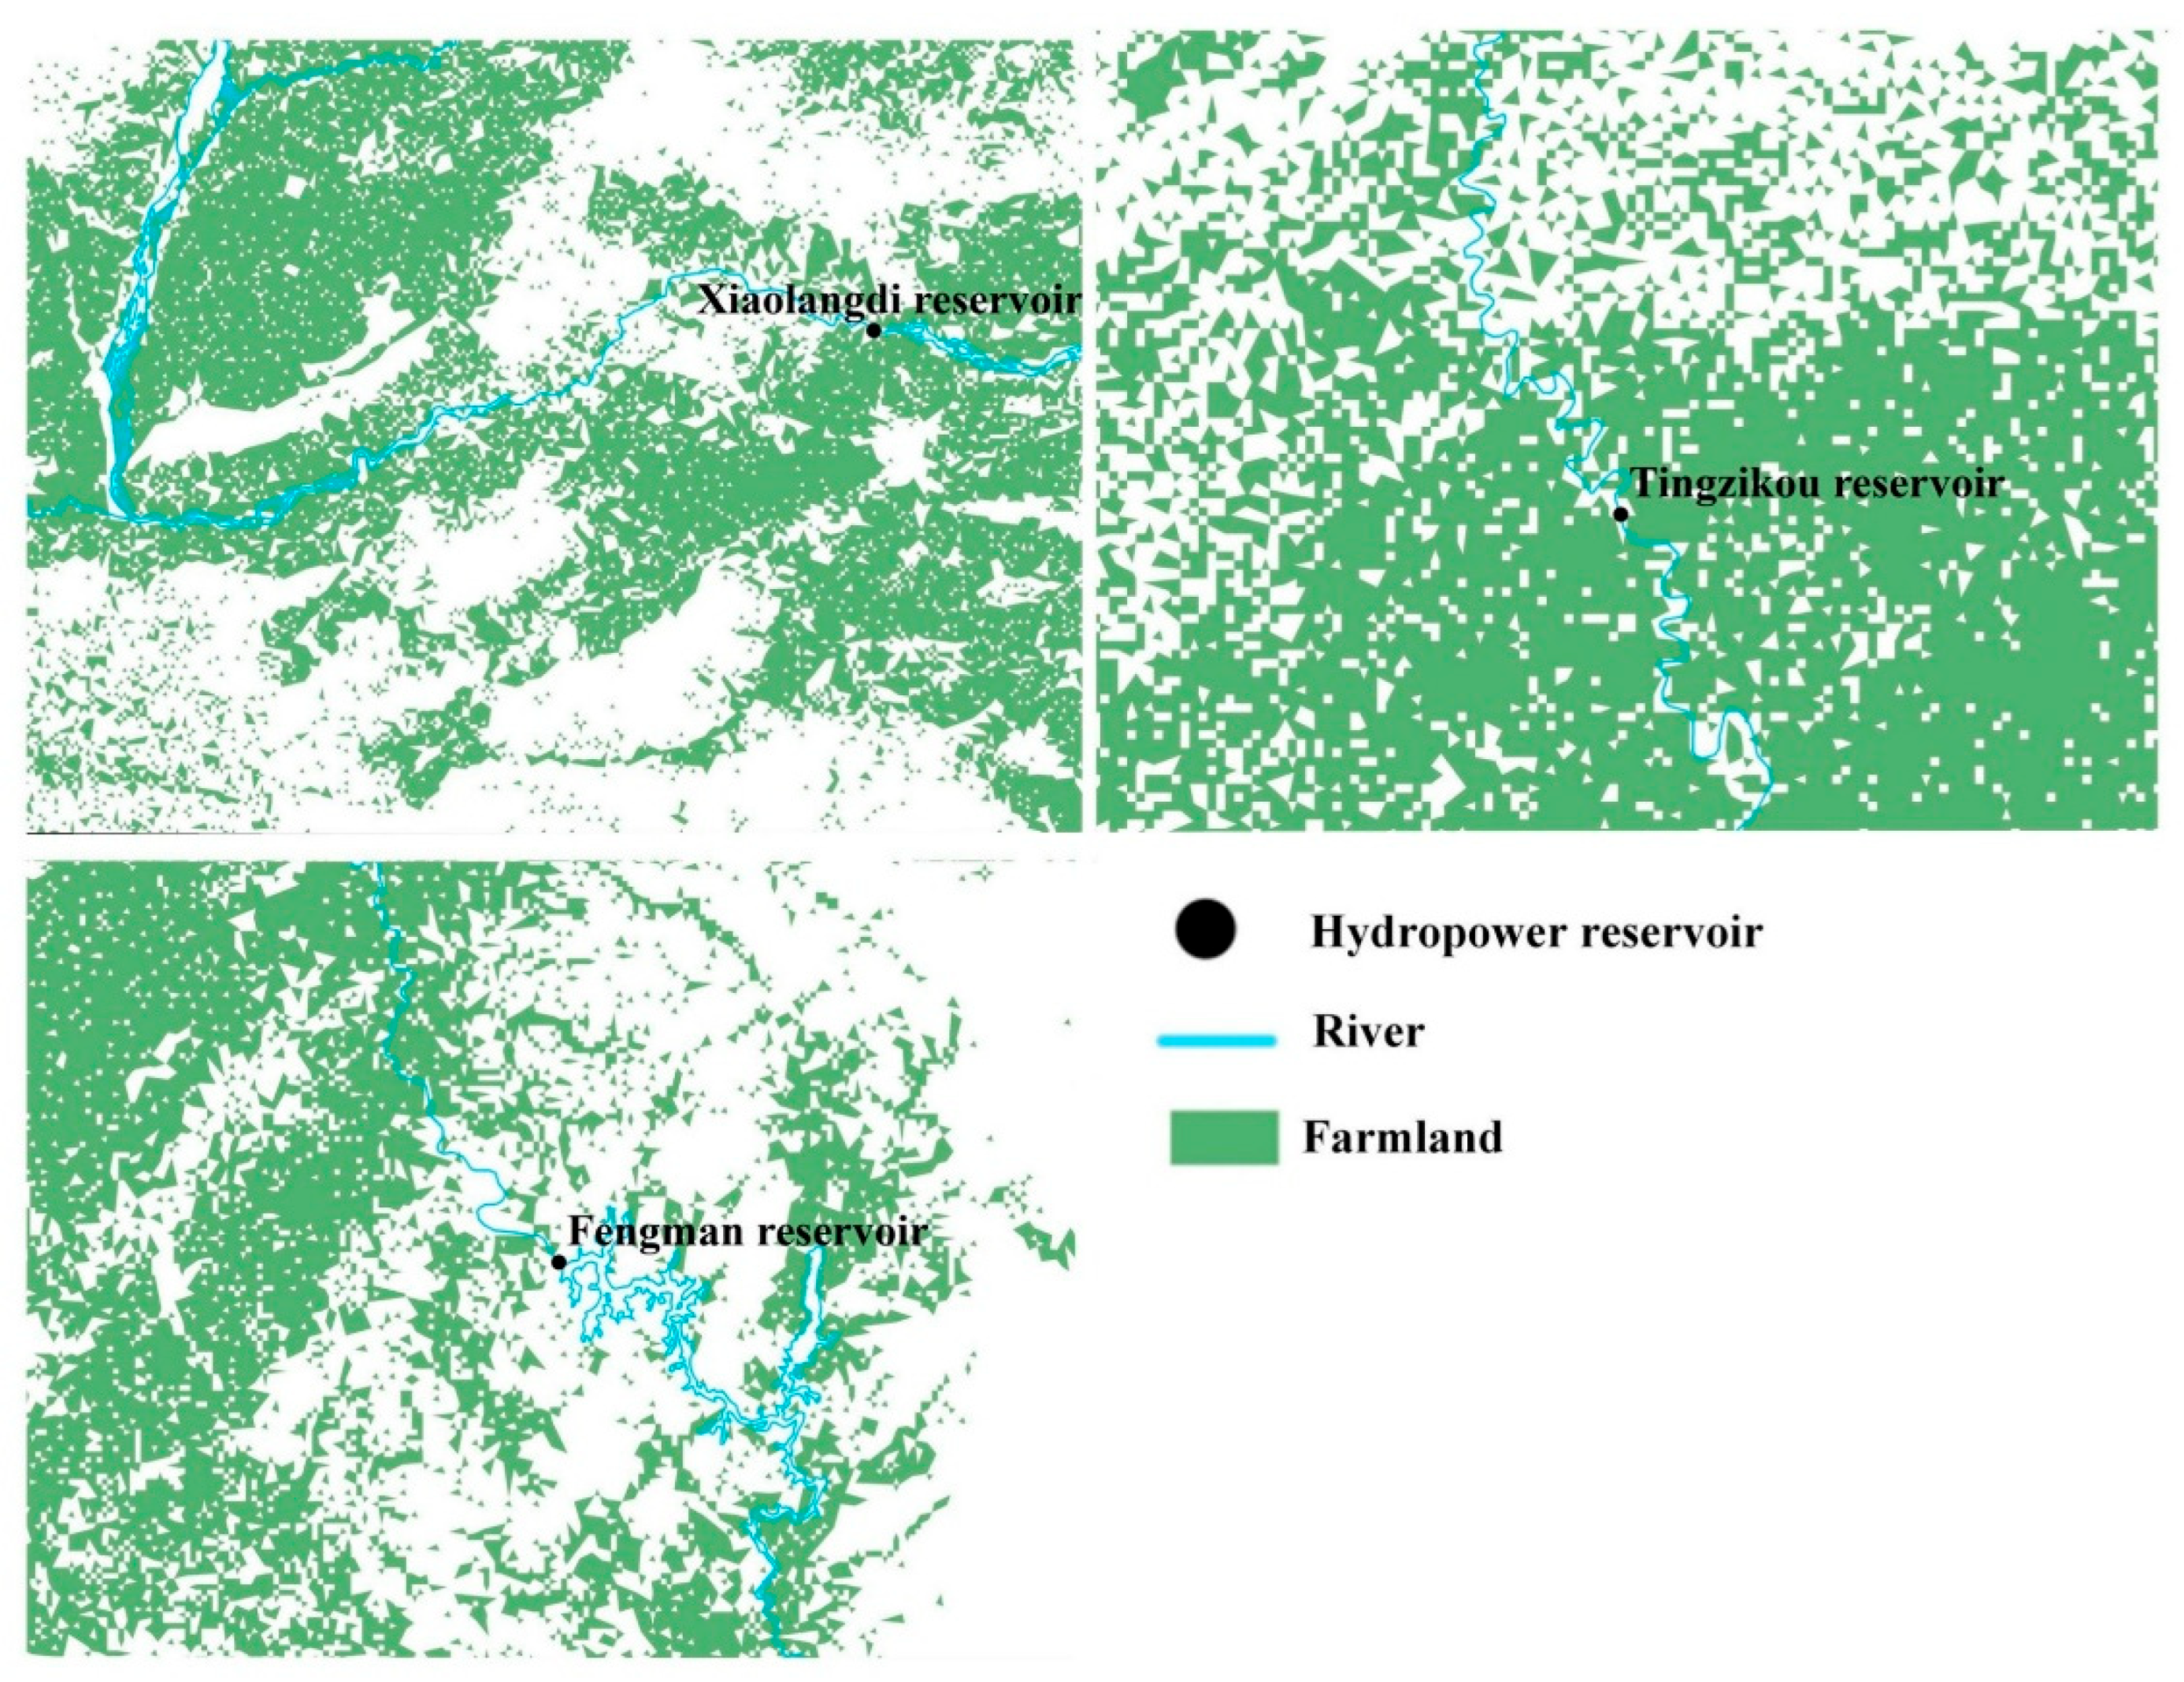
From a socioeconomic perspective, the strategies outlined above offer concrete social benefits beyond climate mitigation. Prioritizing high-altitude, low-CI reservoirs in future planning can directly reduce the carbon footprint of China’s expanding hydropower fleet, potentially generating carbon credits under China’s national emissions trading scheme and offsetting part of the construction and operation costs. In major grain-producing regions (Figure 7), where our results show elevated NH4+ concentrations driving reservoir N2O emissions, coordinated policies that link agricultural nutrient management with hydropower water quality targets can deliver dual benefits: reduced GHG emissions and improved downstream water security for rural communities. Furthermore, dredging and sediment management in older reservoirs, as already piloted on the Yellow River, not only curb methane emissions but also restore reservoir storage capacity, thereby safeguarding both flood control and irrigation services that millions of people rely on.

5. Limitations and Prospects of This Study

This study has several limitations. First, our national-scale GHG estimates for 2020 are based on a single year and therefore cannot capture interannual variability driven by climatic fluctuations or reservoir operations. Second, although the 79 selected reservoirs account for over 60% of China’s hydropower generation and cover all major basins, the sample size remains moderate for machine learning analysis; the random forest model was trained on 79 observations, which may limit the statistical power to detect subtle nonlinear interactions and constrain the generalizability of the derived driver importance to other years or unsampled reservoirs. Third, the input data for certain environmental predictors were compiled from multiple sources and, in a few cases, do not correspond strictly to 2020 (e.g., NO3 concentrations), introducing temporal inconsistency that, while shown to have minimal impact on the main results, nonetheless adds to the overall uncertainty. Fourth, despite the broad coverage, reservoirs across different climate zones, geological settings, ages, and operation modes (e.g., peak shaving versus water storage) may exhibit distinct emission dynamics that are not fully resolved at this scale. Future work should prioritize expanding the monitoring network, compiling multi-year datasets, and including a larger number of reservoirs to strengthen the mechanistic understanding of GHG emissions and improve the robustness of data-driven attribution models.

6. Conclusions

Mitigation of GHG emissions from hydropower reservoirs has been widely recognized, especially given China’s ambitious goal to increase its hydropower share. Revealing emission patterns and clarifying the driving factors can therefore provide insightful implications for sustainable hydropower. However, previous studies often focused on quantifying GHG emissions and rarely considered the relative importance of driving factors under multifactorial conditions. This study fills this gap by combining the G-res tool, IMAGE-DGNM, and a random forest model. Based on 79 hydropower reservoirs, which contribute more than 60% of the nation’s total hydropower generation and span the main basins of China, we observed significant spatial heterogeneity of GHG emission intensity, with reservoirs in high-altitude areas generally exhibiting lower emission intensity. N2O dominates the GHG emissions, followed by CO2 and CH4. The RF-based importance assessment quantitatively demonstrates that reservoir-specific properties collectively explain 40.37% of the variance in total GHG emissions. Among the 15 environmental variables examined, reservoir area emerges as the overwhelmingly dominant driver, with an MDI importance score of 1.41—substantially higher than those of NH4+ concentration, dissolved oxygen, altitude, water temperature, catchment area, total phosphorus, and air temperature, all of which exhibit importance scores exceeding 0.5. Partial dependence plots further quantify these marginal effects: GHG emissions rise significantly with expanding reservoir area, increasing NH4+ concentration (particularly above the 0.15–0.2 mg/L threshold), and larger catchment areas in the 360,000–680,000 km2 range, while elevated dissolved oxygen between 6 and 9 mg/L and higher altitude exert notable suppressive effects. In contrast, rainfall, average reservoir depth, and NO3 concentration show relatively low importance scores, indicating limited influence. These conclusions are drawn from the selected sample of 79 large reservoirs; other unmeasured variables—such as microbial community composition, reservoir age, detailed operation schedules, or land-use dynamics—may also influence emissions and deserve attention in future studies. Finally, this study provides insightful suggestions for reducing these emissions that have global implications.

Supplementary Materials

The following supporting information can be downloaded at: https://www.mdpi.com/article/10.3390/w18131610/s1, Figure S1. The chart of the characteristic importance of environmental variables to CO2 emissions. P1 is reservoir area; P2 is elevation; P3 is catchment area; P4 is sediment depth; P5 is average depth; S1 is reservoir surface soil carbon content; W1 is NH4+ concentration; W2 is dissolved oxygen; W3 is water temperature; W4 is total phosphorus; W5 is Organic nitrogen; W6 is nitrate; C1 is air temperature; C2 is reservoir cumulative global horizontal radiance; C3 is annual rainfall. Figure S2. The chart of the characteristic importance of environmental variables to CH4 emissions. P1 is reservoir area; P2 is elevation; P3 is catchment area; P4 is sediment depth; P5 is average depth; S1 is reservoir surface soil carbon content; W1 is NH4+ concentration; W2 is dissolved oxygen; W3 is water temperature; W4 is total phosphorus; W5 is Organic nitrogen; W6 is nitrate; C1 is air temperature; C2 is reservoir cumulative global horizontal radiance; C3 is annual rainfall. Figure S3. The chart of the characteristic importance of environmental variables to N2O emissions. P1 is reservoir area; P2 is elevation; P3 is catchment area; P4 is sediment depth; P5 is average depth; S1 is reservoir surface soil carbon content; W1 is NH4+ concentration; W2 is dissolved oxygen; W3 is water temperature; W4 is total phosphorus; W5 is Organic nitrogen; W6 is nitrate; C1 is air temperature; C2 is reservoir cumulative global horizontal radiance; C3 is annual rainfall. Figure S4. Partial dependency graph of environmental factors and CO2 emissions (a) Reservoir area; (b) NH4+ concentration; (c) dissolved oxygen; (d) elevation; (e) water temperature; (f) watershed area; (g) total phosphorus; (h) air temperature against GHG emissions. Figure S5. Partial dependency graph of environmental factors and CH4 emissions (a) Reservoir area; (b) NH4+ concentration; (c) dissolved oxygen; (d) elevation; (e) water temperature; (f) watershed area; (g) total phosphorus; (h) air temperature against GHG emissions. Figure S6. Partial dependency graph of environmental factors and N2O emissions (a) Reservoir area; (b) NH4+ concentration; (c) dissolved oxygen; (d) elevation; (e) water temperature; (f) watershed area; (g) total phosphorus; (h) air temperature against GHG emissions.

Author Contributions

Conceptualization, H.L., Q.L., X.T., H.C., J.X. and H.P.; Methodology, H.L., X.T., L.A., J.X. and H.P.; Software, H.L.; Formal analysis, H.P.; Resources, H.C.; Data curation, H.L., Q.L., X.T., L.A., H.C., J.X. and H.P.; Writing—original draft, H.L., Q.L. and H.C.; Visualization, L.A. All authors have read and agreed to the published version of the manuscript.

Funding

This study is supported by Sichuan Provincial Science and Technology Project for Ecological Environmental Protection (No. 2024HB27; No. 2022HB14).

Data Availability Statement

The original contributions presented in this study are included in the article/Supplementary Material. Further inquiries can be directed to the corresponding author.

Acknowledgments

We would like to thank the editors and anonymous reviewers for their valuable time and constructive comments, which have greatly improved the quality of this manuscript.

Conflicts of Interest

The authors declare no conflicts of interest.

References

  1. International Hydropower Association, IHA. IHA 2021 Hydropower Status Report: Sector Trends and Insights; International Hydropower Association, IHA: London, UK, 2021; p. 28. [Google Scholar]
  2. Sun, X.; Wang, X.; Liu, L.; Fu, R. Development and Present Situation of Hydropower in China. Water Policy 2019, 21, 565–581. [Google Scholar] [CrossRef] [Scilit]
  3. de Albuquerque, V.C.; Calili, R.F.; de Almeida, M.F.L.; Albuquerque, R.; Castro, T.; Kelman, R. Integrated Spatiotemporal Life Cycle Assessment Framework for Hydroelectric Power Generation in Brazil. Energies 2025, 18, 5606. [Google Scholar] [CrossRef] [Scilit]
  4. Harrison, J.A.; Prairie, Y.T.; Mercier-Blais, S.; Soued, C. Year-2020 Global Distribution and Pathways of Reservoir Methane and Carbon Dioxide Emissions According to the Greenhouse Gas From Reservoirs (G-Res) Model. Glob. Biogeochem. Cycles 2021, 35, e2020GB006888. [Google Scholar] [CrossRef] [Scilit]
  5. Li, Y.; Tian, H.; Yao, Y.; Shi, H.; Bian, Z.; Shi, Y.; Wang, S.; Maavara, T.; Lauerwald, R.; Pan, S. Increased Nitrous Oxide Emissions from Global Lakes and Reservoirs since the Pre-Industrial Era. Nat. Commun. 2024, 15, 942. [Google Scholar] [CrossRef] [Scilit] [PubMed]
  6. Li, M.; He, N. Carbon Intensity of Global Existing and Future Hydropower Reservoirs. Renew. Sustain. Energy Rev. 2022, 162, 112433. [Google Scholar] [CrossRef] [Scilit]
  7. Qian, C.; Wang, Q.; Gilfedder, B.S.; Frei, S.; Yu, J.; Kattel, G.R.; Yu, Z.G. Seasonal Dynamics of Groundwater Discharge: Unveiling the Complex Control over Reservoir Greenhouse Gas Emissions. Water Res. 2025, 269, 122801. [Google Scholar] [CrossRef] [Scilit] [PubMed]
  8. Cheng, S.; Kumar, A.; Lan, G.; Zhang, W.; Yu, Z.; Zhang, S.; Yu, Z.G.; Yao, M.; Lin, J. Thermal Sensitivity and Rising Greenhouse Gas Emissions in Riparian Zone Soils: Implications for Ecosystem Carbon Dynamics. J. Environ. Manag. 2025, 381, 125194. [Google Scholar] [CrossRef] [Scilit] [PubMed]
  9. Shi, W.; Maavara, T.; Chen, Q.; Zhang, J.; Ni, J.; Tonina, D. Spatial Patterns of Diffusive Greenhouse Gas Emissions from Cascade Hydropower Reservoirs. J. Hydrol. 2023, 619, 129343. [Google Scholar] [CrossRef] [Scilit]
  10. Zhu, D.; Liu, X.; Liu, X.; Wu, L.; Huang, W. Strategies for Phosphorus Management and Greenhouse Gas Reduction via Plant Harvesting in the Water-Level Fluctuation Zone of the Three Gorges Reservoir. Environ. Res. 2025, 268, 120804. [Google Scholar] [CrossRef] [Scilit] [PubMed]
  11. Grinham, A.; Maxwell, C.; Sturm, K.; Hickman, L.; Ringe, R. Towards a Methodology for Spatially and Temporally Resolved Estimation of Emissions from Reservoirs: Learnings from Australia. Appl. Sci. 2025, 15, 9795. [Google Scholar] [CrossRef] [Scilit]
  12. Wang, J.; Vilmin, L.; Mogollón, J.M.; Beusen, A.H.W.; van Hoek, W.J.; Liu, X.; Pika, P.A.; Middelburg, J.J.; Bouwman, A.F. Inland Waters Increasingly Produce and Emit Nitrous Oxide. Environ. Sci. Technol. 2023, 57, 13506–13519. [Google Scholar] [CrossRef] [Scilit] [PubMed]
  13. Chen, H.; Pan, H.; Xiao, S.; Deng, S. Nitrous Oxide Dominates Greenhouse Gas Emissions from Hydropower’s Reservoirs in China from 2020 to 2060. Water Res. 2025, 279, 123420. [Google Scholar] [CrossRef] [Scilit] [PubMed]
  14. Soued, C.; Harrison, J.A.; Mercier-Blais, S.; Prairie, Y.T. Reservoir CO2 and CH4 Emissions and Their Climate Impact over the Period 1900–2060. Nat. Geosci. 2022, 15, 700–705. [Google Scholar] [CrossRef] [Scilit]
  15. Lomov, V.; Stepanenko, V.; Grechushnikova, M.; Repina, I. Mechanistic Modeling of the Variability of Methane Emissions from an Artificial Reservoir. Water 2024, 16, 76. [Google Scholar] [CrossRef] [Scilit]
  16. Beaulieu, J.J.; Waldo, S.; Balz, D.A.; Barnett, W.; Hall, A.; Platz, M.C.; White, K.M. Methane and Carbon Dioxide Emissions From Reservoirs: Controls and Upscaling. J. Geophys. Res. Biogeosci. 2020, 125, e2019JG005474. [Google Scholar] [CrossRef] [Scilit] [PubMed]
  17. Barros, N.; Cole, J.J.; Tranvik, L.J.; Prairie, Y.T.; Bastviken, D.; Huszar, V.L.M.; Del Giorgio, P.; Roland, F. Carbon Emission from Hydroelectric Reservoirs Linked to Reservoir Age and Latitude. Nat. Geosci. 2011, 4, 593–596. [Google Scholar] [CrossRef] [Scilit]
  18. Deemer, B.R.; Harrison, J.A.; Li, S.; Beaulieu, J.J.; Delsontro, T.; Barros, N.; Bezerra-Neto, J.F.; Powers, S.M.; Dos Santos, M.A.; Vonk, J.A. Greenhouse Gas Emissions from Reservoir Water Surfaces: A New Global Synthesis. Bioscience 2016, 66, 949–964. [Google Scholar] [CrossRef] [Scilit] [PubMed]
  19. Li, S.; Bush, R.T.; Santos, I.R.; Zhang, Q.; Song, K.; Mao, R.; Wen, Z.; Lu, X.X. Large Greenhouse Gases Emissions from China’s Lakes and Reservoirs. Water Res. 2018, 147, 13–24. [Google Scholar] [CrossRef] [Scilit] [PubMed]
  20. Li, W.; Xu, S.; Chen, X.; Han, D.; Mu, B. Influencing Factors and Nutrient Release from Sediments in the Water Level Fluctuation Zone of Biliuhe Reservoir, a Drinking Water Reservoir. Water 2023, 15, 3659. [Google Scholar] [CrossRef] [Scilit]
  21. Wei, X.; Liu, M.; Pan, H.; Yao, H.; Ren, Y. Variations in Greenhouse Gas Fluxes at the Water–Gas Interface in the Three Gorges Reservoir Caused by Hydrologic Management: Implications for Carbon Cycling. Water 2024, 16, 1642. [Google Scholar] [CrossRef] [Scilit]
  22. Cheng, F.; Zhang, H.M.; Zhang, G.L.; Liu, S.M.; Song, G.D.; Du, G.X. Distribution and Emission of N2O in the Largest River-Reservoir System along the Yellow River. Sci. Total Environ. 2019, 666, 1209–1219. [Google Scholar] [CrossRef] [Scilit] [PubMed]
  23. He, C.; Feng, H.; Zhao, Z.; Wang, F.; Wang, F.; Chen, X.; Wang, X.; Zhang, P.; Li, S.; Yi, Y.; et al. Mechanism of Nitrous Oxide (N2O) Production during Thermal Stratification of a Karst, Deep-Water Reservoir in Southwestern China. J. Clean. Prod. 2021, 303, 127076. [Google Scholar] [CrossRef] [Scilit]
  24. Zhu, Y.; Purdy, K.J.; Eyice, Ö.; Shen, L.; Harpenslager, S.F.; Yvon-Durocher, G.; Dumbrell, A.J.; Trimmer, M. Disproportionate Increase in Freshwater Methane Emissions Induced by Experimental Warming. Nat. Clim. Chang. 2020, 10, 685–690. [Google Scholar] [CrossRef] [Scilit]
  25. National Energy Administration. The 13th Five-Year Plan for Hydropower Development (2016–2020); National Energy Administration: Beijing, China, 2016.
  26. Zhang, H.; Chen, F.; Wang, L.; Wang, N.; Yu, B. Reservoir Inventory for China in 2016 and 2021. Sci. Data 2023, 10, 609. [Google Scholar] [CrossRef] [Scilit] [PubMed]
  27. Chen, S.N.; Yue, F.J.; Liu, X.L.; Zhong, J.; Yi, Y.B.; Wang, W.F.; Qi, Y.; Xiao, H.Y.; Li, S.L. Seasonal Variation of Nitrogen Biogeochemical Processes Constrained by Nitrate Dual Isotopes in Cascade Reservoirs, Southwestern China. Environ. Sci. Pollut. Res. 2021, 28, 26617–26627. [Google Scholar] [CrossRef] [Scilit] [PubMed]
  28. Hu, M.; Wang, Y.; Du, P.; Shui, Y.; Cai, A.; Lv, C.; Bao, Y.; Li, Y.; Li, S.; Zhang, P. Tracing the Sources of Nitrate in the Rivers and Lakes of the Southern Areas of the Tibetan Plateau Using Dual Nitrate Isotopes. Sci. Total Environ. 2019, 658, 132–140. [Google Scholar] [CrossRef] [Scilit] [PubMed]
  29. Ji, X.; Shu, L.; Li, J.; Zhao, C.; Chen, W.; Chen, Z.; Shang, X.; Dahlgren, R.A.; Yang, Y.; Zhang, M. Tracing Nitrate Sources and Transformations Using △17O, Δ15N, and Δ18O-NO3− in a Coastal Plain River Network of Eastern China. J. Hydrol. 2022, 610, 127829. [Google Scholar] [CrossRef] [Scilit]
  30. Li, C.; Li, S.-L.; Yue, F.-J.; Liu, J.; Zhong, J.; Yan, Z.-F.; Zhang, R.-C.; Wang, Z.-J.; Xu, S. Identification of Sources and Transformations of Nitrate in the Xijiang River Using Nitrate Isotopes and Bayesian Model. Sci. Total Environ. 2019, 646, 801–810. [Google Scholar] [CrossRef] [Scilit] [PubMed]
  31. Zhao, Y.; Zheng, B.; Jia, H.; Chen, Z. Determination Sources of Nitrates into the Three Gorges Reservoir Using Nitrogen and Oxygen Isotopes. Sci. Total Environ. 2019, 687, 128–136. [Google Scholar] [CrossRef] [Scilit] [PubMed]
  32. Guo, X.; Tang, Y.; Xu, Y.; Zhang, S.; Ma, J.; Xiao, S.; Ji, D.; Yang, Z.; Liu, D. Using Stable Nitrogen and Oxygen Isotopes to Identify Nitrate Sources in the Lancang River, Upper Mekong. J. Environ. Manag. 2020, 274, 111197. [Google Scholar] [CrossRef] [Scilit] [PubMed]
  33. Zhang, X.; Zhang, Y.; Shi, P.; Bi, Z.; Shan, Z.; Ren, L. The Deep Challenge of Nitrate Pollution in River Water of China. Sci. Total Environ. 2021, 770, 144674. [Google Scholar] [CrossRef] [Scilit] [PubMed]
  34. Zhao, X.; Xu, H.; Kang, L.; Zhu, G.; Paerl, H.W.; Li, H.; Liu, M.; Zhu, M.; Zou, W.; Qin, B.; et al. Nitrate Sources and Transformations in a River-Reservoir System: Response to Extreme Flooding and Various Land Use. J. Hydrol. 2024, 638, 131491. [Google Scholar] [CrossRef] [Scilit] [PubMed]
  35. Zhan, P.; Song, C.; Liu, K.; Chen, T.; Ke, L.; Luo, S.; Fan, C. Can We Estimate the Lake Mean Depth and Volume from the Deepest Record and Auxiliary Geospatial Parameters? J. Hydrol. 2023, 617, 128958. [Google Scholar] [CrossRef] [Scilit]
  36. Yigzaw, W.; Li, H.Y.; Demissie, Y.; Hejazi, M.I.; Leung, L.R.; Voisin, N.; Payn, R. A New Global Storage-Area-Depth Data Set for Modeling Reservoirs in Land Surface and Earth System Models. Water Resour. Res. 2018, 54, 10372–10386. [Google Scholar] [CrossRef] [Scilit]
  37. Vilmin, L.; Mogollón, J.M.; Beusen, A.H.W.; van Hoek, W.J.; Liu, X.; Middelburg, J.J.; Bouwman, A.F. Modeling Process-Based Biogeochemical Dynamics in Surface Fresh Waters of Large Watersheds With the IMAGE-DGNM Framework. J. Adv. Model. Earth Syst. 2020, 12, e2019MS001796. [Google Scholar] [CrossRef] [Scilit]
  38. Tittel, J.; Hüls, M.; Koschorreck, M. Terrestrial Vegetation Drives Methane Production in the Sediments of Two German Reservoirs. Sci. Rep. 2019, 9, 15944. [Google Scholar] [CrossRef] [Scilit] [PubMed]
  39. Li, C.; Wu, W.; Chen, H.; Ren, L.; Kang, X. Freeze-Thaw Seasonal Variations and Environmental Controls of CO2 and CH4 Diffusive Emissions from Reservoirs in the Upper Yellow River. Sci. Rep. 2025, 15, 34528. [Google Scholar] [CrossRef] [Scilit] [PubMed]
  40. Wu, Y.; Mao, X.; Xia, L.; Tang, W.; Yu, H.; Zhang, Z.; Xiao, F.; Ji, H.; Ma, Y. Controlling Methane Ebullition Flux in Cascade Reservoirs of the Upper Yellow River by the Ratio of McrA to PmoA Genes. Water 2024, 16, 2565. [Google Scholar] [CrossRef] [Scilit]
  41. Mu, C.; Li, K.; Liu, S.; Wei, Y.; Mu, M.; Shang, X.; Liu, F.; Zhang, C.; Liu, H.; Gao, T.; et al. Recent Intensified Riverine CO2 Emission across the Northern Hemisphere Permafrost Region. Nat. Commun. 2025, 16, 3616. [Google Scholar] [CrossRef] [Scilit] [PubMed]
  42. Liao, W.; Chen, H.; Peng, M.; Chang, T. Spatio-Temporal Variation of Trophic Status and Water Quality with Water Level Fluctuation in a Reservoir. Water 2023, 15, 3154. [Google Scholar] [CrossRef] [Scilit]
  43. Breiman, L. Random Forests. Mach. Learn. 2001, 45, 5–32. [Google Scholar] [CrossRef] [Scilit]
  44. Genuer, R.; Poggi, J.; Tuleau-malot, C. Variable Selection Using Random Forests. Pattern Recognit. Lett. 2010, 31, 2225–2236. [Google Scholar] [CrossRef] [Scilit]
  45. Biau, G.; Scornet, E. A Random Forest Guided Tour. Test 2016, 25, 197–227. [Google Scholar] [CrossRef] [Scilit]
  46. Wang, W.; Li, S.L.; Zhong, J.; Wang, L.; Yang, H.; Xiao, H.; Liu, C.Q. CO2 emissions from Karst Cascade Hydropower Reservoirs: Mechanisms and Reservoir Effect. Environ. Res. Lett. 2021, 16, 044013. [Google Scholar] [CrossRef] [Scilit]
  47. International Hydropower Association (IHA). GHG Measurement Guidelines for Freshwater Reservoirs; International Hydropower Association (IHA): London, UK, 2010. [Google Scholar]
  48. Almeida, R.M.; Shi, Q.; Gomes-Selman, J.M.; Wu, X.; Xue, Y.; Angarita, H.; Barros, N.; Forsberg, B.R.; García-Villacorta, R.; Hamilton, S.K.; et al. Reducing Greenhouse Gas Emissions of Amazon Hydropower with Strategic Dam Planning. Nat. Commun. 2019, 10, 4281. [Google Scholar] [CrossRef] [Scilit] [PubMed]
  49. Wang, Z.; Chan, F.K.S.; Feng, M.; Johnson, M.F. Greenhouse gas emissions from hydropower reservoirs: Emission processes and management approaches. Environ. Res. Lett. 2024, 19, 073002. [Google Scholar] [CrossRef] [Scilit]
  50. Lauerwald, R.; Regnier, P.; Figueiredo, V.; Enrich-Prast, A.; Bastviken, D.; Lehner, B.; Maavara, T.; Raymond, P. Natural Lakes Are a Minor Global Source of N2O to the Atmosphere. Glob. Biogeochem. Cycles 2019, 33, 1564–1581. [Google Scholar] [CrossRef] [Scilit]
  51. Maavara, T.; Lauerwald, R.; Laruelle, G.G.; Akbarzadeh, Z.; Bouskill, N.J.; Van Cappellen, P.; Regnier, P. Nitrous Oxide Emissions from Inland Waters: Are IPCC Estimates Too High? Glob. Change Biol. 2019, 25, 473–488. [Google Scholar] [CrossRef] [Scilit] [PubMed]
  52. Deutsch, B.; Forster, S.; Wilhelm, M.; Dippner, J.W.; Voss, M. Denitrification in Sediments as a Major Nitrogen Sink in the Baltic Sea: An Extrapolation Using Sediment Characteristics. Biogeosciences 2010, 7, 3259–3271. [Google Scholar] [CrossRef] [Scilit]
  53. He, Q.; Zhu, Y.; Li, G.; Fan, L.; Ai, H.; Huangfu, X.; Li, H. Impact of Dissolved Oxygen on the Production of Nitrous Oxide in Biological Aerated Filters. Front. Environ. Sci. Eng. 2017, 11, 16. [Google Scholar] [CrossRef] [Scilit]
  54. Hertwich, E.G. Addressing Biogenic Greenhouse Gas Emissions from Hydropower in LCA. Environ. Sci. Technol. 2013, 47, 9604–9611. [Google Scholar] [CrossRef] [Scilit] [PubMed]
  55. Li, S.; Zhang, Q.; Bush, R.T.; Sullivan, L.A. Methane and CO2 Emissions from China’s Hydroelectric Reservoirs: A New Quantitative Synthesis. Environ. Sci. Pollut. Res. 2015, 22, 5325–5339. [Google Scholar] [CrossRef] [Scilit] [PubMed]
  56. Jin, Y.; Chen, X.; Zhu, L.; Yuan, J.; Hu, T. Spatiotemporal Distribution of Methane Concentration and Emissions in the Northeastern Reservoir with Ice-Covered Characteristics. Water 2025, 17, 483. [Google Scholar] [CrossRef] [Scilit]
  57. St Louis, V.L.; Kelly, C.A.; Duchemin, É.; Rudd, J.W.; Rosenberg, D.M. Reservoir Surfaces as Sources of Greenhouse to the Atmosphere: A Global Estimate. Bioscience 2000, 50, 766–775. [Google Scholar] [CrossRef] [Scilit]
  58. DelSontro, T.; Beaulieu, J.J.; Downing, J.A. Greenhouse Gas Emissions from Lakes and Impoundments: Upscaling in the Face of Global Change. Limnol. Oceanogr. Lett. 2018, 3, 64–75. [Google Scholar] [CrossRef] [Scilit] [PubMed]
  59. Lv, G.; Jin, J.; He, M.; Wang, C. Soil Moisture Content Dominates the Photosynthesis of C3 and C4 Plants in a Desert Steppe after Long-Term Warming and Increasing Precipitation. Plants 2023, 12, 2903. [Google Scholar] [CrossRef] [Scilit] [PubMed]
  60. Jager, H.I.; Pilla, R.M.; Hansen, C.H.; Matson, P.G.; Iftikhar, B.; Griffiths, N.A. Understanding How Reservoir Operations Influence Methane Emissions: A Conceptual Model. Water 2023, 15, 4112. [Google Scholar] [CrossRef] [Scilit]
  61. He, W.; Luo, J.; Xing, L.; Yu, X.; Zhang, J.; Chen, S. Effects of Temperature-Control Curtain on Algae Biomass and Dissolved Oxygen in a Large Stratified Reservoir: Sanbanxi Reservoir Case Study. J. Environ. Manag. 2019, 248, 109250. [Google Scholar] [CrossRef] [Scilit] [PubMed]
  62. Hu, L.; Xiao, L.; Wang, T. Dynamics of Nitrogen and Phosphorus Release from Submerged Soil–Plant Systems in the Three Gorges Reservoir. Water 2025, 17, 1701. [Google Scholar] [CrossRef] [Scilit]
  63. Mondal, B.; Bauddh, K.; Kumar, A.; Bordoloi, N. India’s Contribution to Greenhouse Gas Emission from Freshwater Ecosystems: A Comprehensive Review. Water 2022, 14, 2965. [Google Scholar] [CrossRef] [Scilit]
  64. Beaulieu, J.J.; DelSontro, T.; Downing, J.A. Eutrophication Will Increase Methane Emissions from Lakes and Impoundments during the 21st Century. Nat. Commun. 2019, 10, 3–7. [Google Scholar] [CrossRef] [Scilit] [PubMed]
  65. León-Palmero, E.; Morales-Baquero, R.; Reche, I. P Inputs Determine Denitrifier Abundance Explaining Dissolved Nitrous Oxide in Reservoirs. Limnol. Oceanogr. 2023, 68, 1734–1749. [Google Scholar] [CrossRef] [Scilit]
  66. Liu, Z.; Mao, X.; Wu, Y.; Xia, L.; Yu, H.; Tang, W.; Qi, Y.; Zhang, Z.; Xiao, F.; Ji, H. Methanogenic Community Characteristics and Its Influencing Factors in Reservoir Sediments on the Northeastern Qinghai Plateau. Biology 2024, 13, 615. [Google Scholar] [CrossRef] [Scilit] [PubMed]
  67. Liang, X.; Xing, T.; Li, J.; Wang, B.; Wang, F.; He, C.; Hou, L.; Li, S. Control of the Hydraulic Load on Nitrous Oxide Emissions from Cascade Reservoirs. Environ. Sci. Technol. 2019, 53, 11745–11754. [Google Scholar] [CrossRef] [Scilit] [PubMed]
  68. Kumar, A.; Kumar, A.; Chaturvedi, A.K.; Joshi, N.; Mondal, R.; Malyan, S.K. Greenhouse Gas Emissions from Hydroelectric Reservoirs: Mechanistic Understanding of Influencing Factors and Future Prospect. Environ. Sci. Pollut. Res. 2025, 32, 7149–7166. [Google Scholar]
Figure 1. Location of the 79 studied hydropower reservoirs in China. Reservoir coordinates, installed capacity, and basin attributes were obtained from the National Energy Administration dam database (https://dam.nea.gov.cn/), and correspond to the year 2020.
Water 18 01610 g001
Figure 2. GHG areal fluxes from the studied reservoirs in China. In the violin plot, the center line represents the median. Violin edges show the 25th and 75th percentiles, and whiskers extend to 1.5× the interquartile range.
Water 18 01610 g002
Figure 3. Carbon intensity (GHG emissions per unit of electricity generation) of the 79 studied reservoirs. Emission estimates are based on the G-res and IMAGE-DGNM models using 2020 input data (see Table 1 for data sources). The intensity values reflect the combined CO2, CH4, and N2O emissions expressed as CO2 equivalents.
Water 18 01610 g003
Figure 4. Correlation analysis of main drivers and carbon intensity. (a) Age (b) elevation. The significance of the trend is given as * p < 0.05, ** p < 0.01, and *** p < 0.001.
Water 18 01610 g004
Figure 5. The characteristic importance of environmental variables to total GHG emissions. P1 is reservoir surface area; P2 is elevation; P3 is catchment area; P4 is sediment depth; P5 is average depth; S1 is reservoir surface soil carbon content; W1 is NH4+ concentration; W2 is dissolved oxygen; W3 is water temperature; W4 is total phosphorus; W5 is Organic nitrogen; W6 is nitrate; C1 is air temperature; C2 is reservoir cumulative horizontal radiance; C3 is annual rainfall.
Water 18 01610 g005
Figure 6. Partial dependency graph of environmental factors and total GHG emissions. (a) Reservoir area; (b) NH4+ concentration; (c) dissolved oxygen; (d) elevation; (e) water temperature; (f) drainage area; (g) total phosphorus; (h) air temperature against GHG emissions.
Water 18 01610 g006
Figure 7. A large amount of farmland within the drainage area of the hydropower station reservoir.
Water 18 01610 g007
Table 1. Summary of input data, sources, temporal coverage, and corresponding references.
DataSourcesYear
River lengthChina Water Statistical Yearbook.2020
Reservoir area[26]2020
Hydropower stations installed capacity and power generationNational Energy Administration (https://dam.nea.gov.cn/)2020
Catchment area, dam heightNational Energy Administration (https://dam.nea.gov.cn/)2020
Mean depth and maximum depth[35,36]2020
NO3 concentration of reservoirs[27,28,29,30,31,32,33,34]Other year
Water temperature, dissolved oxygen, NH4+, total phosphorus and organic nitrogen in reservoirsChina National Environmental Monitoring Centre (http://www.cnemc.cn/)2020
Soil carbon contentWorld Soil Information (https://data.isric.org/geonetwork/srv/)2020
Cumulative global horizontal radianceGeographic Information System Remote Sensing (https://www.gisrsdata.com/)2020
Monthly meteorological dataNational Tibetan Plateau Data Center (https://data.tpdc.ac.cn/)2020
Historical temperature, precipitation, and river flow dataNational Tibetan Plateau Data Center (https://data.tpdc.ac.cn/)2020
Density of sediments, total benthic sediments[37]2020
Disclaimer/Publisher’s Note: The statements, opinions and data contained in all publications are solely those of the individual author(s) and contributor(s) and not of MDPI and/or the editor(s). MDPI and/or the editor(s) disclaim responsibility for any injury to people or property resulting from any ideas, methods, instructions or products referred to in the content.