1. Introduction
Landslides are among the most damaging geological hazards in mountainous and tectonically active regions, posing serious threats to infrastructure, settlements, transportation corridors, reservoirs, and lifeline engineering systems. Landslide hazard and risk assessment commonly require not only identifying where slope failures may initiate, but also estimating how far failed materials may travel after detachment [
1,
2,
3,
4]. Therefore, landslide run-out distance is a key parameter for hazard zoning and risk assessment. Accurate estimation of run-out distance helps delineate potential impact zones and supports risk-informed decision-making in landslide-prone areas.
The run-out process of landslides is controlled by multiple interacting factors, including source-region geometry, elevation difference, failure volume, slope angle, material properties, terrain confinement, and energy dissipation mechanisms. Early studies of long-run-out landslides emphasized the roles of apparent friction, mobility scaling, granular flow behavior, and self-lubrication mechanisms [
5,
6,
7]. Numerical and physically based methods have also been widely used to simulate landslide stability and post-failure run-out processes [
8,
9,
10,
11]. In parallel, empirical and statistical relationships have been developed to estimate run-out distance from landslide geometry and volume-related parameters [
12,
13,
14,
15,
16]. These studies have provided important insights into landslide mobility and have supported operational run-out estimation and hazard zoning [
17,
18,
19].
Rainfall-induced and earthquake-induced landslides are both affected by source-region geometry and slope conditions, such as elevation difference, source area, source volume, and mean slope angle. However, their triggering mechanisms are fundamentally different. Rainfall-induced landslides are often associated with infiltration, pore-water pressure increase, suction loss, and slope-strength reduction [
20,
21,
22]. Numerous studies have investigated rainfall-induced landslide initiation, susceptibility, and post-failure behavior using hydrological analysis, numerical modeling, physical experiments, and data-driven approaches [
23,
24,
25,
26,
27,
28]. For example, Mondini et al. (2023) developed a deep-learning framework for forecasting rainfall-induced shallow landslides, demonstrating the potential of data-driven models for event-based landslide prediction [
29]. Recent advances in remote sensing and machine learning have further improved the forecasting and mapping of rainfall-induced shallow landslides [
30,
31].
In contrast, earthquake-induced landslides are related to seismic shaking, dynamic disturbance, coseismic weakening, and spatially extensive slope destabilization. These processes may produce larger source regions and broader run-out domains than rainfall-induced events. For instance, Hibert et al. (2025) used machine-learning methods to estimate the volume and run-out of seismogenic landslides, highlighting the importance of data-driven modeling for earthquake-induced landslide- mobility assessment [
32]. Other recent studies have also examined seismic or post-seismic landslide run-out using numerical and artificial-intelligence-based approaches [
11,
33]. As a result, rainfall-induced and earthquake-induced landslides may differ not only in absolute scale, but also in normalized mobility, scaling behavior, tail-risk characteristics, and prediction reliability.
Data-driven methods have increasingly been used for the prediction of landslide susceptibility, run-out path, and run-out distance. Machine-learning models, such as Random Forest, gradient boosting methods, XGBoost, and LightGBM, have shown strong predictive ability in landslide-related applications [
34,
35,
36,
37]. For run-out modeling, several studies have demonstrated the value of data-driven approaches. For example, Xu et al. (2019) compared multiple data-driven models for estimating loess landslide run-out distance and showed that machine-learning methods can capture nonlinear relationships between run-out distance and controlling factors [
38]. Ju et al. (2022) proposed a terrain-matching-targeted machine-learning approach to predict landslide run-out paths, highlighting the role of terrain information in data-driven run-out analysis [
39]. More recently, Giarola et al. (2024) developed a data-driven method for estimating shallow landslide run-out, further demonstrating the applicability of machine learning to regional-scale run-out assessment [
40].
Uncertainty-aware run-out modeling has also received increasing attention. Ma et al. (2022) quantified uncertainty in landslide run-out motion by considering soil anisotropy and fabric orientation, while Sun et al. (2023) developed a Bayesian framework for simple run-out distance models of loess landslides [
41,
42]. Zhang et al. (2023) further evaluated run-out uncertainty by considering the anisotropic scale of fluctuation in spatially variable friction angle [
43]. In parallel, quantile regression and conformalized quantile regression provide general frameworks for constructing prediction intervals and evaluating coverage reliability [
44,
45,
46,
47,
48]. These developments indicate that uncertainty quantification is becoming an important component of landslide run-out prediction, particularly for hazard zoning and risk-informed decision-making.
Despite these advances, most existing data-driven landslide run-out studies evaluate model performance within a single landslide inventory or under a single triggering mechanism. Although such validation is useful for assessing within-inventory accuracy, it does not directly test whether a model can be transferred across different triggering mechanisms. This represents a domain-shift or out-of-distribution prediction problem in geohazard machine learning, as rainfall-induced and earthquake-induced landslide inventories may differ substantially in terms of feature distribution, mobility indicators, and scaling relationships. Consequently, a model trained on one trigger type may produce systematic bias when applied to another, even if it performs well within the source inventory. This issue is also important for uncertainty quantification. Conformal and quantile-based prediction intervals generally rely on calibration data that are representative of the target distribution [
49,
50,
51,
52]. Therefore, uncertainty estimates calibrated within one inventory may become unreliable under cross-trigger domain shift. However, the transferability of landslide run-out models and the reliability of their uncertainty estimates across different triggering mechanisms remain insufficiently explored. This constitutes the specific research gap addressed in the present study.
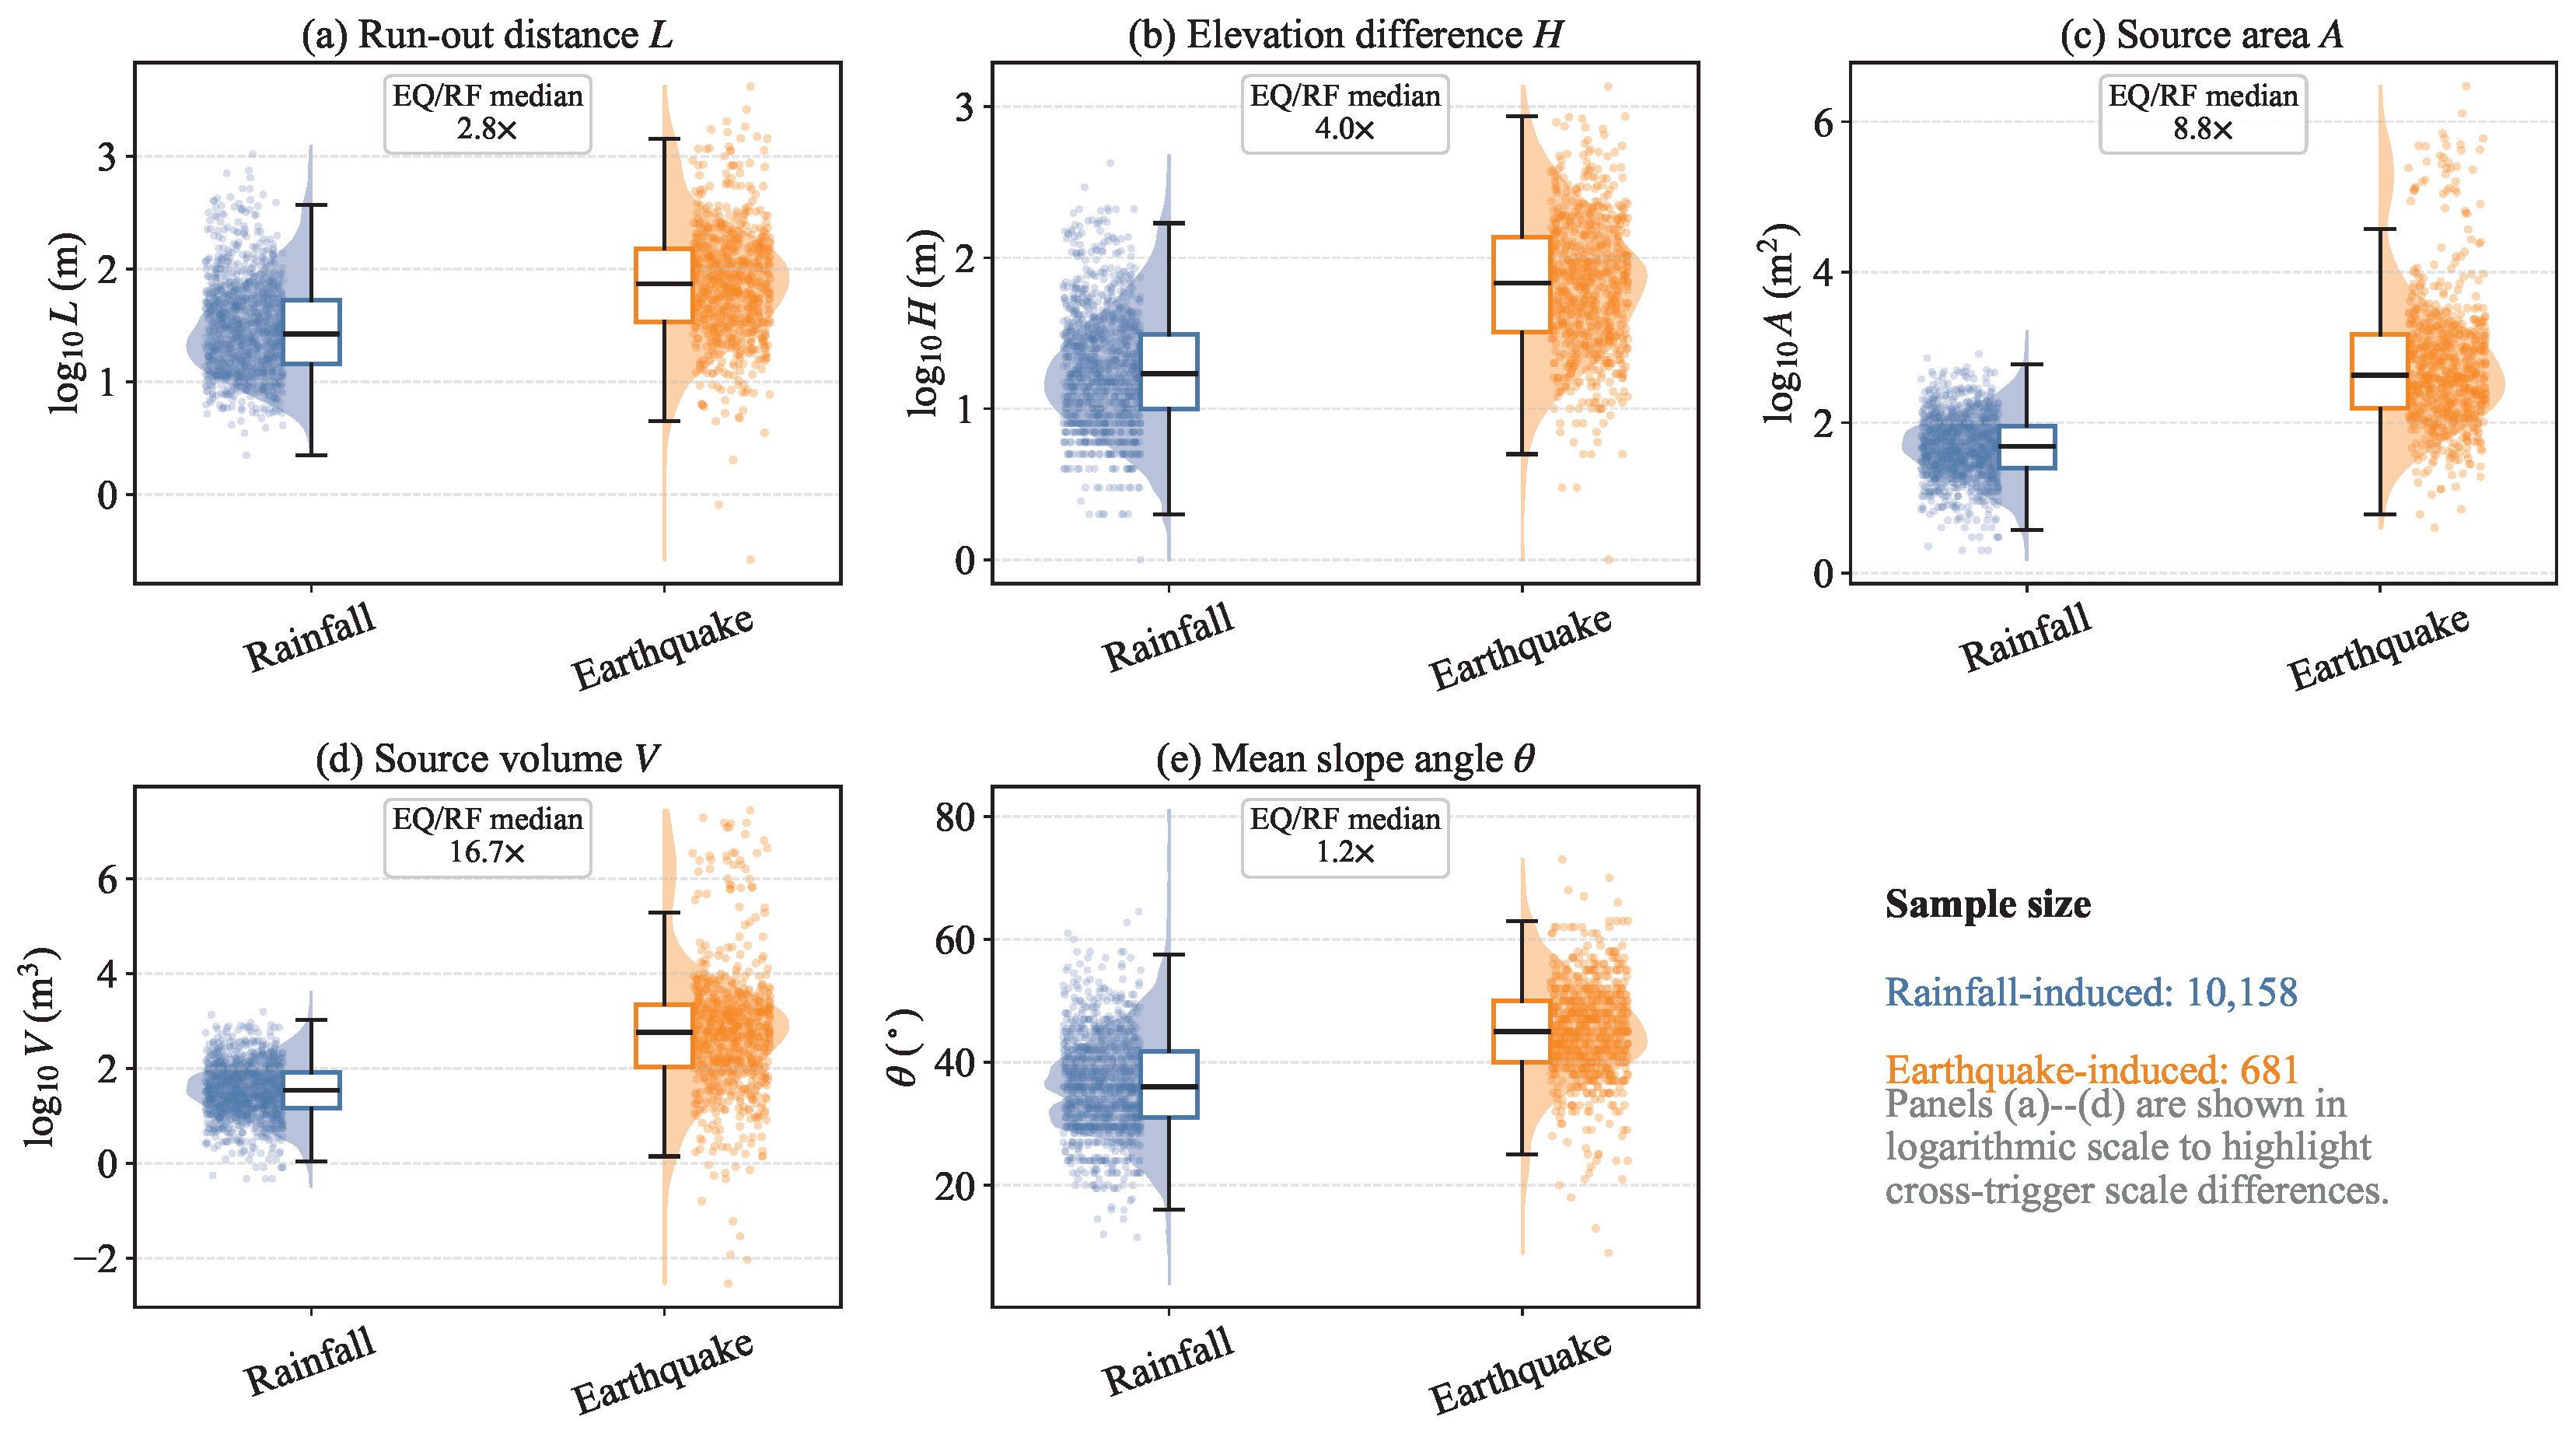
To address these gaps, this study investigates trigger-dependent run-out behavior and cross-trigger transferability between rainfall-induced and earthquake-induced landslides using a harmonized inventory containing 10,158 rainfall-induced and 681 earthquake-induced records. Five common geometric descriptors, namely run-out distance L, elevation difference H, source area A, source volume V, and mean slope angle , are used for distributional comparison, mobility analysis, scaling-law modeling, machine-learning prediction, tail-risk assessment, and uncertainty quantification. Trigger-aware and trigger-interaction scaling-law models are constructed to test whether the two trigger types share the same conditional run-out relationship. Log-linear regression, Random Forest, HistGBR, and LightGBM models are then evaluated under within-trigger, cross-trigger, pooled, trigger-aware, and trigger-interaction settings. The R→R and E→E experiments assess within-trigger prediction performance, whereas the R→E and E→R experiments quantify cross-trigger transferability degradation and systematic prediction bias. Finally, threshold-based long-run-out metrics and conformalized quantile regression are used to evaluate tail-risk identification and uncertainty reliability under cross-trigger domain shift.
3. Methodology
3.1. Problem Formulation and Data Transformation
The objective of landslide run-out prediction is to estimate the run-out distance
L from source-region geometric descriptors and trigger information. For machine-learning prediction, the response variable and strongly right-skewed geometric predictors are transformed using
to reduce the influence of heavy-tailed distributions and improve numerical stability. The prediction problem is formulated as
where
is the transformed run-out distance, and
is the binary trigger indicator defined in
Section 2. Because
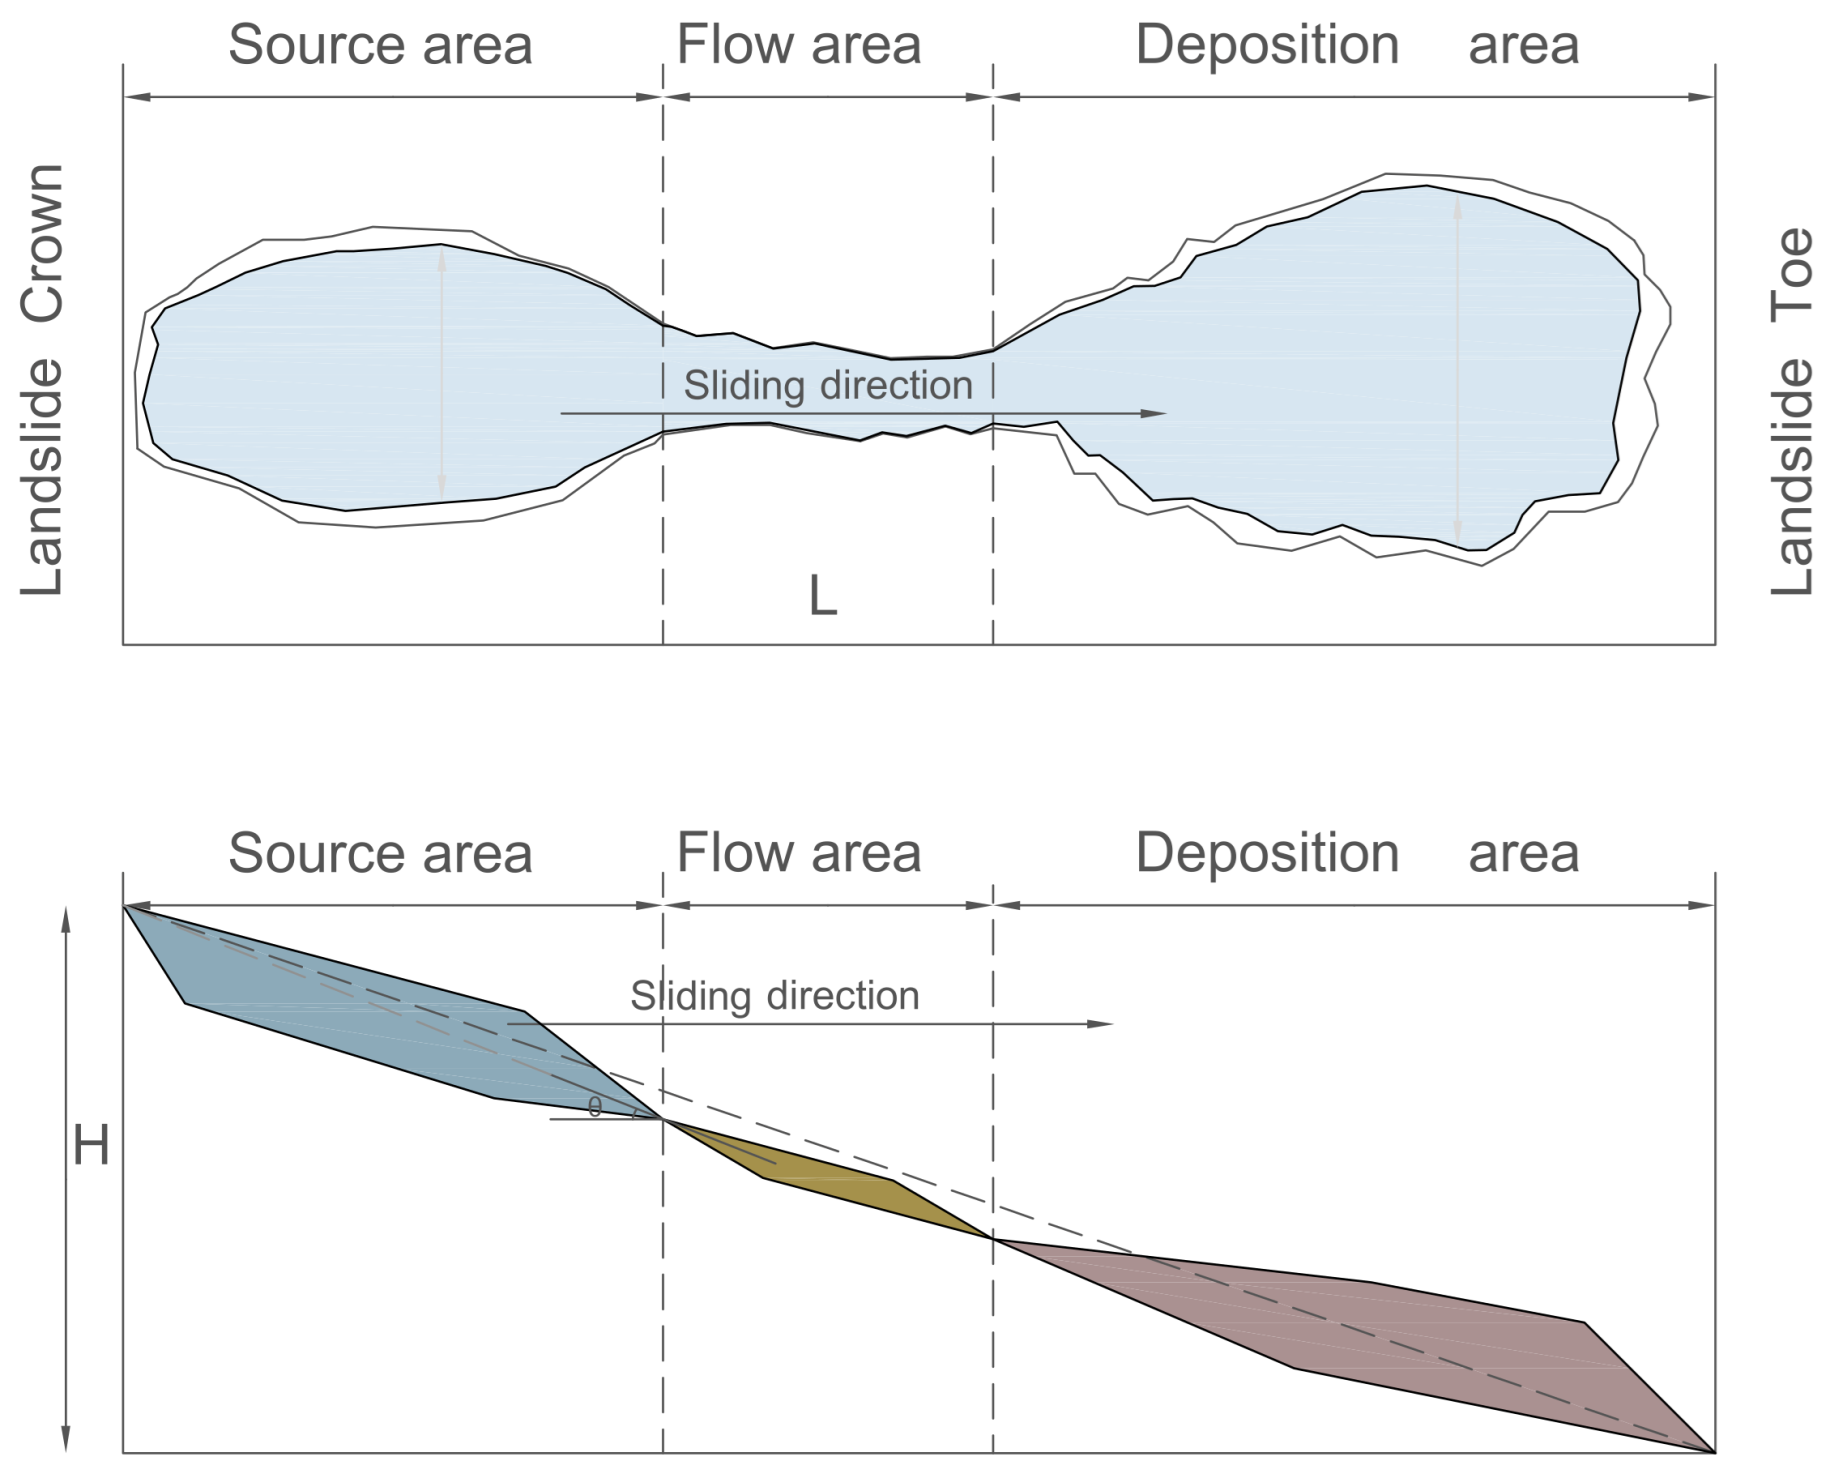
H is measured between the source region and the observed distal deposit boundary, it partly reflects post-event run-out geometry. Therefore, models using
H belongs to empirical run-out scaling models based on mapped landslide inventories rather than fully prospective prediction models.
After prediction, the estimated run-out distance is transformed back to the original scale as
This transformation is used for the predictive models and evaluation. For the scaling-law analysis, ordinary logarithmic transformations of positive-valued variables are also used to preserve the conventional interpretation of power-law-type relationships between run-out distance and geometric variables.
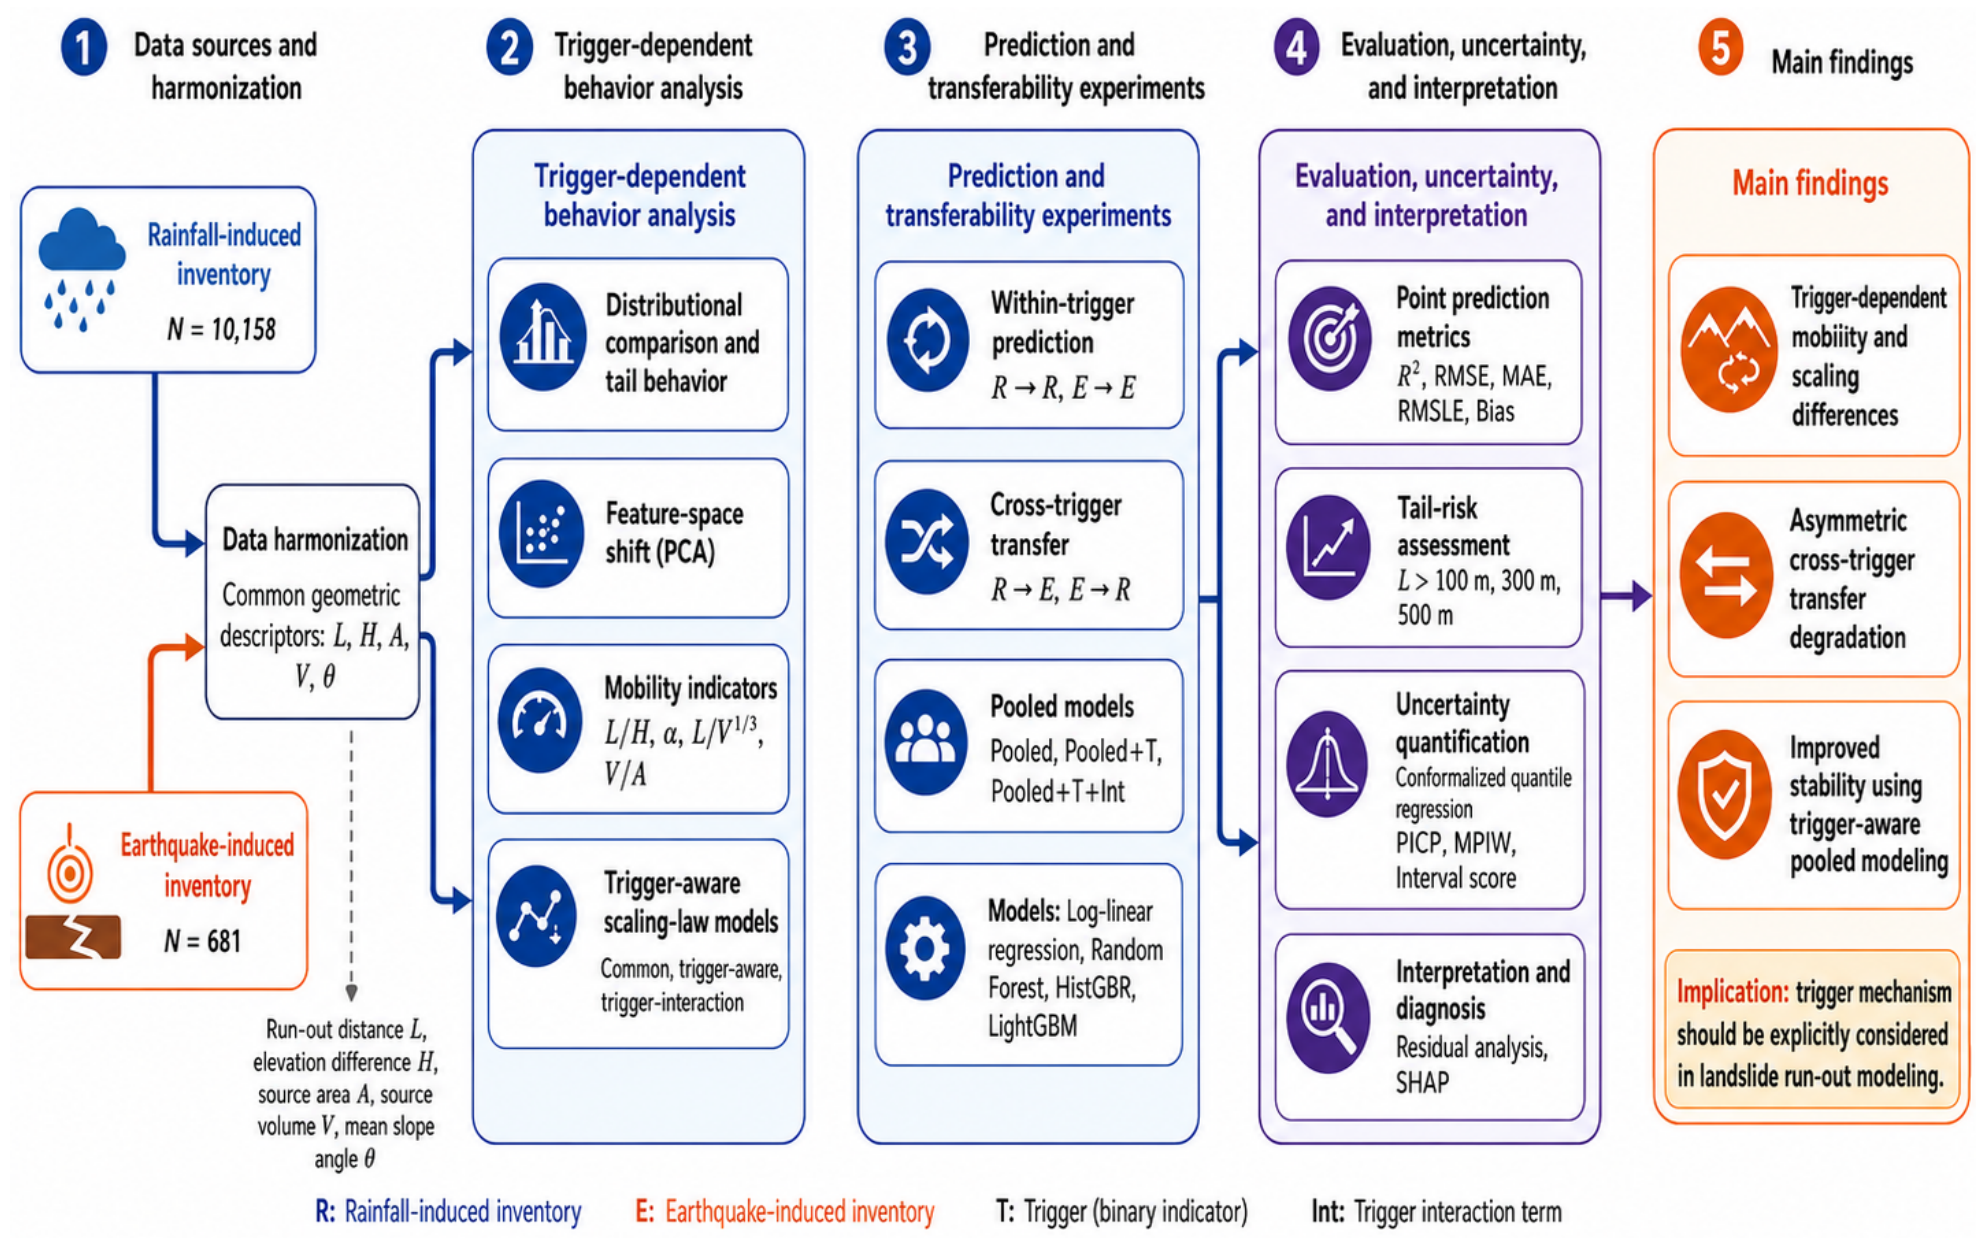
The overall workflow of this study includes data harmonization, cross-trigger distributional analysis, mobility-indicator comparison, trigger-aware scaling-law modeling, within-trigger and cross-trigger prediction, tail-risk evaluation, uncertainty quantification, and residual-based transferability diagnosis. The workflow is summarized in
Figure 3.
3.2. Mobility Indicators and Trigger-Aware Scaling-Law Models
To compare run-out mobility between rainfall-induced and earthquake-induced landslides, four mobility-related indicators are defined as follows:
Here, represents the run-out mobility ratio, is the apparent travel angle, is the volume-normalized run-out distance, and is an effective thickness proxy. These indicators are used to quantify trigger-dependent differences in relative mobility and source-region geometry.
To examine whether rainfall-induced and earthquake-induced landslides follow the same run-out scaling relationship, three log-linear scaling-law models are constructed. The first model is a common scaling model, which assumes that both trigger types share the same relationship between run-out distance and geometric predictors:
The second model is a trigger-aware scaling model, in which the trigger indicator
is introduced to test whether the two trigger types differ in their overall run-out level after controlling for geometric predictors:
The third model is a trigger-interaction scaling model, which further introduces interaction terms between the trigger indicator and the geometric variables:
Here, denotes rainfall-induced landslides and denotes earthquake-induced landslides. The coefficient measures the trigger-dependent intercept shift, while , , , and measure trigger-dependent changes in the scaling coefficients. If the trigger-aware or trigger-interaction models improve model fit relative to the common scaling model, this indicates that the two trigger types do not fully share the same run-out scaling relationship.
3.3. Prediction Models and Feature Configurations
Both interpretable regression models and tree-based machine-learning models are used for run-out prediction. The evaluated models include log-linear regression, Random Forest, histogram-based gradient boosting regression (HistGBR), and LightGBM. These models are selected to compare a simple interpretable baseline with nonlinear ensemble learners.
Three feature configurations are considered, as summarized in
Table 2. The base log-geometry configuration uses only transformed geometric predictors. The trigger-aware configuration further includes the trigger indicator
T. The trigger-interaction configuration includes interaction terms between
T and the transformed geometric predictors, allowing the model to learn trigger-dependent predictor effects.
The comparison among these configurations is used to determine whether explicit trigger information and trigger-variable interactions improve prediction performance and transferability. No additional hyperparameter optimization was performed in this study. The machine-learning models were implemented using their default hyperparameter settings. This design was adopted to keep the comparison focused on cross-trigger transferability and to avoid introducing additional variability caused by model-specific tuning procedures.
3.4. Cross-Trigger Transfer Experiments and Imbalance Treatment
The core experimental design evaluates prediction performance under within-trigger, cross-trigger, and pooled modeling settings. To reduce the dependence of model evaluation on a single random split, all within-trigger, cross-trigger, and pooled experiments were repeated over 50 random 80:20 train–test splits. For each split, rainfall-induced and earthquake-induced inventories were partitioned separately to preserve the same target test sets across transfer settings. The reported metrics are the mean and standard deviation over repeated splits.
The experimental settings are summarized in
Table 3. The within-trigger experiments, R→R and E→E, evaluate model performance when training and testing samples are drawn from the same trigger type. The cross-trigger experiments, R→E and E→R, evaluate whether a model trained on one triggering mechanism can be transferred to the other. Pooled models are used to evaluate mixed-inventory prediction with and without explicit trigger information.
It should be noted that the cross-trigger experiments are also influenced by the sample-size imbalance between the two inventories. In R→E, the model is trained on the much larger rainfall-induced inventory but tested on the smaller earthquake-induced inventory with a broader feature domain, so the results may involve extrapolation to larger-scale landslides. In E→R, the model is trained on the smaller earthquake-induced inventory, and the results may be affected by the limited training-sample size. Therefore, the cross-trigger results are interpreted as reflecting both trigger-associated domain shift and sample-size imbalance. Because the rainfall-induced inventory is much larger than the earthquake-induced inventory, sample imbalance is further considered in pooled modeling. Three pooled training strategies are compared. The first uses the original unbalanced pooled training set. The second uses balanced training, and the rainfall-induced training subset is randomly downsampled to match the number of earthquake-induced training samples. The third uses sample-weighted training, and each sample is weighted in a way that is inversely proportional to the sample size of its trigger group and the weights are normalized to have unit mean. This comparison is used to examine whether pooled models are dominated by the larger rainfall-induced inventory.
3.5. Evaluation Metrics, Tail-Risk Analysis, and Uncertainty Quantification
Point prediction performance is evaluated on the original run-out distance scale using the coefficient of determination
, root mean squared error (RMSE), mean absolute error (MAE), root mean squared logarithmic error (RMSLE), and bias:
Tail-risk performance is evaluated using threshold-based long-run-out events:
For each threshold, landslides are classified as long-run-out or non-long-run-out events based on the observed and predicted run-out distances. The corresponding metrics include recall, precision, F1-score, and false negative rate:
Here, TP, FP, and FN denote true positives, false positives, and false negatives, respectively.
In addition to point prediction, probabilistic prediction is performed to evaluate whether prediction intervals remain reliable under cross-trigger transfer. Quantile regression combined with conformalized quantile regression (CQR) is used to construct prediction intervals. The CQR procedure is performed in the log-transformed response space. Let
and
denote the lower and upper quantile predictions for a given input vector
x. For each calibration sample, the nonconformity score is defined as
The conformal correction
is computed as the empirical
quantile of the calibration scores. The conformal prediction interval in the transformed space is
The interval bounds are then transformed back to the original run-out distance scale using the inverse logarithmic transformation. Prediction-interval reliability is evaluated using prediction-interval-coverage probability (PICP), mean prediction-interval width (MPIW), and interval score:
For a nominal coverage level of
, the interval score is defined as
A nominal 90% prediction interval is used in this study. Under within-trigger prediction, calibration and testing samples are drawn from the same trigger type. Under cross-trigger transfer, calibration and testing distributions differ, allowing the effect of trigger-induced domain shift on uncertainty reliability to be explicitly evaluated.
3.6. Residual Diagnosis and SHAP-Based Model Interpretation
To diagnose transfer-related prediction bias, residuals were analyzed in the transformed response space
where positive and negative residuals indicate overprediction and underprediction, respectively. Residuals were examined against observed run-out distance, source volume, and the first principal component of the standardized feature space.
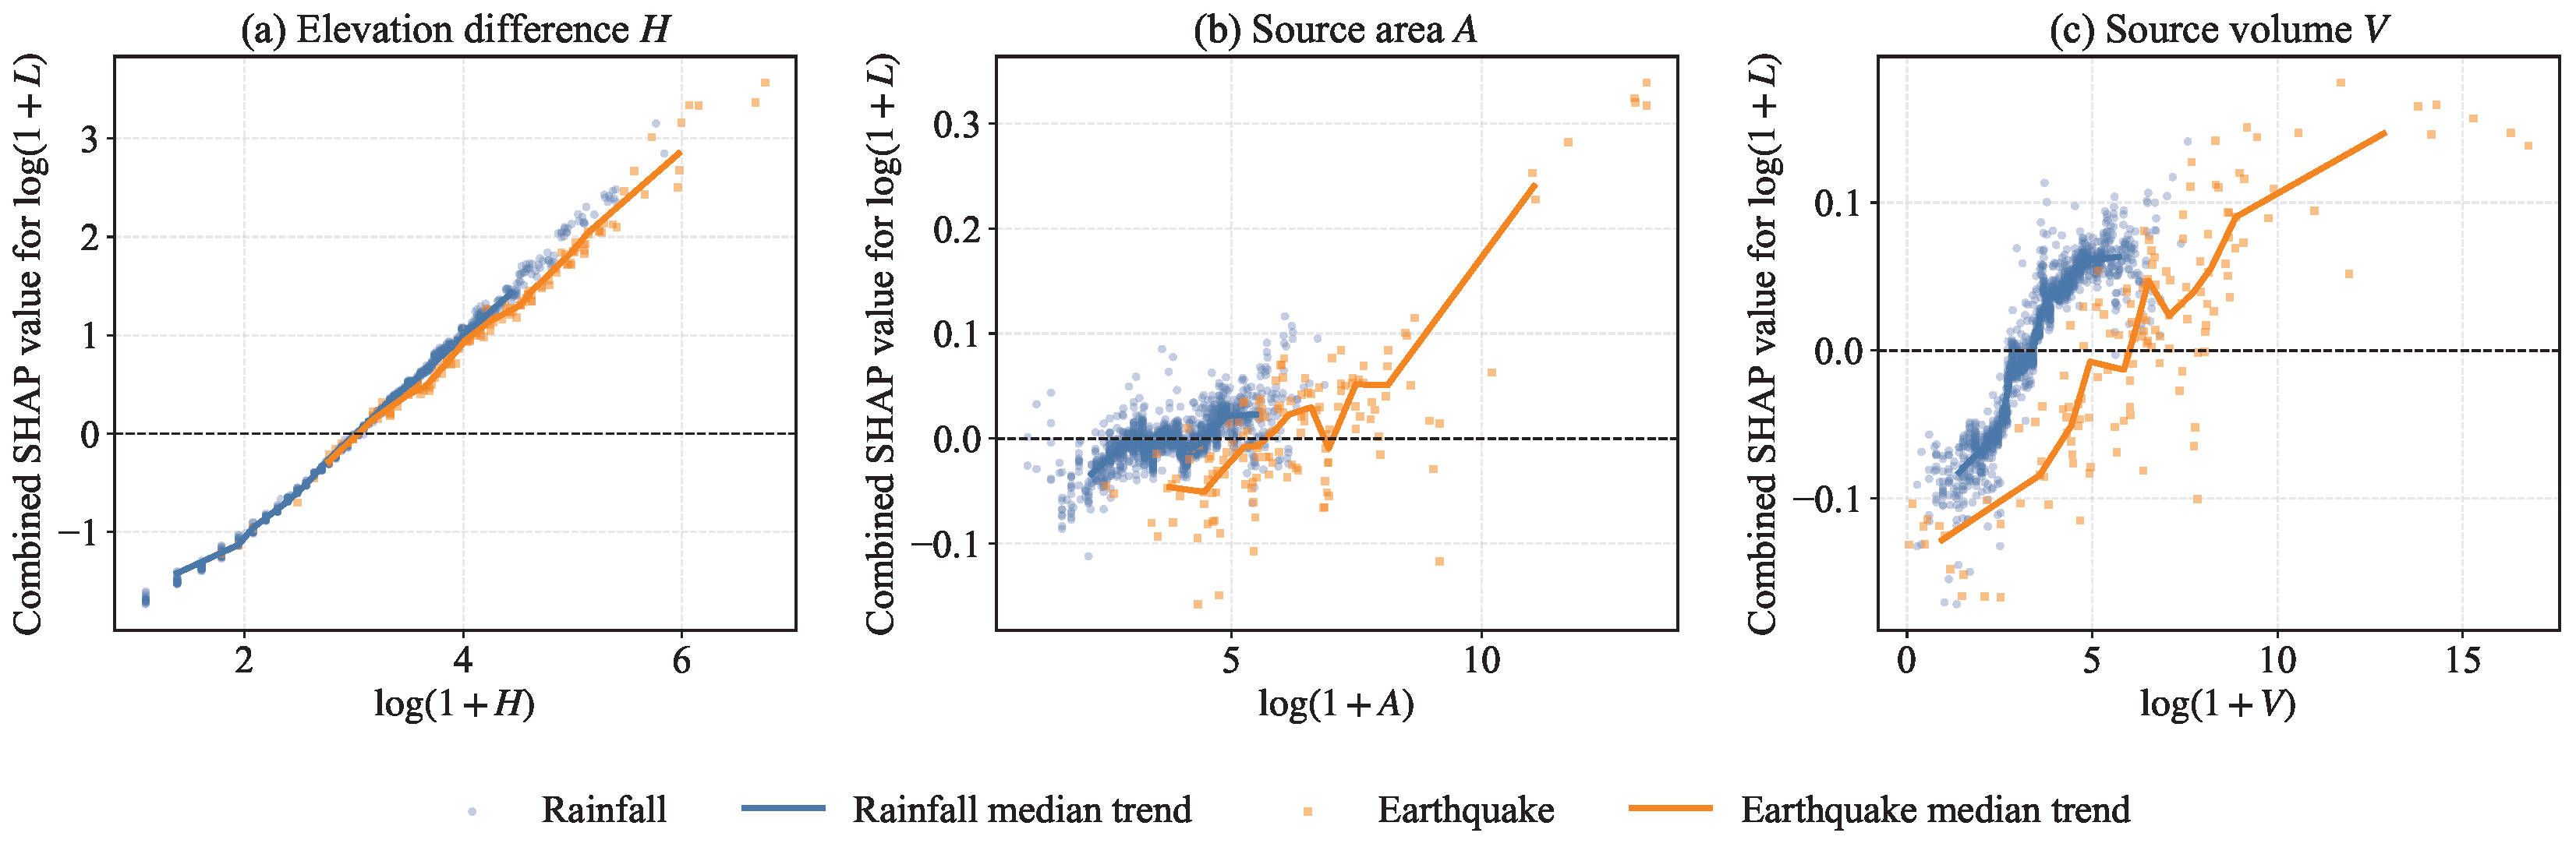
To further interpret the pooled trigger-interaction model, SHAP analysis was conducted for the representative LightGBM model. SHAP values were computed in the transformed response space, corresponding to contributions to predicted . For models with trigger-interaction terms, the SHAP value of each interaction term was combined with the corresponding original geometric predictor to obtain the total contribution of each physical variable.
4. Results
4.1. Cross-Trigger Tail Behavior and Feature-Space Shift
Building on the basic scale differences identified in
Section 2, this subsection further examines whether rainfall-induced and earthquake-induced landslides differ in terms of run-out tail behavior, geometric scaling patterns, and multivariate feature-space structure.
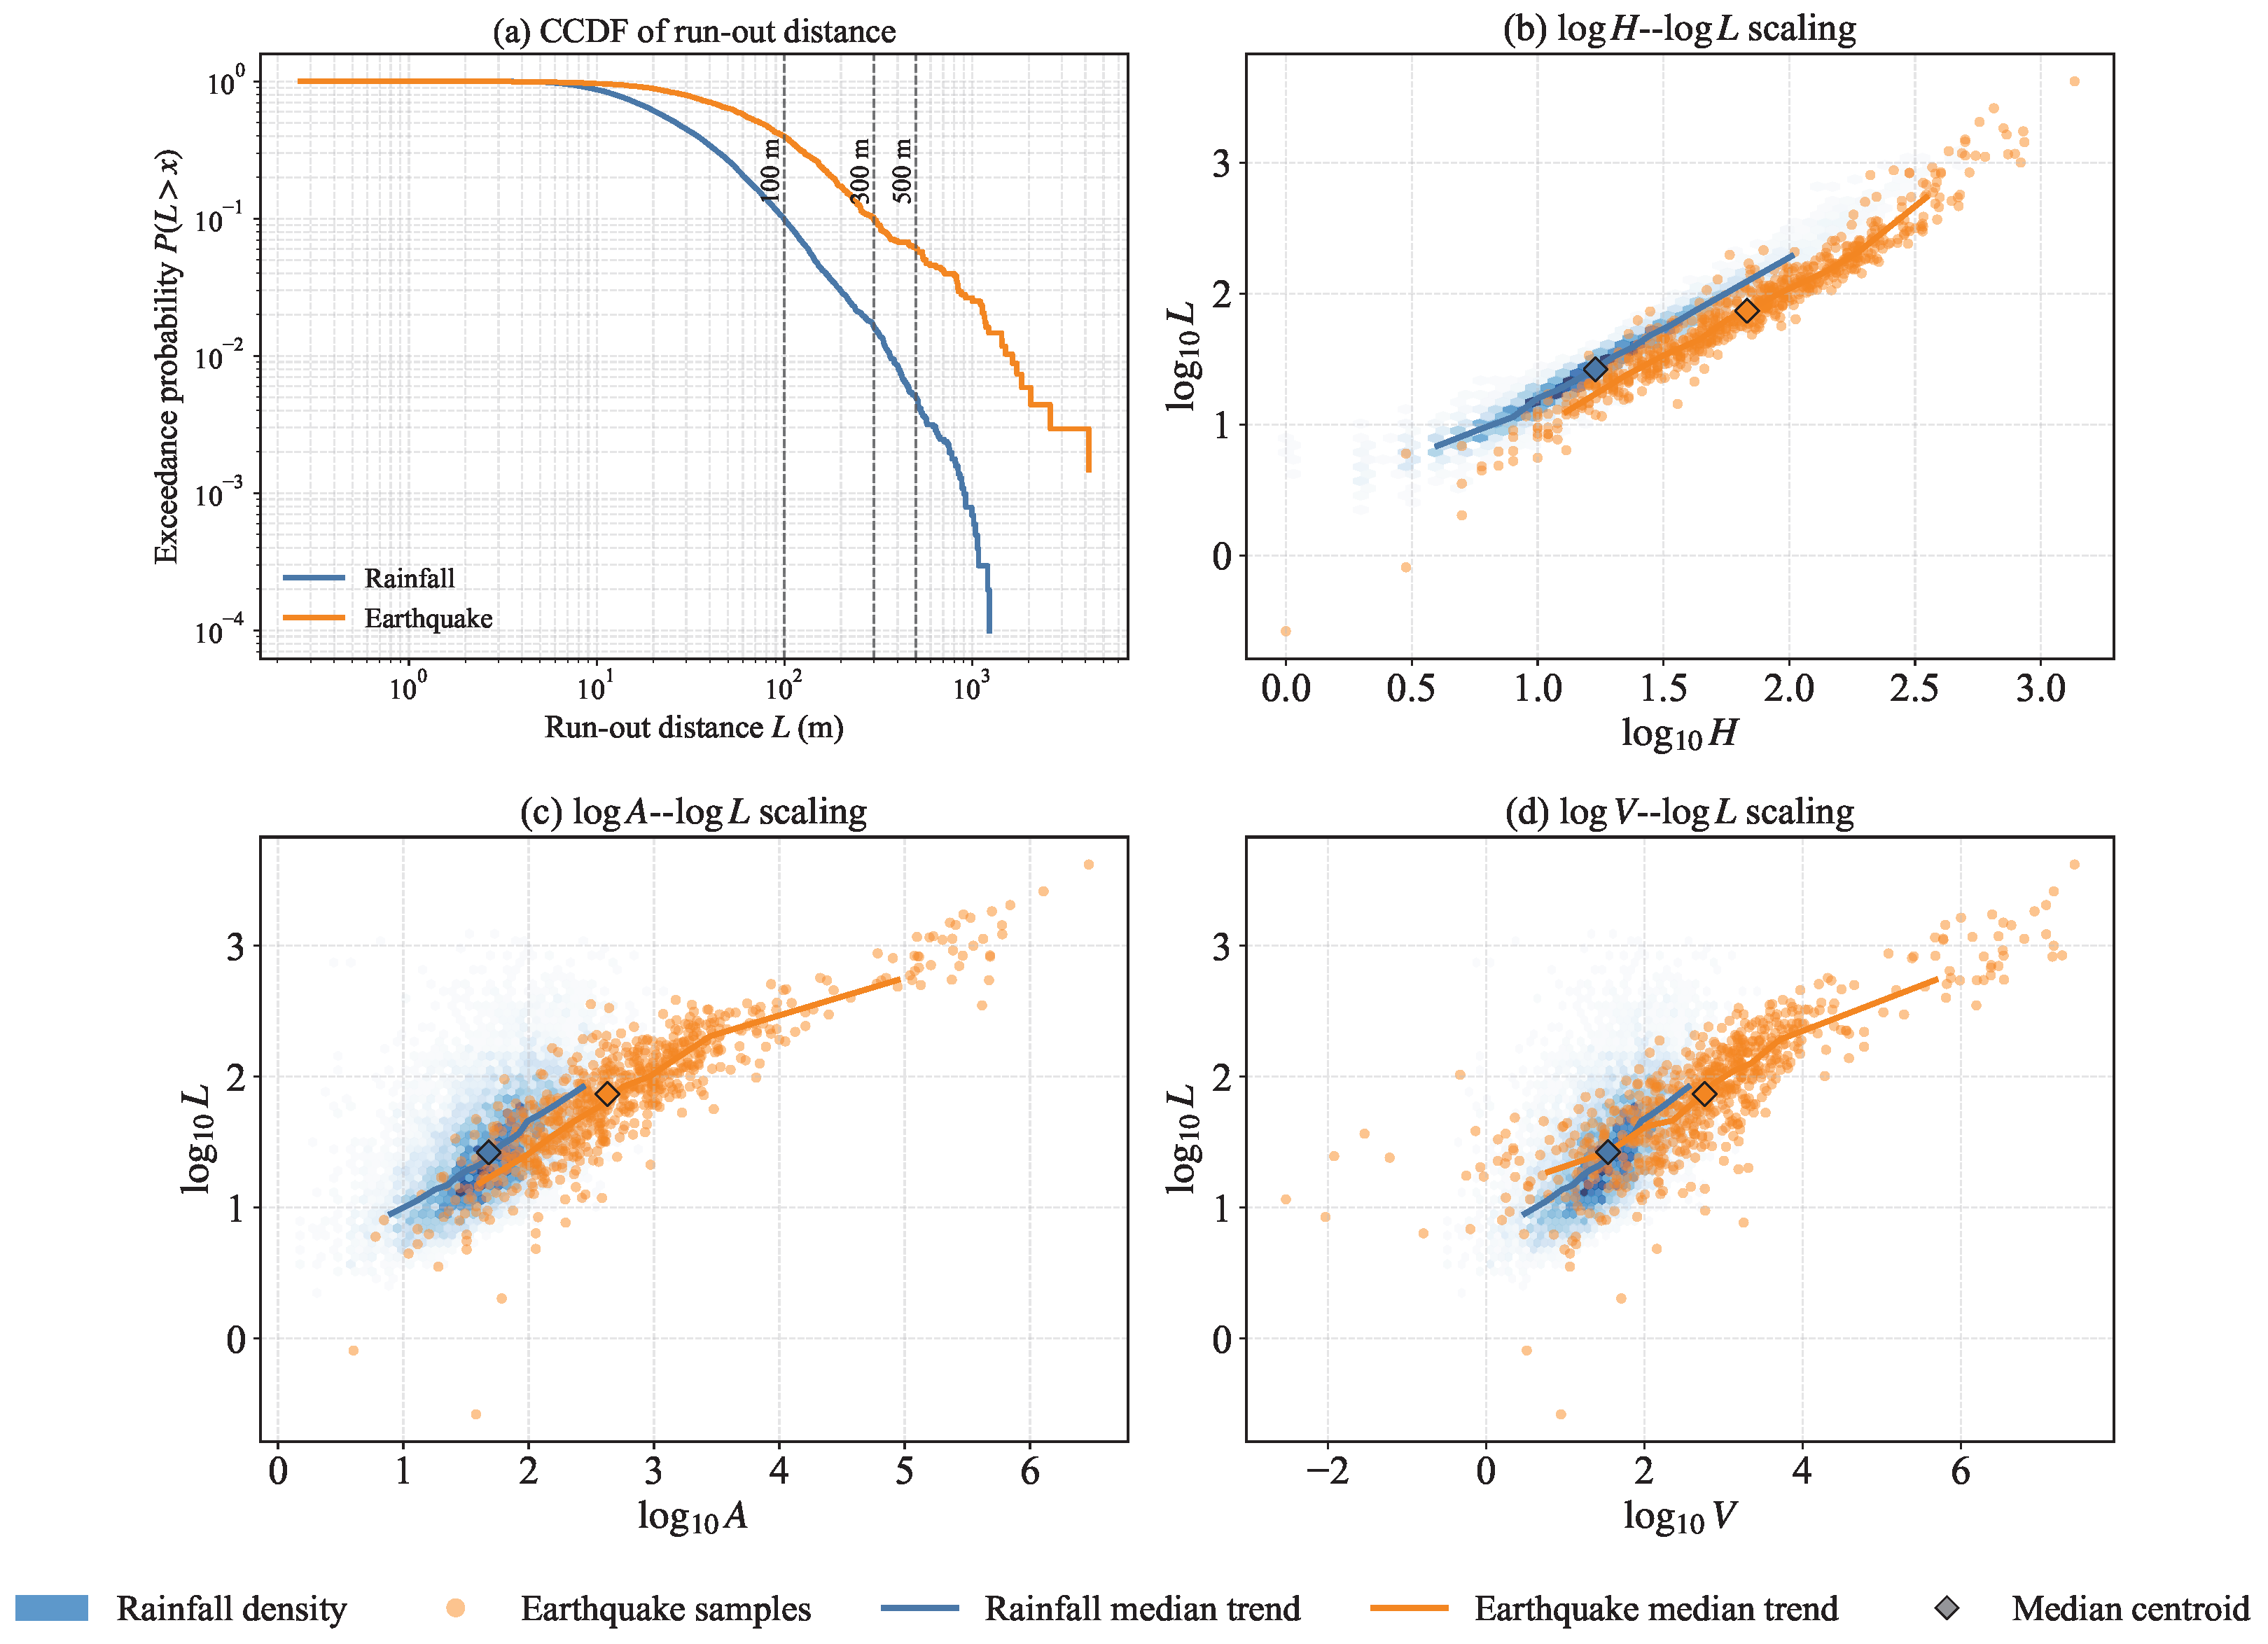
Figure 4 shows the upper-tail behavior and trigger-dependent scaling patterns of run-out distance. The complementary cumulative-distribution function indicates that earthquake-induced landslides have a substantially heavier run-out tail than rainfall-induced landslides. For the threshold
m, only 9.82% of rainfall-induced landslides exceed this value, whereas 39.35% of earthquake-induced landslides exceed it. For
m, the exceedance probabilities are 1.60% and 9.69%, respectively. For
m, only 0.49% of rainfall-induced cases exceed the threshold, compared with 6.02% of earthquake-induced cases. Therefore, fixed long-run-out thresholds have different statistical meanings for the two trigger types. In particular,
m already represents an upper-tail event for rainfall-induced landslides, whereas nearly 40% of earthquake-induced landslides exceed this threshold.
The log-scale scaling plots show positive relationships between run-out distance and the geometric predictors H, A, and V for both trigger types. However, rainfall-induced landslides are mainly concentrated in the lower-left region of the log-scale predictor–response space, whereas earthquake-induced landslides extend toward larger values of H, A, V, and L. This pattern confirms that the rainfall-induced inventory mainly represents smaller-scale events, while the earthquake-induced inventory covers a broader and larger-scale domain. The different locations and ranges of the two trigger types suggest that a model trained on one inventory may not be directly transferable to the other without accounting for cross-trigger domain shift.
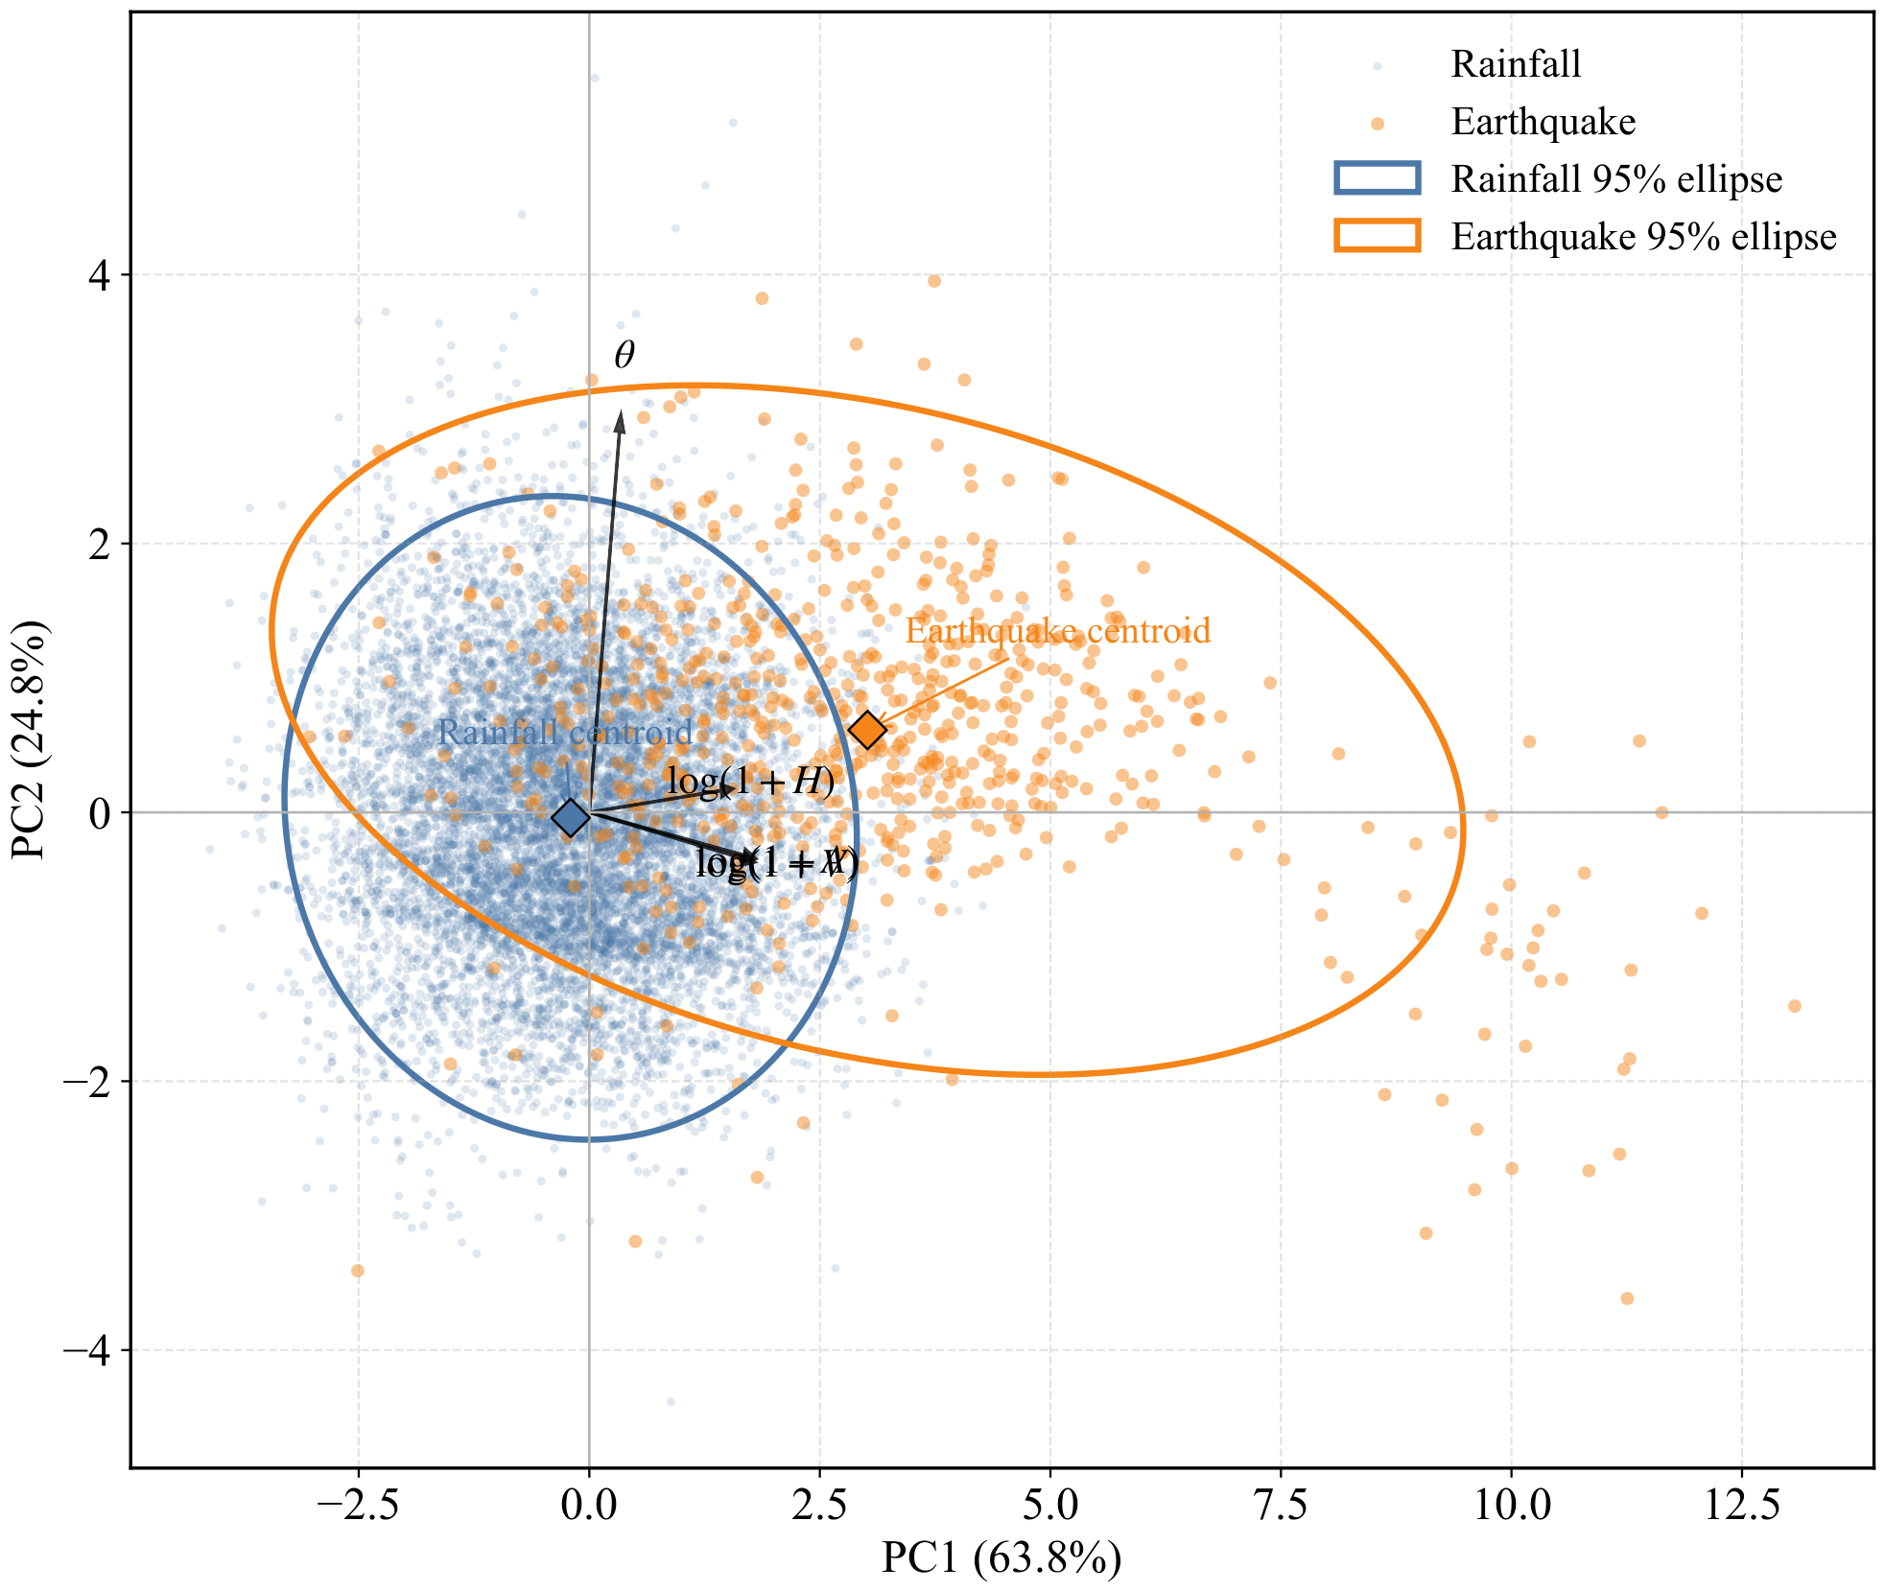
Figure 5 presents a principal component analysis based on standardized
,
,
, and
. The first two principal components explain 88.59% of the total variance, with PC1 explaining 63.84% and PC2 explaining 24.76%. The loading directions indicate that PC1 is mainly associated with the geometric scale variables
H,
A, and
V, whereas PC2 is more strongly related to the slope angle
. The PCA results show that the rainfall-induced and earthquake-induced samples only partially overlap in the multivariate predictor space. The rainfall-induced samples are concentrated around a smaller-scale domain, while the earthquake-induced samples are shifted toward higher PC1 values, consistent with their larger
H,
A, and
V values. The separation between the group centroids and the different confidence ellipses provides direct evidence of cross-trigger feature-space mismatch. Overall, the two inventories differ not only in terms of marginal scale distributions, but also in terms of upper-tail behavior, predictor–response scaling patterns, and multivariate feature-space structure.
4.2. Trigger-Dependent Mobility and Scaling Relationships
After identifying cross-trigger differences in absolute scale, tail behavior, and feature-space structure, this subsection further examines whether rainfall-induced and earthquake-induced landslides differ in terms of normalized run-out mobility and conditional scaling relationships. Four mobility indicators were considered: the run-out mobility ratio , the apparent travel angle , the volume-normalized run-out distance , and the effective thickness proxy .
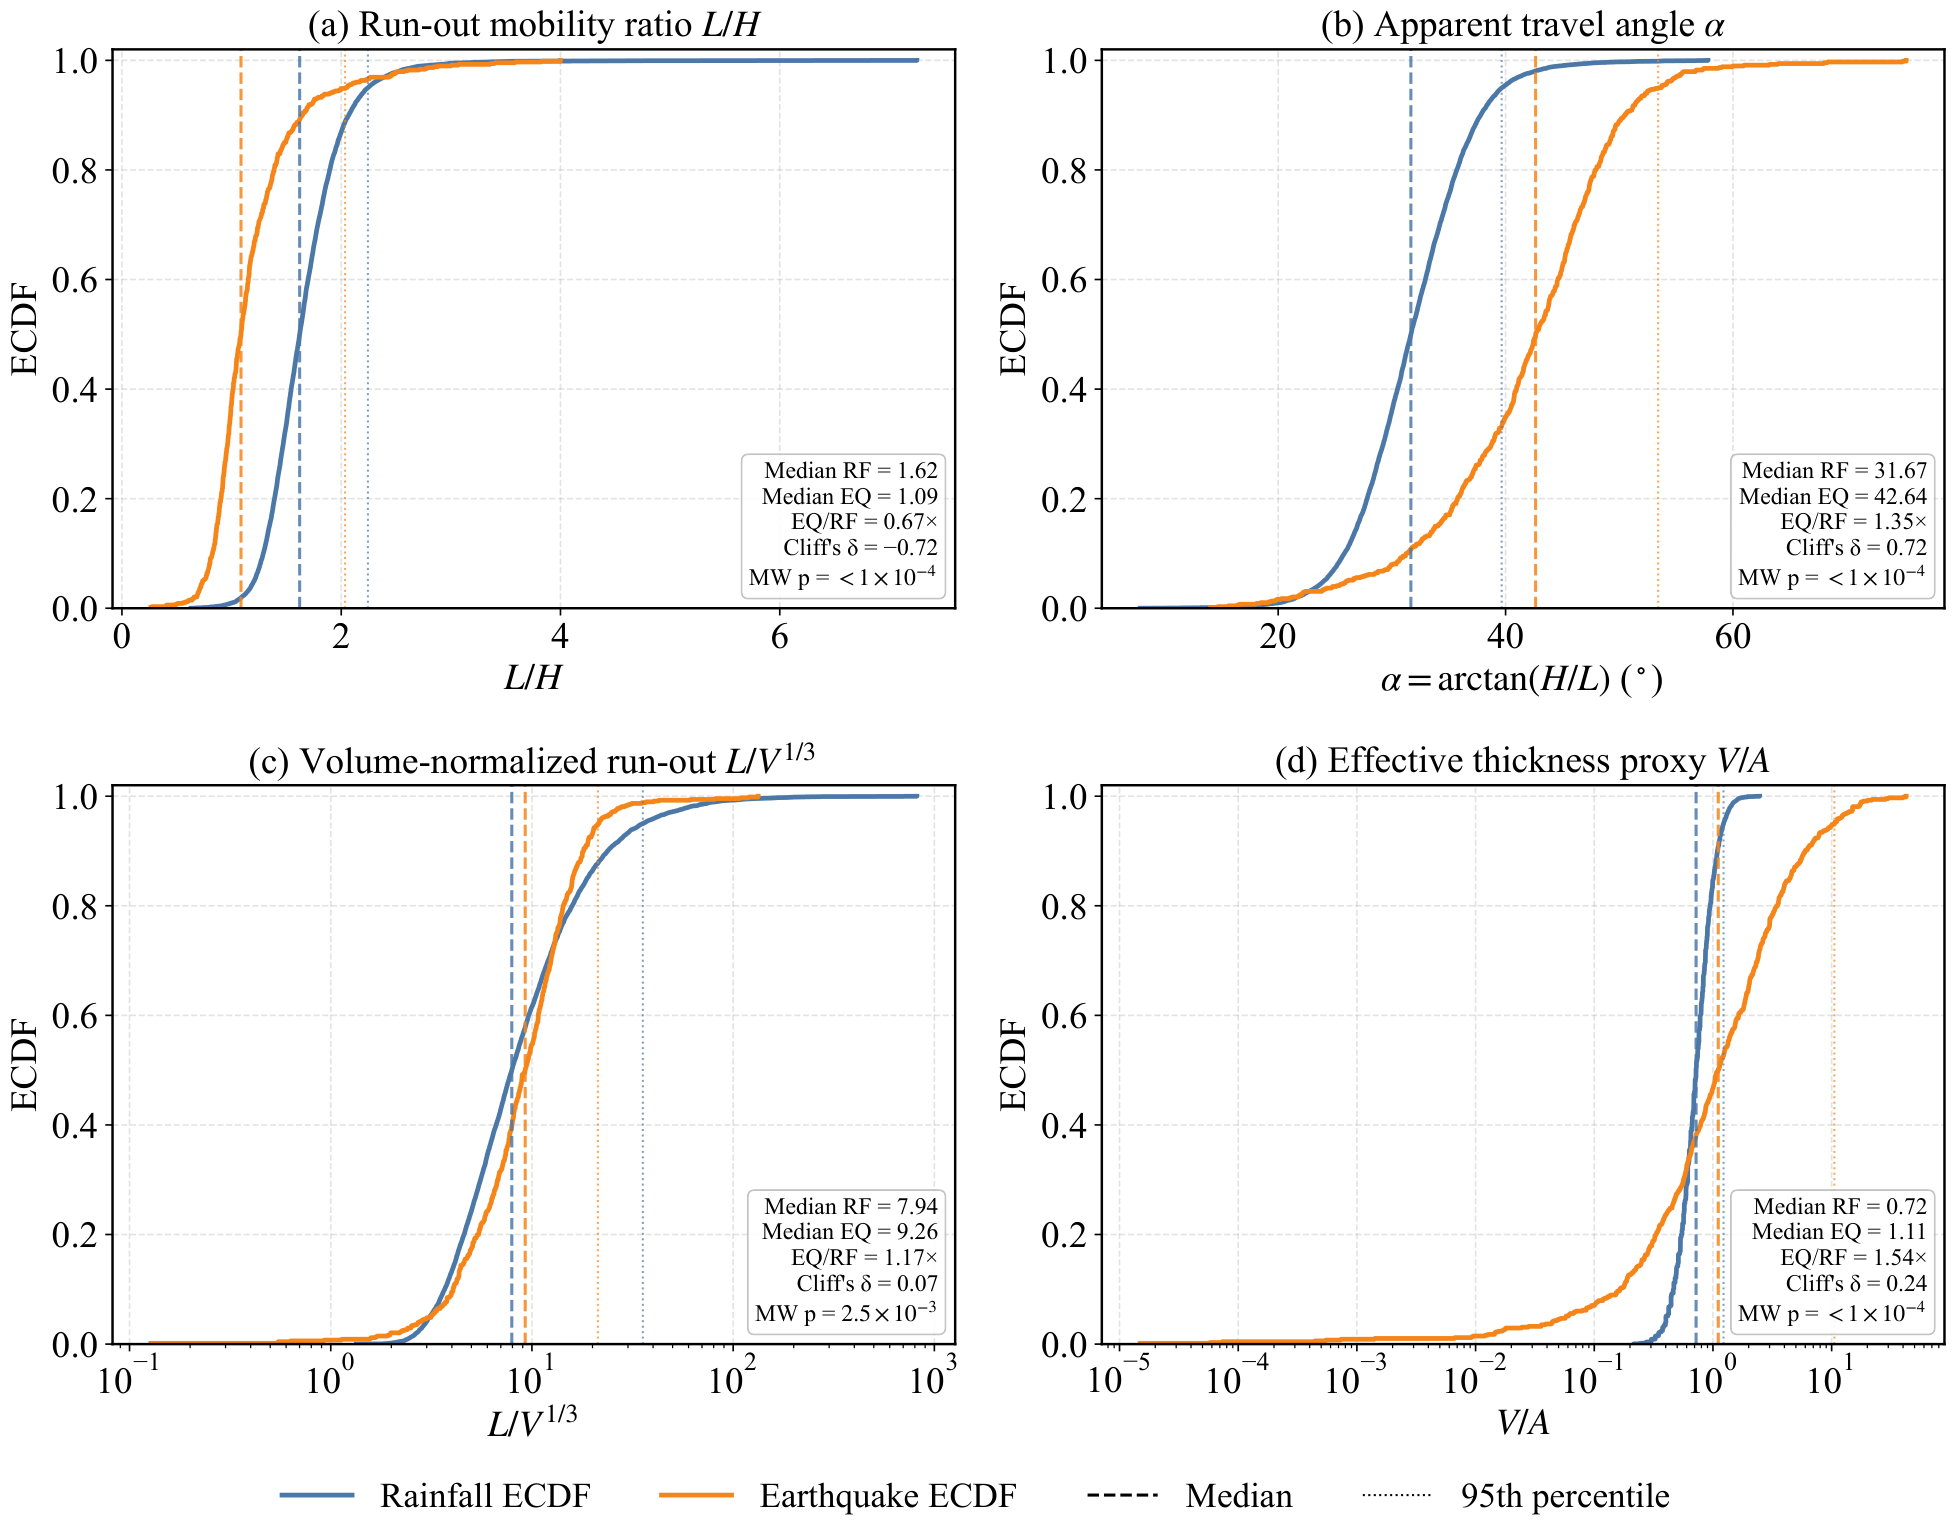
Figure 6 compares the empirical cumulative distributions of these mobility indicators between the two trigger types, and
Table 4 summarizes the corresponding statistics and non-parametric test results. The two trigger types show clear differences in normalized mobility. Although earthquake-induced landslides are larger in absolute scale, rainfall-induced landslides have a larger median
value: 1.62 compared with 1.09 for earthquake-induced landslides. This indicates that rainfall-induced landslides travel farther relative to their elevation difference. Consistently, the median apparent travel angle
is lower for rainfall-induced landslides, 31.67°, than for earthquake-induced landslides, 42.64°. The large Cliff’s
values for
and
,
and 0.72, respectively, indicate strong cross-trigger differences in these two mobility measures.
The differences in and are less pronounced. The median increases only slightly from 7.94 to 9.26, with a small Cliff’s of 0.07. In contrast, increases from 0.72 to 1.11, suggesting that earthquake-induced landslides are associated with larger effective source thickness. These results indicate that trigger-dependent mobility cannot be fully characterized by a single normalized indicator.
To further quantify whether the two trigger types follow the same conditional run-out scaling relationship, the three scaling-law models defined in Equations (
9)–(
11) were compared. The model comparison results are summarized in
Table 5. As shown in
Table 5, the common scaling model already explains a large proportion of run-out variability, with an
of 0.959. However, introducing the trigger indicator improves the
to 0.966 and reduces
from 0.198 to 0.180. Allowing trigger-variable interactions further improves the model, increasing
to 0.970, reducing
to 0.169, and producing the lowest AIC. These improvements indicate that the two trigger types differ not only in terms of marginal scale distribution, but also in their conditional run-out scaling structure.
Based on the trigger-interaction model, the equivalent scaling relationship for rainfall-induced landslides is
For earthquake-induced landslides, the equivalent relationship is
Equations (
28) and (
29) show that the two trigger types do not differ only by an intercept shift; the effective coefficients of
H,
A,
V, and
also vary with trigger type. Since these geometric variables are physically coupled, individual coefficients should be interpreted cautiously. Nevertheless, the improvement from the common model to the trigger-interaction model demonstrates that trigger mechanism is an important factor in landslide run-out scaling.
4.3. Prediction Performance and Cross-Trigger Transferability
Prediction performance was evaluated under within-trigger, cross-trigger, and pooled trigger-aware modeling settings.
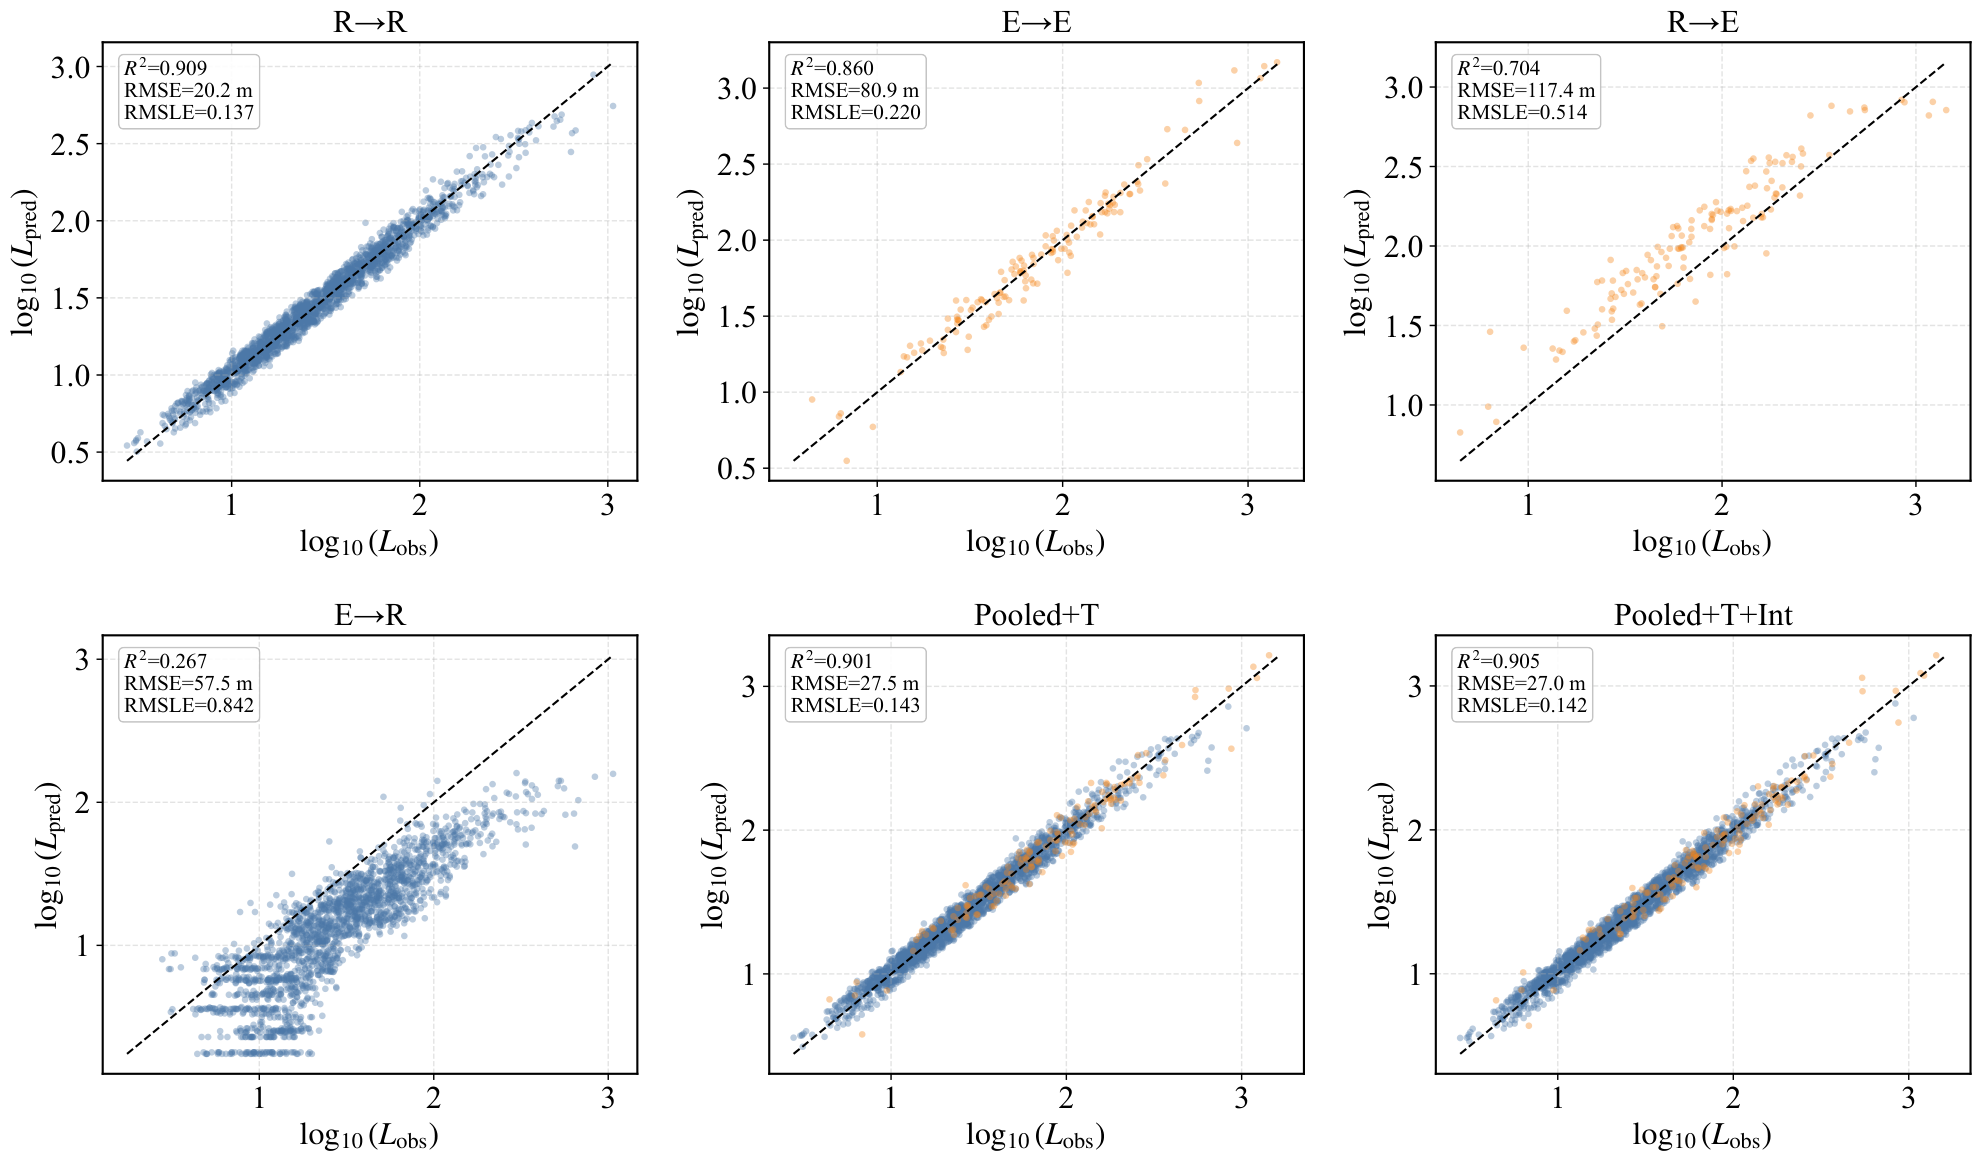
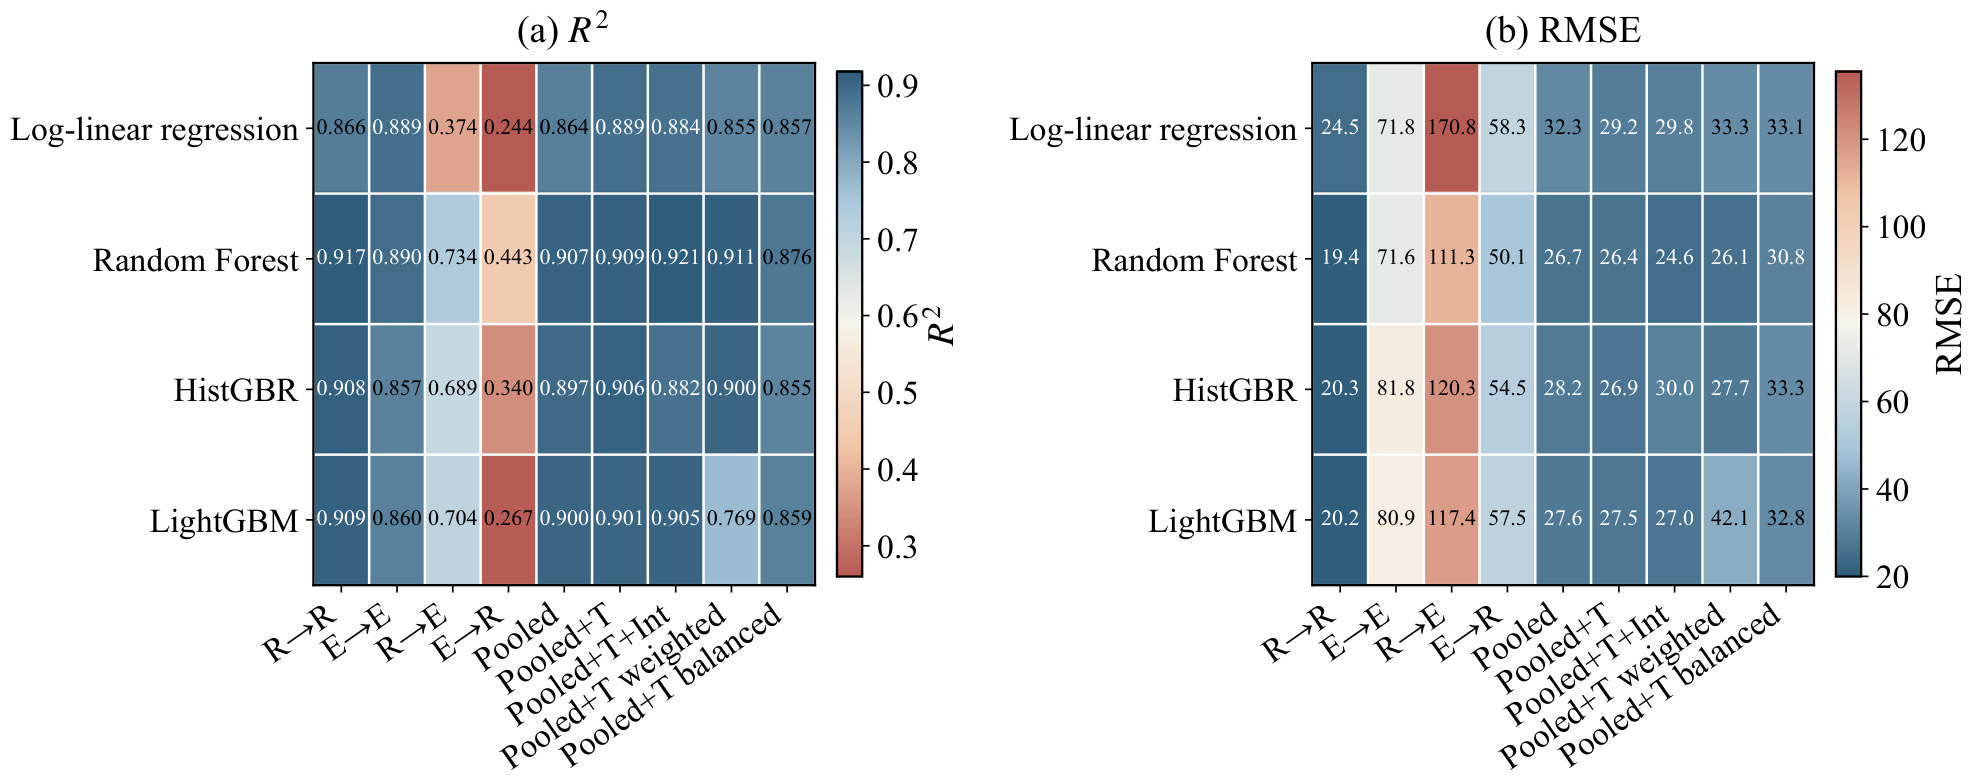
Figure 7 summarizes the results across different models and transfer settings. A consistent pattern is observed: within-trigger prediction achieves relatively high accuracy, whereas direct cross-trigger transfer leads to substantial degradation. Across the evaluated models, R→R and E→E maintain high
values, while R→E, and especially E→R, show marked performance loss. The RMSE results show a similar trend, although the smaller run-out scale of the rainfall-induced test set leads to moderate RMSE values in E→R despite the low
. In contrast, pooled and trigger-aware settings recover much of the lost performance, indicating that mixed-trigger training with explicit trigger information is more reliable than direct cross-trigger application.
The detailed results for the representative LightGBM model are listed in
Table 6. Within-trigger prediction achieves
and RMSE = 20.20 m for R→R, and
and RMSE = 80.87 m for E→E. Direct cross-trigger transfer substantially degrades performance: R→E decreases to
with RMSE = 117.37 m, while E→R decreases to
with RMSE = 57.46 m. The bias values reveal a clear directional pattern: R→E has a positive bias of 35.57 m, indicating overprediction of earthquake-induced landslides, whereas E→R has a negative bias of −25.71 m, indicating underprediction of rainfall-induced landslides. Pooled trigger-aware modeling improves stability; compared with Pooled + T, Pooled + T + Int slightly increases
from 0.901 to 0.905 and reduces RMSE from 27.51 m to 27.01 m, while maintaining a low RMSLE of 0.142. See
Appendix A for tthe complete numerical results corresponding to the prediction performance.
Figure 8 shows the observed versus predicted run-out distance for representative transfer settings. The within-trigger predictions are closely distributed around the 1:1 line, especially for R→R. In contrast, the cross-trigger settings show systematic deviations. In the R→E setting, many points lie above the 1:1 line, indicating overprediction of earthquake-induced landslides. In the E→R setting, the points are mainly below the 1:1 line, indicating underprediction of rainfall-induced landslides. These patterns confirm that cross-trigger prediction errors are not random, but are associated with systematic bias caused by trigger-dependent domain shift. Overall, within-trigger models are reliable when applied to the same trigger type, but cross-trigger transferability is limited and direction-dependent. Pooled trigger-aware modeling reduces this degradation and provides more stable prediction performance across the combined inventory.
4.4. Tail-Risk Prediction and Uncertainty Transferability
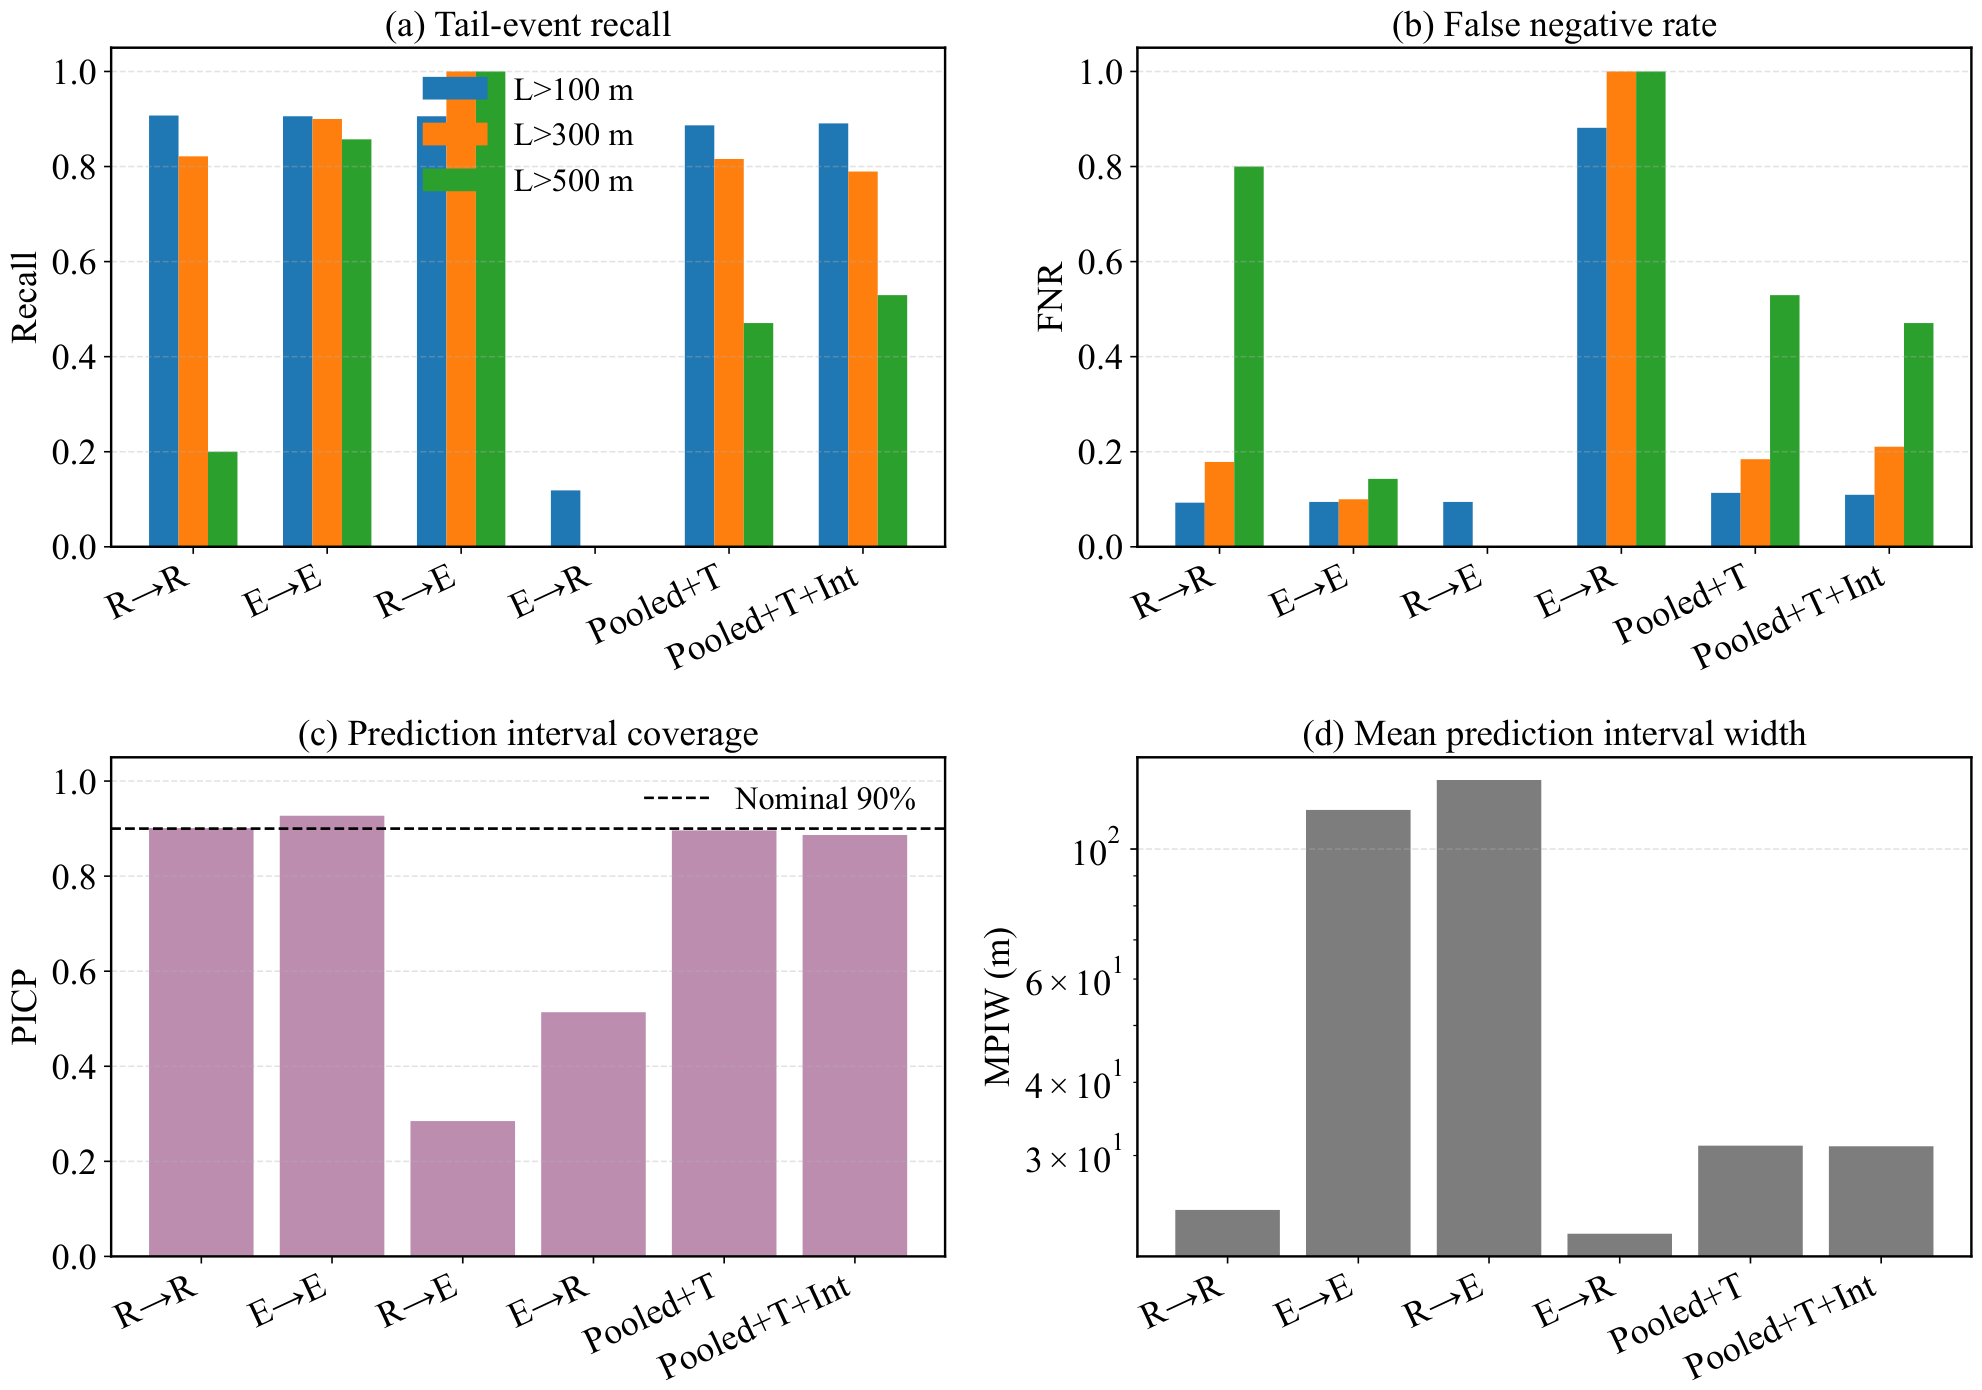
Because long-run-out events are most relevant to landslide hazard assessment, model performance was further evaluated using threshold-based tail-risk metrics. Three thresholds were considered: m, m, and m. For each threshold, recall and false negative rate were calculated to assess whether long-run-out events were successfully identified. In addition, prediction-interval reliability was evaluated using prediction-interval coverage probability (PICP) and mean prediction-interval width (MPIW).
Figure 9 shows the tail-risk prediction and uncertainty transferability results. The within-trigger settings generally maintain high recall for
m and
m. For example, R→R and E→E both show recall values close to or above 0.8 for the lower and intermediate thresholds. However, the
m threshold is more unstable, especially for R→R, where the recall is much lower. This result should be interpreted cautiously because the number of positive cases at the
m threshold is limited.
The cross-trigger tail-risk results are strongly affected by the direction of transfer. The R→E setting shows high recall for the long-run-out thresholds, including nearly complete recall for the higher thresholds. However, this does not necessarily indicate reliable prediction, because
Figure 8 shows that R→E is associated with systematic overprediction. Therefore, high recall in this setting may partly result from conservative overestimation rather than accurate tail-risk discrimination. In contrast, the E→R setting shows very poor recall and high false negative rates, especially for
m and
m. This indicates that the earthquake-trained model tends to miss long-run-out rainfall-induced cases.
The uncertainty results further reveal the effect of cross-trigger domain shift. The prediction intervals are well calibrated in the within-trigger settings, with PICP values close to the nominal 90% level. In contrast, coverage collapses under cross-trigger transfer. The R→E setting shows severe under-coverage, whereas E→R also shows substantial under-coverage. This indicates that cross-trigger transfer affects not only point prediction accuracy but also the reliability of predictive uncertainty.
The pooled trigger-aware models recover interval reliability. Both Pooled + T and Pooled + T + Int achieve PICP values close to the nominal 90% level, while maintaining much narrower intervals than the cross-trigger R→E setting. This result suggests that combining both trigger types during training and explicitly including trigger information can improve uncertainty calibration under mixed-inventory prediction. However, the small difference between Pooled + T and Pooled + T + Int also suggests that the main improvement in uncertainty reliability comes from pooled calibration and trigger awareness, while interaction terms provide only additional refinement.
Overall, the tail-risk and uncertainty results indicate that cross-trigger transfer can produce misleading hazard predictions. R→E may appear to have high tail-event recall because of overprediction, whereas E→R is prone to missing long-run-out rainfall-induced landslides. Reliable tail-risk assessment, therefore, requires not only high recall, but also calibrated uncertainty and careful evaluation of systematic bias.
4.5. Error Structure and Transferability Diagnosis
To diagnose the causes of cross-trigger transferability degradation, residuals were analyzed with respect to observed run-out distance, source volume, and feature-space position. The residual was defined in log space as
where positive residuals indicate overprediction and negative residuals indicate underprediction.
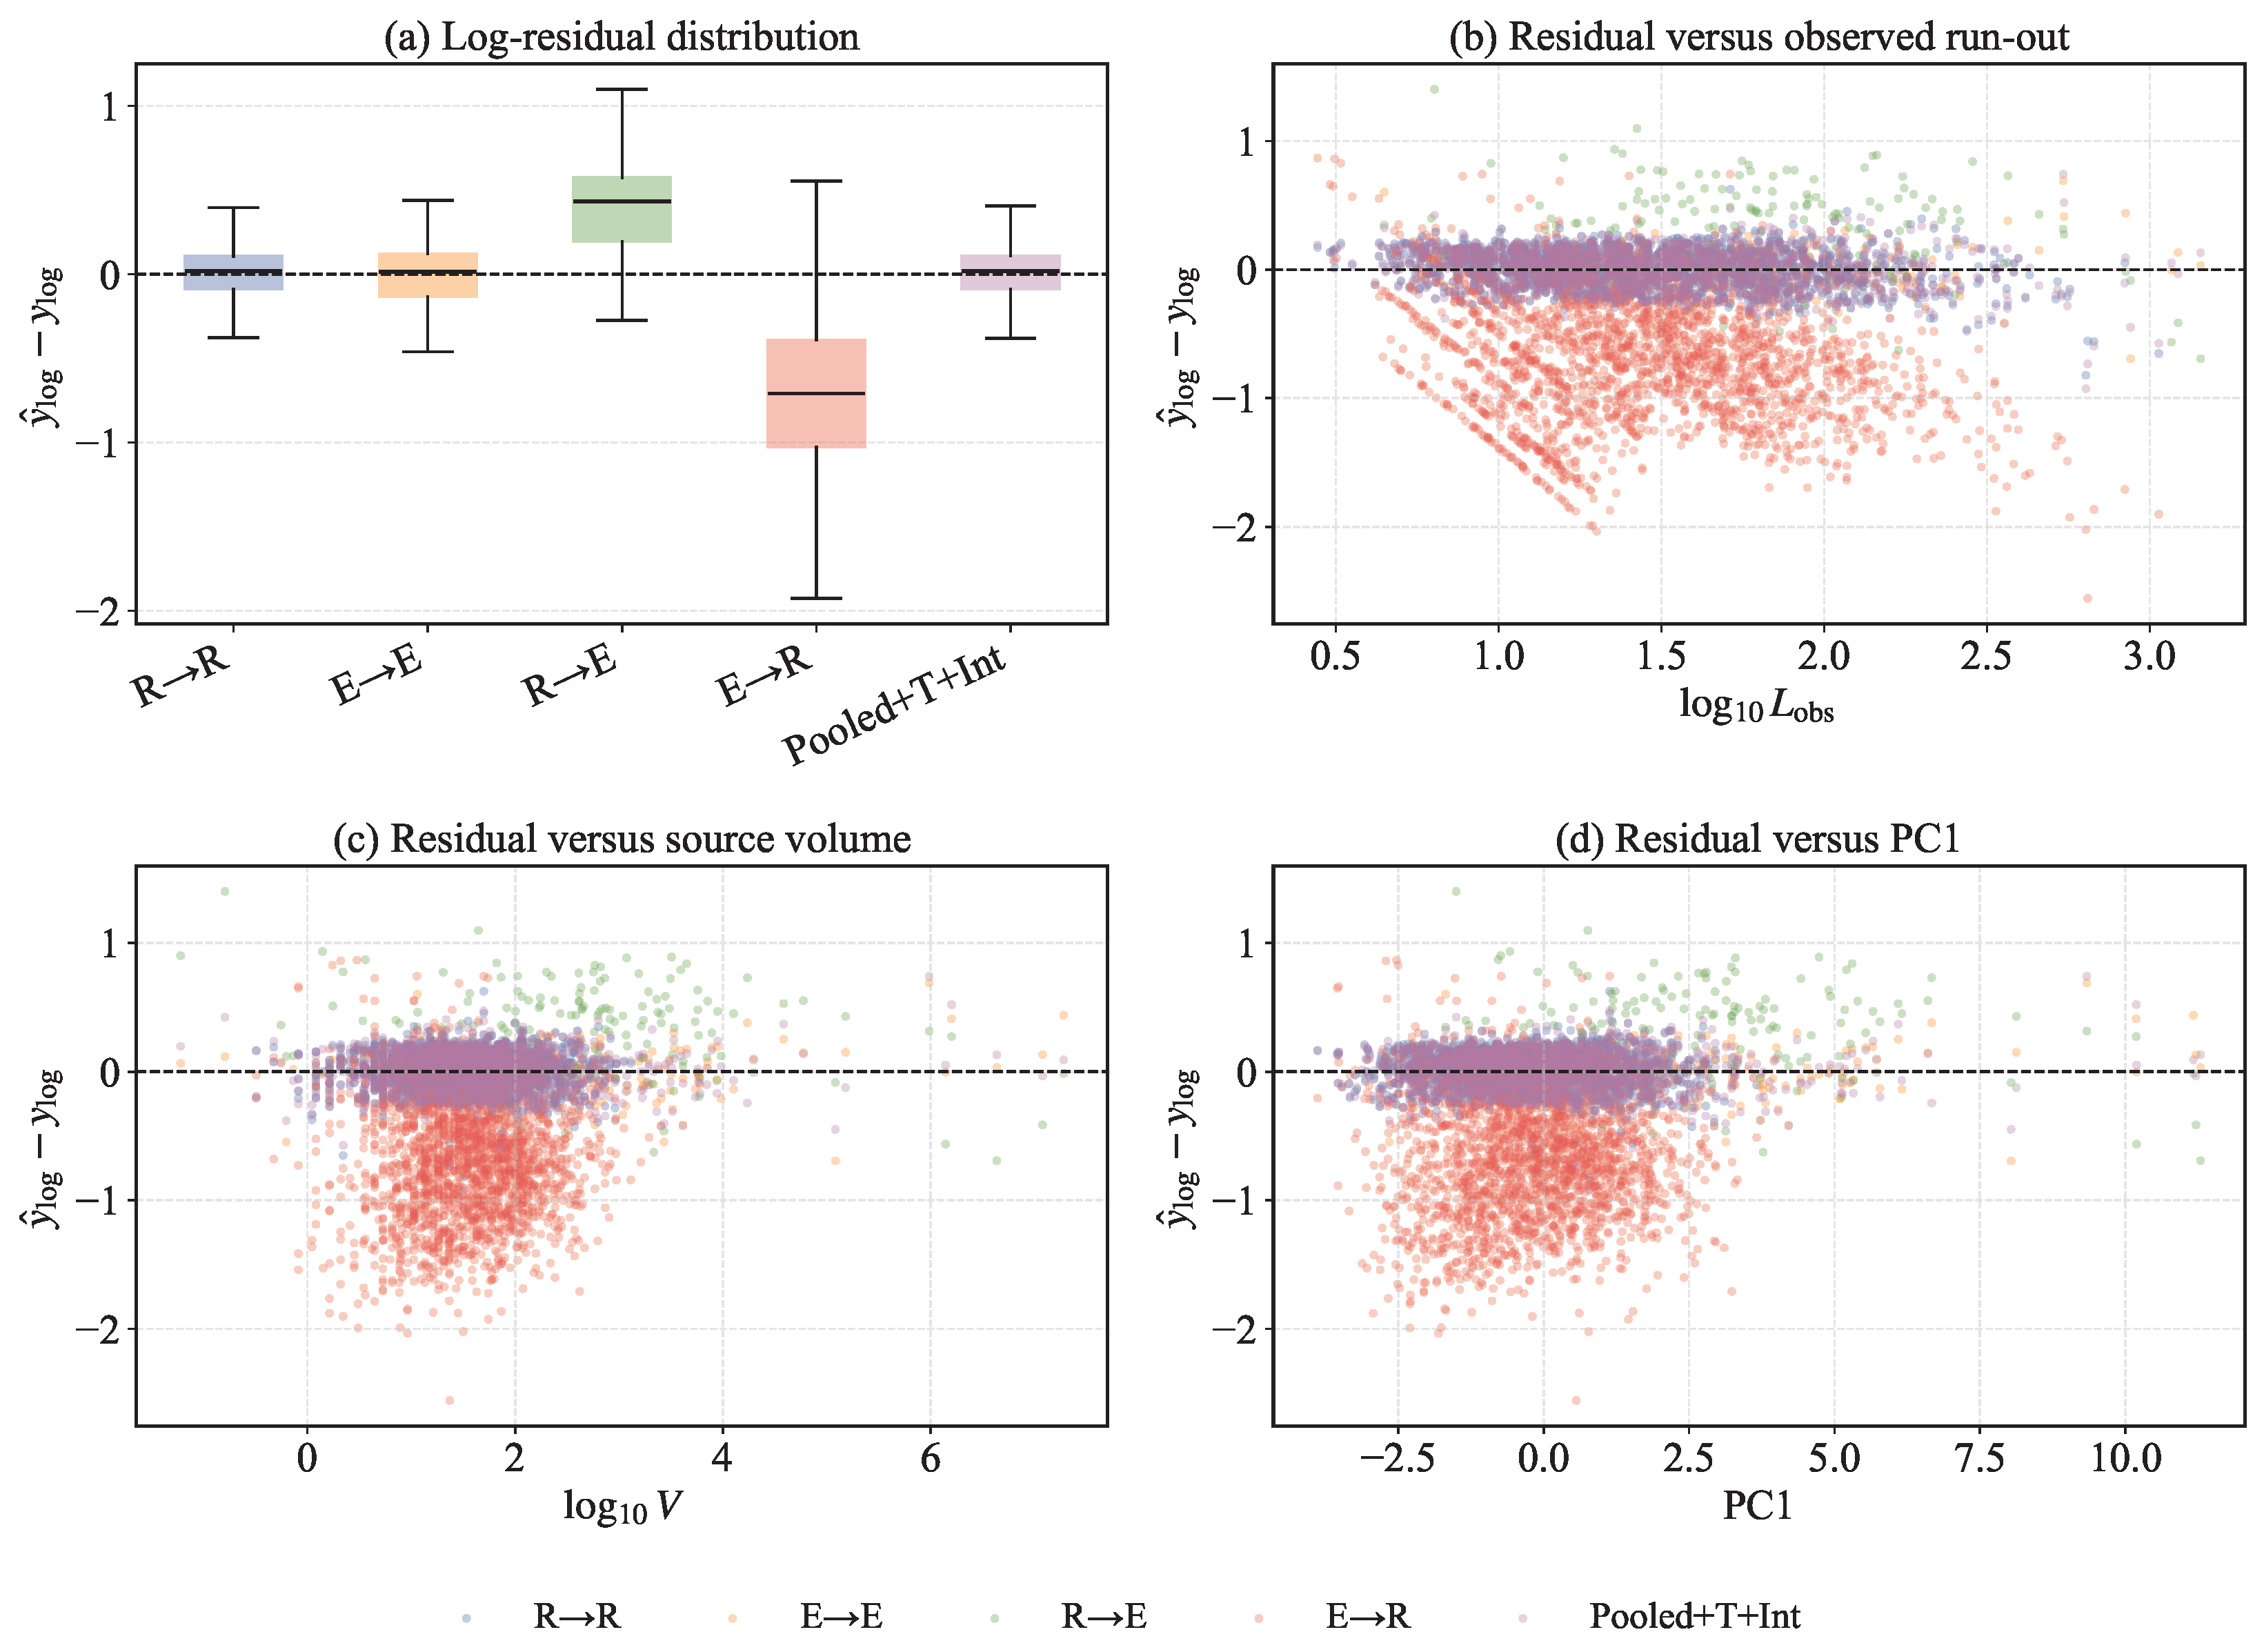
Figure 10 shows the residual distributions and residual patterns under representative prediction settings. The within-trigger settings, R→R and E→E, have residual distributions centered close to zero, indicating limited systematic bias.
In contrast, the cross-trigger settings show clear directional bias. The R→E residuals are mostly positive, confirming that the rainfall-trained model tends to overpredict earthquake-induced landslides. The E→R residuals are mostly negative, confirming that the earthquake-trained model tends to underpredict rainfall-induced landslides. This residual pattern explains the asymmetric behavior observed in
Figure 8 and
Figure 9. In particular, R→E can produce high tail-event recall because of overprediction, whereas E→R leads to high false negative rates because of underprediction.
The residual scatter plots further show that the largest errors are not uniformly distributed across the data space. In the E→R setting, large negative residuals occur across a broad range of observed run-out distance, source volume, and PC1 values, indicating systematic underestimation when earthquake-trained relationships are applied to rainfall-induced landslides. The R→E residuals are generally shifted toward positive values, indicating systematic overestimation when rainfall-trained relationships are applied to earthquake-induced landslides.
Taken together, the residual diagnosis supports the conclusion that cross-trigger transferability is limited by systematic domain shift. Pooled trigger-aware modeling reduces these residual biases, but direct cross-trigger extrapolation without target-trigger calibration remains unreliable.
4.6. Trigger-Aware Model Interpretation Using SHAP
To further interpret the pooled trigger-interaction model, SHAP analysis was performed for the representative LightGBM model. The SHAP values were calculated in the transformed response space, corresponding to contributions to . Positive SHAP values, therefore, indicate an increase in the predicted run-out distance, whereas negative values indicate a decrease. Because the model includes trigger-interaction terms, the SHAP values of each interaction term were aggregated with the corresponding geometric predictor to obtain physically interpretable total effects.
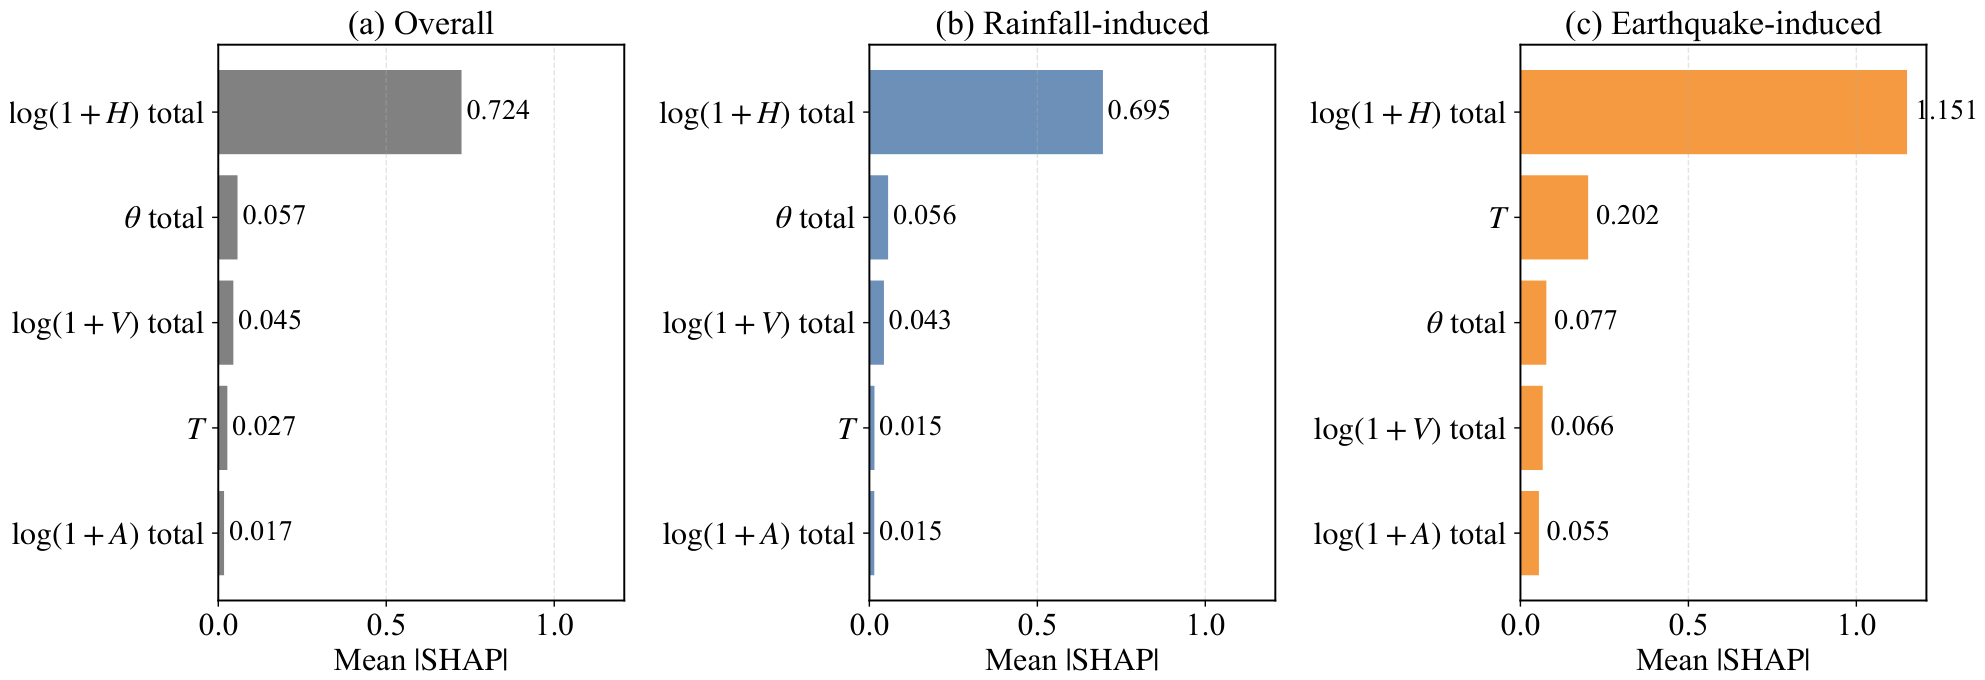
Figure 11 shows the global and trigger-specific SHAP feature importance. Elevation difference, represented by
total, is the dominant predictor in all cases. For the overall test set, its mean absolute SHAP value reaches 0.724, which is substantially larger than those of
total,
total,
T, and
total, with values of 0.057, 0.045, 0.027, and 0.017, respectively. Thus, the contribution of
total is approximately 13 times that of
total and more than 40 times that of
total, indicating that elevation difference provides the primary empirical geometric control on predicted run-out distance within the mapped inventories. This interpretation should be treated with caution. As
H may partly contain post-event run-out geometric information when it is derived from mapped source-to-deposit geometry, the high SHAP importance of
H indicates a strong model-based association with mapped run-out distance, but it should not be interpreted as evidence that
H is a fully prospective or causal predictor for real-time forecasting. In addition, because
H,
A, and
V are geometrically related descriptors, their correlations may influence the allocation of SHAP importance among predictors.
The importance pattern also differs between trigger types. The mean absolute SHAP value of total increases from 0.695 for rainfall-induced landslides to 1.151 for earthquake-induced landslides, corresponding to a 1.66-fold increase. The trigger indicator T has a limited contribution in the rainfall-induced subset, with a mean absolute SHAP value of 0.015, but increases to 0.202 in the earthquake-induced subset, becoming the second most important factor after total. This result suggests that the model mainly relies on elevation-related geometric control, while trigger information acts as an additional correction, especially for earthquake-induced landslides.
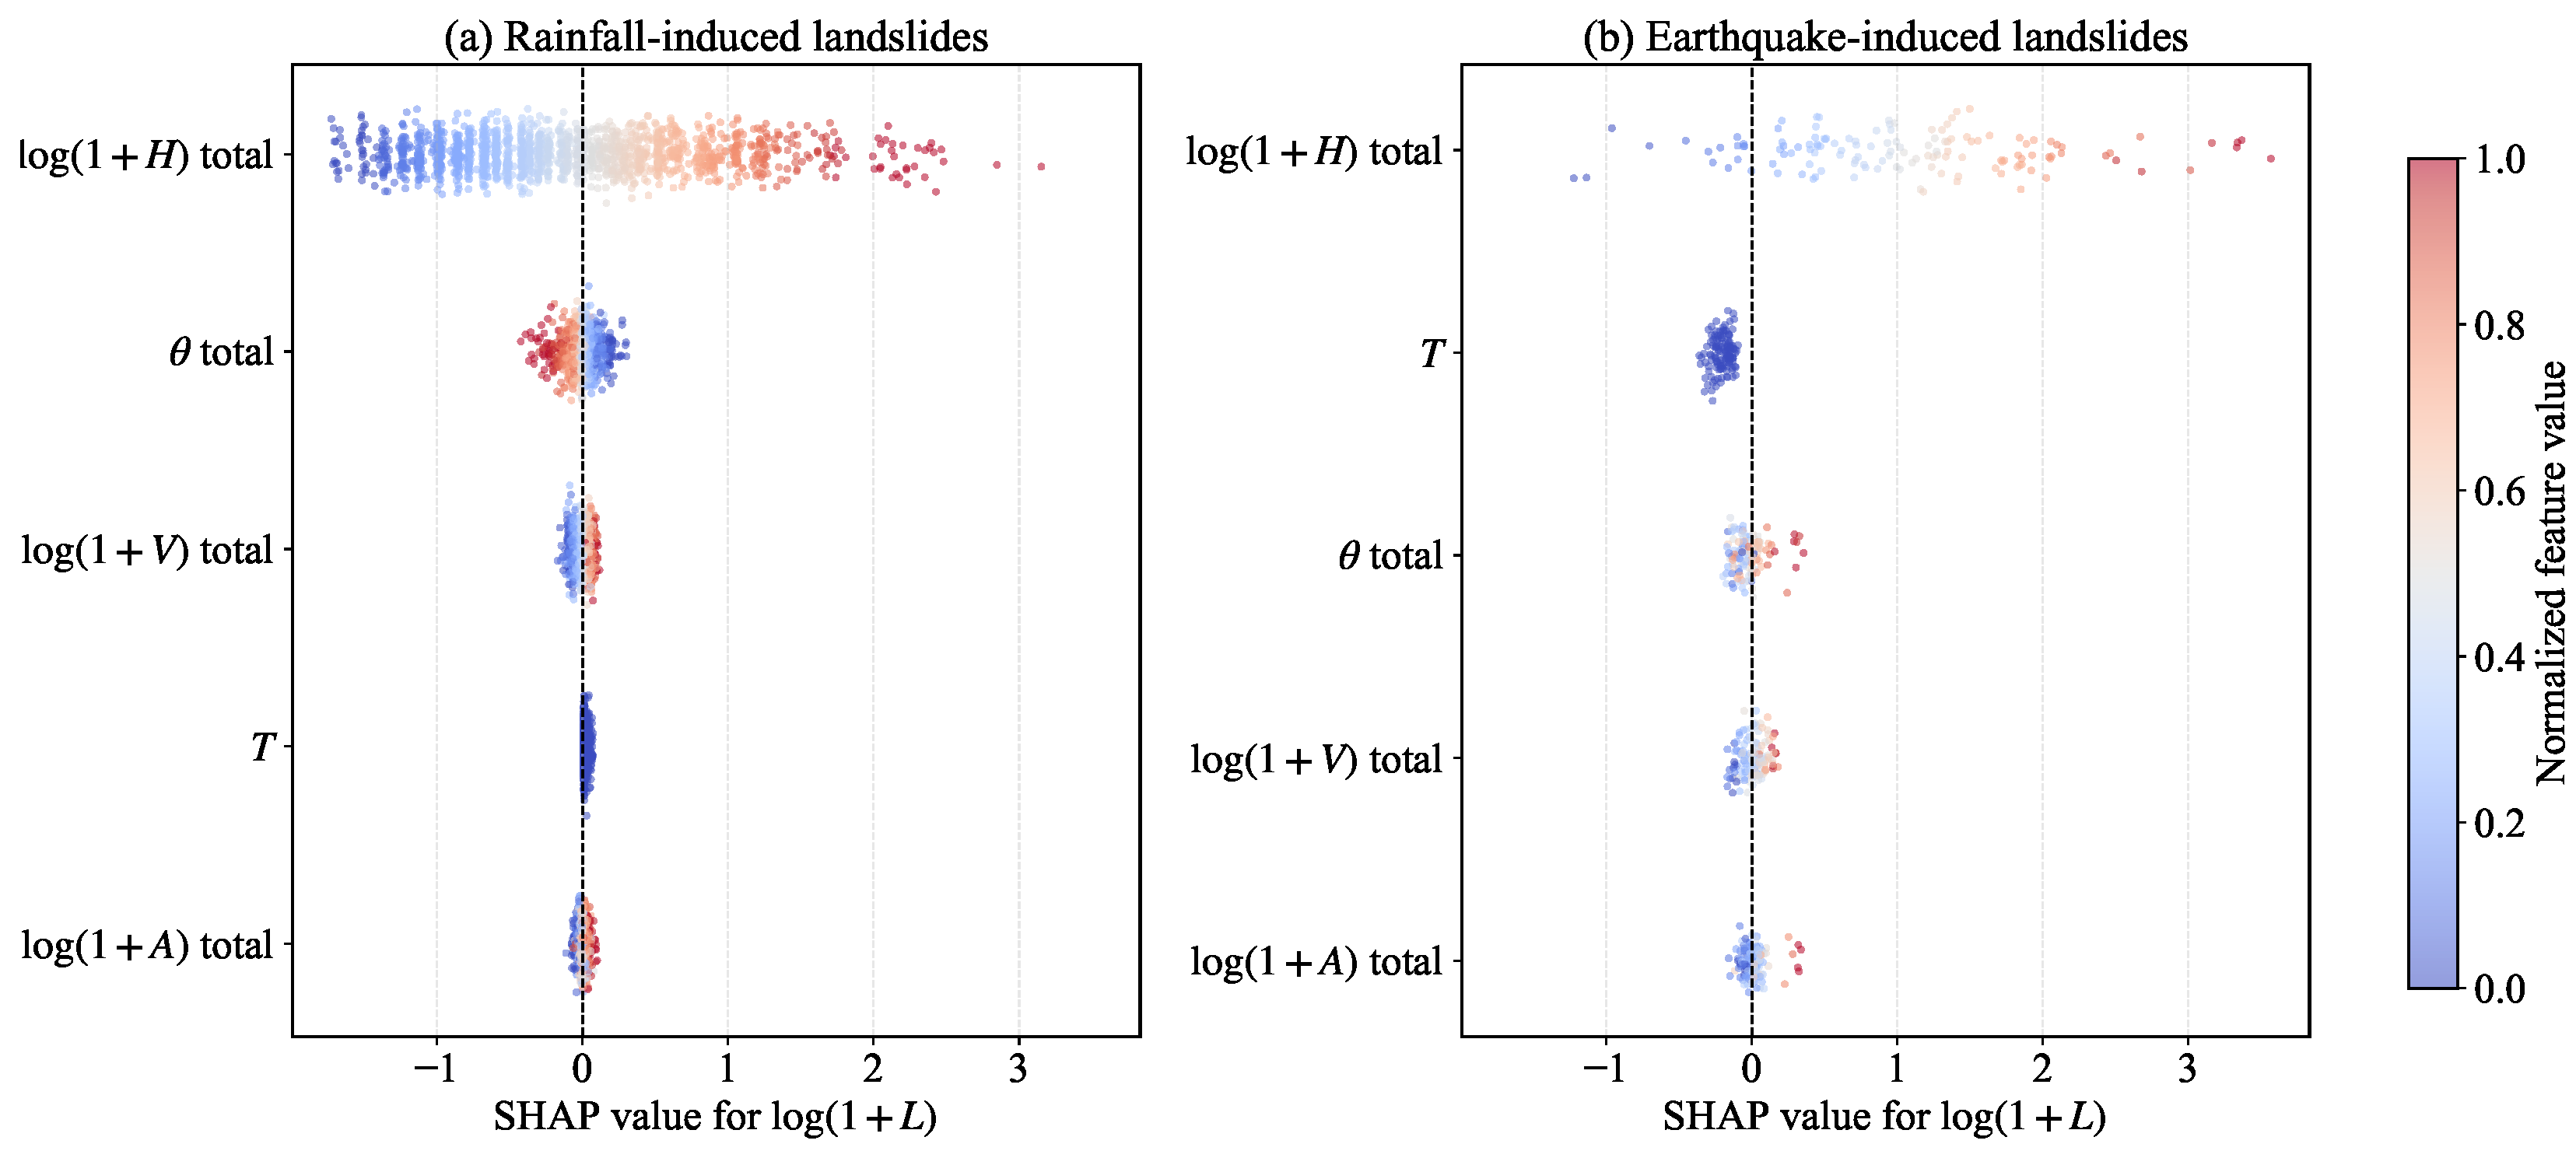
Figure 12 presents the trigger-specific SHAP summary plots. For both trigger types, high values of
total are generally associated with positive SHAP values, whereas low values are associated with negative SHAP values. This confirms that increasing elevation difference consistently increases the predicted run-out distance. The spread of SHAP values for
total is broader in the earthquake-induced subset, which is consistent with its larger geometric range and heavier run-out tail. In contrast, the SHAP values of
total and
total are mostly concentrated near zero, indicating weaker marginal effects after the dominant elevation-related contribution has been accounted for.
Figure 13 further illustrates the dependence of SHAP values on key geometric predictors. The effect of
total is strongly positive and approximately monotonic for both trigger types, confirming its dominant role in the model prediction. The effects of
total and
total are weaker and more nonlinear. For rainfall-induced landslides, their SHAP values remain close to zero across most samples. For earthquake-induced landslides, the median SHAP trends of
total and
total increase more clearly at larger values, suggesting that source area and source volume become more informative in the large-scale earthquake-induced domain.
Overall, the SHAP analysis indicates that the pooled trigger-interaction model captures both shared geometric controls and trigger-dependent corrections. Elevation difference is the primary predictor for both trigger types, while trigger information and interaction effects are more important for earthquake-induced landslides. These results are consistent with the scaling-law comparison and residual diagnosis, supporting the conclusion that cross-trigger transferability is limited not only by feature-space shift, but also by trigger-dependent predictor effects. Since SHAP values describe model-based associations, they should be interpreted as evidence of learned prediction structure rather than direct physical causality.
5. Discussion
5.1. Trigger-Dependent Behavior and Transferability
The results show that rainfall-induced and earthquake-induced landslides should not be treated as a single homogeneous population. Earthquake-induced landslides generally occupy a larger geometric domain, with greater run-out distance, elevation difference, source area, and source volume. This is consistent with the broader spatial influence of seismic shaking, which can destabilize slopes over large areas and generate larger source regions. In contrast, rainfall-induced landslides in this inventory are mainly concentrated in a smaller-scale domain, likely reflecting more localized hydrological triggering processes such as infiltration, pore-water-pressure increase, and near-surface-strength reduction.
However, larger absolute scale does not necessarily imply higher normalized mobility. Rainfall-induced landslides show larger and smaller apparent travel angles, suggesting greater run-out distance relative to elevation difference. Earthquake-induced landslides, by contrast, show larger effective source thickness, as reflected by . This indicates that absolute run-out distance, elevation-normalized mobility, volume-normalized mobility, and source-thickness proxies describe different aspects of landslide behavior and should not be interpreted interchangeably.
These trigger-dependent differences directly affect model transferability. Models trained and tested within the same trigger type perform relatively well, but direct transfer between rainfall-induced and earthquake-induced inventories leads to systematic degradation. The degradation is also asymmetric: R→E mainly produces overprediction, whereas E→R produces underprediction. This suggests that cross-trigger prediction errors are not random noise, but arise from differences in feature distribution, mobility characteristics, and trigger-dependent scaling relationships. Therefore, conventional random train–test validation within a single inventory may overestimate model reliability when the intended application involves another triggering mechanism.
5.2. Interpretation of Trigger-Aware Modeling
The scaling-law and SHAP analyses provide complementary evidence that trigger information is meaningful for run-out prediction. The improvement from the common scaling model to the trigger-aware and trigger-interaction models indicates that rainfall-induced and earthquake-induced landslides do not fully share the same conditional run-out relationship. The trigger mechanism affects not only the overall run-out level, but also how geometric predictors contribute to run-out distance.
The SHAP results further show that elevation difference is the dominant contributor to predicted run-out distance for both trigger types. This is physically reasonable because H is closely related to the gravitational potential energy available for downslope motion. At the same time, trigger-related terms provide additional corrections, especially for earthquake-induced landslides. This suggests that trigger-aware modeling does not replace geometric controls, but modifies their effects according to the triggering mechanism.
The dependence plots also indicate that source area and source volume have weaker effects than elevation difference, but their contributions become more evident in the large-scale earthquake-induced domain. Since H, A, and V are physically and statistically coupled, SHAP values should not be interpreted as direct causal effects. Nevertheless, the agreement among scaling-law comparison, SHAP interpretation, and residual diagnosis supports the conclusion that trigger-dependent predictor effects are an important source of cross-trigger transferability loss. The interpretation of scaling-law coefficients and SHAP-based-variable importance may be affected by multicollinearity among geometric predictors. Variables such as elevation difference H, source area A, and source volume V are geometrically related and, therefore, not fully independent. Consequently, scaling-law coefficients should be interpreted as conditional empirical associations rather than independent physical effects, while SHAP importance may be shared or redistributed among correlated predictors. The dominant SHAP contribution of H should, therefore, be understood as reflecting the learned prediction behavior of the model, not as causal variable importance.
5.3. Implications for Tail-Risk Prediction and Uncertainty Reliability
The tail-risk results highlight the limitation of evaluating run-out models only with average accuracy metrics. Long-run-out events are most relevant to hazard zoning and emergency planning, but they are also more sensitive to systematic prediction bias. In the R→E setting, high recall for long-run-out thresholds partly reflects conservative overprediction rather than reliable discrimination. In contrast, the E→R setting is more problematic from a risk-management perspective because it tends to underpredict rainfall-induced long-run-out cases and produces high false-negative rates.
The uncertainty results further show that cross-trigger transfer affects not only point predictions but also prediction-interval reliability. Prediction intervals are well calibrated within the same trigger type, but show severe under-coverage when transferred across triggering mechanisms. This is consistent with the exchangeability assumption underlying conformal prediction: when calibration and target samples come from different trigger-dependent distributions, nominal coverage can no longer be expected. The improved coverage of pooled trigger-aware models suggests that mixed-trigger calibration and explicit trigger information are important for uncertainty-aware landslide run-out prediction.
5.4. Practical Implications and Limitations
For practical landslide-hazard assessment, trigger information should be incorporated whenever possible. Pooled trigger-aware models provide a useful compromise when both rainfall-induced and earthquake-induced inventories are available because they can capture shared geometric controls while accounting for trigger-dependent deviations. Conversely, applying a model trained on one trigger type directly to another trigger type should be avoided unless target-trigger validation or recalibration is available.
Several limitations remain. First, although the inventories were harmonized using the same set of geometric descriptors, the rainfall-induced and earthquake-induced records may differ in terms of regional coverage, mapping resolution, landslide-delineation criteria, and volume-estimation methods. Therefore, the observed transfer degradation should be interpreted as trigger-associated inventory shift rather than purely as the isolated causal effect of a triggering mechanism. Second, the two inventories are strongly imbalanced, with many more rainfall-induced samples than earthquake-induced samples, which may affect pooled training and tail-event evaluation. Third, this study uses only harmonized geometric descriptors, including H, A, V, and . Trigger-specific variables such as rainfall intensity, antecedent moisture, peak ground acceleration, lithology, material strength, and terrain confinement were not included. Fourth, if elevation difference H is derived from observed source-to-deposit geometry, models using H should be regarded as empirical inventory-based scaling models rather than fully prospective prediction tools. Finally, SHAP analysis improves model transparency but explains learned statistical associations rather than proving physical causality.
Future work should incorporate trigger-specific physical covariates and validate the framework on independent regional inventories. Combining interpretable machine learning, physically based run-out simulations, domain-adaptive learning, and trigger-wise uncertainty calibration may further improve the reliability of landslide run-out prediction under multi-trigger hazard scenarios.
6. Conclusions
This study investigated trigger-associated differences in landslide run-out behavior and their influence on the transferability of data-driven run-out-prediction models. By comparing rainfall-induced and earthquake-induced landslide inventories under a harmonized modeling framework, the study evaluated geometric scale, normalized mobility, scaling relationships, point prediction, tail-risk identification, uncertainty calibration, and model interpretation.
The results show that rainfall-induced and earthquake-induced landslides differ not only in absolute geometric scale but also in normalized mobility and predictor–response relationships. Earthquake-induced landslides generally occupy a larger geometric domain, whereas rainfall-induced landslides exhibit greater elevation-normalized mobility. These contrasting patterns indicate that absolute run-out distance and normalized mobility reflect different aspects of landslide behavior and should not be interpreted interchangeably.
The prediction experiments further demonstrate that models trained under one trigger-associated inventory do not necessarily transfer reliably to another. Cross-trigger prediction produced systematic and asymmetric biases, and prediction intervals calibrated within one trigger type showed degraded coverage when transferred to the other. These findings indicate that high within-inventory accuracy alone is insufficient for evaluating landslide run-out models, especially when they are intended for multi-trigger hazard assessment or long-run-out risk analysis.
The overarching implication of this study is that landslide run-out prediction should be treated as a transferability- and uncertainty-sensitive problem rather than only a within-dataset regression task. These differences are interpreted as trigger-associated inventory differences rather than purely causal effects of triggering mechanisms because they may reflect the combined influence of failure processes, regional coverage, mapping resolution, landslide-delineation criteria, and volume-estimation uncertainty. In this context, trigger-aware pooled modeling provides a practical strategy for improving prediction stability when multi-trigger inventories are available.
Several limitations should also be acknowledged. First, the analysis is based on mapped landslide inventories, and the elevation difference H may partly reflect post-event run-out geometry; therefore, the proposed models should be interpreted as empirical inventory-based run-out scaling models rather than fully prospective early-warning models. Second, the observed differences cannot be attributed solely to triggering mechanisms because the two inventories also differ in terms of regional coverage, mapping resolution, landslide-delineation procedures, and volume-estimation uncertainty. Third, the present feature set mainly consists of geometric descriptors and does not explicitly include trigger-specific physical variables such as rainfall intensity, antecedent moisture, ground-motion intensity, lithology, material properties, or topographic confinement.
Future research should develop more prospective run-out-prediction models by excluding post-event geometric variables or replacing them with pre-event topographic proxies. Independent regional inventories should be used to further test the robustness of cross-trigger transferability. Incorporating trigger-specific physical information, physics-informed learning, domain adaptation, and recalibrated uncertainty quantification may further improve the reliability of landslide run-out prediction under multi-trigger and out-of-distribution conditions.