1. Introduction
Inland water bodies are indispensable freshwater resources for human survival and societal development, and they perform irreplaceable ecological functions. A healthy water environment is critical to the sustainable development of cities [
1]. Lakes represent one of the most important categories of inland water resources in China [
2]. In recent years, excessive exploitation of lake basins has severely degraded lake water quality [
3]. Large quantities of exogenous pollutants—domestic sewage, industrial discharges, and aquaculture effluents—have entered lakes, inducing eutrophication and cyanobacterial blooms [
4]. Lake Taihu serves as the primary drinking water source for major cities along its shores, including Wuxi, Suzhou, Huzhou, Shanghai, and Jiaxing, and constitutes a vital support and guarantee for the national strategy of integrated development in the Yangtze River Delta [
5]. Lake Taihu receives water from numerous inflow rivers, which function as critical conduits and hubs connecting the lake with the surrounding terrestrial ecosystems [
6]. Xishan Island, a central island situated in the eastern part of Lake Taihu, is the largest island within a freshwater lake in China [
7]. The island features a dense network of rivers. Compared with rivers in the surrounding Lake Taihu basin, the rivers on Xishan Island are relatively short, meaning that pollutants can readily enter the lake water body and consequently exert a substantial influence on the water quality of Lake Taihu. Most of these rivers originate from the central hills of the island, flow through tea plantations, orchards, and residential areas, and ultimately discharge into Lake Taihu. The riparian vegetation areas and in-stream self-purification processes of these rivers retain and degrade terrestrial nutrients and suspended particulates, thereby partially reducing the pollutant load entering the lake [
8]. To date, research on the water quality of rivers flowing into Lake Taihu has predominantly focused on the lake proper and its littoral zones [
9,
10], whereas studies addressing the water quality of the river network on Xishan Island remain scarce. The present study takes the rivers on Xishan Island that inflow directly into Lake Taihu as its research objects (hereinafter referred to as “inflow rivers”). Understanding the pollution status and variation trends of the inflow rivers on Xishan Island is of considerable significance for the more effective treatment and protection of the water environment of Lake Taihu.
Traditional water quality monitoring methods are characterized by high data-acquisition costs, low processing efficiency, and heavy labor and material inputs, making it difficult to thoroughly investigate large-scale pollution across an entire basin [
11]. Unmanned aerial vehicle (UAV) remote sensing technology can acquire large-area, high-frequency environmental data at a lower cost, offering a new monitoring tool for urban river assessment [
12,
13]. Research on UAV-based water quality monitoring has also yielded encouraging results [
14,
15]. For example, Ying et al. [
16] used UAV multispectral imagery to establish retrieval models for suspended-solids concentration and turbidity. Dong et al. [
17] quantitatively retrieved river water quality parameters from UAV hyperspectral data and obtained satisfactory retrieval accuracy.
Constructing retrieval models is a critical step in establishing the mapping relationship between image spectral features and water quality parameters [
18]. As an emerging tool, machine learning methods exhibit stronger data integration capacity, computational power, and predictive accuracy than traditional methods [
19]. These approaches are capable of better capturing the latent relationships between remote sensing spectral data and water quality parameter concentrations, and their application in water quality retrieval has therefore become increasingly widespread [
20]. At present, the principal machine learning algorithms applied to water quality retrieval include random forest (RF) [
21,
22], XGBoost [
15], support vector machine (SVM) [
23,
24], back-propagation neural network (BP) [
25,
26,
27], convolutional neural network (CNN) [
28], extreme learning regression (ELR) [
29,
30], deep neural network (DNN) [
31], artificial neural network (ANN) [
32], and the match-up per-pixel (MPP) algorithm [
33,
34]. For instance, Fu [
35] selected seven different machine learning models to retrieve chlorophyll-a concentrations. In addition to single-model approaches [
36,
37,
38], some studies have integrated multiple machine learning algorithms to achieve higher accuracy [
39]. In recent years, deep learning models have also been increasingly applied in water quality remote sensing. Ref. [
40] focused on global inland waters and reviewed key advances in deep learning-based water quality remote sensing from the three core dimensions of feature construction, model architecture, and optimization strategies. Concurrently, several cutting-edge deep learning frameworks have been proposed. For example, Li et al. [
41] integrated a Transformer with an LSTM network to develop the TL-Net deep learning framework, which addresses challenges of ecological heterogeneity, multi-scale complexity, and data noise in inland waters using UAV hyperspectral imagery. Chen et al. [
42] proposed the Important Spatial Features Extraction Network (ISFE-Net), which employs UAV hyperspectral imagery and a spatial feature extraction module to identify critical image information while suppressing noise. These deep learning models have shown notable performance in terms of generalizability and robustness. However, most existing deep learning frameworks rely on large sample sizes derived from hyperspectral data and have not been investigated in comparative studies under small-sample, multi-river conditions.
To summarize, although UAV remote sensing for water quality monitoring has achieved considerable progress [
15,
43], clear limitations remain. First, existing studies have largely concentrated on single large rivers or lakes [
44], giving insufficient attention to the holistic assessment of complex river networks composed of multiple independent rivers, and the capacity for basin-scale model extension remains unclear. Second, in terms of model validation strategies, the majority of studies have adopted a random split of training and validation sets within the same continuous water body, thereby ignoring the spatial autocorrelation of water and leading to an overly optimistic estimation of model generalizability and a gap between theoretical performance and practical application [
45]. Furthermore, a specific model is typically only applicable to a particular water environment, and its cross-regional generalization capacity is limited [
46].
In view of these shortcomings, the present study takes the 13 inflow rivers on Xishan Island in Lake Taihu—characterized by short flow paths, independent catchment areas, and varying land use influences—as a complete “natural laboratory”, and designs and validates a UAV remote sensing water quality assessment framework tailored to a multi-river, small-sample scenario. The main contributions of this framework are threefold: (1) Multi-river holistic assessment perspective: the 13 independent rivers are treated as an integrated system for synchronous retrieval and evaluation, and land use and human activity background information are combined to area-specifically analyze the driving factors of the spatial heterogeneity of water quality; (2) Spatially independent validation strategy: one sample is mandatorily withheld from each river to form an independent validation set, allowing the generalizability of models to rivers never seen during training to be assessed; (3) Multi-model comparison and suitability analysis: under the spatially independent validation strategy, multiple machine learning algorithms (BP, RF, XGBoost, SVM, CNN) are systematically compared for the retrieval of dissolved oxygen and turbidity, and a lightweight suitability design of machine learning models is conducted in light of the small-sample characteristics. This study provides theoretical support for managing the water quality of Lake Taihu inflow rivers, controlling land use types across the basin, and improving the eutrophication status of Lake Taihu, and it holds promise for enhancing the intelligence and automation level of water environment monitoring.
2. Research Proposal
2.1. Study Area
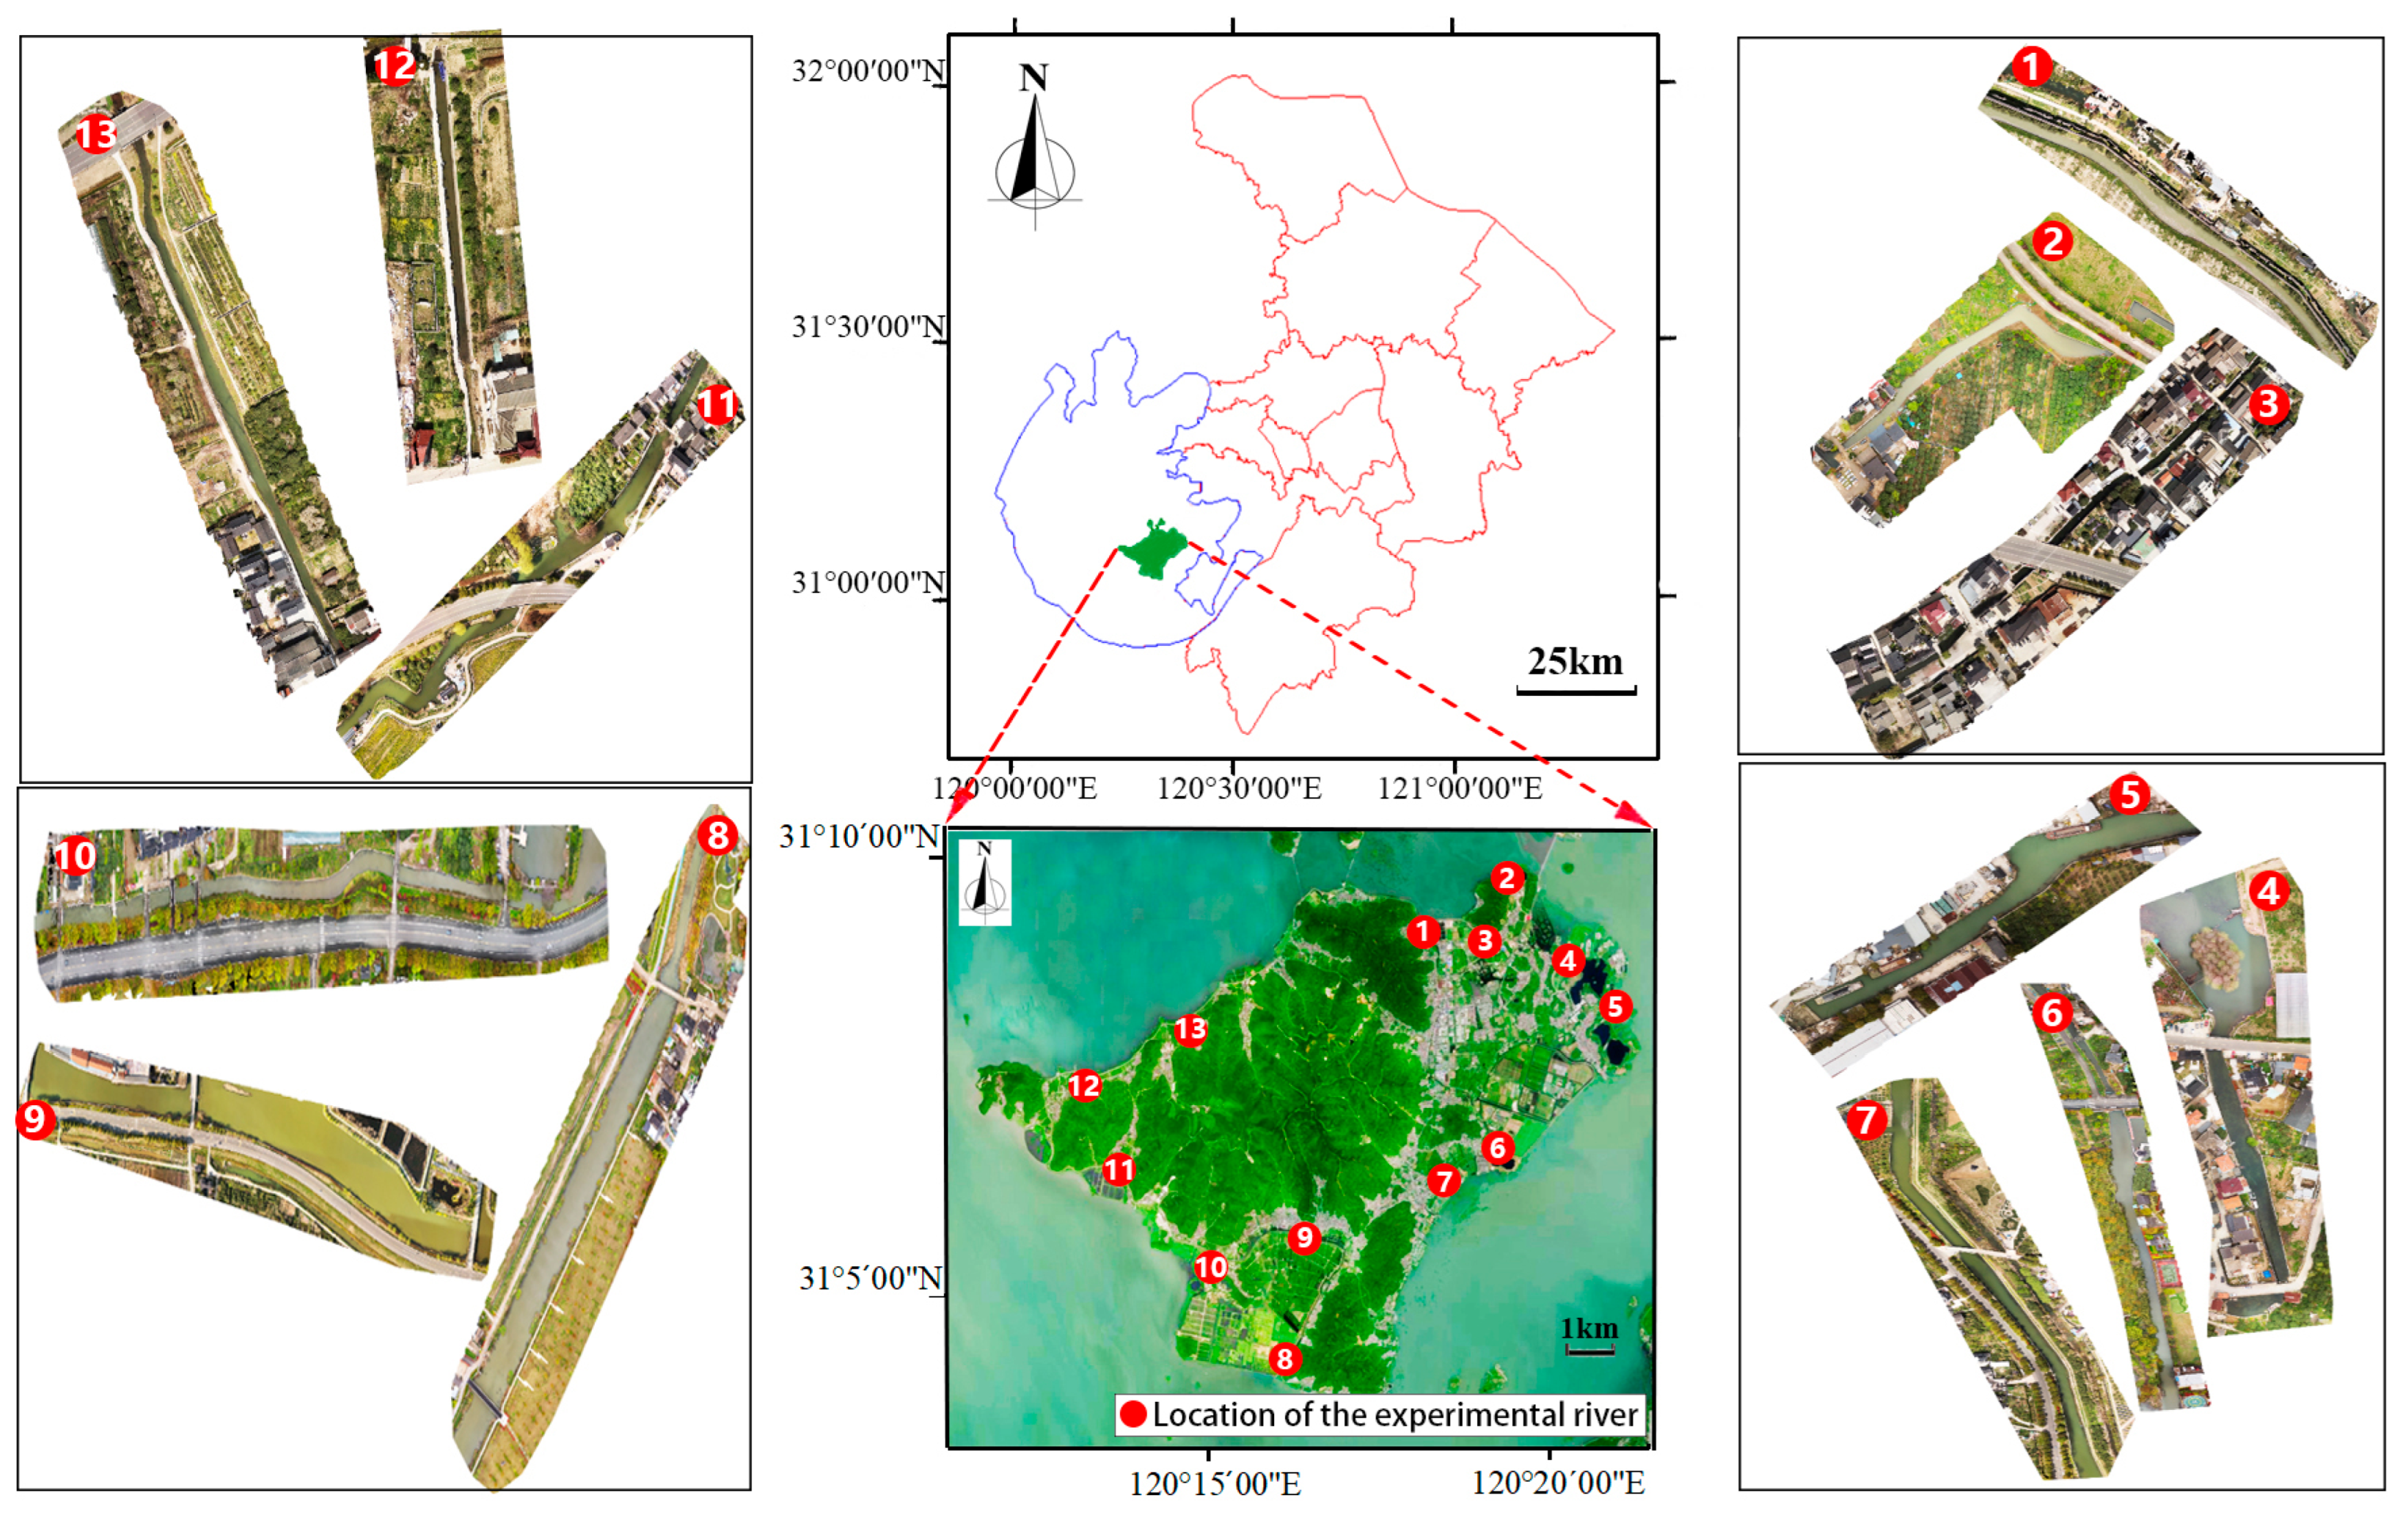
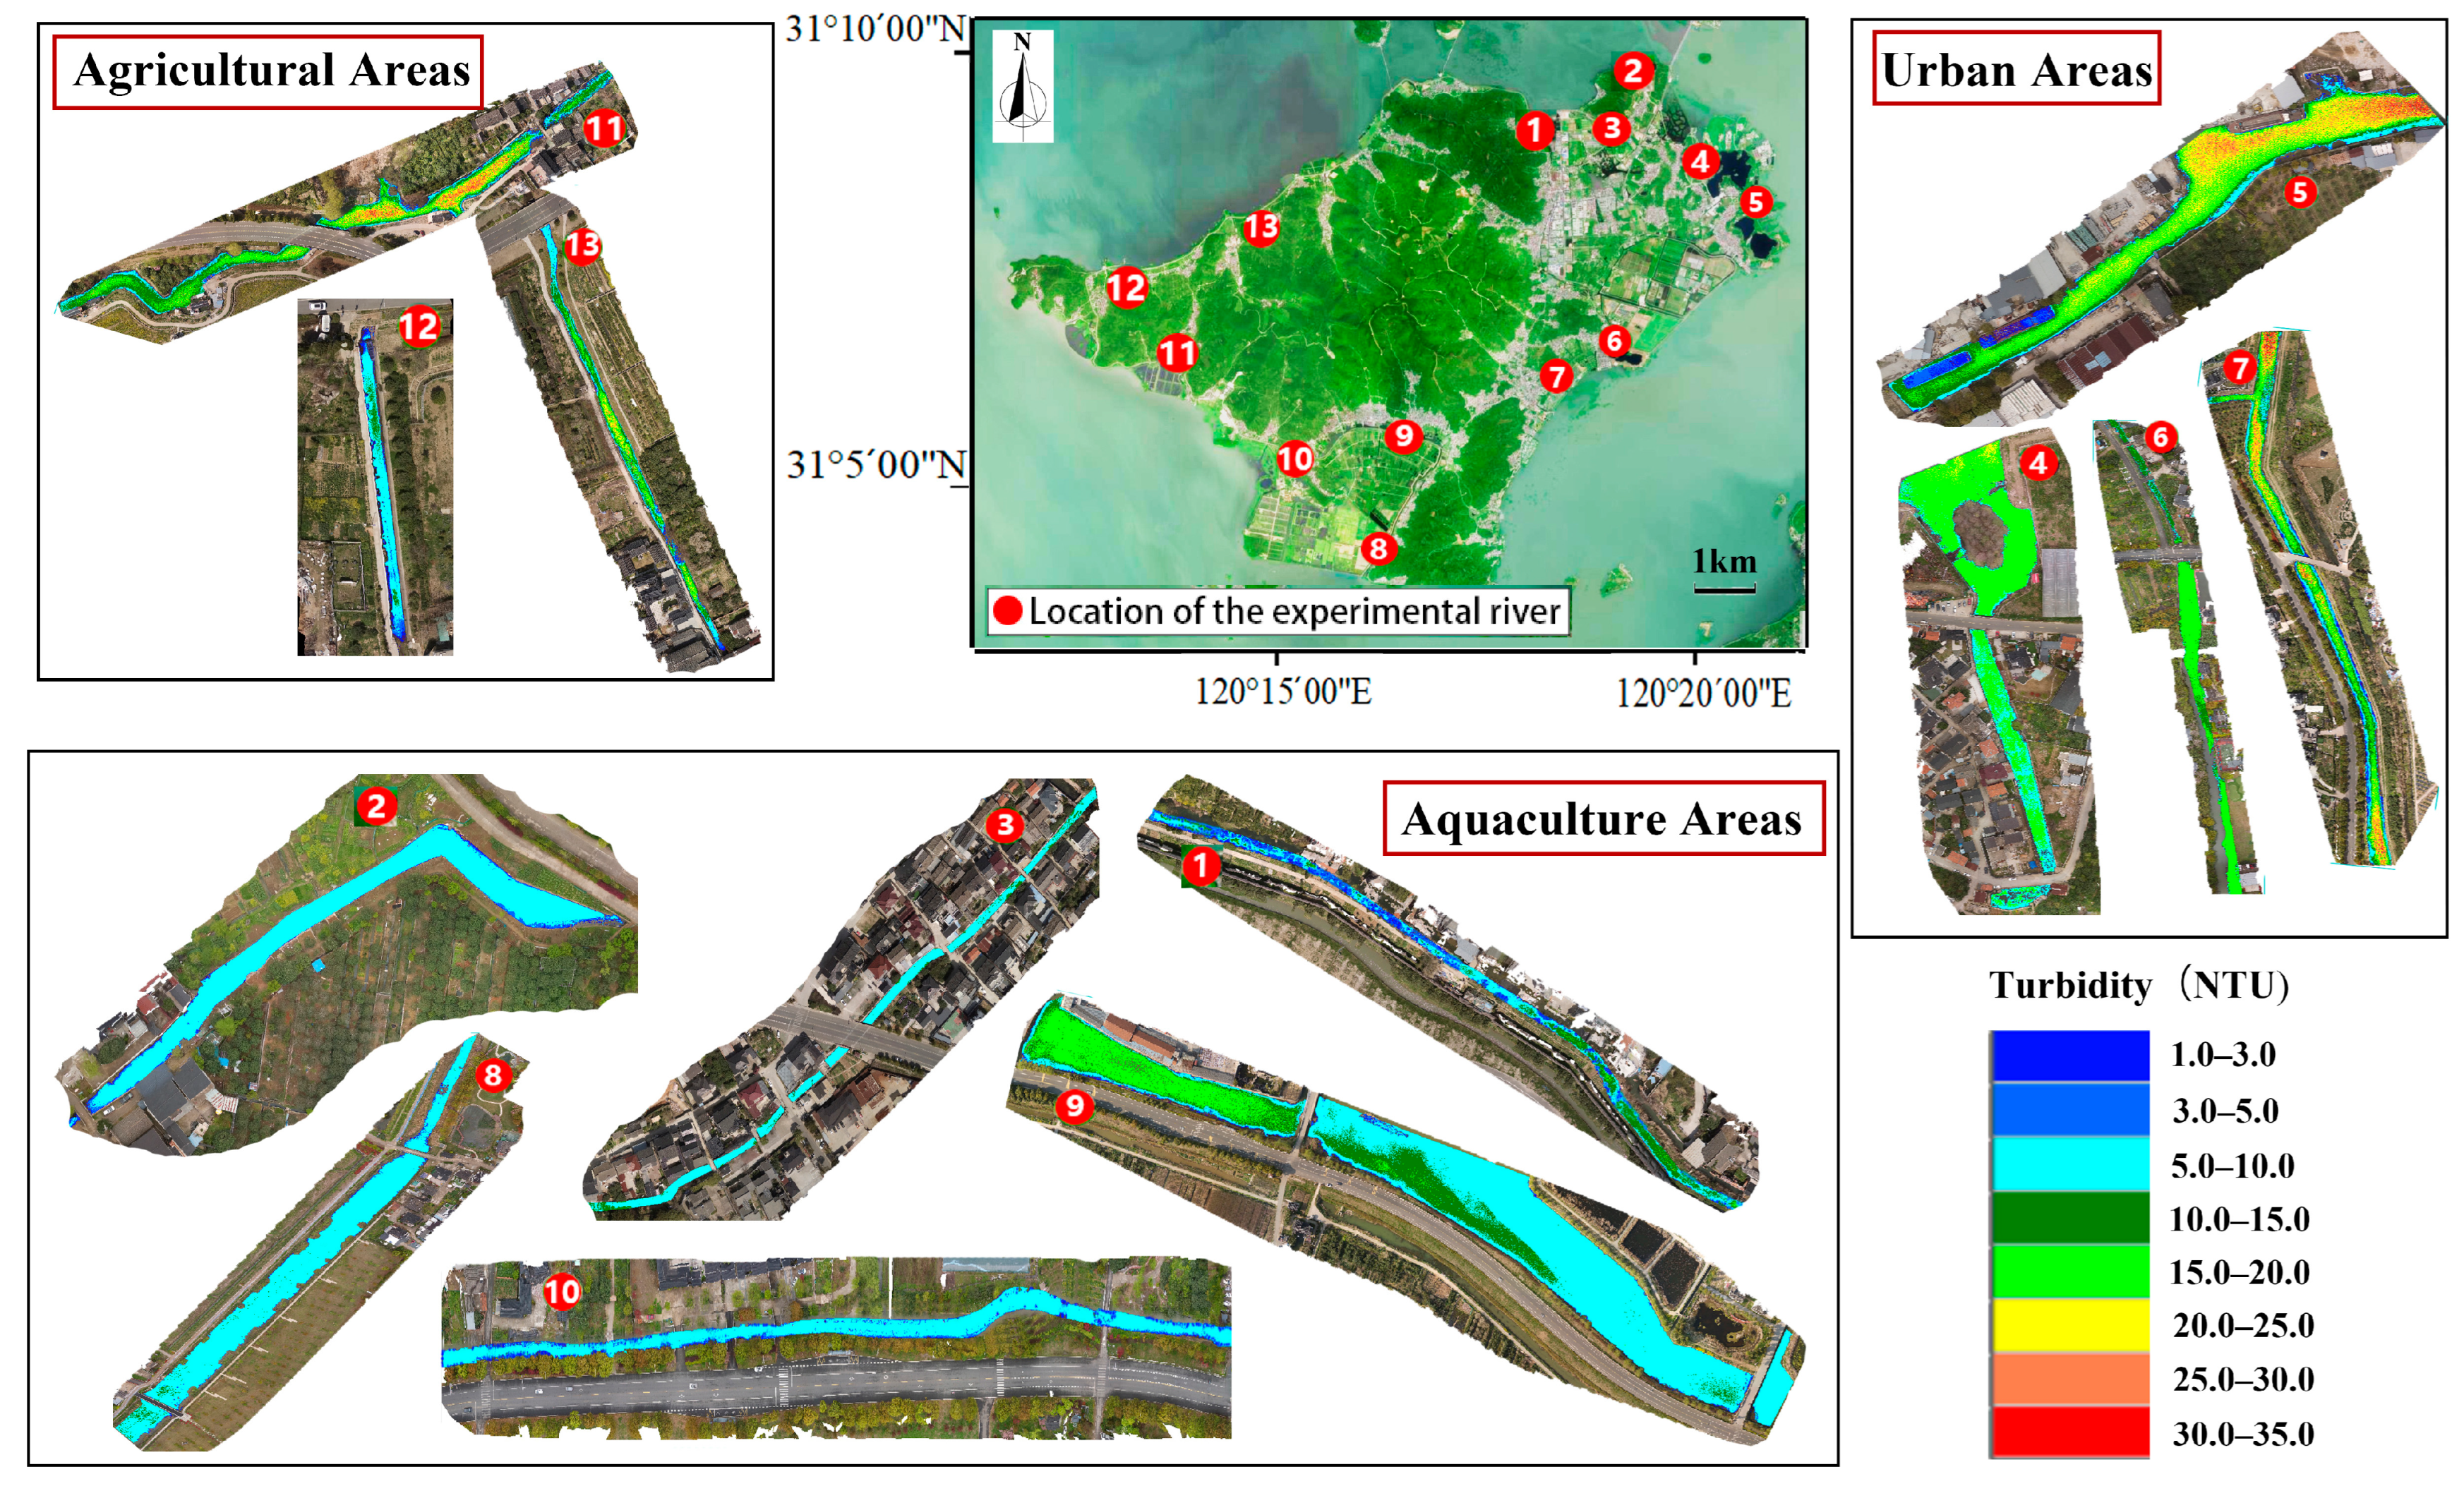
Xishan Island is located in the central area of Lake Taihu, between latitudes 31°02′ and 31°12′ N and longitudes 120°10′ and 120°23′ E (see
Figure 1). With a total area of approximately 82 km
2, it extends 15 km from east to west and 11 km from north to south, making it the largest island in Lake Taihu and the biggest island within a freshwater lake in China [
8]. Xishan Island is characterized by a hilly terrain with a high central region surrounded by lower areas; its highest point is Piaomiao Peak (336.6 m) at the island’s center. The island is crisscrossed by a dense network of rivers and streams, forming a relatively well-developed drainage system. There are currently about 60 rivers, most of which connect to Lake Taihu. Based on long-term records from two automatic weather stations on the island and 15 national stations in the Lake Taihu basin, the island has a mean annual temperature of 16.2 °C and receives an annual precipitation of approximately 1200 mm, with the flood season (May–September) accounting for over 60% of the total. The data for this study were collected in March 2025, which falls within the normal water period in terms of precipitation. Due to the small spatial extent of Xishan Island, spatial variability in meteorological forcing can be considered to have a uniform effect on water mixing processes. The island has a resident population of about 45,000, with the local economy primarily based on cultural tourism, high-quality agriculture, and aquaculture. Agriculture is characterized by a distinctive tea-fruit intercropping system: Biluochun tea bushes are interplanted with loquat, bayberry, and other fruit trees, covering a tea plantation area of roughly 2.23 × 10
4 mu. Historically, the island once supported large-scale enclosure aquaculture (with crab pond area peaking at about 5000 mu); however, since 2018, all enclosure aquaculture in Lake Taihu has been phased out, and the former crab ponds have been converted into high-standard farmland or constructed ecological wetlands.
In this study, the 13 inflow rivers on Xishan Island were selected as the study area for water quality monitoring and pollution status assessment. Based on the water body types and ecological characteristics of the island’s river network, the sampling sites were classified into three categories: urban area rivers, aquaculture area rivers, and agricultural area rivers (
Figure 1). Specifically, rivers numbered 4, 5, 6 and 7 are in the urban area, which is characterised by high population density and serves as the main waterway in the central district of Jinting Town on Xishan Island. Rivers numbered 1, 2, 3, 8, 9 and 10 are in the aquaculture area. Prior to 2018, these served as breeding grounds for Taihu Lake hairy crabs. They are now being progressively developed into ecological buffer wetlands to support naturally replenished fishery resources. Rivers numbered 11, 12 and 13 are in the agricultural area, primarily encompassing orchards, woodlands and cultivated fields.
2.2. Overall Technical Framework
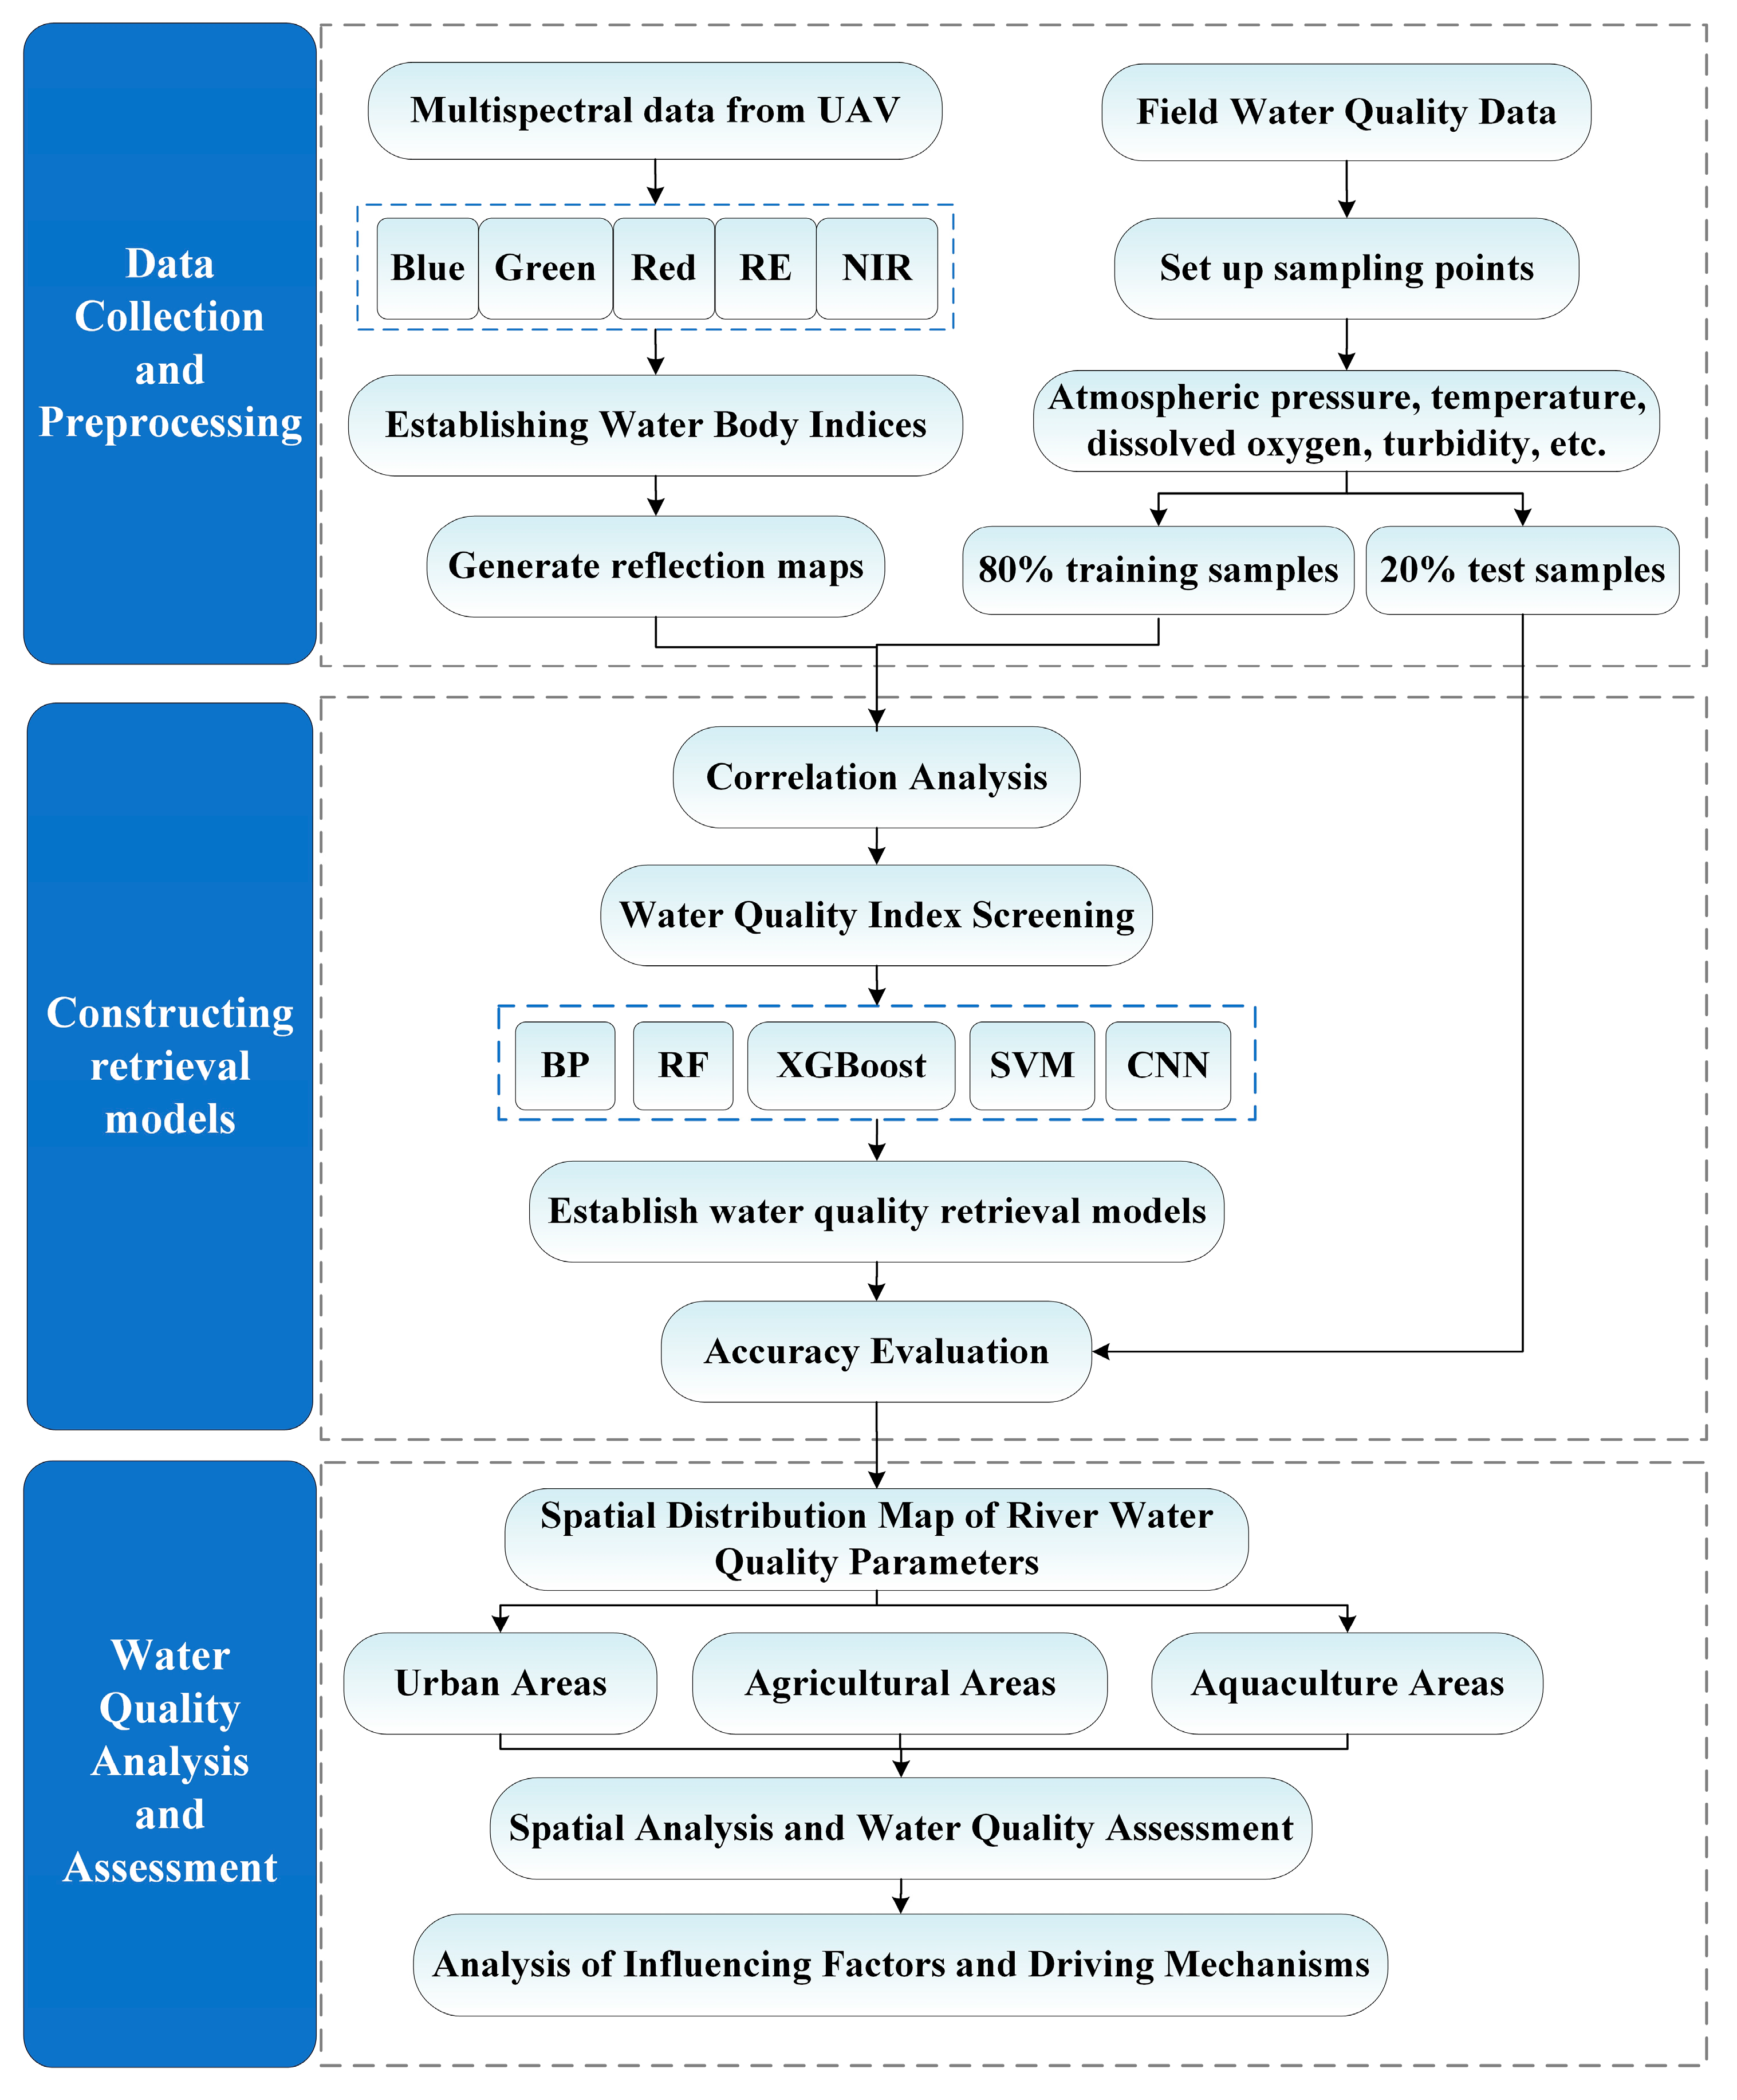
Figure 2 shows the three-step overall design of this project: data acquisition and preprocessing, construct retrieval models, and water quality analysis and assessment. First, multispectral data from UAV and ground-based water quality data are collected simultaneously. Then, preprocessing tasks such as radiometric calibration, geometric correction, and image mosaicking are performed. Then, the spectral characteristics of the imagery are examined thoroughly to construct water body indices and generate reflectance maps. Next, a correlation analysis is performed between spectral reflectance and water quality parameters to identify the optimal water body index. Then, using this index as the input variable, retrieval models are established through various machine learning algorithms. Finally, through accuracy assessment, the optimal retrieval model was selected to generate spatial distribution maps of water quality parameters for the inflow rivers, upon which spatial analysis and water quality evaluation were performed.
2.3. Acquisition of Water Quality Parameters and UAV Multispectral Data
In this study, sampling sites were evenly distributed along the rivers for water sample collection and water quality analysis. The layout of sampling sites and the sampling procedures followed the national technical specifications for surface water environmental monitoring [
47]. In situ water quality parameters were measured using a YSI ProDSS portable multi-parameter water quality instrument (YSI Inc., Yellow Springs, OH, USA). Prior to measurement, the instrument was calibrated according to the manufacturer’s instructions. During measurement, the sampling platform (boat or fixed shore point) was secured at each site, and the probe was lowered vertically to a depth of approximately 0.5 m below the water surface; recording began after the readings stabilized. Three replicate measurements were taken at each site and averaged. The collected water quality indicators included atmospheric pressure, water temperature, dissolved oxygen (optical method), electrical conductivity (EC), pH, and turbidity. Atmospheric pressure was also recorded, primarily as a calibration compensation parameter for the optical dissolved oxygen sensor to ensure data accuracy. Additionally, the name, latitude and longitude coordinates, and other relevant information of each sampling site were recorded. Atmospheric pressure was used primarily for calibration compensation of the dissolved oxygen sensor and served as a quality control parameter for the measured data. Water temperature was employed not only to verify the temperature compensation of dissolved oxygen concentration, but also as auxiliary information for the subsequent discussion on the thermal environment of the rivers.
This study concurrently collected aerial data via UAV and conducted field water quality sampling. A DJI Phantom 4 UAV (DJI, Shenzhen, China)equipped with visible light and multispectral sensors was employed as the data acquisition platform. The multispectral sensors included blue (450 nm), green (560 nm), red (650 nm), red edge (730 nm), and near-infrared (840 nm) sensors. A total of 15 flight lines were arranged to cover the entire study area, yielding 8658 raw images. The acquired imagery was of good quality with a ground resolution of 5 cm, meeting the requirements for river water quality retrieval.
2.4. Constructing Water Body Indices
The variety and concentration of pollutants in bodies of water cause differences in surface characteristics, such as color, turbidity, and transparency. They also alter the absorption and reflection properties of electromagnetic wavelengths. These variations manifest as distinct spectral features in remote sensing imagery. Previous studies indicate that water bodies exhibit strong absorption characteristics in the green light band and strong reflection properties in the near-infrared and red-edge bands [
14]. This project focuses on the red-edge and near-infrared bands. First, multiple water indices are selected and constructed from different band combinations. Then, normalization operations are performed. The names and calculation formulas for each index are listed in
Table 1.
For this project, the UAV remote sensing data has undergone radiometric calibration and reflectance scaling, with band values ranging between 0 and 1. The water body indices in
Table 1 use ratio operations to amplify numerical differences. This enhances the reflectance information of water bodies and achieves strong separation. These indices mitigate the effects of spatiotemporal variations, such as water surface smoothness and wave action, while partially eliminating the influence of other water quality factors. Consequently, they are well-suited for water quality analysis and retrieval studies.
2.5. Correlation Analysis
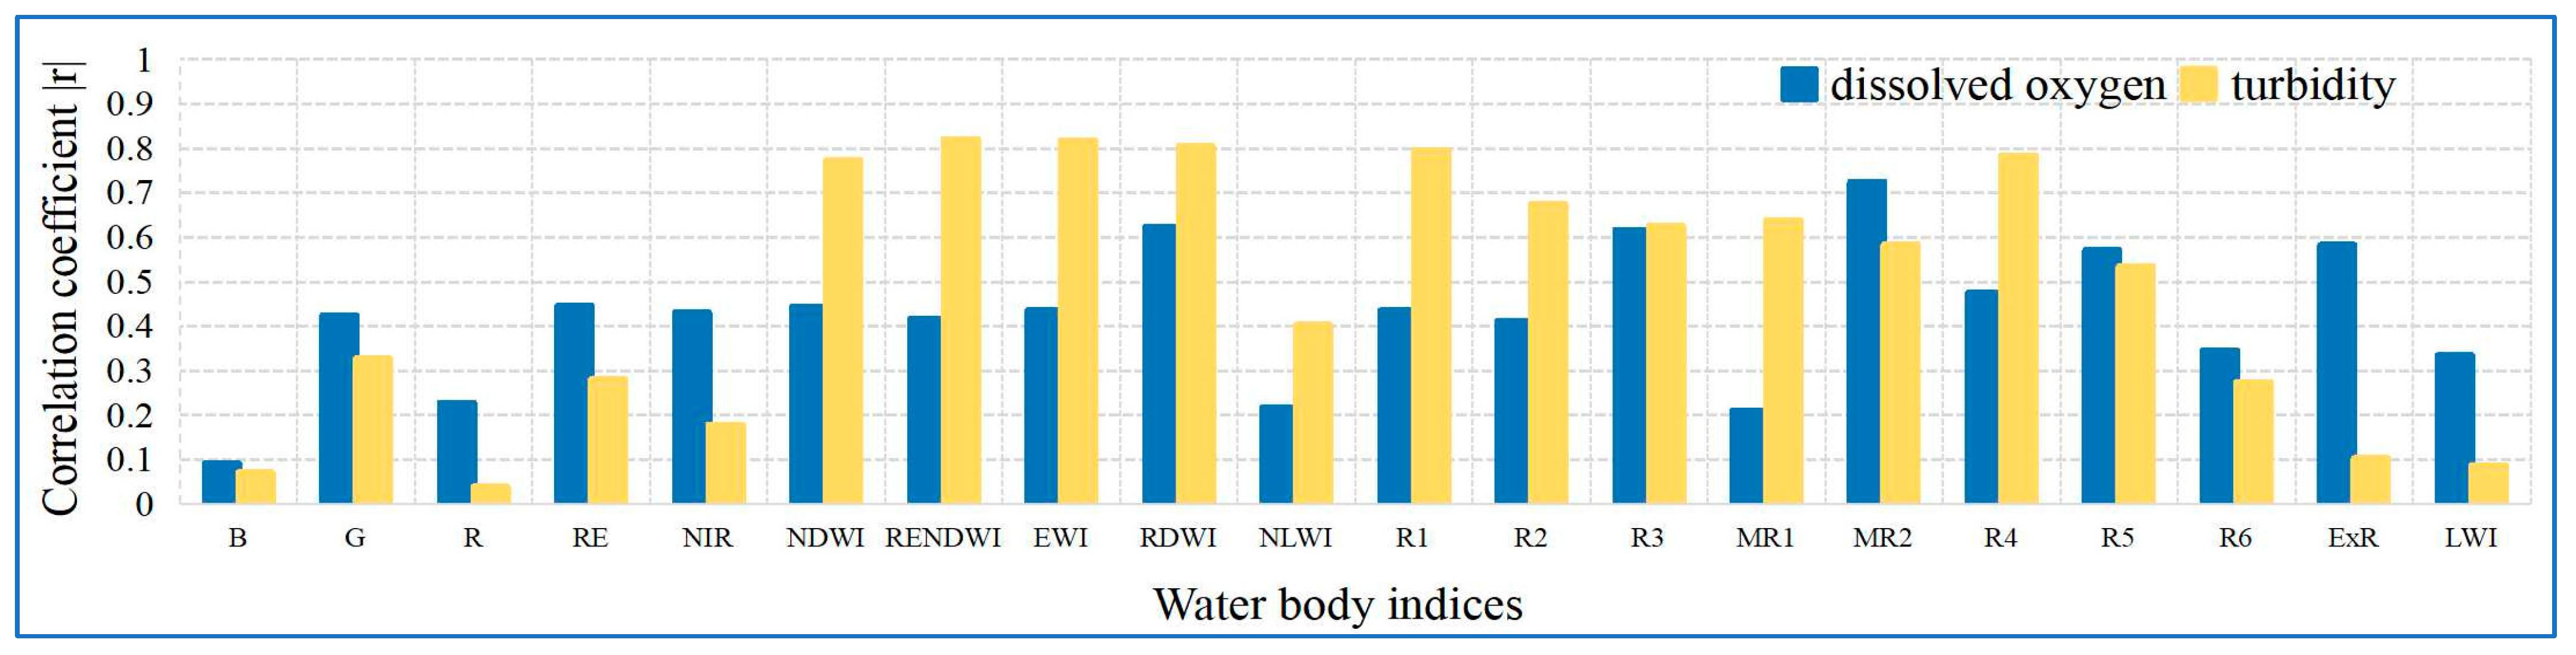
This study performed a correlation analysis of field-collected water quality parameters and the reflectance values of multiple water body indices to determine which index had the highest correlation coefficient. The analysis used the classical Pearson correlation coefficient method [
15]. Calculating the correlation coefficient determines the water body index most sensitive to water quality parameters. The formula for the correlation coefficient is as follows:
In the formula, represents the correlation coefficient, represent the sample values of spectral reflectance and water quality parameters, respectively, represent the arithmetic means of the sample data for the two variables, respectively.
2.6. Construction of Water Quality Parameter Retrieval Models
This project selected the following representative machine learning algorithms to construct water quality indicator retrieval models: BP neural network, Random Forest, XGBoost, SVM, and CNN.
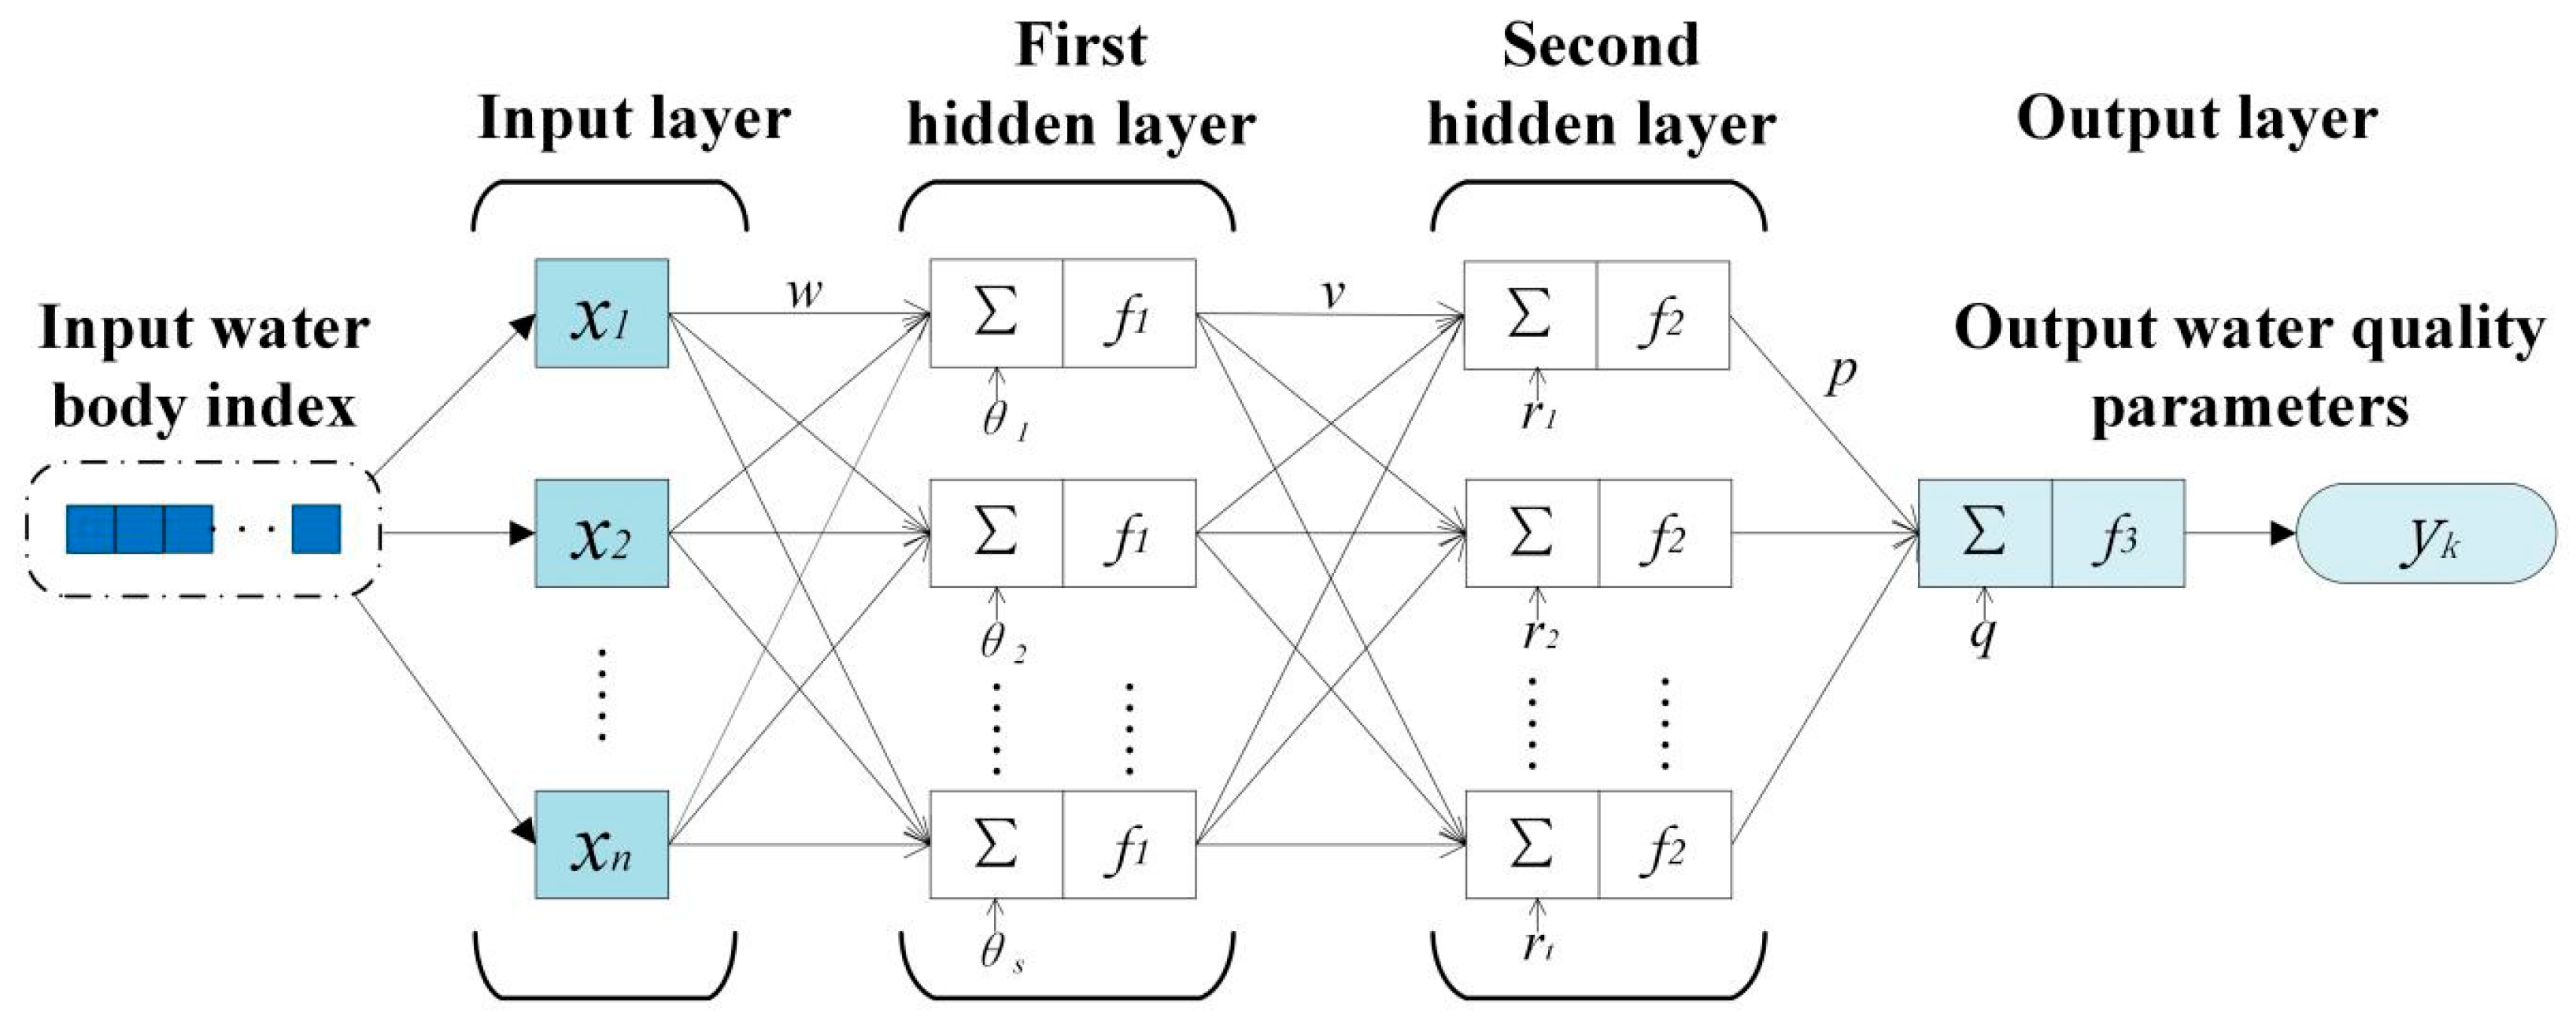
A BP neural network is a type of multilayer, feedforward neural network that uses the backpropagation learning algorithm.
Figure 3 shows the BP neural network structure diagram adopted in this project.
After repeated experiments, the learning rate was set to 0.0004 to balance training speed and network stability. The number of hidden-layer neurons was progressively adjusted until the training results stabilized and met the error requirement. Based on error comparisons and computational efficiency, the optimal BP network structures were determined. The key parameter settings are summarized as follows:
- (1)
Learning rate: 0.0004
- (2)
Optimal network structure (DO): 5–6–9–1
- (3)
Optimal network structure (Turbidity): 6–11–13–1
Random forest (RF) is an ensemble learning method based on decision trees and bagging. In this study, an RF regression model was built using the scikit-learn library in Python 3.11. Two key parameters—the number of input features at each split (Mtry) and the number of decision trees (N)—strongly affect model accuracy. A grid search was conducted over N = {400, 800, 1200, 1600, 2000, 2400} and Mtry = {1, 2, 3, 4, 5, 6}, and the optimal combination was obtained. The key parameter settings are summarized as follows:
- (1)
Number of decision trees (N): 1600
- (2)
Number of input features at each split (Mtry): 3
XGBoost, a regression tree-based algorithm developed by Chen in 2016, was implemented in this study using the scikit-learn interface in Python. The workflow consisted of splitting the data, setting hyperparameters, training the model, and generating predictions. The model was built with XGBRegressor(), trained using fit(), and predictions were made with predict(). The key hyperparameter settings are summarized as follows:
- (1)
max_depth: 6
- (2)
eta (learning rate): 0.01 (to prevent overfitting)
- (3)
gamma: 0.1
- (4)
lambda (L2 regularization): 2
- (5)
subsample: 0.8
- (6)
colsample_bytree: 0.7
Support Vector Machine (SVM), a machine learning algorithm introduced by Corinna Cortes and Vapnik in 1995, is based on the principle of structural risk minimization. In this study, SVM regression was adopted, which, unlike classification, seeks an optimal fitting curve that encompasses as many data points as possible within a given error margin. The performance of SVM depends on the scale, distribution, and characteristics of the specific dataset. A systematic balance among the penalty coefficient C, the kernel parameter σ, and the error tolerance ε is required to achieve the best trade-off between fitting the training data and maintaining generalization ability. Considering that ε had a relatively minor impact on the model, it was fixed at 0.15, and the optimization focused on C and σ. The optimal parameter combination was obtained through systematic parameter search. The key parameter settings are summarized as follows:
- (1)
Error tolerance (ε): 0.15 (fixed)
- (2)
Penalty coefficient (C): 18.5
- (3)
Kernel parameter (σ): 0.6
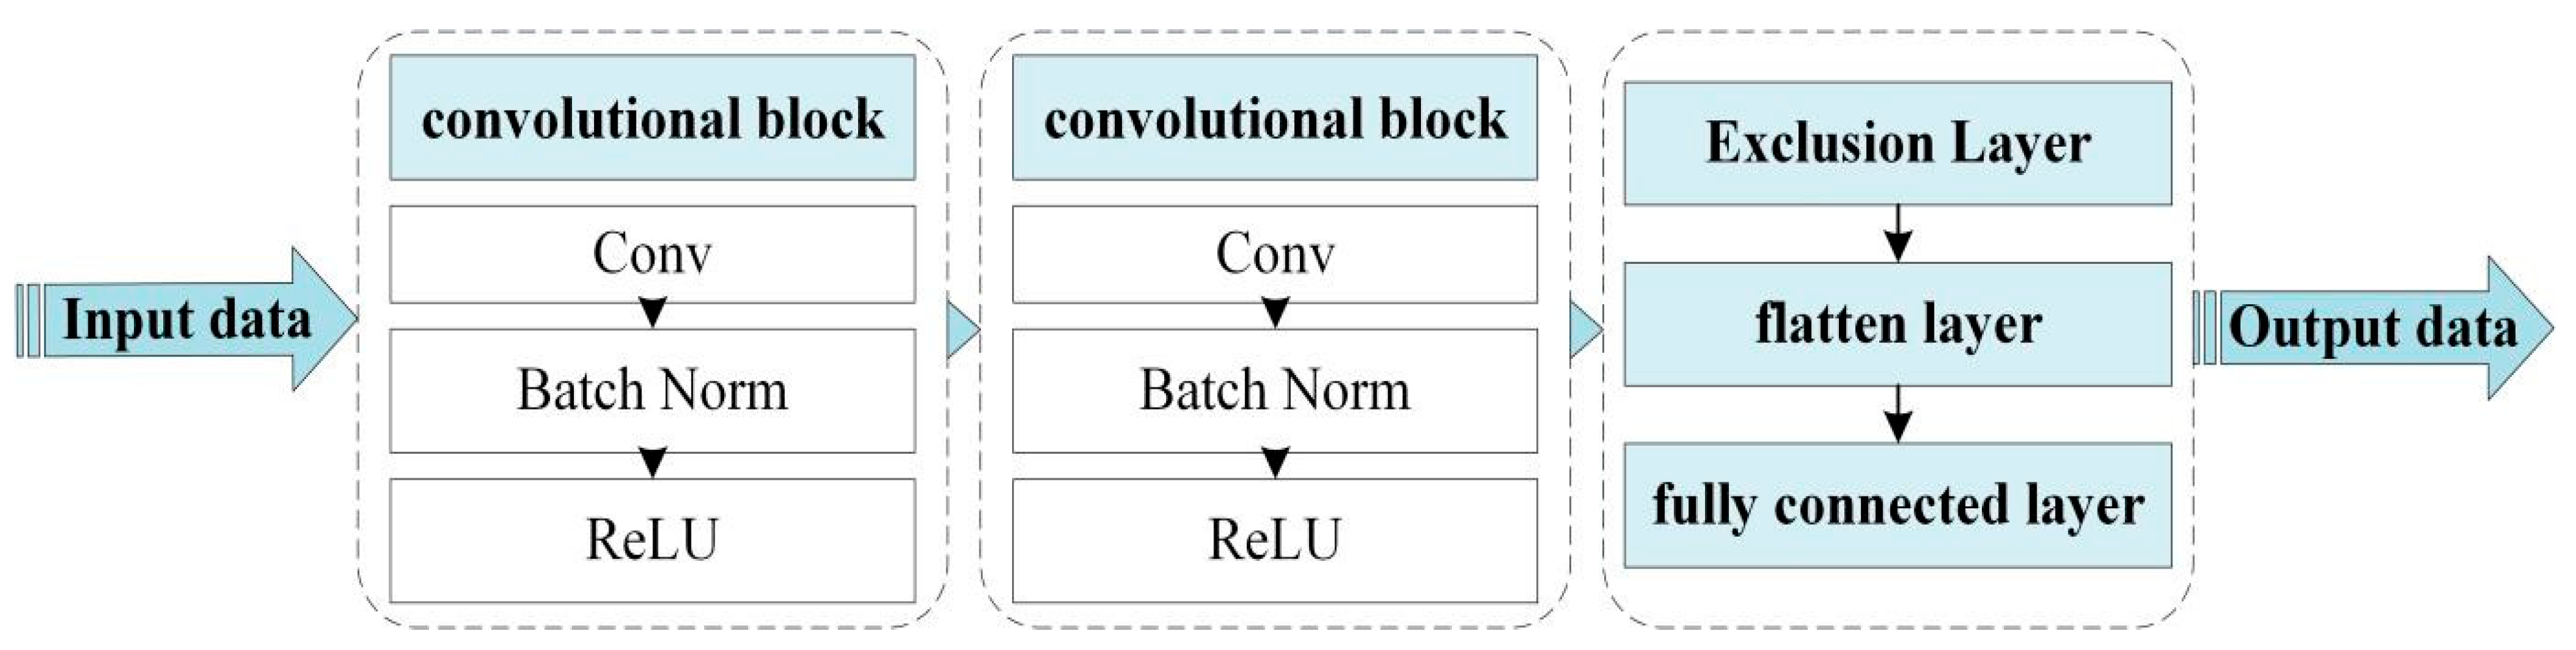
CNN is a feedforward neural network that performs well in object recognition and regression tasks [
48]. The architecture used in this study, illustrated in
Figure 4, consists of two convolutional blocks and one fully connected layer. To determine the appropriate number of convolutional blocks, we compared single-, double-, and triple-block architectures under the same training settings. The double-block model achieved markedly higher average test accuracy than the single-block counterpart, whereas the triple-block model improved accuracy by less than 2% while increasing parameter count by approximately 35% and showing signs of overfitting. Considering the small sample size, representational capacity, generalization performance, and computational efficiency, the two-block architecture was ultimately selected. Each convolutional block contains a convolutional layer (Conv), a batch normalization layer (Batch Norm), and a rectified linear unit (ReLU) activation. A dropout layer is placed before the fully connected layer to prevent overfitting, and a flatten layer converts the data into a one-dimensional array for input into the fully connected layer. No pooling layers are included, as their dimensionality reduction effect is negligible for small image patches. The overall network is relatively simple, consistent with previous findings that deep networks are unnecessary for water quality retrieval [
28]. The key architectural settings are summarized as follows:
- (1)
Number of convolutional blocks: 2
- (2)
Convolutional block composition: Conv + Batch Norm + ReLU
- (3)
Pooling layers: None
- (4)
Dropout layer: placed before the fully connected layer
- (5)
Fully connected layers: 1
4. Water Quality Retrieval Results
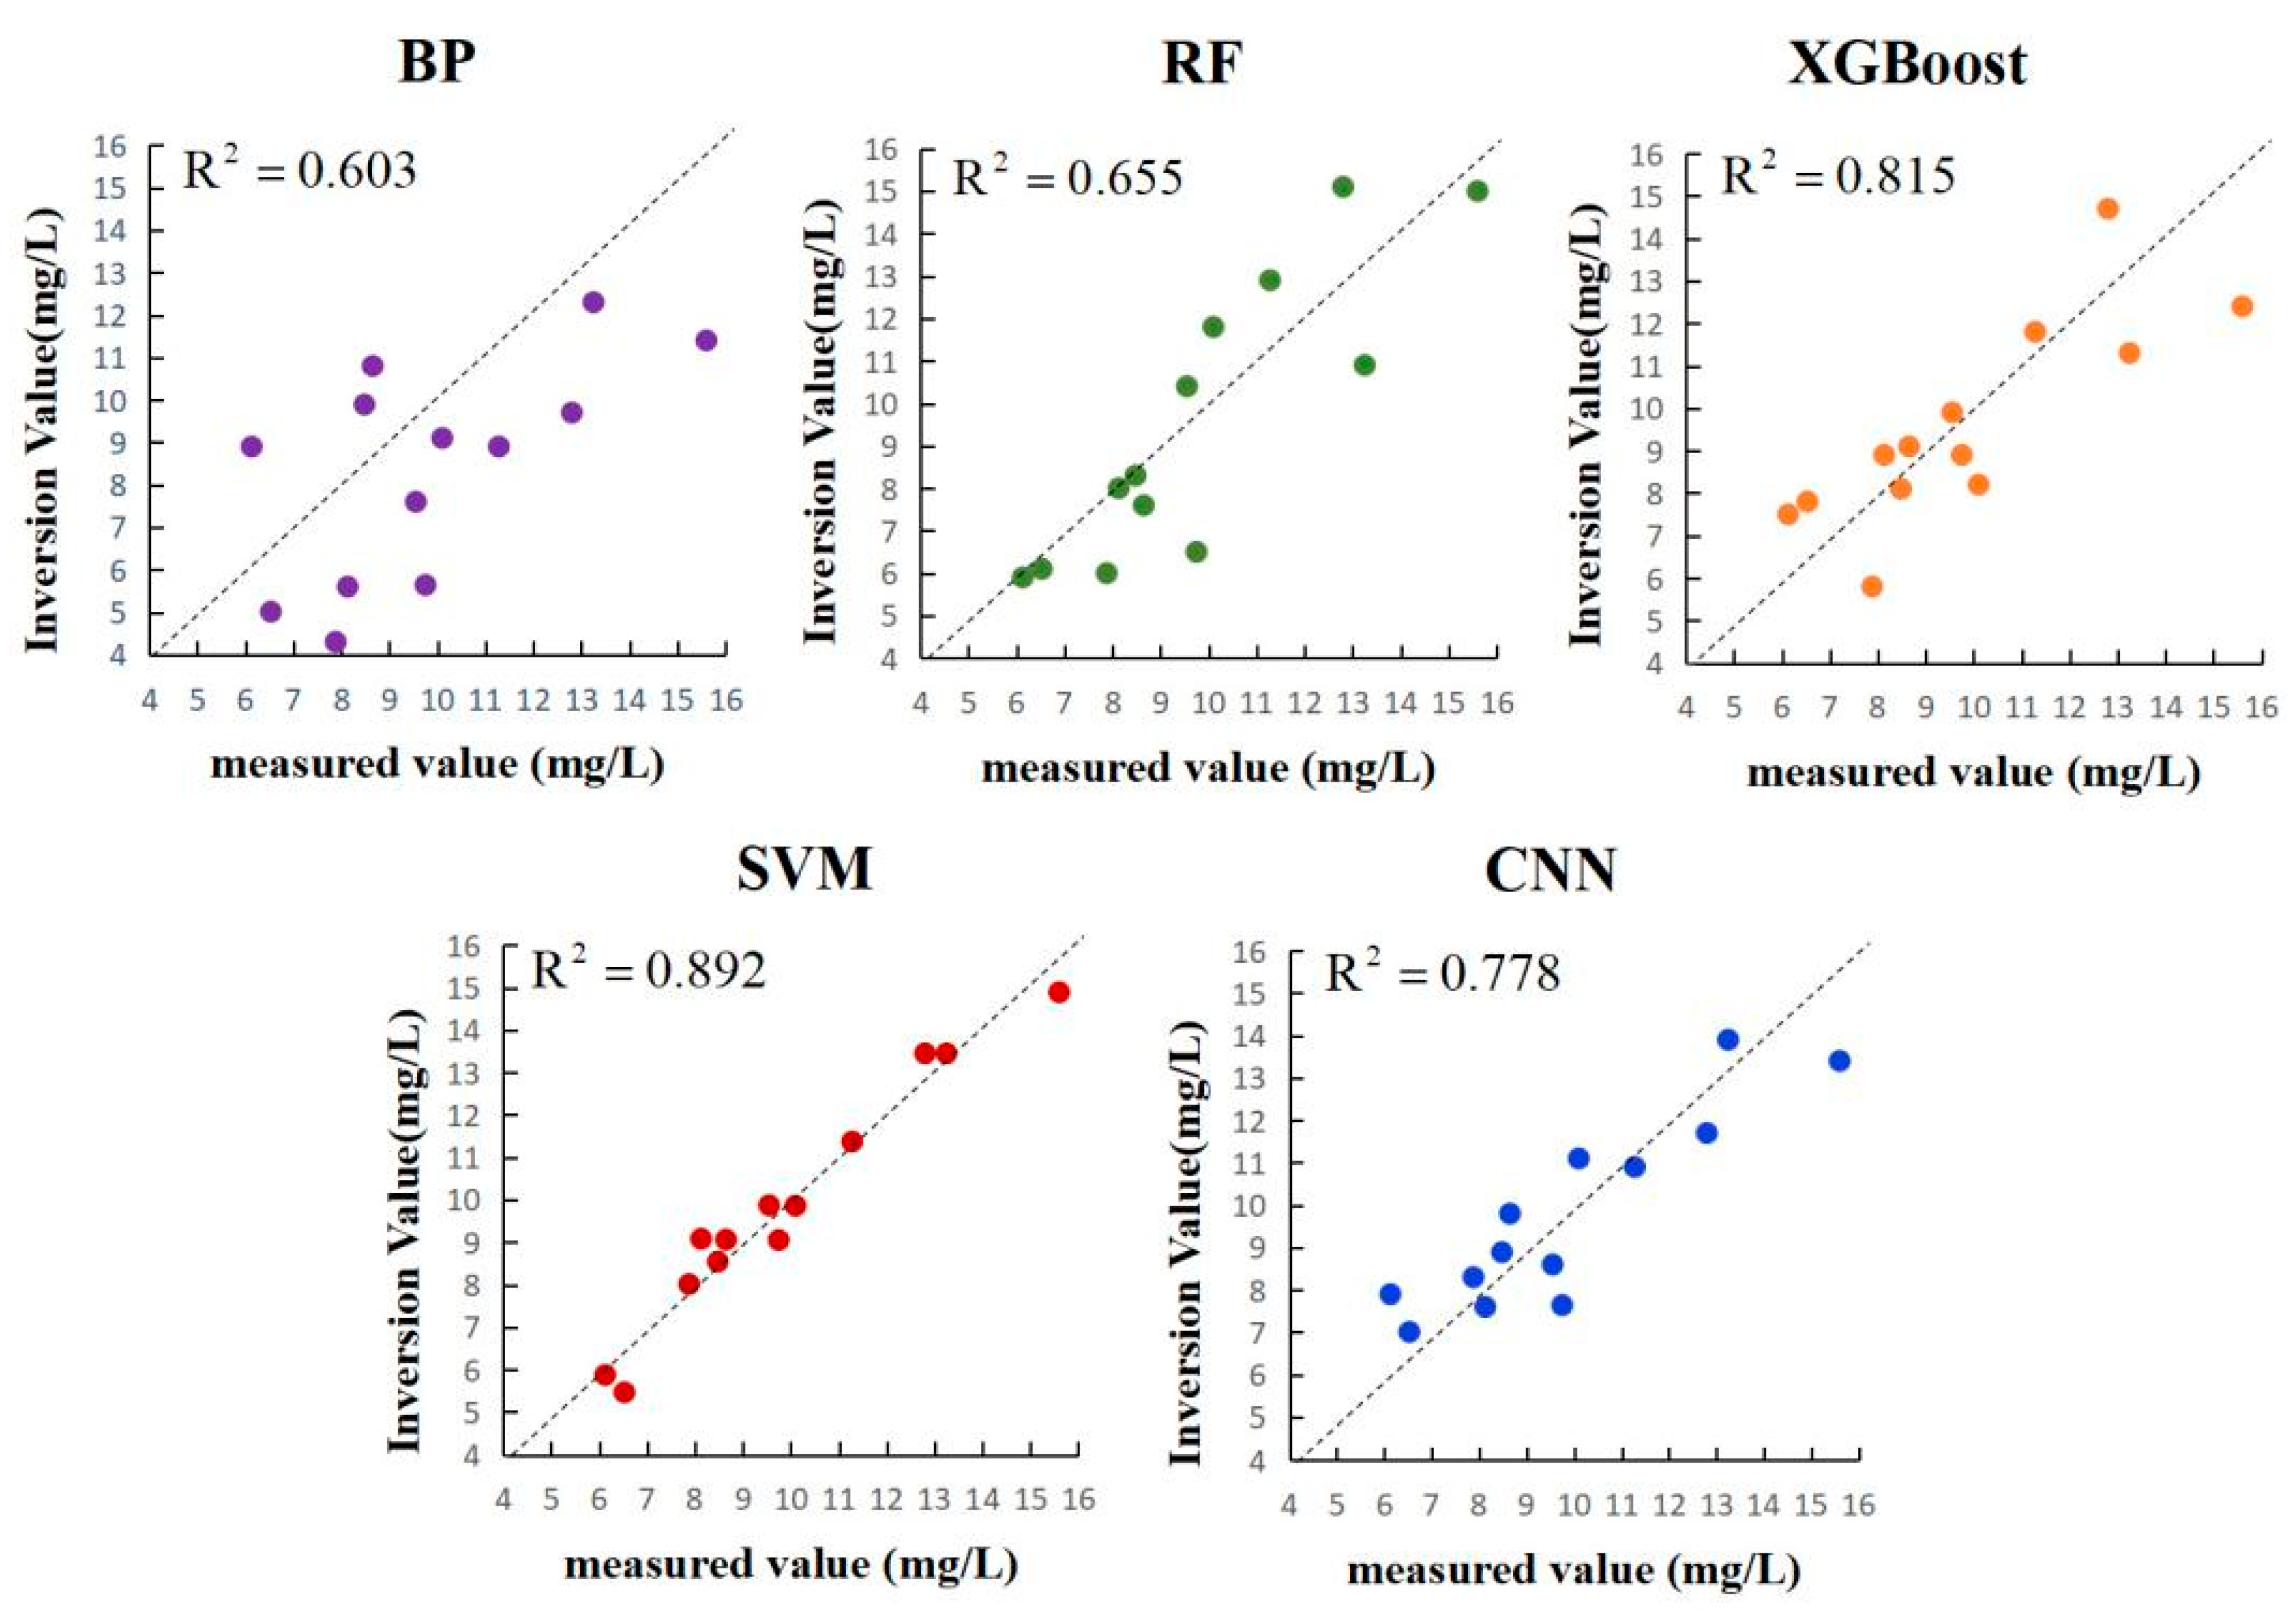
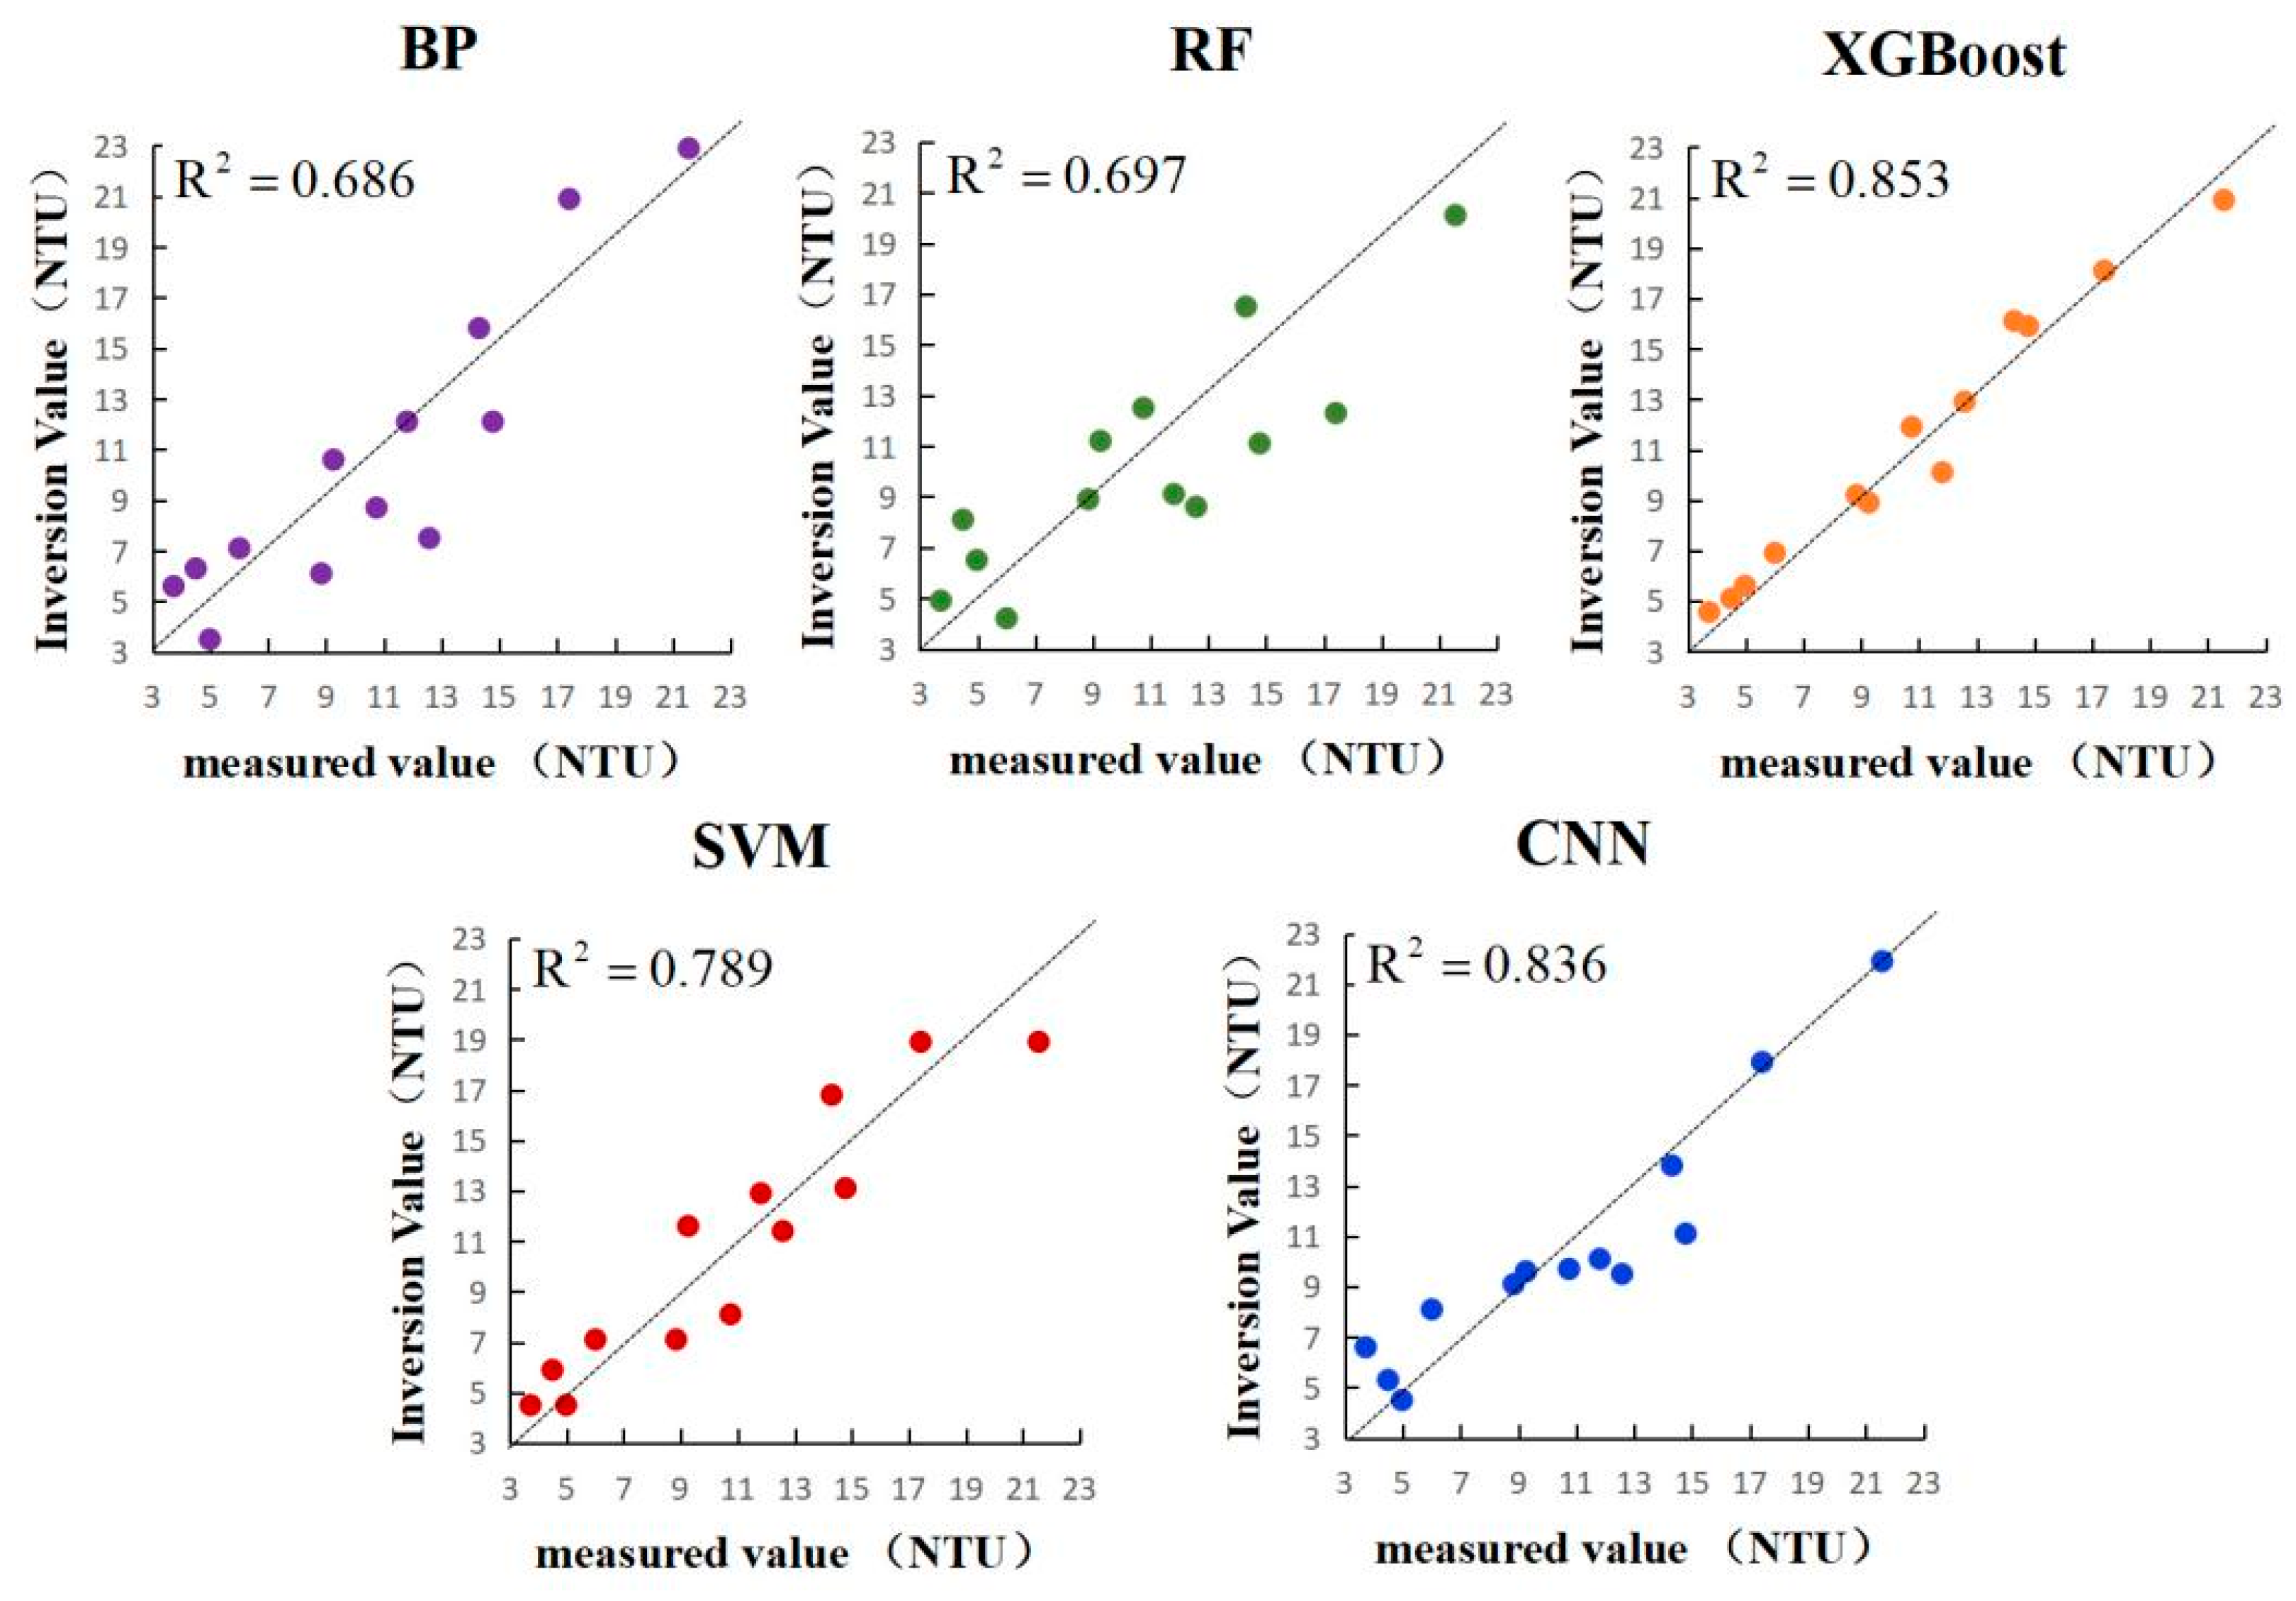
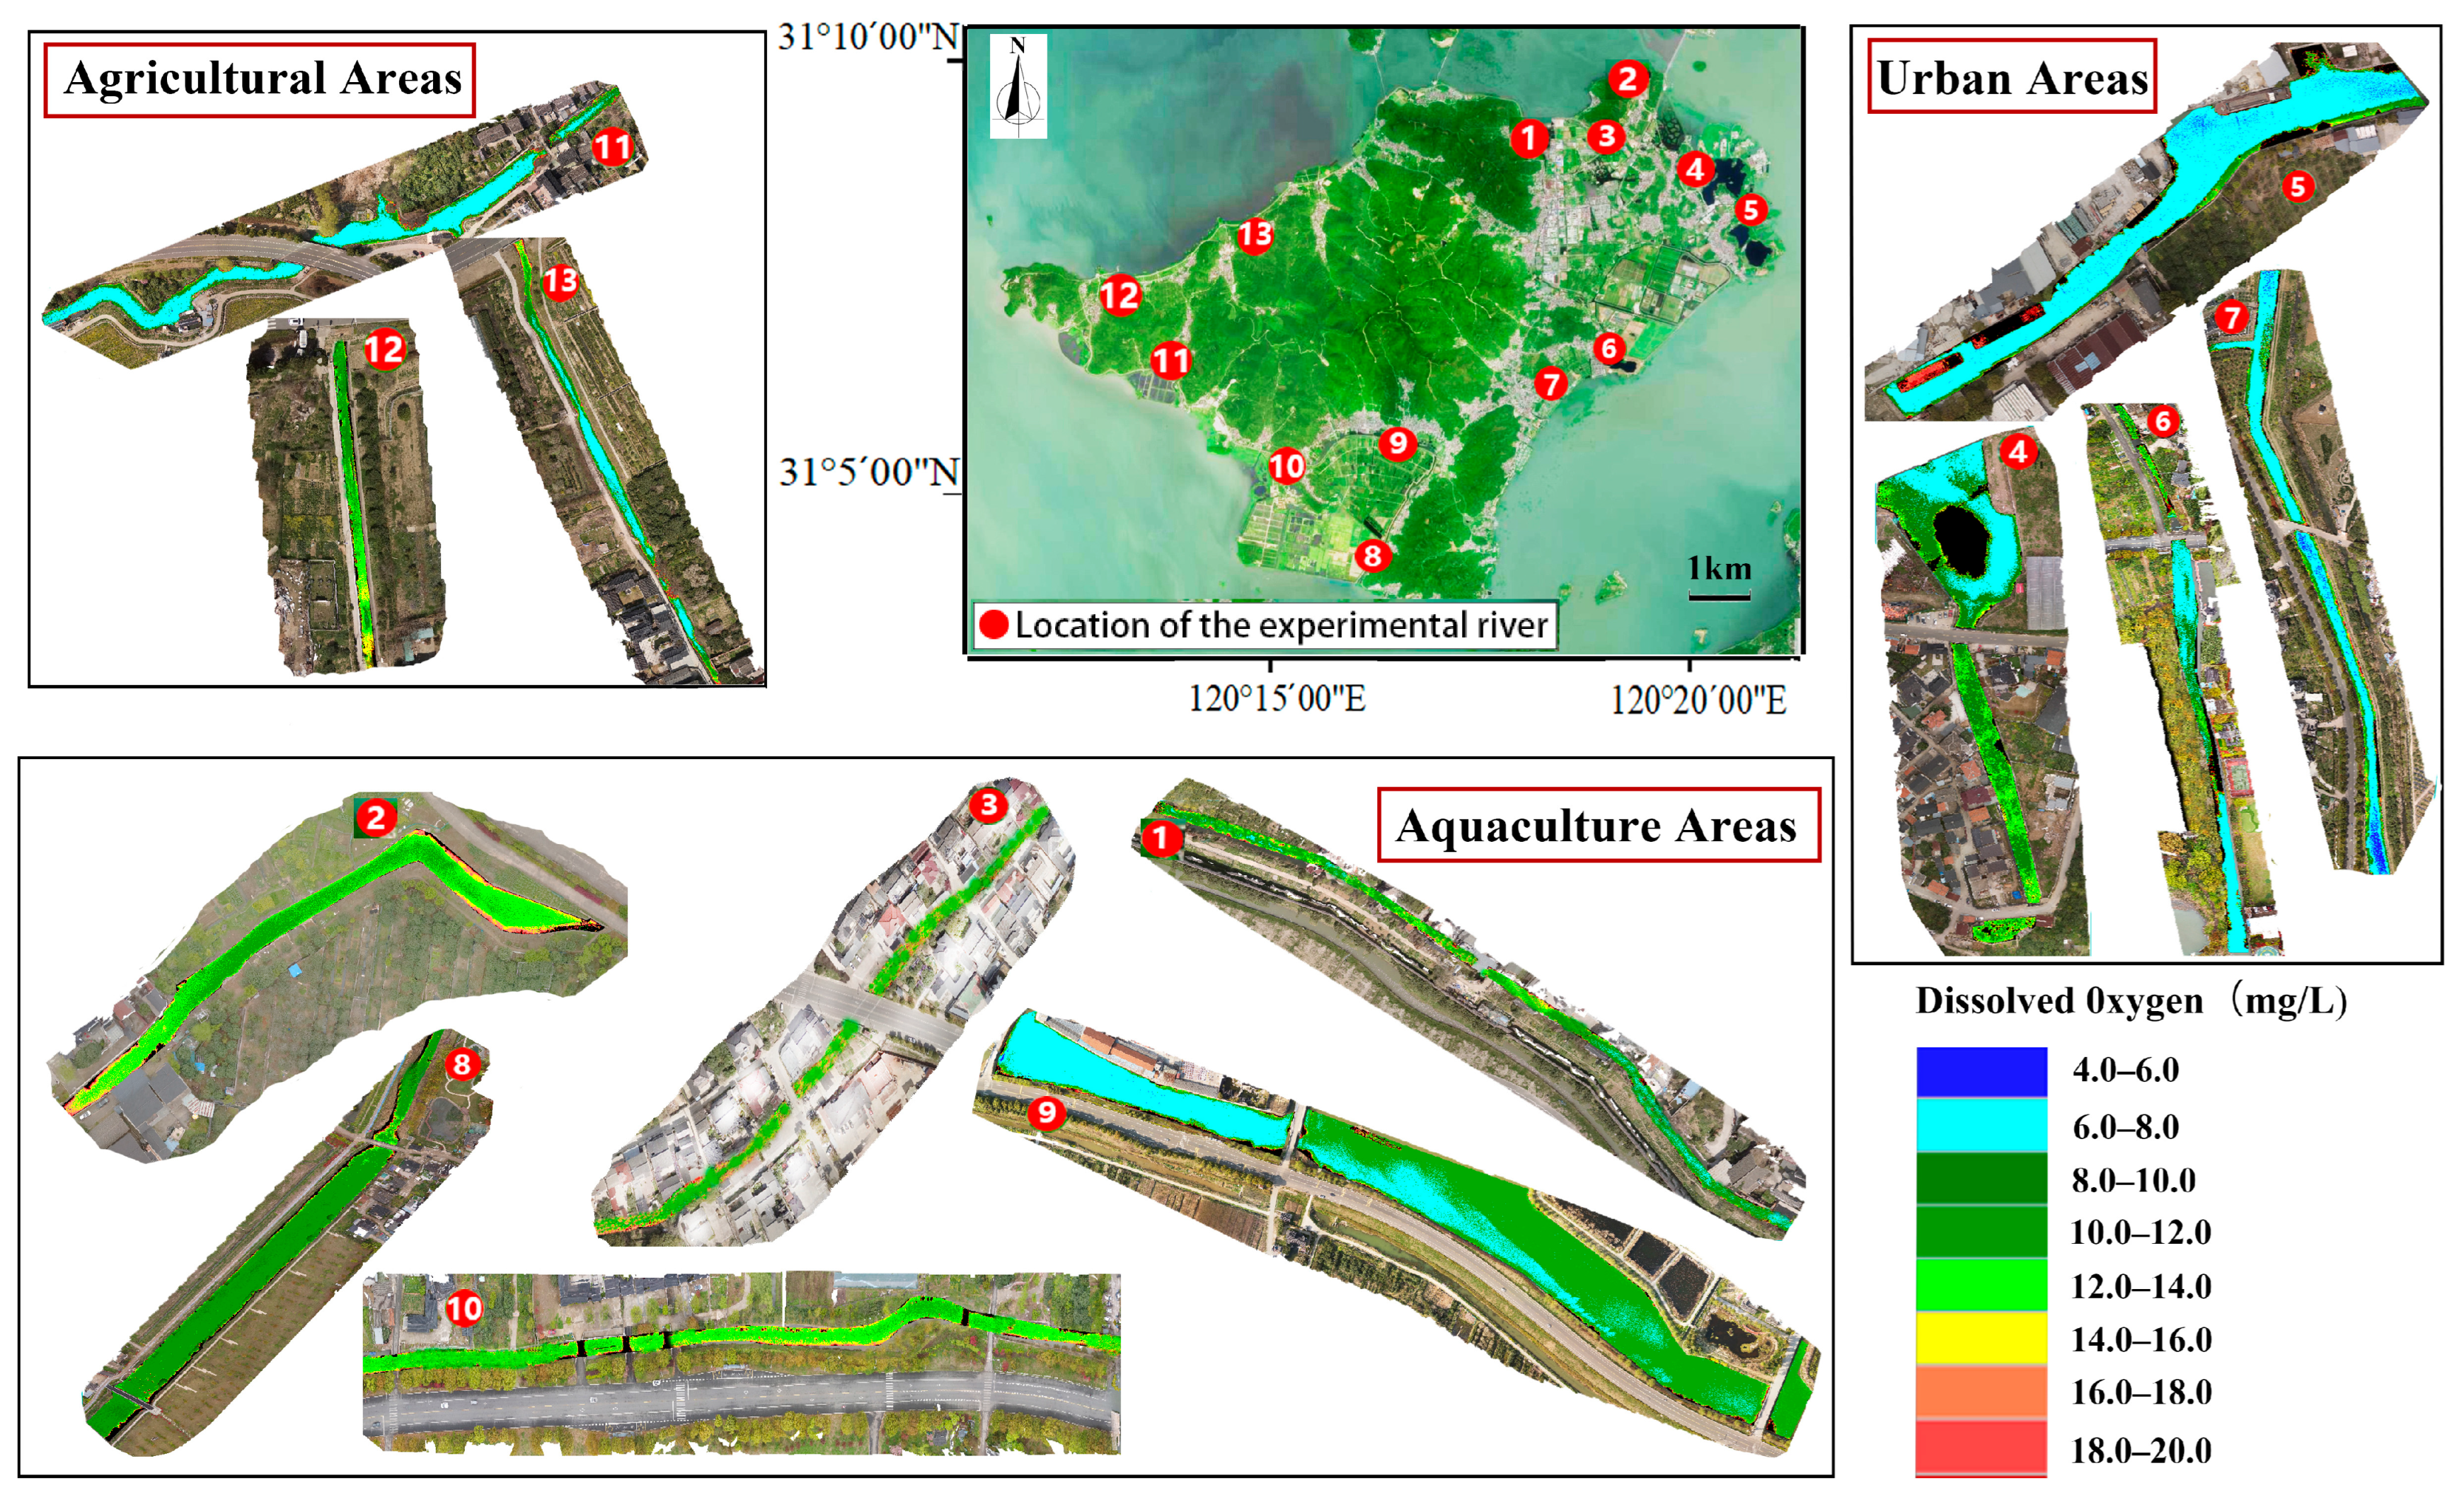
Based on the accuracy assessment results mentioned earlier, this study used the SVM and XGBoost neural network models, which had the highest predictive accuracy, to process water body index reflectance maps derived from UAV multispectral imagery.
Figure 8 and
Figure 9 show the spatial distribution maps of dissolved oxygen and turbidity for 13 inflow rivers.
According to the national standards “Surface Water Environmental Quality Standard GB3838-2002 [
47],” “Determination of Turbidity in Water GB13200-91 [
49],” and the classification method for dissolved oxygen and turbidity limits in “Sanitary Standard for Drinking Water GB 5749-2022 [
50],” surface water environmental quality is classified into Classes I through V (see
Table 3).
As shown in
Figure 8 and
Table 3, during the sampling period (spring normal-water period), the dissolved oxygen (DO) concentrations in the inflow rivers of Xishan Island were generally high, ranging from 6.0 to 16.0 mg/L. With reference to the Environmental Quality Standard for Surface Water (GB3838-2002), most sampling sites met the Class I or Class II water quality standards. Among them, rivers 1, 2, 3, and 10 exhibited the highest DO values (12.0–16.0 mg/L) and were geographically located in the aquaculture area. The aquaculture area lies at the junction of urban and agricultural areas. Rivers 11, 12, and 13, located in the agricultural area, had DO values mainly between 6.0 and 12.0 mg/L. Rivers 4, 5, 6, and 7, located in the urban area, had DO values primarily between 4.0 and 10.0 mg/L. Overall, the DO concentrations followed the order: aquaculture area rivers (1, 2, 3, 8, 9, 10) > agricultural area rivers (11, 12, 13) > urban area rivers (4, 5, 6, 7).
As shown in
Figure 9 and
Table 3, the turbidity of the inflow rivers spanned a relatively wide range from 3.0 to 30.0 NTU, generally falling within low-to-moderate turbidity levels. Rivers 4, 5, 6, and 7, located in the urban area, recorded higher turbidity values between 15.0 and 30.0 NTU. Rivers 11, 12, and 13, situated in the agricultural area, had turbidity values between 5.0 and 25.0 NTU. Rivers 1, 2, 3, 8, 9, and 10, in the aquaculture area, exhibited the lowest turbidity values between 1.0 and 15.0 NTU. Overall, the turbidity values followed the order: urban area rivers (4, 5, 6, 7) > agricultural area rivers (11, 12, 13) > aquaculture area rivers (1, 2, 3, 8, 9, 10). The retrieval results of water quality parameters in this study were in good agreement with the river conditions observed during the field surveys.
5. Discussion
5.1. Comparative Summary of Machine Learning Models
In this study, five typical machine learning models were selected to investigate their robustness and accuracy in urban river water quality monitoring. Previous similar studies usually adopted a single statistical or machine learning method for water quality retrieval and prediction [
13,
23,
32]. For example, the predictive performance of XGBoost was validated in [
35], the BP neural network was tested in [
25], and SVM and random forest were mainly examined in [
23]. These studies lack a comparative summary of different retrieval models for water quality monitoring. Our results further indicate that different retrieval models are suitable for different data types and data quality.
The BP neural network offers good nonlinear approximation, self-learning, and fault tolerance with a flexible network structure, but it learns and converges slowly and is prone to overfitting, limiting its generalization. Random forest trains fast, has strong noise resistance, and handles high-dimensional data well, but is unsuitable for data with few features. XGBoost incorporates regularization and pruning, making it simple, fast, and accurate, yet it involves many parameters, complex tuning, and is better suited to structured rather than high-dimensional data. SVM can effectively fit nonlinear spectral characteristics of water, performs robustly under small sample sizes and noise, requires relatively few modeling data, and shows relatively strong generalization; however, it is sensitive to parameter selection and input data quality, and its interpretability is often low. CNN can automatically extract spatial features and handle complex nonlinear relationships, but it requires large amounts of labeled data, substantial computational resources, and careful model design.
When performing water quality monitoring and retrieval, factors such as application scenario, data characteristics, algorithm performance, interpretability, and computational efficiency should be comprehensively considered to select the most suitable algorithm for achieving optimal prediction accuracy, efficiency, and practicality. Our findings provide an important reference for future in-depth research.
5.2. Effect Evaluation and Analysis of the Influencing Factors of Retrieval Models
By integrating the water quality retrieval results with factors including precipitation, land use types, human activities, and urban planning, this study explored the driving mechanisms of the spatial differentiation of water quality in the inflow rivers of Xishan Island. Overall, differences in the main pollutant sources were the fundamental reason for the significant variation in pollution levels among rivers [
51].
The retrieval results revealed a pronounced urban-rural functional gradient in water quality across the study area: dissolved oxygen (DO) concentrations generally followed the order of aquaculture area rivers > agricultural area rivers > urban area rivers, while turbidity displayed a completely opposite trend. This pattern was highly coupled with land use intensity and the types of human activities in the region.
- 2.
Urban area: driving factors of high turbidity and low dissolved oxygen
The urban area (e.g., rivers 4, 5, 6, and 7), located in the Jinting Town center, is characterized by high population density and intensive construction land. The formation of its water quality characteristics was closely related to the following factors. First, the high proportion of impervious surfaces (asphalt, concrete) caused rapid concentration of surface runoff during rainfall, carrying large amounts of road dust, oil, and debris directly into rivers, significantly increasing suspended particulate matter (turbidity). Second, although centralized domestic sewage treatment facilities were available, the high population density and large sewage generation might lead to illicit discharges of untreated sewage; the decomposition of organic-rich sewage consumed substantial oxygen, which was a key reason for lower DO. In addition, most rivers in this area had artificial hard embankments, poor water mobility, unfavorable natural reaeration conditions, and lacked vegetated buffer strips to effectively intercept and filter particulate matter in runoff, further aggravating water quality deterioration. This finding is consistent with previous studies showing that intensively human-impacted areas negatively affect water quality [
52]. Compared with previous studies that focused on single large rivers [
36], the multi-river spatial gradient across different functional areas revealed in this study provides a more comprehensive perspective for understanding the spatial heterogeneity within island watersheds. The pronounced urban–rural water quality gradient observed in this work can serve as a basis for formulating land-use-specific pollution control strategies.
- 3.
Agricultural area: transitional characteristics of moderate turbidity and moderate dissolved oxygen
The agricultural area (e.g., rivers 11, 12, and 13) exhibited water quality intermediate between the urban and aquaculture areas. The economy of Xishan Island is dominated by agriculture, especially fruit tree and tea cultivation, with a farmed area of approximately 36.58 km
2. Heavy fertilization of tea and fruit orchards is an important means to ensure yields, but inefficient use of pesticides and fertilizers causes some chemicals to enter rivers via surface runoff, becoming a major agricultural non-point pollution source [
8]. The sampling period (spring) coincided with post-plowing and post-fertilization, leaving soil bare; rainfall readily washed soil particles into ditches, explaining why turbidity in the agricultural area, though lower than in the urban area, remained at a moderate level. Meanwhile, these rivers were mostly short and narrow with poor water exchange. Although their natural reaeration conditions were better than those of urban hardened channels, allowing a moderate recovery of DO, the decomposition of agricultural fertilizers and organic matter entering the rivers consumed oxygen, inhibiting further improvement of DO. The transitional water quality in the agricultural area is consistent with findings reported in other tea–fruit intercropping regions [
6,
7], confirming that fertilizer leaching from orchards and tea plantations constitutes a chronic source of nutrients to adjacent rivers. Our results further indicate that the water quality conditions in agricultural rivers arise from a dynamic balance between fertilizer inputs and natural purification. This mechanism may provide a reference for the design of agricultural management practices in small-watershed systems.
- 4.
Aquaculture area: causes of low turbidity and high dissolved oxygen
The aquaculture area (e.g., rivers 1, 2, 3, 8, 9, and 10) showed the best water quality, especially high DO and low turbidity. This was mainly attributed to the complete withdrawal of enclosure aquaculture in Lake Taihu in recent years and the construction of ecological buffer wetlands [
7]. This area currently has a low population density, is less affected by external runoff erosion, and maintains clear water through management practices (e.g., periodic application of flocculants, probiotics, or water exchange), effectively reducing turbidity. Low turbidity facilitates light penetration, promoting photosynthesis of submerged plants and algae and generating abundant oxygen. Meanwhile, the open water surface and good air circulation also enhance atmospheric reaeration. In addition, organic detritus from uneaten feed of fish and crabs in historical aquaculture may have provided nutrients for phytoplankton, contributing extra photosynthetic oxygen production during daytime sampling, which is consistent with related findings [
8]. The marked improvement in water quality in the aquaculture area demonstrates the positive effects of ecological restoration after the removal of enclosure aquaculture and the reduction of anthropogenic disturbance. Ecological compensation and wetland construction have proven effective in accelerating the recovery of riverine dissolved oxygen levels and reducing turbidity.
- 5.
Discussion of other common influencing factors
The results also indicated that green landscape belts along rivers (mainly composed of grasslands and sparse woodlands) had a positive effect on water quality improvement [
36,
39]. The mechanism may involve these vegetation belts effectively trapping sediments and intercepting pollutants, making the water clearer, which was consistent with our field observations [
34].
- 6.
Necessary statement of uncertainty
It should be emphasized that the above analysis of driving factors for the spatial differentiation of water quality is, in part, a reasonable inference based on land use data, population distribution, and known management policies. The other part (e.g., the specific contributions of flow velocity and aquatic plant distribution to DO, sources of nutrients) currently remains as scientific hypotheses to be validated, due to the lack of synchronous measurements of flow velocity, aquatic biomass, and quantitative nutrient data. Future research will supplement high-temporal-resolution synchronous monitoring of water quality and quantity to transform these speculative conclusions into quantitatively verifiable causal mechanisms.
5.3. Limitations and Future Work
This study has the following limitations. (1) The temporal representativeness of the data is limited. All UAV imagery and synchronous water quality data were collected in March 2025 (spring normal-water period), when hydrological, meteorological, and water quality conditions are relatively stable; they do not reflect extreme scenarios such as algal blooms in the summer flood season or the winter dry season. The performance of the models under highly dynamic events, such as storm runoff and algal proliferation, therefore, remains to be tested. (2) The spatial scale and sample coverage are constrained. All data were acquired at a single flight altitude, and the adaptability of the trained models to different pixel resolutions has not been calibrated. Although the 65 sampling sites cover the 13 major inflow rivers, they still cannot fully capture the water quality variability across all micro-catchments on the island. The seasonal transferability, inter-annual stability, and extensibility of the models to other spatial scales require further data validation. (3) The coverage of water quality parameters is insufficient. Owing to field operation conditions and sensor configuration, only dissolved oxygen and turbidity were modeled in this study. For key indicators most directly associated with eutrophication—such as chemical oxygen demand (COD), nitrogen, and phosphorus nutrients—laboratory chemical analyses were not synchronously performed, so the applicability of the models to non-optically active parameters cannot yet be evaluated. In addition, limited by the current lack of runoff background data for the island’s internal rivers, the quantitative analysis of sub-catchment characteristics in the Discussion remains insufficiently detailed.
In response to the above limitations, future work will focus on the following aspects. (1) Multi-temporal observations will be conducted: UAV images and synchronous water samples will be collected during both the summer eutrophication-prone period and the winter dry season to systematically assess the transferability and robustness of the models across seasons. (2) Multi-scale validation will be implemented: imagery of the same area will be acquired at different flight altitudes to analyze the systematic influence of spatial resolution changes on retrieval accuracy. (3) The coverage of water quality parameters will be expanded as a priority: additional ion-selective electrodes will be equipped for the YSI ProDSS, and water samples will be synchronously collected for laboratory analysis of COD, total nitrogen, and total phosphorus, thereby extending the retrieval targets from dissolved oxygen and turbidity to nutrients and organic pollutants. (4) Multi-source data will be integrated: refined background analyses of river runoff will be carried out by combining hydrological models with historical data from water-level stations around the lake, and the sample database will be gradually expanded through multi-temporal UAV data and automatic monitoring stations, providing more reliable fundamental data for spatiotemporal model transfer studies.
6. Conclusions
This study takes the 13 independent inflow rivers of Xishan Island in Lake Taihu as a natural experimental field. By integrating UAV multispectral remote sensing with five typical machine learning models (BP, RF, XGBoost, SVM, CNN) and adopting a spatially independent validation strategy (one sample mandatorily withheld from each river), a water quality monitoring and spatial generalization assessment framework tailored to multi-river, small-sample scenarios was designed and validated. The core of this framework is not the simple application of machine learning algorithms, but rather the construction of a full-chain technical pathway of “multi-river synchronous retrieval—spatially independent validation strategy—area mechanistic assessment”. To evaluate model generalizability, a spatially independent validation strategy was adopted. Our results reveal a significant trade-off between model complexity and cross-river generalization ability: structurally simpler, lightweight machine learning models achieved higher accuracy and robustness in dissolved oxygen and turbidity retrieval than their more complex counterparts.
Based on the optimal models identified under this validation strategy, spatial distribution maps of water quality in the inflow rivers of Xishan Island during the spring normal-water period were generated. A pronounced gradient in dissolved oxygen and turbidity across urban-rural functional areas was revealed: “DO concentrations were highest in aquaculture area rivers and lowest in urban area rivers, while turbidity showed the opposite pattern.” By spatially correlating the retrieval results with land use and human activity data, the proposed framework successfully decomposed the driving forces of the macroscopic pattern into specific pollution sources. Higher turbidity in urban areas was closely associated with dense impervious surfaces and surface runoff scouring, whereas lower DO was mainly attributed to excessive inputs of organic pollutants and their decomposition-driven oxygen consumption. The transitional water quality in agricultural areas reflected the persistent pressure of non-point fertilizer loss, while the superior water quality in aquaculture areas demonstrated the positive effects of ecological restoration after enclosure aquaculture withdrawal and low-intensity anthropogenic disturbance. This analytical capability—linking macroscopic spatial retrieval to micro-level mechanistic associations—provides a scientific basis for managers to accurately identify priority pollution-control areas and trace pollution origins.
In summary, the assessment framework proposed in this study offers a new reference point for advancing UAV-based water quality monitoring from local experiments toward basin-scale application. The findings not only supply baseline information for monitoring and evaluating the water environmental quality of the Lake Taihu Xishan Eco-Island, but also provide a replicable technical paradigm for intelligent water quality monitoring and precision management in similar multi-river systems.