Article

Channel Reshaping and Adaptive Management of Inland Tail-End Deltas Under River–Lake Interaction: Model Experiments and Empirical Evidence from the Comprehensive Regulation of the Ganjiang Tail-End Delta

1
Jiangxi Academy of Water Science and Engineering, Nanchang 330029, China
2
Jiangxi Key Laboratory of Flood and Drought Disaster Defense, Nanchang 330029, China
*
Author to whom correspondence should be addressed.
Water 2026, 18(11), 1310; https://doi.org/10.3390/w18111310
Submission received: 7 April 2026 / Revised: 10 May 2026 / Accepted: 14 May 2026 / Published: 28 May 2026

Abstract

Intensive human activities are reshaping inland tail-end deltas. Based on hydrological and sediment data from 1950 to 2023 and physical model experiments, this study examines the Ganjiang tail-end delta to analyze channel evolution, driving mechanisms, and management pathways. Results indicate that the Wan’an Reservoir and large-scale sand mining are the dominant drivers of flow-sediment regime shifts and channel reshaping. Sand mining has caused severe riverbed incision, with a local maximum depth of 16.5 m. During the dry season, the flow diversion ratio of the West Branch exceeds 90%, fundamentally altering the flow distribution pattern. Although riverbed incision has enhanced local flood conveyance, the overall flood discharge capacity of the tail-end delta remains limited due to backwater from Poyang Lake, introducing new flood risks. Reduced sediment supply and hydrological changes have exacerbated wetland shrinkage and eutrophication. Physical model experiments show that the comprehensive regulation project can raise dry-season water levels by approximately 5 m through sluice operation, optimize flow diversion, and increase wetland surface water area by 56%. This project integrates flood control, ecological protection, and water resource utilization, representing a proactive exploration of adaptive management for deltas and providing scientific references for understanding evolution and guiding management in similar inland tail-end deltas.

1. Introduction

As one of the most dynamic geographical units within the Earth’s surface system, river deltas support over 50% of the global population and account for 30% of the world’s economic output [1]. Their sustainability is increasingly threatened by the dual pressures of climate change and human activities [1,2,3], positioning delta management as a central issue in global environmental governance in the 21st century [4,5]. In recent years, research on delta evolution has predominantly focused on large-scale estuarine systems, such as the Yangtze, Mississippi, and Mekong deltas [6,7], with particular emphasis on sea-level rise, sediment trapping, and coastal erosion. However, for inland tail-end deltas subjected to intense human regulation—such as cascade reservoirs and large-scale sand mining—a systematic understanding of their coupled “natural–social” evolutionary mechanisms and adaptive management strategies remains lacking. Notably, these systems exhibit nonlinear characteristics characterized by “rapid channel metamorphosis and slow ecological responses.” Conventional management models face compound challenges, including the failure of flood control standards and the degradation of ecological services [8], thereby constraining the capacity to predict and manage future risks in similar regions.
The Ganjiang tail-end delta is the largest and most typical shallow-water delta in Poyang Lake. As a critical node for flow–sediment transformation in the middle reaches of the Yangtze River, its evolutionary trajectory profoundly reflects the reshaping effects of human activities on inland river systems. Unlike coastal deltas, whose evolution is controlled by the interaction between fluvial and marine dynamics (e.g., tides, waves, saline wedges), the evolution of inland tail-end deltas is primarily governed by the interaction between river dynamics and receiving lake dynamics [9]. The hydrological characteristics of the Ganjiang tail-end delta are controlled by a threefold mechanism of “river–lake interaction, seasonal inflow–outflow, and bidirectional backwater effects from river and lake,” exhibiting multi-scale uniqueness. During the wet season (April–September), lake water spills over the floodplain, and flow velocities are dominated by gravity-driven lake currents. During the dry season (November–March), lake water retreats into the main channel, and fluvial control prevails, but with low discharge. This seasonal alternation shapes the nonlinear water-level response of suspended sediment concentration and the erosion–deposition pattern of the delta [10], characterized by the following: at moderate water levels, floodplain inundation occurs with maximum sediment transport capacity; at high water levels, water dilution increases and the proportion of fine suspended particles rises; at low water levels, sediment source exposure decreases and transport capacity weakens. Spatially, this manifests as a unique pattern of “erosion in the upper reaches, deposition in the lower reaches; erosion in concave banks, deposition in convex banks; and deposition in the tail-end channels.”
The Ganjiang tail-end delta is located in the political, economic, and cultural core of Jiangxi Province. This delta forms the central hub of the Greater Nanchang Metropolitan Area and supports multiple functional demands, including flood control, water supply, ecological conservation, and navigation. From a global perspective, the increasing economic and ecological value of deltas has driven scholarly interest in their evolutionary history and underlying mechanisms. Human interventions such as upstream dam construction, sand mining, deforestation, and delta reclamation [11] have led to a 40–60% reduction in global sediment delivery to deltas [12]. The Ganjiang tail-end delta serves as a quintessential example of this global trend. Since the 1990s, intense human activities have drastically reduced the average annual sediment load of the Ganjiang tail-end delta from 11.68 million tons to less than 2 million tons, triggering riverbed incision at a rate of 0.6 m/yr—one to two orders of magnitude higher than natural erosion rates. Concurrently, the increasing frequency of extreme drought events (e.g., the 2022 drought) has exacerbated wetland degradation and water quality deterioration [13], posing a growing threat to regional ecological security.
From an international perspective, the perturbation of watershed flow and sediment processes by climate change and human activities has been widely documented [3,14]. Studies on the Yangtze and Mississippi River deltas have shown that fluvial sedimentation and marine dynamics jointly shape deltaic morphology [2,4,6], while Subrata Mondal et al. [15] emphasized the compounded effects of coupled climate–human interactions on deltas. Research on the Yellow River delta has revealed that water–sediment regulation schemes can partially restore erosion–deposition balance and mitigate delta retreat [16]. However, the evolutionary mechanisms of the Ganjiang tail-end delta are more complex. Sediment trapping by the Wan’an Dam has reduced downstream sediment load by 50%, triggering persistent riverbed erosion. Since 2001, the superimposed impact of large-scale sand mining has resulted in a maximum riverbed incision depth of 16.5 m, fundamentally altering the flow diversion ratio and significantly increasing the risk of flow interruption in tail-end channels. Concurrently, the backwater effect from Poyang Lake, combined with extreme climatic events, has amplified the co-occurrence risk of “river flooding” and “lake flooding” [9], raising the sensitivity of the ecosystem to low-water stress to historically unprecedented levels [17]. Understanding the patterns of channel evolution under such coupled “natural–anthropogenic” drivers urgently requires high-resolution monitoring data and model-based simulations.
Assessing the effectiveness of existing flood control measures and identifying vulnerable zones have become urgent priorities in current channel management. However, systematic research on the driving mechanisms of flow–sediment changes, patterns of channel evolution, and the associated flood control and ecological effects in tail-end reaches remains limited. Furthermore, the operation rules of water conservancy projects are increasingly inadequate under the compound flood scenarios induced by asynchronous water level fluctuations between the river and the lake. In addition, given the multifunctional demands placed on the Ganjiang tail-end delta, there is an urgent need to develop adaptive management strategies grounded in dynamic flow–sediment processes.
This study synthesizes multi-source data from 1950 to 2023 to systematically analyze trends in flow–sediment evolution, channel response patterns, and the associated flood control and ecological effects in the Ganjiang tail-end delta. Based on physical model experiments, the regulatory effectiveness of a comprehensive regulation project is evaluated, and adaptive management strategies are proposed. This study aims to promote a transition in channel management from single-function to integrated approaches, providing a reference for the management of similar inland tail-end deltas.

2. Data and Methods

2.1. Study Area

The Ganjiang River is a first-order tributary of the Yangtze River and the largest river system within the Poyang Lake Basin. Its drainage area accounts for approximately 50% of the total land area of Jiangxi Province. Originating in the mountainous region of southern Jiangxi, the river flows northeastward from Ganzhou City and, after passing through Nanchang City, bifurcates into four distributary channels that discharge into Poyang Lake.
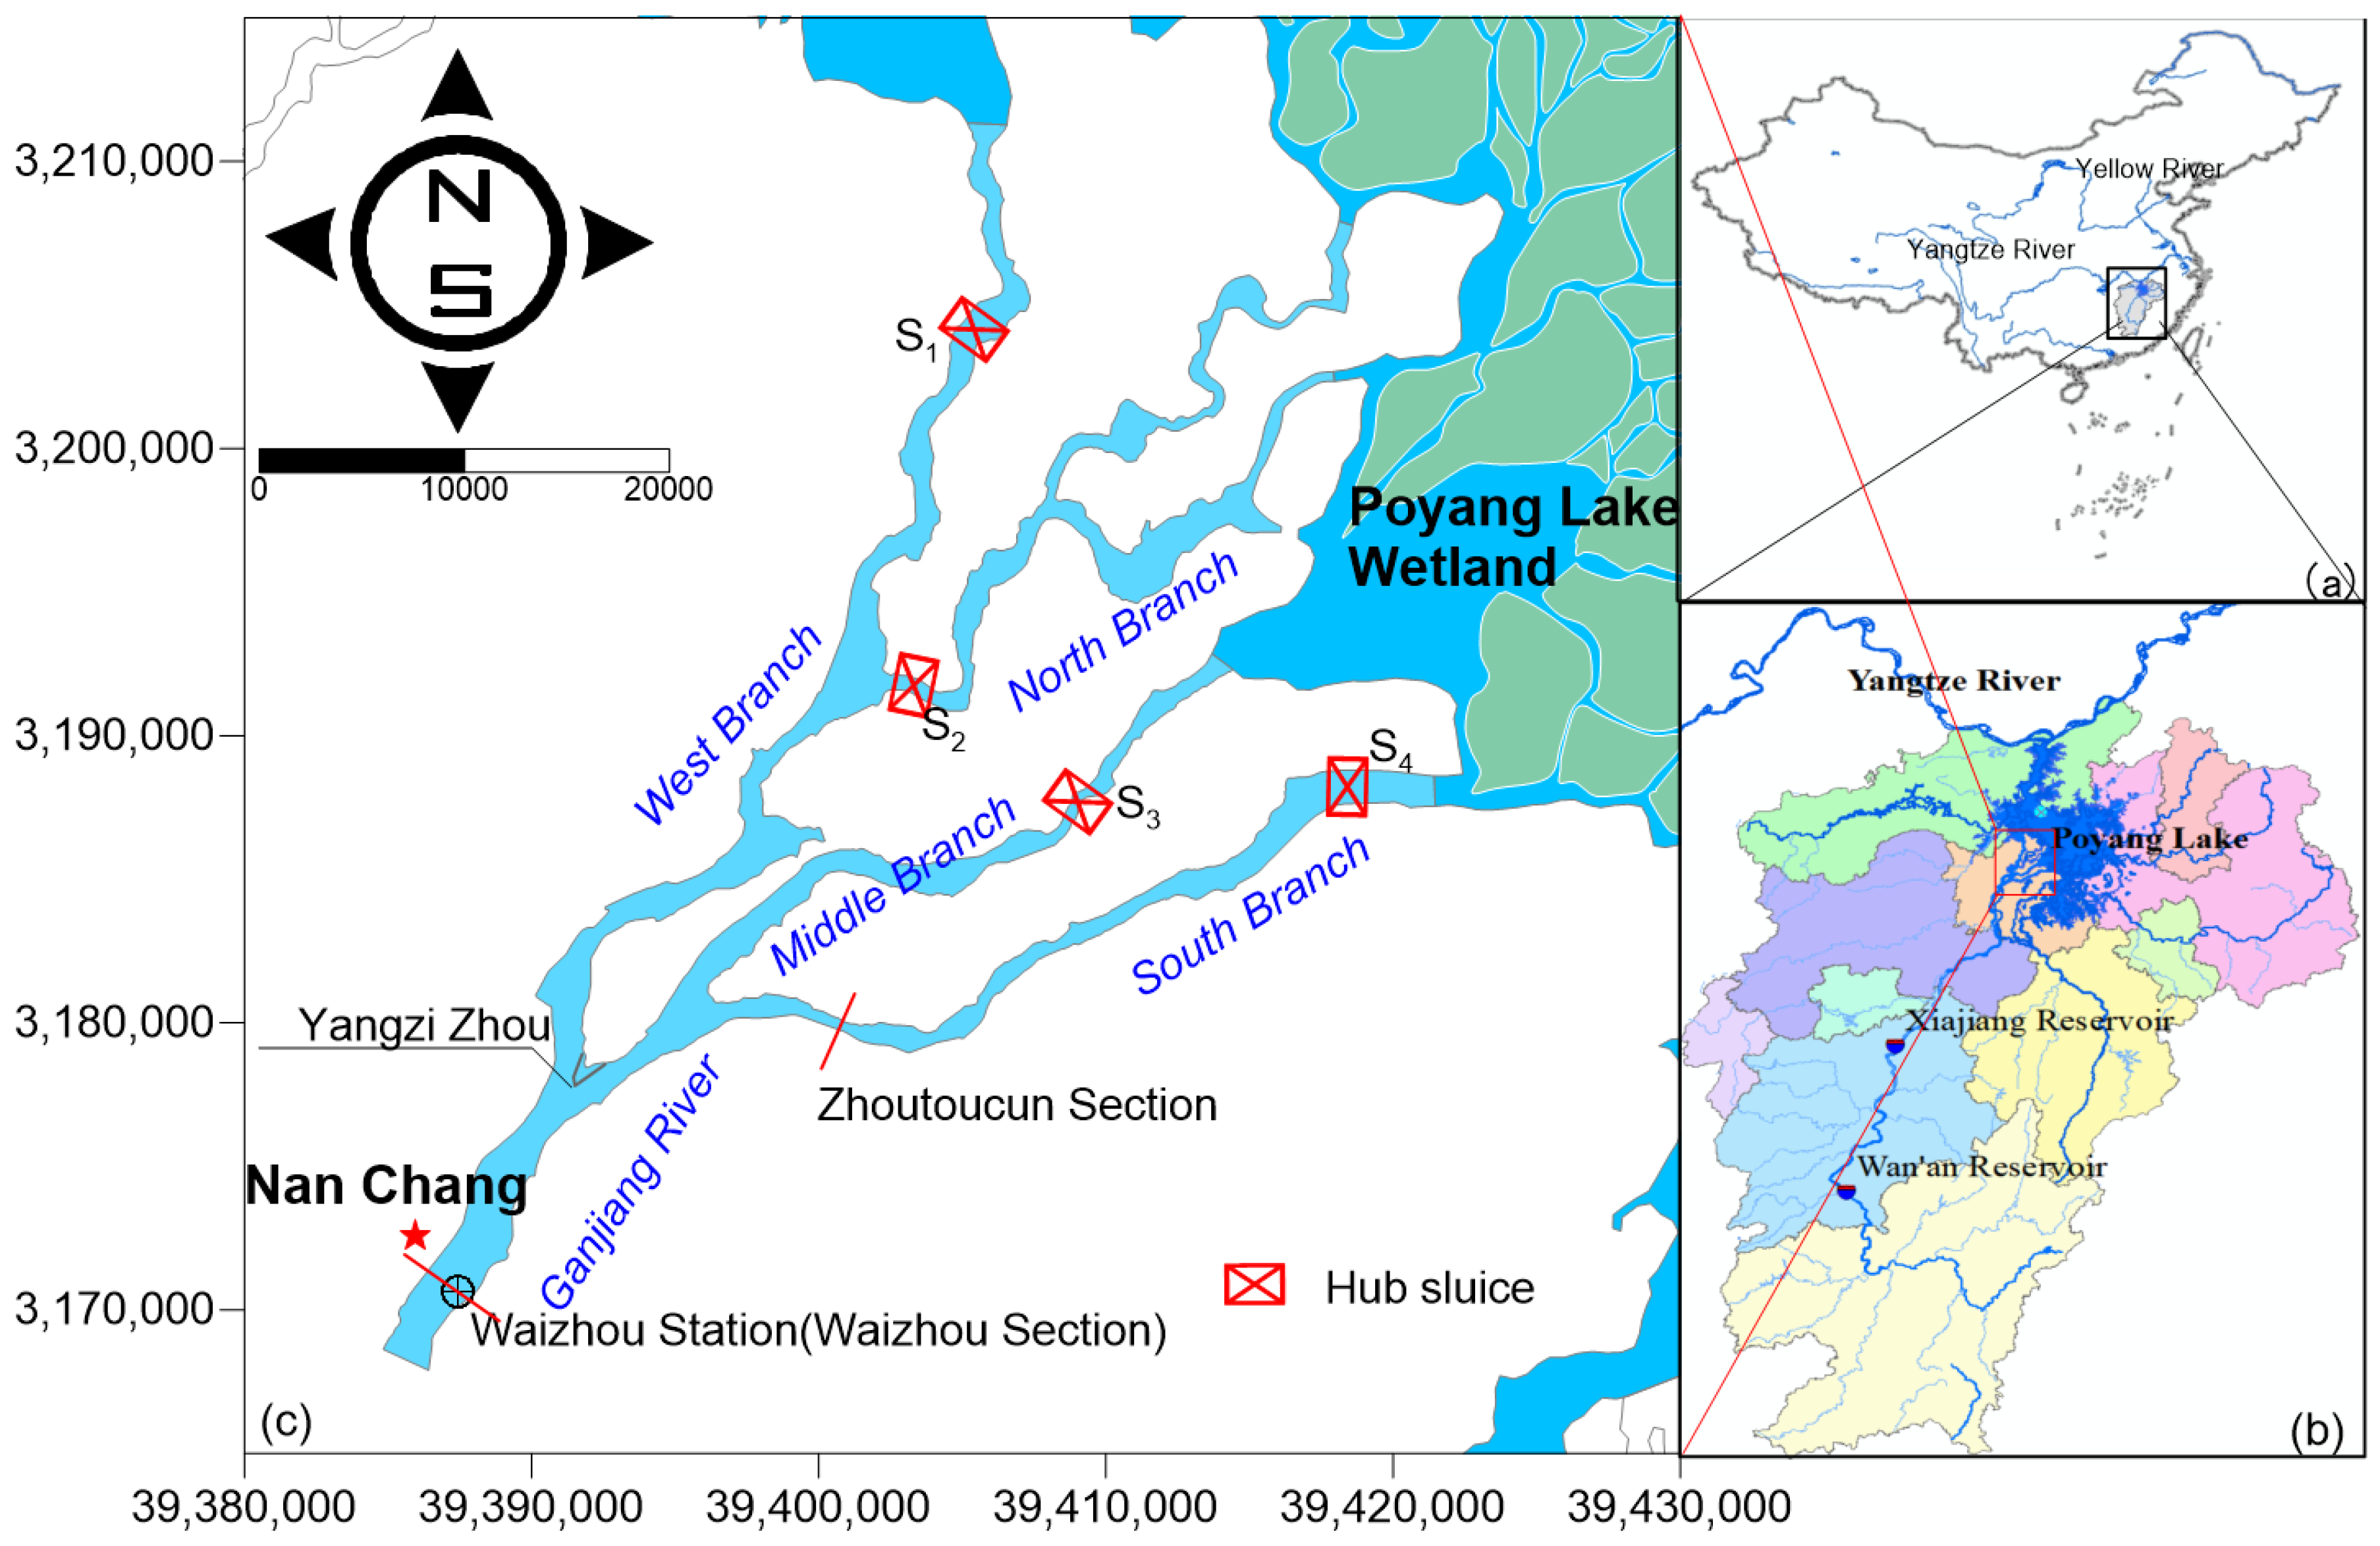
This study focuses on the tail-end delta reach of the Ganjiang River (Figure 1). Located in the northeastern part of Nanchang City, this reach extends north–south through the Nanchang urban area. The tail-end channels begin to diverge at the head of Yangzi Island, initially splitting into the East Channel and West Channel, which subsequently undergo secondary bifurcation to form four main distributaries flowing into Poyang Lake: the Middle Branch, North Branch, South Branch, and West Branch. The delta is characterized by an intricate network of interconnected waterways and alternating shoals and channels, with the West Branch serving as the main flow path. The total length of the study reach is approximately 54 km. Waizhou Hydrological Station, a national basic hydrological station, serves as the control station for the Ganjiang tail-end reach, with a drainage area of 80,948 km2, accounting for 96.9% of the total basin area.
To stabilize the river regime of the lower Ganjiang tail-end reach, enhance regional flood control capacity, optimize transportation infrastructure, and improve landscape ecology, the Jiangxi Provincial Government has planned and implemented a series of engineering measures, including levee reinforcement, channel dredging, and bridge construction. Currently, the Comprehensive Regulation Project for the Lower Ganjiang Tail-End Reach is under implementation. This project includes the construction of the Nanchang Water Conservancy Hub (Figure 1) and headland protection measures, aimed at regulating water levels in the lower Ganjiang tail-end reach during dry seasons, reconnecting and activating the river–lake water system, and controlling low water levels to achieve integrated regulation objectives. The Nanchang Water Conservancy Hub consists of four Water Conservancy Hubs: the West Branch Hub(S1), North Branch Hub(S2), Middle Branch Hub(S3), and South Branch Hub(S4) (Figure 1). The total construction period is 65 months, with completion scheduled for April 2026.

2.2. Data Sources

The flow and sediment data used in this study were obtained from the Jiangxi Provincial Academy of Water Sciences. Daily discharge and water level records from the Waizhou Hydrological Station spanning the period 1950–2023 were collected, along with suspended sediment concentration measurements from 1956 to 2022. Bathymetric data were derived from nautical charts and historical as well as recent channel cross-sectional surveys conducted between 1960 and 2020. Topographic data were based on field surveys conducted in 2018.

2.3. Research Method

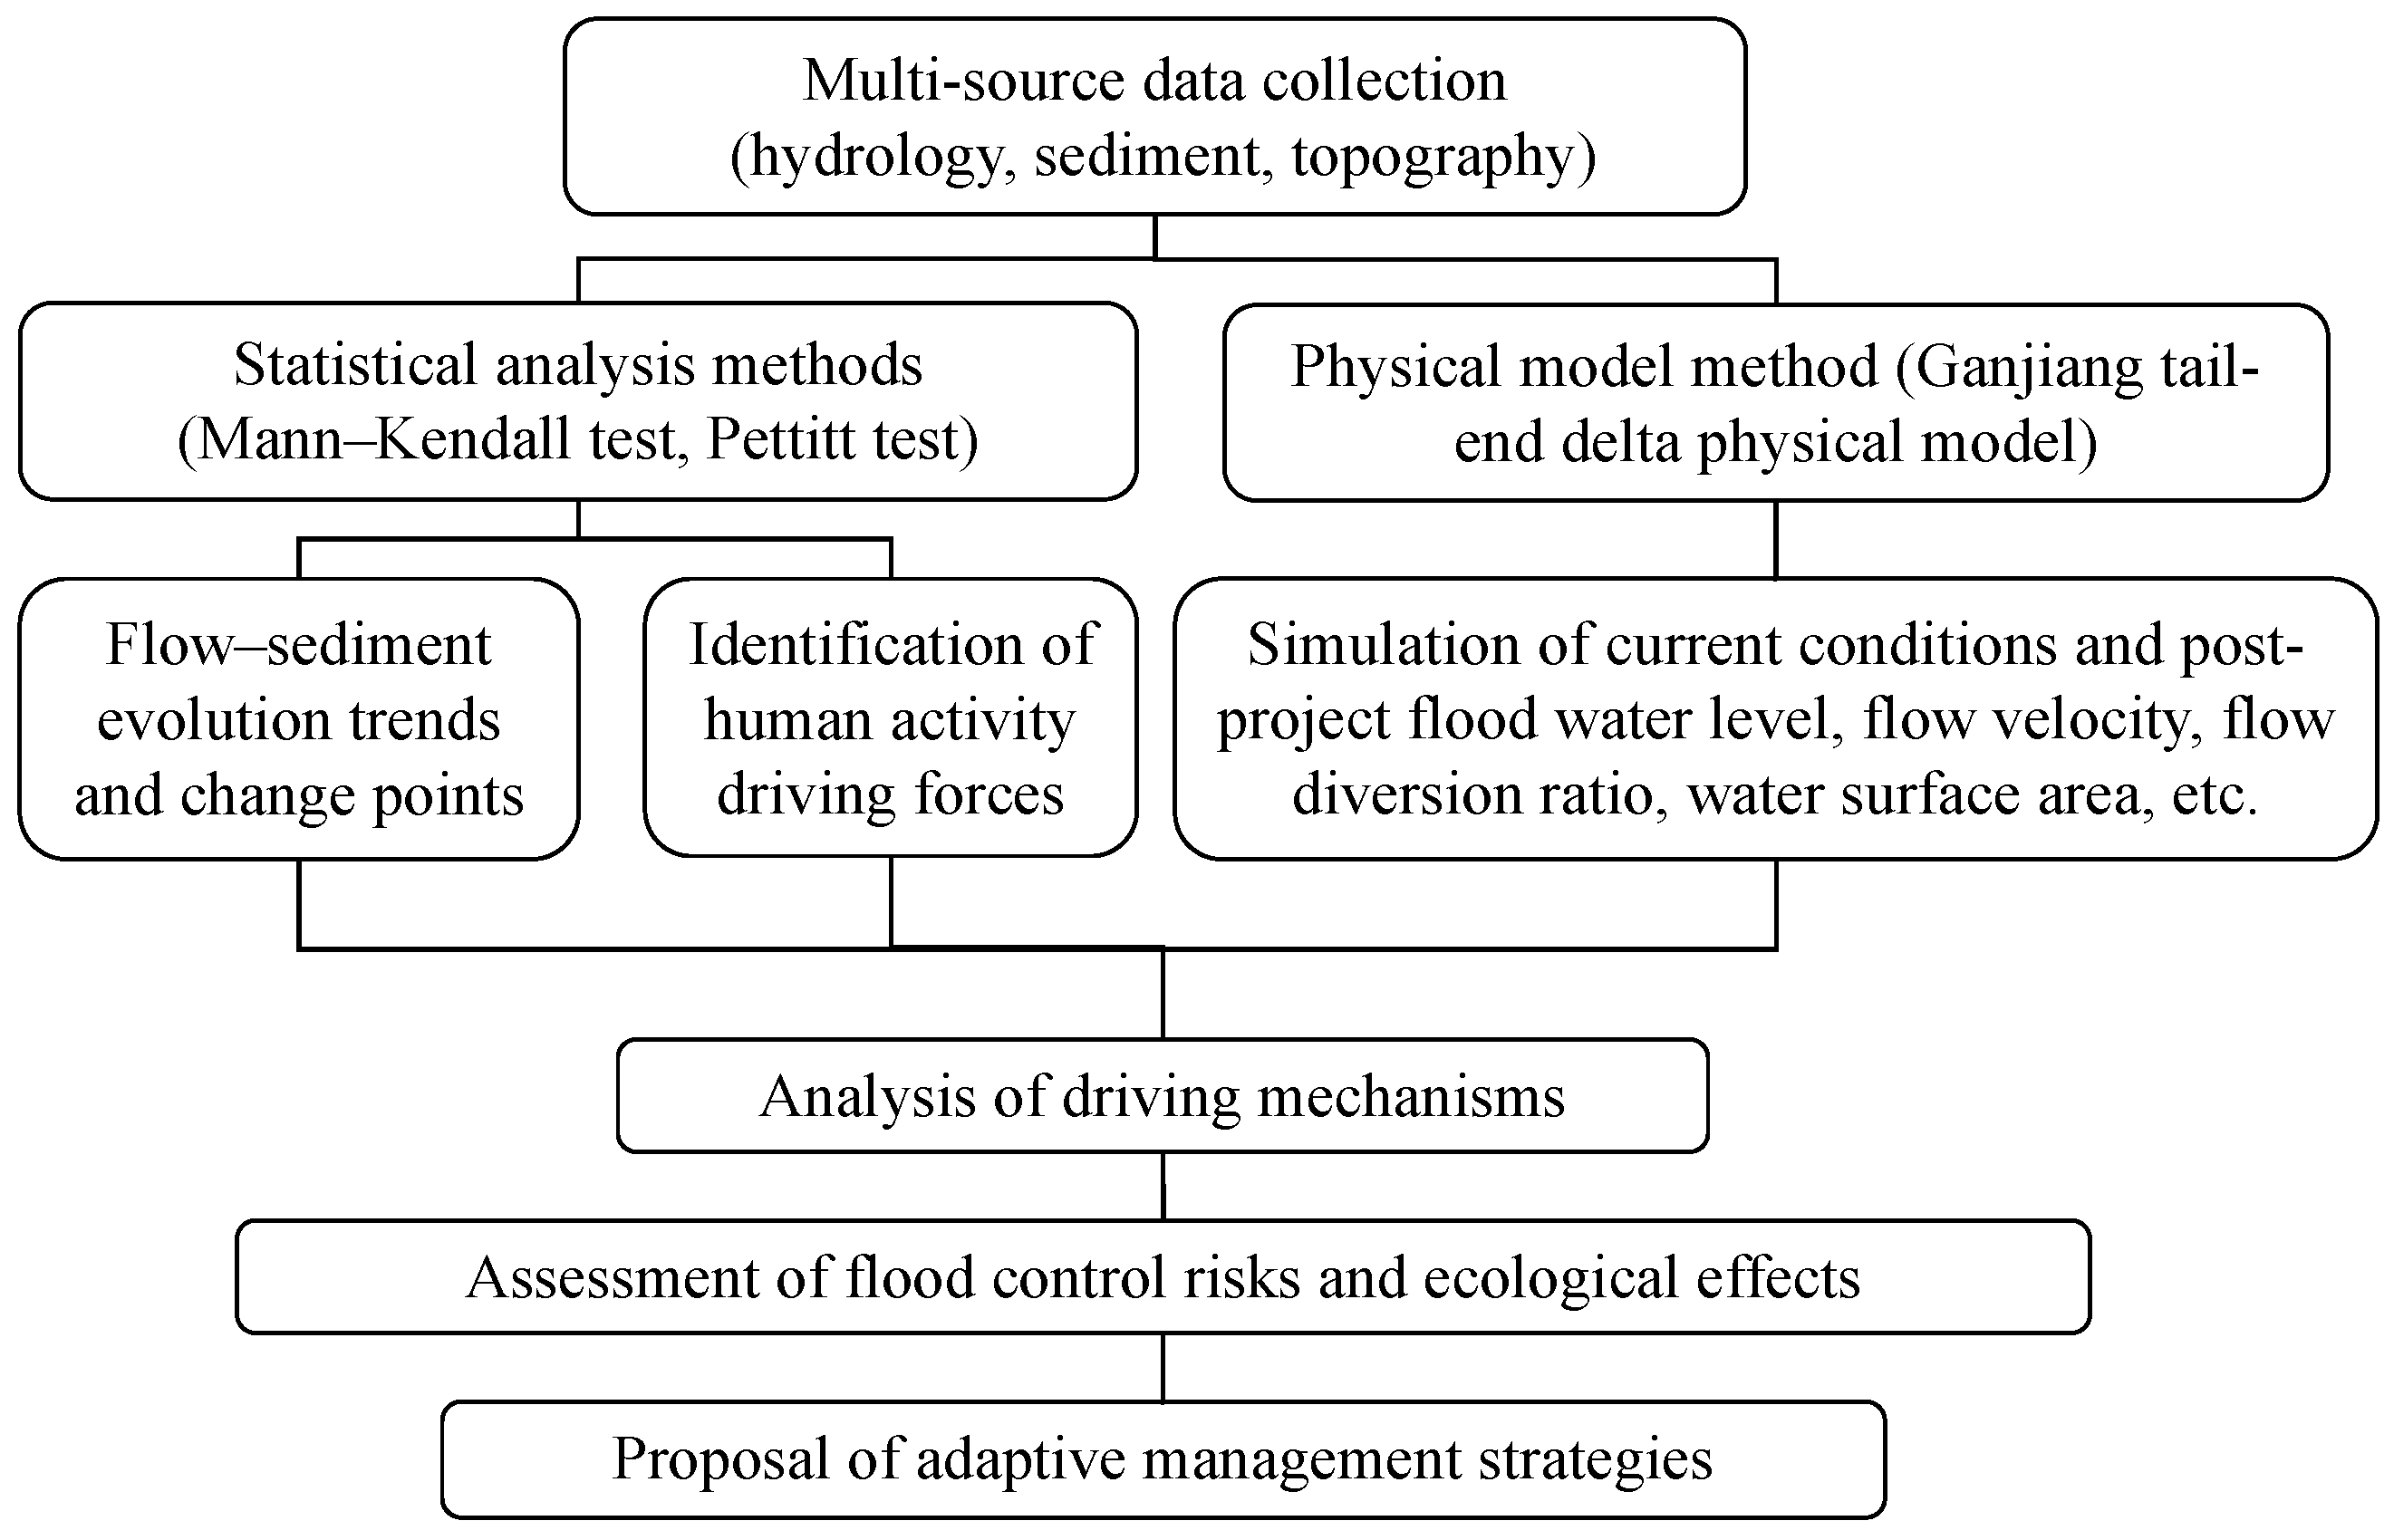
This study employs statistical analysis methods to diagnose evolutionary trends and driving mechanisms, investigating why the channel has changed. It also evaluates the current conditions and the regulatory effectiveness of the comprehensive regulation project through physical model simulations, analyzing what the channel has become and how to address the associated challenges. The research flowchart is shown in Figure 2.

2.3.1. Water-Sediment Trend Analysis

(1)
Mann–Kendall Trend Test
The Mann–Kendall trend test was employed to analyze the trends in annual average discharge, water level, suspended sediment concentration, and sediment delivery coefficient at the Waizhou Hydrological Station in the Ganjiang tail-end delta. For a given test statistic, a positive value indicates an increasing trend, whereas a negative value indicates a decreasing trend. At a 95% confidence level (α = 0.05), if ∣Z∣ ≥ 1.96, the trend is considered statistically significant; otherwise, the trend is not significant.
(2)
Pettitt Change-Point Test
The Pettitt change-point test [18] was applied to detect abrupt changes in flow and sediment regimes in the Ganjiang tail-end delta. A significance level of α = 0.05 was adopted, corresponding to a 95% confidence level for identifying change points.

2.3.2. Physical Model Experiment

(1)
Model Construction
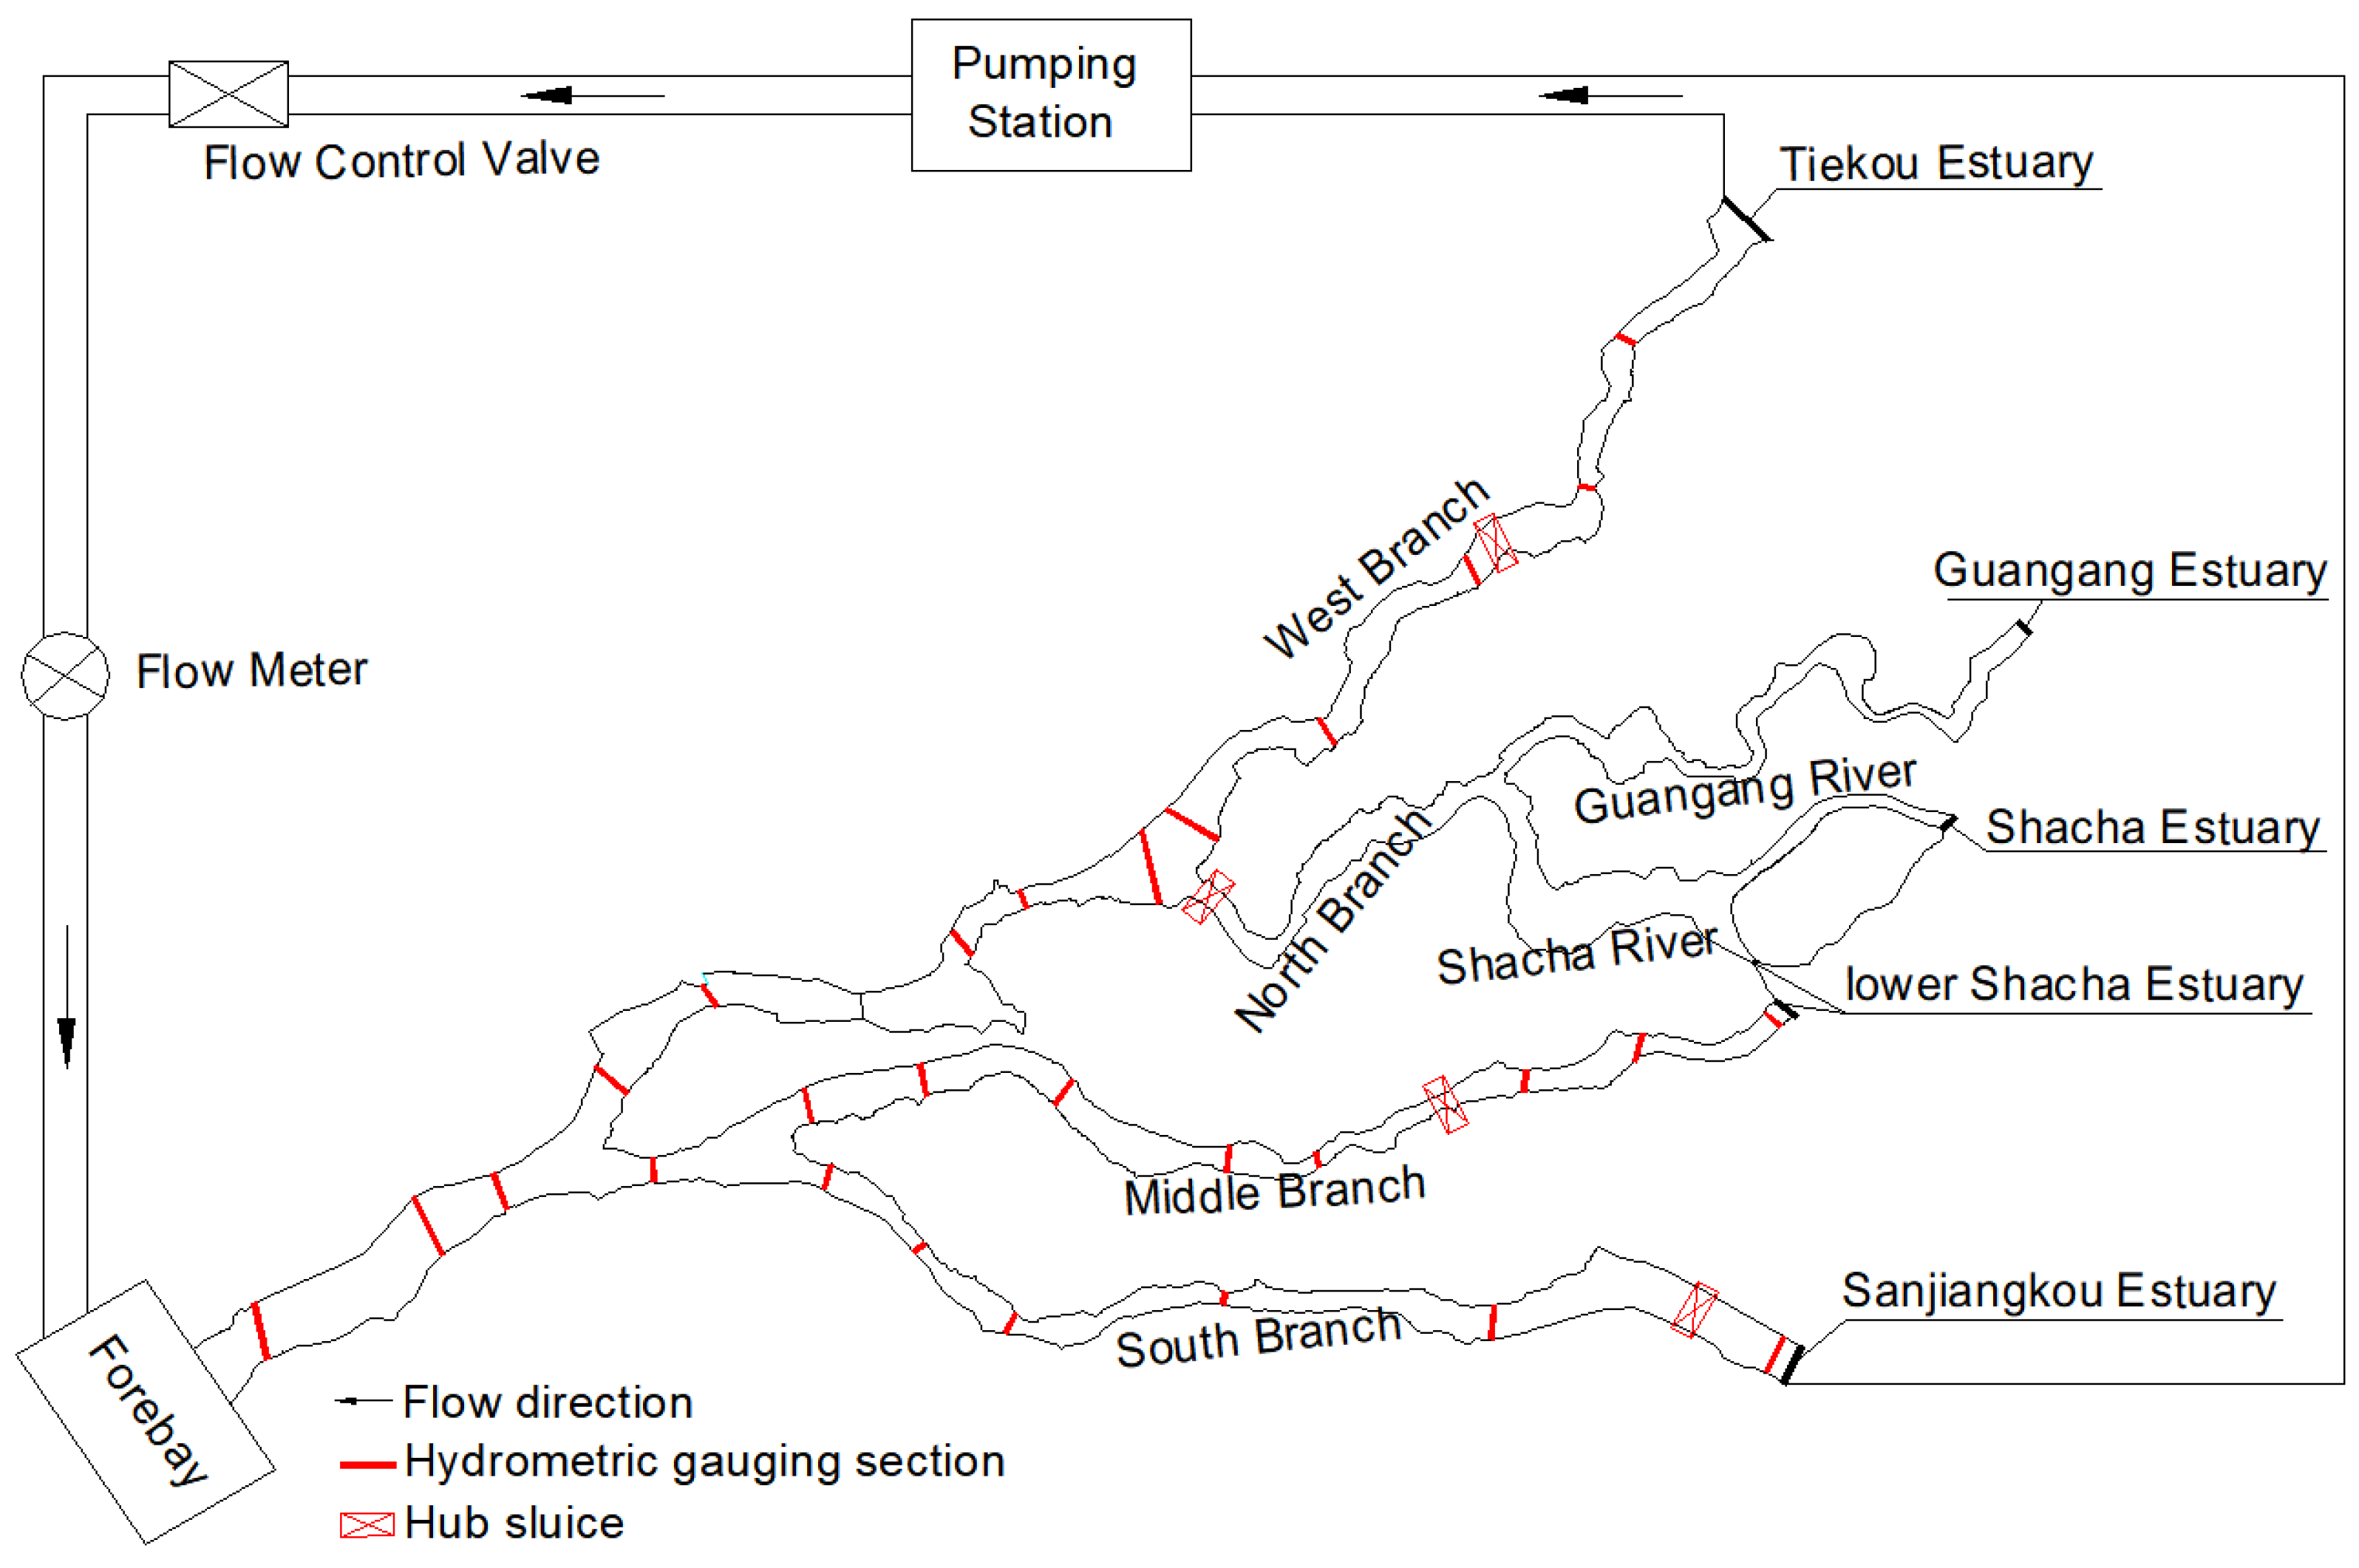
To simulate the hydrological and hydrodynamic changes in the distributary channels of the Ganjiang tail-end delta before and after the implementation of comprehensive regulation measures, a physical river model of the entire Ganjiang tail-end reach was constructed (Figure 3). The upstream boundary of the model is located 0.7 km upstream of Waizhou Hydrological Station, specified as a flow boundary using data from Waizhou Station. The downstream boundaries are located at the four river mouths where the distributaries enter the lake: the West Branch at the Tiehe River mouth, the North Branch at the Guangang River mouth, the Middle Branch at the Shacha River mouth, and the South Branch at the Sanjiangkou. These are specified as water level boundaries, with boundary water levels derived from measured hydrological data. The model covers a total length of approximately 54 km and a width of 36 km. The model topography was constructed based on the 2018 measured riverbed topographic maps, using the cross-sectional panel method with cement mortar screeding. The model dimensions are 180 m in length and 125 m in width. The horizontal scale is 1:300, and the vertical scale is 1:80, resulting in a distortion ratio of 3.75. Other parameters were converted according to the similarity criteria for flow motion.
(2)
Model Validation
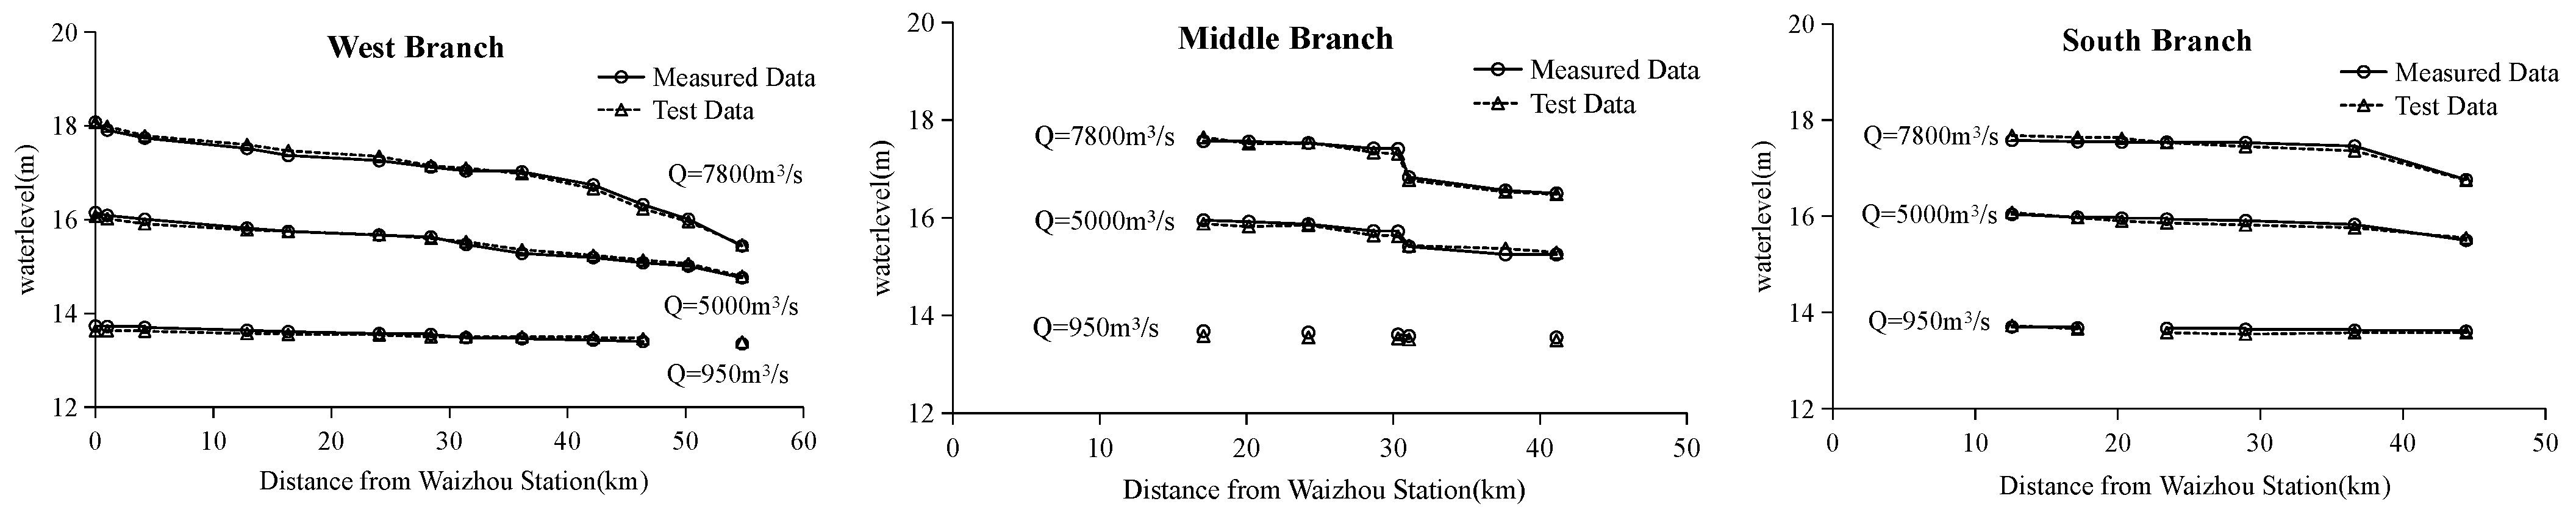
The Poyang Lake Hydrology and Water Resources Monitoring Center conducted three field surveys along the West Branch, South Branch, and Middle Branch of the Ganjiang tail-end delta between June and October 2018. Hydrological measurements along the channels were obtained under three flow conditions at Waizhou Station: high flow (Q = 7800 m3/s), medium flow (Q = 5000 m3/s), and low flow (Q = 950 m3/s). These data were used to validate the model resistance similarity.
Based on the hydrological measurement data under high-flow (Q = 7800 m3/s), medium-flow (Q = 5000 m3/s), and low-flow (Q = 950 m3/s) conditions, the physical model was validated for hydraulic characteristics including longitudinal water surface profiles (Figure 4), cross-sectional velocity distributions, and flow diversion ratios. The validation results show that the difference between simulated and measured water levels is generally within 0.05 m, the relative error in flow velocity is within ±15%, and the maximum error in flow diversion ratio validation is 2.08%. The statistical metrics R2 and RMSE for water level, flow velocity, and flow diversion ratio under the three flow conditions are presented in Table 1. The R2 values for water level, velocity, and diversion ratio all exceed 0.95, and the RMSE values are consistently low, indicating that the experimental values accurately reproduce the trends and numerical accuracy of the measured values under different hydrological conditions. The overall model exhibits high reliability.

3. Results

3.1. Flow–Sediment Evolution Trends in the Lower Ganjiang River

3.1.1. Trend and Change-Point Analysis of Flow and Sediment Regimes

The Mann–Kendall trend test and Pettitt change-point test were applied to the hydrological time series from the Waizhou Station covering the period 1950–2023 (Table 2). The results indicate that the annual average water level and suspended sediment concentration exhibited significant decreasing trends, with z-values of −5.8474 and −8.3987, respectively, both exceeding the 95% confidence threshold. In contrast, the annual average discharge showed no significant trend (z = −0.18667, p > 0.05). These findings suggest that sediment supply conditions in the lower Ganjiang River have undergone fundamental changes over the past seven decades, while flow conditions have remained relatively stable.
Change-point analysis further revealed that an abrupt change in annual average suspended sediment concentration occurred in 1991, whereas a significant shift in annual average water level was detected in 2000. These change points coincide closely with the timing of major human interventions within the basin.
Based on the history of watershed management and engineering construction, the flow–sediment evolution of the Ganjiang River was divided into four stages: the soil and water conservation period (1980–1990), the impoundment period (1991–2000), the sand mining period (2001–2013), and the adjustment period (2014–2023). Trend analyses of the annual average suspended sediment concentration, annual average sediment delivery coefficient [19], and annual average water level for each stage are presented in Table 3. Before 2000, sediment supply exhibited a significant decreasing trend, whereas after 2000, it stabilized, showing no significant trend. The sediment delivery coefficient (S/Q) [19] decreased significantly during the impoundment period, falling to approximately 40% of its pre-1991 level. In contrast, water level showed a significant decreasing trend during the sand mining period.

3.1.2. Changes in Stage–Discharge Relationship

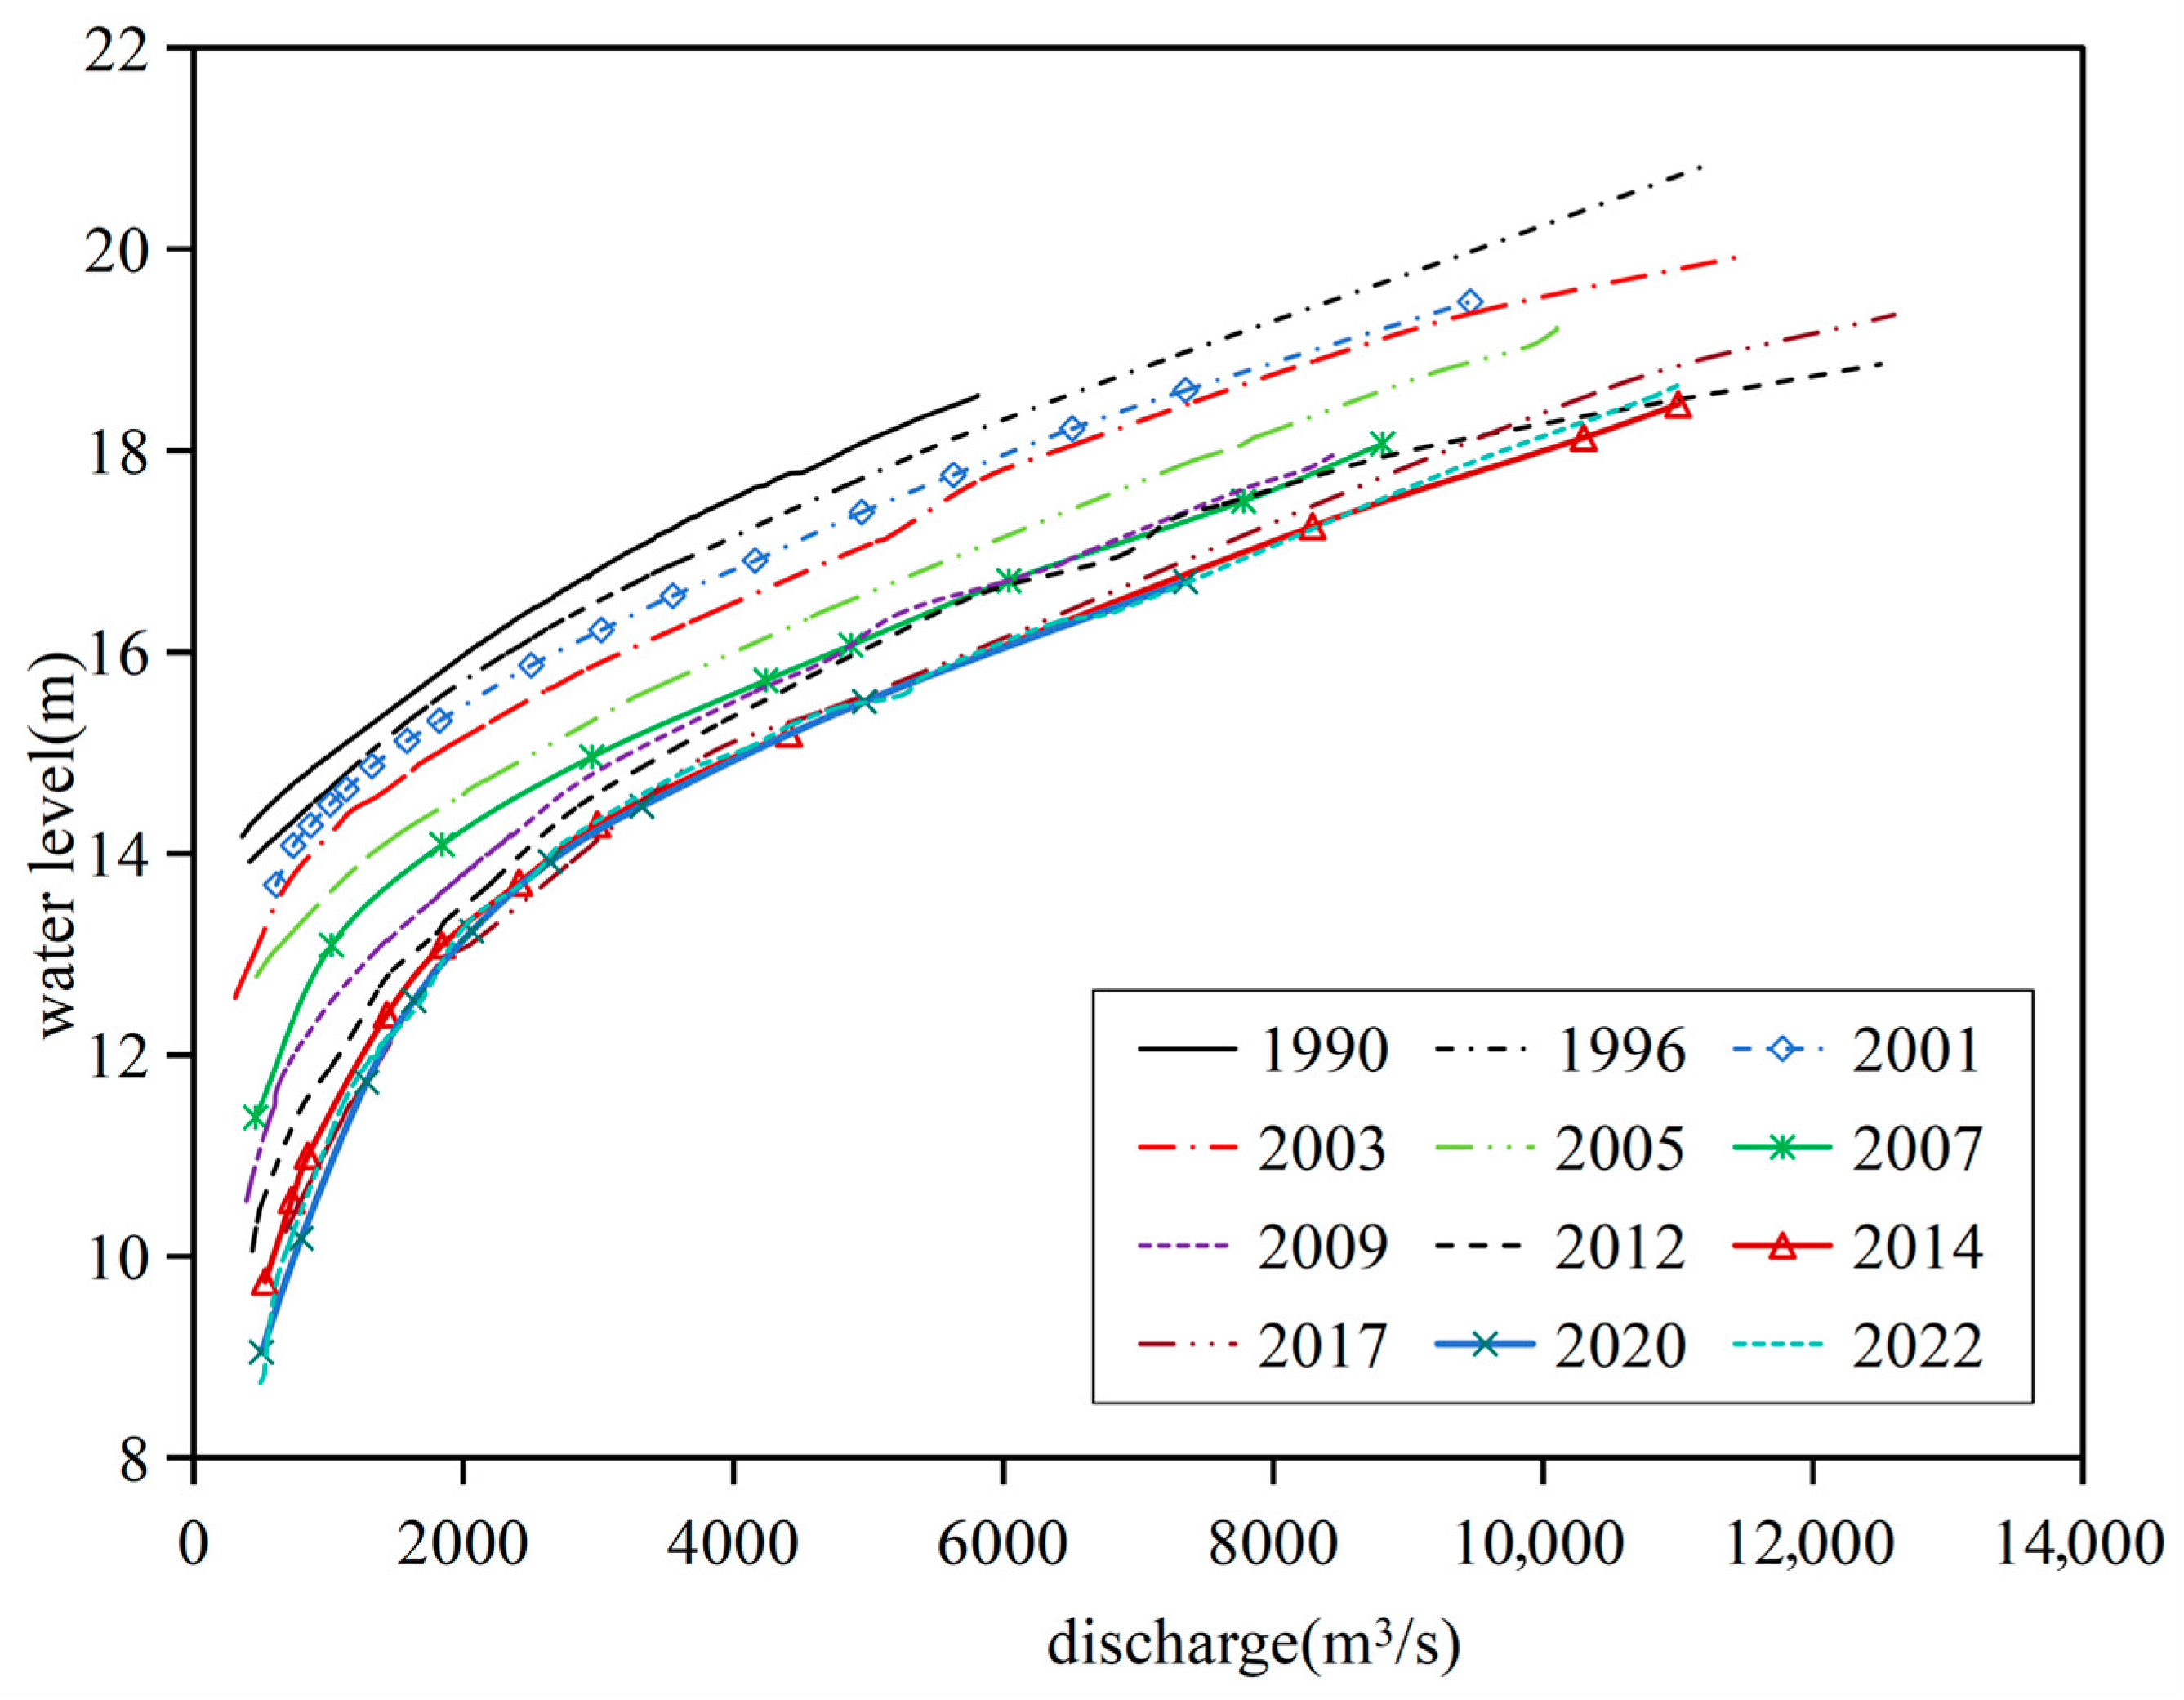
Owing to persistent human disturbances, the flow–sediment conditions in the lower Ganjiang River have undergone significant alterations. Continuous riverbed incision has led to a pronounced decline in low and medium water levels under the same discharge conditions. This evolutionary characteristic can be clearly observed from the stage–discharge rating curves for typical years at Waizhou Hydrological Station (Figure 5).
Overall, water levels corresponding to the same discharge exhibited a progressive decline from 1990 to 2014, after which the declining trend moderated and entered a relatively stable phase. For example, at a discharge of 527 m3/s at Waizhou Station, the water level in 2014 was approximately 4.32 m lower than that in 1990. At a discharge of 9480 m3/s, the water level in 2014 was approximately 1.32 m lower than that in 2003. Comparing the stage–discharge relationships between 2022 and 2014, a certain degree of decline in water levels at the same discharge is still observed during low and medium flow periods, whereas little change is evident during medium to high flow periods. These findings indicate that after 2014, the Ganjiang tail-end channel gradually transitioned into a new phase characterized by adjustment and relative stabilization.

3.1.3. Changes in Flow–Sediment Relationship

The sediment delivery coefficient (S/Qave) was used to characterize the flow–sediment relationship in the lower Ganjiang River. As shown in Table 3, the sediment delivery coefficient decreased significantly during the impoundment period from 1991 to 2000 (Z = −3.04), with the mean value of this period (16.78 kg·s/m6) decreasing by approximately 56% compared to the preceding soil and water conservation period (38.2 kg·s/m6). This indicates that, under generally stable flow conditions, sediment trapping by the Wan’an Reservoir was the fundamental cause of the dramatic change in the flow–sediment relationship. Subsequently, although the sediment delivery coefficient remained at a low level, the trend was no longer significant, reflecting the establishment of a new equilibrium between riverbed erosion replenishment and clear water release from the reservoir under low-sediment background conditions. This fundamental alteration of the flow–sediment relationship served as the key energy source driving the subsequent stepwise riverbed incision and reshaping of the channel.

3.2. Channel Evolution Patterns

3.2.1. Historical Evolution Pattern (1960–2000)

Prior to 2000, the evolution of the Ganjiang tail-end delta channel was predominantly governed by natural processes, combined with preliminary human interventions. During this period, channel evolution exhibited the following characteristics:
(1)
Bankline retreat during flood periods and channel widening
During the Tongzhi reign of the Qing Dynasty, numerous sandbars were distributed within the Nanchang reach of the Ganjiang River. The high sediment concentrations (Table 3) provided a material basis for sandbar aggradation, and these sandbars progressively merged and expanded under sediment deposition. Some sandbars gradually attached to the banks due to reduced flow energy, transforming into floodplains, while others were eroded and dissipated under flood scouring. During flood periods, flow scouring induced continuous bankline retreat, leading to significant increases in channel width. The processes of sandbar aggradation and merging were frequent, accompanied by intensified lateral migration of the main channel, with the thalweg position shifting markedly in response to variations in the main flow path.
(2)
Construction of flood control levees stabilizing local channel regime and main flow path
To mitigate flood disasters, flood control levees on both banks were progressively constructed and reinforced between 1960 and 1983. This curbed bankline retreat during flood periods, resulting in increasingly stable flood-season banklines. Following the operation of the Wan’an Reservoir in 1991, the sharp reduction in sediment supply disrupted the existing erosion–deposition equilibrium. During this stage, the sediment delivery coefficient remained relatively high (Table 3). Under high-flow conditions, the channel cross-sections experienced erosion, whereas under low-flow conditions, deposition occurred, resulting in a state of slight erosion or slight deposition overall. The stabilized boundaries facilitated a smooth flow path for the main flow line, which followed a relatively fixed curvature into the middle and lower reaches. During this period, channel evolution was mainly concentrated on the low- and medium-flow channel bars, shoals, and thalweg (main flow line). The alternating erosion and deposition of bar and shoal boundaries caused migration of the main flow line, altering the flow dynamic axis. Longitudinal profiles developed alternating deep pools and shallow riffles in local reaches, with thalweg migration amplitudes reaching tens to hundreds of meters, reflecting the active nature of natural channel adjustment.

3.2.2. Recent Adjustment Pattern (2001–2023)

Following the onset of the 21st century, large-scale sand mining and dredging projects became the dominant factors driving channel evolution, triggering significant changes. The recent evolution of the Ganjiang tail-end delta is characterized by channel reshaping under the dominance of human activities.
(1)
Erosion–deposition changes in channel cross-sections
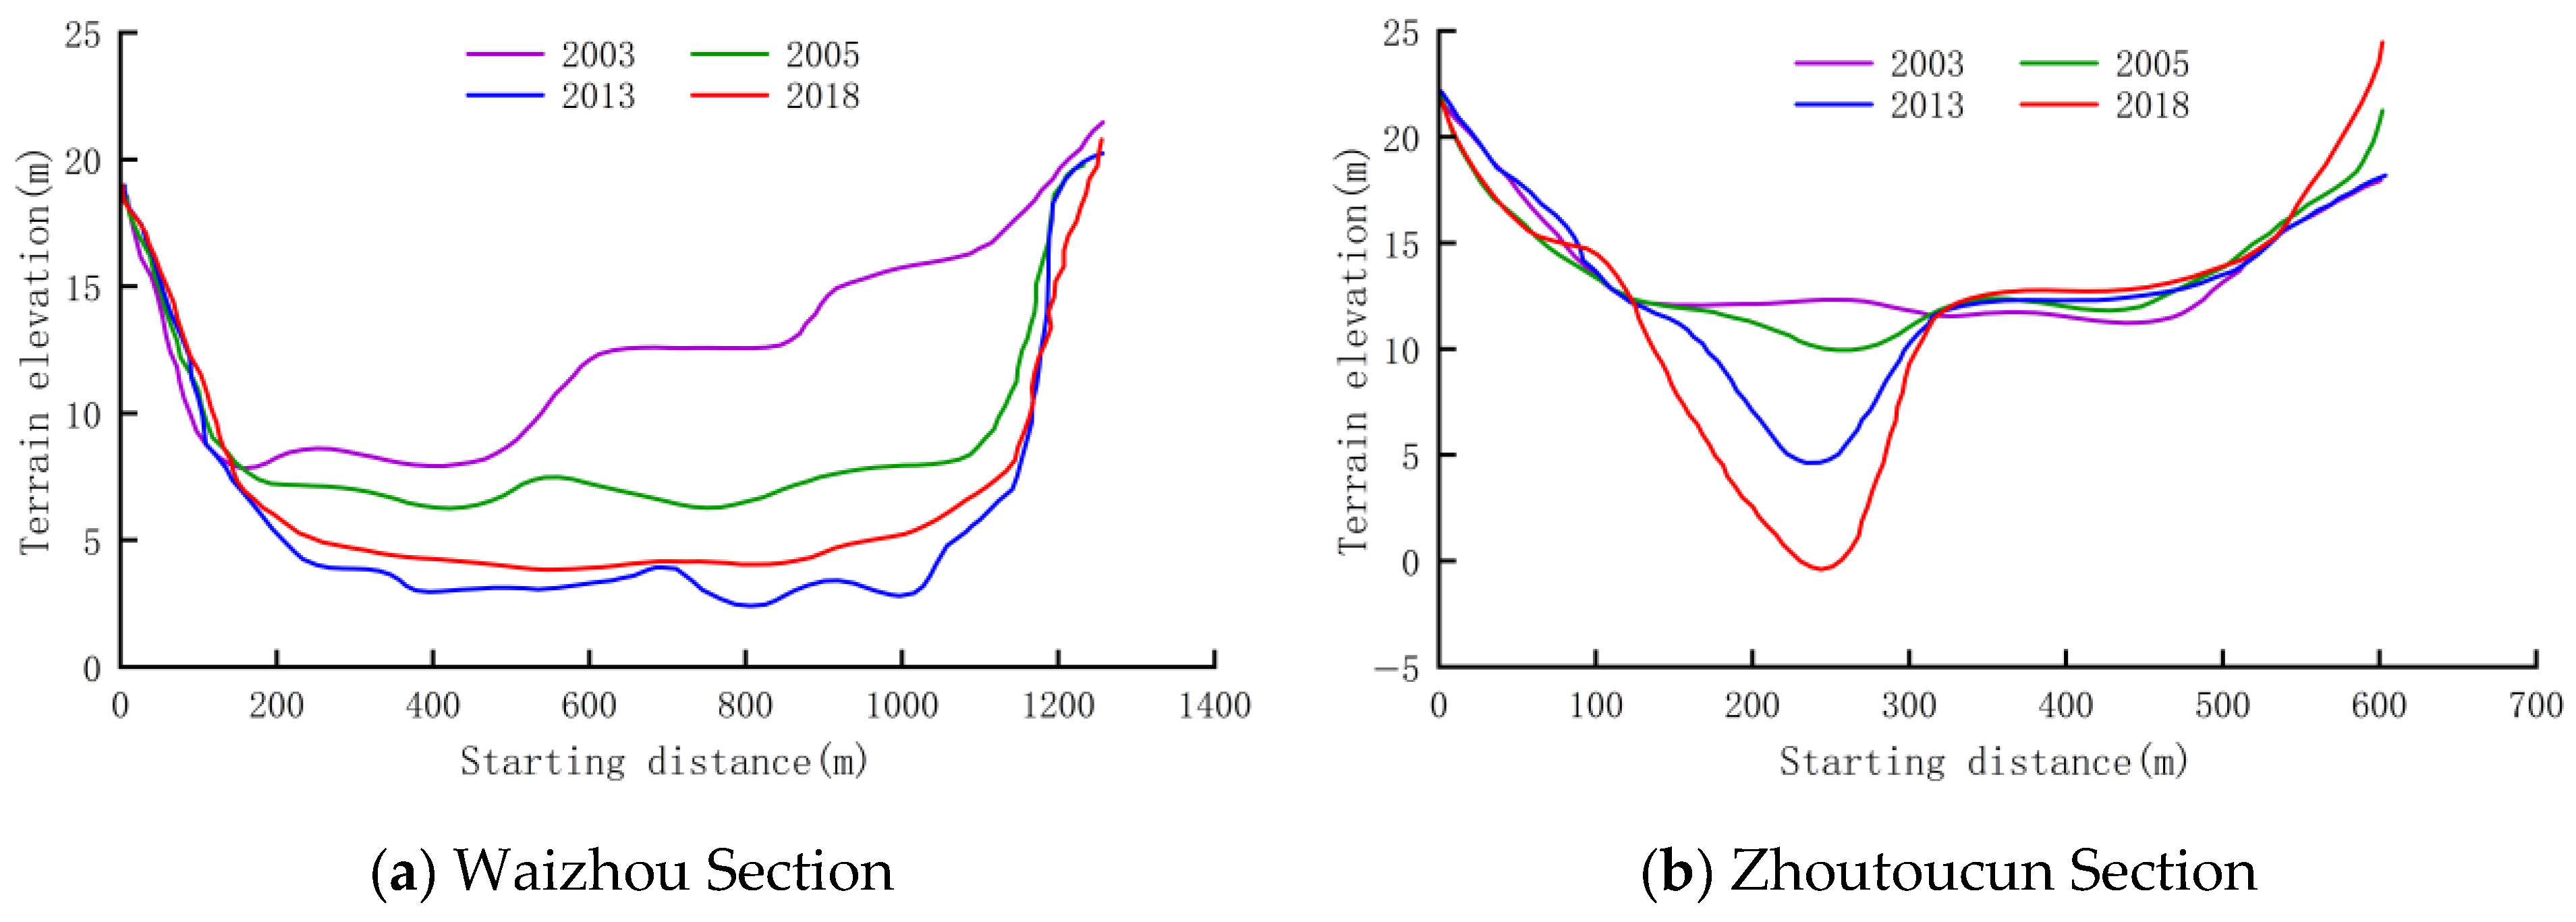
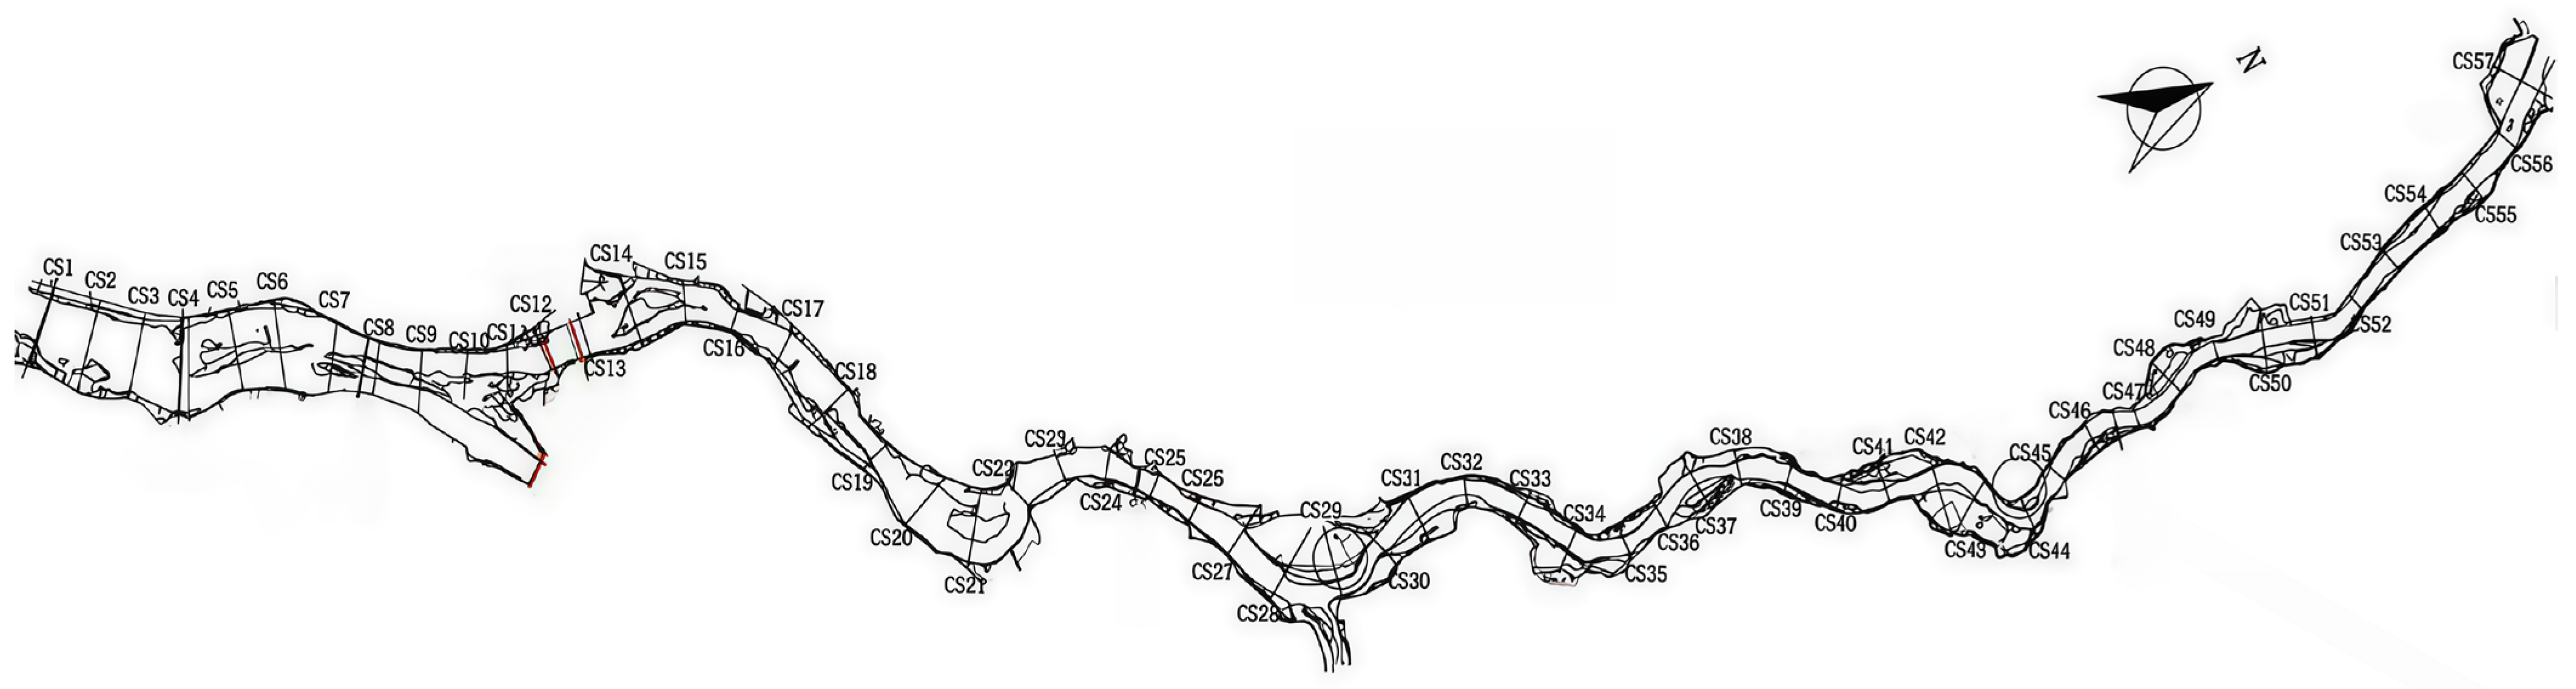
Using topographic data from representative cross-sections along the channel (Figure 6 and Figure 7), the volume of channel erosion and deposition was calculated [20]. Overall, the channel exhibited net erosion from 2003 to 2020, with a total erosion volume of 27.89 million m3. During 2003–2005, the erosion volume was 5.02 million m3, while during 2005–2013, the erosion volume reached 23.08 million m3, accounting for 82.7% of the total erosion from 2003 to 2020. This confirms the pronounced channel adjustment characteristic of the sand mining period. Since 2013, following effective regulation of sand mining activities, the magnitude of erosion–deposition changes has significantly decreased, exhibiting a pattern of alternating erosion and deposition along the channel with a net slight erosion overall.
(2)
Stepwise riverbed incision
The intensification of sand mining activities induced a systematic evolution of the Ganjiang tail-end channel. Large-scale, unregulated sand mining caused widespread thalweg incision. The West Branch and South Branch experienced incision depths of 5–10 m (reaching a local maximum of 16.5 m), with average annual incision rates of 0.46 m/yr, 0.67 m/yr, 0.57 m/yr, and 0.09 m/yr for the West Branch, South Branch, Middle Branch, and North Branch, respectively. Channel storage capacity increased significantly. Owing to uneven sand mining activities and channel regulation dredging, the longitudinal profile exhibited stepwise incision with spatial and temporal variations, representing a nonlinear response of the channel to altered flow–sediment conditions.
(3)
Modification of cross-sectional morphology
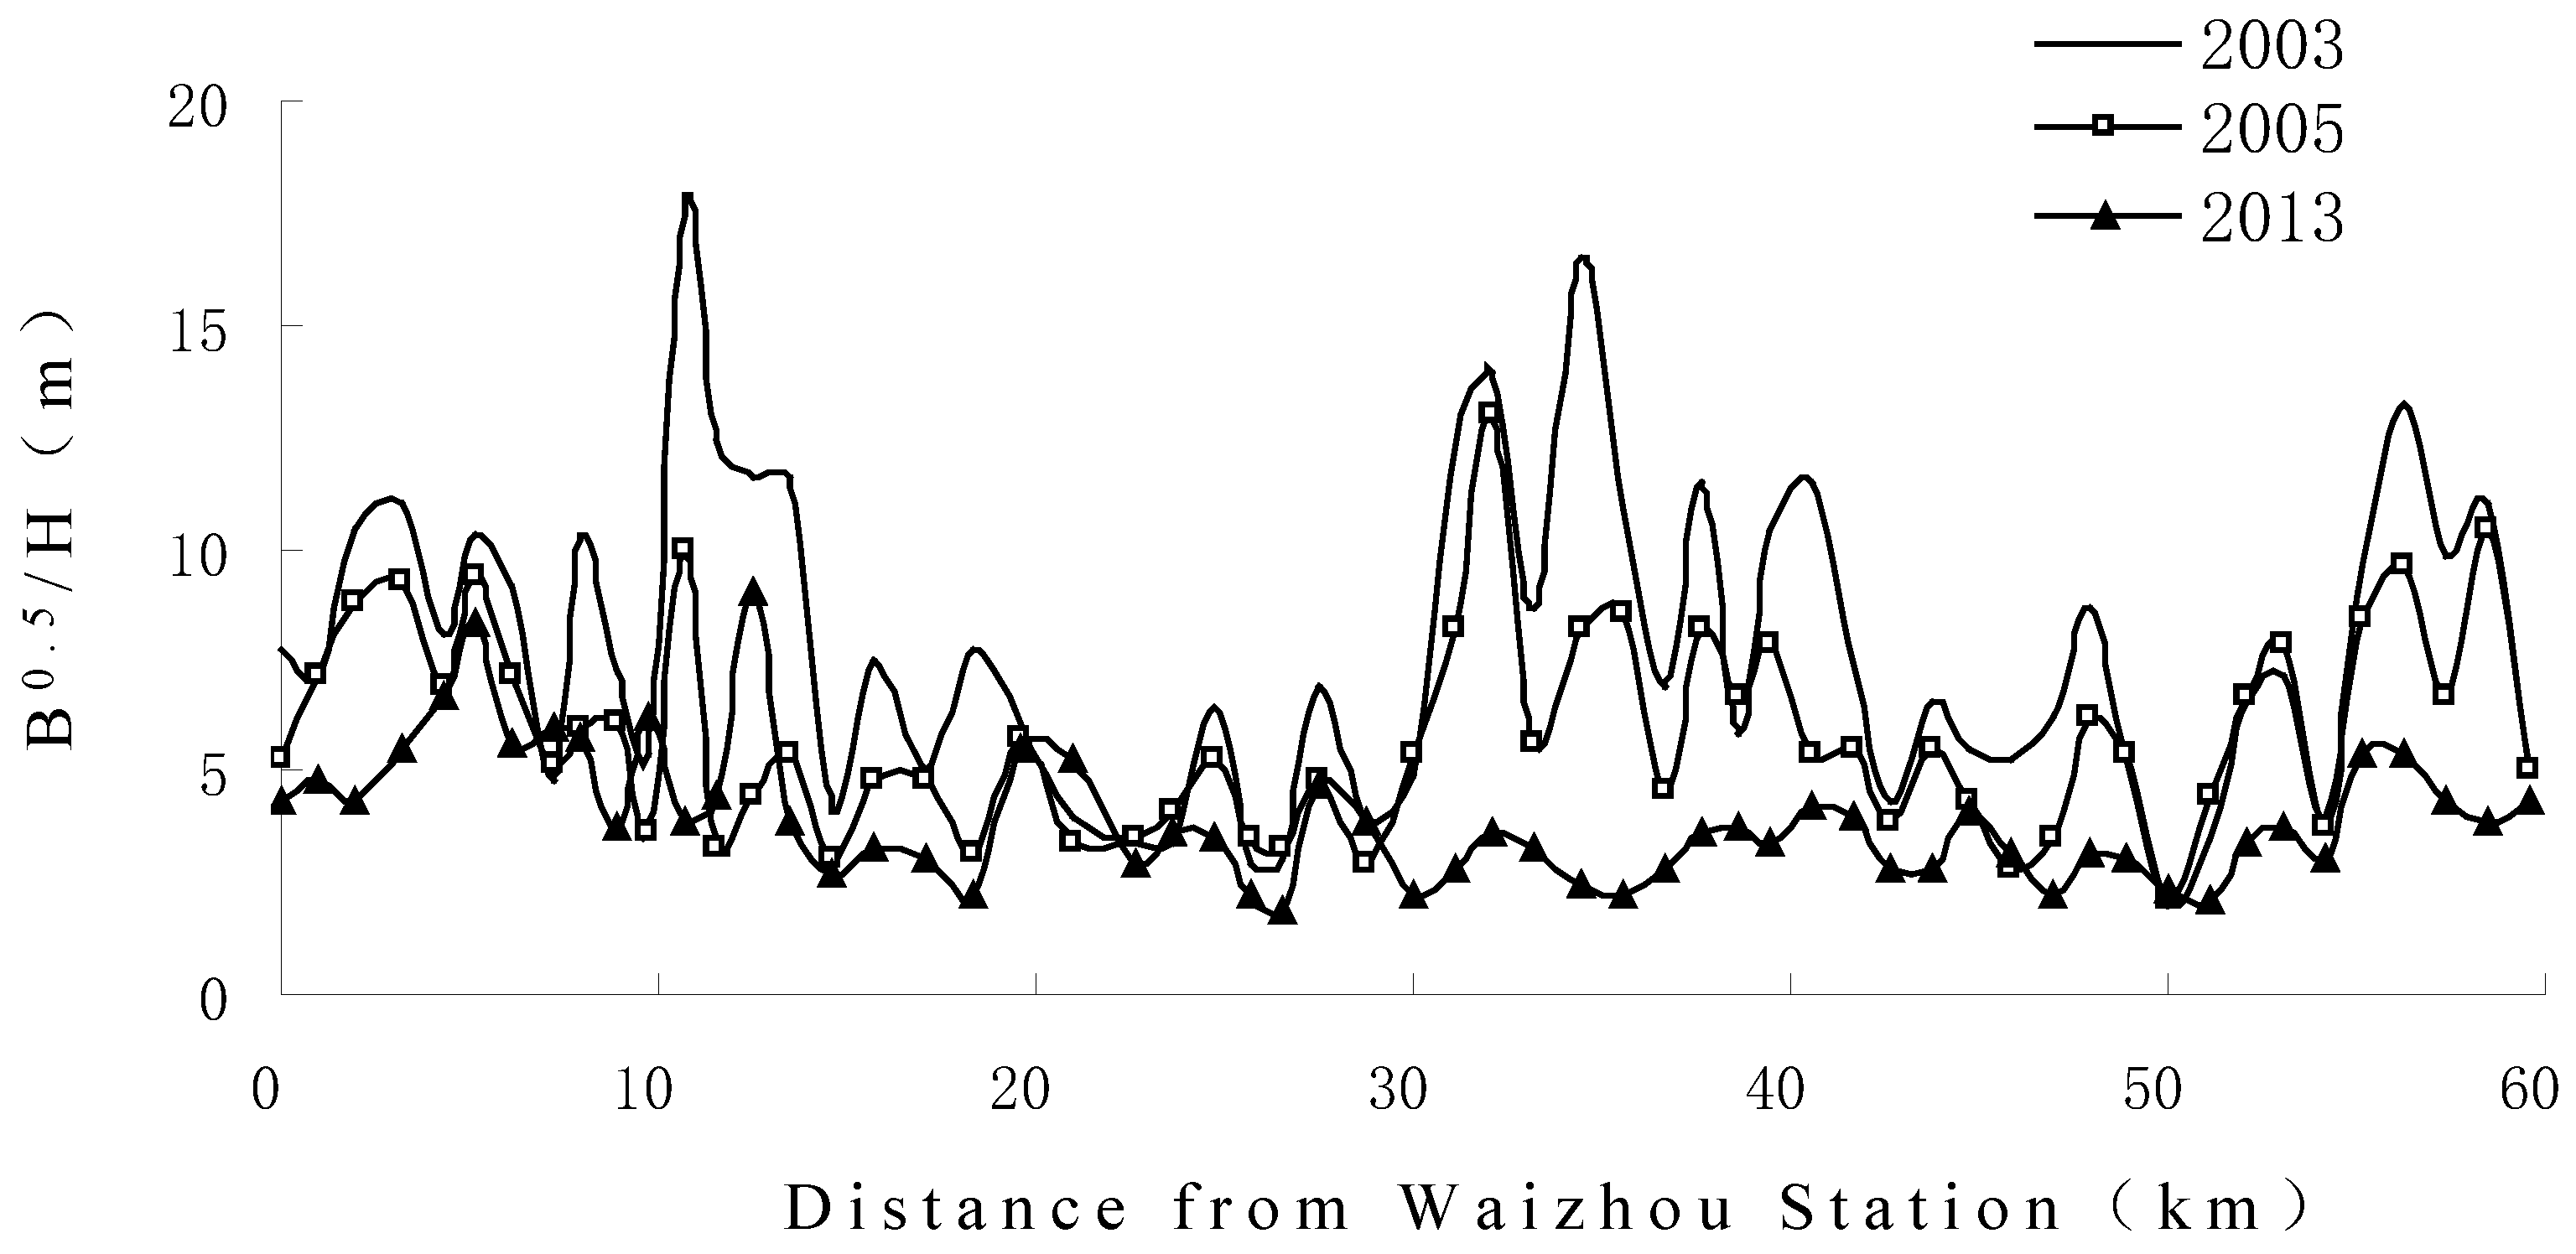
Non-uniform scour pits formed by sand mining created “V”-shaped or “U”-shaped deep troughs in local cross-sections (Figure 7). Channel width (B) increased, mean water depth (H) increased, and the hydraulic geometry coefficient ( B / H ) decreased, indicating an evolution toward relatively narrower and deeper cross-sections (Figure 8). Due to the containment provided by flood control levees on both banks, flood-season banklines remained relatively stable, while channel evolution was concentrated on low- and medium-flow channel bars, shoals, and the thalweg. Riverbed incision led to significant declines in water levels under the same discharge conditions, resulting in lower water levels during dry seasons.
(4)
Changes in flow distribution ratio
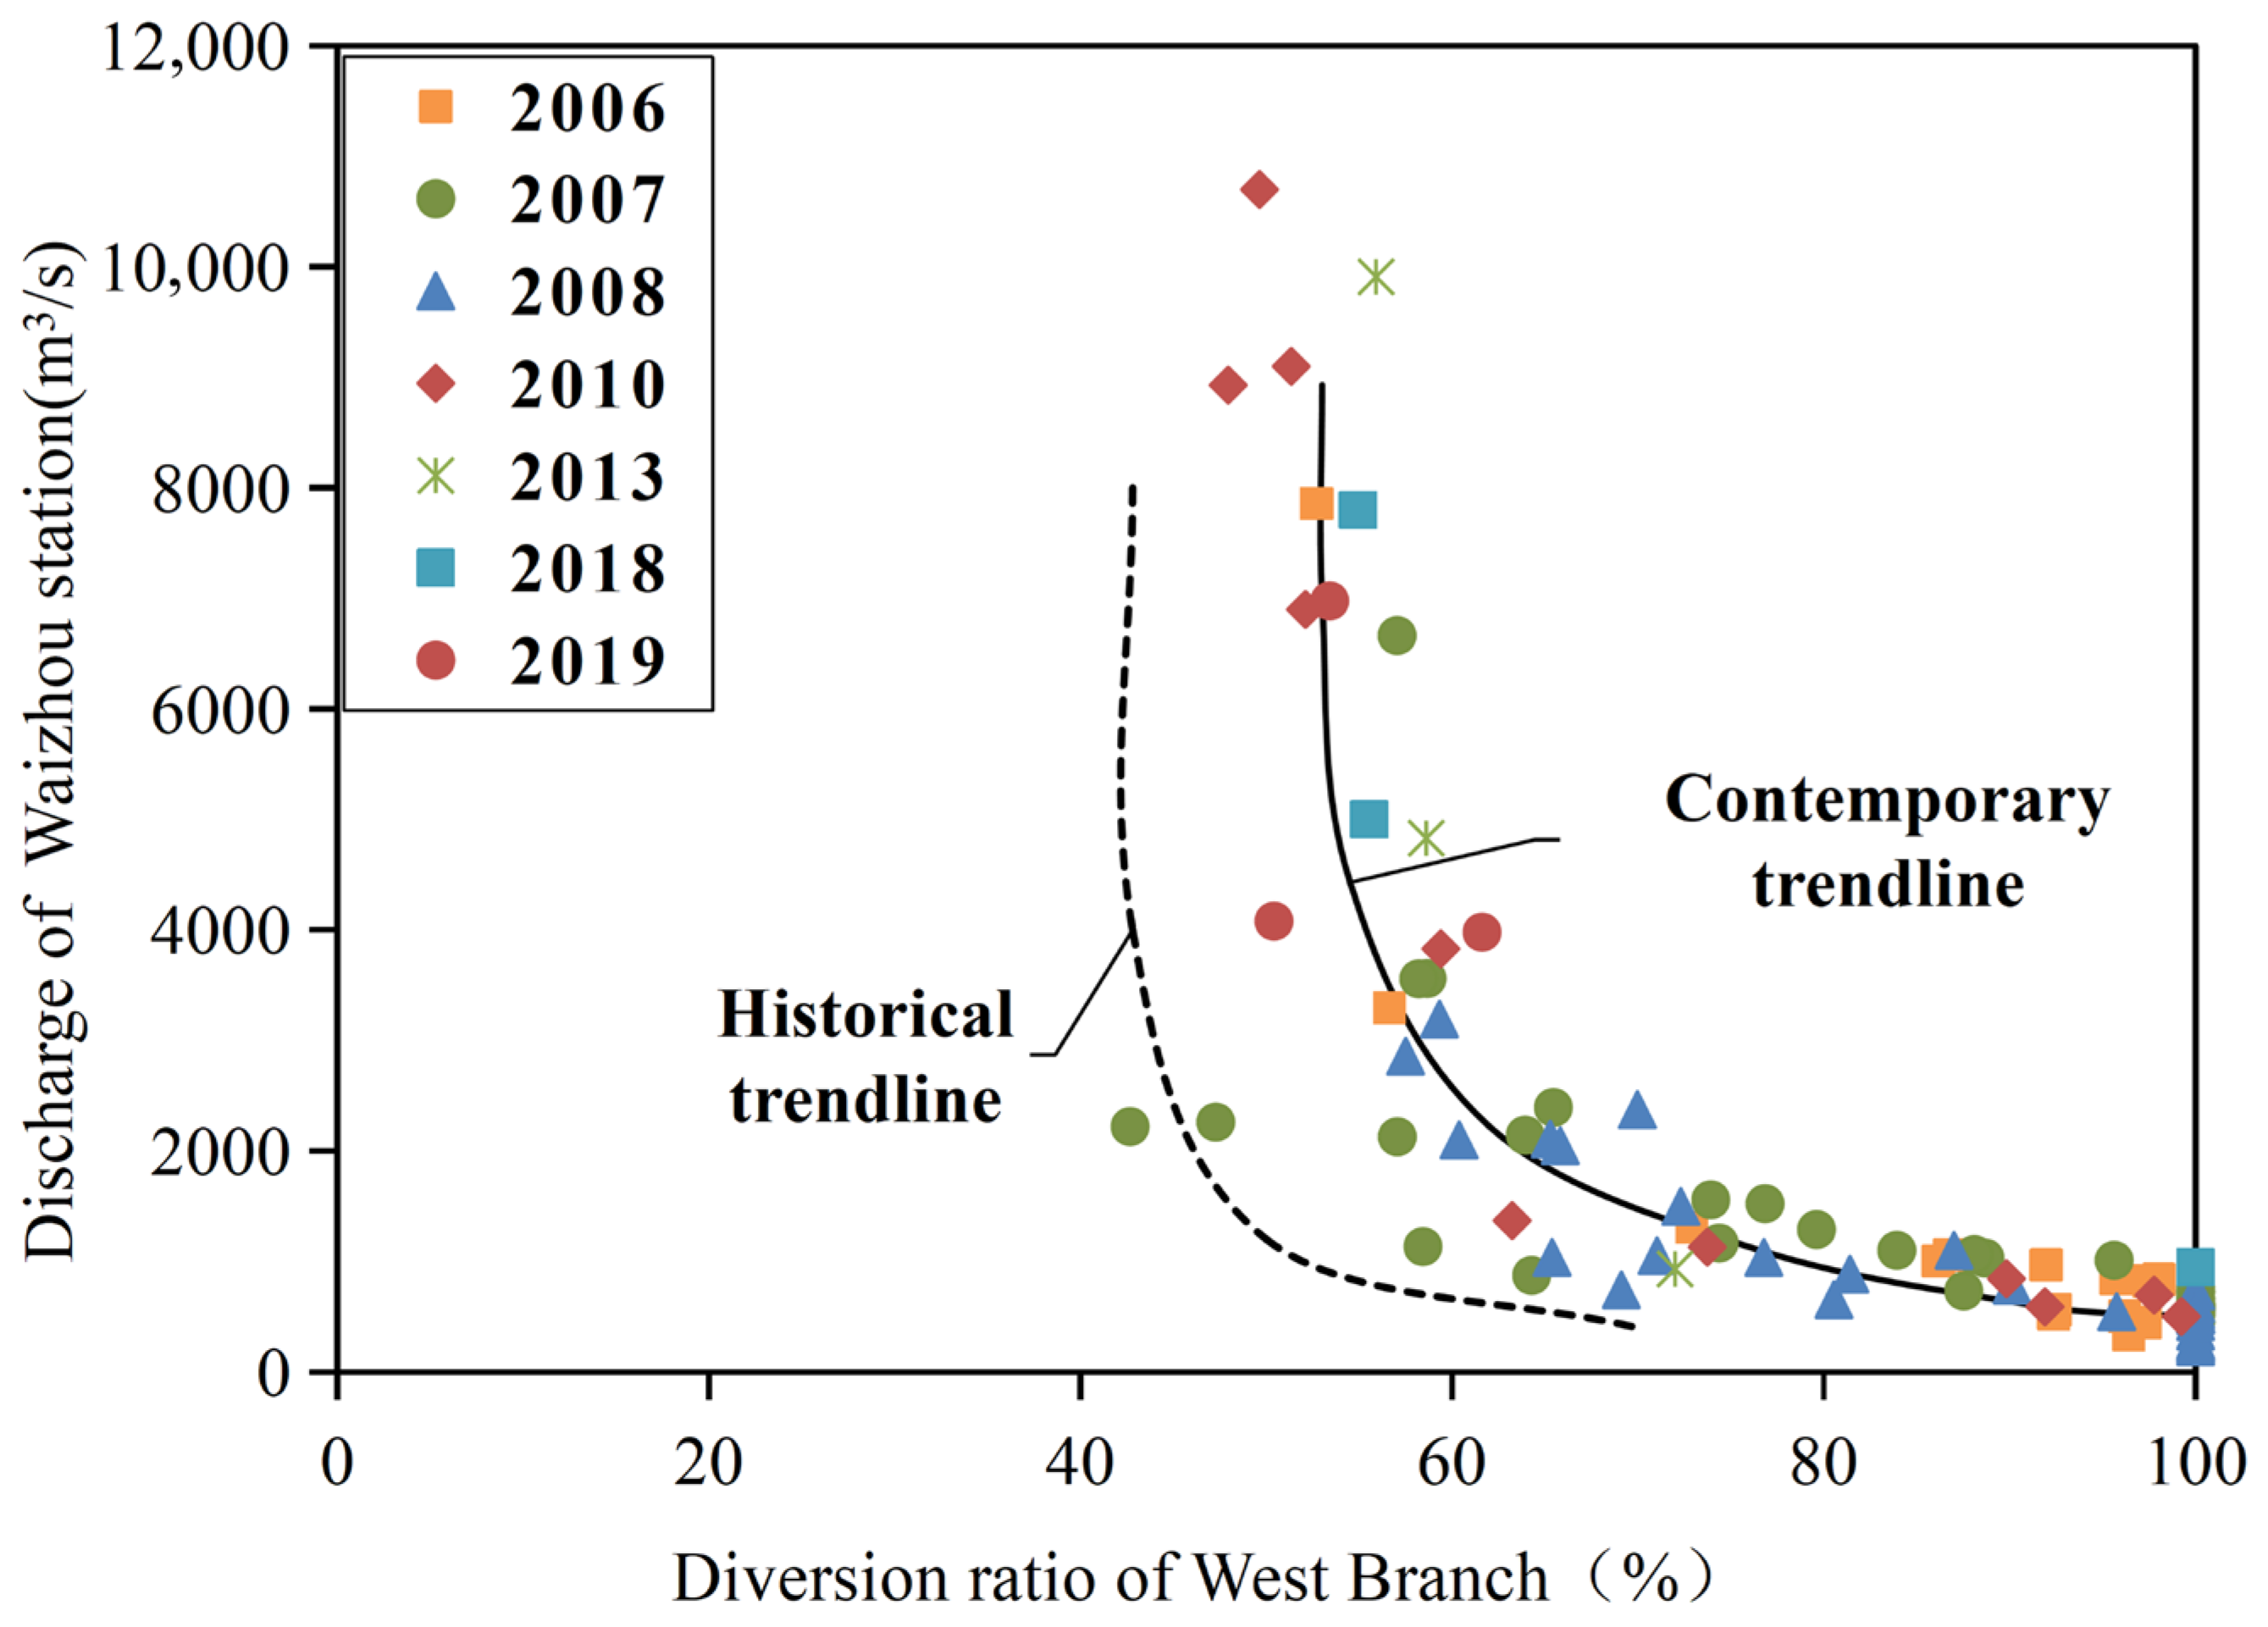
From 1970 to 2000, the flow diversion ratio between the East and West channels remained relatively stable, with the West Channel accounting for approximately 60% of the flow during dry seasons and approximately 40% during flood seasons. Over the past two decades, the West Branch and South Branch have successively undergone navigation channel regulation and dredging, while sand mining activities of varying intensities have also occurred in the West Branch, South Branch, and Middle Branch. Owing to the greater magnitude of riverbed incision in the West Branch, the flow diversion ratio of the West Branch has continuously increased under different hydrological conditions.
Based on measured flow diversion ratio data for the East and West channels from 2006 to 2019 (Figure 9), it is evident that the flow diversion ratio of the West Channel has significantly increased compared to the pre-2000 period, while that of the East Channel has correspondingly decreased. When the discharge at Waizhou Station ranges from 1000 to 4000 m3/s, the flow diversion ratio of the West Channel varies between 55% and 80%. As the discharge at Waizhou Station decreases, the flow diversion ratio of the West Channel gradually increases, reaching over 90%, while the corresponding diversion ratio of the East Channel decreases to less than 10%. During low flood periods, the mainstream flow is almost entirely conveyed through the West Branch, resulting in flow interruption in other distributaries during dry seasons [21].

3.3. Assessment of River Flood Control Capacity

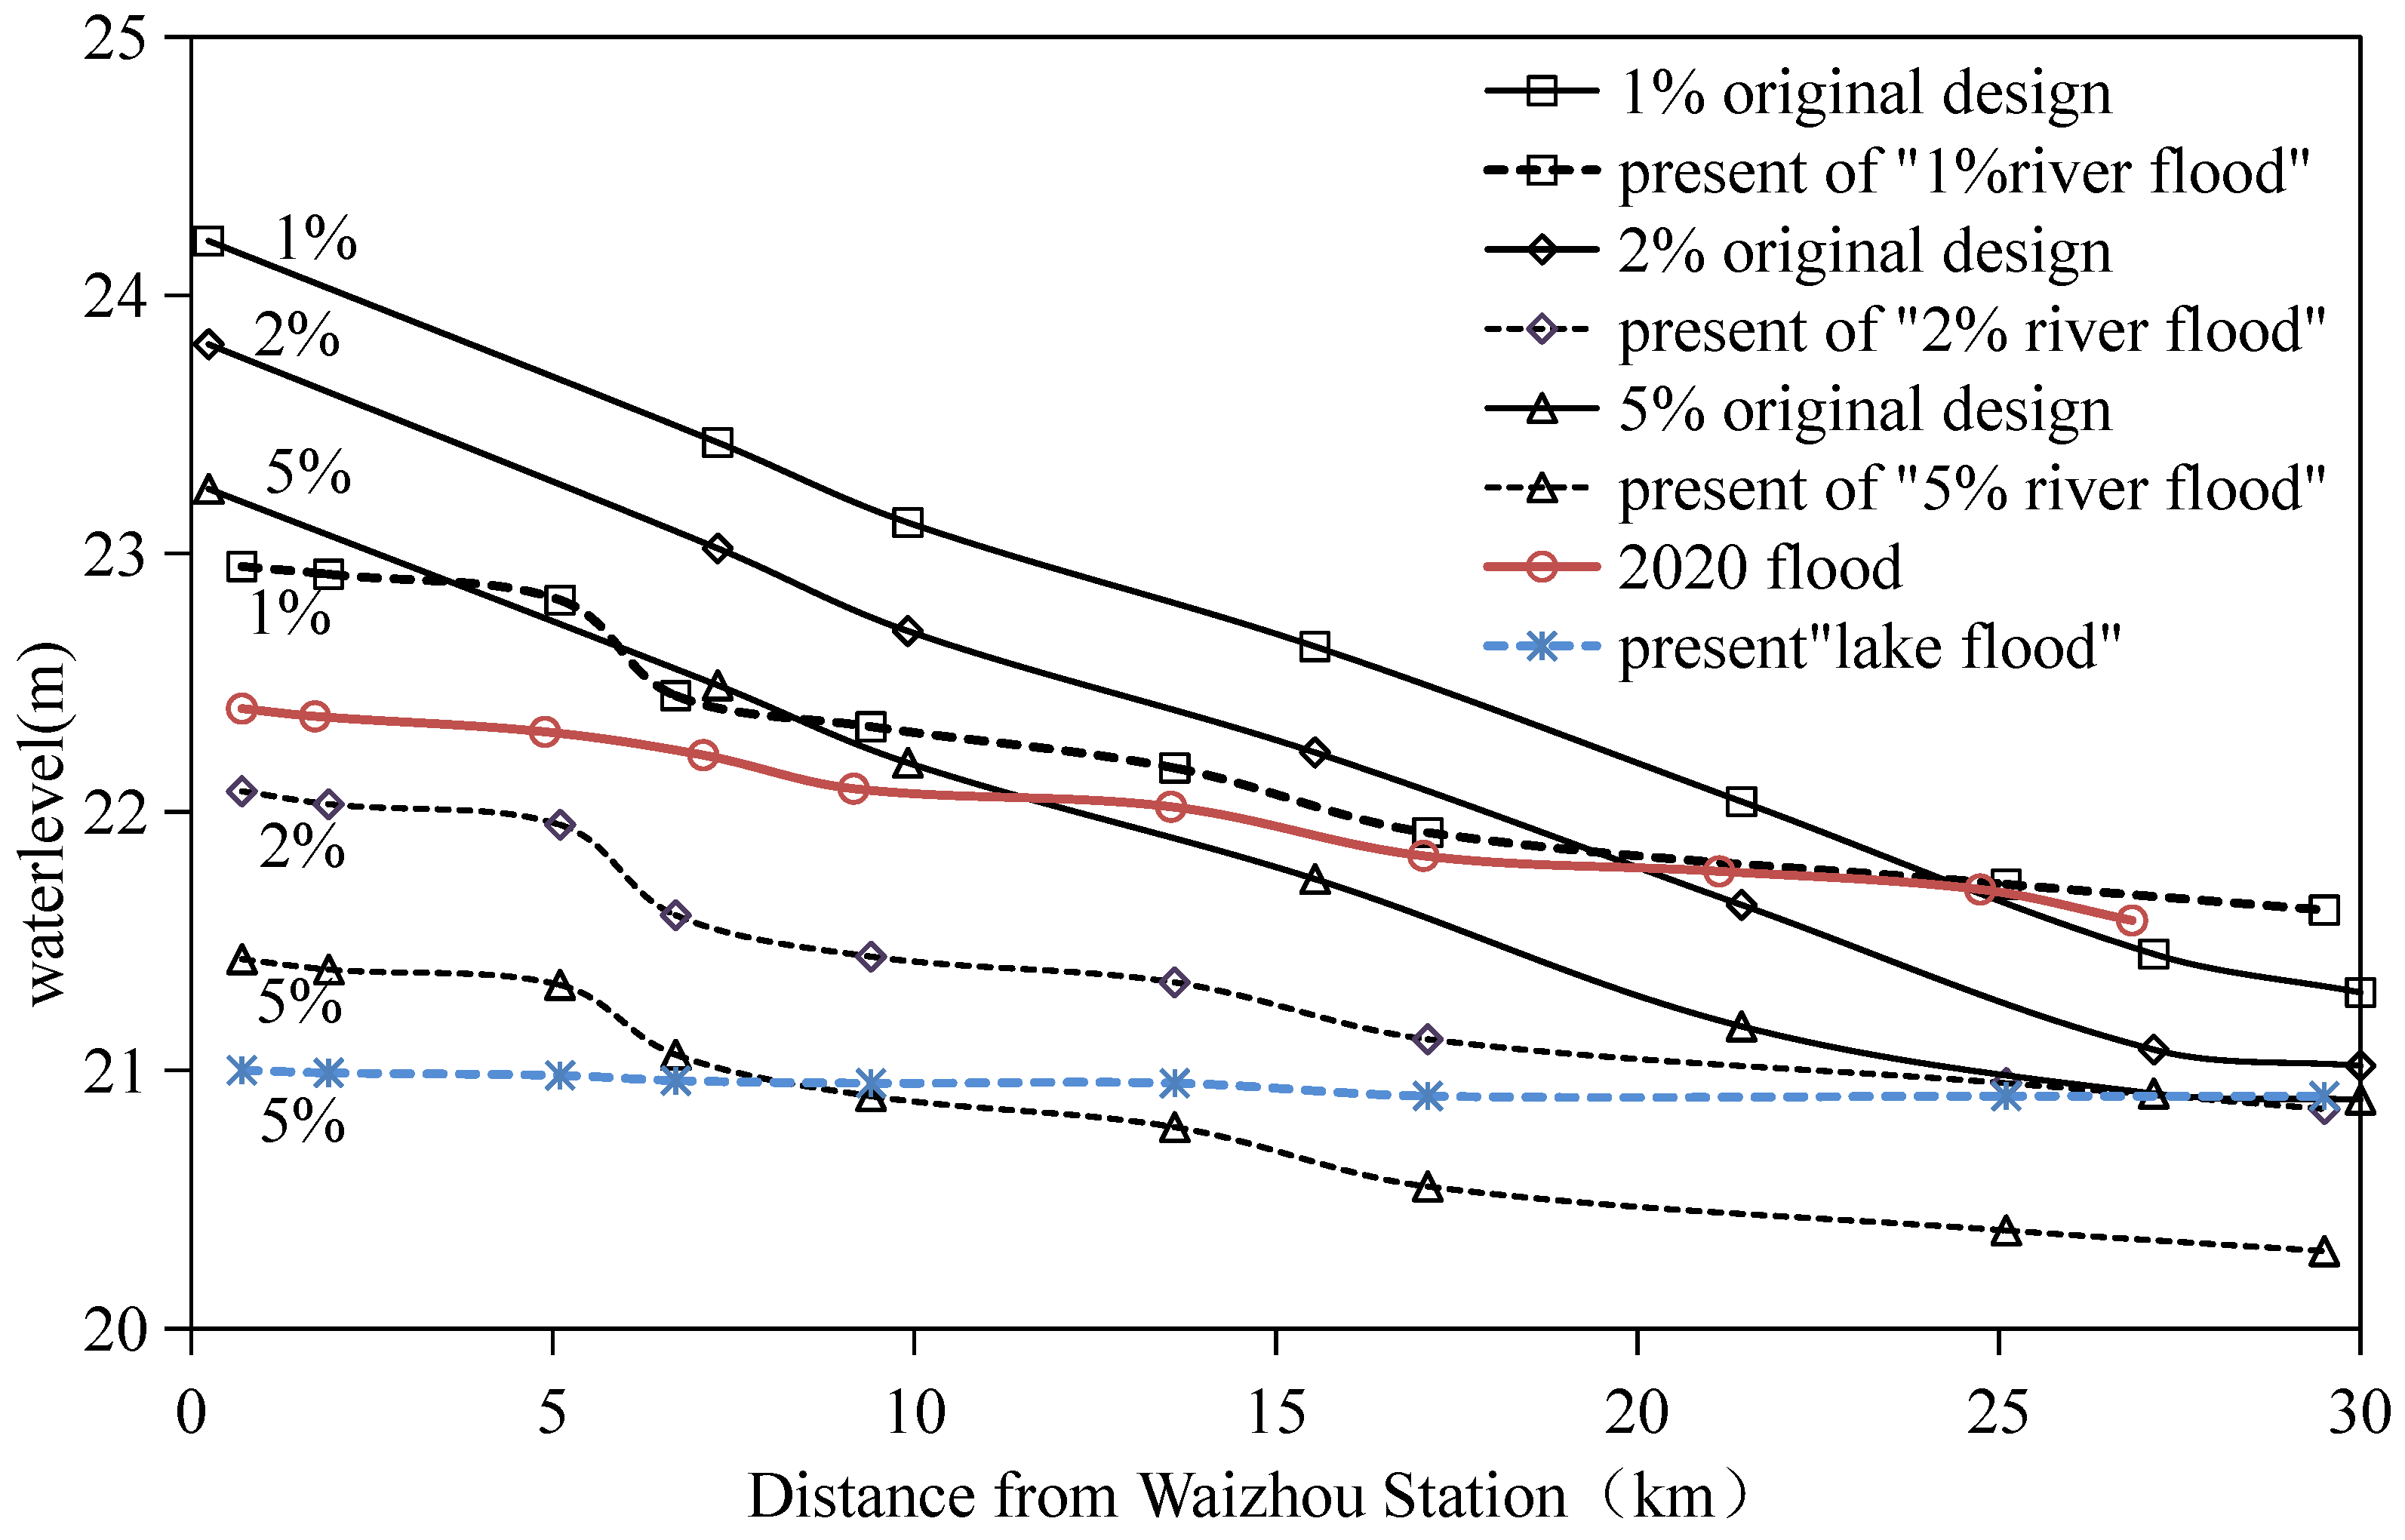
The Ganjiang tail-end delta is characterized by flat and low-lying topography, with flood control infrastructure consisting primarily of levees. Following the Phase I and Phase II flood control projects of Poyang Lake, the flood control capacity of key levees in the Poyang Lake area has reached or exceeded a 20-year return period, with the exception of the Yangzi Island levee, which has a capacity of less than a 10-year return period. The flood control levees in Nanchang City have been designed to withstand floods with return periods of 50 to 100 years. The design flood levels for the main stem of the Ganjiang River and the levees along the West Branch are shown in Figure 10.
The unique hydrological characteristics of the Ganjiang tail-end delta expose it to the dual flood risks of “river flooding” and “lake flooding.” River flooding refers to the scenario in which heavy rainfall in the upper Ganjiang Basin results in a large discharge at Waizhou Station, while the water level in Poyang Lake remains relatively low, allowing the river flood to be smoothly conveyed downstream. Lake flooding refers to the scenario in which intense rainfall occurs simultaneously in the mainstem Yangtze River basin and the Poyang Lake basin, leading to abnormally high water levels in Poyang Lake, which strongly backs up or even reverses into the Ganjiang tail-end delta. Under such conditions, even if the upstream discharge of the Ganjiang River is not large, the tail-end area experiences high water levels due to poor drainage. The year 2020 represents a typical co-occurrence event of river flooding and lake flooding. The primary factors influencing the flood control situation in the Ganjiang tail-end delta include the maximum flood water level, upstream and local inflow, the co-occurrence characteristics of “river flooding” and “lake flooding,” as well as the current status and capacity of flood control infrastructure.
A physical model experiment was conducted to assess the current flood control capacity of the Ganjiang tail-end delta. Two scenarios—“river flooding” and “lake flooding”—were considered, and the prototype boundary conditions for the model experiments are presented in Table 4. Prior to the major flood of 2020, the co-occurrence of “river flooding” in the Ganjiang tail-end delta and “lake flooding” in Poyang Lake had never been observed. The 2020 flood event demonstrated that there is a probability of such co-occurrence; therefore, the 2020 flood was analyzed.
According to the physical model test results (Figure 10), owing to factors such as riverbed incision and channel cross-sectional adjustments, the current flood water levels in the Ganjiang tail-end delta have decreased to varying degrees compared to the original design values. Under the “river flooding” control scenario, the flood water level decrease was most pronounced, with a maximum reduction of 1.62 m. Under the “lake flooding” control scenario, flood water levels were primarily constrained by the water level of Poyang Lake, resulting in a relatively gentle longitudinal water surface profile overall, with flood water levels in the downstream tail-end reach of Nanchang remaining largely consistent with the original design values.
The reduction in flood water levels implies a significant enhancement of flood conveyance capacity in some reaches. Taking Waizhou Station as an example, under a 100-year flood event, its flood conveyance capacity increased from the design value of 25,600 m3/s to 33,500 m3/s, representing an increase of 31%. However, from the perspective of the overall tail-end channel system, because flood water levels in the “lake flooding” controlled zone did not change significantly, the overall improvement in flood conveyance capacity across the entire Ganjiang tail-end delta was limited. This manifests as a marked enhancement in flood conveyance capacity in reaches dominated by “river flooding” control, while reaches dominated by “lake flooding” control remained essentially at their original levels.

4. Discussion

4.1. Driving Mechanisms of Channel Evolution

Prior to the 1980s, activities such as deforestation for grain cultivation and indiscriminate reclamation led to severe soil erosion within the watershed. The annual average sediment load at Waizhou Station reached as high as 11.68 million tons. Since 1983, large-scale afforestation and soil and water conservation projects have been implemented in the Ganjiang Basin, resulting in a significant increase in forest cover and a gradual reduction in hillslope erosion and riverine sediment supply.
The completion of the Wan’an Reservoir in 1991 marked a critical turning point in the flow–sediment evolution of the Ganjiang River. The change point detected by the Pettitt test coincides with the year the reservoir began operation. The sediment trapping efficiency of the Wan’an Reservoir reached approximately 50%, significantly reducing sediment input to the lower reaches. The annual average sediment load at Waizhou Station dropped sharply to 6.90 million tons. Subsequently, the impoundment of the Three Gorges Reservoir in 2002 altered the hydrodynamic conditions of Poyang Lake and further exacerbated the water level decline in the Nanchang reach.
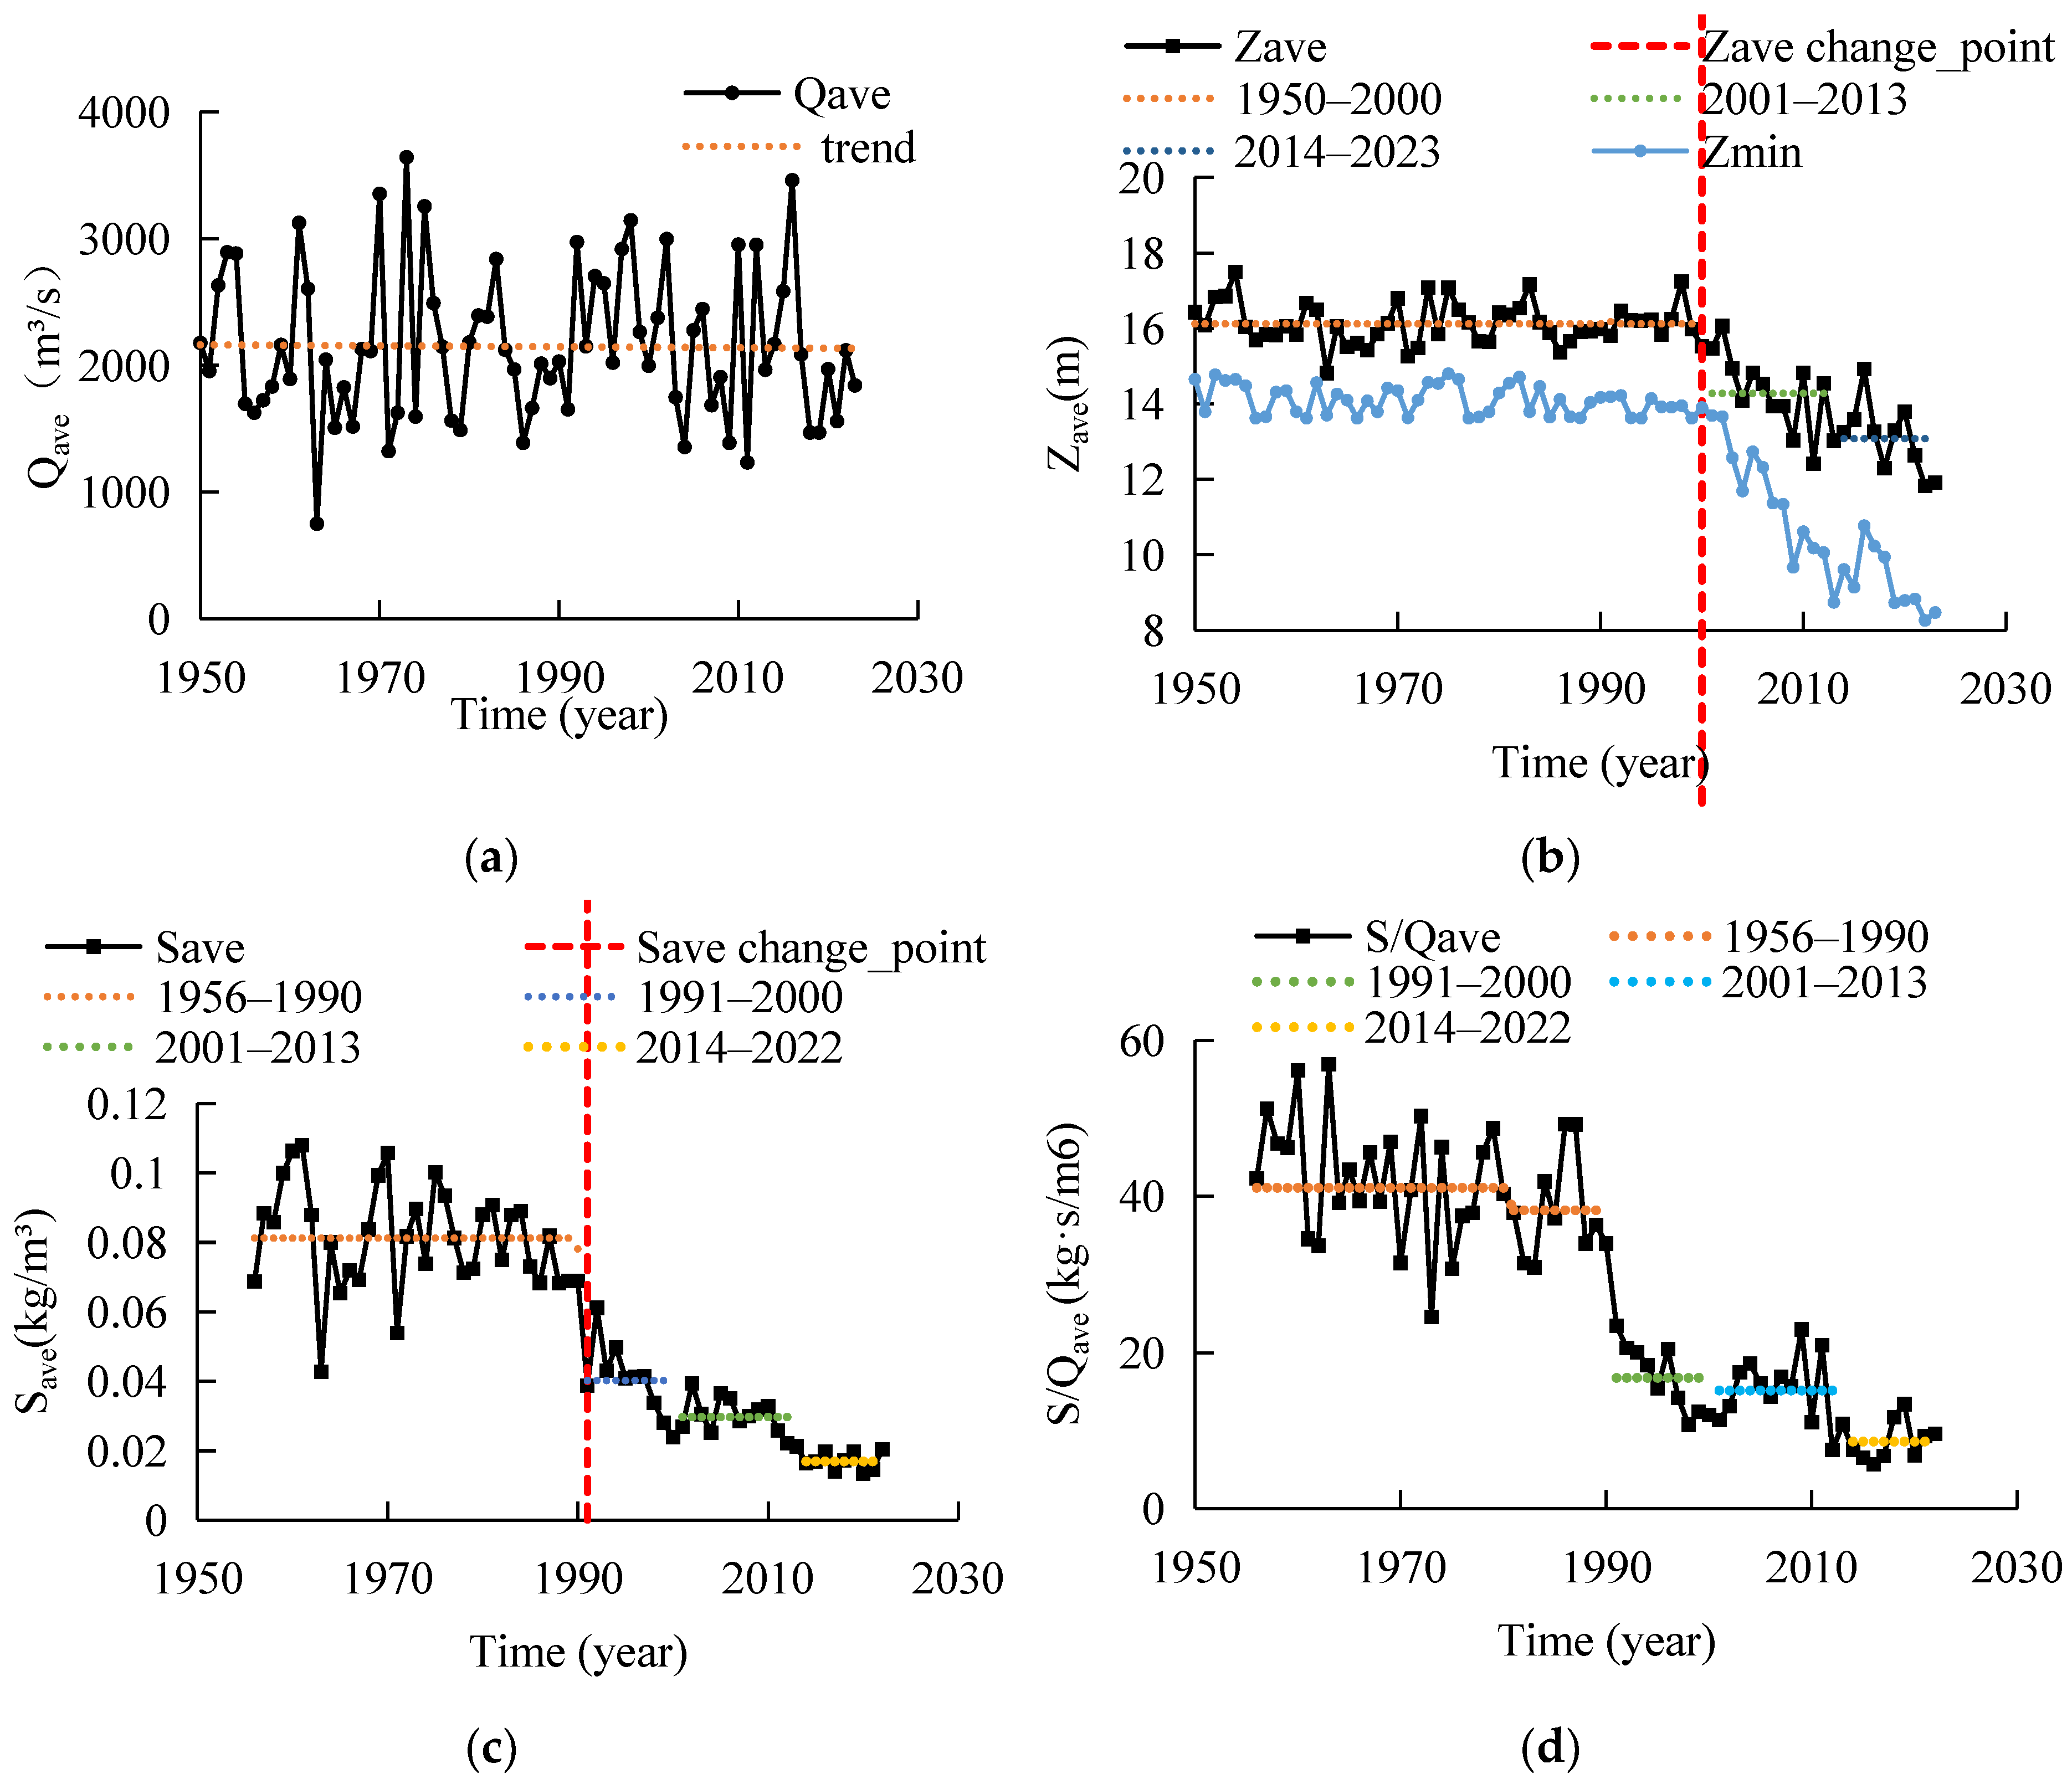
Large-scale sand mining activities that began in 2001 further intensified riverbed disturbance. Although the decreasing trend in annual average suspended sediment concentration during this period was not statistically significant (z = −1.03), the phased mean value was notably lower than in previous periods. After 2010, the annual average sediment load did not exceed 2 million tons. During the same period, the water level response was significant: the average annual minimum water level decreased by 0.41 m from 2001 to 2013, reaching a record low of only 8.74 m in 2013 (Figure 11b). Following the regulation of illegal sand mining after 2011, combined with channel regulation projects, sediment supply gradually stabilized.
Analysis of the sediment delivery coefficient (S/Q) (Table 3, Figure 11d) further reveals the phased changes in the flow–sediment relationship: during the impoundment period, the sediment delivery coefficient decreased significantly (to approximately 40% of its pre-1991 level), reflecting the imbalance in sediment transport induced by sediment trapping at the Wan’an Reservoir. During the sand mining period, the riverbed underwent drastic adjustments, and water levels exhibited a significant decreasing trend.
Collectively, the flow–sediment evolution of the Ganjiang tail-end channel is driven by the coupled effects of watershed vegetation restoration, reservoir sediment trapping, and sand mining disturbances, among which the impoundment of the Wan’an Reservoir and sand mining activities have exerted the most pronounced influences on water levels and sediment transport patterns. It should be noted that the decline in water level under the same discharge condition is the result of multiple interacting factors, behind which there exists a clear causal hierarchy. Reduced sediment supply is the fundamental driving force, but it does not directly cause water level decline—the fact that the abrupt change in suspended sediment concentration (1991) preceded the abrupt change in water level (2000) supports this. Channel widening is not the primary cause; in the sand-mined reaches, the cross-sectional morphology tended toward narrow and deep (the hydraulic geometry coefficient B / H decreased), indicating that vertical incision is the dominant geometric factor responsible for the increase in flow area. In summary, the drastic alteration of the flow–sediment relationship drove channel reshaping dominated by vertical incision, which ultimately manifested as cascading responses in water levels and diversion patterns.
Currently, with the strict regulation of sand mining activities, the future recovery of the riverbed in the Ganjiang tail-end delta warrants discussion. Under the current background of low sediment supply (annual average sediment load less than 2 million tons), natural recovery would be extremely slow. Drawing on the experience of localized sedimentation following the ban on sand mining in the middle and lower reaches of the Yangtze River, a significant re-deposition process may take decades or even longer. Moreover, the recovered morphology is unlikely to be a simple reversal of the past; rather, a new dynamic equilibrium is more probable under the altered flow–sediment boundary conditions, such as the mitigation and filling of localized scour pits. In the short term, it is unrealistic to expect natural processes to restore the pre-mining riverbed elevation. This finding further reinforces the necessity of implementing artificial regulation measures (e.g., the comprehensive regulation hub) to compensate for the adverse effects induced by riverbed incision.

4.2. Flood Risk Analysis

4.2.1. Causes of Flood Water Level Changes

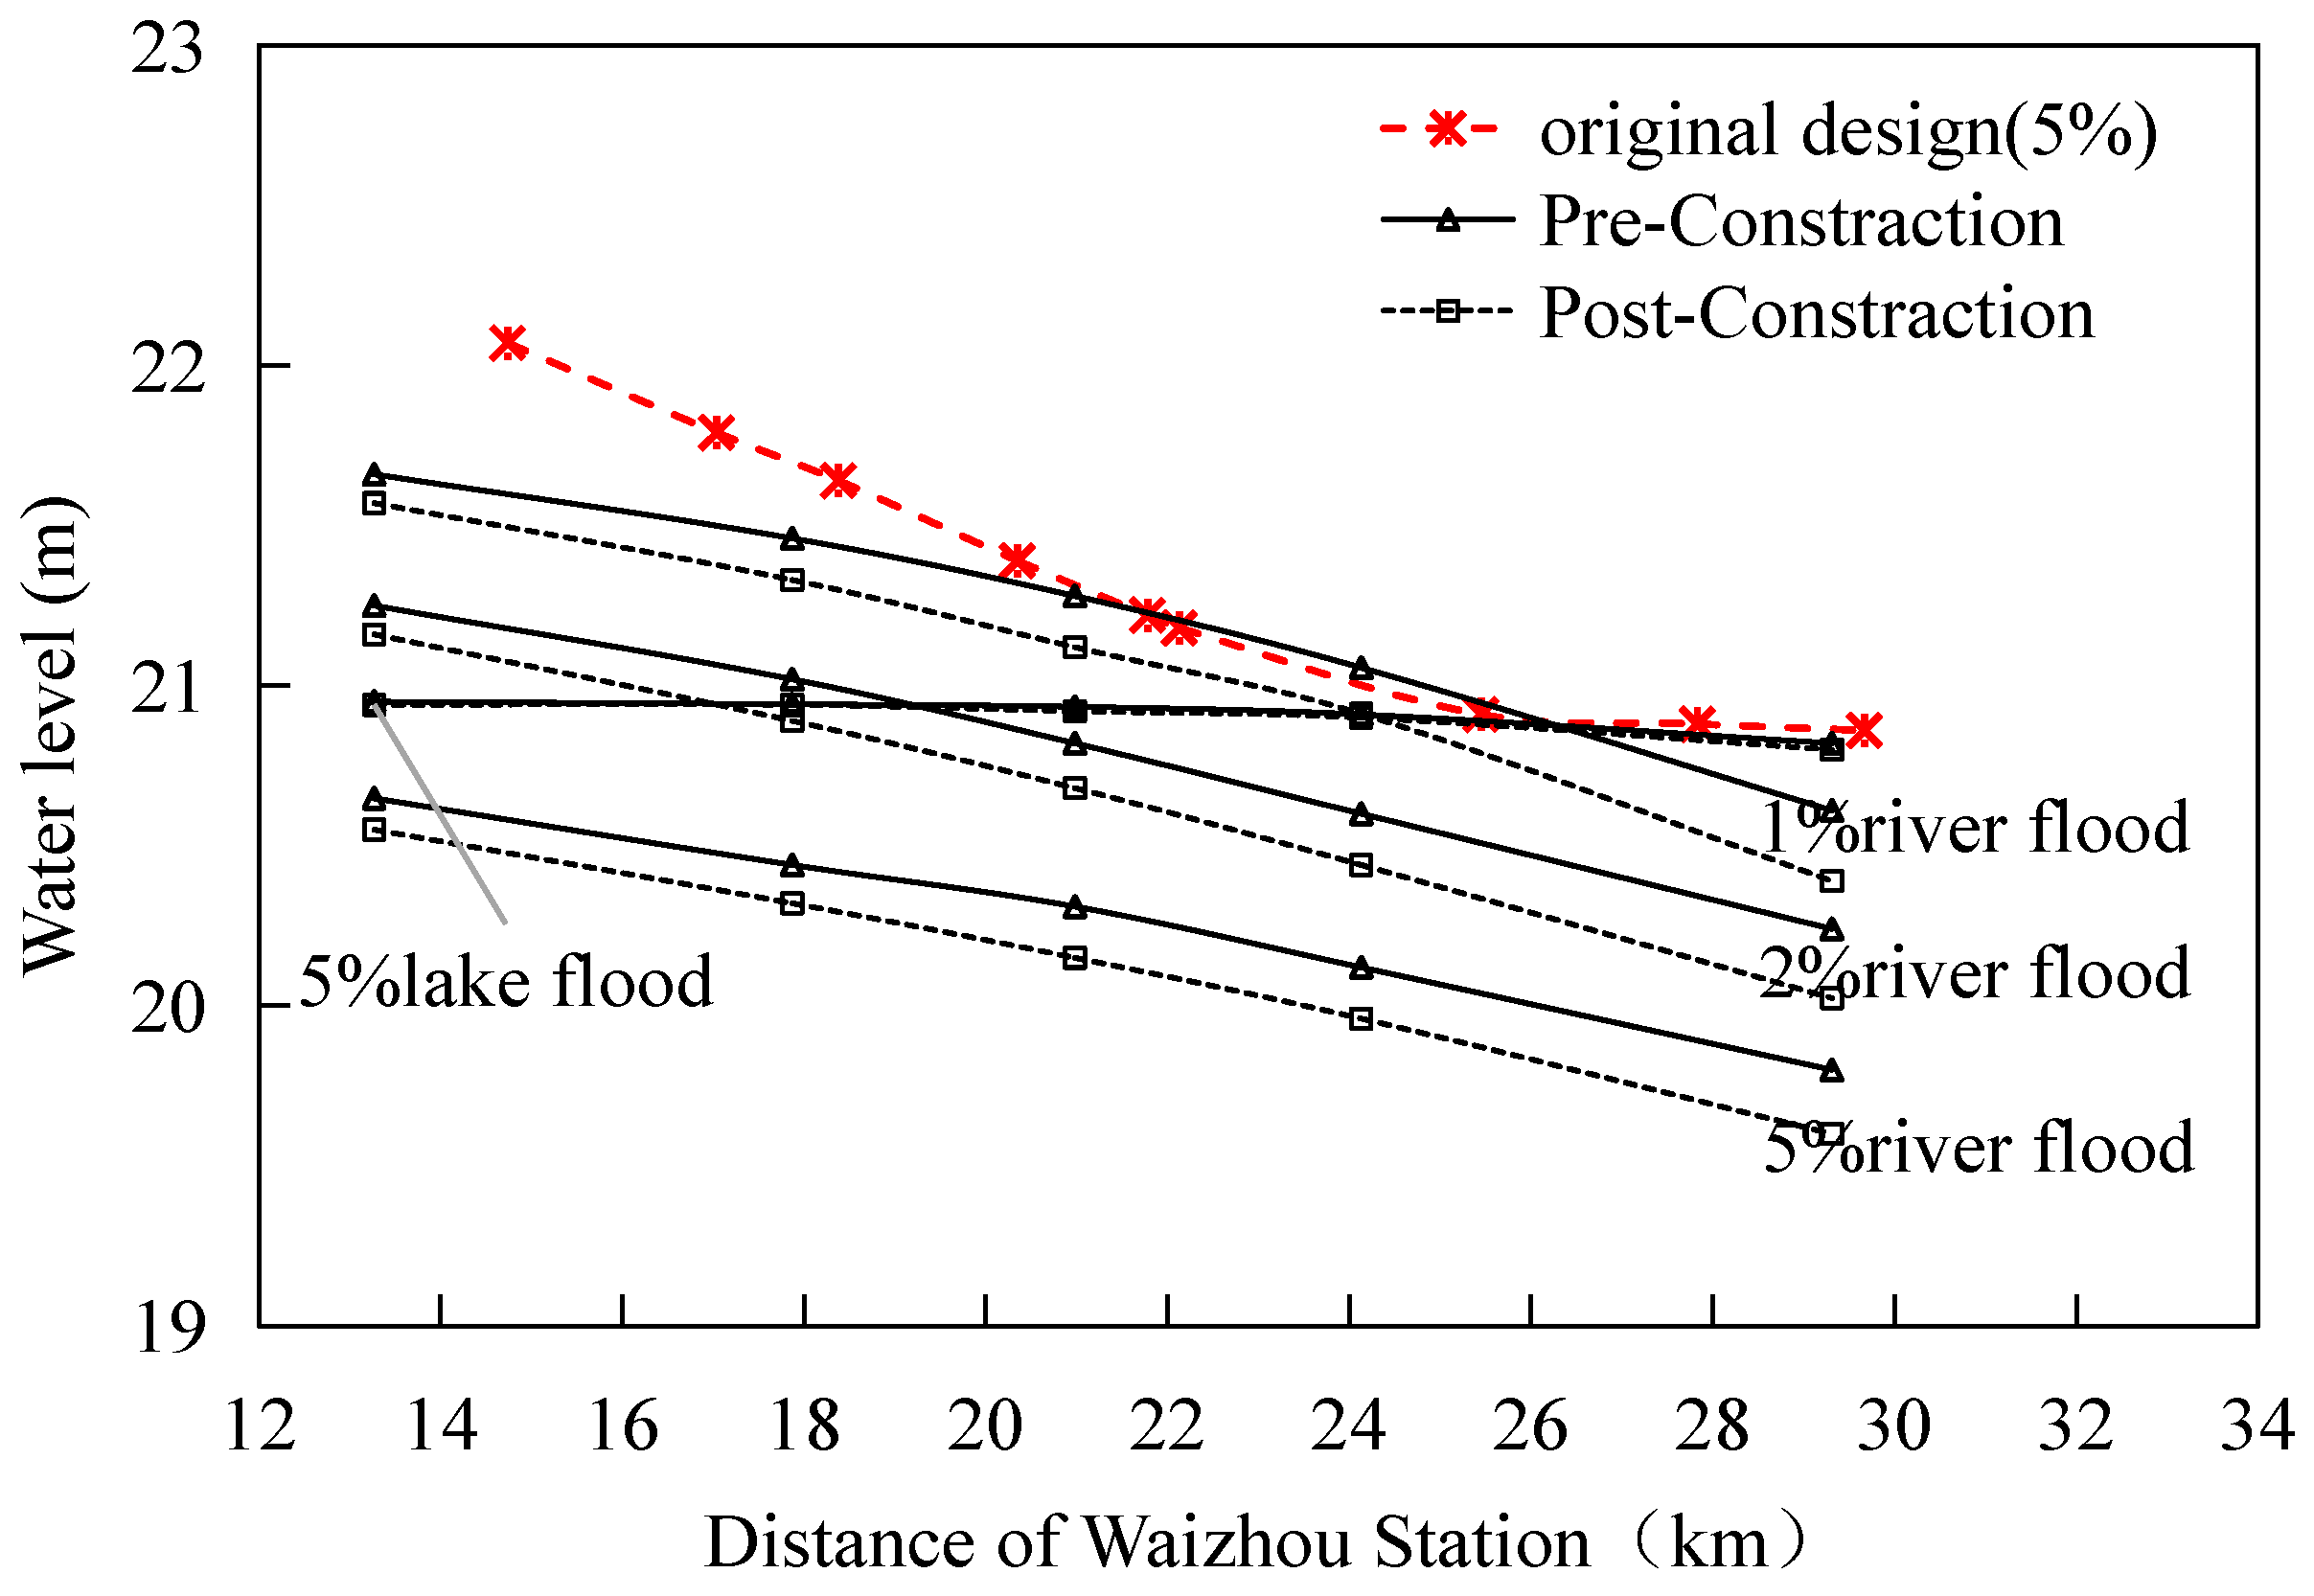
Comparing the design flood water levels of various levees in the Nanchang urban reach with the physical model test results, the current flood water levels of the levees are generally lower than the original design standards. For example, the physical model test results show that the 100-year flood water level in the main stem ranges from 21.87 to 22.55 m, which is approximately 1.44 to 1.66 m lower than the original design flood water level of the levees (Figure 10). For the South Branch, the 20-year flood water level from the simulation ranges from 19.60 to 20.55 m, which is 1.06 to 1.42 m lower than the original design value (Figure 12). This indicates that human activities in recent years have played a significant role in reducing flood risk, effectively raising the original levee standards (locally, the South Branch levee has achieved the 1% design standard).
Combined with the trend analysis of discharge at Waizhou Station presented earlier, the characteristic values of discharge have remained generally stable. Therefore, the decline in flood water levels is not related to changes in upstream inflow but is closely associated with adjustments in channel morphology. Monitoring results show that the cross-section at Waizhou Station has experienced incision depths ranging from 2.59 to 14.33 m in recent years, with an average of approximately 6 m. The thalweg of the main stem of the Ganjiang River and the West Branch reach has also undergone incision ranging from 0.23 to 15 m, averaging 6.4 m. Riverbed incision has increased the flow conveyance capacity of the channel, leading to a significant reduction in water levels under the same discharge conditions, thereby enhancing the flood conveyance capacity of the reach.

4.2.2. Co-Occurrence of “River Flooding” and “Lake Flooding”

During the 2020 flood season, a major flood in the Yangtze River Basin coincided with a record-breaking flood in Poyang Lake, resulting in a co-occurrence event of “river flooding” and “lake flooding” in the Ganjiang tail-end delta. The two flood peaks occurred only one day apart. The “lake flooding” event corresponded to a 20-year return period, while the “river flooding” event exceeded a 10-year return period (18,400 m3/s) [9]. Nevertheless, this led to measured flood water levels in some reaches of the West Branch exceeding the design standard (50-year return period), with localized levels even surpassing the 100-year flood water level (Figure 11). Statistical analysis indicates that only one such co-occurrence event has occurred over the 69-year period from 1956 to 2024, with an occurrence probability of approximately 1.5%, representing a low-probability phenomenon. However, with the increasing frequency of extreme climate events, combined with increased drainage discharge into the river due to human activities along the riverbanks and accelerated confluence caused by channelization of small and medium-sized rivers, the probability of high water levels occurring under relatively small flood volumes in the Ganjiang River is increasing [13]. The potential for superposition of high water levels in the Yangtze River and flood peaks in the Ganjiang River is rising, necessitating heightened attention to the future risk of co-occurrence of “river flooding” and “lake flooding.”

4.2.3. Vulnerabilities in Flood Control Infrastructure in the Ganjiang Tail-End Delta

Under the influence of intense human activities, flood water levels in the Ganjiang tail-end delta channel have been effectively reduced; however, vulnerabilities remain within the flood control system. Riverbed incision constitutes one of the key challenges to flood control safety. Continued incision may expose levee foundations and increase the risk of piping, which is one of the primary causes of levee failure. Furthermore, human activities have accelerated the rate of channel adjustment to two to three times that of natural processes. Uneven incision may locally form “bottleneck” cross-sections, resulting in backwater effects and localized flooding. The changing characteristics of flood co-occurrence have further exacerbated flood control pressures. With the combined effects of climate variability and human activities, the likelihood of simultaneous occurrence of “river flooding” in the Ganjiang tail-end delta and “lake flooding” in Poyang Lake is increasing. Traditional levee designs have largely not accounted for such co-occurrence scenarios, and some reaches have already experienced water levels exceeding the design safety threshold. This situation urgently requires revision and strengthening in future flood control planning.

4.3. Ecological and Environmental Impacts

4.3.1. Riverbed Structure, Human Activities, and Ecological Function Degradation

With the construction and reinforcement of flood control levees along both banks of the Ganjiang tail-end channel by the Jiangxi Provincial Government, the problem of lateral bank collapse and channel widening has been curbed. However, vertical channel development has undergone drastic changes due to human activities, thereby exacerbating ecological risks.
Human activities have exacerbated ecological risks by altering sediment supply processes and riverbed morphology. By 2009, a total of 3959 reservoirs had been constructed in the Ganjiang River Basin [22]. Cascade water conservancy projects, exemplified by the Wan’an Reservoir, have disrupted sediment connectivity, while long-term channel regulation and illegal sand mining have modified riverbed topography and hydrodynamic patterns, inducing localized excessive erosion and deposition as well as channel incision. Sediment serves as a critical structural and functional material in river ecosystems, playing an essential role in maintaining bed stability, benthic habitat heterogeneity, and habitat connectivity. Disruption of sediment flux and grain size distribution diminishes the natural buffering capacity of rivers during extreme climate events and facilitates localized accumulation of nutrients and pollutants during low-flow periods, further exacerbating water quality deterioration and ecological degradation. Additionally, extreme drought events, such as that occurring in 2022, have led to prolonged exposure of shoals, which may impede benthic community recovery, accelerate wetland vegetation degradation, and enhance soil oxidation–mineralization processes. The recovery of these ecological functions exhibits hysteresis and uncertainty.

4.3.2. Impact of Extreme Drought on Water Area Patterns, Navigation, and Water Supply

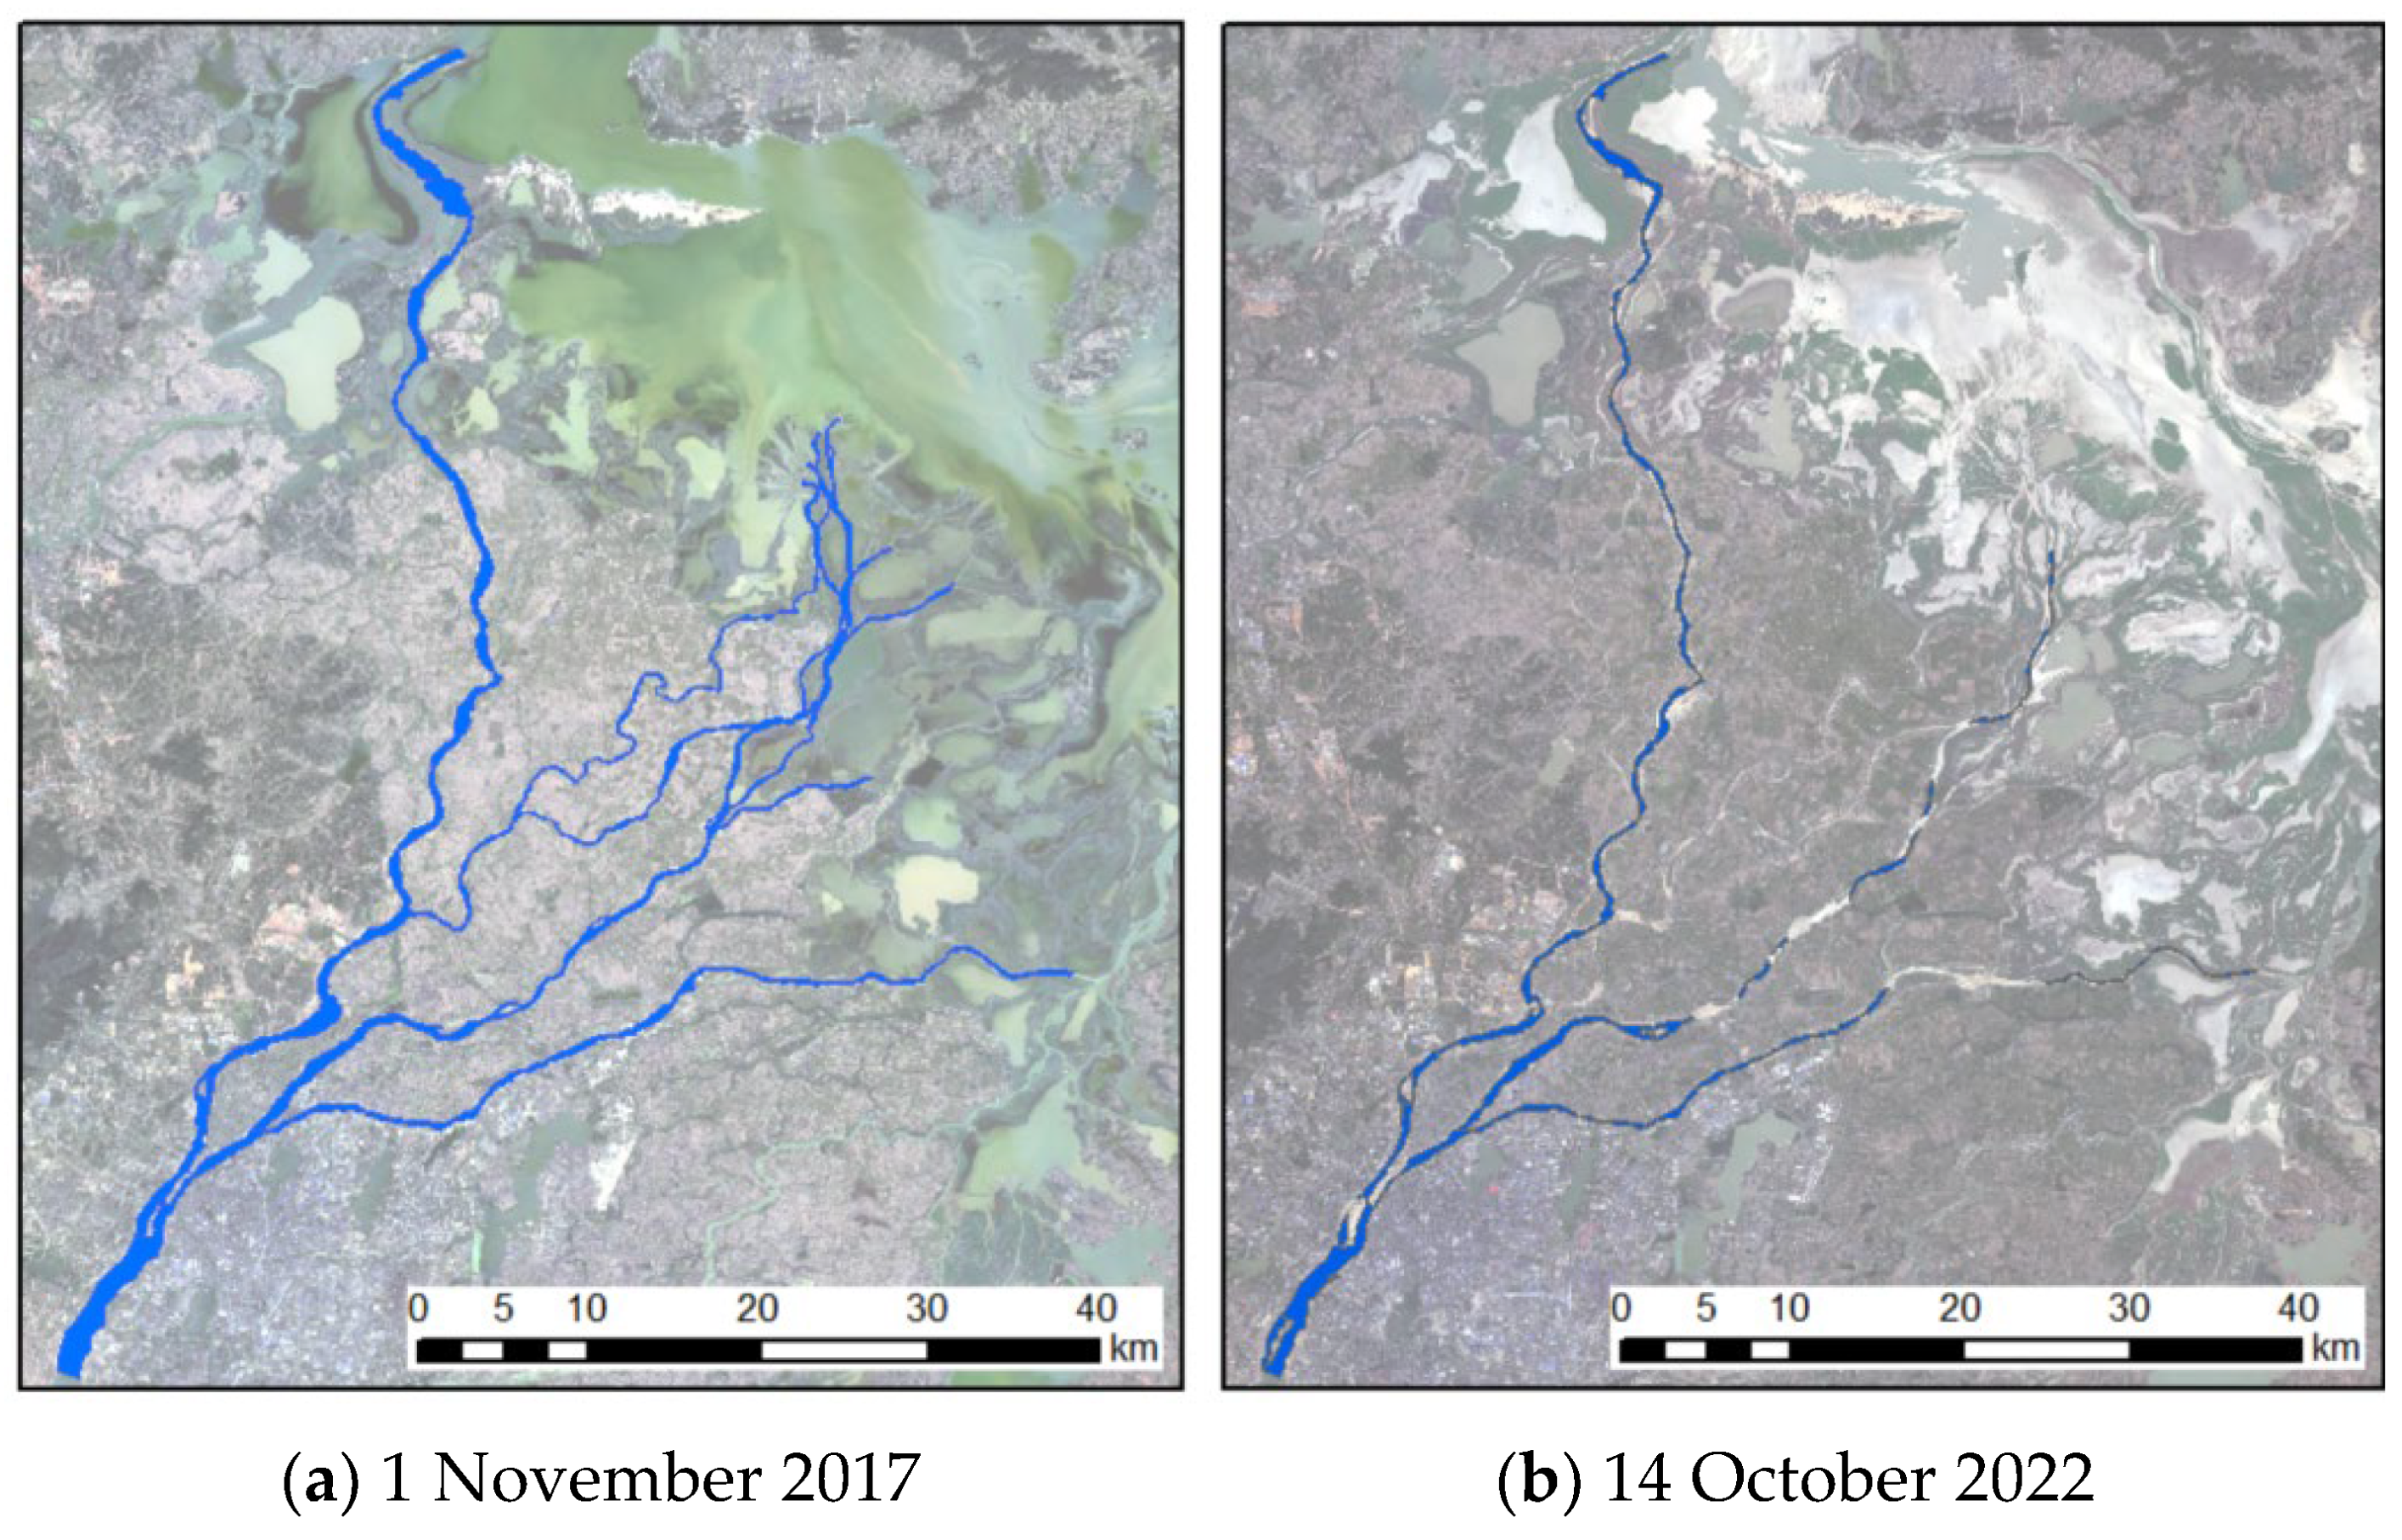
Remote sensing interpretation results (Figure 13) show that during the dry season of a normal hydrological year (2017), the water area of the Poyang Lake delta channels was approximately 102.47 km2. In contrast, during the extreme drought year (2022), this area decreased to approximately 55.59 km2, representing a reduction of 46.88 km2 (−45.75%) compared to the normal year. Owing to the significant contraction of the inundated area, the main channels of the delta became notably narrower, and large areas of shoals were exposed, leading to a series of engineering and societal issues, including reduced navigation safety margins and difficulties in domestic and industrial water extraction [23].
From a process mechanism perspective, riverbed incision has resulted in a downward shift in the stage–discharge (H–Q) relationship under the same flow conditions, significantly lowering dry-season water levels. This directly reduces the available water depth and surface width during dry seasons, weakening the natural buffering capacity against extreme drought events. Compared with 2017, the inundated area of delta wetlands during the dry season decreased by 45.75% in 2022, with a notable decline in wetland connectivity and increased habitat fragmentation, thereby heightening the sensitivity of the ecosystem to low-water stress.

4.3.3. Eutrophication Response and Community Structure Changes

Following the extreme drought event, a pronounced eutrophic response was observed in the delta water bodies during the dry season. Compared with the normal hydrological period (December 2017), the nutrient concentrations—total nitrogen (TN), total phosphorus (TP), and ammonium nitrogen (NH4+-N)—in February 2023 (following the extreme drought) increased by 50.2%, 240%, and 64.7%, respectively. This indicates that a reduction in dilution capacity, coupled with extended residence time, jointly drove a “concentration effect” of nutrients, resulting in a clear trend of water quality deterioration. Nitrogen and phosphorus, as the primary limiting factors for algal growth, promoted explosive algal proliferation: the density and biomass of periphytic algae increased by 87.2% and 557.9%, respectively. In contrast, the benthic macroinvertebrate community exhibited a significant negative response to elevated nitrogen levels and substrate environmental degradation, with density and biomass decreasing by 59.9% and 78.5%, respectively [24].

4.4. Evolution of the Ganjiang Tail-End Delta in a Global Perspective

Placing the Ganjiang tail-end delta in a global context, its evolutionary trajectory shares both similarities and differences with other renowned sediment-deficient deltas. Similarly to the Mekong Delta, where upstream dam construction and sand mining have led to large-scale coastal erosion, the driving force is the same—a collapse in sediment supply. However, the response mechanisms are distinctly different: the Ganjiang tail-end delta exhibits “riverbed incision,” whereas the Mekong Delta exhibits “coastal retreat.” This divergence stems from the hydrodynamic contrast emphasized in the introduction of this paper—the former is controlled by the base level of an inland lake, while the latter is controlled by sea level.
Compared with the Mississippi River Delta, where extensive wetland loss has occurred due to levee confinement and sediment diversion into the deep sea, the risks to the Ganjiang tail-end delta are more subtle: not direct land loss, but rather the disruption of river–lake connectivity and the acute degradation of ecosystem functions.
These comparisons reveal a common lesson: in delta management, any single-objective engineering intervention (e.g., dam construction upstream of the Mekong, levees downstream of the Mississippi) can trigger systemic negative cascading effects. Successful adaptive management must respect and actively regulate the core dynamic processes that determine the delta’s fate. For the Ganjiang tail-end delta, this means that the dynamic interactions of river–lake coupling must be considered holistically. The comprehensive regulation project represents a practical implementation of this principle.

4.5. Countermeasures

Currently, the Jiangxi Provincial Government is implementing the Comprehensive Regulation Project for the Ganjiang Tail-End Delta. Through the construction of the Nanchang Water Conservancy Hub and headland protection measures, the project aims to achieve efficient water level regulation and ecological protection, facilitate the activation and connectivity of river–lake water systems, increase water surface area during dry seasons, restore the ecological environment, alleviate flood control pressure, and improve navigation conditions. For example, during dry seasons, the opening and closing degrees of the gates can be adjusted to regulate the flow diversion ratios among the four distributaries, maintaining the minimum ecological flow in the channels to support the survival and reproduction of aquatic organisms. Meanwhile, elevated water levels help reduce the exposed area of the riverbed, mitigate bed erosion, and enhance the self-purification capacity of the river. Through adaptive management, a balance can be achieved between engineering benefits and potential risks, maintaining the dynamic stability of the channel–levee system while improving flood control capacity.

4.5.1. Alleviation of Flood Control Pressure by the Comprehensive Regulation Project

This study investigated the impact of the Comprehensive Regulation Project for the Ganjiang Tail-End Delta on flood control in the tail-end channel through physical model experiments. The experimental results indicate that following project implementation, flood water levels under the “river flooding” scenario decreased compared to the current conditions. The water level reduction ranged from 0.04 to 0.08 m in the main stem, 0.09 to 0.10 m in the West Branch and Middle Branch, and 0.10 to 0.20 m in the South Branch (Figure 12), with the South Branch exhibiting the greatest reduction. Under the “lake flooding” scenario, water level changes were relatively minor, with reductions generally within 0.01 m. Regarding velocity changes, the model test results show that after implementation of the flood control project, cross-sectional flow velocities increased slightly, but the magnitude of increase was less than 0.10 m/s. It can be concluded that the project has not substantially affected the velocity characteristics of the reach and is unlikely to induce significant bank erosion.

4.5.2. Regulation of Water Levels and Hydrological Connectivity by the Water Conservancy Hub

Under extreme low-flow conditions, the sharp decline in Ganjiang River discharge has exerted significant adverse effects on water levels and hydrological connectivity in the Ganjiang tail-end delta. When the Ganjiang discharge drops to 452 m3/s, flow interruption occurs in all distributaries except the West Branch, and the water level in the West Branch decreases to only 9.1 ± 0.7 m. Under such conditions, regulation by the water conservancy hub can effectively control water levels and mitigate the adverse impacts of drought.
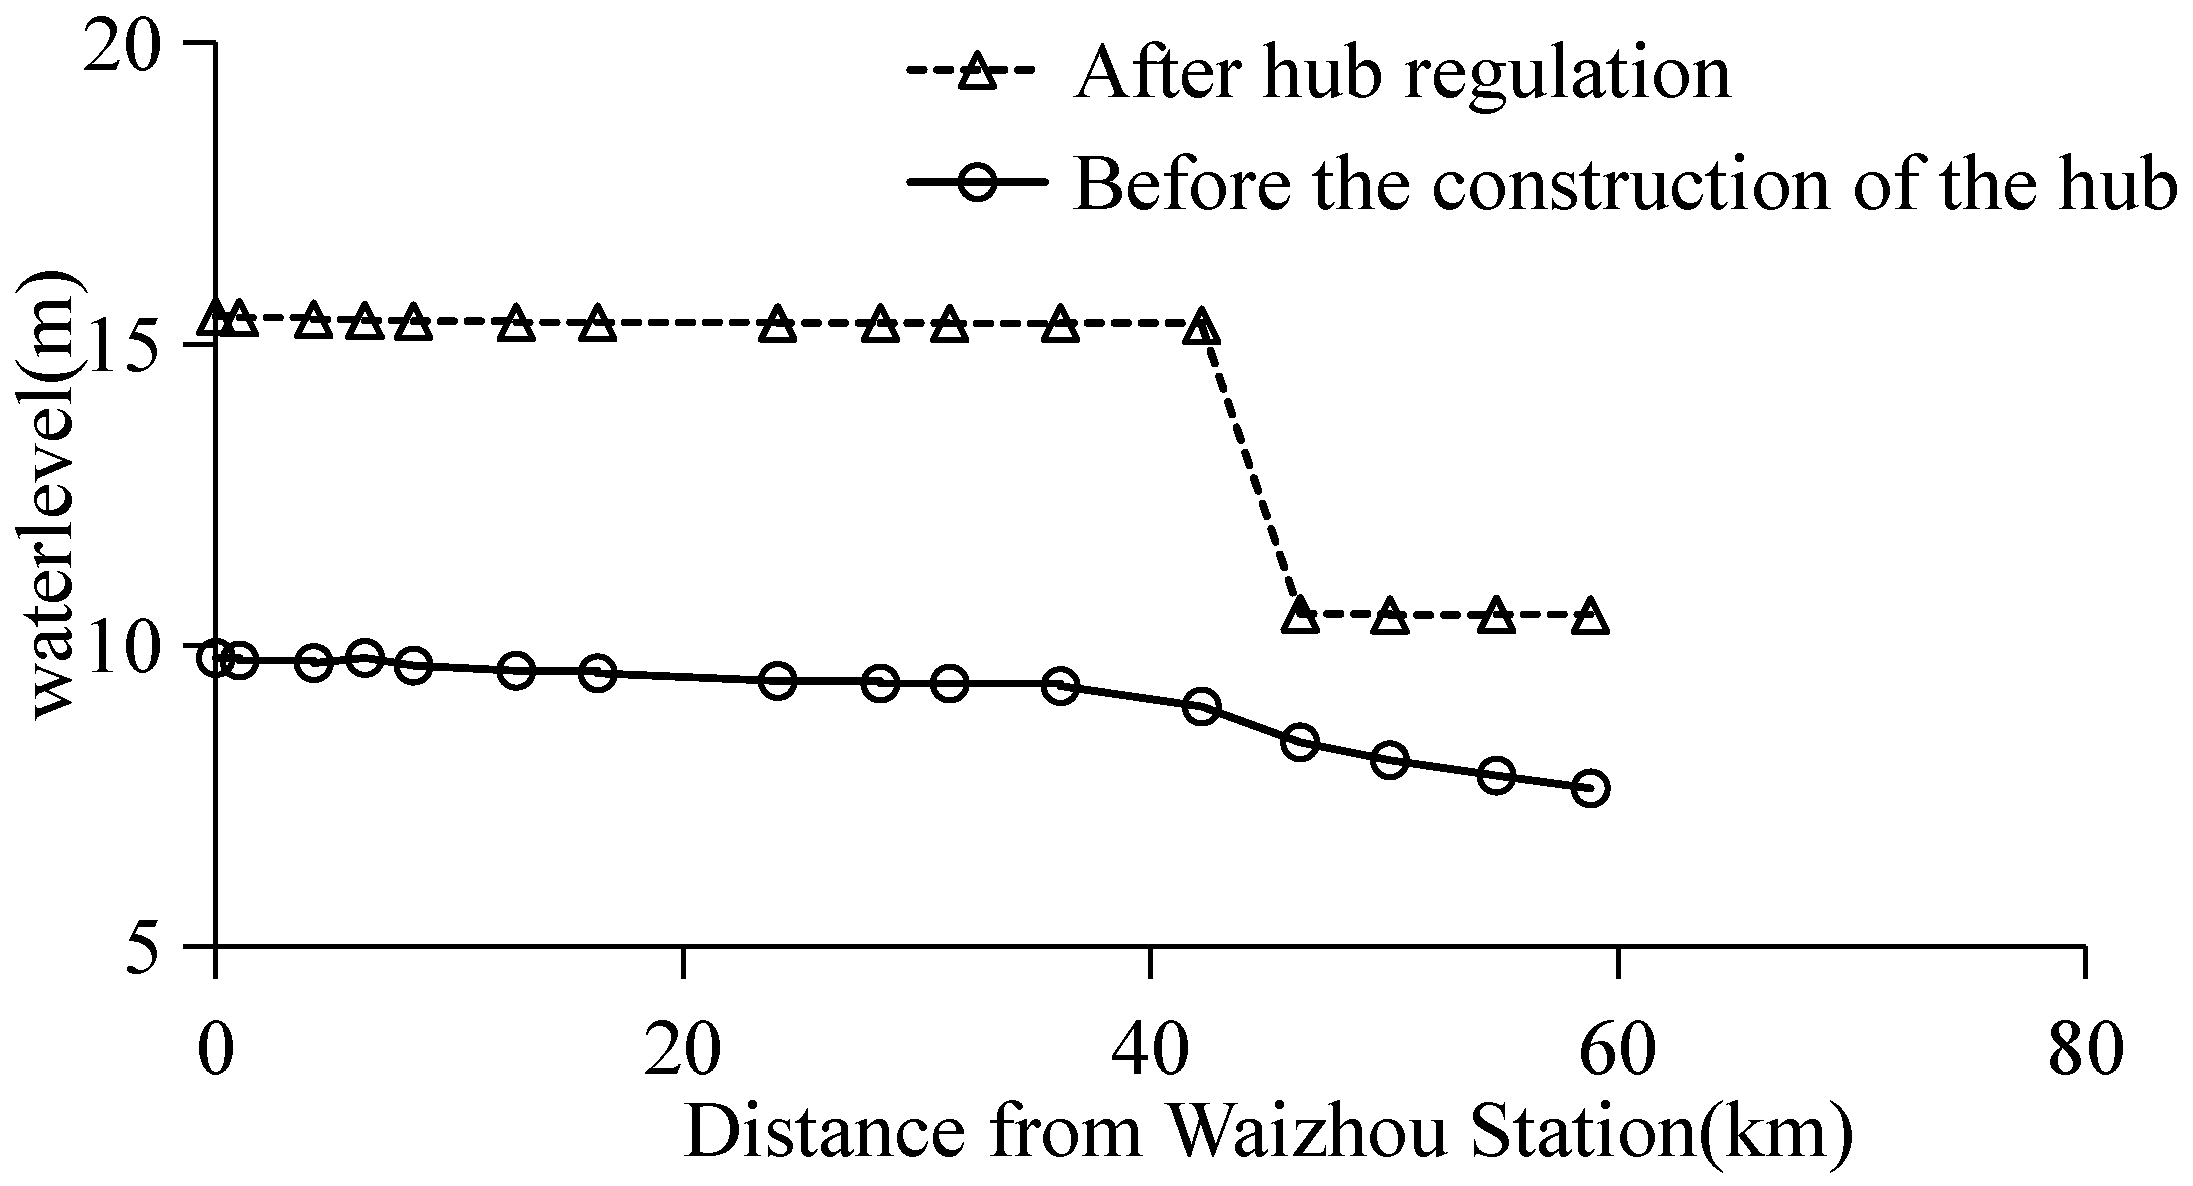
Using the physical model of the Ganjiang tail-end delta, gate operation adjustment experiments were conducted for the four branches of the Nanchang Water Conservancy Hub. At a Ganjiang discharge of 500 m3/s, the gate openings were adjusted to 0.64 for the West Branch, 0.28 for the North Branch, 0.48 for the Middle Branch, and 0.40 for the South Branch. The results show that water levels in the distributary channels can be maintained at 14.2 ± 1.8 m, representing an overall water level increase of approximately 5 m (Figure 14). Hydrological connectivity was significantly improved, with all channels maintaining flow. Notably, in the Middle Branch, where the floodplain elevation is approximately 12 m, hub regulation raised the water level to 14.0 ± 1.9 m, effectively achieving lateral hydrological connectivity.

4.5.3. Enhancement of Delta Water Area and Ecological Conditions Through Hub Regulation

During dry seasons, gate-controlled operation of the Nanchang Water Conservancy Hub can effectively raise the water level upstream of the gates, creating a significant backwater effect. In addition, the flow diversion ratios have been optimized. According to the gate opening adjustment tests described in Section 4.5.2, under low-flow conditions (Ganjiang River discharge of 500 m3/s), the dry-season diversion ratios of the West, North, Middle, and South Branches can reach 50%, 4%, 24%, and 22%, respectively, thereby effectively ensuring the ecological flow in each distributary.
The elevated water levels directly contribute to an expansion of the delta water area, improving the wetland water ecological environment. According to physical model experiments, by raising the water level at Waizhou Station from 9.78 m to 15.5 m through hub regulation, the water area of the delta increased by 56% (Table 5). The expanded water surface provides suitable habitat conditions for wetland vegetation and aquatic organisms, helping to alleviate ecological pressures induced by extreme droughts. Meanwhile, stable water level and flow conditions reduce the risk of flow interruption in distributary channels, enhance the resilience of the overall aquatic ecosystem, and establish a hydrological foundation for the maintenance and restoration of delta ecological functions.

5. Conclusions and Recommendations

5.1. Key Findings

Based on long-term flow–sediment data from 1950 to 2023 and physical model experiments, this study systematically investigated the channel evolution processes, driving mechanisms, and adaptive management pathways of the Ganjiang tail-end delta under intense human activities. The main conclusions are as follows:
(1)
The flow-sediment evolution exhibits significant phased and abrupt change characteristics. Between 1950 and 2023, sediment supply conditions in the lower Ganjiang River underwent fundamental changes: the annual average suspended sediment concentration experienced an abrupt change in 1991, and the annual average water level declined significantly in 2000, whereas flow conditions remained overall stable. Watershed soil and water conservation, sediment trapping by the Wan’an Reservoir, and large-scale sand mining jointly constitute the three driving forces of the flow-sediment evolution. Among these, the operation of the Wan’an Reservoir and the sand mining activities after 2001 exerted the most pronounced influences on sediment transport patterns and water level variations.
(2)
Human activities emerged as the dominant factor driving channel reshaping, characterized by nonlinear features of “rapid channel metamorphosis and slow ecological response.” Prior to 1990, channel evolution was primarily governed by natural processes. Following the operation of the Wan’an Reservoir in 1991, sediment trapping efficiency reached approximately 50%, significantly reducing sediment input to the lower reaches. After 2001, large-scale sand mining and dredging projects became the dominant factors, triggering stepwise riverbed incision. Localized incision depths reached 16.5 m in the West Branch and South Branch, leading to a substantial increase in channel storage capacity. Cross-sectional morphology evolved toward narrower and deeper configurations, with a corresponding decrease in the hydraulic geometry coefficient. The flow diversion pattern of the delta underwent fundamental changes. From 1970 to 2000, the flow diversion ratio between the East and West channels remained relatively stable; however, after 2001, the greater magnitude of riverbed incision in the West Branch resulted in a continuously increasing diversion ratio for this branch. During dry seasons, the diversion ratio of the West Branch exceeded 90%, while that of the East Branch decreased to less than 10%, with flow interruption occurring in other distributaries.
(3)
Flood control benefits coexist with emerging risks. Riverbed incision enhanced flood conveyance capacity in local reaches to a certain extent. Under a 100-year flood event, the flood conveyance capacity at Waizhou Station increased from the design value of 25,600 m3/s to 33,500 m3/s, representing an increase of 31%. However, due to the backwater effect from Poyang Lake, the overall improvement in flood conveyance capacity across the entire tail-end delta was limited. New flood control risks have emerged, including increased piping hazards due to exposed levee foundations and an elevated risk of co-occurrence of “river flooding” and “lake flooding.”
(4)
Human activities have exacerbated ecosystem vulnerability and water quality degradation risks. Disruption of sediment continuity and alterations to riverbed structure have weakened the ecological buffering capacity of the river. During the extreme drought year (2022), the delta water area during the dry season decreased by 45.75% compared to the normal hydrological year (2017), with notable declines in wetland connectivity and increased habitat fragmentation. Water eutrophication intensified, with benthic macroinvertebrate community density and biomass decreasing by 59.9% and 78.5%, respectively, indicating a significant increase in ecosystem sensitivity to low-water stress.
(5)
The Comprehensive Regulation Project has demonstrated significant regulatory effectiveness. Physical model experiments indicate that the planned Comprehensive Regulation Project for the Ganjiang Tail-End Delta not only exerts positive effects on flood control but also effectively improves hydrological conditions through gate regulation. Under extreme low-flow conditions, hub regulation can maintain water levels in the distributary channels at 14.2 ± 1.8 m, representing an overall water level increase of approximately 5 m. Hydrological connectivity is significantly enhanced, the delta wetland water area increases by 56%, and the flow diversion ratios during dry seasons are optimized.

5.2. Strategic Implications for Adaptive Management of Inland Tail-End Deltas

The study of the Ganjiang tail-end delta provides important implications for the long-term sustainability of inland tail-end deltas worldwide: management strategies cannot be detached from the complex river–lake interactions. The co-occurrence of “river flooding” and “lake flooding” in 2020 serves as a warning that a future-oriented adaptive management framework must shift from a “river engineering” mindset to a “basin–lake system” mindset. This means that throughout the entire life cycle of planning, design, and operation, the coupled effects among upstream flow–sediment regulation, channel morphological changes, and downstream lake water level fluctuations must be assessed simultaneously. Furthermore, engineering regulation should integrate multiple objectives, including flood safety, aquatic ecology, and water resource utilization; establish an adaptive management framework grounded in dynamic flow–sediment processes; strengthen emergency response capabilities for extreme hydrological scenarios; and promote the transformation of delta management toward a multifunctional, integrated model.

5.3. Limitations and Future Perspectives

This study has several limitations, which also point to directions for future research. First, the physical model used in this study was a fixed-bed model that did not account for the dynamic processes of channel erosion and deposition, thus preventing the evaluation of long-term channel re-equilibration following engineering regulation. Second, the model was simulated only under typical hydrological scenarios and has not yet incorporated predictive capabilities under future climate change scenarios (e.g., more frequent extreme drought/flood patterns). Future research should focus on developing comprehensive physical or numerical models that integrate a channel evolution module, unsteady flow–sediment dynamics, and climate change scenarios to achieve long-distance, high-accuracy simulations of delta system evolution over decadal timescales. In addition, establishing a real-time monitoring network covering multiple variables such as hydrology, sediment, topography, and ecology is a crucial foundation for supporting the dynamic adjustment of the adaptive management framework.


Author Contributions

Writing—original draft preparation, Q.W. and B.C.; writing—review and editing, Q.W.; supervision, S.Z. and Z.H.; physical model experiment, N.Y.; funding acquisition, J.Z. and Z.H.; All authors have read and agreed to the published version of the manuscript.

Funding

This research was funded by the National Key R&D Program of China (Grant Nos. 2022YFC3201804, 2022YFC3202603), Natural Science Foundation of Jiangxi Province (Grant No. 20252BAC200349), Jiangxi Province Technology Innovation Guidance Science and Technology Plan Project (Grant No. 20223AEI91008) and Science and Technology Project of Jiangxi Provincial Department of Water Resources (Grant No. 202325ZDKT04).

Data Availability Statement

The original contributions presented in this study are included in the article. Further inquiries can be directed to the corresponding author.

Conflicts of Interest

The authors declare no conflicts of interest.

References

  1. Syvitski, J.P.M.; Kettner, A.J.; Overeem, I.; Hutton, E.W.H.; Hannon, M.T.; Brakenridge, G.R.; Day, J.; Vörösmarty, C.; Saito, Y.; Giosan, L.; et al. Sinking deltas due to human activities. Nat. Geosci. 2009, 2, 681–686. [Google Scholar] [CrossRef]
  2. Zhang, W.; Xu, Y.J.; Guo, L.; Lam, N.S.-N.; Xu, K.; Yang, S.; Yao, Q.; Liu, K.-B. Comparing the Yangtze and Mississippi River deltas in the light of coupled natural-human dynamics: Lessons learned and implications for management. Geomorphology 2022, 399, 108075. [Google Scholar] [CrossRef]
  3. Mulder, T.; Syvitski, J.P.M. Climate change and the delivery of sediment to the coastal zone: Implications for global sea-level rise. Geology 1996, 24, 887–890. [Google Scholar]
  4. Lam, N.S.-N.; Xu, Y.J.; Pace, R.K.; Liu, K.-B.; Qiang, Y.; Narra, S.; Bianchette, T.A.; Cai, H.; Zou, L.; Li, K.; et al. Collaboration Across Boundaries: Reflections on Studying the Sustainability of the Mississippi River Delta as a Coupled Natural-Human System. In Collaboration Across Boundaries for Social-Ecological Systems Science; Perz, S., Ed.; Palgrave Macmillan: Cham, Switzerland, 2019; pp. 231–256. [Google Scholar]
  5. Giosan, L.; Clift, P.D.; Macklin, M.G.; Fuller, D.Q.; Constantinescu, S.; Durcan, J.A.; Stevens, T.; Duller, G.A.T.; Tabrez, A.R.; Gangal, K.; et al. Fluvial landscapes of the Harappan civilization. Proc. Natl. Acad. Sci. USA 2012, 109, E1688–E1694. [Google Scholar] [CrossRef] [PubMed]
  6. Yang, H.F.; Yang, S.L.; Li, B.C.; Wang, Y.; Wang, J.; Zhang, Z.; Xu, K.; Huang, Y.; Shi, B.; Zhang, W. Different fates of the Yangtze and Mississippi deltaic wetlands under similar riverine sediment decline and sea-level rise. Geomorphology 2021, 381, 107646. [Google Scholar] [CrossRef]
  7. Zoccarato, C.; Minderhoud, P.J.; Teatini, P. The role of sedimentation and natural compaction in a prograding delta: Insights from the mega Mekong delta, Vietnam. Sci. Rep. 2018, 8, 11437. [Google Scholar] [CrossRef] [PubMed]
  8. Yang, S.L.; Milliman, J.D.; Li, P.; Xu, K. 50,000 dams later: Erosion of the Yangtze River and its delta. Glob. Planet. Change 2011, 75, 14–20. [Google Scholar] [CrossRef]
  9. Hu, Y.C.; Chen, L.; Yang, H. Analysis of flood control situation changes in the Ganjiang tail-end delta. Yangtze River Sci. Res. Inst. 2024, 41, 202–208. [Google Scholar]
  10. Min, Q.; Shi, J.G.; Min, D. Preliminary analysis of suspended sediment characteristics and changes in inflow and outflow of Poyang Lake from 1956 to 2005. Hydrology 2011, 31, 54–58. [Google Scholar]
  11. Syvitski, J.P.M.; Kettner, A. Sediment flux and the Anthropocene. Philos. Trans. R. Soc. A 2011, 369, 957–975. [Google Scholar] [CrossRef] [PubMed]
  12. Vörösmarty, C.J.; Green, P.; Salisbury, J.; Lammers, R.B. Global water resources: Vulnerability from climate change and population growth. Science 2000, 289, 284–288. [Google Scholar] [CrossRef] [PubMed]
  13. Feng, K.D. Channel Evolution and Simulation of Multi-Stage Braided River in the Ganjiang Tail-End. Master’s Thesis, Changjiang River Scientific Research Institute, Wuhan, China, 2019. [Google Scholar]
  14. Liu, B.; Wei, Y.; Wang, C.; Chen, X.; Wang, P.; Ma, J.; Li, P. Projected future trends in runoff and sediment transport in typical rivers of the Yellow River Basin, China. Water 2026, 18, 421. [Google Scholar] [CrossRef]
  15. Mondal, S.; Paul, R.K. Climate Variability and Human Interference. In Climate Change and Water Resources; Springer: Cham, Switzerland, 2020. [Google Scholar]
  16. Wu, X.; Bi, N.; Xu, J.; Nittrouer, J.A.; Yang, Z.; Saito, Y.; Wang, H. Stepwise morphological evolution of the active Yellow River (Huanghe) delta lobe (1976–2013): Dominant roles of riverine discharge and sediment grain size. Geomorphology 2017, 292, 115–127. [Google Scholar] [CrossRef]
  17. Li, B.; Yang, G.S.; Wan, R.R.; Lai, X.J.; Wagner, P.D. Impacts of hydrological alteration on ecosystem services changes of a large river-connected lake (Poyang Lake), China. J. Environ. Manag. 2022, 310, 114750. [Google Scholar] [CrossRef] [PubMed]
  18. Conte, L.C.; Bayer, D.M.; Bayer, F.M. Bootstrap Pettitt test for detecting change points in hydroclimatological data: Case study of Itaipu Hydroelectric Plant, Brazil. Hydrol. Sci. J. 2019, 64, 1312–1326. [Google Scholar] [CrossRef]
  19. Wu, B.S.; Shen, G.Q. Discussion on the physical significance of the sediment delivery coefficient. Yellow River 2008, 30, 15–16. [Google Scholar]
  20. Hu, H.; Bai, Y.C.; Kuang, F. Analysis of water sediment characteristics and erosion deposition in Waizhou reach of downstream Ganjiang River. Water Resour. Power 2017, 35, 29–32. [Google Scholar] [CrossRef]
  21. Tian, T.H. Study on the Flow Diversion Patterns of the East and West Channels in the Ganjiang Tail-End Delta. Master’s Thesis, Nanchang Institute of Technology, Nanchang, China, 2019. [Google Scholar]
  22. Liu, G.H.; Zhu, Q.X.; Wang, D. Quantitative analysis of the impacts of climate change and human activities on the runoff in the Poyang Lake Basin. J. Lake Sci. 2016, 28, 682–690. [Google Scholar]
  23. Liu, Z.W.; Lian, L.K.; Yin, C.Y. Design analysis of lock capacity and water consumption for the comprehensive regulation project in the lower Ganjiang tail-end delta. China Water Transp. 2024, 7, 107–109. [Google Scholar]
  24. Xia, Y.; Liu, Y.; Wang, Z.; Huang, Z.; You, W.; Wu, Q.; Zhou, S.; Zou, J. Damage inflicted by extreme drought on Poyang Lake delta wetland and the establishment of countermeasures. Water 2024, 16, 2292. [Google Scholar] [CrossRef]
Figure 1. Schematic map of the study area. (a) Extent of China; (b) extent of Jiangxi Province; (c) extent of the Ganjiang tail-end delta.
Water 18 01310 g001
Figure 2. Flowchart of the research methodology.
Water 18 01310 g002
Figure 3. Layout of the physical model.
Water 18 01310 g003
Figure 4. Validation results of the water surface profile.
Water 18 01310 g004
Figure 5. Stage-discharge rating curves for Waizhou Station in recent years.
Water 18 01310 g005
Figure 6. Distribution of historical survey cross-sections in the West Branch.
Water 18 01310 g006
Figure 7. Changes in typical channel cross-sections of the Ganjiang River.
Water 18 01310 g007
Figure 8. Longitudinal variation in the channel geometry factor ( B / H ) for various cross-sections in the West Branch over the years.
Water 18 01310 g008
Figure 9. Relationship between the flow distribution ratio of the West Channel and discharge at Waizhou Station (2006–2019).
Water 18 01310 g009
Figure 10. Comparison between the original design flood water levels and the current measured water levels from physical model tests along the main stem of the Ganjiang River and the West Branch levees (note: 1%, 2%, and 5% denote design flood exceedance probabilities).
Water 18 01310 g010
Figure 11. Interannual variations in flow and sediment parameters at Waizhou Station. (a) Annual mean discharge; (b) annual mean water level; (c) annual average suspended sediment concentration; (d) annual mean sediment coefficient.
Water 18 01310 g011
Figure 12. Comparison of design flood water levels in the South Branch of the Ganjiang tail-end delta before and after the implementation of the Comprehensive Regulation Project.
Water 18 01310 g012
Figure 13. Remote sensing interpretation results of the delta during the dry seasons of a normal water year and an extreme drought year.
Water 18 01310 g013
Figure 14. Comparison of water levels in the West Branch before and after hub regulation.
Water 18 01310 g014
Table 1. Error analysis of model simulation results.
Flow ConditionWater LevelVelocityDiversion Ration
R2RMSE (m)R2RMSE (m/s)R2RMSE (%)
High flow0.99160.03860.97610.05240.99990.0321
Medium flow0.96720.04520.95130.06220.99570.0782
Low flow0.97210.02590.97650.0463--
Table 2. Results of Mann–Kendall trend analysis and Pettitt change-point diagnosis for annual average discharge (Qave), suspended sediment concentration (Save), and annual average water level (Zave) at Waizhou Station.
VariablePeriodMann–Kendall TestPettitt Test
z-ValueTrendSignificanceChange-Point Yearp-ValueSignificance
Qave (m3/s)1950–2023−0.18667DecreasingFALSE20031.043FALSE
Save (kg/m3)1956–2022−8.3987DecreasingTRUE19916 × 10−11TRUE
Zave (m)1950–2023−5.8474DecreasingTRUE20002 × 10−8TRUE
Table 3. Mann–Kendall trend test value of water sediment in the Waizhou reach.
PeriodParameterMeanz-ValueTrendSignificance
Soil and water conservation period (1981–1990)Save (kg/m3)0.079–2.06DecreasingSignificant
S/Qave (kg·s/m6)38.20No trendNot significant
Zave (m)16.13–1.07DecreasingNot significant
Impoundment period (1991–2000)Save (kg/m3)0.04–2.15DecreasingSignificant
S/Qave (kg·s/m6)16.78–3.04DecreasingSignificant
Zave (m)16.17–0.18DecreasingNot significant
Sand mining period (2001–2013)Save (kg/m3)0.03–1.03DecreasingNot significant
S/Qave (kg·s/m6)15.160.07IncreasingNot significant
Zave (m)14.27–2.40DecreasingSignificant
Adjustment period (2014–2023)Save (kg/m3)0.0170.31IncreasingNot significant
S/Qave (kg·s/m6)8.611.4IncreasingNot significant
Zave (m)13.07–1.09DecreasingNot significant
Table 4. Prototype boundary conditions for the Ganjiang tail-end delta physical model test scenarios.
ScenarioTest
Condition
Prototype Discharge at
Waizhou Station (m3/s)
Prototype Water Level at Tail Gate (m)
“River flooding” controlp = 1%25,60016.52
p = 2%23,60015.89
p = 5%20,70015.68
“Lake flooding” controlp = 5%683020.74
Table 5. Impact of the Nanchang Water Conservancy Hub on water area of the Ganjiang tail-end delta.
ParameterBefore Hub
Construction
After Hub Regulation
Upstream of GateDownstream of Gate
Ganjiang River water level (m)9.7815.5
West Branch water level (m)9.1 ± 0.715.3510.5
North Branch water level (m)Partial flow interruption14.410.52
Middle Branch water level (m)Partial flow interruption14.9810.65
South Branch water level (m)Partial flow interruption14.410.52
Delta water surface area (km2)38.6360.27
Increase in water surface area056%
Disclaimer/Publisher’s Note: The statements, opinions and data contained in all publications are solely those of the individual author(s) and contributor(s) and not of MDPI and/or the editor(s). MDPI and/or the editor(s) disclaim responsibility for any injury to people or property resulting from any ideas, methods, instructions or products referred to in the content.