1. Introduction
Guangdong Province, with its developed economy and dense population, occupies an important strategic position in the national development landscape. However, it is also one of the regions most severely affected by typhoons, experiencing an average of 2–3 typhoon landfalls annually, which result in substantial losses. Specifically, the direct economic losses caused by typhoons alone from 2013 to 2015 exceeded 15 billion yuan [
1]. According to the analysis data of the Sixth Assessment Report of the Intergovernmental Panel on Climate Change (IPCC) released in August 2021, global warming is still accelerating. Changes in the frequency, location, track, and intensity of typhoons induced by global warming have become one of the most intense scientific issues [
2,
3,
4,
5]. Kossin et al. [
6] attributed the poleward migration trend of global tropical cyclones since 1980 to the impact of global warming. Zhan and Wang [
7] found that weak tropical cyclones over the western North Pacific have shown a significant northward shift, while the shift in strong tropical cyclones is not obvious. Wu et al. [
8] also revealed that the tracks of tropical cyclones over the western North Pacific have exhibited a distinct westward shift in recent years. In terms of frequency, most model studies indicate that under global warming, the frequency and intensity of tropical cyclones in the central Pacific will increase, whereas those in the western North Pacific will decrease [
9,
10,
11,
12,
13]. Nevertheless, most future scenario projections of models are based on the results of CMIP5 (or CMIP3). In these models, future global warming exhibits an El Niño-like warming pattern, with only a few models showing a La Niña-like warming pattern [
14], which significantly increases the uncertainty of typhoon activity changes under the background of global warming. In addition, with the rapid economic development in recent years, urban areas have continued to expand, and land use has undergone drastic changes, forming a complex underlying surface modified by both natural and anthropogenic factors. Urban land expansion and intensive economic and social activities exert a significant impact on local weather processes, such as sea–land breezes, urban heat island circulation, and local heavy precipitation. In particular, frequent heavy precipitation events often trigger secondary disasters such as urban waterlogging, landslides, collapses, and debris flows, which have caused incalculable casualties and economic losses to Guangdong over a long period [
15,
16,
17].
Ensemble forecasting is a numerical prediction method proposed to address the uncertainty and predictability of atmospheric motions [
18]. In recent years, with the successive establishment of ensemble weather prediction systems by major weather forecasting agencies [
19,
20,
21], research on typhoon precipitation forecasting methods using ensemble forecasts has gradually become active [
22,
23]. The National Meteorological Center has developed the ensemble multi-statistic fusion technique (FUSE) based on ensemble forecasts, which corrects different precipitation magnitudes by referring to specific ensemble quantiles (e.g., ensemble maximum, 90th ensemble quantile, 75th ensemble quantile, median, 10th ensemble quantile, etc.) [
24,
25,
26]. If the fixed ensemble quantiles in the ensemble multi-statistic fusion technique are replaced with ensemble quantiles obtained from optimal sliding modeling based on TS, it is transformed into a more flexible Optimal Threshold Selection (OTS) technique [
27]. OTS was put into operational application at the National Meteorological Center in 2015. The subjective and objective forecast scores of heavy rainfalls with a 24 h forecast lead time in the summer of 2015 showed that the TS of OTS had slightly exceeded that of forecasters [
28]. Chen et al. [
29] found through experiments in Jiangsu Province that OTS can improve the ECMWF deterministic forecast products, but the reduction in missing report rate is inevitably accompanied by an increase in false alarm rate. Pang et al. [
30] evaluated heavy rainfall forecasts in Chongqing and indicated that OTS achieves a high TS for heavy rainfall forecasts but mainly exhibits a wet bias. Similar results have been observed in convection-scale ensemble models, where TS, hit rate, false alarm rate, and frequency bias all increase [
31]. It can be seen that the traditional OTS has a certain effect on improving TS, but this improvement is achieved at the cost of excessive false alarms. Excessive false alarms of heavy precipitation are not conducive to the implementation of accurate and effective disaster prevention and mitigation measures. To reduce forecast bias while maintaining a high TS, it is necessary to introduce the uncertainty information of ensemble members, which is a quantitative index used to improve the traditional OTS [
32].
Since the Guangdong Meteorological Observatory began producing refined grid forecasts in 2013, it has carried out certain quantitative precipitation interpretation work based on numerical models and ensemble forecasts, providing objective technical support for grid forecast operations. Aiming at the characteristics of typhoon precipitation in the post-flood season, a statistical downscaling scheme integrating optimal quantiles has been designed using numerical ensemble prediction models [
32,
33]. As we all know, in the precipitation forecast of OTS (especially for heavy precipitation forecasts), to obtain high scores for low-probability events, it tends to use higher quantiles to map heavy precipitation forecasts [
32,
33,
34], thereby achieving a high TS. However, this also leads to higher bias and more precipitation false alarms, bringing difficulties to disaster prevention and mitigation work. In view of the shortcomings of OTS, on the basis of evaluating the impact of typhoon forecast uncertainty on fusion products, Zhang et al. [
32] introduced a quantitative index based on the uncertainty information of ensemble members to improve the fusion method and designed a statistical downscaling scheme integrating optimal quantiles. This scheme enables fusion products to significantly reduce positive bias and false alarm rate while maintaining a high TS for heavy precipitation [
33]. The developed method uses the period from 2013 to 2017 as the training period, combines the uncertainty information of ensemble precipitation forecasts during the training period, and introduces the forecast probability of a certain small-magnitude precipitation as a criterion to judge whether there are obvious false alarms in the heavy precipitation forecast of fusion products when the quantile corresponding to the fusion product reaches above heavy rainfall. The “small magnitude” and “forecast probability” appearing in the above steps are the index thresholds for discrimination. Finally, the index thresholds are used to perform downscaling correction on the fusion products.
While various bias correction methods have been developed to improve precipitation forecasts, several persistent challenges remain. First, as numerical models like the ECMWF system undergo frequent updates, correction thresholds derived from outdated training periods (e.g., 2013–2017) often exhibit limited effectiveness on current model versions, highlighting the necessity of regular calibration updates. Second, due to the influence of underlying surfaces and complex near-surface wind fields, many regions exhibit significant spatial heterogeneity in precipitation biases. Using a unified threshold across a large area, such as Guangdong Province, often fails to account for localized topographic effects. Furthermore, the traditional identification of correction thresholds is frequently labor-intensive and subjective, making it difficult to objectively balance performance metrics across a high-resolution grid.
To address these common limitations in bias correction, this study develops an Objective Improvement of Optimal Threshold Selection (OIOTS) scheme based on the framework designed by Zhang et al. [
32]. The scheme incorporates updated training data and implements objective, grid-point-specific thresholds to enhance correction precision. Although this study enhances Zhang’s original framework, certain constraints remain regarding the spatial and temporal scope. Specifically, the study focuses on Guangdong Province, and its applicability to other regions requires further investigation. The flood season in Guangdong is divided into pre-flood and post-flood periods. The pre-flood season involves highly complex synoptic systems, including warm-sector heavy rainfall, frontal precipitation, and return flow precipitation. The performance of the correction scheme varies across these weather types, necessitating continuous experimental adjustments to achieve optimal results. In contrast, this study primarily addresses precipitation during the post-flood season, which is dominated by typhoon-related events. During this period, the correction scheme exhibits greater stability and higher temporal applicability. In summary, further research is needed to evaluate the effectiveness of this scheme in other regions or under diverse weather scenarios during the pre-flood season.
2. Data and Methods
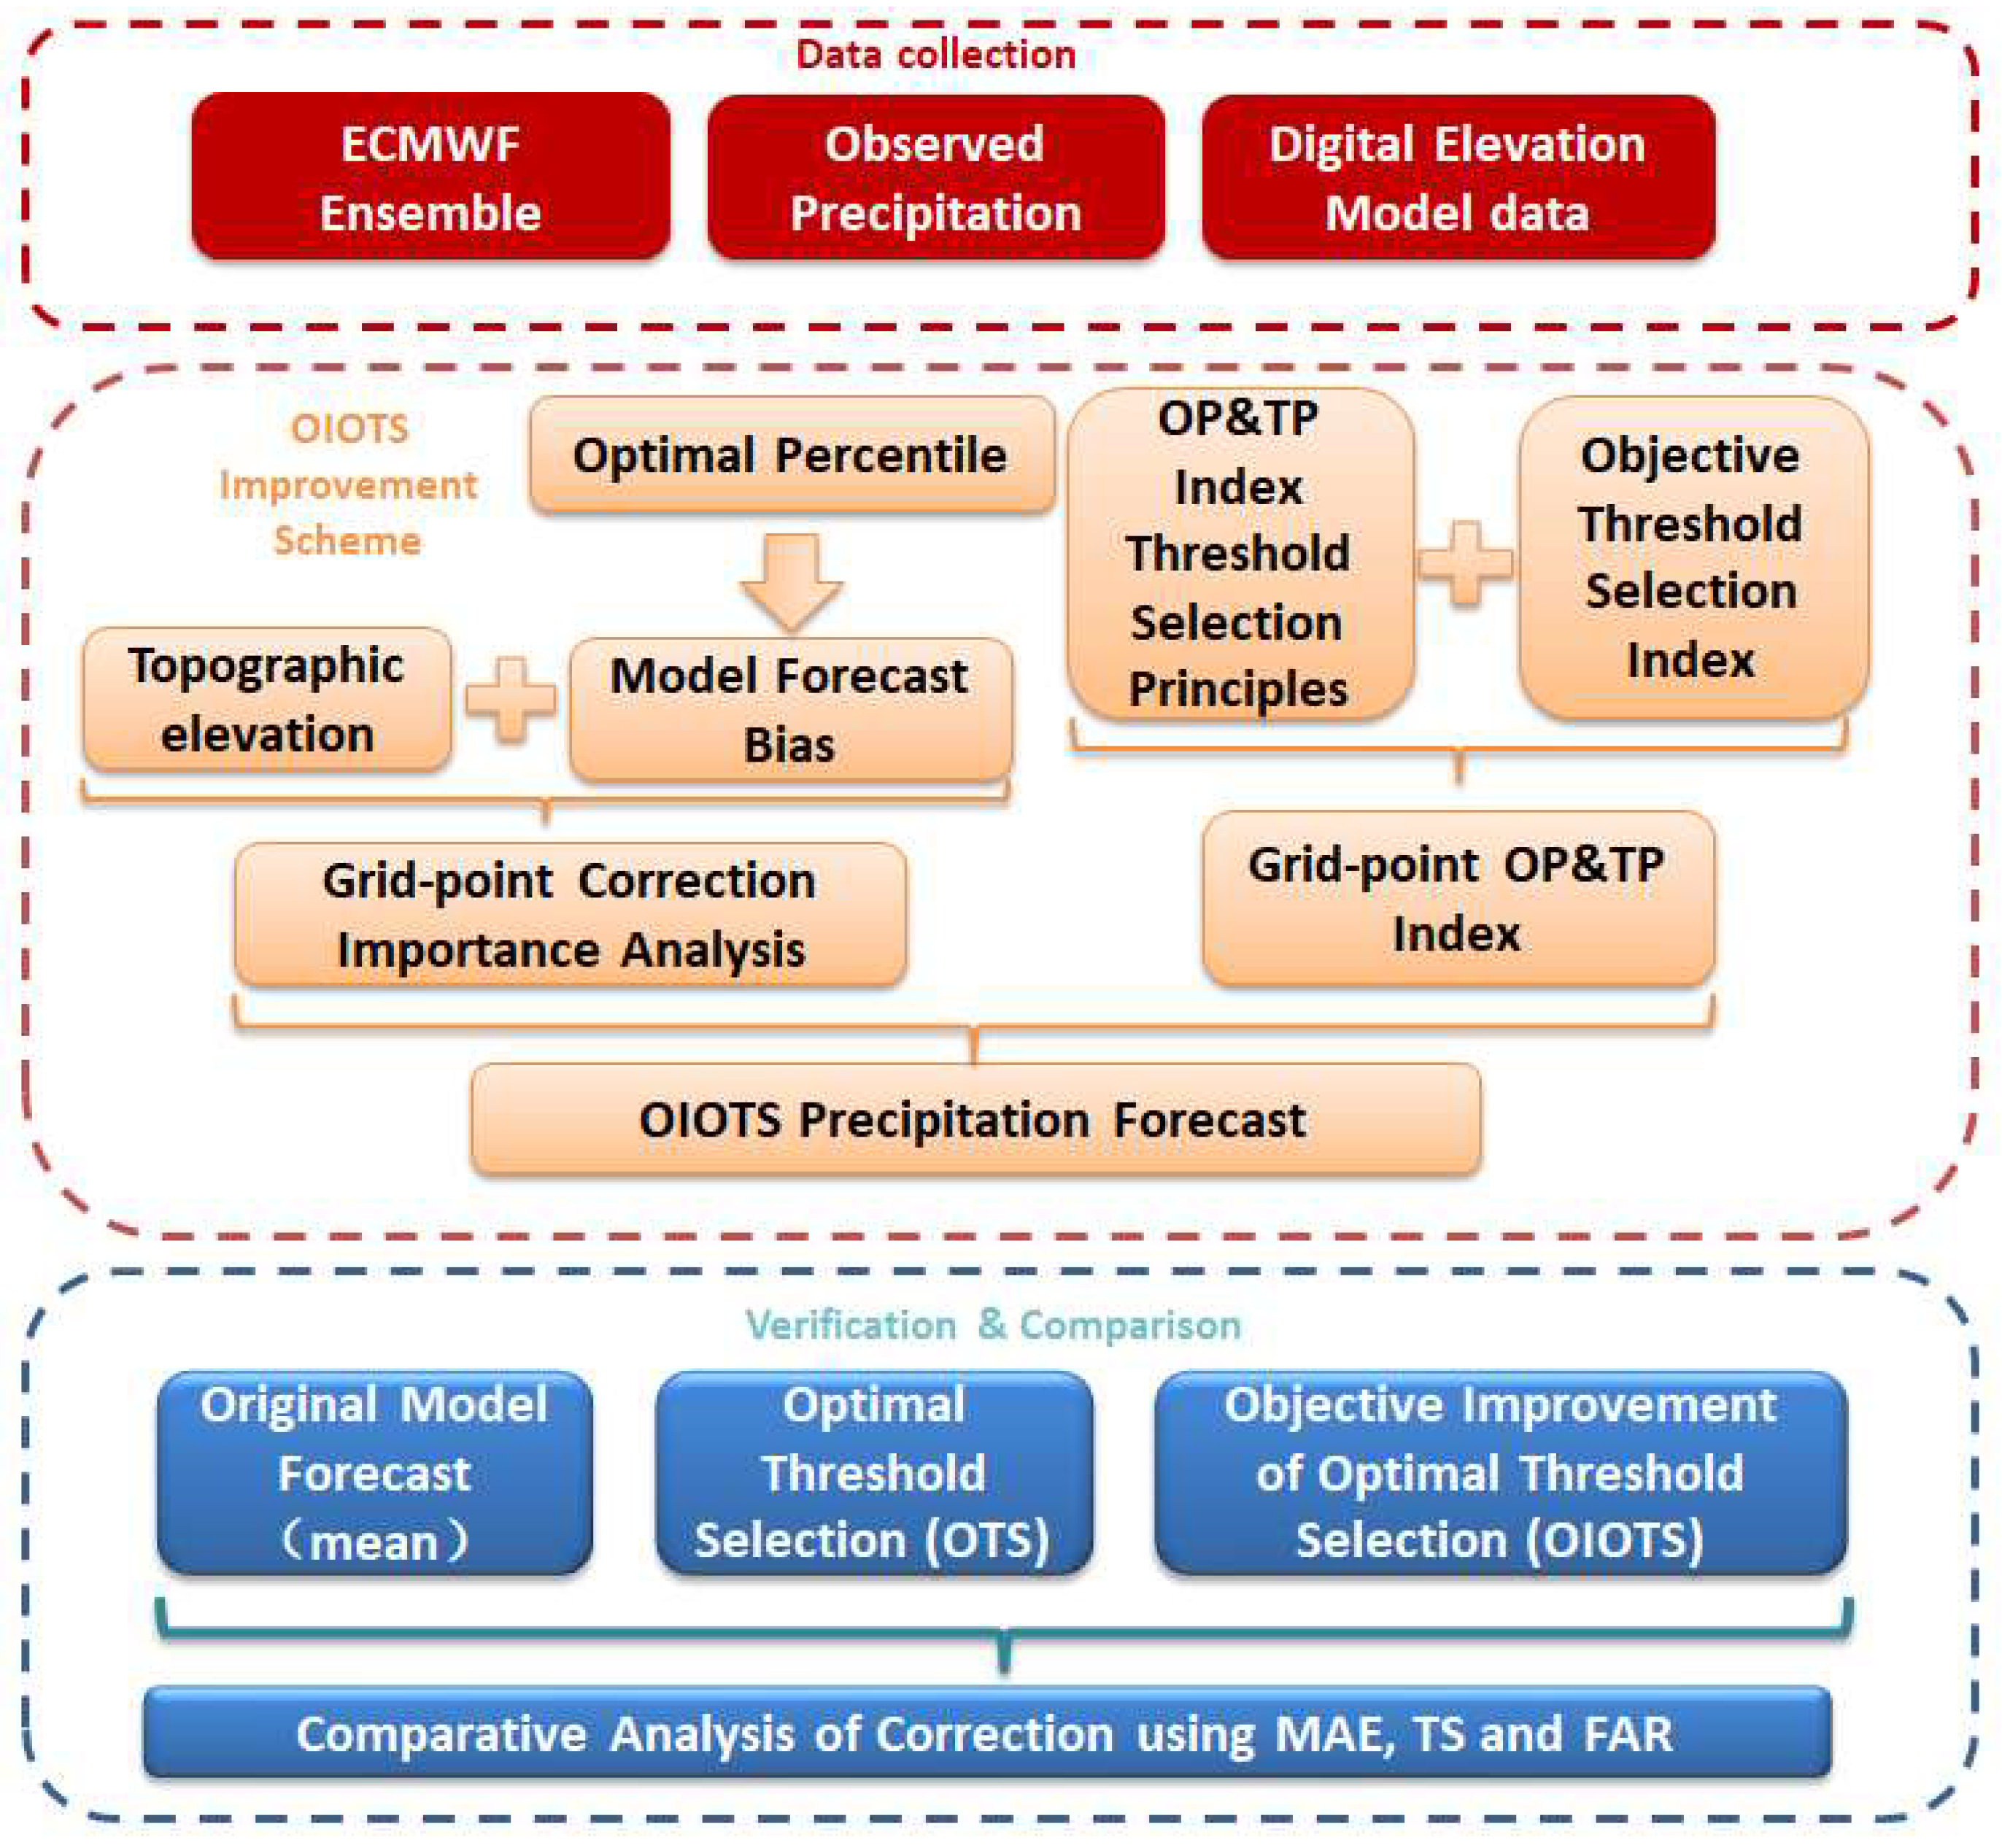
This research establishes a framework for the OIOTS in precipitation forecasting (
Figure 1), designed to optimize predictive performance through multi-source data integration and algorithmic refinement. The framework initiates with a data collection phase, incorporating ECMWF ensemble forecasts, observed precipitation data, and Digital Elevation Model (DEM) data as fundamental inputs. At its core, the OIOTS improvement scheme bifurcates into two systematic analytical streams: first, a grid-point correction importance analysis is conducted by synthesizing topographic elevation features with model forecast biases; second, an optimal grid-point OP&TP index configuration is determined based on objective threshold selection principles and predefined indices. The convergence of these two streams results in the generation of the final OIOTS precipitation forecast. To validate the efficacy of the methodology, the framework concludes with a comprehensive verification and comparison phase. Comparative analyses are performed among the original model forecast, the standard OTS scheme, and the proposed OIOTS scheme. By utilizing evaluative metrics such as MAE, TS and FAR, the study quantitatively assesses the correction improvements and overall forecast reliability.
2.1. Study Area
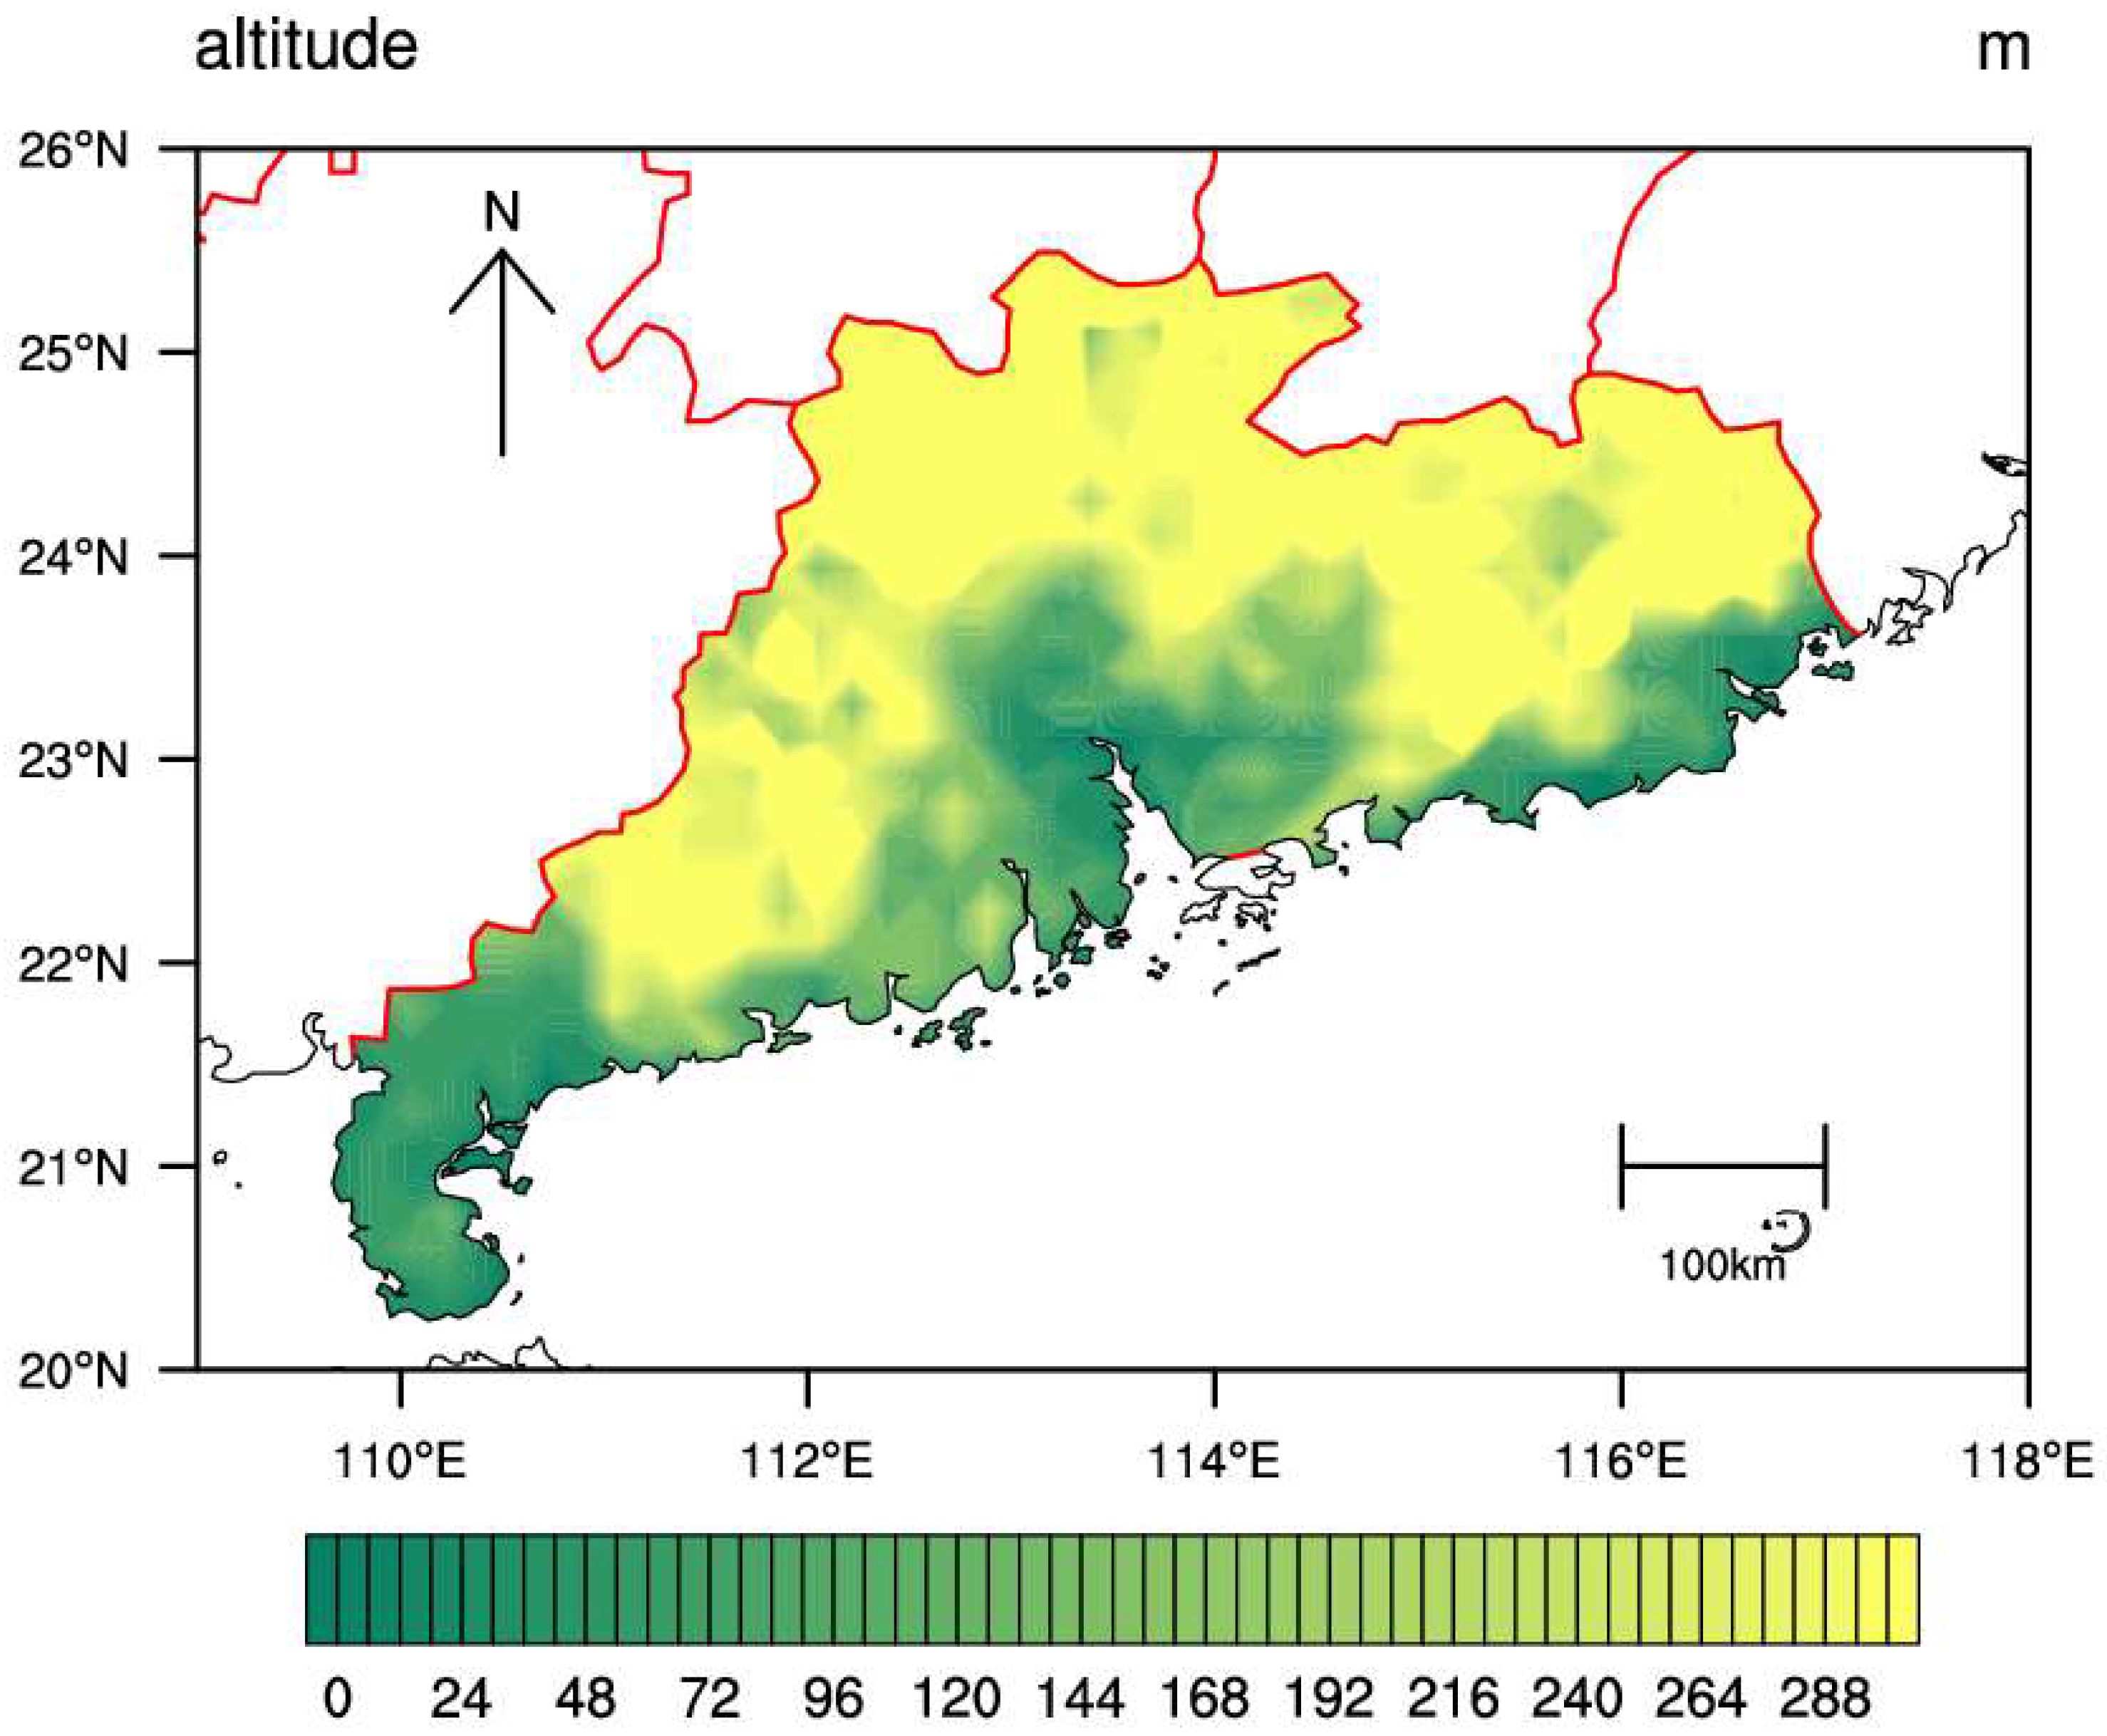
According to the altitude distribution map of Guangdong, the overall elevation of the region is relatively low, while its terrain is complex. The topography generally exhibits a characteristic of being high in the north and low in the south: the northern part is dominated by mountains and high hills, whereas the southern part mainly consists of plains and terraces.
Northern Guangdong features relatively high elevation and constitutes part of the Nanling Mountains, where orographic rainfall occurs frequently. Therefore, in the design of the model correction scheme, greater attention should be paid to topographic effects to reduce the inherent biases in the model’s simulation of terrain in this region.
In contrast, central and southern Guangdong are dominated by flat terrain, and the topographic influence on precipitation is weaker compared with northern Guangdong. However, as shown in
Figure 2, the Pearl River Delta is an estuarine area. Affected by southerly winds during the post-flood season in Guangdong, the model still shows limited skill in capturing local precipitation in this region.
In addition, with the rapid advancement of urbanization, the urban heat island effect has intensified. Combined with the impact of global warming, the frequency of local extreme precipitation events in this region has increased continuously in recent years. Thus, for precipitation forecasting, it is still necessary to consider the subtle influences of local topographic fluctuations and underlying surface properties.
2.2. Datasets
The study period in this paper spans from 1 January 2020 to 31 December 2024. Specifically, data from 2020 to 2021 are used for model training, while data from 2022 to 2024 serve as the independent validation period to ensure the objectivity of the evaluation of model optimization performance. This data-splitting strategy, where the validation period is longer than the training period, was deliberately adopted to provide a more rigorous test of the OIOTS scheme’s generalization capability. By demonstrating that thresholds derived from a 2-year training set yield consistent improvements over a subsequent and longer 3-year period, we ensure the scheme captures persistent systematic biases—driven by stable geographical features like topography—rather than over-adjusting to short-term noise. This approach confirms the scheme’s robustness and its reliability for operational applications across diverse weather scenarios. The datasets employed include both observational data and model forecast data.
The observation data adopt daily precipitation data from meteorological observation stations across Guangdong Province, covering 897 national weather stations and approximately 2680 regional automatic meteorological observation stations. These stations provide full coverage of the province and offer reliable, real-time support for the verification of precipitation forecasts. In the preprocessing stage, an objective analysis interpolation method is applied to interpolate the station-based observations into ultra-high-resolution gridded data with a 9 km grid spacing, which can meet the operational precipitation forecasting requirements of the Guangdong Meteorological Bureau. Statistical analysis of the station-based observation data during the study period (2020–2024) reveals a mean daily precipitation of 5.549 mm with a standard deviation of 13.690 mm. The precipitation values range from a minimum of 0.000 mm to a maximum of 393.600 mm. Notably, the distribution exhibits a significant positive skewness of 5.513 and a high kurtosis of 57.038. This dataset characteristically exhibits high statistical variability, the high standard deviation and non-normal distribution—marked by significant skewness—highlight the complexity of the data, thereby necessitating the use of the grid-specific optimization (OIOTS) proposed in this study.
The model forecast data adopt daily precipitation ensemble forecast data from ECMWF in the THORPEX Interactive Grand Global Ensemble (TIGGE) dataset, with a spatial resolution of 0.5° × 0.5°. The research area corresponds to Guangdong Province. The daily accumulated precipitation with lead times of 1–3 days is selected, corresponding to the total precipitation products of 24–48 h, 48–72 h, and 72–96 h starting at 00 UTC, with a temporal resolution of 24 h. The ensemble prediction system consists of one control forecast member initialized based on the optimal analysis field and perturbation members. During the study period, the system is initially configured with 51 ensemble members (including 50 perturbation members), and the initial perturbations of the perturbation members are generated based on the singular vector method. All members are run daily at 00 UTC. To unify the spatial scale of the two types of data, the linear interpolation method is used to perform spatial downscaling on the model forecast data, so that its spatial resolution matches the grid scale of the observation data. At the same time, spatial cropping, temporal matching and other preprocessing are uniformly carried out on the two types of data to meet the needs of model training and verification. It should be noted that this study focuses on the ECMWF model due to its dominant role and practical reliability in the operational meteorological services of Guangdong Province; however, future research will incorporate multi-model datasets to further evaluate and enhance the robustness of the proposed scheme across diverse ensemble systems.
2.3. Correction Methods
2.3.1. The Standard OTS Method
OTS is a widely used non-parametric statistical method in the field of ensemble model precipitation forecast post-processing [
27,
28]. Based on the probability distribution of ensemble forecast members, it establishes the corresponding relationship between forecast quantiles and observed facts through historical sample statistics. For different precipitation grades such as light rain, moderate rain, heavy rain, and rainstorm, the optimal quantile threshold interval of TS is determined by cross-validation, so as to realize the correction of systematic deviations of the original ensemble forecast. First, based on the training period samples, for different rainfall grades (divided into light rain, moderate rain, heavy rain, rainstorm, severe rainstorm, and extraordinary rainstorm according to operational regulations), the TS of different quantile members of the ensemble forecast for corresponding rainfall is verified to determine the optimal quantiles of ensemble members for different rainfall grades. Then, according to the descending order, it is judged in turn whether the ensemble-member forecast at the optimal quantile of the corresponding grade exceeds the threshold. If the condition is met, the judgment is stopped, and the forecast value at this position is taken as the corrected value; if none of the conditions are met, the corrected value is 0, thus obtaining the optimal quantile fusion product based on the ensemble forecast [
28]. The formula is as follows:
In the formula, is the optimal quantile forecast value at position I, is the forecast of all members at position i, represents the quantile calculation function, is the preset precipitation threshold, and is the corresponding optimal quantile. As shown in Equation (1), since the predefined precipitation thresholds () are sorted in descending order for judgment, the OTS is prone to a high FAR, even though it may achieve a relatively high TS over a long-term evaluation.
2.3.2. The Improved OIOTS Scheme
Previous studies have shown that in the OTS algorithm, although the forecast of large heavy precipitation areas can obtain a higher TS, there are many false alarms [
29,
32]. To address this shortcoming, Zhang et al. [
32] introduced a quantitative metric derived from ensemble-member uncertainty information to improve the fusion method, enabling the fused product to maintain high TS for heavy precipitation while significantly reducing positive bias and false alarm rates.
Based on the forecast uncertainty information of ensemble precipitation, when the quantile corresponding to the fusion product reaches above heavy rainfall (50 mm/day), the forecast probability of a certain small-magnitude precipitation is further introduced as a criterion to judge whether there are obvious false alarms in the heavy precipitation forecast of the fusion product.
The correction procedure is implemented as follows: First, an optimal percentile fusion product is generated using the ECMWF ensemble forecasts. Second, for each grid point where the fusion product predicts heavy rainfall (≥50 mm/day), the grid-specific PT is used to perform censoring. The predicted rainfall is substituted with rainfall values from lower-intensity categories until the corresponding optimal percentile value falls below 50 mm. For example, consider a grid point where the OTS predicts heavy rainfall (≥50 mm). If the local probability threshold for this grid is not met, the OIOTS procedure initiates an iterative downgrade: (1) if the optimal percentile value for the “heavy rain” category is <50 mm, it is used as the replacement; (2) if the “heavy rain” percentile value is ≥50 mm but the “moderate rain” category percentile value is <50 mm, the latter is adopted; (3) if the “moderate rain” percentile value also exceeds 50 mm, the value for the “light rain” category is used instead. This iterative substitution yields the final OIOTS corrected precipitation forecast.
According to the scheme designed by Zhang et al. [
32], the OP and PT are determined experimentally. By testing various rainfall thresholds and varying the PTs to identify the configuration where the BIAS is closest to 1, the corresponding probability is defined as the optimal censoring (false alarm suppression) probability. Concurrently, the optimal TS and FAR are calculated under these conditions. This process identifies the specific precipitation and PTs that maintain a high TS while effectively reducing the FAR, serving as the core indices for the correction scheme.
However, the thresholds in Zhang et al.’s [
32] approach are subjectively selected absolute values applied uniformly across the entire province. To address this limitation, this study enhances the methodology by conducting a statistical analysis of training data for each grid point in Guangdong. We evaluate the optimal TS, FAR, and the precipitation probability (where BIAS is closest to 1) across different precipitation thresholds at a grid-wise scale. By calculating the difference between TS and FAR and selecting its minimum absolute value, we objectively determine grid-specific precipitation and PTs. These are defined as the “objective relative thresholds” designed in this study.
In practical operational applications, the computational efficiency of the algorithm is a key metric for its feasibility. Tests demonstrate that for 1–3-day daily precipitation forecasts across the Guangdong region, the entire OIOTS correction procedure—which involves iterative judgment and substitution for every grid point across the province—can be completed within minutes on a standard operational computing server. This low computational complexity ensures that the scheme can be seamlessly integrated into real-time meteorological forecasting workflows, meeting the high timeliness requirements for forecast product dissemination.
2.4. Evaluation Methods
The TS, first proposed by Palmer and Allen [
35], is a widely used evaluation metric based on binary classification. To date, the TS has been widely regarded as a synonymous indicator in the meteorological field [
36,
37]. It has been incorporated into the scoring system for deterministic forecasts as an evaluation metric. The precipitation classifications are as follows:
In the formula, which is shown in
Table 1, NA represents the number of correctly forecasted precipitation events, NB represents the number of false alarms, and NC represents the number of misses. A higher TS indicates better forecast results.
In this study, the Threat Score (TS) and False Alarm Ratio (FAR) are employed as the primary evaluation metrics, as they are the standard benchmarks used in operational forecasting to balance hit rates and false alarms. Additionally, to provide a more robust assessment of the magnitude errors of the precipitation correction, the Mean Absolute Error (MAE) is also incorporated. This multi-metric approach ensures that the proposed scheme is evaluated both from the perspective of operational utility and overall numerical accuracy.
where
is the total number of all samples containing the verification grid points during the evaluation period, f represents the model forecast values, and o represents the corresponding observed values.
3. Results
3.1. Optimal Quantile Distribution at Different Forecast Lead Times
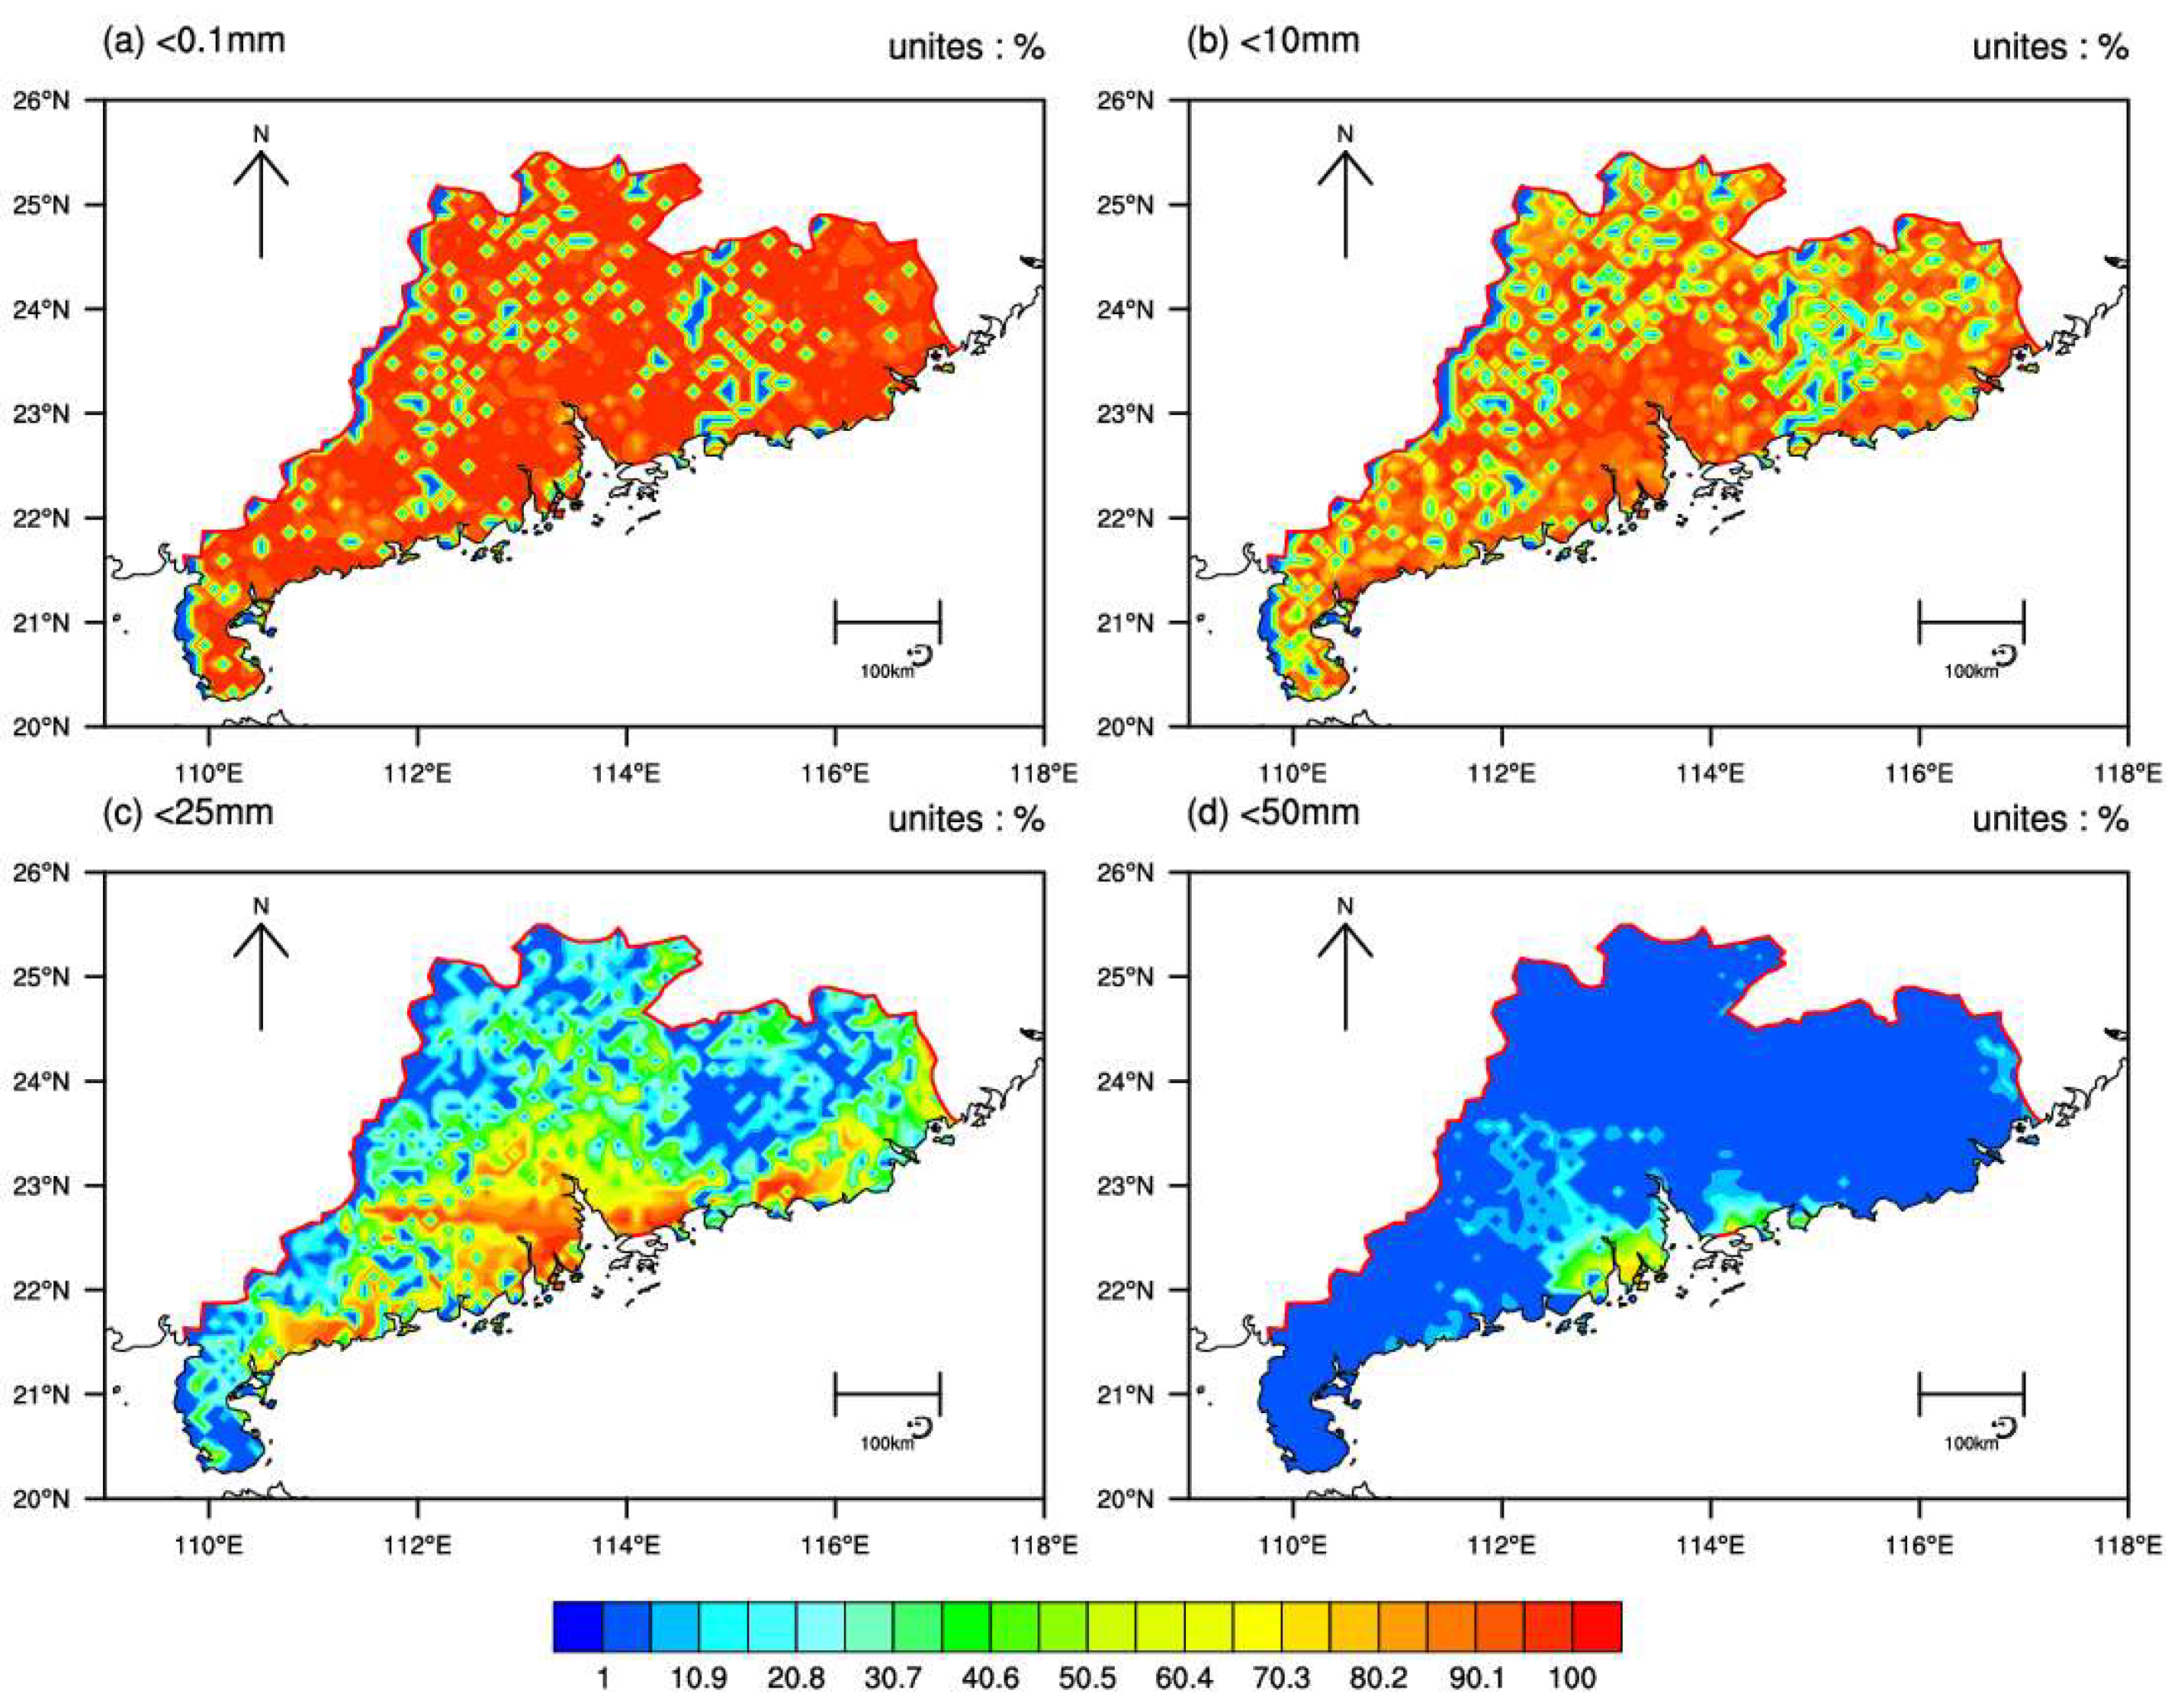
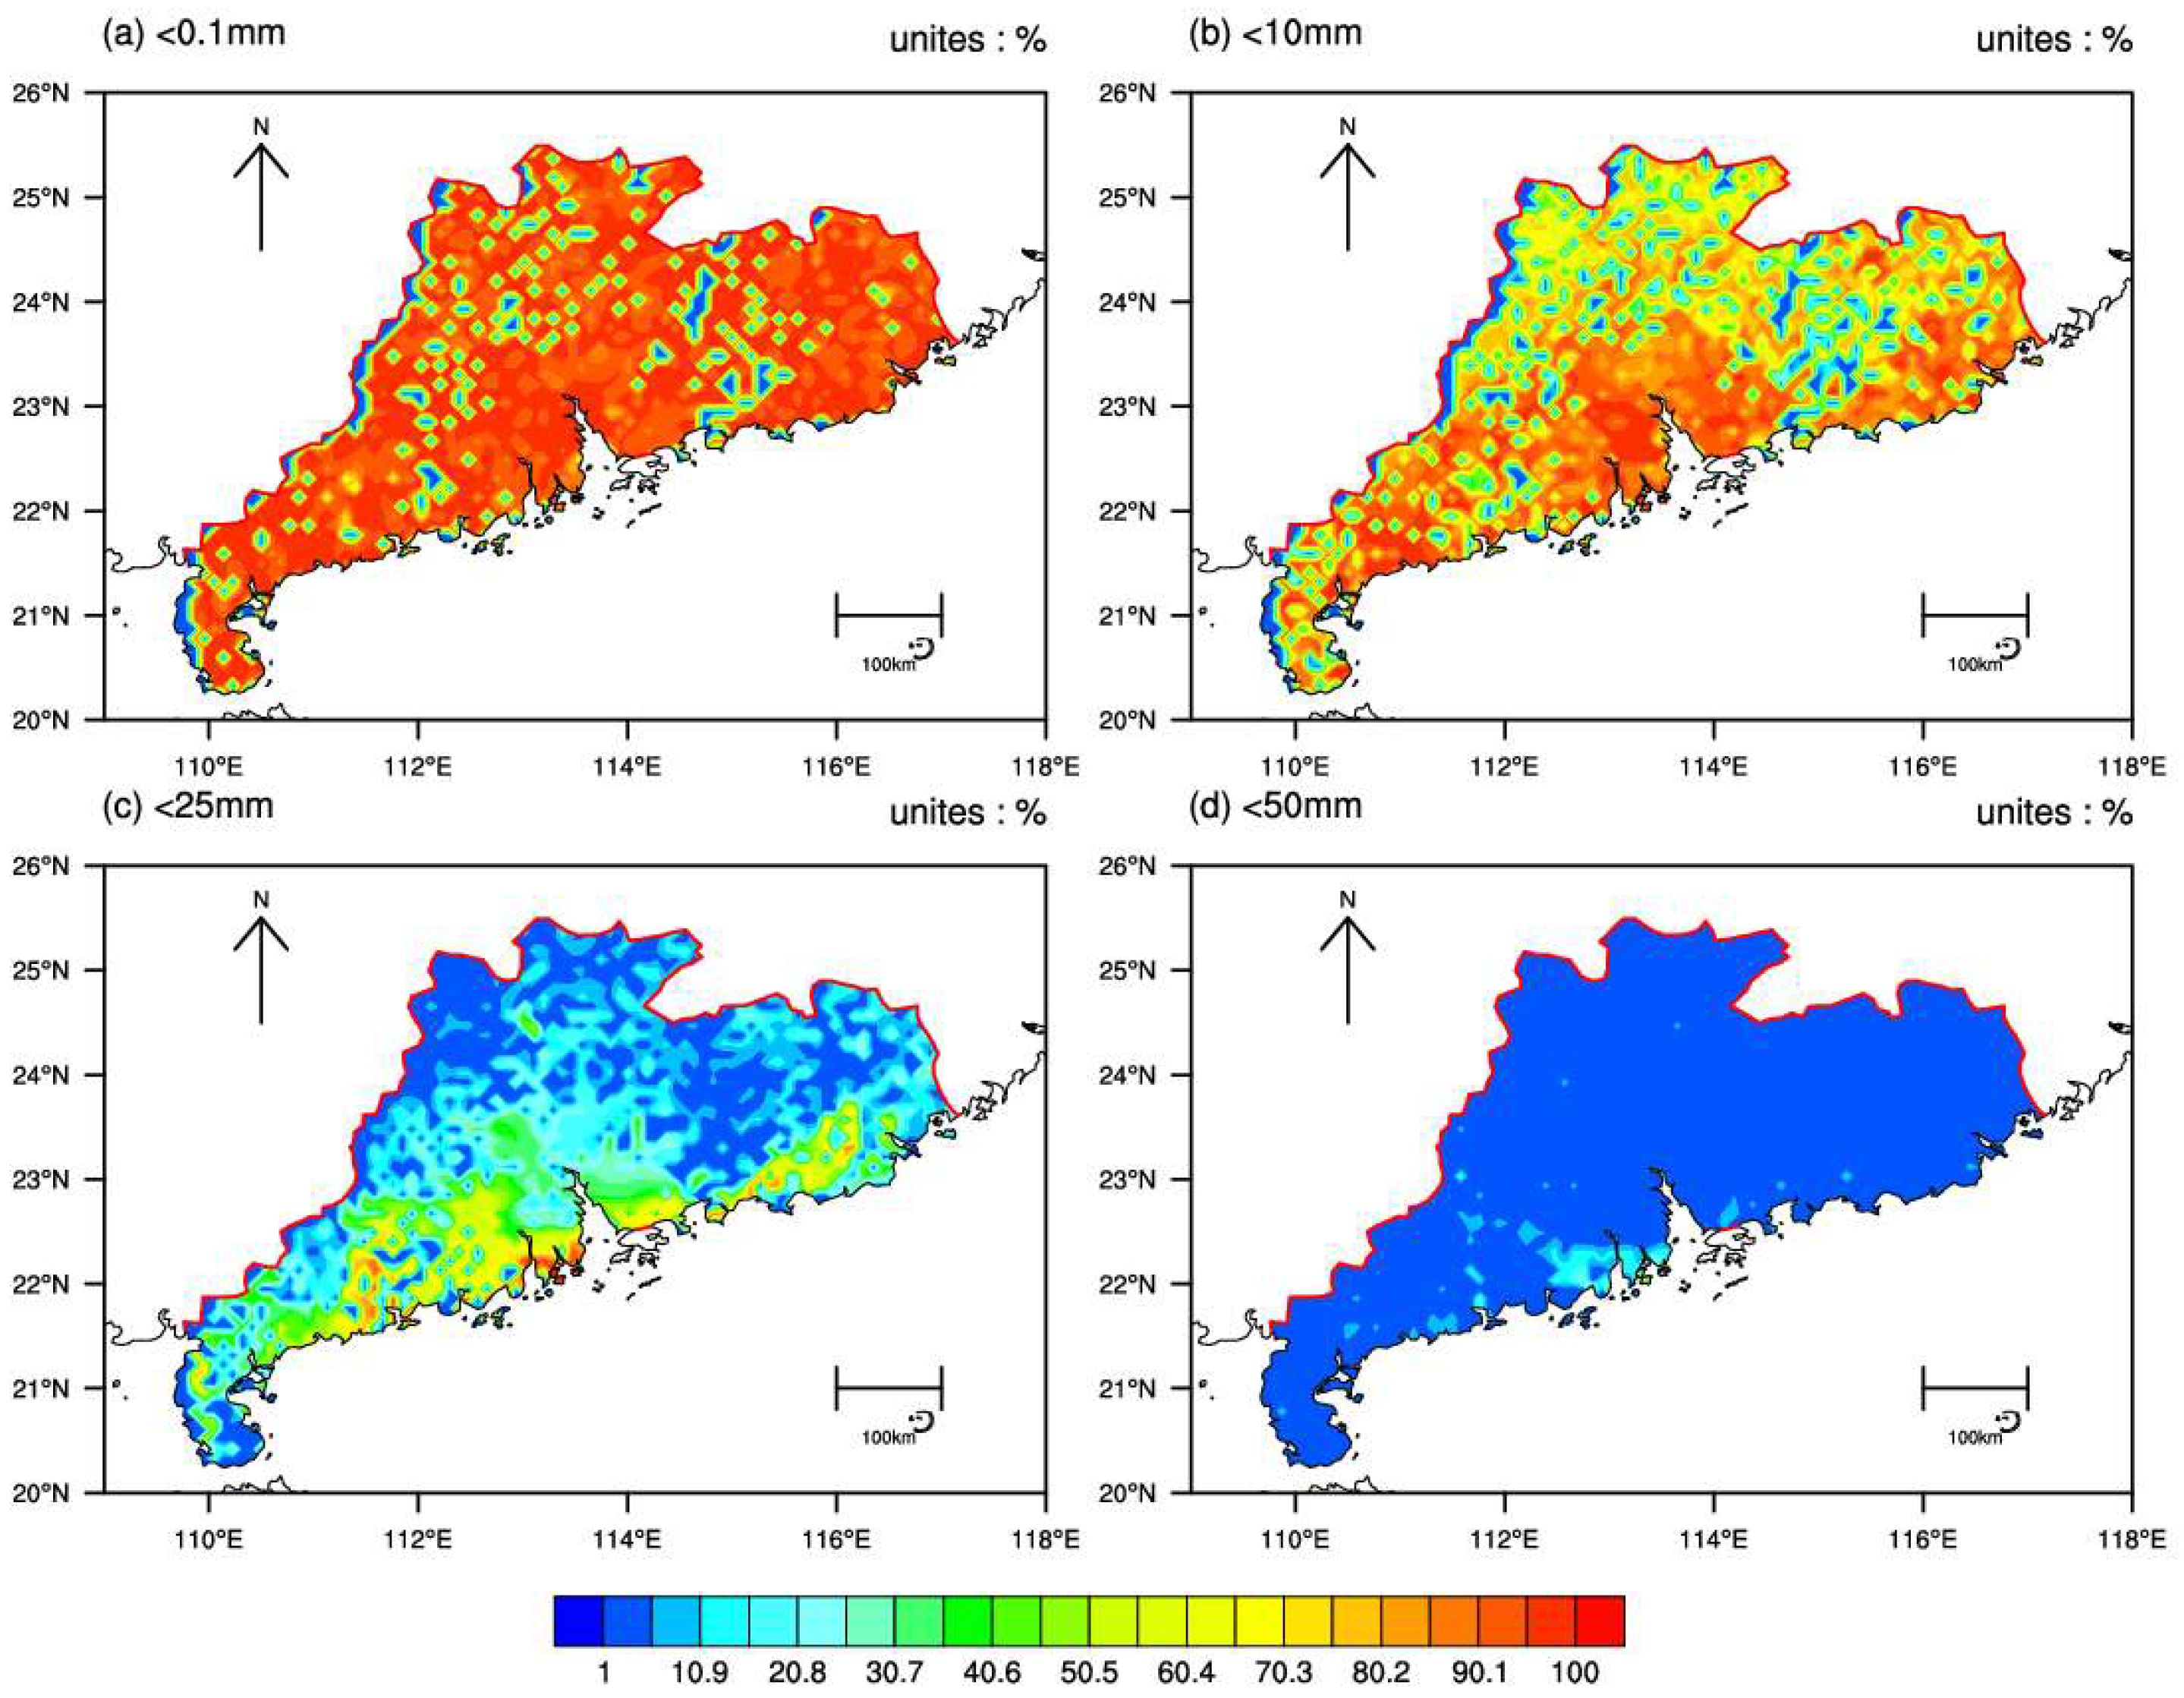
According to the optimal percentile distributions of 1-day-ahead forecasts for clear/rain (
Figure 3a), light rain (
Figure 3b), moderate rain (
Figure 3c) and heavy rain (
Figure 3d), the ECMWF ensemble model shows certain forecasting skill for precipitation over Guangdong. However, its performance varies with precipitation intensity.
For clear/rain and light rain events (
Figure 3a), the optimal percentiles of the model are mainly above the 99th percentile, indicating that most ensemble members achieve reasonable performance for precipitation below moderate rain over Guangdong. In terms of the optimal percentiles for light rain (
Figure 3b), they are generally above the 99th percentile. However, the optimal percentiles in other regions are lower than those in the Pearl River Delta, and this difference becomes increasingly significant with increasing precipitation intensity, indicating that the optimal percentiles of the model exhibit regional disparities. In other words, precipitation correction should be implemented regionally (grid-by-grid correction is expected to yield better results).
For precipitation exceeding 25 mm/d (
Figure 3c,d), the forecasting skill of the ECMWF ensemble model decreases significantly, as reflected by the remarkably lower optimal percentiles. This suggests that most ensemble members have substantially reduced capability in capturing precipitation at or above this intensity.
For the 25 mm/d precipitation category (
Figure 3c), the optimal percentiles are relatively high (around the 90th percentile) over coastal areas and the southern Pearl River Delta, while they are lower (below the 50th percentile) over other regions. For precipitation exceeding 25 mm/d (
Figure 3d), the optimal percentiles over most parts of Guangdong drop to approximately 1. Among all cities, Jiangmen has the highest optimal percentile in the province, at around 50.
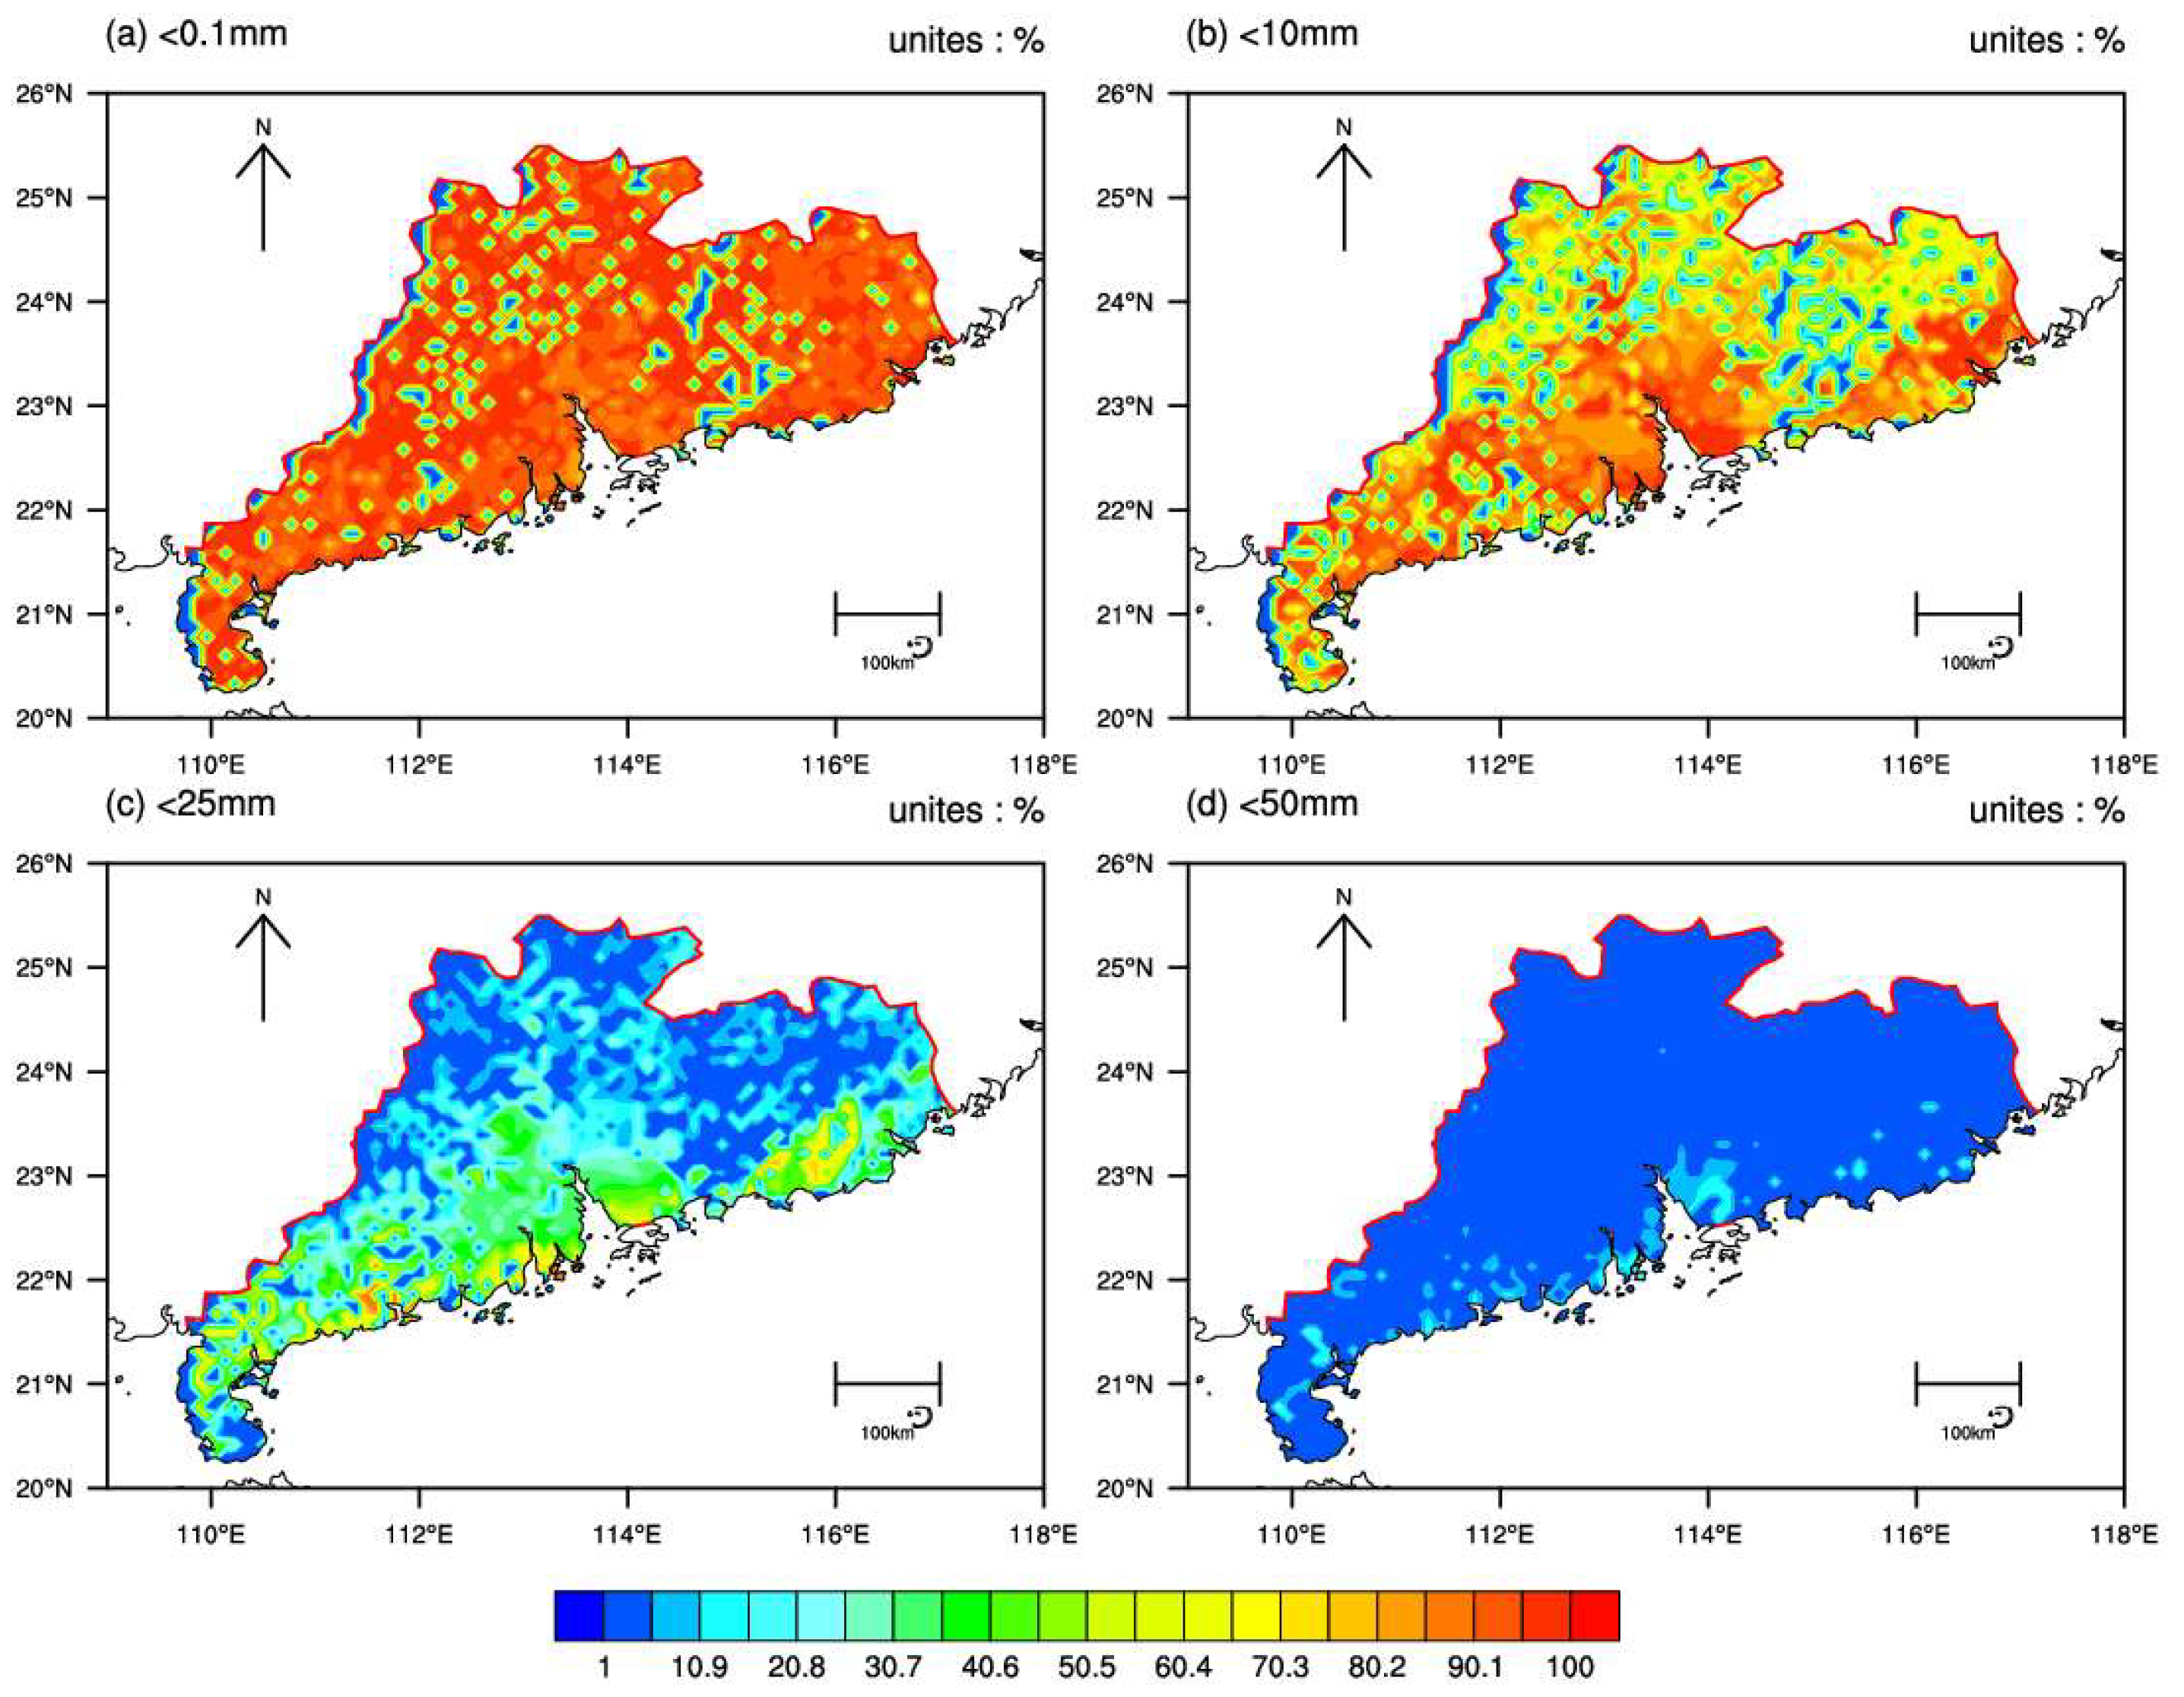
Compared with the optimal percentile distribution of 1-day-ahead forecasts (
Figure 3), the optimal percentiles for 2-day-ahead forecasts (
Figure 4) decrease to varying degrees across all precipitation intensities.
For clear/rain forecasts (
Figure 4a), the downward trend of the optimal percentiles is relatively weak, indicating that the model has high accuracy and stability in predicting the occurrence or non-occurrence of precipitation. This also suggests that the model has relatively high reliability for rainfall occurrence forecasts over Guangdong.
For light rain and higher precipitation categories (
Figure 4b–d), the optimal percentiles show a more evident decreasing trend. In general, however, the distribution patterns of the optimal percentiles across categories remain similar. The model shows relatively higher forecast accuracy over the Pearl River Delta and coastal areas, where more ensemble members can reasonably capture precipitation.
The model exhibits a certain degree of systematic bias in precipitation forecasts over Guangdong, which may result from the model’s poor representation of orographic precipitation induced by the complex terrain in the region. This indirectly implies that terrain-based (grid-specific) precipitation correction is necessary for forecasts over Guangdong, and that post-processing correction of model precipitation forecasts is highly essential.
The optimal percentile distribution of the 3-day-ahead precipitation forecasts from the ECMWF ensemble model (
Figure 5) is similar to that of the 2-day-ahead forecasts (
Figure 4), and the downward trend of the optimal percentiles slows with increasing forecast lead time.
Similarly, for clear/rain and light rain events, the optimal percentile distributions for 1- to 3-day-ahead forecasts are relatively consistent, and a considerable number of ensemble members can reasonably represent such precipitation intensities, indicating high forecast reliability.
Compared with the relatively weak downward trend of optimal percentiles for precipitation below moderate rain as lead time increases (
Figure 5a,b), the optimal percentiles for moderate rain and above show a more significant decrease (
Figure 5c,d).
However, the optimal percentiles over coastal areas remain higher than those over other regions, indicating that the variation in model forecast reliability with terrain is consistent across all forecast lead times.
Based on the above analysis of the optimal percentiles for 1- to 3-day-ahead model forecasts, the optimal percentiles for rainfall occurrence and light rain are relatively high, indicating that most ensemble members can reasonably predict precipitation below moderate rain over Guangdong. For moderate rain and heavier precipitation, the forecast skill of the ECMWF ensemble model decreases significantly with increasing precipitation intensity, suggesting a pronounced decline in the ability of most ensemble members to capture precipitation at and above this intensity. For moderate rain and above, the optimal percentiles are higher over coastal areas and the southern Pearl River Delta, while they are lower over other regions. This implies that precipitation correction for the model over Guangdong should be performed separately according to terrain (grid by grid), and that correction of model precipitation forecasts is highly necessary.
3.2. OP and PT Distribution
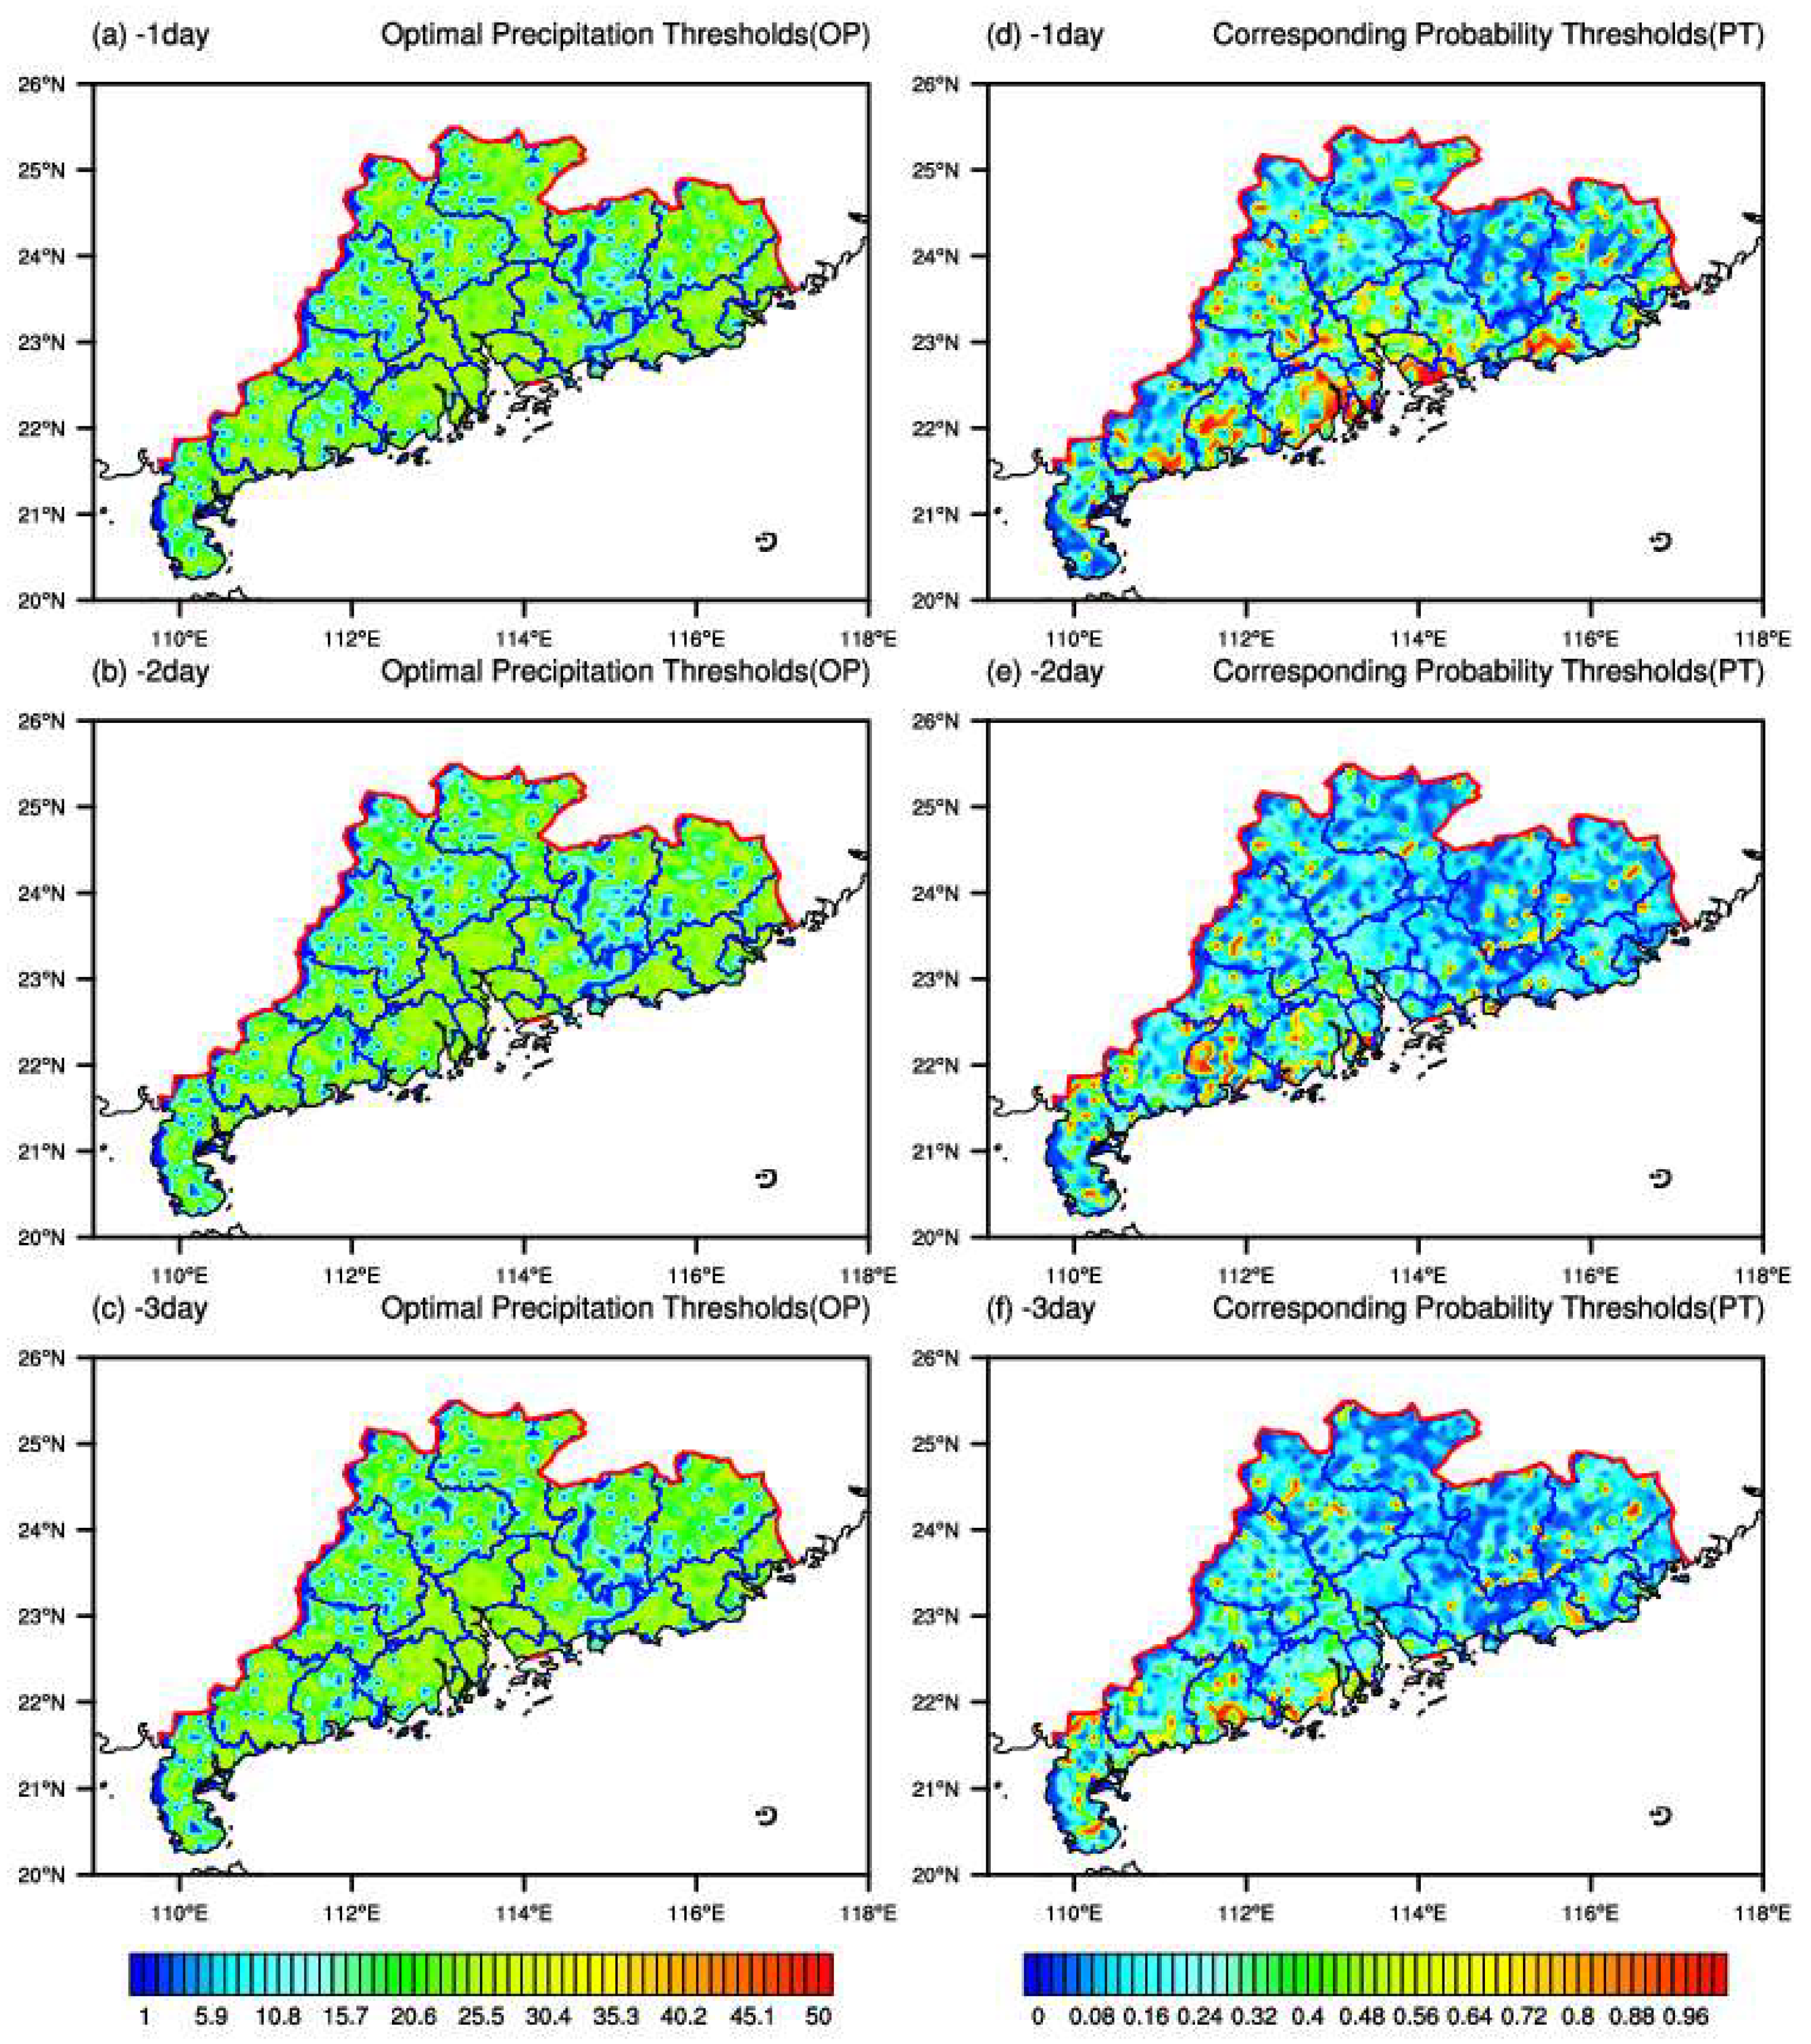
For the OP threshold (
Figure 6a–c), the differences in threshold values across different forecast lead times are relatively small, and the threshold exhibits high stability against variations in lead time. This indirectly indicates that the correction based on this index is highly stable.
Across the whole of Guangdong, the OP threshold values are distributed within a narrow range of 15 to 30. However, in detail, the OP threshold varies among individual grid points and shows clear regional characteristics: it is relatively large over the Pearl River Delta and coastal areas, but smaller over other regions. This implies that a uniform, fixed OP threshold is not suitable for the entire Guangdong area, and the threshold should be determined separately according to the topographic features of different regions.
Compared with the OP threshold, the corresponding PT (
Figure 6d–f) shows a relatively obvious downward trend with increasing forecast lead time, indicating that the stability of the PT associated with the OP is low with respect to lead time. For this correction scheme, the threshold still needs to be selected separately for different forecast lead times. Specifically, the PT is relatively high over the Pearl River Delta and coastal areas, and lower over other regions.
4. Verification and Comparative Analysis
In the verification of precipitation forecasts, the TS is commonly used as an evaluation metric in operational practice. The TS comprehensively considers the Hit Rate (HR) and FAR of forecasts, which are applied separately for different precipitation intensities, and effectively reflects the forecast accuracy and the ability to capture the occurrence of precipitation events.
In this study, the TS is also introduced according to the design principle of the OIOTS scheme, and the FAR will be analyzed simultaneously.
In addition, the Mean Absolute Error (MAE) is highly sensitive to errors and can directly reflect the average deviation between predicted and observed precipitation values, thus characterizing the overall correction performance of the method. Therefore, the MAE is also calculated in this part to conduct an integrated analysis of the correction effect.
To demonstrate the improvement of each correction scheme over the original model, the arithmetic mean of all ensemble members is computed to obtain a deterministic precipitation forecast product that represents the baseline forecast performance of the ensemble model.
4.1. Statistical Verification Analysis
Using MAE as a verification metric can effectively reflect the magnitude of precipitation forecast biases. Before conducting TS analysis of precipitation forecasts, MAE is first employed to analyze forecast errors, allowing a comprehensive understanding of the correction performance of each scheme.
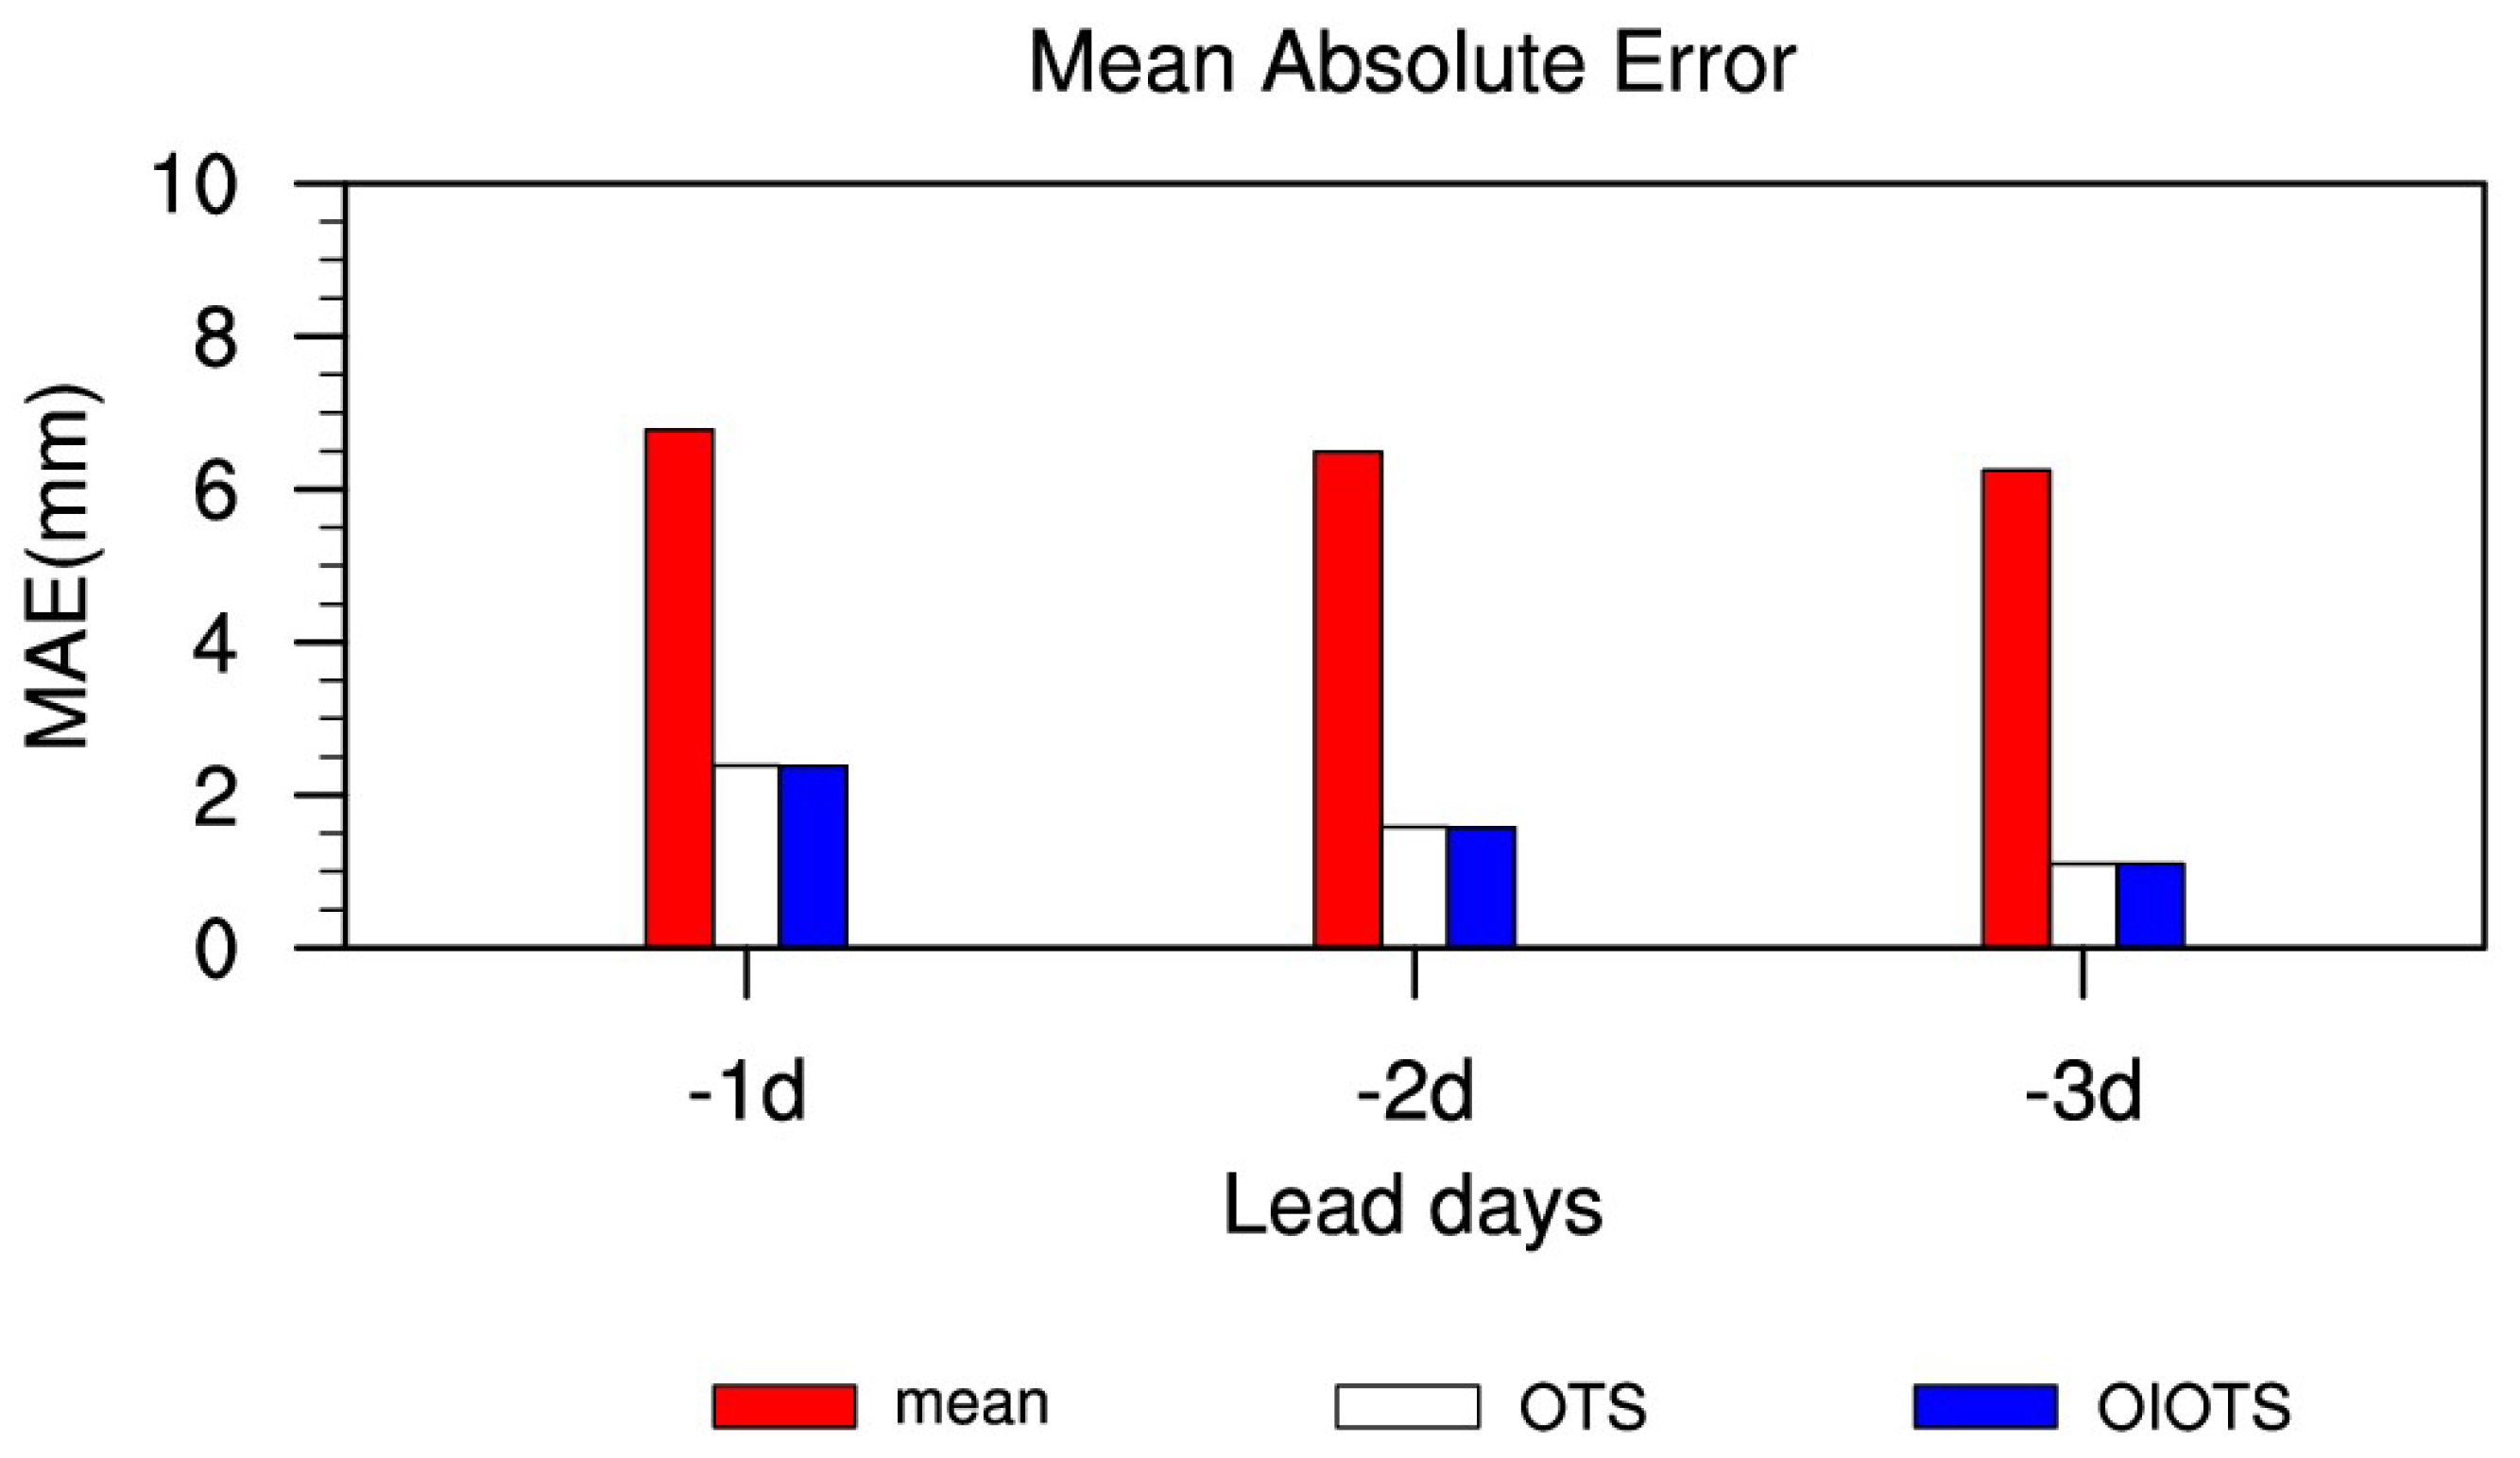
As shown in the bar charts of MAE for the Ensemble Mean (EM), OTS, and OIOTS forecasts at different lead times (
Figure 7), EM is used as the raw model forecast to conduct a comparative analysis of the correction schemes. It can be seen that both the OTS scheme and the OIOTS scheme achieve noticeable correction effects relative to the original model.
Comparing OTS and OIOTS, for 1-day-ahead forecasts, the MAE values of precipitation forecasts from OIOTS and OTS are close, indicating a small difference in correction performance. However, as the forecast lead time increases, the MAE of the OIOTS scheme gradually becomes lower than that of OTS. Overall, the correction effect of the OIOTS scheme on precipitation forecasts over Guangdong is slightly superior to that of the OTS scheme.
4.2. TS Distribution
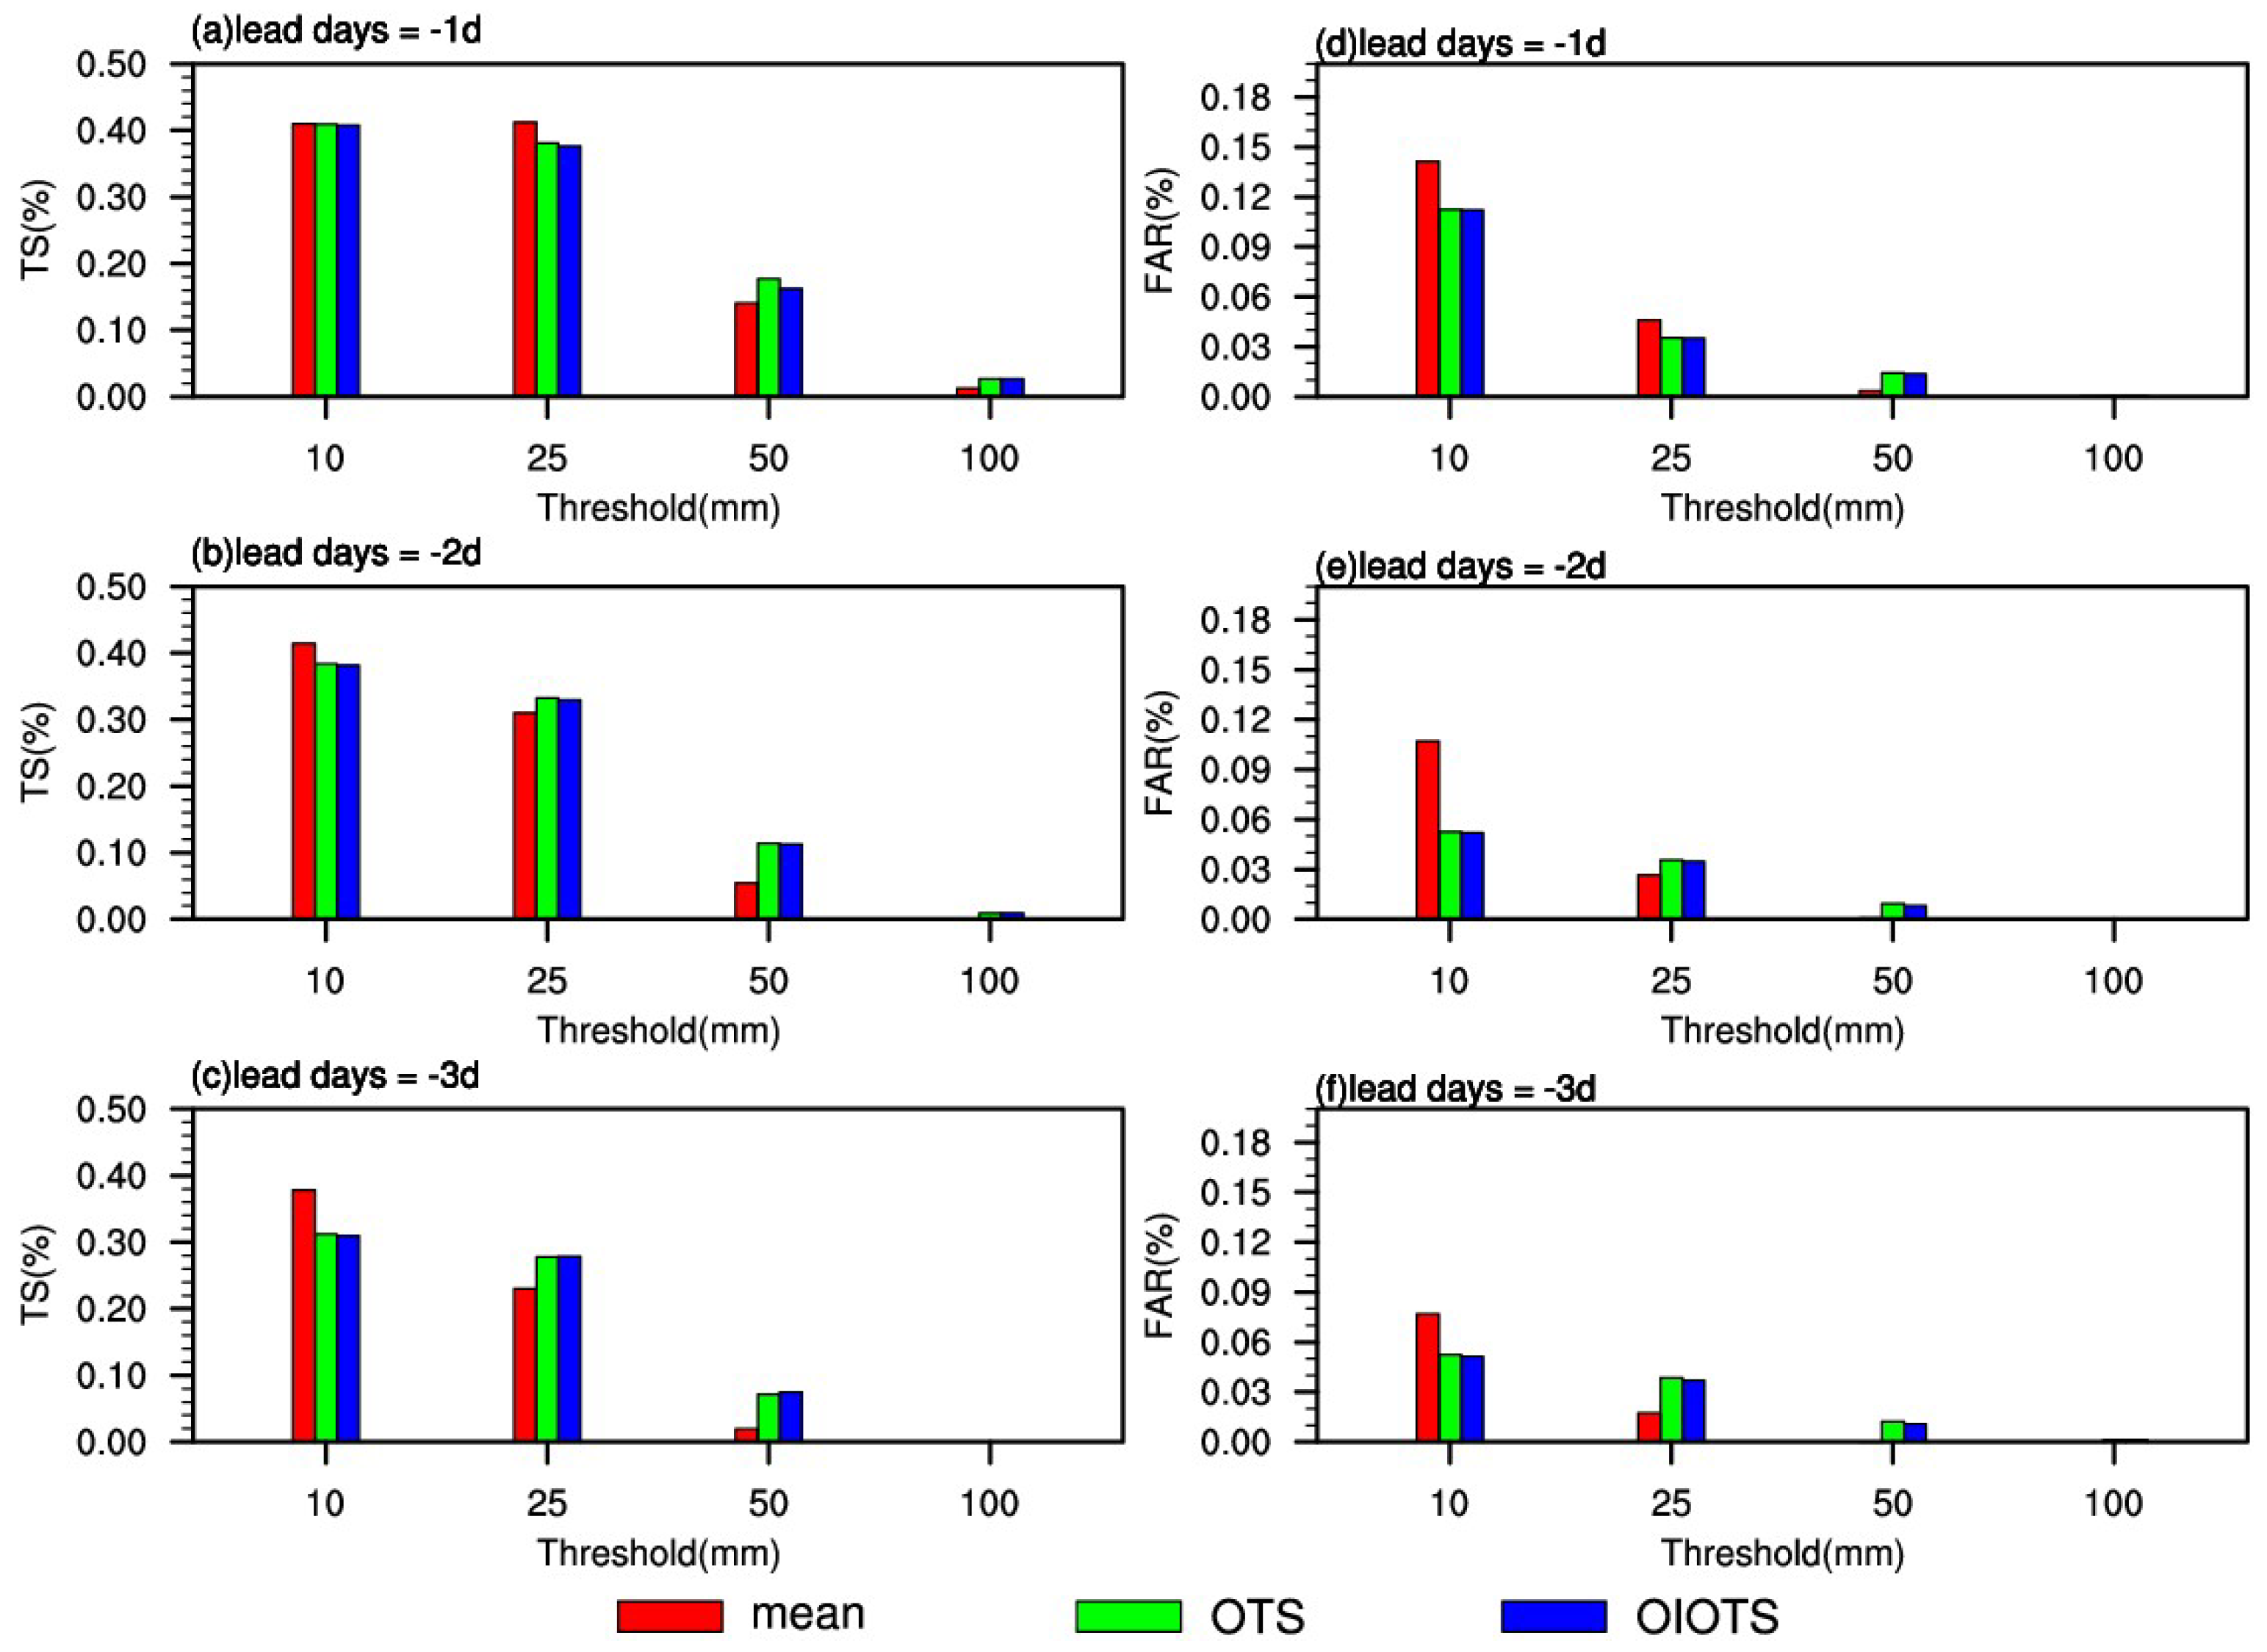
Regarding the TS (
Figure 8a–c), the EM forecast (representing the baseline model performance) shows a clear decrease with increasing precipitation threshold across all forecast lead times. This decline is especially sharp for rainstorms above 50 mm/d, indicating that the original model performs very poorly in forecasting heavy precipitation events and that rainstorm correction is highly necessary.
Comparing the TSs of the OTS and OIOTS schemes, both correction methods achieve noticeable improvements. The increase in TS relative to EM becomes more significant with longer lead times and higher precipitation thresholds, and the TSs of OTS and OIOTS are generally close to each other. It is noteworthy that in certain precipitation grades, the TS of the OIOTS scheme may be slightly lower than or equal to that of the original OTS. This is primarily due to the different optimization objectives of the two schemes: while the standard OTS is designed to maximize the TS by selecting optimal quantiles—often leading to aggressive “over-forecasting” to capture more hits—the OIOTS scheme focuses on balancing detection accuracy and error suppression. By minimizing the absolute difference between TS and FAR, our objective relative thresholding in OIOTS seeks a bias closer to 1. Consequently, while the iterative “filtering” or “downgrading” logic in OIOTS might occasionally lead to the loss of a few marginal hits, it ensures a more physically consistent and reliable forecast by significantly reducing the systematic false alarms inherent in the original OTS.
In terms of FAR (
Figure 8d–f), compared with EM, the improvement in TS for OTS is achieved at the cost of an increased FAR. In contrast, the OIOTS scheme maintains a TS similar to that of OTS while effectively reducing the high FAR of OTS. This reduction in FAR by OIOTS becomes increasingly evident with longer forecast lead times and higher precipitation thresholds.
Overall, according to the MAE, the correction performance of the OIOTS scheme for precipitation forecasts over Guangdong is slightly better than that of the OTS scheme. In terms of the TS, both the OTS and OIOTS schemes achieve considerable improvement, and the correction effect becomes more significant with longer lead times and higher precipitation thresholds. The TSs of the two schemes are similar. Considering the FAR, the OIOTS scheme maintains a TS close to that of the OTS scheme while effectively reducing the relatively high FAR of OTS. Furthermore, the FAR of the OIOTS scheme shows a clear downward trend with increasing forecast lead time and precipitation threshold.
5. Discussion
The OIOTS scheme effectively balances forecast precision and reliability, though several aspects warrant further consideration. First, while the grid-by-grid and lead-time-specific calibration increases computational complexity, the fully automated framework ensures high operational efficiency and regional scalability. Our tests confirm that provincial-level correction can be completed within minutes, though hourly forecasting might require further computational optimization.
An observed decrease in MAE from day 1 to 3, while counter-intuitive, likely stems from the mitigation of “double-penalty” effects associated with displacement errors in very short-range forecasts. However, this trend is expected to reverse as lead times extend to 5–7 days due to growing atmospheric chaos. Future research will analyze longer-range data to identify this “inflection point” and define the scheme’s predictability limits.
Furthermore, the current validation is focused on the post-flood season. The performance of OIOTS during the pre-flood season, characterized by diverse and complex mechanisms like warm-sector heavy rainfall, remains to be investigated. Lastly, while the statistical approach of OIOTS offers robustness and transparency over traditional OTS, comparing it with emerging machine learning (ML) techniques is an essential next step. Future efforts will prioritize integrating multi-model ensembles, developing weather-type-dependent thresholds, and benchmarking against ML models to further enhance the scheme’s robustness and accuracy across varied synoptic conditions.