Article

Using Sodium Humate and Desulfurization Gypsum to Improve Saline Water Irrigation for Better Soil Water Movement and Salt Balance in Saline-Alkali Soils

1
College of Water Conservancy and Civil Engineering, Xinjiang Agricultural University, Urumqi 830052, China
2
Xinjiang Key Laboratory of Hydraulic Engineering Safety and Water Disaster Prevention, Urumqi 830052, China
3
Xinjiang Future Irrigation District Engineering Technology Research Center, Wensu County, Aksu City 843100, China
4
State Key Laboratory of Desert and Oasis, Xinjiang Institute of Ecology and Geography, Chinese Academy of Sciences, Urumqi 830011, China
5
National Key Laboratory of Water Engineering Ecological Environment in Arid Areas, Xi’an University of Technology, Xi’an 710048, China
*
Authors to whom correspondence should be addressed.
Water 2026, 18(11), 1253; https://doi.org/10.3390/w18111253
Submission received: 16 April 2026 / Revised: 16 May 2026 / Accepted: 19 May 2026 / Published: 22 May 2026
(This article belongs to the Section Soil and Water)

Abstract

Saline water irrigation has emerged as a promising approach to mitigate agricultural water shortages; however, its improper use may induce secondary soil salinization. In this study, saline-alkali soil collected from Hami, Xinjiang, was used to conduct a series of indoor one-dimensional vertical soil column experiments. The aim was to systematically investigate the effects of sodium humate and desulfurization gypsum on soil infiltration behavior and the distribution patterns of key cations and anions under different levels of irrigation water salinity. The results showed that sodium humate application markedly improved soil infiltration capacity, while the duration of infiltration decreased with increasing salinity. Under salinity levels of 12 and 16 g/L, the 4 g/kg sodium humate treatment exhibited the most rapid advancement of the wetting front. In contrast, desulfurization gypsum reduced infiltration rates, with the lowest infiltration observed under the 12.5 g/kg treatment at 16 g/L salinity. Under different treatments, the adjusted coefficients of determination (adjusted R2) for the Philip, Kostiakov, and Horton models ranged from 0.8450 to 0.9841, 0.9901 to 0.9989, and 0.9748 to 0.9942, respectively, while the global performance indicator (GPI) ranged from 1.619 × 10⁻³ to 5.103 × 10⁻¹, 4.998 × 10⁻⁹ to 2.166 × 10⁻⁵, and 1.505 × 10⁻⁶ to 2.438 × 10⁻⁴, respectively. These results indicate that the Kostiakov model outperformed the other models in terms of fitting accuracy and overall performance for describing the soil infiltration process. In addition, sodium humate generally increased the sorptivity parameter S in the Philip model and the empirical coefficient K in the Kostiakov model, whereas desulfurization gypsum showed the opposite trend. In terms of salt regulation, sodium humate demonstrated optimal desalination performance at application rates of 6–8 g/kg under low salinity and 4–6 g/kg under high salinity conditions. Conversely, excessive gypsum application tended to exacerbate salt accumulation, although a moderate dosage (5 g/kg) effectively limited the downward migration and accumulation of Na+ and Cl. These two ions were identified as the dominant contributors to soil salinization, showing strong positive correlations with soil salt content (SSC), sodium adsorption ratio (SAR), and exchangeable sodium percentage (ESP). In contrast, Ca2+, Mg2+, and HCO3 played beneficial roles in alleviating sodicity through ion exchange and buffering mechanisms. Overall, sodium humate enhanced infiltration and facilitated salt leaching in the upper soil layers under saline irrigation conditions. Although desulfurization gypsum reduced infiltration and increased overall salt content, it contributed to mitigating Na+ accumulation in deeper soil profiles. These findings highlight the critical importance of selecting appropriate soil amendments and optimizing their application rates to improve saline water use efficiency and promote sustainable management of saline-alkali soils.

1. Introduction

Soil salinization is a widespread ecological and agricultural problem worldwide, occurring in more than 100 countries and regions. The global area of salt-affected soils is approximately 955 million hectares [1]. In China, the area of salt-affected soils is about 99.13 million hectares, accounting for nearly one-tenth of the global total [1]. Among these regions, salinization and alkalization are particularly severe in arid and semi-arid areas of northwestern China, posing significant constraints on vegetation restoration, sustainable agricultural development, and ecosystem stability [2]. Under arid climatic conditions, limited precipitation and intense evaporation facilitate the upward movement of salts from soil or groundwater to the surface through capillary water, thereby aggravating soil salinization and alkalization. This process not only deteriorates soil physicochemical properties and structure, but also restricts plant uptake of water and nutrients, ultimately reducing agricultural productivity and weakening soil ecological functions [3,4]. In arid regions where freshwater resources are relatively scarce, the development and utilization of saline or brackish water with relatively high mineralization as a supplementary irrigation source has become an important approach to alleviating water shortages [5,6]. However, long-term saline water irrigation can easily lead to soil salt accumulation, further intensifying salinization and alkalization. Therefore, under saline water irrigation conditions, regulating soil water and salt transport through the rational application of amendments is essential for the sustainable utilization of salt-affected land. Chemical amendments are characterized by strong specificity, rapid short-term effectiveness, and a wide range of formulation materials [7], and are commonly used for the reclamation of mildly and moderately salt-affected soils. Among them, humic acid-based and gypsum-based materials are widely used amendments for salt-affected soil improvement.
Humic acid (HA) is a class of macromolecular organic substances widely present in nature. It is rich in active functional groups, such as carboxyl and phenolic hydroxyl groups, and exhibits strong complexation, adsorption, and ion-exchange capacities [8]. However, due to differences in raw material sources and properties, its effectiveness in soil improvement varies considerably [9,10]. In recent years, extensive studies have investigated the influence of humic-acid-based amendments on soil infiltration behavior, physicochemical properties, and nutrient dynamics. Biochemical fulvic acid, a derivative of humic acid, has been shown to markedly enhance soil infiltration capacity, with both cumulative infiltration and infiltration rate increasing significantly as the application rate rises [11]. Moreover, humic acid exerts distinct regulatory effects on soil water movement and physicochemical attributes across different soil types. In sandy loam soils, HA can reduce the final infiltration rate [12]; in coastal saline soils, its application prolongs the infiltration time, increases infiltration volume and soil moisture content, but reduces the wetting front depth at a given time [13]. Compared with its influence on bulk density and initial water content, HA exerts a more pronounced effect on the wetting front in clay loam soils [14]. In soda saline–alkali soils, the application of coal-derived humic acid increases soil nutrient content while effectively reducing soil pH and alkalinity [15]. Appropriate HA application also enhances soil saturated hydraulic conductivity, reduces bulk density, and decreases the concentrations of water-soluble Na+ and Cl ions [16,17,18]. Simultaneously, it lowers electrical conductivity (EC) and sodium adsorption ratio (SAR), thereby improving soil fertility and nutrient status [19,20]. More importantly, humic acid not only alters ionic composition but also promotes the formation of soil aggregates, accelerates the leaching of surface salts, and consequently enhances the reclamation efficiency of saline–alkali soils [21].
Desulfurized gypsum is primarily composed of calcium sulfate (CaSO4) and functions as an effective soil amendment in saline–alkali environments through salt exchange and ion substitution processes [22]. The Ca2+ supplied by gypsum replaces exchangeable Na+ on soil colloids, thereby improving the soil aggregate structure, increasing porosity, and enhancing salt leaching efficiency in coastal saline soils [22]. Previous studies have demonstrated that the application of desulfurized gypsum in oasis saline lands can significantly increase soil porosity while reducing bulk density, pH, electrical conductivity (EC), and the concentrations of Na+ and K+ [23]. Moreover, the SO42− ions released from gypsum can replace CO32− in soda saline–alkali soils, resulting in a marked reduction in soil pH and sodium adsorption ratio (SAR) within the 0–20 cm layer, as well as a significant improvement in sunflower germination rate and yield [24,25,26,27]. Gypsum application has also been reported to enhance the stability of water-stable aggregates [28], promote soil water movement [29], and increase cumulative infiltration, infiltration rate, sorptivity, steady-state infiltration rate, and empirical indices [30]. However, the response of saline-alkali soils to gypsum varies across regions. For example, in the Yinbei saline area, gypsum application reduced cumulative infiltration and the wetting front distance [31]. Additionally, due to the relatively low solubility of gypsum, large quantities of irrigation water are required for effective salt leaching; excessive water input may even elevate soil pH [32]. Overapplication of gypsum can lead to excessive salt accumulation, thereby increasing the total soil salinity [33].
At present, research on humic-acid-based and gypsum-based amendments has mainly focused on improving the infiltration characteristics and cumulative infiltration of saline-alkali soils, predominantly under deionized or ultrapure water irrigation conditions. However, studies addressing the combined effects of highly mineralized saline water irrigation and different soil amendments remain limited, particularly in the context of freshwater scarcity. Moreover, the mechanisms by which different amendments influence soil infiltration behavior and salt distribution in typical arid-zone saline-alkali soils are still not well understood. Considering the widespread saline-alkali land, limited freshwater availability, and abundant saline water resources in the Gobi region of Hami, Xinjiang, this study conducted one-dimensional vertical soil column experiments to systematically evaluate the effects of sodium humate and desulfurized gypsum, applied at varying dosages, on soil infiltration processes under different saline water mineralization levels. Representative infiltration models were used to simulate and optimize the water infiltration process. Additionally, the distribution characteristics of basic soil ions were analyzed to elucidate the differences in salt-regulation mechanisms among the amendments. The findings aim to provide a scientific basis and practical guidance for the efficient utilization of highly mineralized saline water and the improvement of saline-alkali soils in arid regions.

2. Materials and Methods

2.1. Experimental Materials

Soil samples used in this study were collected on 16 September 2024 from the 0–20 cm surface layer of an ecological forest field located near the mining area of China Coal Hami Power Generation Co., Ltd., Yizhou District, Hami City, Xinjiang, China (42.32° N, 93.34° E). A general overview of the sampling site is shown in Figure 1. The soil particle size distribution and basic physicochemical properties of the tested soil are presented in Table 1 and Table 2. According to the USDA soil texture classification standard, the soil texture type was classified as sand. The electrical conductivity (EC1:5) of the soil extract at a soil–water ratio of 1:5 was 5.29 mS·cm−1, and the soil pH was 8.73. The salinity level of the field irrigation water was 16 g/L, and its initial ionic composition is shown in Table 3. The saline solutions used in the experiment were prepared according to the initial ionic composition of mine water used for field irrigation. First, based on the target mineralization level of 16 g/L, specific amounts of analytical-grade reagents, including NaCl, CaCl2, MgCl2, Na2SO4, NaHCO3, and KCl, were weighed and added to freshwater. The reagents were fully dissolved under continuous stirring to obtain a solution with a mineralization of 16 g/L. On this basis, freshwater was added to the 16 g/L solution for dilution at saline water-to-freshwater ratios of 1:1 and 2:1, yielding experimental solutions with mineralization levels of 8 g/L and 12 g/L, respectively. The theoretical amounts of chemical reagents corresponding to each mineralization level are shown in Table 4. This preparation method ensured that the irrigation water used in the laboratory experiment could adequately reflect local field irrigation conditions in terms of both mineralization level and ionic composition. In this study, irrigation water salinity refers to the total dissolved salt content in irrigation water, expressed in g/L. Two soil amendments were used in the experiment: desulfurized gypsum (white powder) and sodium humate (black powder, readily soluble in water).

2.2. Experimental Design

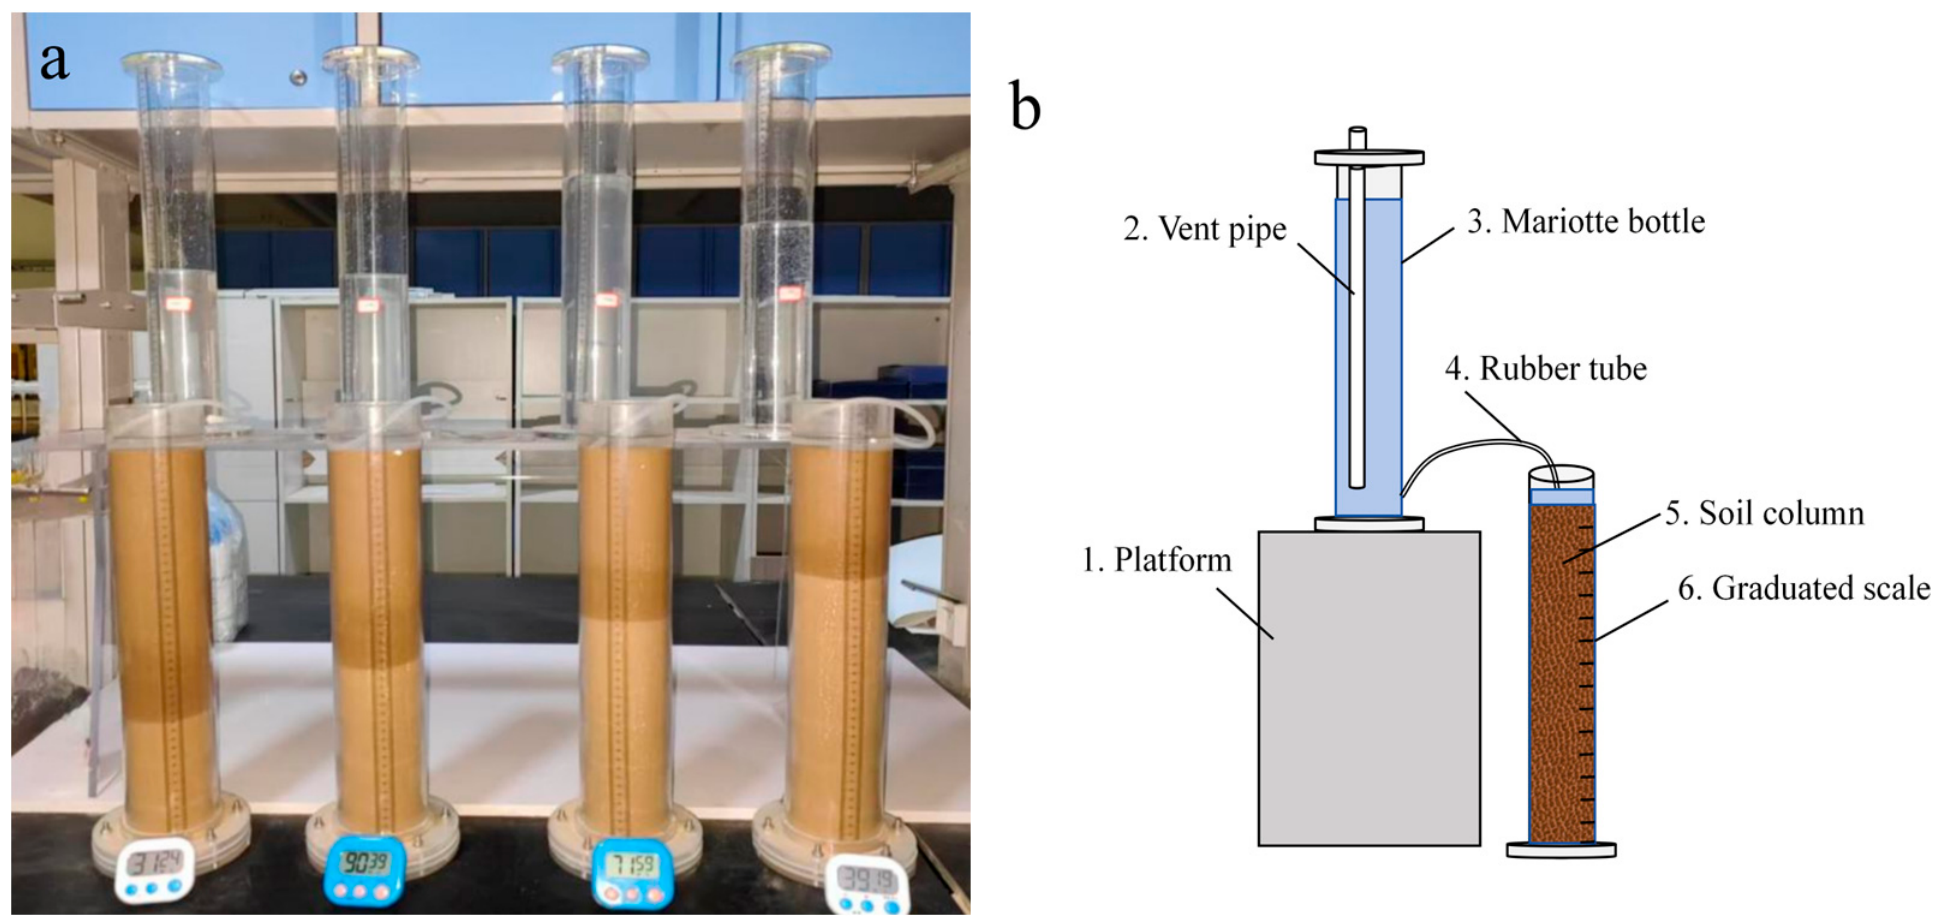
The experiment was conducted in the Agricultural Hydraulic Engineering Laboratory of Xinjiang Agricultural University. A one-dimensional constant-head vertical infiltration apparatus was employed, consisting of two main components: a soil column and a Mariotte bottle, as illustrated in Figure 2. Both the soil column and the Mariotte bottle were made of transparent acrylic (organic glass). The soil column was 50 cm in height with an inner diameter of 8 cm, while the Mariotte bottle was 50 cm high with an inner diameter of 7 cm. Graduated scales were attached to the sidewalls of both components to facilitate accurate observation and measurement. A total of 36 treatments were established, each replicated three times (Table 5). Air-dried soil was packed into the columns in 5 cm increments, forming nine layers with a total height of 45 cm, at a bulk density of 1.62 g/cm3, corresponding to the field bulk density. The surface of each soil layer was gently roughened before adding the next to minimize preferential flow, and the soil was compacted layer by layer to avoid voids. A piece of filter paper was placed on the surface to prevent scouring during infiltration. Throughout the infiltration process, the water head was maintained constant at 2 cm. Water level readings from the Mariotte bottle and the wetting front depth in the soil column were recorded using a stopwatch, every 1 min for the first 30 min and every 5 min thereafter, following the principle of increasing time intervals. When the wetting front reached a depth of 30 cm (i.e., two-thirds of the total soil column height), the water supply was stopped, and any remaining surface water was drained. Subsequently, soil samples from each layer were collected using a soil auger to determine gravimetric water content and electrical conductivity (EC), from which the soil salinity was calculated.

2.3. Measurements and Methods

2.3.1. Cumulative Infiltration and Wetting Front

The cumulative infiltration was calculated based on the variation in the water level of the Mariotte bottle recorded during the infiltration process. The wetting front depth was determined by visually observing the position of the advancing wetting front along the graduated scale on the side of the soil column.

2.3.2. Soil Salt Content and Desalination Rate

Soil salinity was determined using the electrical conductivity method. Soil samples were collected using a soil auger from the 0–5, 5–10, 10–15, 15–20, 20–25, and 25–30 cm layers. Six soil samples were obtained from each soil column. The samples were oven-dried at 105 °C to constant weight, ground, and passed through a 2 mm sieve prior to analysis. For salinity determination, 10 g of air-dried soil was mixed with 50 mL of distilled water to prepare a soil–water extract at a ratio of 1:5 (w/v). The suspension was thoroughly stirred and allowed to stand for 12 h. The electrical conductivity (EC1:5) of the extract was measured using a Leici DDSJ-307F conductivity meter (Shanghai INESA Scientific Instrument Co., Urumqi, China.). Based on the calibration relationship between electrical conductivity (EC) and soil salt content, the EC values of soil samples with different salinity levels and their corresponding salt contents were measured. A linear regression analysis was then performed to establish the relationship between them, yielding the following conversion equation:
y = 3.7823x + 0.8898
where y represents soil salinity (g·kg−1) and x represents the measured electrical conductivity (mS·cm−1).
The relative desalination rate and relative salt accumulation rate were calculated based on soil salinity values. The difference in soil salinity between each treatment and the corresponding control was divided by the soil salinity of the control treatment. A positive value indicates a relative salt accumulation rate, whereas a negative value indicates a relative desalination rate [3].

2.3.3. Soil Ion Composition and Salinization Indices

Water-soluble K+, Ca2+, Na+, and Mg2+ in soil extracts from each soil layer were determined using atomic absorption spectrometry with a Hitachi Z-2010 atomic absorption spectrophotometer (Tokyo, Japan) [34]. Cl and HCO3 were determined by titration, with Cl measured using the silver nitrate titration method and HCO3 measured by acid-base titration using phenolphthalein and methyl orange as indicators. SO42− was determined by spectrophotometry [35].
The standard calculation of the sodium adsorption ratio (SAR) is typically based on ionic concentrations in the saturated paste extract. In this study, however, Ca2+, Na+, and Mg2+ were measured as water-soluble ion contents expressed in mg·kg−1. Therefore, the measured values were converted into solution concentrations (mmol·L−1) according to the soil–water extraction ratio and subsequently used for SAR calculation. The obtained SAR values were primarily used for relative comparative analysis among different treatments.
The sodium adsorption ratio (SAR), expressed in (mmol·L−1)1/2, was calculated using the following equation:
S A R = N a + 0.5 ( C a 2 + + M g 2 + )
The exchangeable sodium percentage (ESP), also referred to as the alkalization degree, is a key indicator for evaluating the extent of soil sodification. A higher ESP indicates a greater degree of soil alkalization. According to the commonly used classification standard in China, soils are categorized as follows: non-alkaline (ESP < 3%), slightly alkaline (3% < ESP < 10%), moderately alkaline (10% < ESP < 20%), strongly alkaline (20% < ESP < 35%), and alkali soil (ESP > 35%) [31]. The empirical formula proposed by the U.S. Department of Agriculture [36] for calculating ESP is
E S P = ( 0.0126 + 0.01475 × S A R ) 1 + ( 0.0126 + 0.01475 × S A R )
The total exchangeable bases (TEB) represent the sum of all exchangeable basic cations in the soil and were calculated as:
T E B = K + + N a + + C a 2 + + M g 2 +

2.4. Infiltration Models

To evaluate the applicability of different infiltration models under varying salinity levels and amendment application rates, the Philip [37], Kostiakov [38], and Horton [39,40] models were employed to simulate the soil water infiltration process using their cumulative infiltration formulations. Under short infiltration duration conditions, Equation (5) can be simplified to Equation (6). The expressions of cumulative infiltration as a function of time for each model are given in Equations (6), (7), and (9), respectively, as follows:
I ( t ) = S t 0.5 + A t
I ( t ) = S t 0.5
I ( t ) = K t n
i ( t ) = i c + ( i 0 i c ) e k t
I ( t ) = i c t + i 0 i c k ( 1 e k t )
where I(t) is the cumulative soil infiltration amount (cm); S is the soil sorptivity (cm/min0.5); A is the stable infiltration rate (cm/min); K is the empirical infiltration coefficient (cm/min); n is the infiltration exponent; t is the infiltration time (min); and i c , i 0 and k are empirical parameters.

2.5. Data Processing and Statistical Analysis

Data processing and calculation were performed using Microsoft Excel 2019, while one-way and two-way analysis of variance (ANOVA) was conducted using SPSS Statistics 22. Model fitting and graphical visualization were carried out using Origin 2024. Each treatment in the experiment was replicated three times.
To compare and evaluate the performance of the Philip, Kostiakov, and Horton models, the coefficient of determination (R2), adjusted coefficient of determination ( R a d j 2 ) [41], and global performance indicator (GPI) [42] were used for comprehensive assessment based on the fitting results between the simulated and measured values. The ideal values of these indicators are 1, 1, and 0, respectively. The optimal infiltration model was determined according to the degree of agreement between the measured and fitted values.
The calculation formulas for the coefficient of determination (R2) and adjusted coefficient of determination ( R a d j 2 ) are as follows:
R 2 = 1 i = 1 N ( O i S i ) 2 i = 1 N ( O i O i ¯ ) 2
R a d j 2 = 1 ( 1 N S E ) × N 1 N P 1
where O i , S i represent the mean values of the measured and simulated values, respectively; N is the number of samples corresponding to each treatment, and P is the number of model parameters.
The global performance indicator (GPI) was calculated as follows:
G P I = M B E × R M S E × U 95 × T S × ( 1 R 2 )
M B E = 1 N i = 1 N ( S i O i )
R M S E = 1 N i = 1 N ( S i O i ) 2
T S = M B E × N 1 R M S E 2 M B E 2
S D = 1 N 1 i = 1 N ( e i e ¯ ) 2
U 95 = 1.96 × R M S E 2 + S D 2
R 2 = i = 1 N ( O i O ¯ ) × ( S i S ¯ ) 2 i = 1 N ( O i O ¯ ) 2 × i = 1 N ( S i S ¯ ) 2
MBE is the mean bias error, RMSE is the root mean square error, U95 is the uncertainty at the 95% confidence level, and TS is the t-statistic.

3. Results

3.1. Effects of Amendment Concentration on Soil Infiltration Characteristics Under Different Salinity Levels

3.1.1. Temporal Variation in the Wetting Front

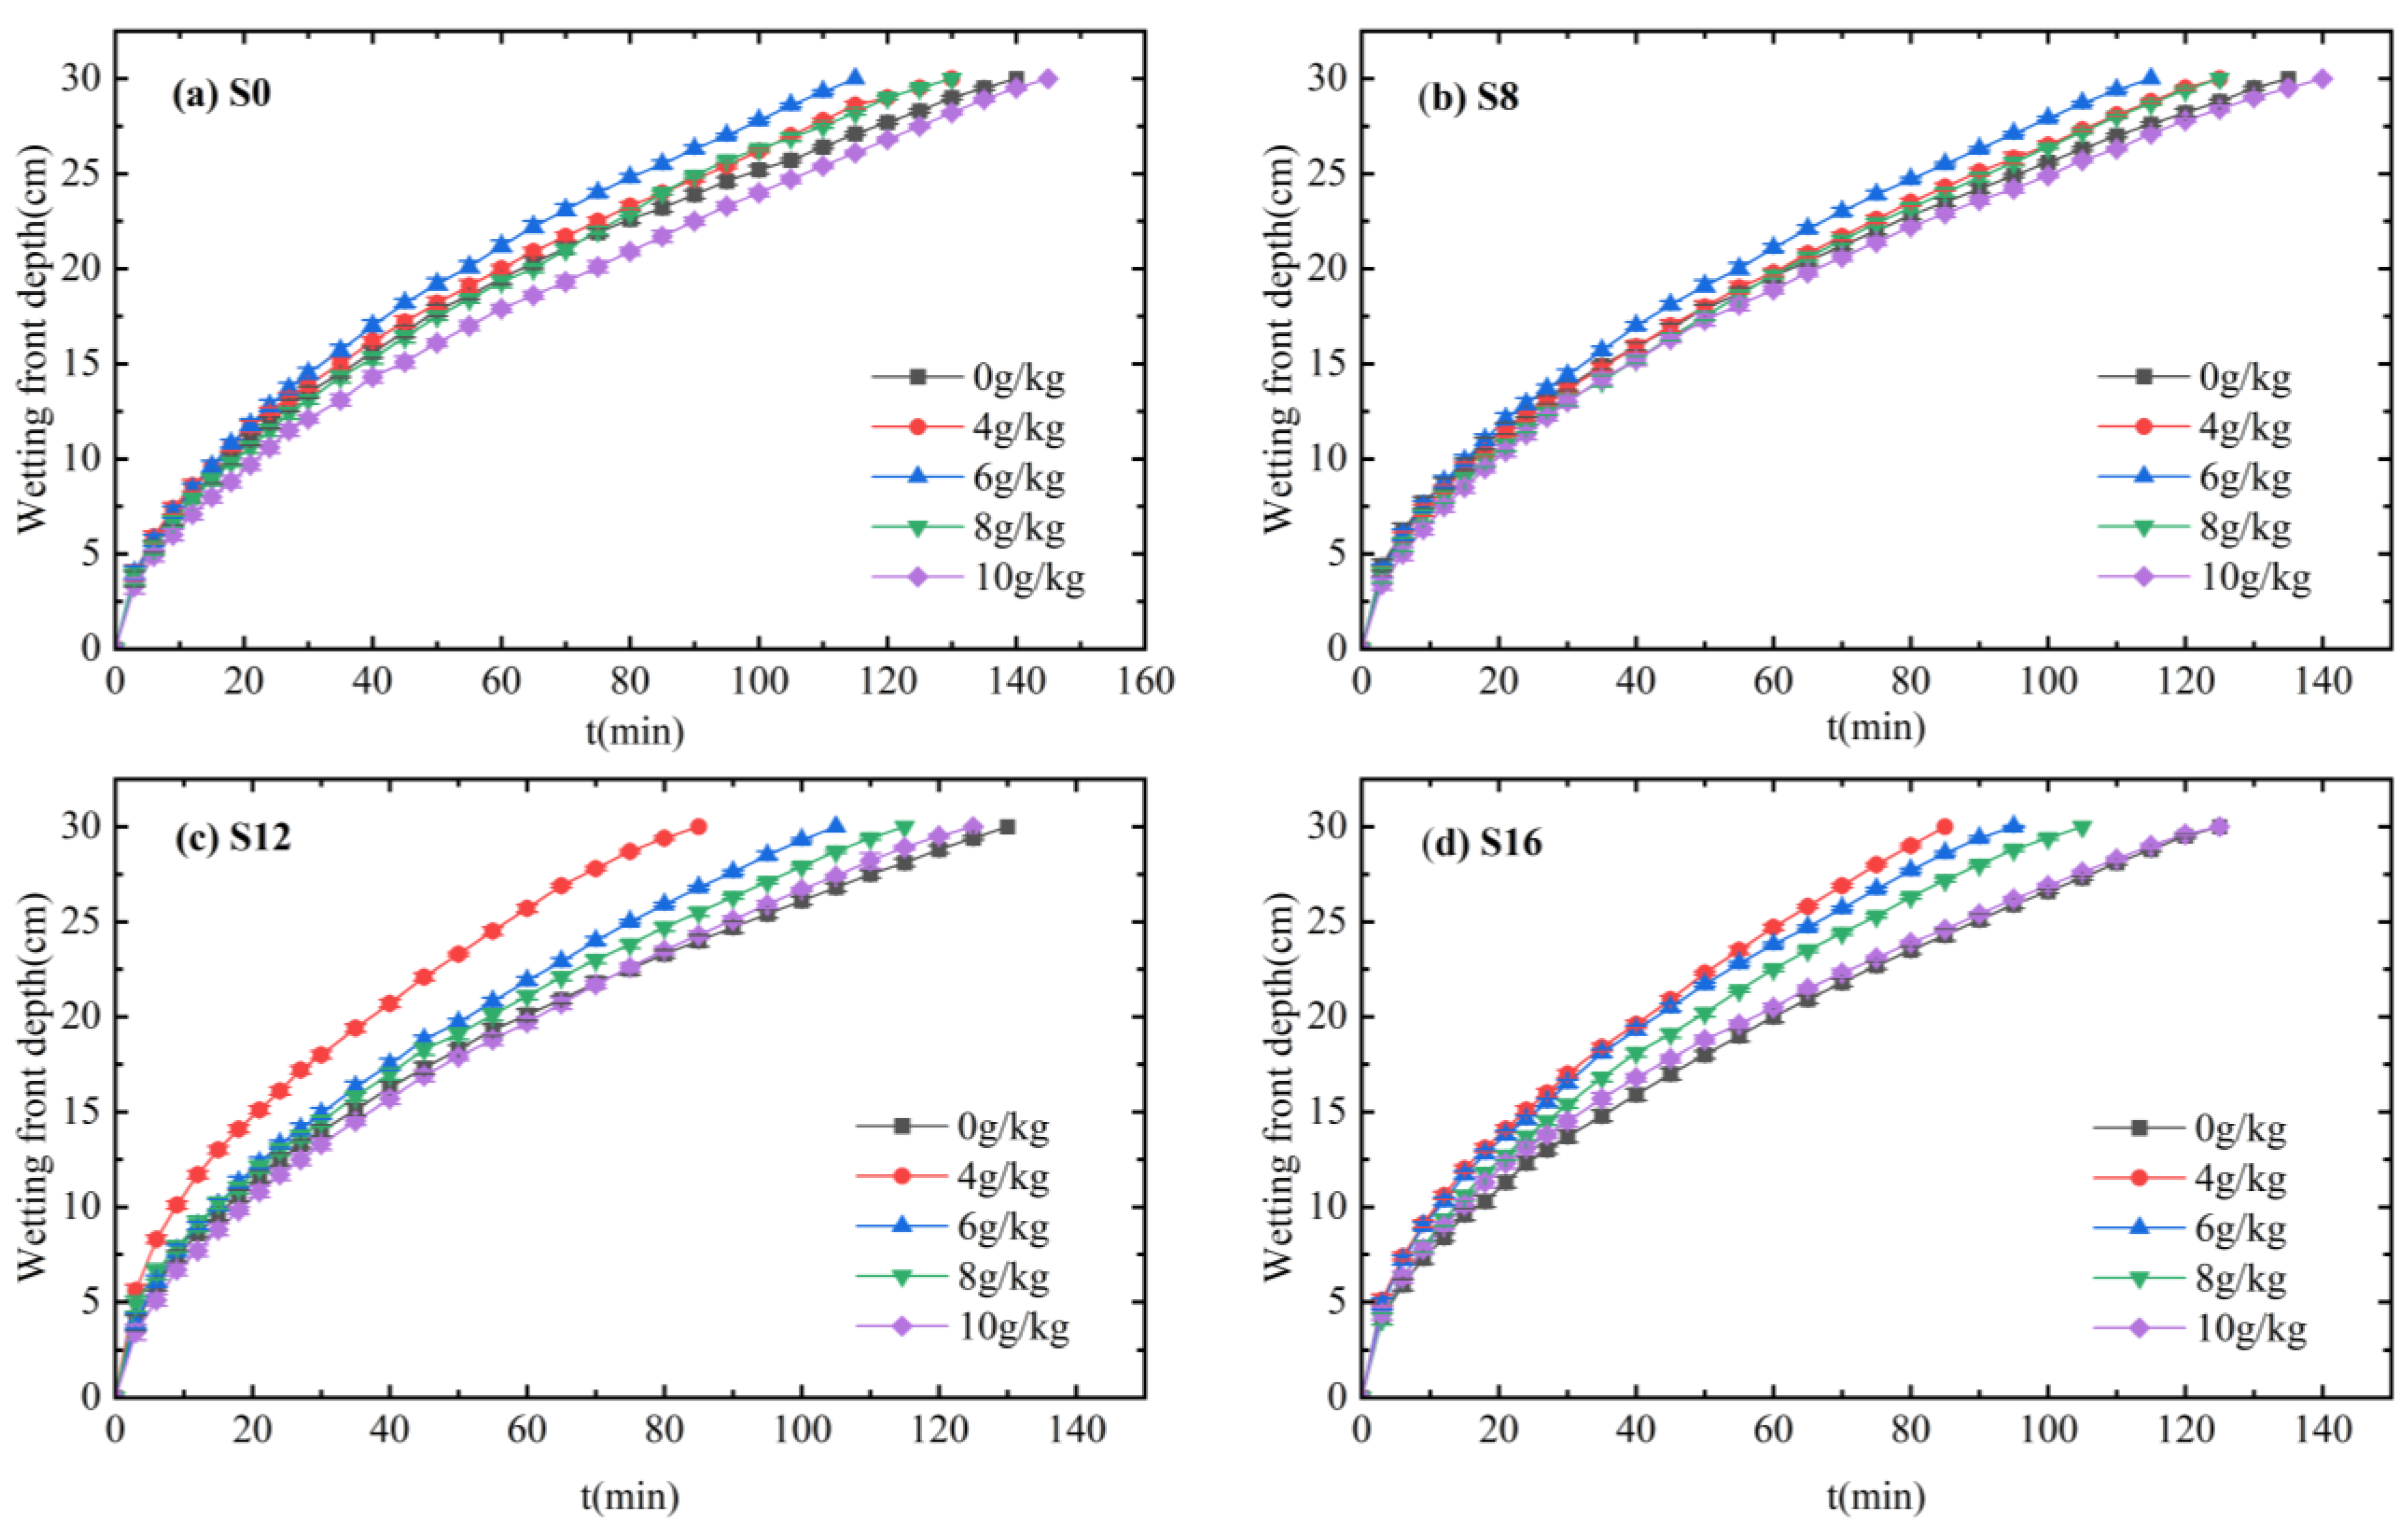
The variation in wetting front depth with infiltration time under different water mineralization levels (0, 8, 12, and 16 g/L) and sodium humate application rates is shown in Figure 3. At the early stage of infiltration, the wetting front advanced rapidly, and differences among treatments were minimal. As infiltration progressed, the advancement rate of the wetting front gradually decreased, and significant differences emerged among treatments (p < 0.05). After 85 min of infiltration, compared with the control (T1), the wetting front depths under the 0 g/L mineralization condition increased by 3.45%, 9.91%, 3.45%, and −6.47% for sodium humate application rates of 4, 6, 8, and 10 g/kg, respectively. Under 8 g/L mineralization, the wetting front depths were 3.40%, 8.51%, 2.13%, and −2.55% higher than those of the control (T2). For 12 g/L mineralization, the corresponding increases relative to the control (T3) were 25.00%, 11.67%, 6.25%, and 1.25%, while at 16 g/L, the values increased by 23.46%, 17.70%, 11.93%, and 1.23% compared with the control (T4). Under mineralization levels of 0 and 8 g/L, the shortest infiltration duration and the fastest wetting front movement were observed under the 6 g/kg sodium humate treatment. However, when the mineralization level increased to 12 and 16 g/L, the optimal application rate decreased to 4 g/kg. Meanwhile, the difference in infiltration duration between the highest sodium humate application rate and the treatment with the shortest infiltration duration became larger. This indicates that, under high-mineralization conditions, higher application rates may adversely affect the pore structure, thereby reducing their ability to promote soil water infiltration.
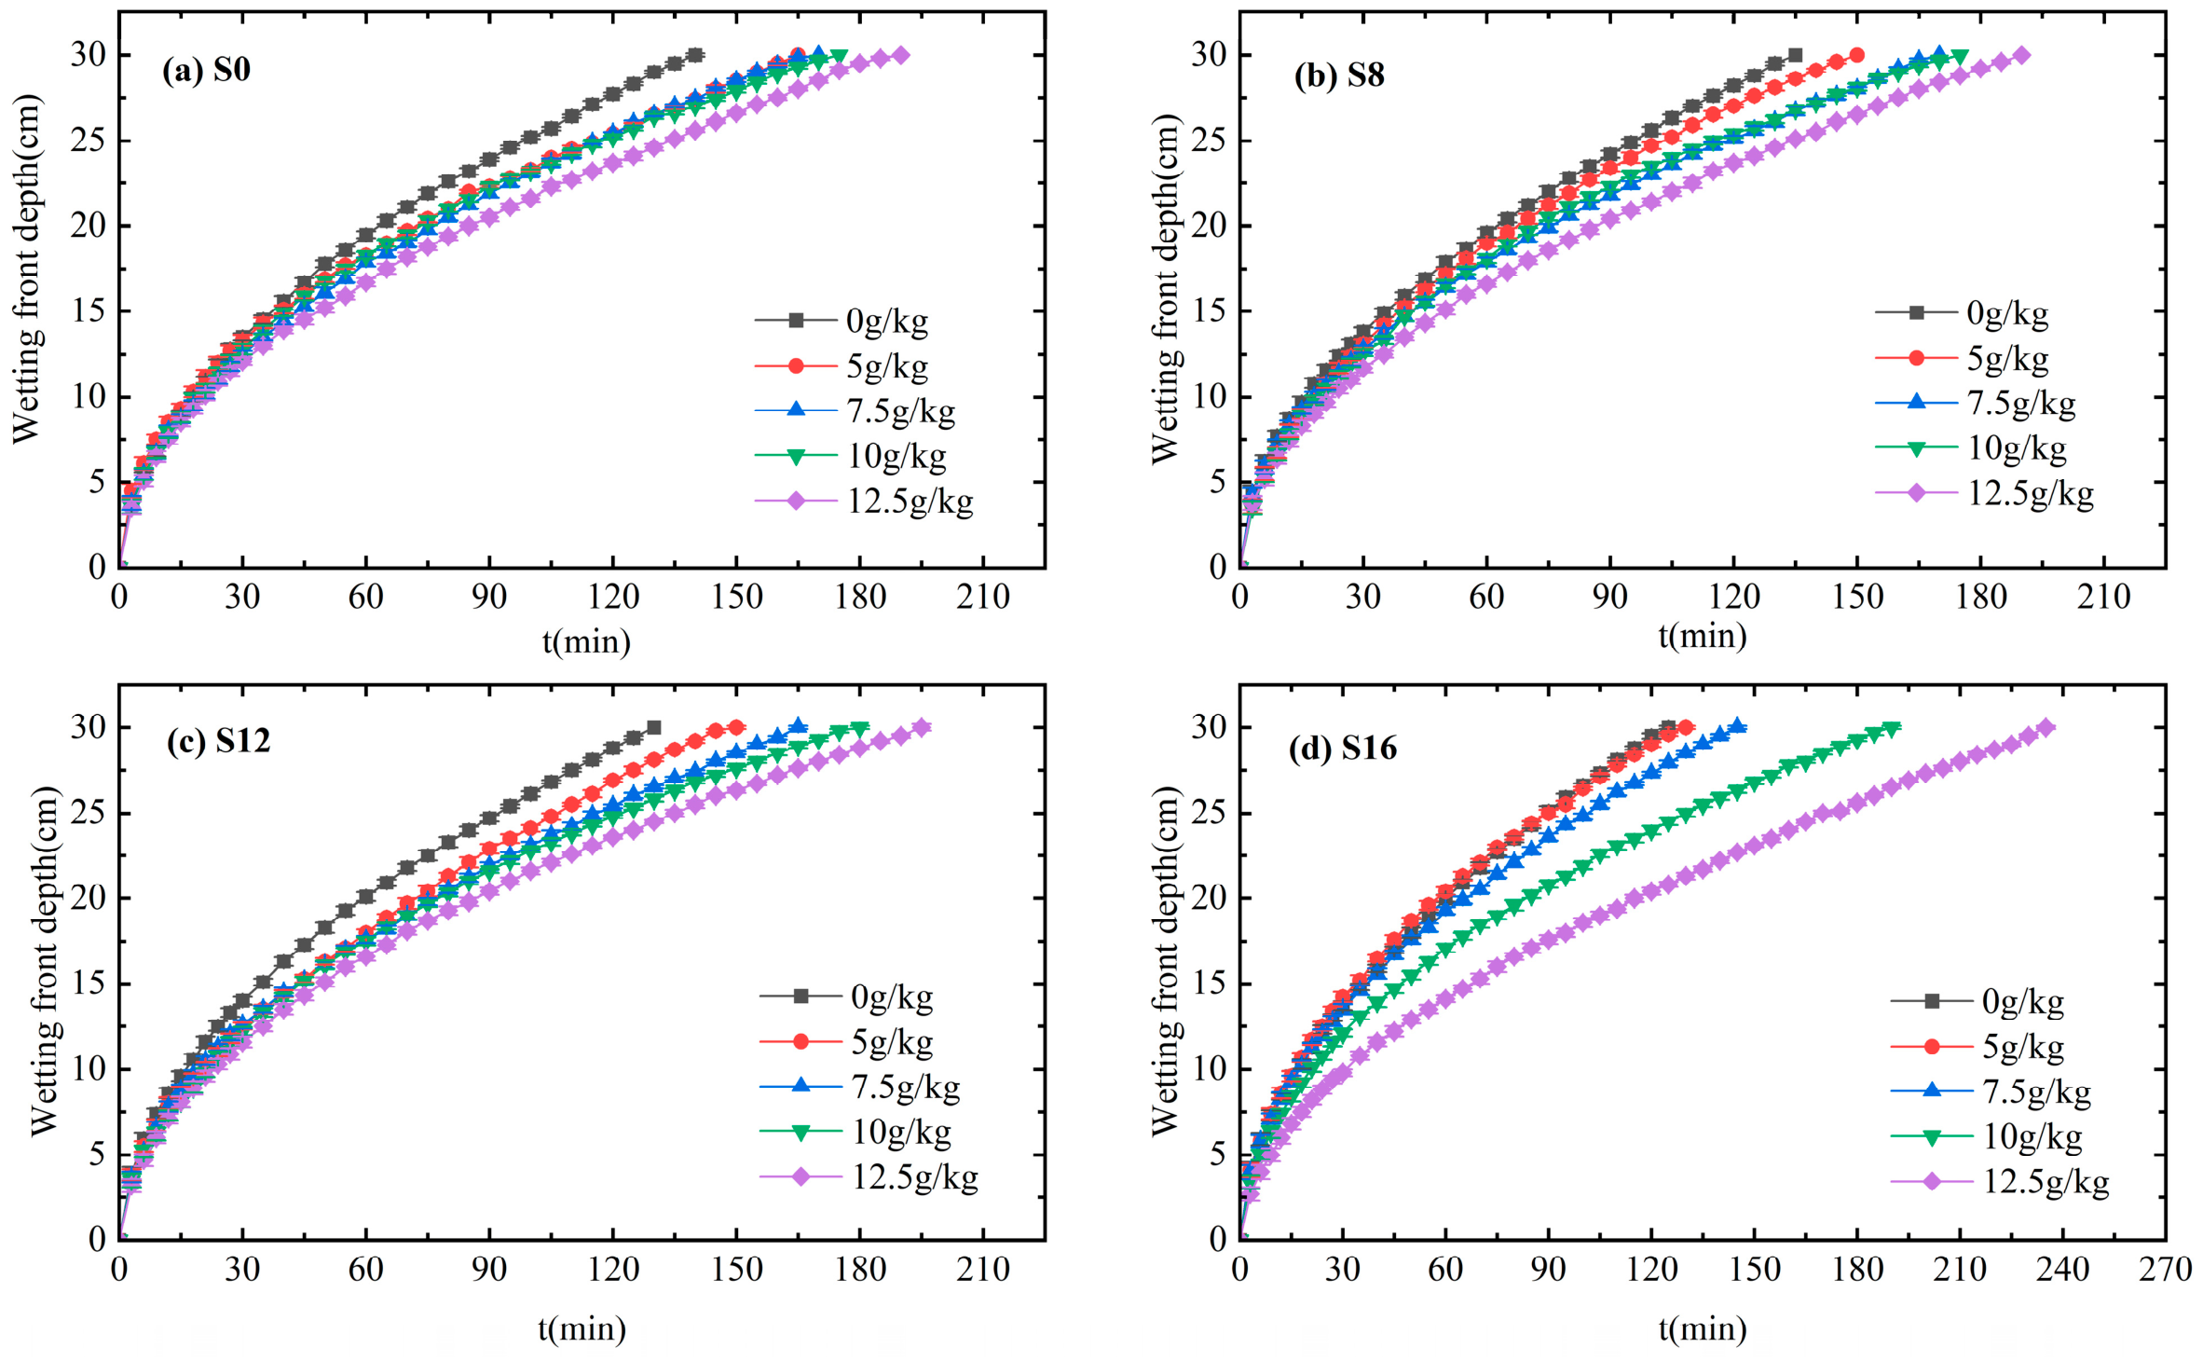
The variation in wetting front depth with infiltration time under different saline water mineralization levels and desulfurized gypsum application rates is shown in Figure 4. As illustrated in the figure, differences among treatments were negligible during the early infiltration stage but became apparent after 115 min. At an infiltration time of 85 min, compared with the control (T1), the wetting front depths under 0 g/L mineralization decreased by 5.2%, 7.3%, 6.9%, and 13.8% for gypsum application rates of 5, 7.5, 10, and 12.5 g/kg, respectively. Under 8 g/L mineralization, the corresponding decreases relative to the control (T2) were 3.4%, 9.8%, 7.7%, and 15.7%. For 12 g/L mineralization, the wetting front depths declined by 7.9%, 11.7%, 12.5%, and 17.5% compared with the control (T3). When the mineralization increased to 16 g/L, the reductions relative to the control (T4) were 0.4%, 6.17%, 16.87%, and 29.63%, showing significant differences among treatments (p < 0.05). Overall, under the same mineralization condition, an increase in gypsum application rate progressively prolonged infiltration duration and slowed the advancement of the wetting front, indicating that desulfurized gypsum tends to reduce infiltration velocity as its dosage increases.

3.1.2. Fitting of Soil Water Infiltration Process

Under irrigation mineralization levels of 0, 8, 12, and 16 g/L, the fitted equations and evaluation indicators of the Philip, Kostiakov, and Horton infiltration models are presented in Table 6, Table 7, Table 8 and Table 9, respectively. The application of sodium humate generally increased the sorptivity parameter S in the Philip model, indicating that it enhanced the initial soil infiltration capacity. However, when the application rate increased to 10 g/kg, the S value decreased instead. In contrast, the application of desulfurized gypsum generally reduced the parameter S. In the Kostiakov model, the parameters K and n reflect the soil infiltration capacity and the variation characteristics of infiltration rate with time, respectively, and their values varied markedly among different treatments. The application of sodium humate generally increased the empirical coefficient K, suggesting an enhancement of the initial soil infiltration capacity. However, under desulfurized gypsum treatments, the K value showed an overall decreasing trend. Compared with treatment T4, the 12.5 g/kg desulfurized gypsum treatment (T36) reduced the K value by 25.19%, further indicating that desulfurized gypsum exerted a certain inhibitory effect on soil infiltration capacity.
Overall, all three models could effectively describe the soil infiltration process under different mineralization levels and amendment treatments. The coefficient of determination (R2) and adjusted coefficient of determination were generally high, indicating good fitting performance, whereas the global performance indicator (GPI) showed differences among models. Under the 0 g/L mineralization condition, the adjusted coefficients of determination of the Philip, Kostiakov, and Horton models ranged from 0.8761 to 0.9820, 0.9928 to 0.9988, and 0.9748 to 0.9927, respectively. Their GPI values ranged from 2.121 × 10⁻³ to 5.103 × 10⁻¹, 4.998 × 10⁻⁹ to 1.058 × 10⁻⁵, and 1.755 × 10⁻⁸ to 2.438 × 10⁻⁴, respectively. Under the 8 g/L mineralization condition, the adjusted coefficients of determination of the Philip, Kostiakov, and Horton models ranged from 0.8450 to 0.9465, 0.9938 to 0.9989, and 0.9779 to 0.9897, respectively. Their GPI values ranged from 4.326 × 10⁻² to 5.035 × 10⁻¹, 2.240 × 10⁻⁸ to 4.096 × 10⁻⁶, and 2.141 × 10⁻⁶ to 8.690 × 10⁻⁵, respectively. Under the 12 g/L mineralization condition, the adjusted coefficients of determination of the Philip, Kostiakov, and Horton models ranged from 0.9054 to 0.9795, 0.9945 to 0.9977, and 0.9819 to 0.9942, respectively. Their GPI values ranged from 3.141 × 10⁻³ to 1.728 × 10⁻¹, 3.368 × 10⁻⁸ to 5.307 × 10⁻⁶, and 1.505 × 10⁻⁶ to 3.508 × 10⁻⁵, respectively. Under the 16 g/L mineralization condition, the adjusted coefficients of determination of the Philip, Kostiakov, and Horton models ranged from 0.9158 to 0.9841, 0.9901 to 0.9987, and 0.9839 to 0.9940, respectively. Their GPI values ranged from 1.619 × 10⁻³ to 1.241 × 10⁻¹, 5.278 × 10⁻⁹ to 2.166 × 10⁻⁵, and 2.544 × 10⁻⁶ to 3.185 × 10⁻⁵, respectively. In general, the adjusted coefficients of determination of the Philip, Kostiakov, and Horton models ranged from 0.8450 to 0.9841, 0.9901 to 0.9989, and 0.9748 to 0.9942, respectively, while their GPI values ranged from 1.619 × 10⁻³ to 5.103 × 10⁻¹, 4.998 × 10⁻⁹ to 2.166 × 10⁻⁵, and 1.505 × 10⁻⁶ to 2.438 × 10⁻⁴, respectively.
Although the Philip model could capture the general variation trend of the infiltration process, its fitting performance was relatively lower than that of the other two models, and its GPI values were relatively higher. The Horton model showed relatively high fitting accuracy and smaller GPI values under low-mineralization conditions, indicating a certain adaptability to the infiltration process under specific conditions. The Kostiakov model exhibited the best fitting performance, with consistently high adjusted coefficients of determination under different mineralization levels, all exceeding 0.99. In addition, its corresponding GPI values were generally the lowest, indicating clear advantages in both fitting accuracy and overall performance. Furthermore, the evaluation results of the three models showed consistent trends under different mineralization levels, suggesting that the ranking of model performance was not affected by changes in mineralization. Taken together, the Kostiakov model demonstrated good stability and applicability under different mineralization levels and amendment treatments, and can therefore be considered the optimal model for describing the soil infiltration process under the experimental conditions.

3.2. Effects of Amendment Concentration on Soil Salinity Under Different Mineralization Levels

3.2.1. Effect of Sodium Humate on Soil Salt Distribution

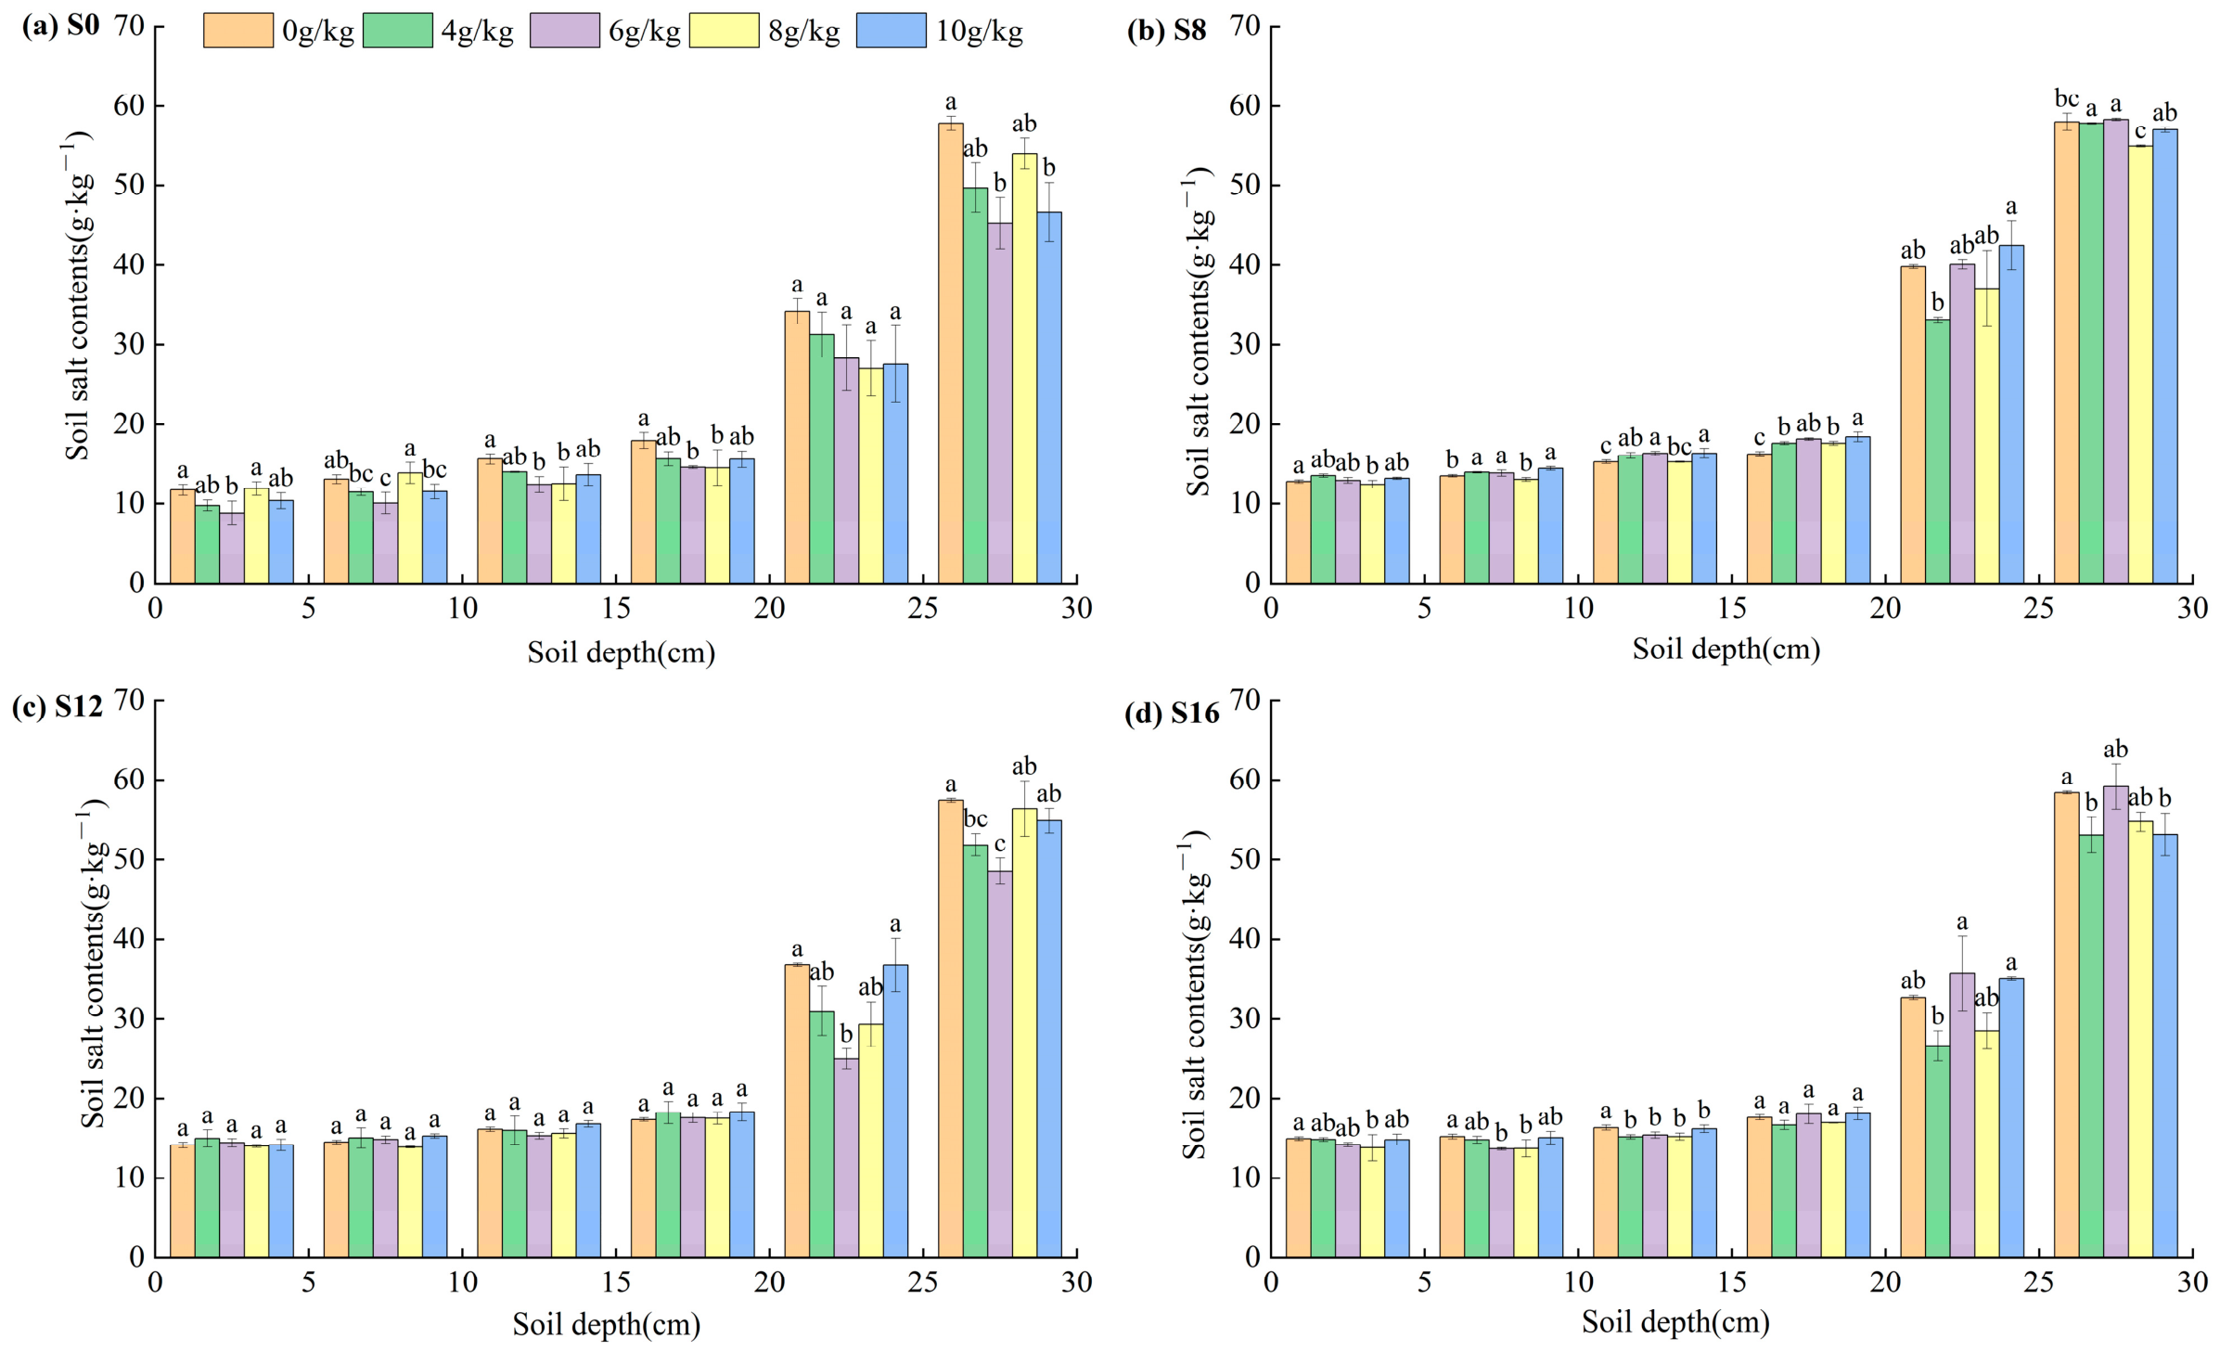
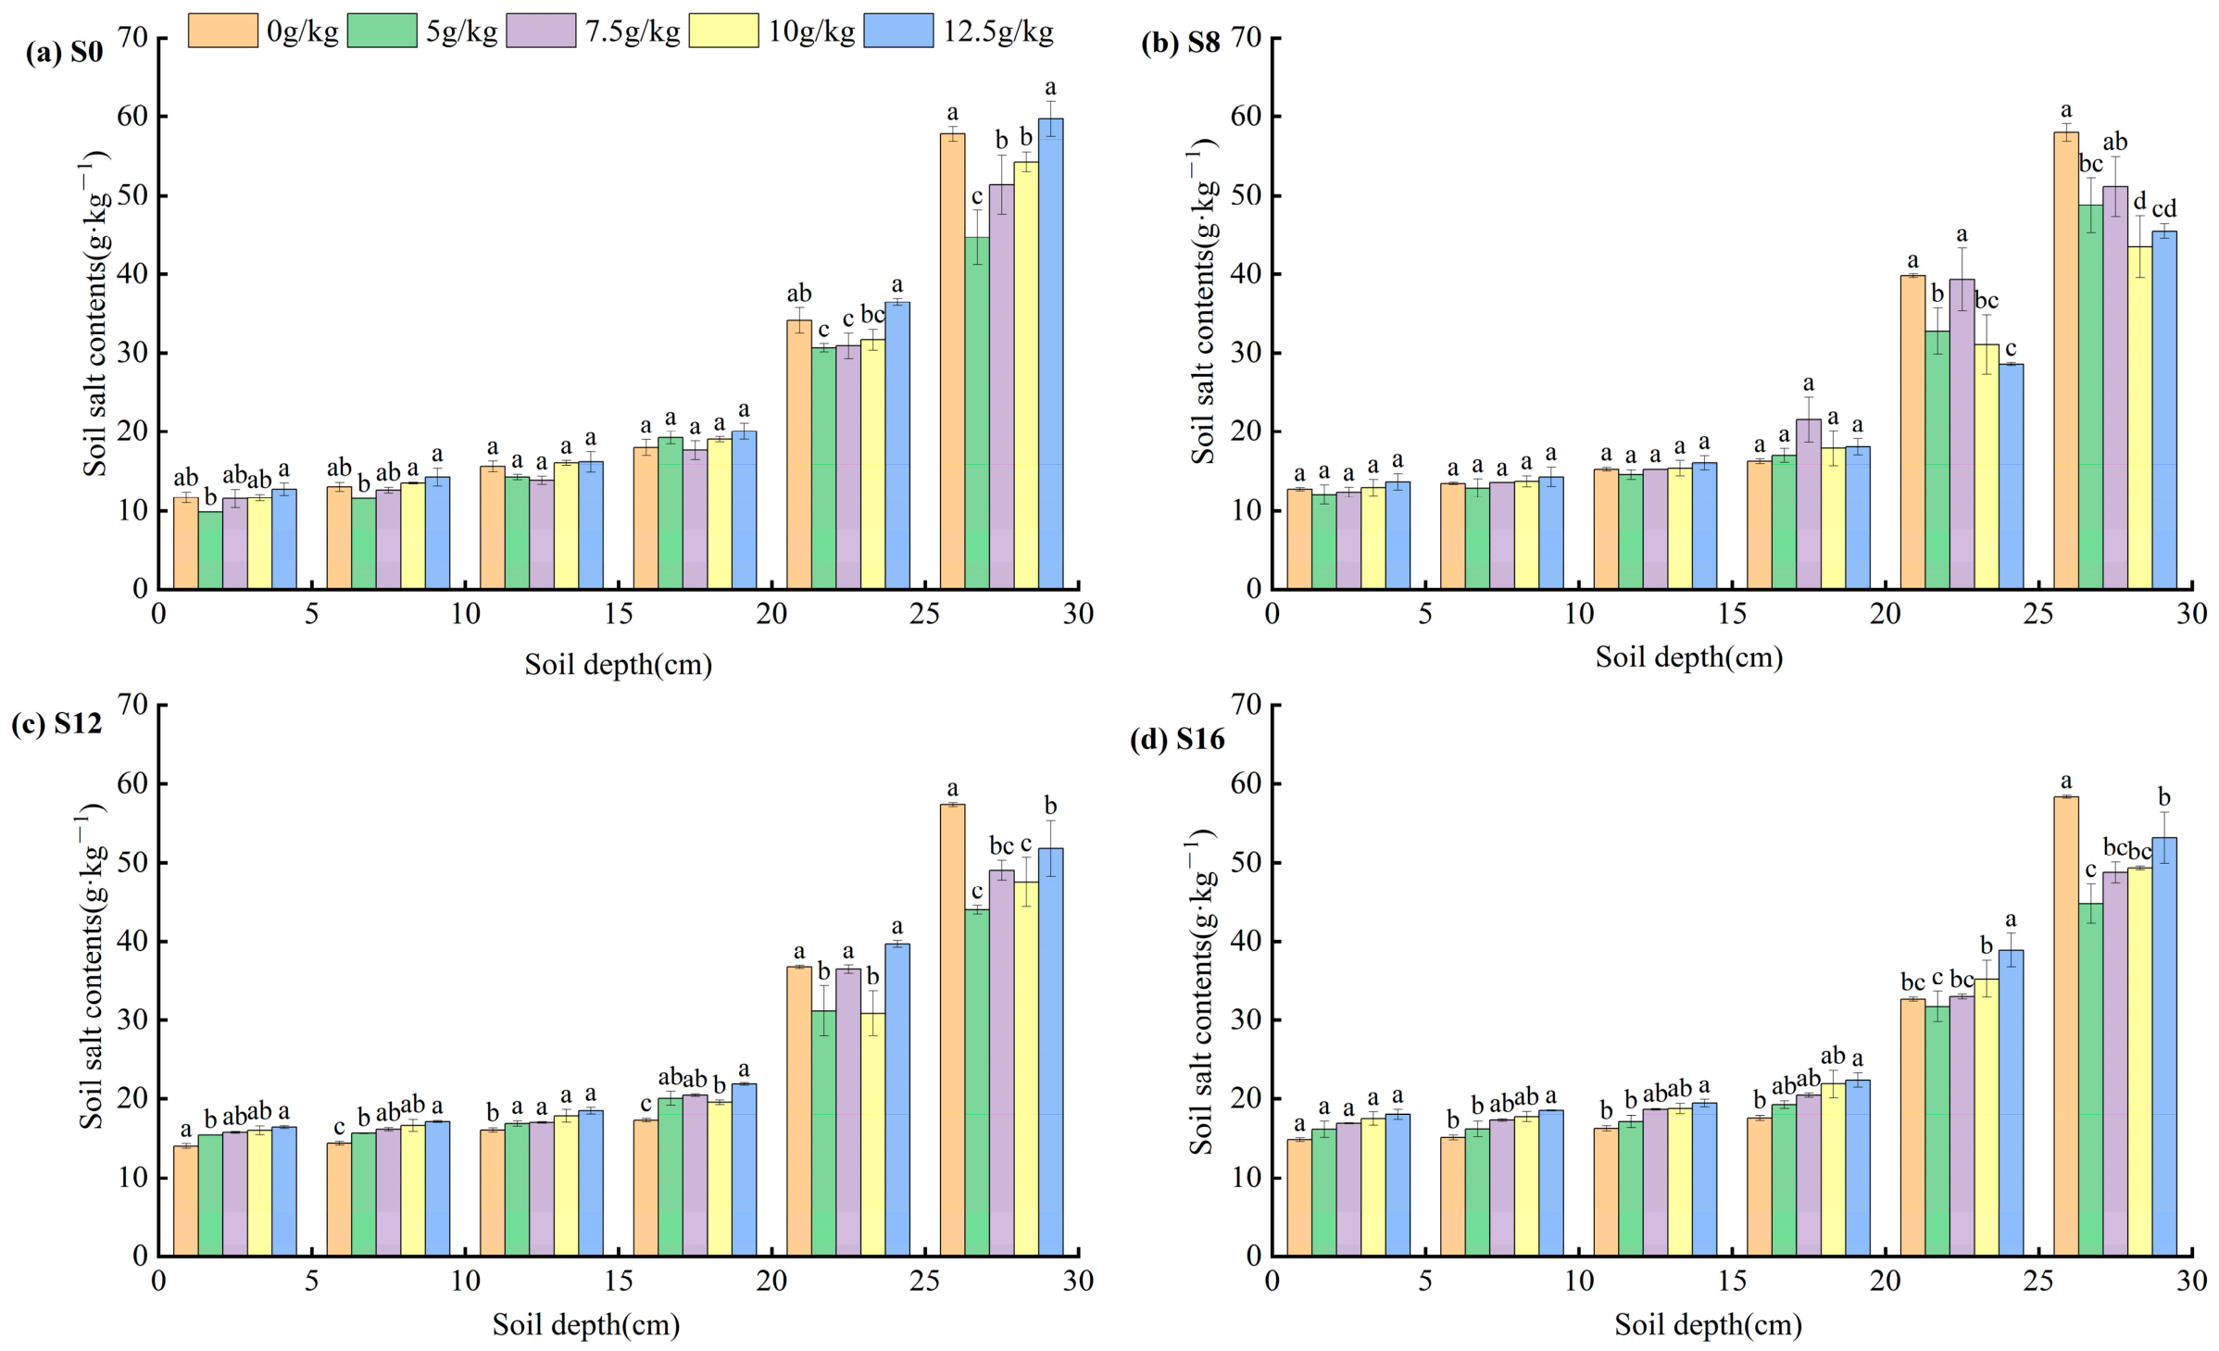
The variations in soil salt content under different sodium humate application rates are shown in Figure 5. After water infiltration, salts migrated downward with the movement of soil water, leading to a decrease in salt content in the surface layer and a significant accumulation in deeper layers. As irrigation water salinity increased, salt accumulation in each soil layer intensified, and the leaching effect of sodium humate gradually weakened. Under the same salinity condition, soil salinity increased progressively with depth. Under 0 g/L mineralization, all sodium humate treatments exhibited overall desalination within the 0–30 cm soil profile compared with the control (T1). The S0 + H6 treatment achieved the most pronounced desalination, with relative desalination rates of 23.64% and 19.77% in the 0–10 cm and 10–20 cm layers, respectively. Below 20 cm, the S0 + H8 treatment showed the greatest desalination effect. Under 8 g/L and 12 g/L mineralization, compared with the controls (T2 and T3), sodium humate application slightly promoted salt accumulation in the 0–20 cm layer. However, at 12 g/L, all sodium humate treatments markedly reduced salt content in the 20–30 cm layer. The S12 + H6 treatment exhibited the most significant desalination, with a relative desalination rate of 32.08% in the 20–25 cm layer (p < 0.05). In the 16 g/L salinity treatment, compared with the control (T4), all sodium humate application treatments generally reduced soil salinity in the surface layers, with the S16 + H4 treatment showing the best relative desalination effect.

3.2.2. Effect of Desulfurized Gypsum on Soil Salt Distribution

The variations in soil salt content under different desulfurized gypsum application rates are shown in Figure 6. As illustrated, soil salinity also migrated downward with water movement, resulting in salt accumulation with increasing mineralization level and soil depth. However, distinct differences in salt distribution were observed among treatments with varying irrigation salinity and gypsum application rates. Under 0 g/L mineralization, the application of 5 and 7.5 g/kg gypsum reduced soil salinity across all layers compared with the control (T1), while higher dosages (10 and 12.5 g/kg) led to relatively higher soil salt content. Under 8 g/L mineralization, gypsum slightly increased salt content in the upper layers but reduced salinity in deeper layers compared with the control (T2). The S8 + G10 treatment showed a significant desalination effect in the 25–30 cm layer, with a relative desalination rate of 24.99% (p < 0.05). At higher mineralization levels of 12 and 16 g/L, compared with the controls (T3 and T4), soil salt accumulation increased within the 10–20 cm layer, with relative accumulation rates ranging from 10.49% to 20.59% and 7.30% to 23.24%, respectively. In contrast, below 20 cm, the 5 g/kg gypsum treatment exhibited a notable desalination effect. Specifically, in the 25–30 cm layer, soil salt content under S12 + G5 and S16 + G5 treatments decreased by 23.26% and 23.24%, respectively, compared with their corresponding controls (T3 and T4).

3.3. Ionic Composition and Distribution After Desalination

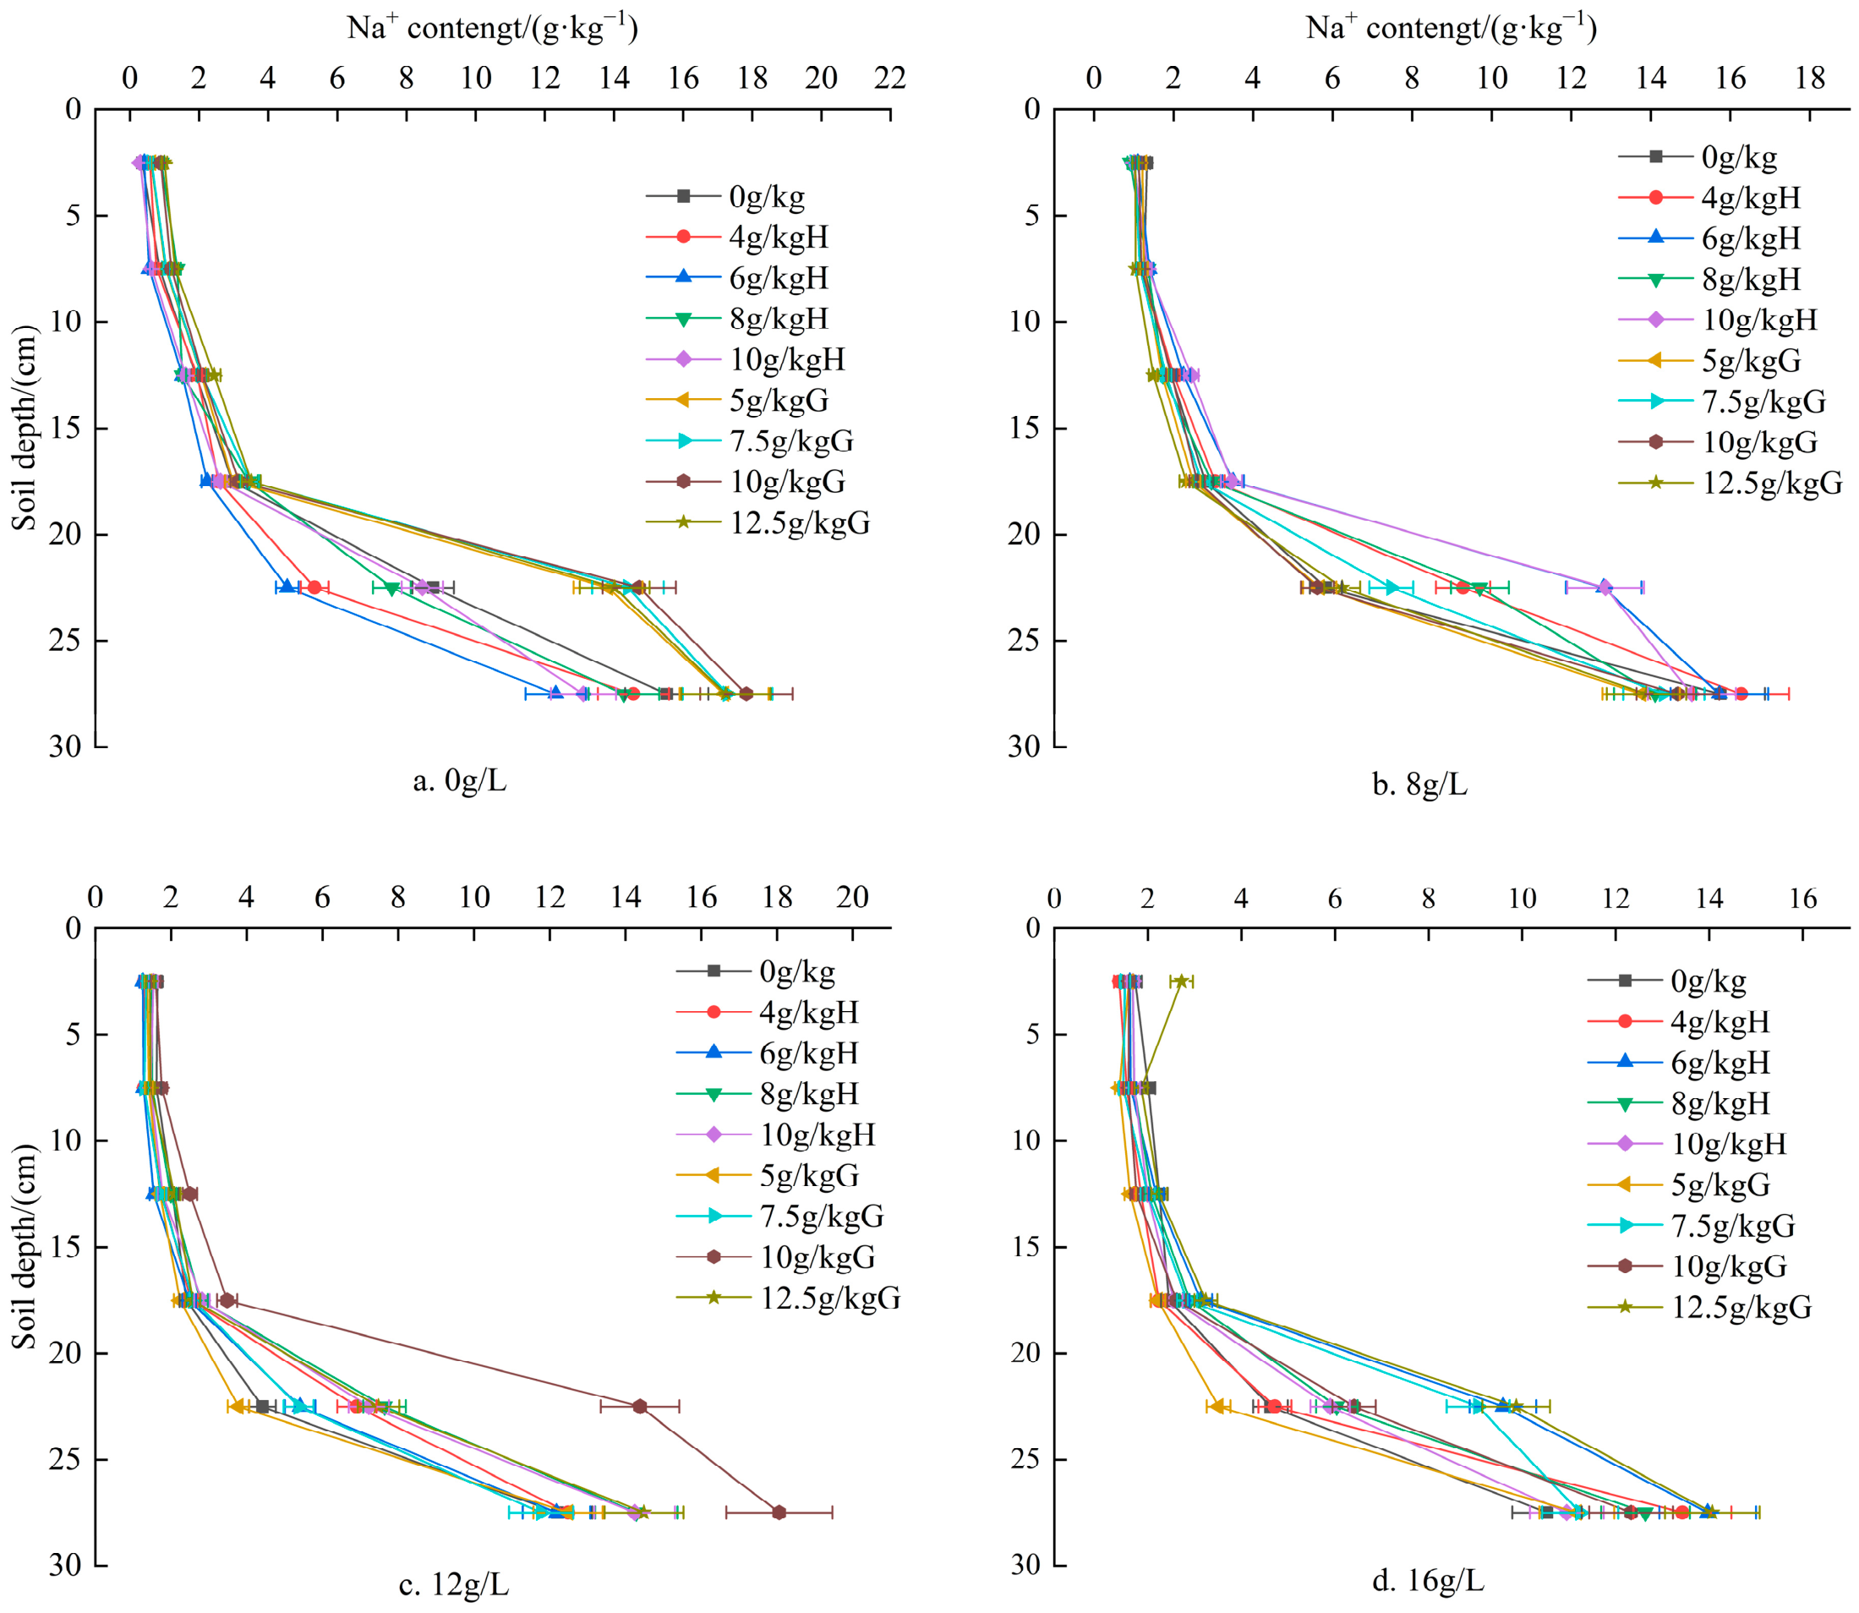
As shown in Figure 7, the effects of different soil amendments on the distribution of Na+ under varying mineralization levels differed significantly. Under 0 g/L mineralization, the 8 g/kg sodium humate treatment significantly increased Na+ content in the 0–20 cm soil layer (p < 0.05). Under 8 g/L and 12 g/L conditions, sodium humate generally reduced Na+ content in the 0–20 cm layer, although slight enrichment occurred in deeper layers. The S16 + H4 treatment significantly decreased Na+ concentration throughout the 0–25 cm layer (p < 0.05), while the difference at 25–30 cm was not significant. Under 0 g/L conditions, desulfurized gypsum treatments increased Na+ content in the soil profile. At 8 g/L and 12 g/L, gypsum application slightly reduced Na+ content in the 0–20 cm surface layer, and the S16 + G5 treatment showed significantly lower Na+ concentrations in the 0–25 cm layer than the 10 and 12.5 g/kg treatments (p < 0.05). However, in the 20–30 cm layer, Na+ content increased with gypsum addition, likely because the released Ca2+ from gypsum dissolved and replaced exchangeable Na+ on soil colloids. The displaced Na+ migrated downward with percolating water and accumulated in the deeper layer.
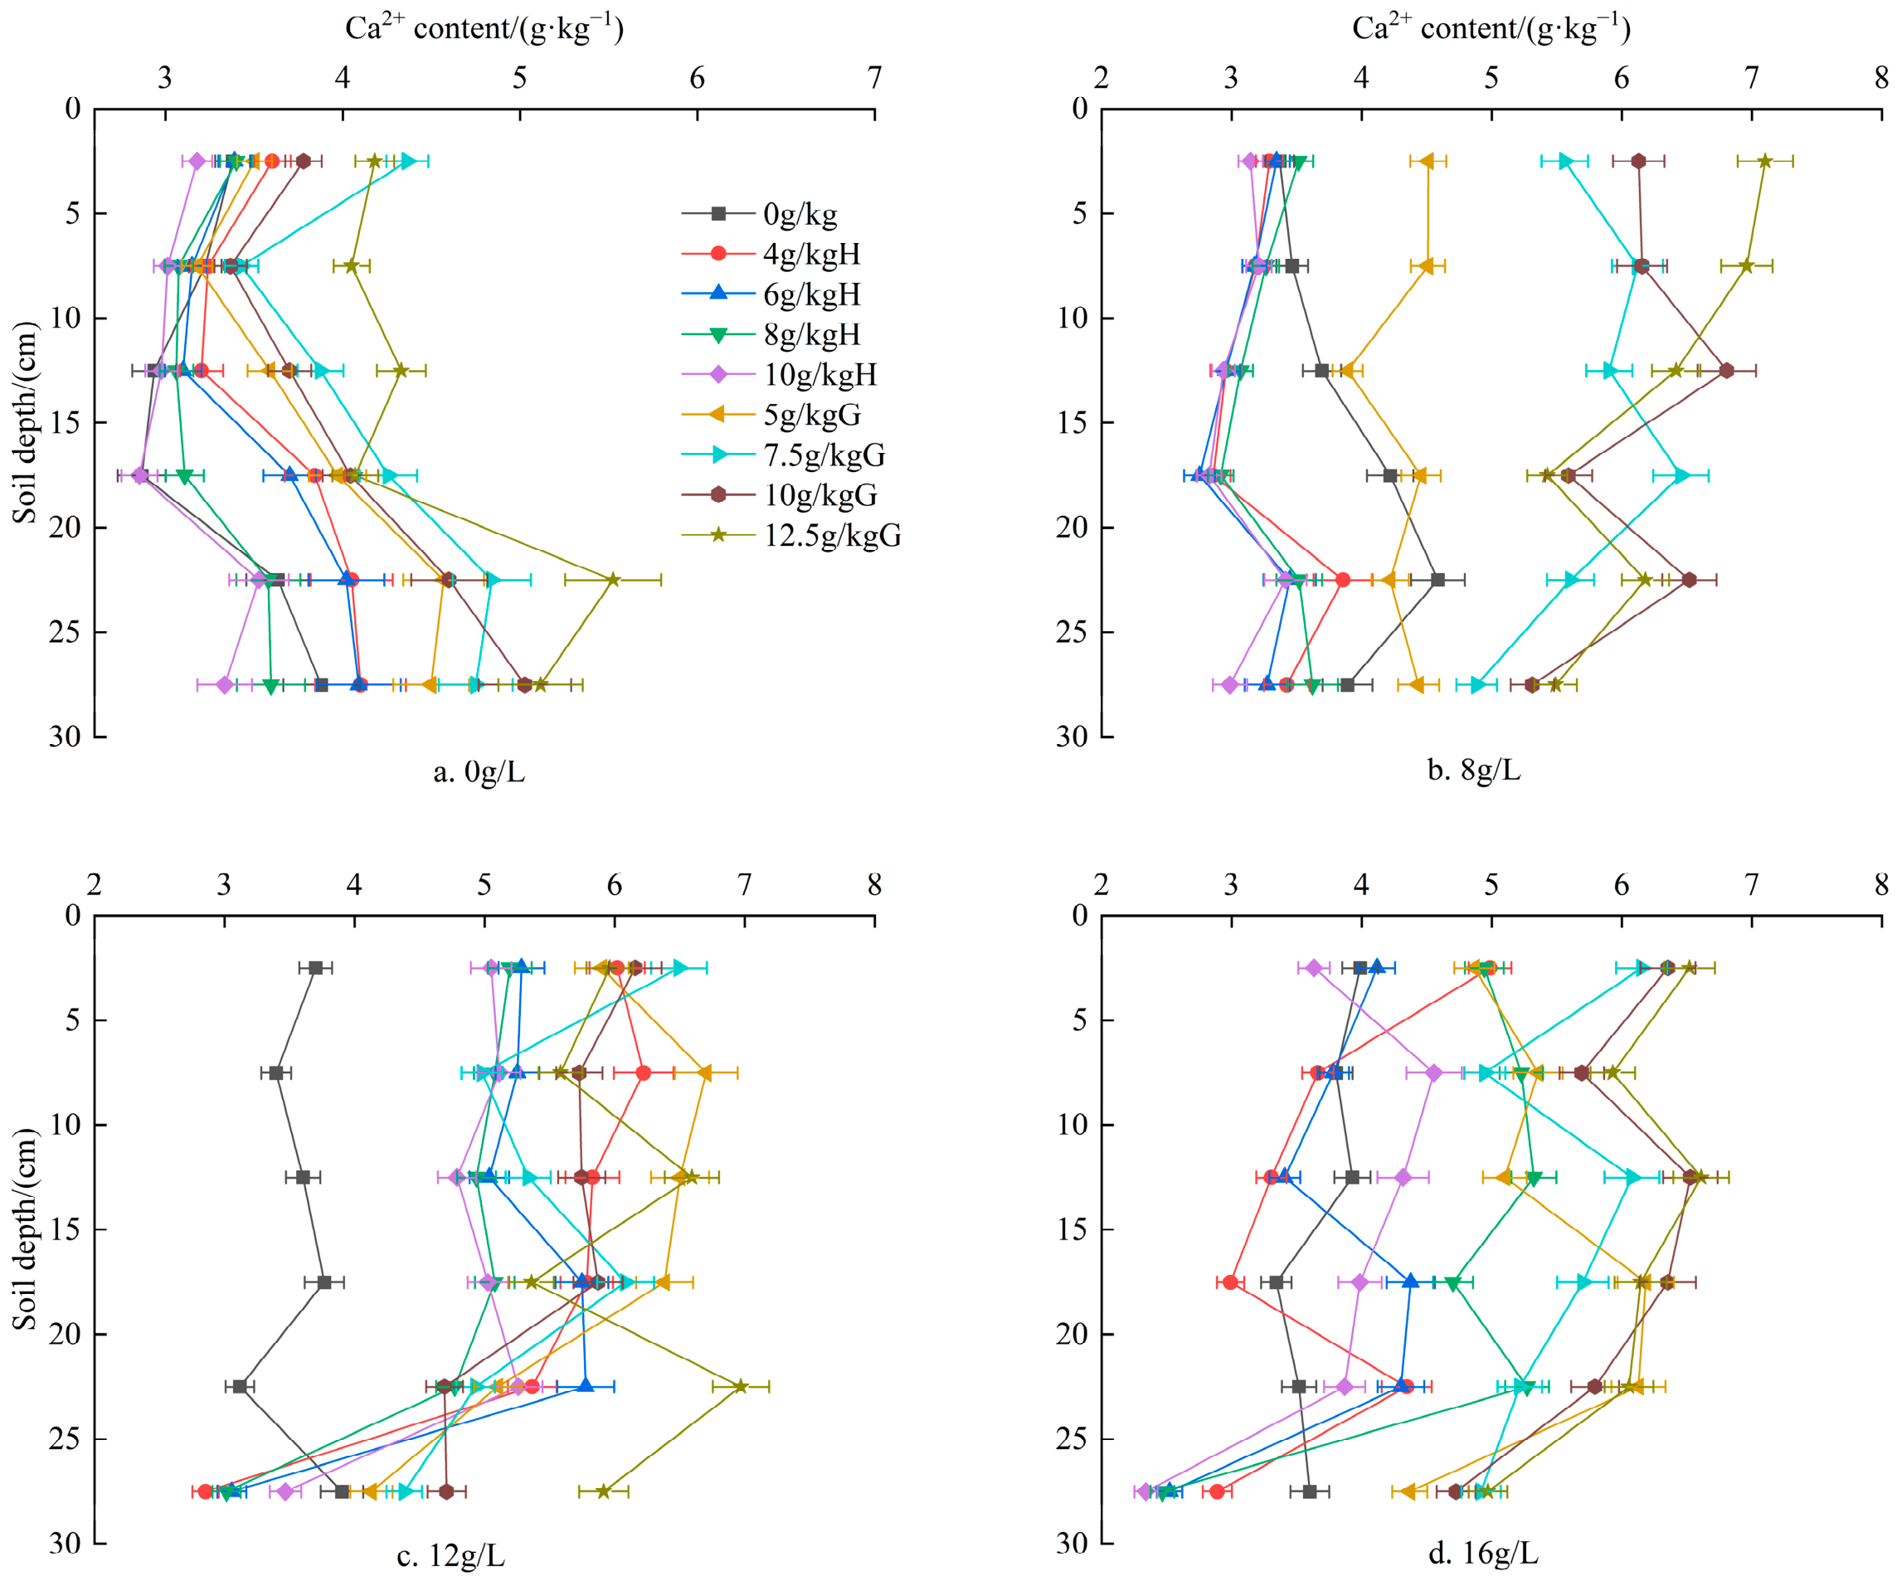
As shown in Figure 8, the Ca2+ content in each soil layer increased overall with rising irrigation water mineralization. Under 0 g/L and 8 g/L conditions, sodium humate treatments reduced Ca2+ concentrations in the 0–20 cm surface layer. In contrast, at 12 g/L and 16 g/L, sodium humate application increased Ca2+ content across all soil layers. Desulfurized gypsum treatment, however, promoted an increase in Ca2+ concentration under both freshwater and saline irrigation conditions. At the same mineralization level and amendment dosage, the Ca2+ content in soils treated with gypsum was consistently higher than that in sodium humate treatments. The increase in soil Ca2+ may be attributed to two factors: (1) the saline irrigation water introduced additional Ca2+ ions, and (2) the dissolution of desulfurized gypsum during infiltration continuously released Ca2+ into the soil solution.
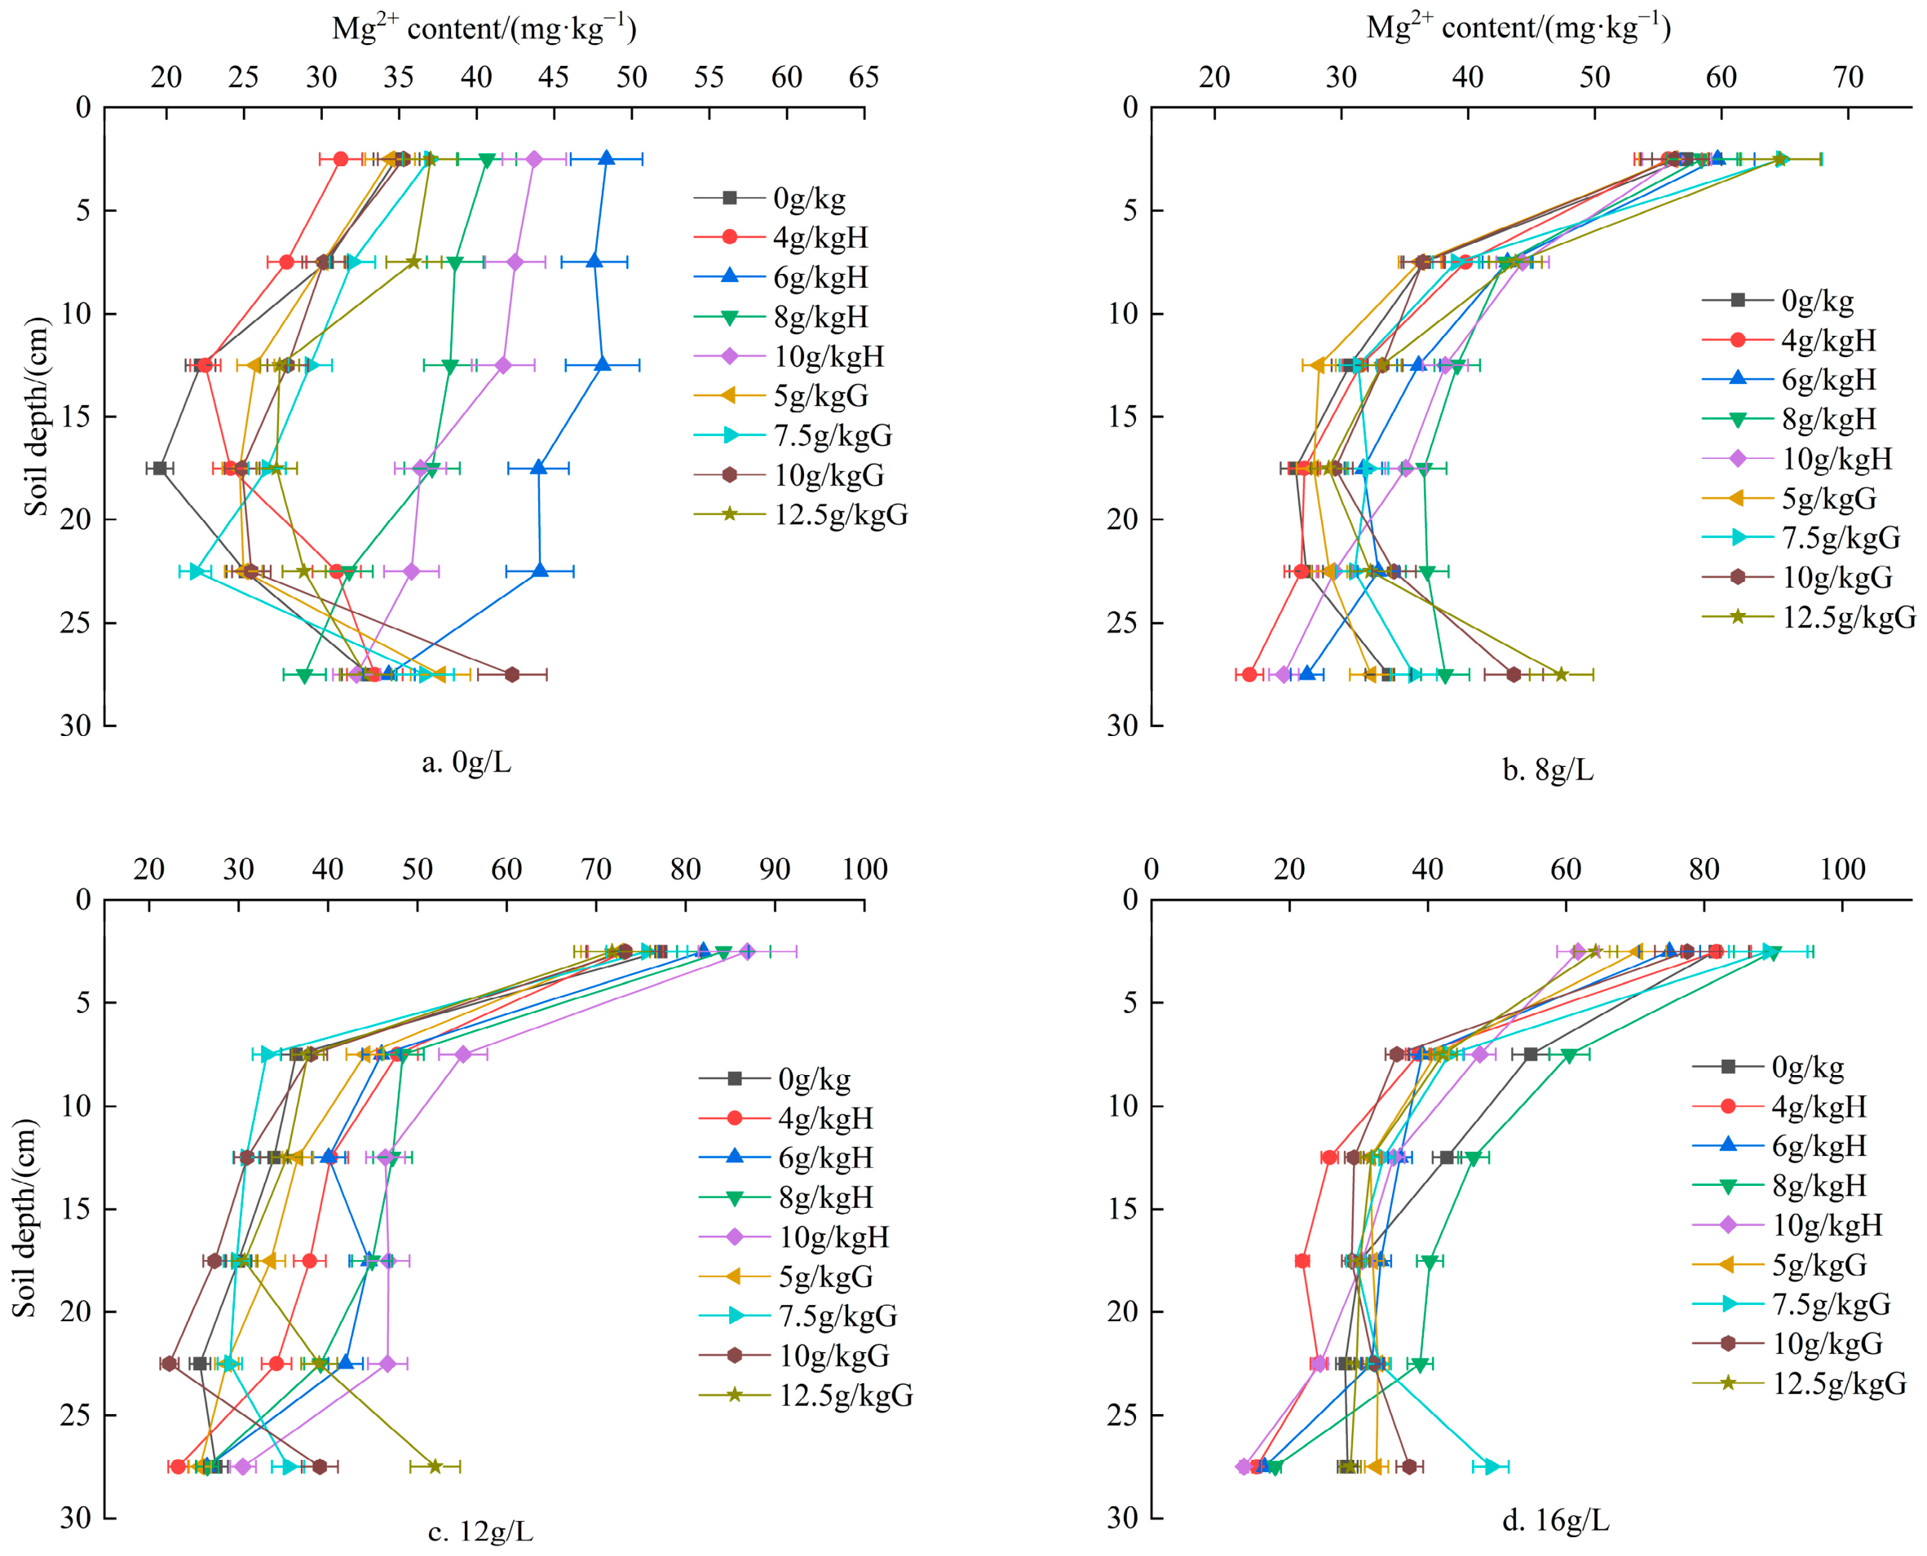
As shown in Figure 9, the Mg2+ content in soil increased significantly with rising irrigation water mineralization, with the most pronounced variation observed in the surface layers. Under all mineralization levels, sodium humate treatments resulted in higher Mg2+ concentrations within the 0–25 cm depth range compared with their respective controls. However, at 8, 12, and 16 g/L, Mg2+ content in the 25–30 cm layer was lower than in the controls, indicating that sodium humate effectively delayed the downward migration of Mg2+ under high-salinity conditions. In contrast, desulfurized gypsum treatments showed a similar overall trend to the controls (T1–T4), with Mg2+ concentrations first decreasing and then increasing with soil depth. Compared with sodium humate, gypsum application led to a more pronounced reduction in Mg2+ content in the 0–20 cm soil layer, suggesting a stronger cation-exchange and dilution effect in the surface zone. However, higher gypsum application rates promoted Mg2+ migration toward deeper layers: at 0, 8, 12, and 16 g/L mineralization, soils treated with 12.5 g/kg gypsum exhibited higher Mg2+ concentrations in the 25–30 cm layer than their corresponding controls (T1–T4).
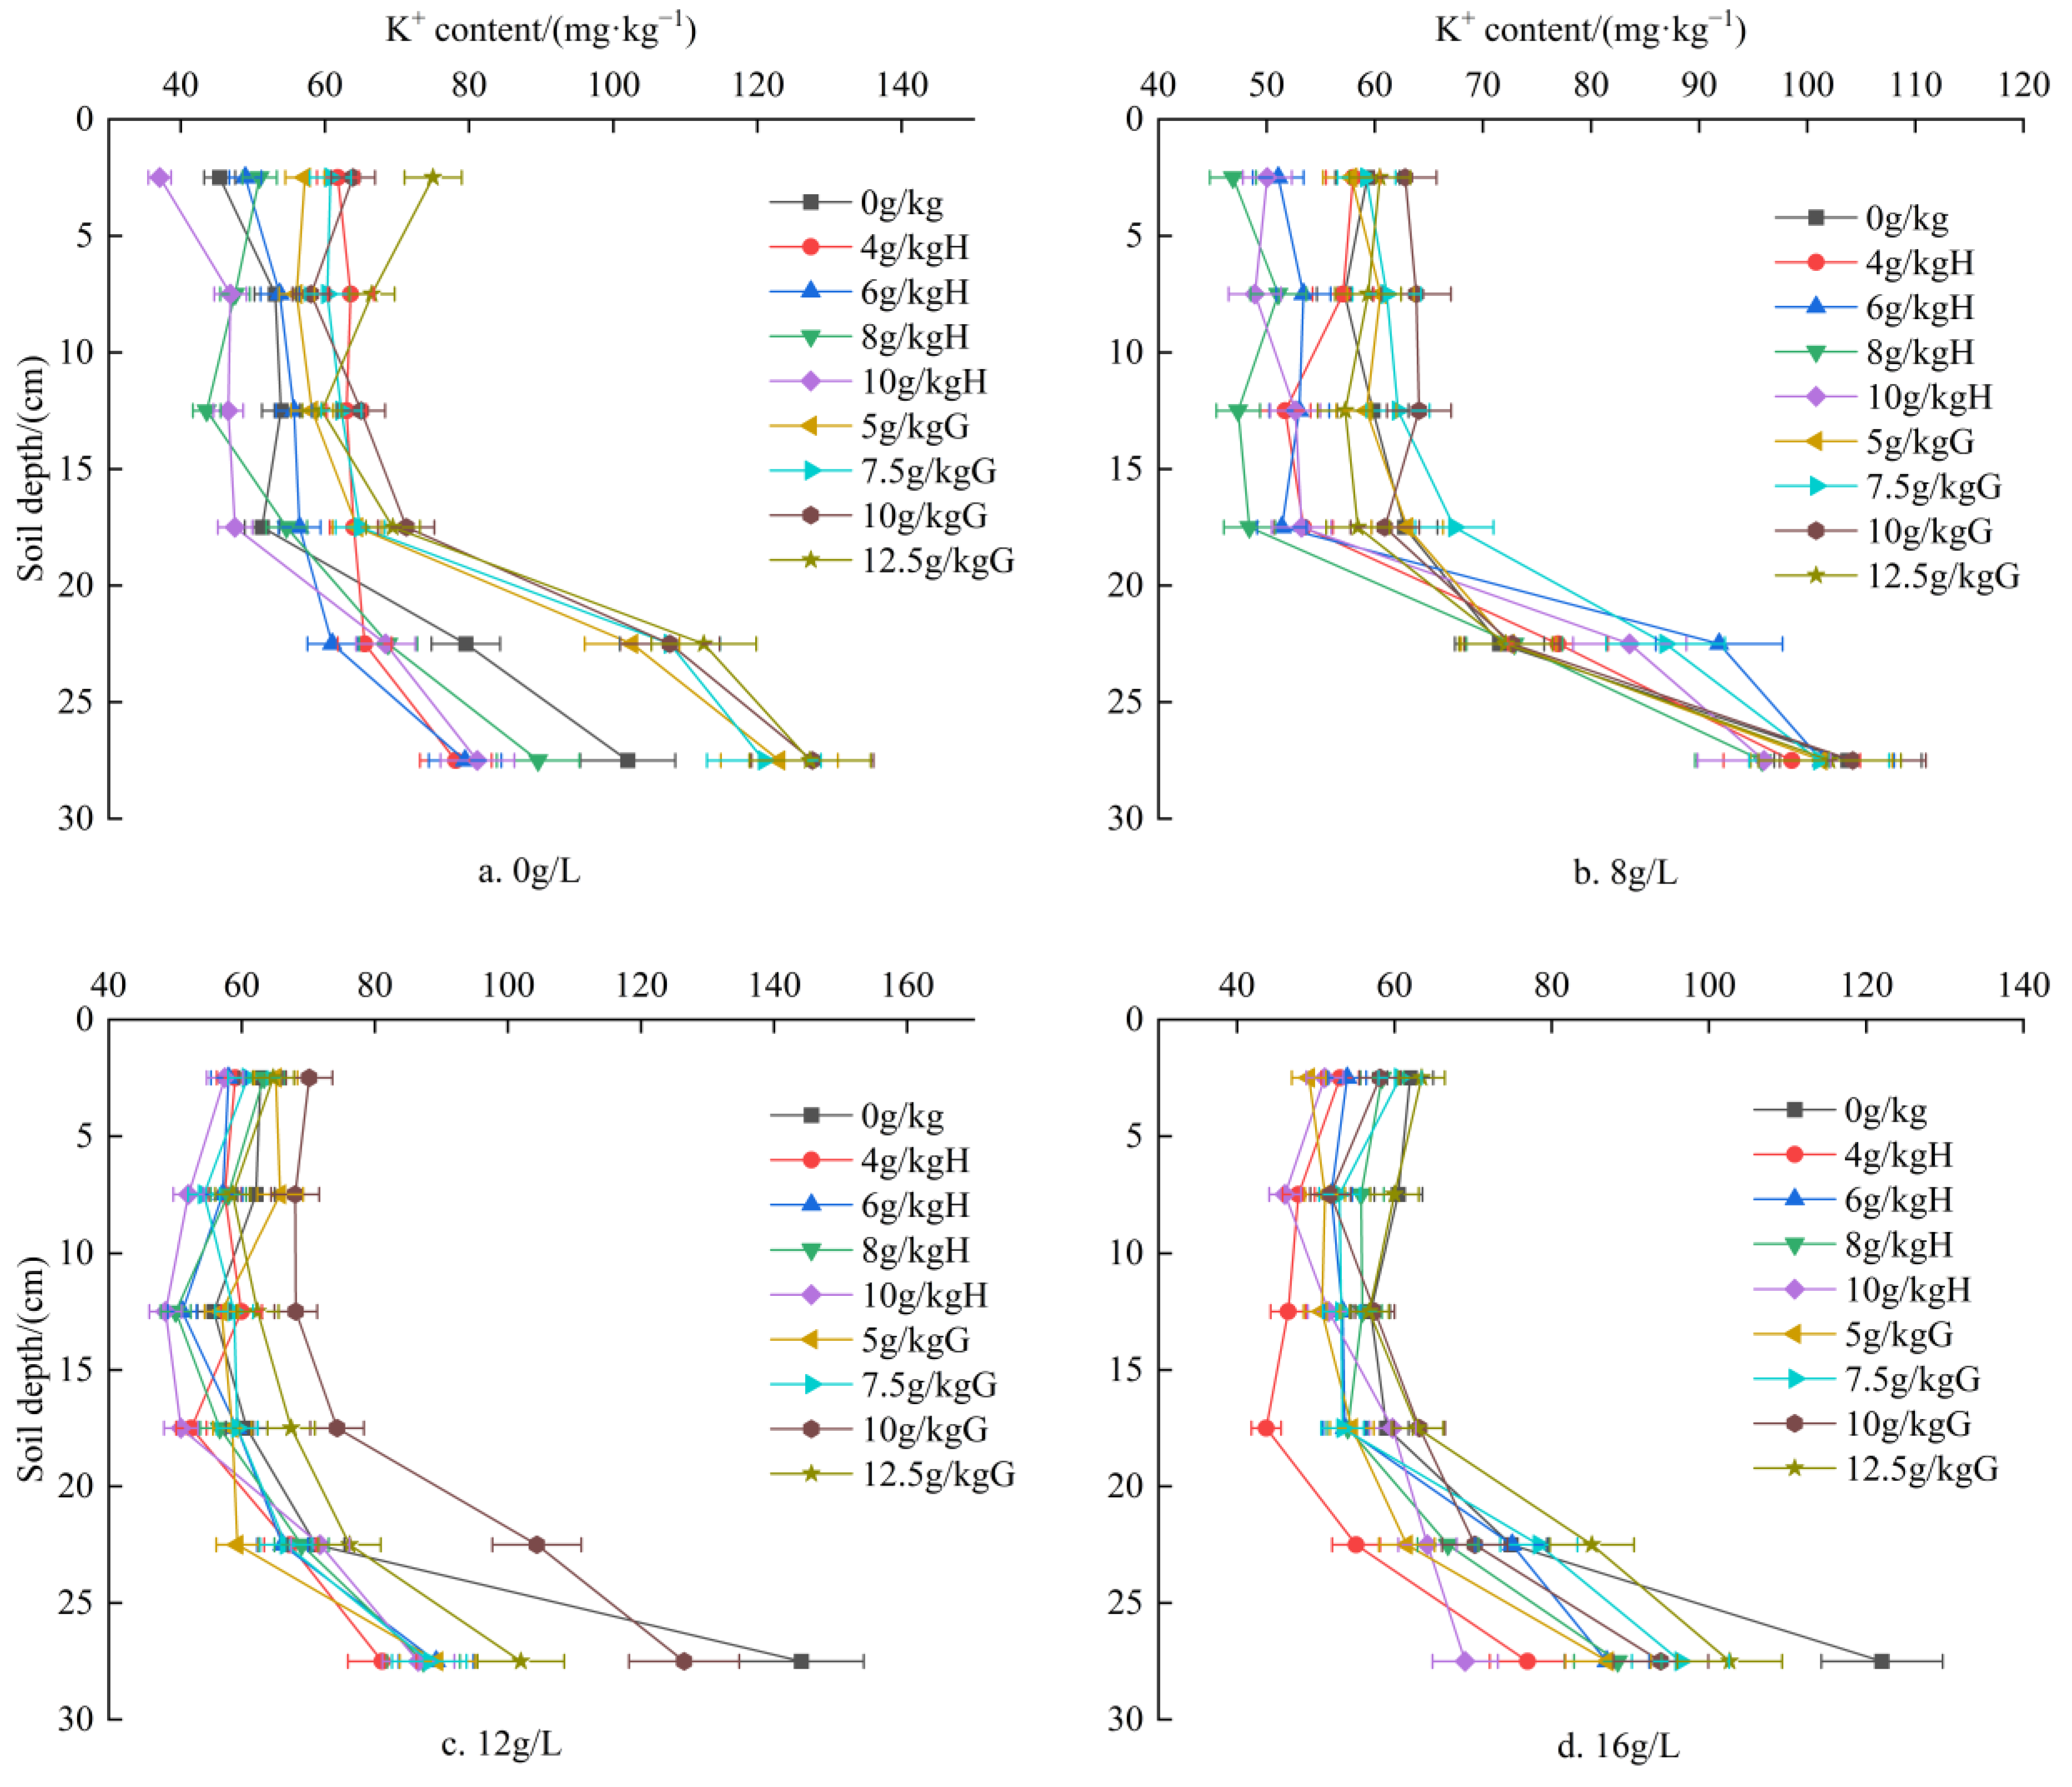
As shown in Figure 10, the average K+ content in the soil profile increased with both irrigation water mineralization and soil depth. Potassium accumulation occurred mainly within the 25–30 cm layer, where the maximum concentrations were observed across all treatments. Under 0 g/L and 8 g/L mineralization, desulfurized gypsum treatments resulted in higher K+ contents in the 20–30 cm layer compared with the controls (T1 and T2). In particular, the S0 + G12.5 treatment increased K+ content in the 20–25 cm layer by 41.51%, significantly higher than that of the control (p < 0.05). Under low-salinity irrigation, moderate application of sodium humate increased K+ concentration in the surface layer. However, under highly mineralized saline water irrigation, sodium humate effectively suppressed deep-layer K+ accumulation. At 12 g/L, the S12 + H4 to S12 + H10 treatments reduced K+ content in the 25–30 cm layer by 39.42–43.73% relative to the control (T3). Under 16 g/L mineralization, the S16 + H10 treatment significantly decreased K+ concentration in the 25–30 cm layer, showing a 51.52% reduction compared with the control (T4) (p < 0.05). Overall, compared with sodium humate, desulfurized gypsum treatments resulted in higher soil K+ concentrations, and the deep-layer accumulation became more pronounced with increasing gypsum dosage.
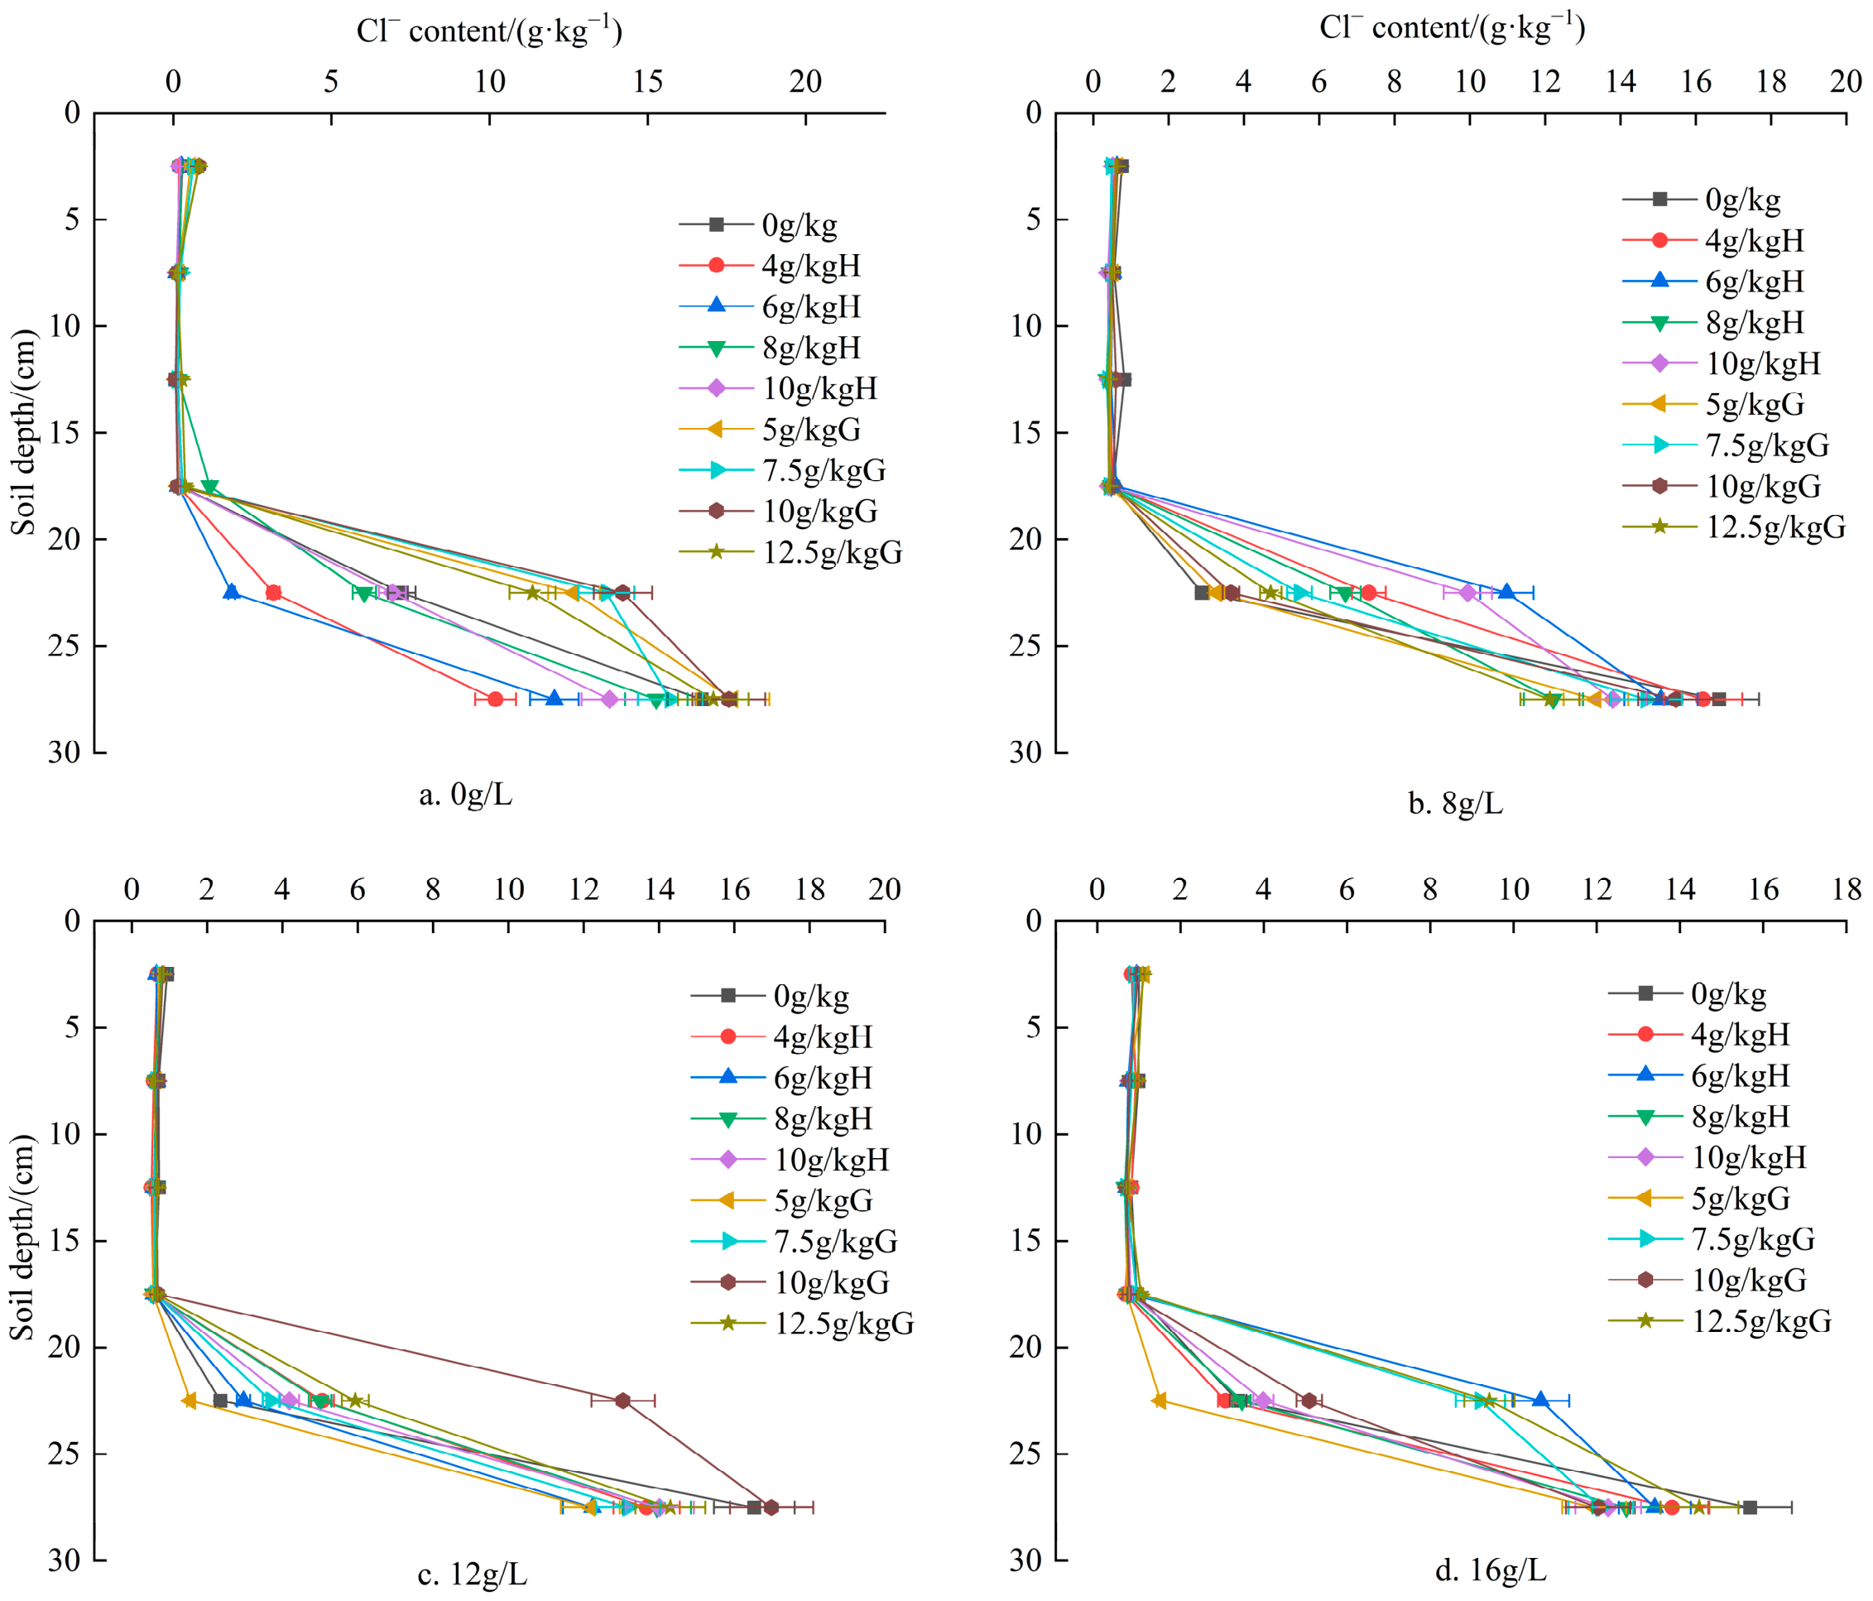
As shown in Figure 11, within the 0–20 cm layer, soil Cl content increased with rising irrigation water mineralization, while under the same treatment, Cl concentration also increased with soil depth. Across all treatments, Cl content showed a slight increase from 0 to 20 cm but accumulated rapidly below 20 cm, reaching the highest concentration in the 25–30 cm layer. Under 0, 8, 12, and 16 g/L mineralization levels, both sodium humate and desulfurized gypsum treatments resulted in lower Cl concentrations in the 0–20 cm layer compared with their respective controls, indicating that both amendments alleviated Cl accumulation in the surface soil through enhanced leaching. In contrast, Cl content in the 20–25 cm layer was higher than in the controls for all mineralization and amendment levels, while the 25–30 cm layer still exhibited the highest Cl accumulation but with values lower than the corresponding controls. These results suggest that both sodium humate and desulfurized gypsum promoted the downward migration of Cl, thereby mitigating its excessive accumulation in deeper soil layers.
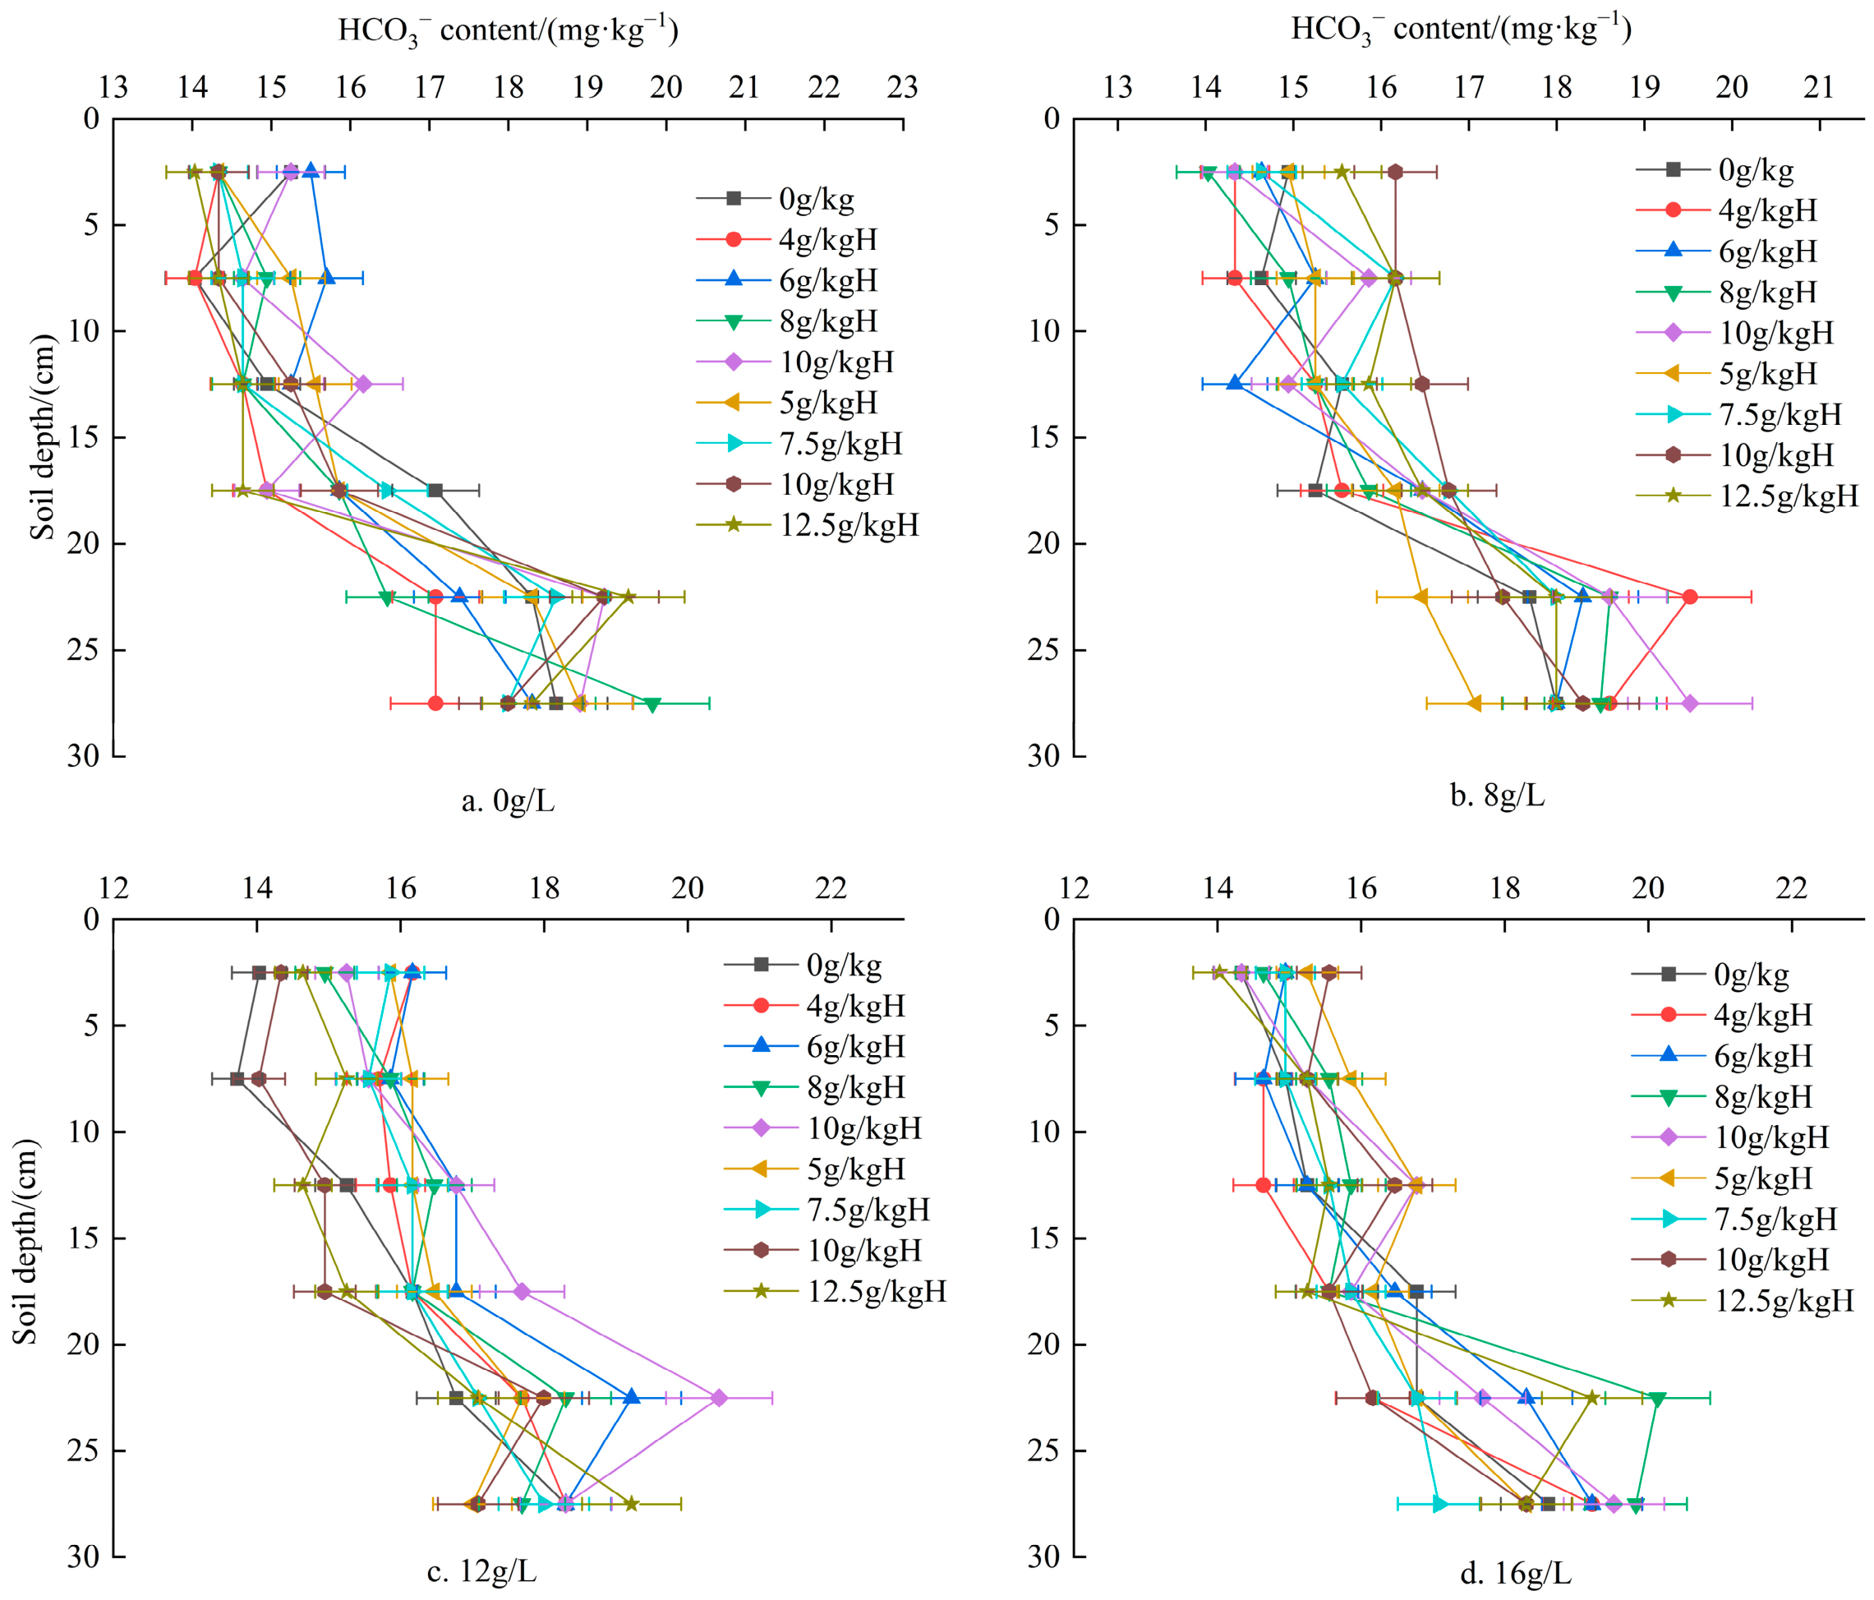
As shown in Figure 12, soil HCO3 content increased progressively with both irrigation water mineralization and soil depth, showing pronounced accumulation within the 20–30 cm layer. In some treatments, HCO3 content in the 25–30 cm layer was lower than that in the 20–25 cm layer, a pattern similar to that of Cl distribution. This phenomenon may be attributed to the slower migration rate of ions compared with the wetting front, resulting in the 20–25 cm layer becoming the main zone of HCO3 accumulation. Under 0 g/L mineralization, sodium humate application partially alleviated HCO3 accumulation. However, under high mineralization conditions, sodium humate treatments led to higher HCO3 concentrations across all soil layers compared with the corresponding controls. In contrast, under 8, 12, and 16 g/L mineralization, the 5 g/kg gypsum treatment reduced HCO3 content in the 20–30 cm layer. This reduction may be due to the release of Ca2+ from gypsum dissolution during infiltration, which reacted with HCO3 to form CaCO3 precipitates, thereby decreasing HCO3 accumulation in deeper soil layers.
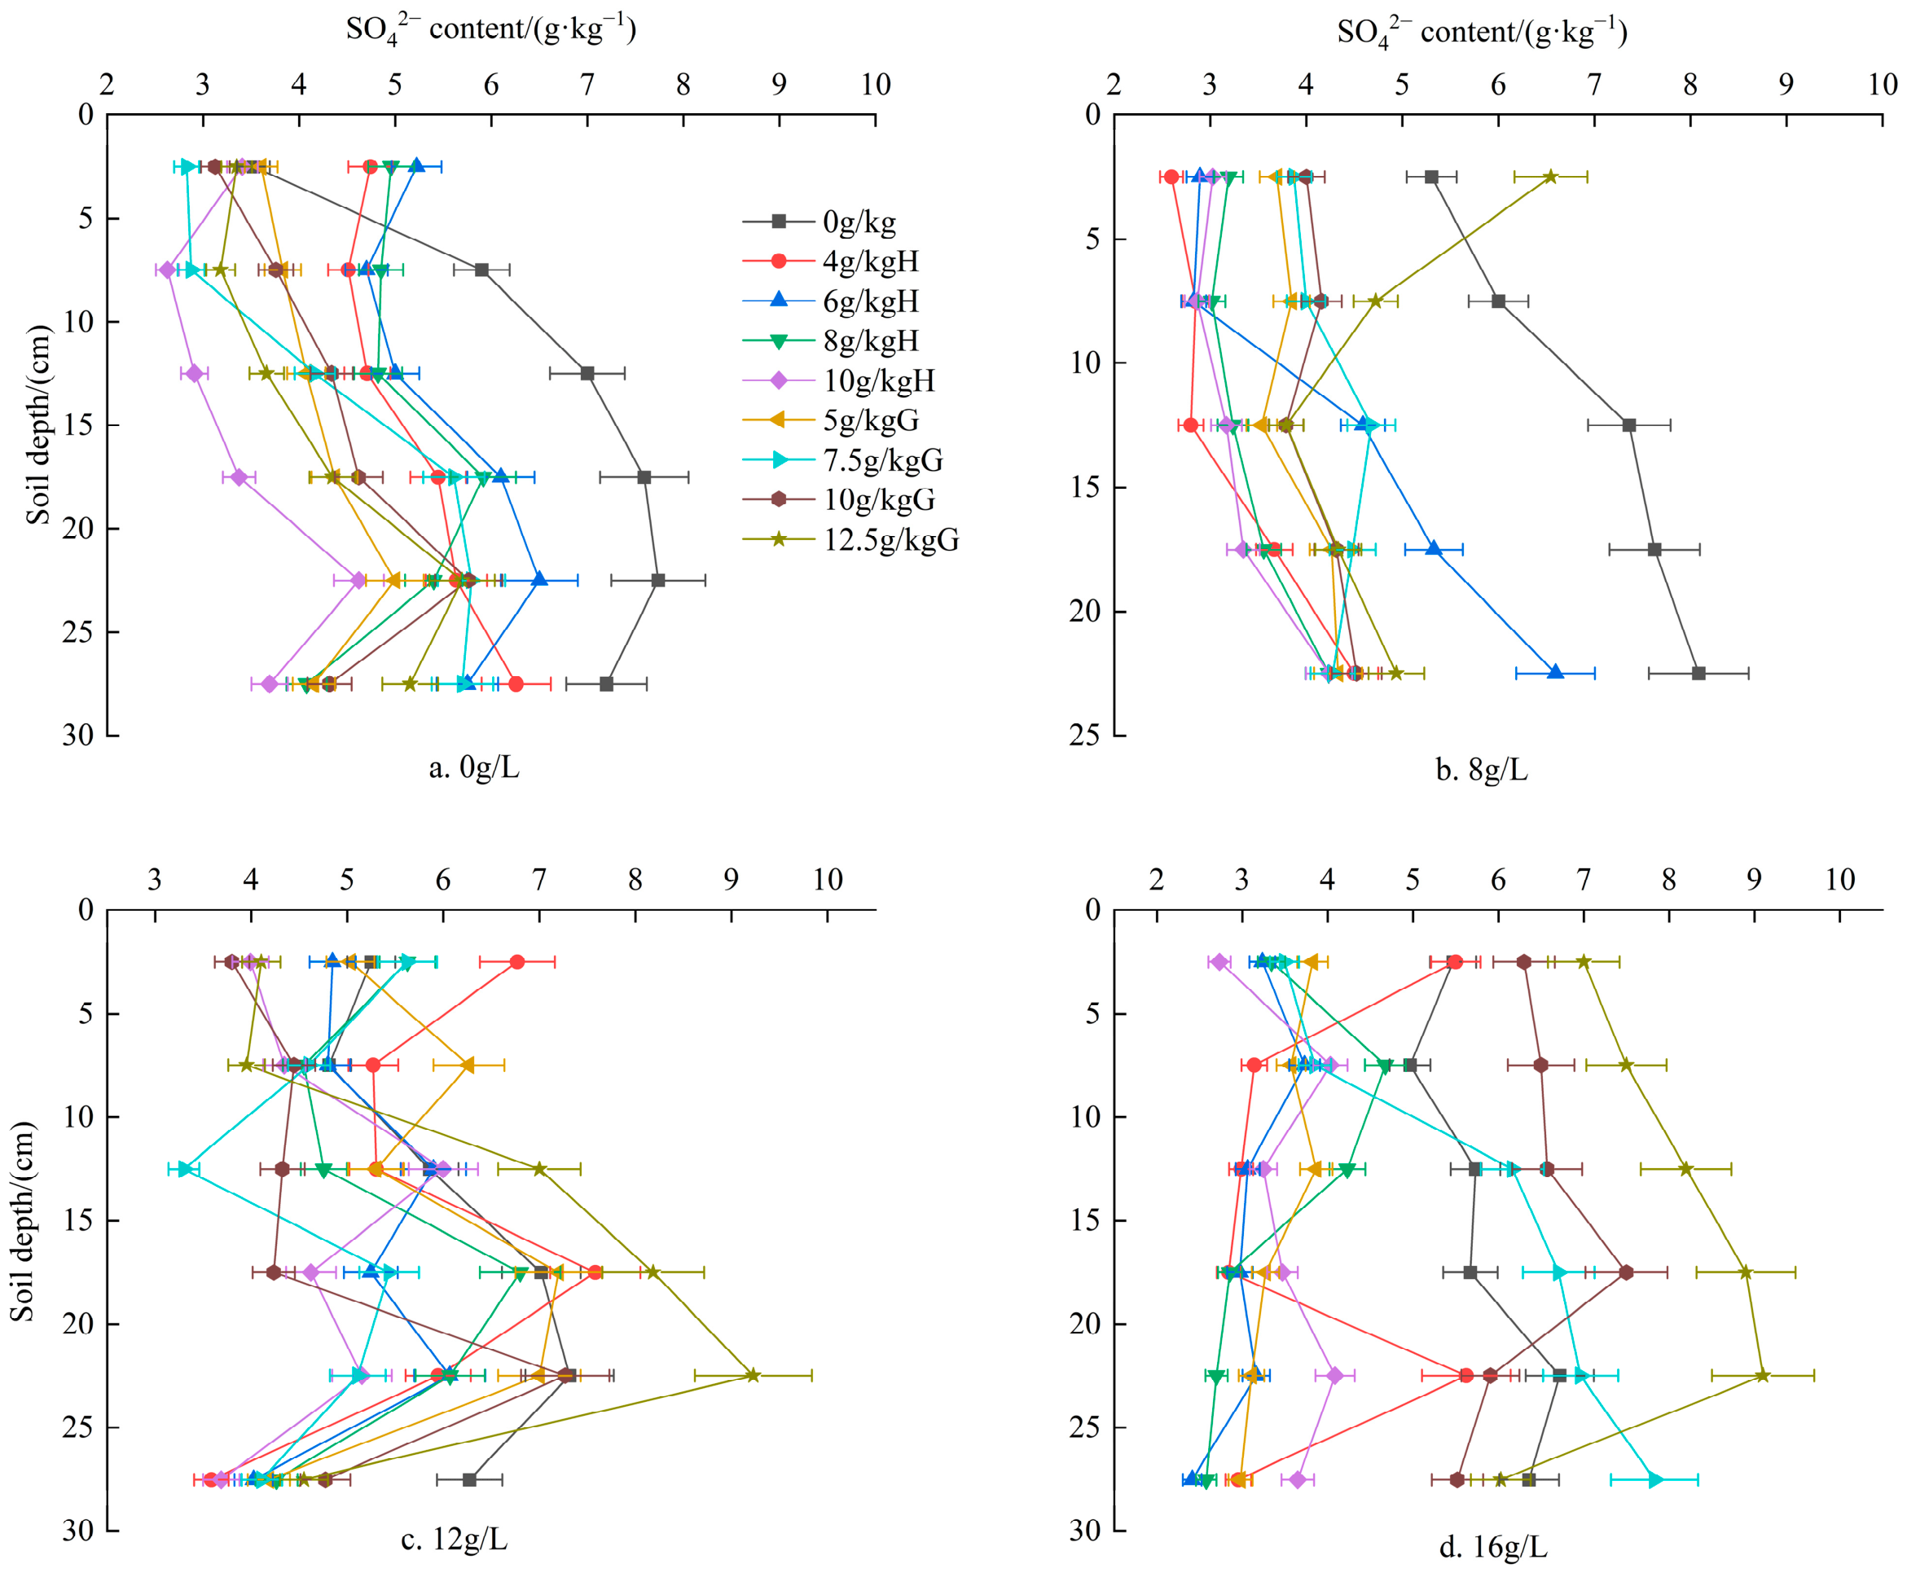
As shown in Figure 13, soil SO42− content exhibited a slight increasing trend with depth across all treatments and tended to accumulate in the 20–30 cm layer. Under low mineralization conditions, sodium humate treatments reduced SO42− concentrations compared with the control (T1). However, under 16 g/L mineralization, several gypsum treatments resulted in higher SO42− contents relative to the control (T4). During the infiltration process, gypsum dissolution released SO42−, which migrated downward and accumulated in deeper layers. Additionally, the saline irrigation water itself contained higher SO42− concentrations, further contributing to deep-layer accumulation. Specifically, the S16 + G12.5 treatment increased SO42− content in the 20–25 cm layer by 35.42% compared with the control (T4). Across the soil profile, all treatments showed higher SO42− concentrations in the 20–25 cm layer than in the 25–30 cm layer, indicating a reduction in ion accumulation at the deepest layer. This pattern was consistent with the distribution trends of Cl and HCO3, suggesting similar ionic migration and retention behavior during infiltration.

3.4. Soil Sodium Adsorption Ratio, Alkalinity, and Total Exchangeable Bases

3.4.1. Soil Sodium Adsorption Ratio (SAR)

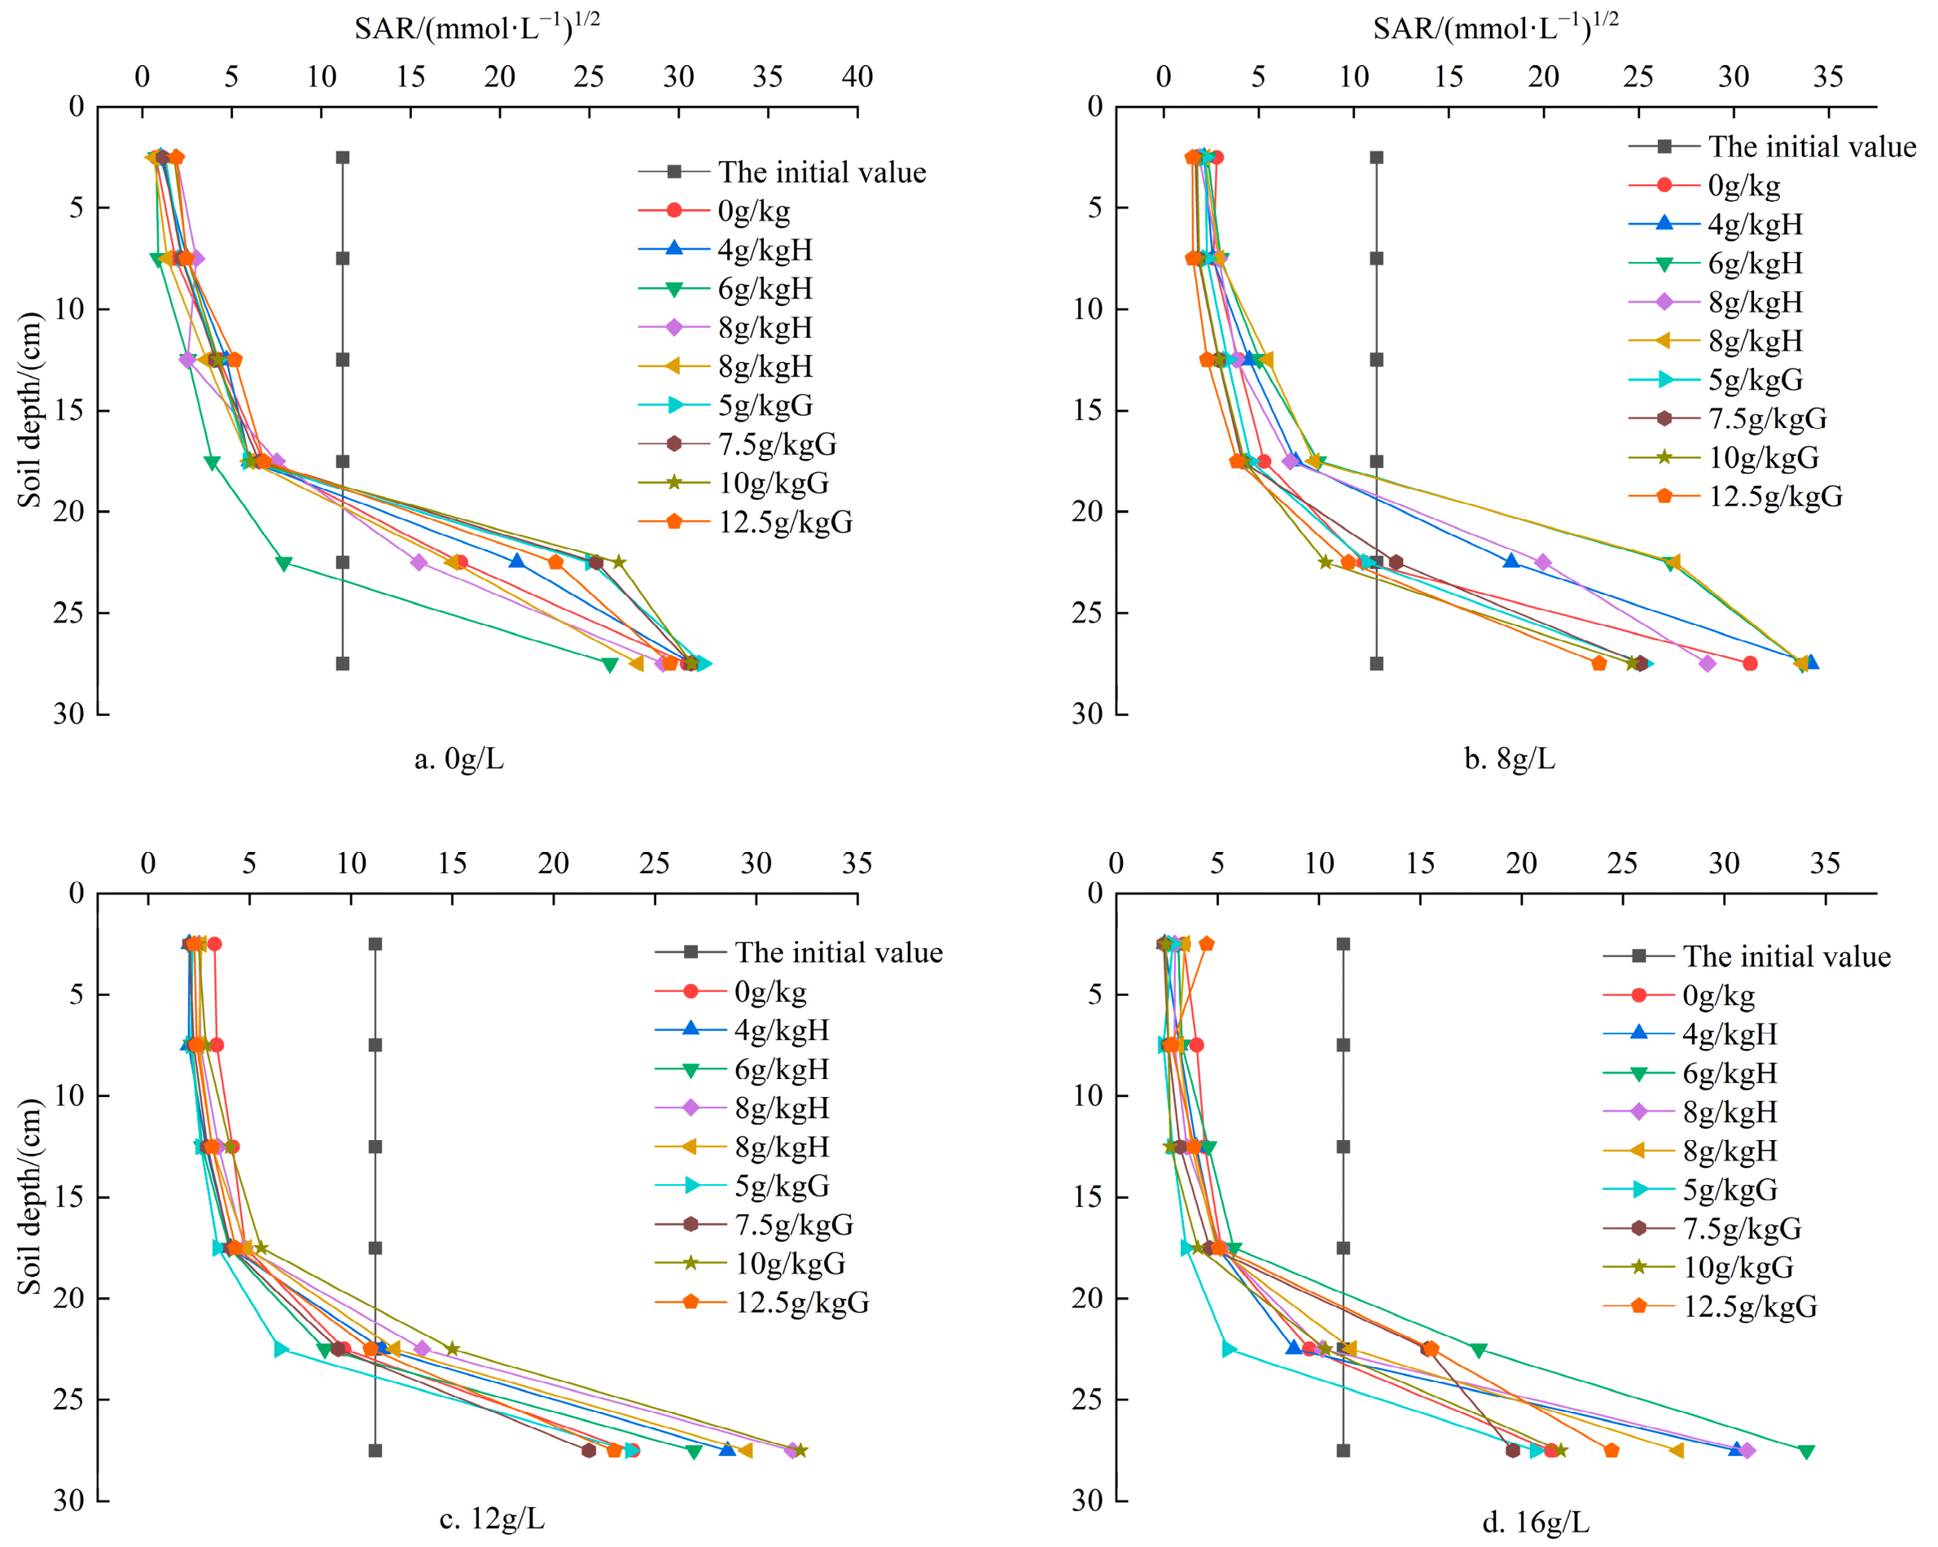
As shown in Figure 14, the soil profile SAR increased overall with rising irrigation water mineralization, and within each salinity level, SAR values also increased with soil depth. Under all mineralization conditions, both sodium humate and desulfurized gypsum treatments resulted in significantly lower SAR values in the 0–20 cm soil layer compared with the controls, while SAR values in the 20–30 cm layer were generally higher than those of the controls. Specifically, the S16 + H8 treatment reduced the SAR of the 5–10 cm layer by 27.51% relative to the control (T4), but increased the SAR in the 25–30 cm layer by 45.03%. Under 16 g/L mineralization, the 10 g/kg gypsum treatment exhibited lower SAR values across all layers (0–30 cm) compared with the same application rate of sodium humate, indicating that gypsum was more effective in reducing sodicity under high-salinity conditions.

3.4.2. Soil Exchangeable Sodium Percentage (ESP)

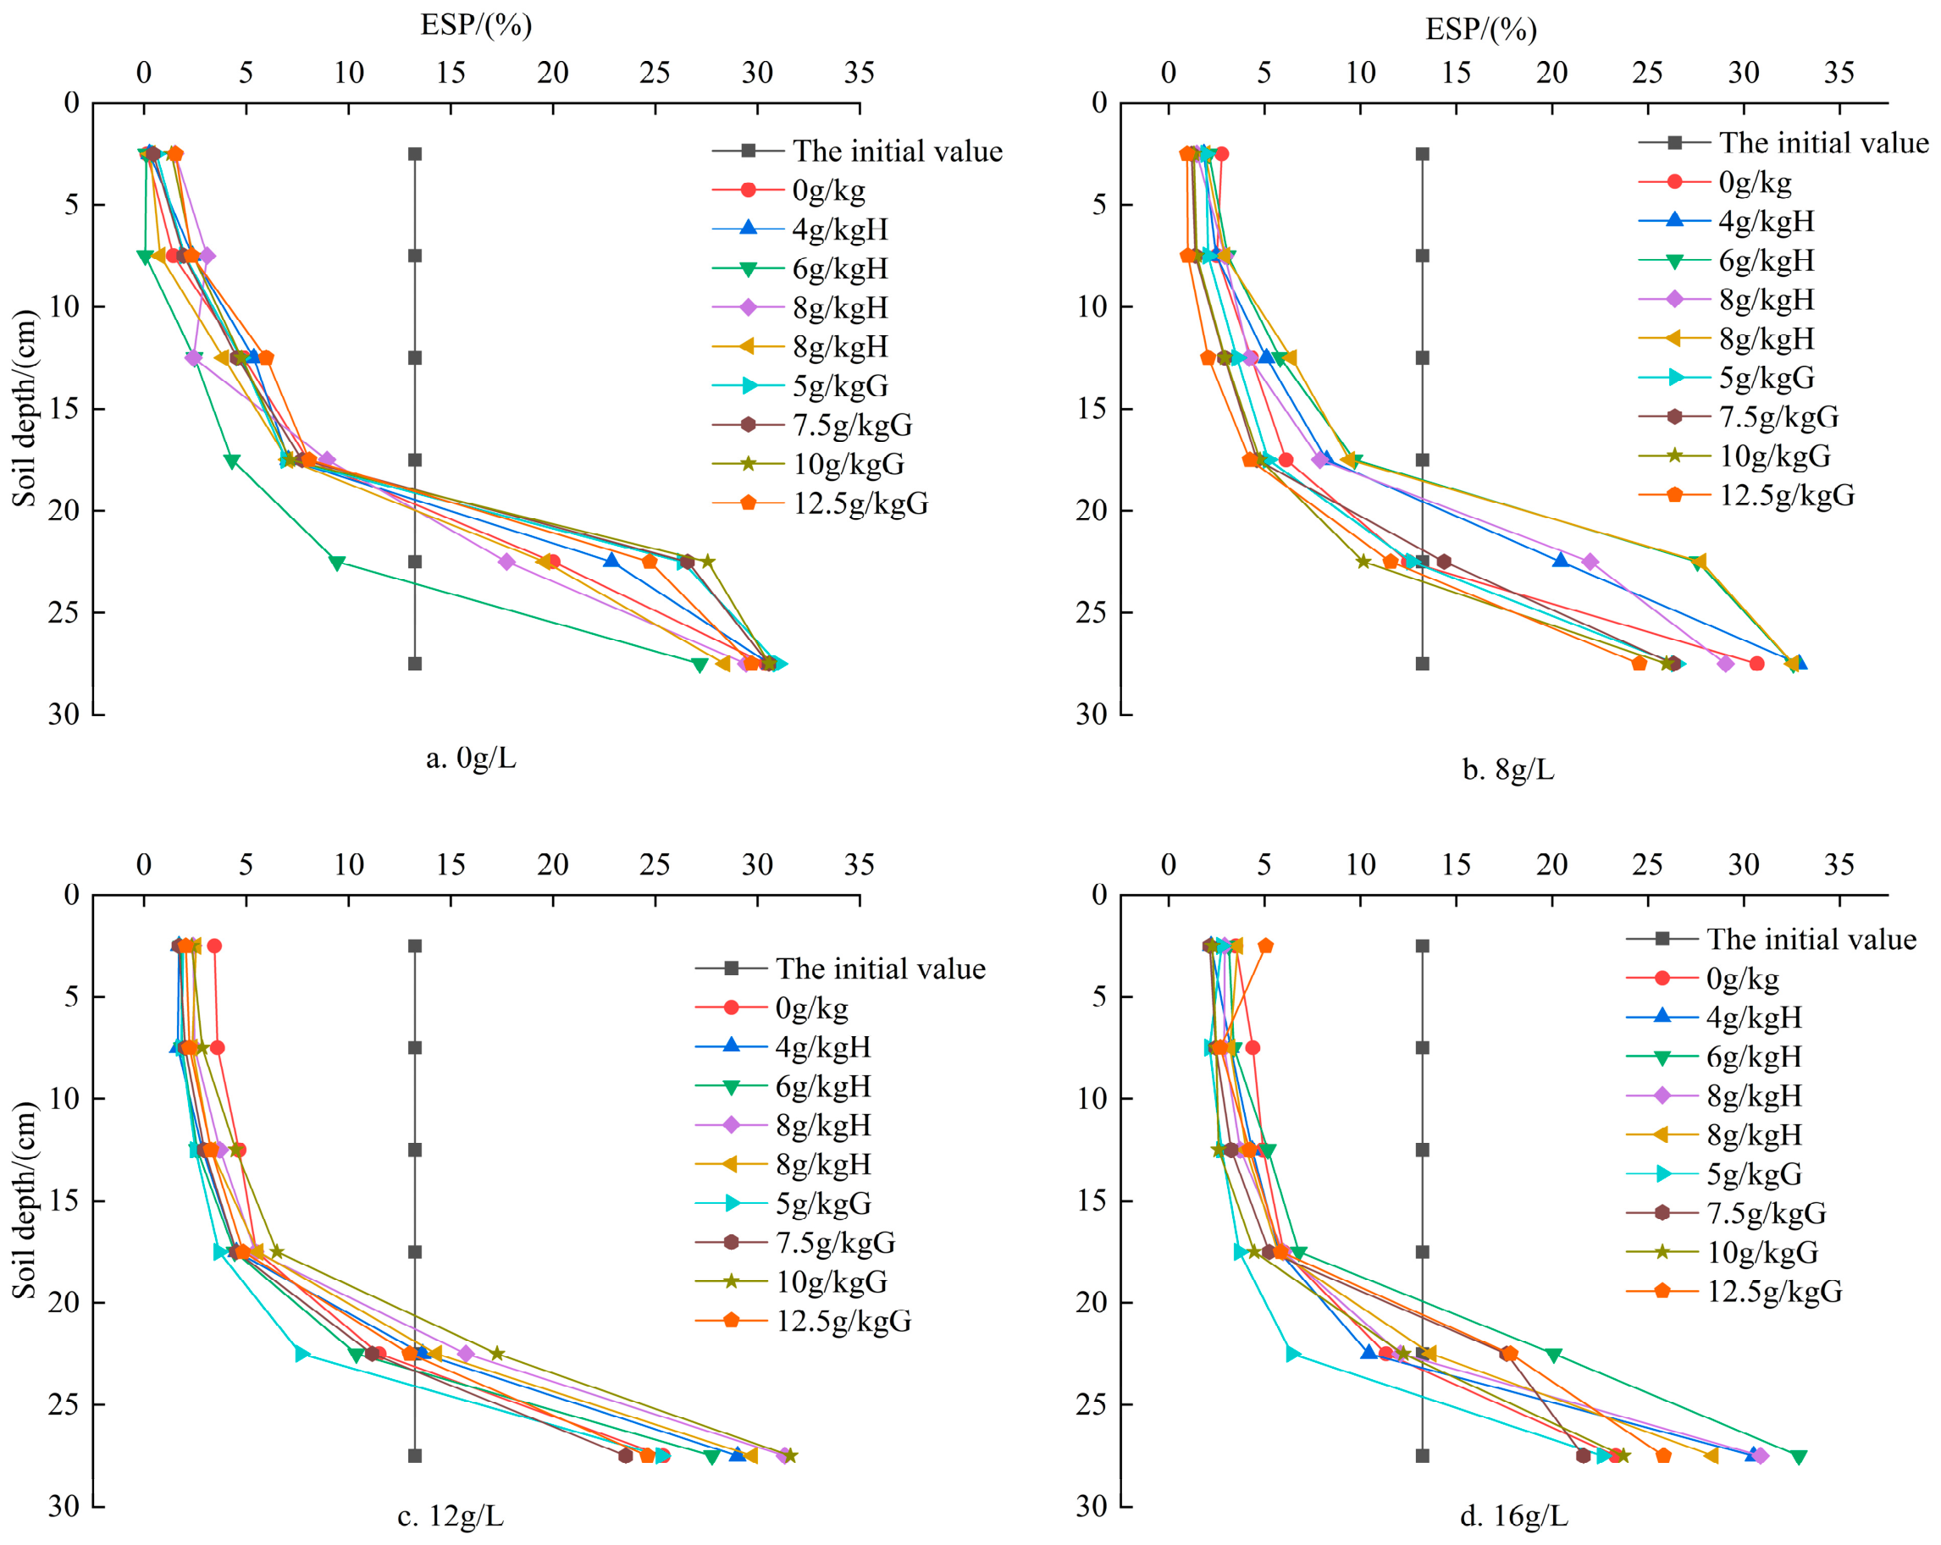
As shown in Figure 15, soil ESP increased with both irrigation water mineralization and soil depth, exhibiting a trend consistent with that of SAR. Under 0 g/L mineralization, sodium humate treatments resulted in lower ESP values in the 0–20 cm layer than the initial level, demonstrating a stronger effect in reducing soil alkalinity compared with desulfurized gypsum. However, under high mineralization conditions, the S16 + H6 treatment increased ESP in the 20–25 cm layer by 77.07% relative to the control (T4), indicating that highly mineralized irrigation water is unfavorable for reducing subsoil alkalinity. Under 12 and 16 g/L mineralization, the 5 g/kg gypsum treatment markedly reduced ESP values across all layers (0–30 cm) compared with controls (T3 and T4). Overall, increasing mineralization elevated ESP in the upper 0–20 cm soil layer. Sodium humate was more effective in suppressing ESP increases under low-salinity conditions, whereas gypsum application produced more consistent ESP reduction under high-salinity irrigation.

3.4.3. Total Exchangeable Bases (TEB)

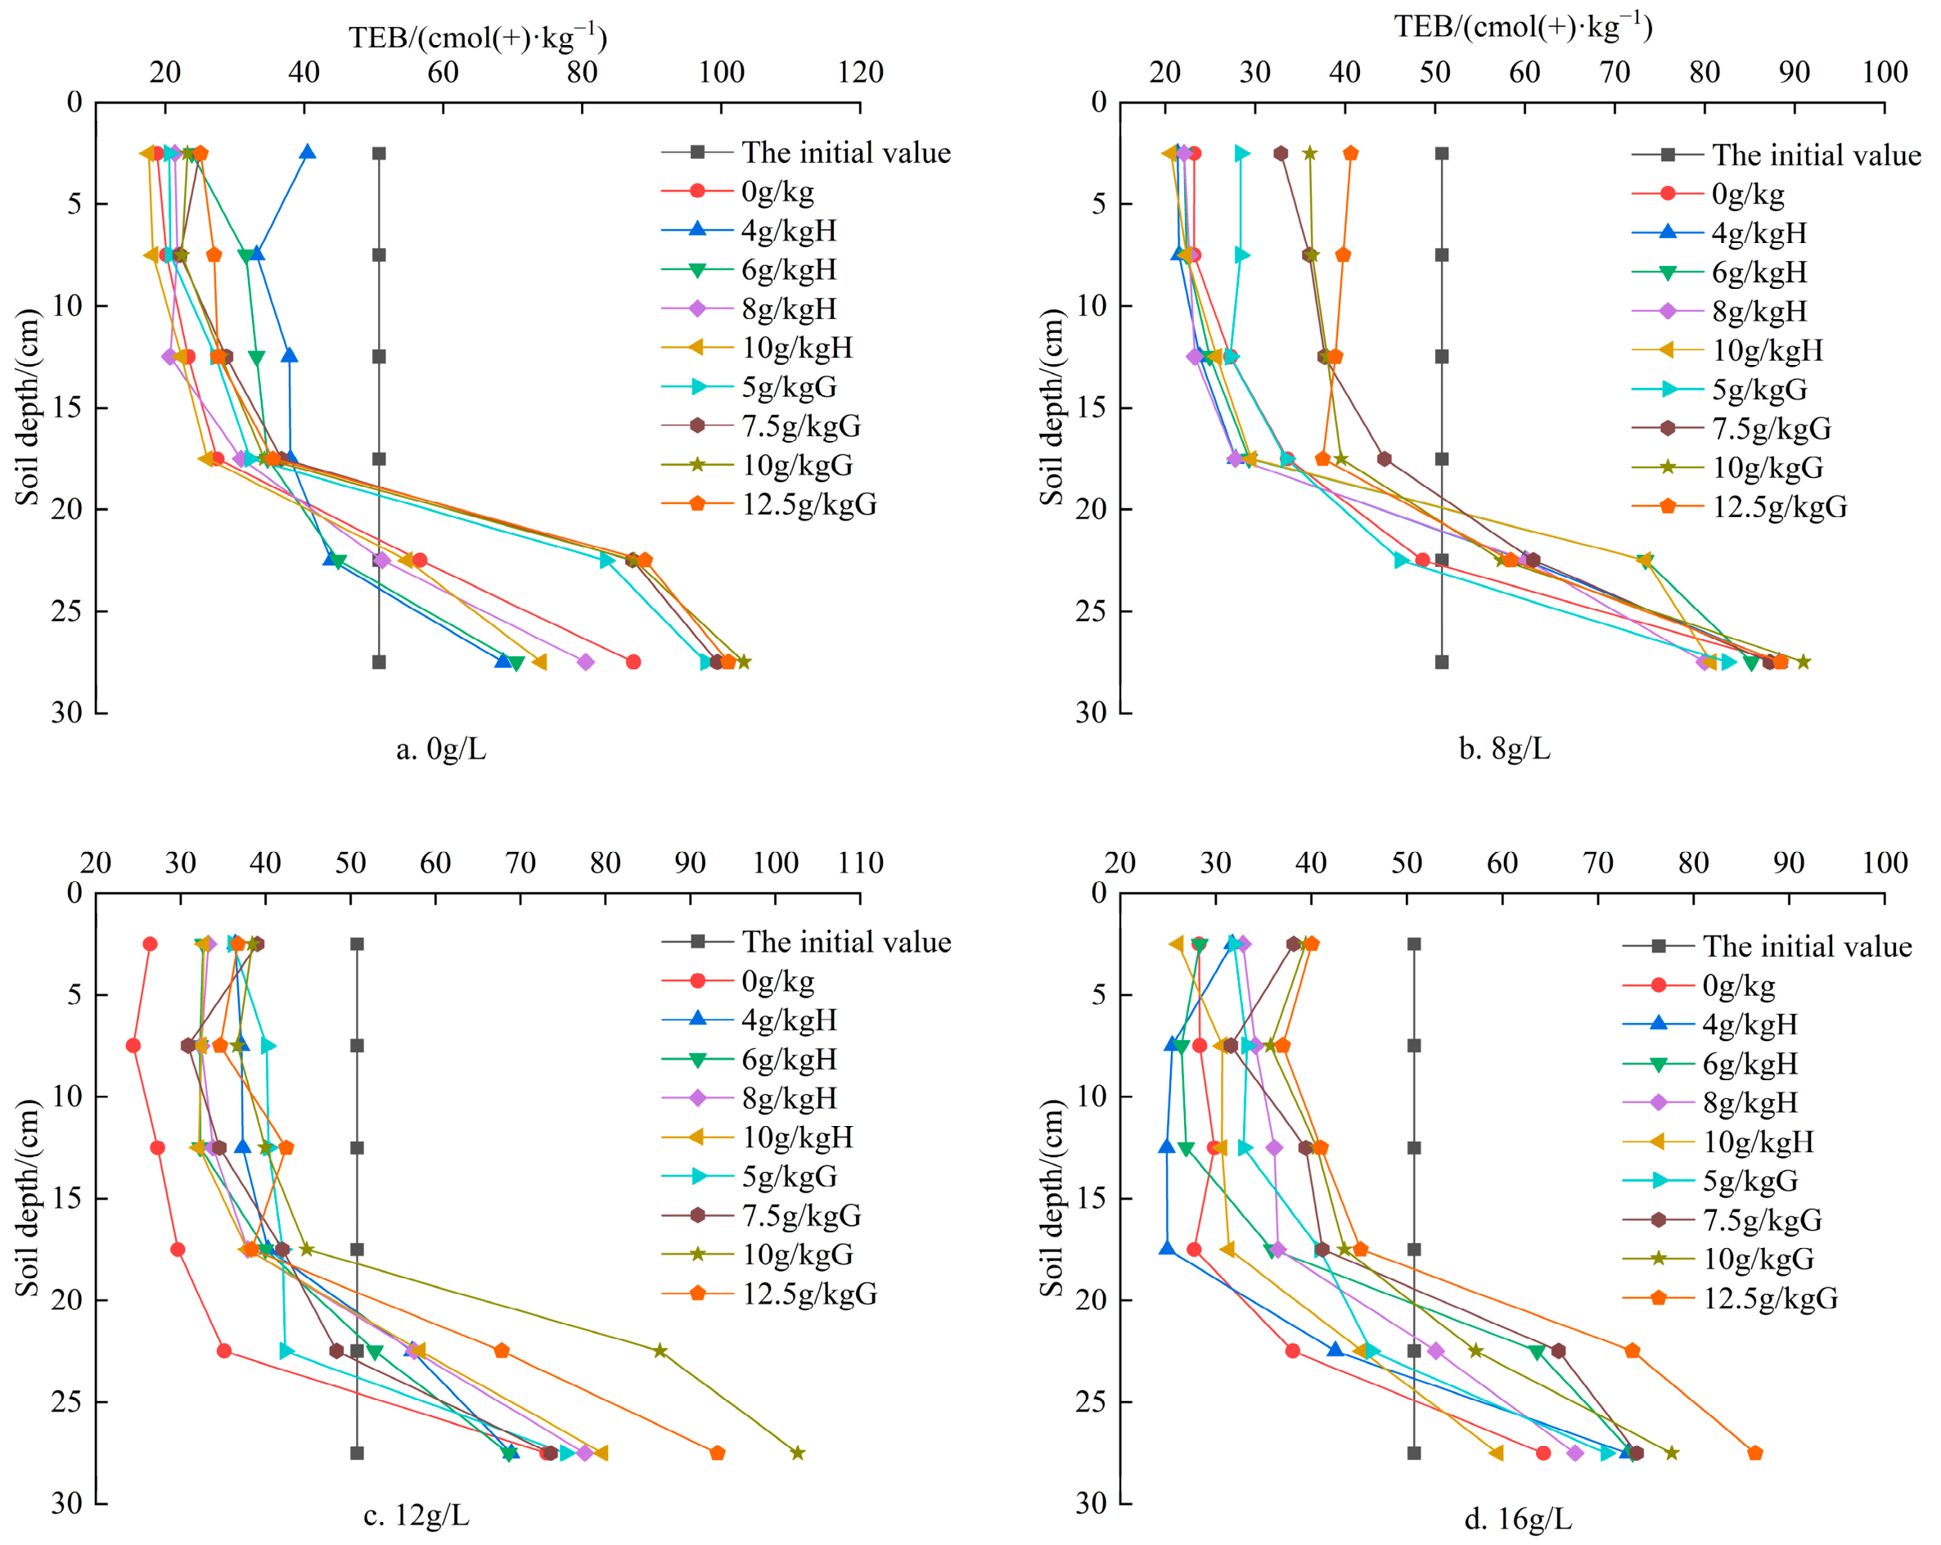
As shown in Figure 16, soil TEB increased with both irrigation water mineralization and soil depth, reaching the highest values in the 25–30 cm layer. Under 0 g/L mineralization, sodium humate treatments resulted in lower TEB values in the 20–30 cm layer compared with the control (T1). In contrast, under high mineralization conditions, TEB increased slightly in deeper soil layers, indicating that sodium humate application partially mitigated the risk of deep salt accumulation. Across all mineralization levels, gypsum treatments increased TEB values in every soil layer compared with the corresponding controls. Moreover, within the 0–30 cm profile, TEB values under gypsum treatments were consistently higher than those under sodium humate treatments at equivalent application rates. Under all mineralization conditions, gypsum treatments resulted in higher soil TEB values in each soil layer than the corresponding controls. The TEB values under the 10 g/kg gypsum treatment were also higher than those under the 10 g/kg sodium humate treatment, which may be attributed to the increase in Ca2+ supplied by gypsum, thereby increasing the total exchangeable bases in soil.

3.5. Effects of Different Soil Amendments on the Correlation Among Soil Parameters

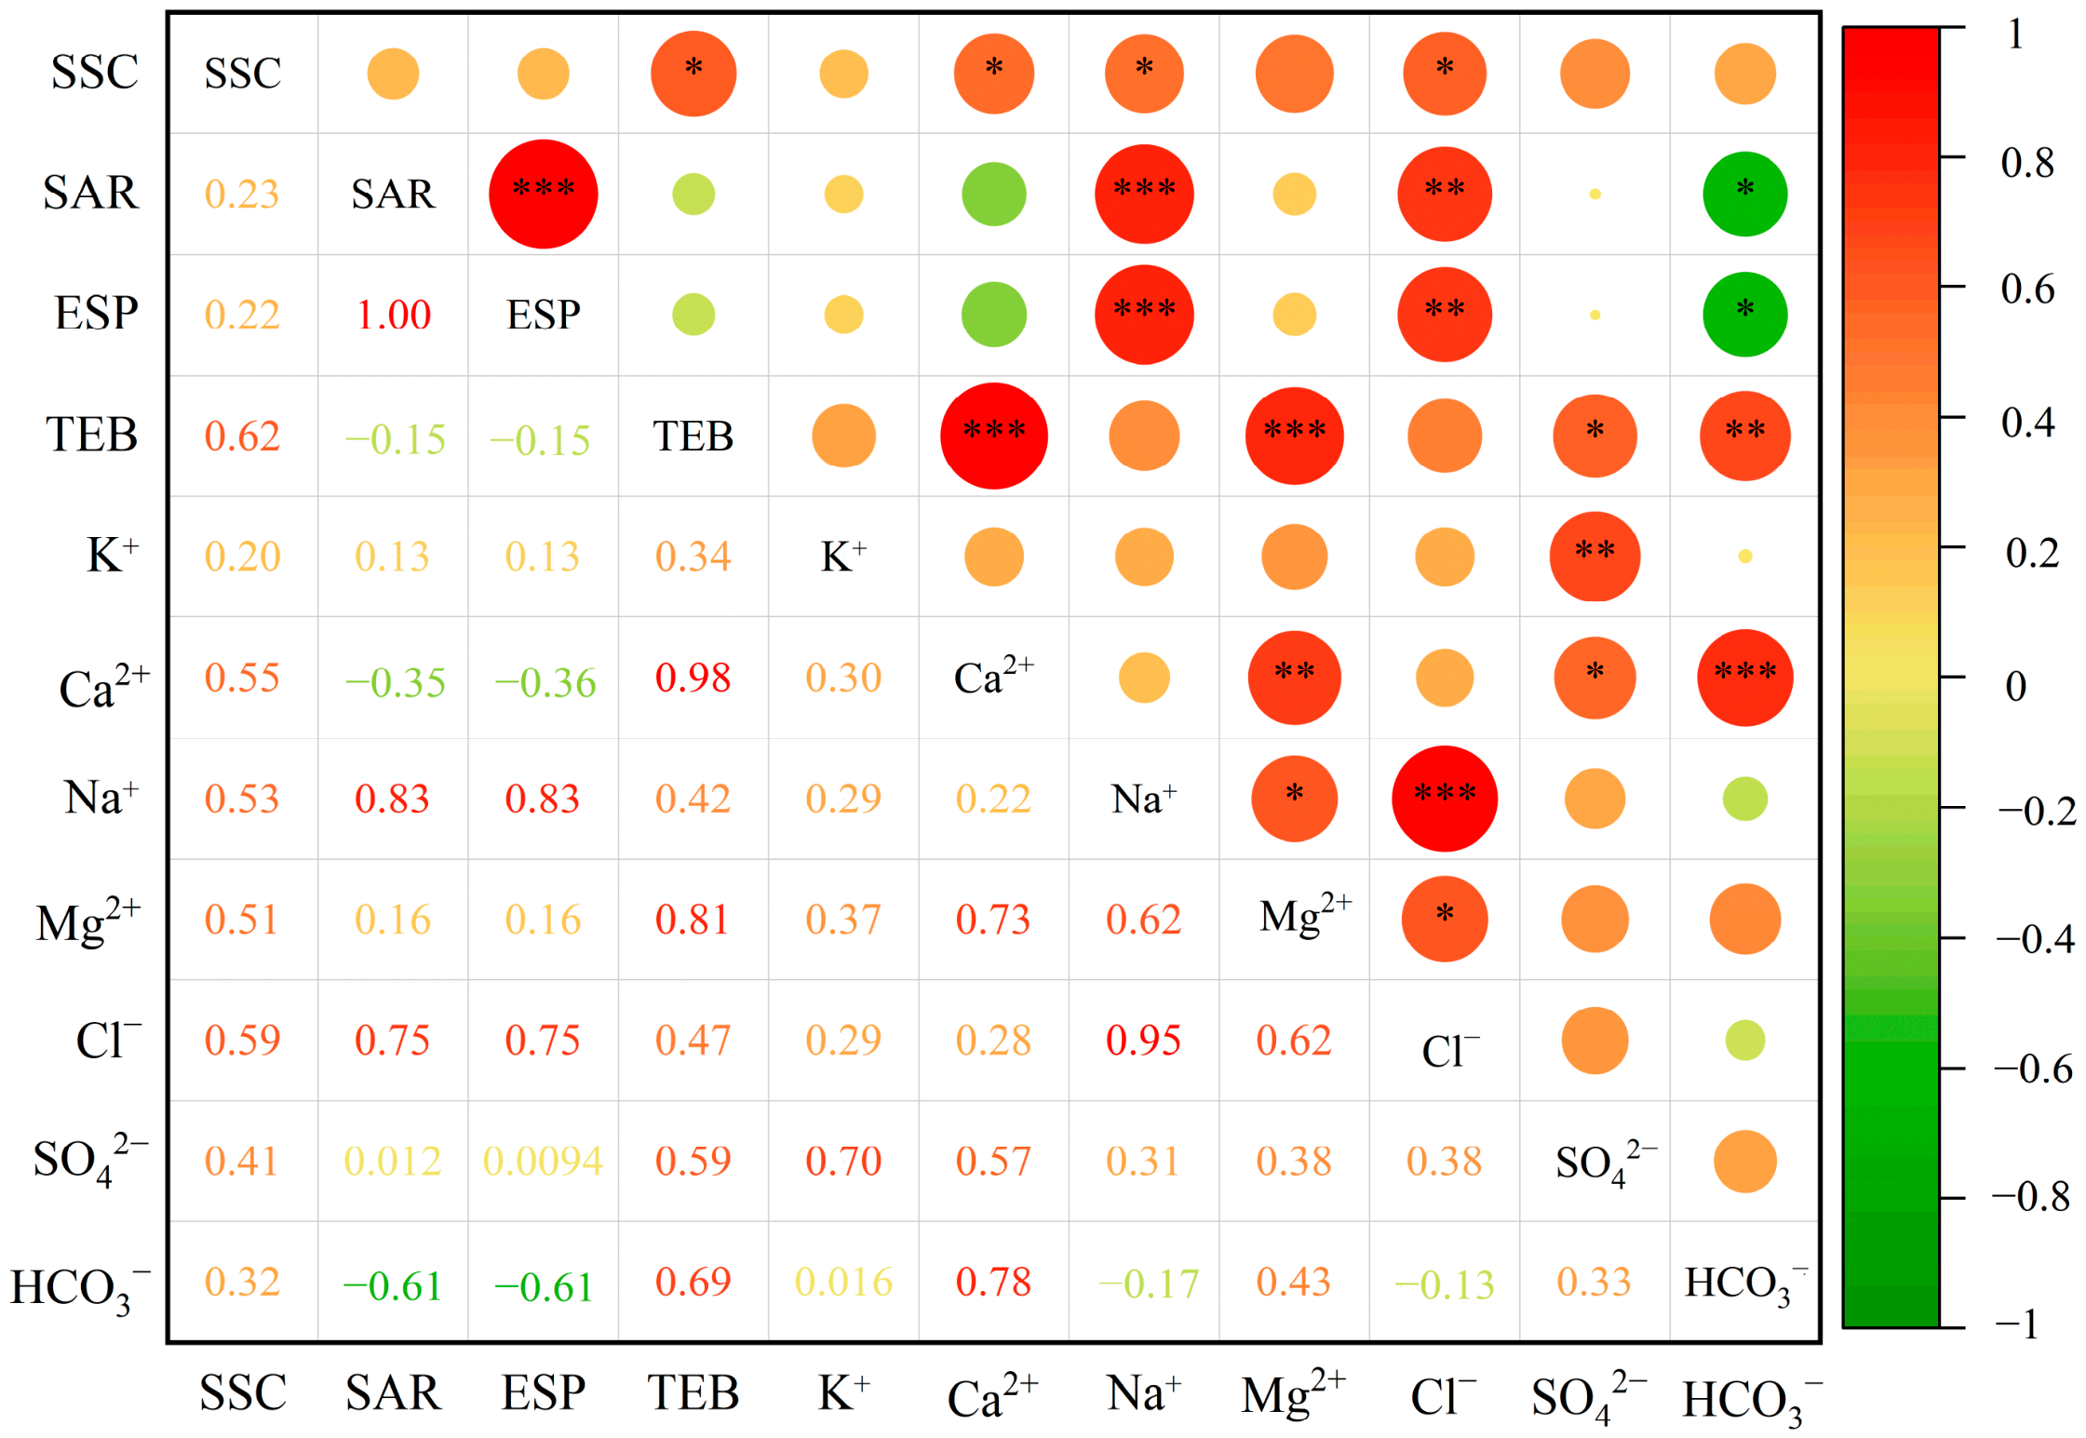
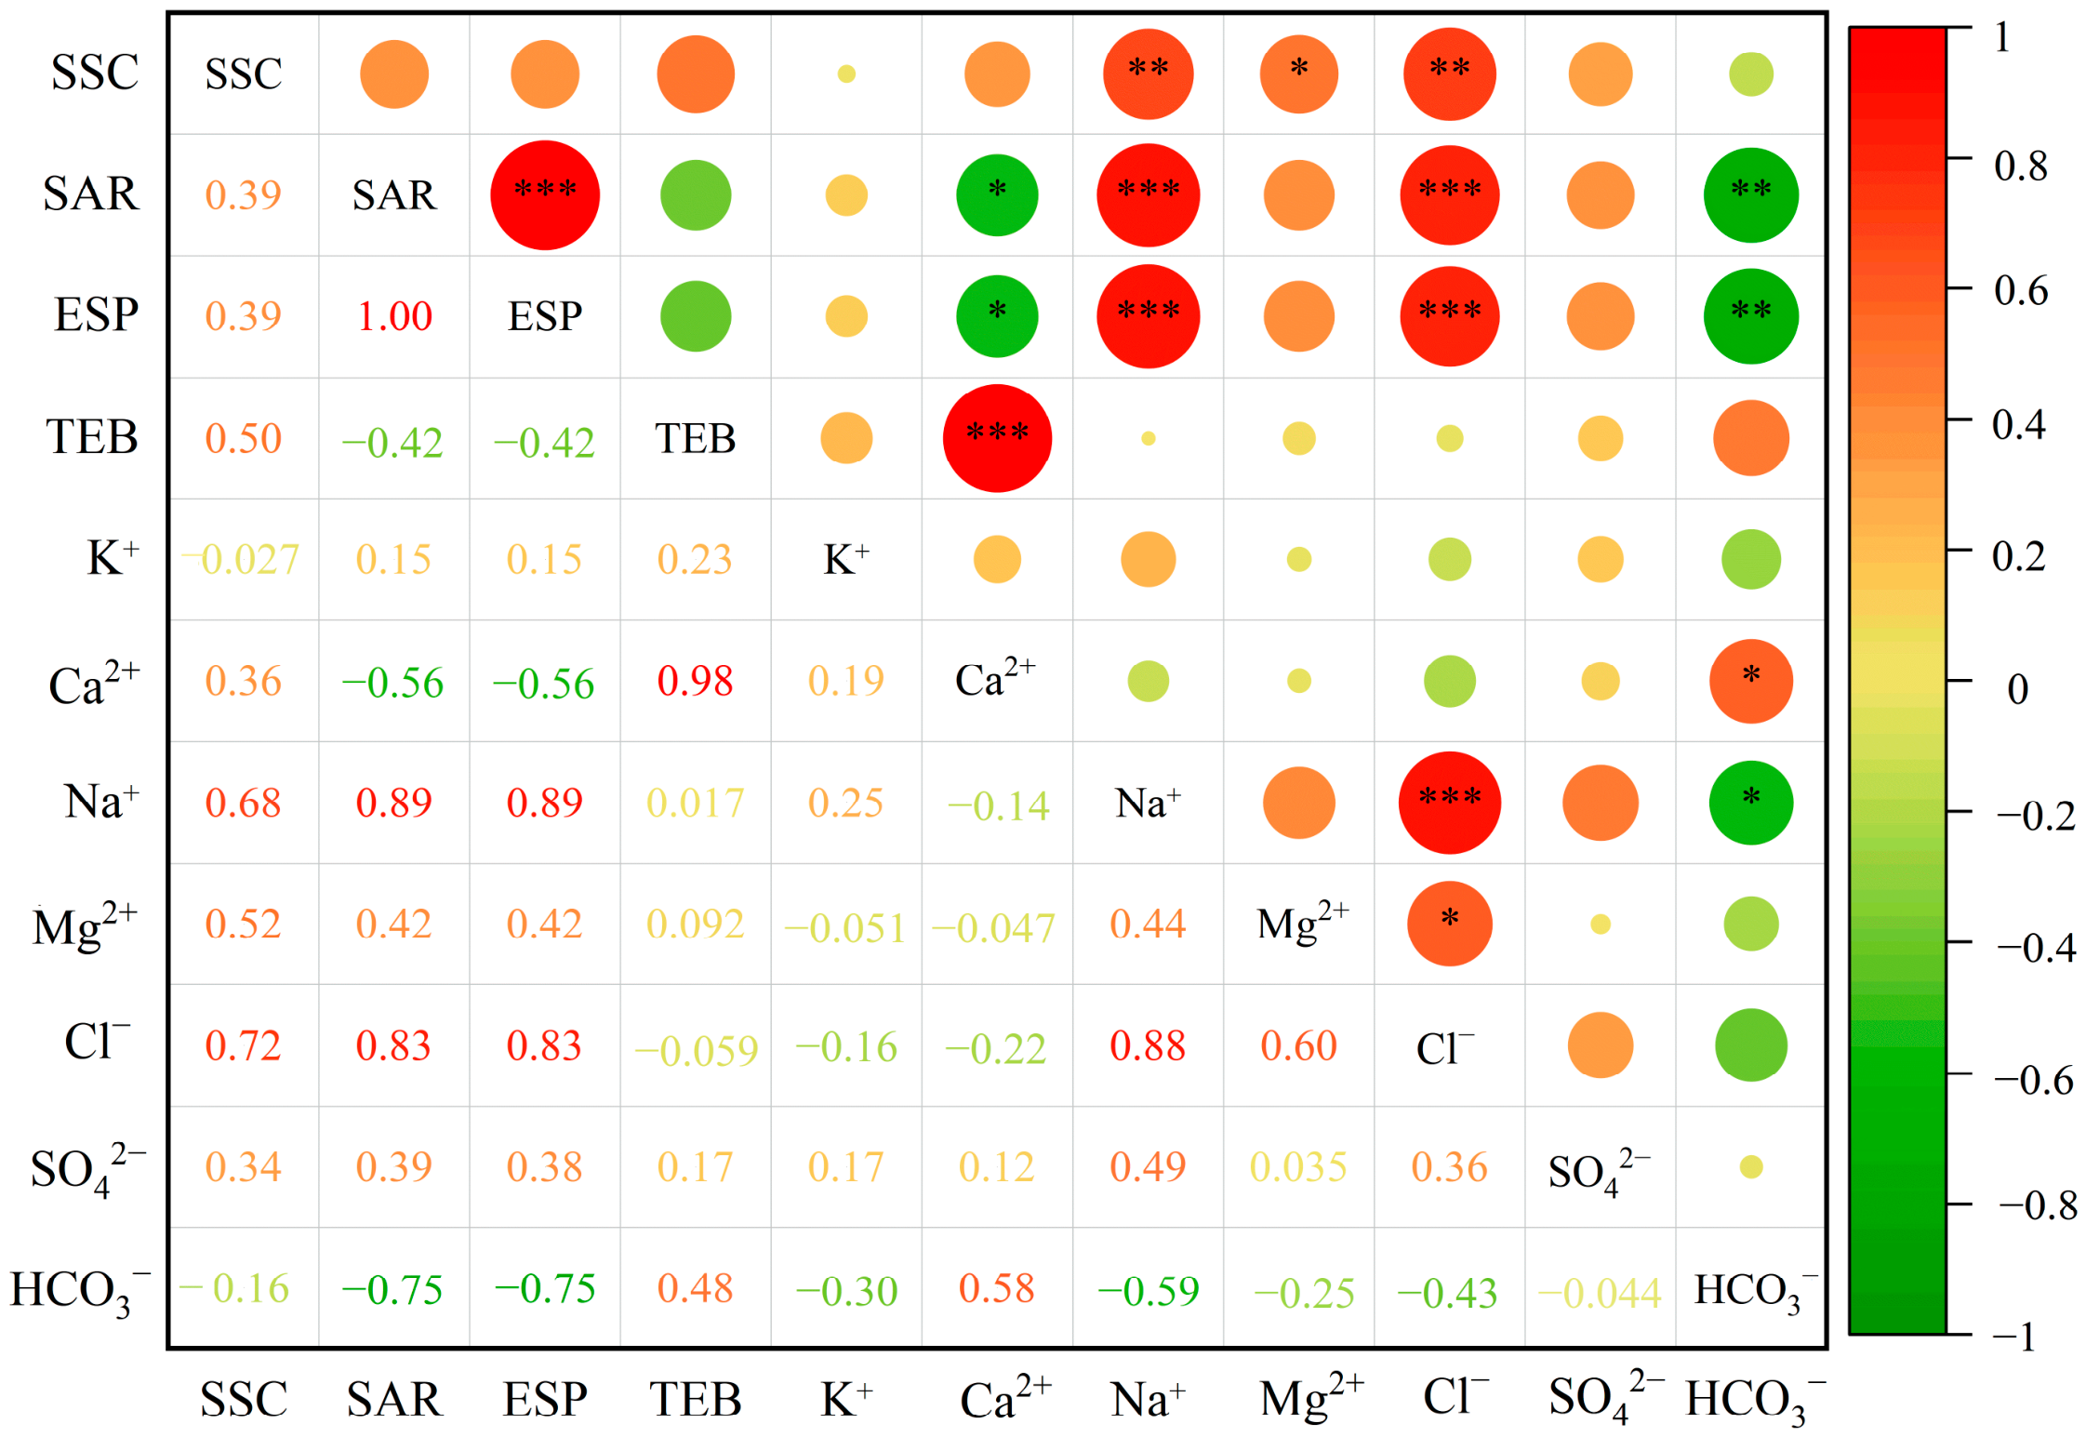
Under different salinity levels and sodium humate application rates, the Pearson correlations among soil variables are shown in Figure 17. Soil salinity content (SSC) was positively correlated with Ca2+, Na+, Mg2+, and Cl, with the strongest correlation observed with Cl. HCO3 showed negative correlations with the sodium adsorption ratio (SAR) and exchangeable sodium percentage (ESP), indicating that its variation pattern is associated with soil alkalization indices. SAR and ESP were both significantly positively correlated with Na+ and also showed significant positive correlations with Cl, reflecting the structural relationships among these variables. The total exchangeable bases (TEB) exhibited highly significant positive correlations with Ca2+ and Mg2+ (r = 0.98 and 0.81), suggesting consistent variation trends between these ions and TEB. In general, positive correlations were observed among most ions, with Na+ and Cl showing a highly significant positive correlation (r = 0.95), indicating that they exhibit similar variation patterns under different treatment conditions.
Under different mineralization levels, the Pearson correlations among soil parameters in the desulfurized gypsum treatments are shown in Figure 18. Soil salt content (SSC) exhibited a significant positive correlation with Na+, Cl, and Mg2+, with the strongest correlation observed for Cl. Under gypsum application, both the sodium adsorption ratio (SAR) and exchangeable sodium percentage (ESP) were highly positively correlated with Na+ and Cl, indicating that Na+ and Cl play dominant roles in soil salinization and alkalization under gypsum-amended conditions. In contrast, SAR and ESP were negatively correlated with HCO3 (r = −0.75), and this relationship was stronger than that observed under sodium humate treatments (r = −0.61), suggesting that HCO3 more effectively inhibits the increase in SAR and ESP in gypsum-treated soils. Moreover, Ca2+ showed a negative correlation with both SAR (r = −0.56) and ESP (r = −0.56), while it remained highly positively correlated with TEB (r = 0.98). This indicates that gypsum application supplies abundant Ca2+, which plays a key role in regulating the soil ionic balance and mitigating sodicity.

4. Discussion

4.1. Effects of Different Mineralization Levels and Soil Amendments on Infiltration Characteristics and Salt Composition

In this study, the irrigation water used was high-mineralization saline water. With the progression of infiltration, the ionic concentration and osmotic pressure of the soil solution increased accordingly. Under conditions without amendment application, the infiltration time showed a decreasing trend with increasing water salinity, indicating an enhancement of soil water infiltration capacity, and the infiltration rate was generally higher than that under freshwater conditions [43]. This phenomenon may be related to changes in soil solution properties under high salinity conditions and their influence on water movement processes. Under different salinity levels of saline water irrigation, sodium humate and desulfurization gypsum exhibited distinct effects on the advancement of the wetting front. Appropriate application rates of sodium humate promoted wetting front movement, accelerated water infiltration, and shortened infiltration time. Under different salinity conditions, infiltration time under low application rates of sodium humate was generally shorter than that under high application rates [44]. In this study, under 0 and 8 g/L salinity conditions, the shortest infiltration time was observed at a sodium humate application rate of 6 g/kg; whereas under 12 and 16 g/L conditions, infiltration time increased with increasing application rates and even exceeded that of the control. This is consistent with the findings of Mamedov et al. (2016) [12], who reported that the effects of humic substances on soil structure and infiltration are not unidirectional and may, under certain conditions, enhance clay dispersion and reduce infiltration capacity.
In addition, the relative desalination rate did not continuously increase with increasing sodium humate application rates. Besides the influence of soil texture, this phenomenon may also be related to the physicochemical properties of sodium humate. Unlike humic acid, sodium humate can promote salt migration with water to some extent; however, it also introduces Na+ into the soil system. With increasing application rates, this may affect the Na+ balance in the soil solution, thereby partially offsetting the overall desalination effect.
Previous studies have shown that gypsum can promote water movement in sodic soils in Northeast China [30,31]. However, in this study, the application of desulfurization gypsum under different salinity conditions consistently delayed wetting front advancement and significantly prolonged infiltration time. At the same time, the wetting front depth under the 12.5 g/kg treatment was the shallowest. Although the wetting front movement showed similar trends among treatments at the initial stage of infiltration, its advancement rate decreased with increasing gypsum application rates over time [45,46]. This may be attributed to the blockage of soil pores by gypsum particles and reaction products such as CaCO3 [31], resulting in reduced wetting front migration distance and increased total infiltration time. Soil salts migrated downward with water infiltration and exhibited redistribution characteristics under different salinity levels and gypsum application rates. Under freshwater conditions, application rates of 5 and 7.5 g/kg reduced soil salinity, whereas higher rates (10 and 12.5 g/kg) showed a tendency toward salt accumulation. Excessive gypsum application may influence pore structure or ion transport processes, thereby weakening the desalination effect and increasing total soil salinity [33].
Three models, namely Philip, Kostiakov, and Horton, were used to describe soil infiltration characteristics under different salinity conditions, and differences in fitting performance were observed. Sun et al. [47] reported that both Philip and Kostiakov models can effectively simulate infiltration processes, with the Kostiakov model showing higher coefficients of determination than the Philip model. Ma et al. [43] suggested that the Philip model performs poorly and is not suitable for soils amended with humic substances, whereas the Kostiakov model exhibits higher fitting accuracy and better performance. In this study, under different salinity conditions, the Kostiakov model showed high adjusted coefficients of determination ( R a d j 2 > 0.99) and low global performance indicator (GPI) values, indicating its superiority in both fitting accuracy and overall performance.

4.2. Ionic Composition Characteristics and Interrelationships

The PearsonHigh concentrations of Na+ in saline–alkali soils can severely disrupt soil structure [48]. Under freshwater irrigation, the 6 g/kg sodium humate treatment exhibited the best leaching performance, whereas the 8 g/kg treatment significantly increased soil Na+ content. This is likely because sodium humate exists as a sodium salt, and its dissolution introduces additional Na+ into the soil, elevating Na+ concentrations in the surface layer. In this study, both sodium humate and desulfurized gypsum treatments exhibited the strongest correlations between soil salt content (SSC) and Na+, Cl, consistent with the findings of Sun et al. [47]. Under 16 g/L irrigation, the salt-leaching effect of sodium humate was reduced, yet it still suppressed salt accumulation in the 20–25 cm layer. The 4 g/kg treatment significantly reduced Na+ concentrations in the 0–25 cm soil profile, as sodium humate promoted Na+ leaching, thereby lowering ion content relative to the control [49]. In addition, sodium humate application improves soil permeability [50] and reduces soil alkalinity and salt ion concentrations, effectively enhancing saline-alkali soil conditions [51]. Desulfurized gypsum, being a moderately soluble salt, can increase total soil salinity when applied excessively [47]. This was also confirmed in the present study: high gypsum application rates increased salt content in all soil layers, with the effect more pronounced under 12 and 16 g/L irrigation. Under highly mineralized irrigation, the desalination efficiency decreased with increasing gypsum dosage [9]. This occurs because gypsum itself contains salts, and as both mineralization level and application rate increase, overall soil salinity rises accordingly [52]. Moreover, excessive gypsum use can also lead to heavy metal accumulation and other negative effects [53].
In this study, under the two amendment treatments, the contents of SO42− and Ca2+ did not vary markedly with increasing soil depth. This may be attributed to factors such as ionic charge, hydration radius, and ion concentration, which enhance their adsorption onto soil colloids, resulting in relatively low spatial variability and a more uniform distribution within the soil profile [49]. The surface Mg2+ content increased with irrigation water salinity, possibly because Mg2+ ions were adsorbed and fixed by soil colloids, while concentrations in the 10–25 cm layers remained uniform [49]. Under high mineralization, Ca2+ concentrations increased with both gypsum dosage and salinity, as saline water infiltration and gypsum dissolution supplied additional Ca2+ to the soil. The Ca2+ and SO42− released from gypsum replaced Na+ adsorbed on soil colloids, thereby reducing ESP and improving soil structure [54,55]. Through flocculation and aggregation effects, Ca2+ converted soil colloids into calcium-dominated structures, increasing cohesion and reducing infiltration rates [56,57], consistent with findings by Zhang Jihong, Gao Xiaolong, and others [45,57]. K+ and Cl concentrations showed little variation in the upper 20 cm but accumulated significantly below 20 cm, as soluble K+ migrated downward with infiltrating water [51]. All treatments in this study enhanced the downward movement of K+ into deeper soil layers. HCO3 showed a positive correlation with Ca2+ [47]. The hydrolysis of HCO3 releases OH, which slightly increases soil pH [47], and can react with Ca2+ to form CaCO3 precipitation. This process may impede water infiltration and reduce the amount of soluble Ca2+ available for exchange with Na+ in the soil, which may, to some extent, indirectly increase the soil alkalization degree (ESP).
Both sodium humate and gypsum effectively suppressed increases in surface-layer SAR and ESP, likely because both parameters are strongly correlated with Na+. The SAR-reducing effect of gypsum weakened with depth and increasing mineralization. Gypsum alleviated ESP accumulation by supplying Ca2+, Mg2+, and SO42− [58], though excessive use elevated TEB, reducing its overall improvement efficiency [23]. This was also confirmed in this study, where Ca2+ and Mg2+ were highly positively correlated with TEB under gypsum treatments. In contrast, sodium humate improved infiltration capacity, promoting the downward transport of salt ions, thereby reducing Na+ content, suppressing SAR, and mitigating shallow-layer TEB increases, ultimately alleviating salt stress [59].

5. Conclusions

This study systematically investigated the effects of saline water irrigation with different mineralization levels and different amendments on water infiltration characteristics and ion composition in saline-alkali soil. The results showed that the application of an appropriate amount of sodium humate under saline water irrigation effectively improved infiltration capacity, whereas desulfurized gypsum showed the opposite effect. The three infiltration models could adequately reflect the effects of amendments on the infiltration characteristics of saline-alkali soil under saline water irrigation with different mineralization levels. Among them, the Kostiakov model accurately described the effects of amendments on the infiltration characteristics of saline-alkali soil under different mineralization levels of saline water irrigation. Meanwhile, compared with desulfurized gypsum, sodium humate application more effectively reduced soil salt content under saline water irrigation, and its desalination effect first increased and then decreased with increasing mineralization. Soil Na+ and Cl were more likely than Ca2+ and Mg2+ to migrate to deeper soil layers and accumulate during infiltration, and they were significantly positively correlated with soil salt content, sodium adsorption ratio (SAR), and exchangeable sodium percentage (ESP). In contrast, Ca2+, Mg2+, and HCO3 could alleviate the risk of salinization and alkalization. In sodium humate treatments, total exchangeable bases were positively correlated with Ca2+, Mg2+, SO42−, and HCO3. In desulfurized gypsum treatments, TEB was extremely significantly positively correlated with Ca2+. In practical field applications of saline water irrigation, soil salinity status, irrigation water mineralization, and amendment objectives should be comprehensively considered. Appropriate application of sodium humate can promote water movement and salt leaching by improving infiltration performance. From the perspective of reducing soil sodification risk, a relatively low application rate of desulfurized gypsum may be considered. In addition, the combined application of different amendments can be further considered to achieve comprehensive optimization of soil water–salt regulation in saline–alkali soils.

Author Contributions

Q.F., Y.D., C.W. and H.X. designed the experiment; Q.F. and Y.D. conducted the experiment; Y.D. wrote the manuscript. Q.F., S.L., Z.M. and Q.W. critically reviewed and edited the manuscript. All authors have read and agreed to the published version of the manuscript.

Funding

This study was funded by the Major Science and Technology Project of the Xinjiang Uygur Autonomous Region (Nos. 2023A02002-5, 2024A03007-5), and Desert Afforestation Service Project for High-Salinity Mine Waterlogging Areas of the Dananhu No. 7 Coal Mine (E3410104).

Data Availability Statement

The original contributions presented in this study are included in the article. Further inquiries can be directed to the corresponding authors.

Acknowledgments

We appreciate and thank the anonymous reviewers for helpful comments that led to an overall improvement of the manuscript. We also thank the Journal Editor Board for their help and patience throughout the review process.

Conflicts of Interest

The authors declare no conflicts of interest.

References

  1. Yang, J.S.; Yao, R.J.; Wang, X.P.; Xie, W.P.; Zhang, X.; Zhu, W.; Zhang, L.; Sun, R.J. Prevent Soil Salinization and Improve Soil Productivity. Science 2021, 73, 30–34. (In Chinese) [Google Scholar]
  2. Feng, Q.; Yin, X.; Zhu, M.; Zhang, J.; Liu, W.; Xi, H.; Lu, Z. Overall promotion of integrated management and utilization of saline-alkali land in Northwest China: Conditions, challenges, and recommendations. Bull. Chin. Acad. Sci. 2024, 39, 2060–2073. [Google Scholar] [CrossRef]
  3. Pan, J.; Xue, X.; Huang, C.; You, Q.; Guo, P.; Yang, R.; Da, F.; Duan, Z.; Peng, F. Effect of salinization on soil properties and mechanisms beneficial to microorganisms in salinized soil remediation—A review. Res. Cold Arid Reg. 2024, 16, 121–128. [Google Scholar] [CrossRef]
  4. Sun, Y.; Liu, J.; Wu, J.; Feng, Z.; Liu, X.; Hu, Z.; Ye, J. Effects of different biomass materials on the physicochemical properties and water-salt transport characteristics of saline-alkali soil. Soils, 2025; in press. [CrossRef]
  5. Chen, W.; Zheng, Z.K.; Xie, J.J.; Zhao, Y.G.; Hu, J.Y. Study on the Unconventional Water Sources: Bitter Salty Water Resources and Its Distribution Characteristics in China. J. China Hydrol. 2021, 41, 1–6. (In Chinese) [Google Scholar]
  6. Tian, F.Q.; Wen, J.; Hu, H.C.; Ni, G.H. Review on Water and Salt Transport and Regulation in Drip Irrigated Fields in Arid Regions. J. Hydraul. Eng. 2018, 49, 126–135. (In Chinese) [Google Scholar] [CrossRef]
  7. Li, D.; Shen, H.; Tian, J.; Guo, Y.; Liu, J. Review of saline-alkali land improvement. Mod. Agric. Sci. 2023, 24, 153–159. [Google Scholar]
  8. Nabi, F.; Sarfaraz, A.; Kama, R.; Kanwal, R.; Li, H. Structure-Based Function of Humic Acid in Abiotic Stress Alleviation in Plants: A Review. Plants 2025, 14, 1916. [Google Scholar] [CrossRef]
  9. Jia, L.; Liu, L.; Zhang, T.; Qu, A.; Li, Z.; Zhang, J. Application of soil amendments in the ecological restoration of salinized soils. J. Hunan Ecol. Sci. 2023, 10, 92–99. [Google Scholar]
  10. Yan, S.; Liu, C.; Liang, Y. Review on structural properties and multiple functionalities of humic acids. J. Agro-Environ. Sci. 2017, 36, 511–516. [Google Scholar] [CrossRef]
  11. Wu, J.; Li, Y.; Shao, F.; Wang, Z. Effects of biochemical fulvic acid on physical properties and water movement characteristics. J. Soil Water Conserv. 2021, 35, 159–164. [Google Scholar] [CrossRef]
  12. Mamedov, A.I.; Bar-Yosef, B.; Levkovich, I.; Rosenberg, R.; Silber, A.; Fine, P.; Levy, G.J. Amending soil with sludge, manure, humic acid, orthophosphate and phytic acid: Effects on infiltration, runoff and sediment loss. Land Degrad. Dev. 2016, 27, 1629–1639. [Google Scholar] [CrossRef]
  13. Li, X.; Shan, Y.; Wang, Q.; Ma, C.; Yu, L. Effect of humic acid on characteristics of salt and water transport in coastal saline-alkali soil. J. Soil Water Conserv. 2020, 34, 288–293. [Google Scholar] [CrossRef]
  14. He, J. Study on the effect of humic acid on the migration distance of wetting front during water infiltration. IOP Conf. Ser. Earth Environ. Sci. 2020, 651, 042009. [Google Scholar] [CrossRef]
  15. Gu, X. Effect of weathered lignite on the dynamic characteristics of water-stable aggregates in soda saline-alkali soil. J. Inn. Mong. Univ. Nat. Sci. 2022, 37, 15–22. [Google Scholar]
  16. Liu, M.; Wang, C.; Liu, X.; Lu, Y.; Wang, Y. Saline-alkali soil applied with vermicompost and humic acid fertilizer improved macroaggregate microstructure to enhance salt leaching and inhibit nitrogen losses. Appl. Soil Ecol. 2020, 156, 103705. [Google Scholar] [CrossRef]
  17. Wu, J. Research on the Improvement Effect of Humic Acid on the Coastal Clayey Saline Soil. Master’s Thesis, Shandong Agricultural University, Shandong, China, 2021. [Google Scholar]
  18. Huang, Y. Effect of Humic Acid on Desalination of Coastal Viscous Saline Soil. Master’s Thesis, Shandong Agricultural University, Shandong, China, 2021. [Google Scholar]
  19. Wang, Q.; Wang, Y.; Sun, Z.; Liu, J.; Niu, S.; Xue, C.; Ma, W. Amelioration effect of humic acid on saline-alkali soil. Chin. J. Appl. Ecol. 2019, 30, 1227–1234. [Google Scholar] [CrossRef]
  20. Yang, H.; Chen, Y.; Hou, X. Effects of biology humic acid on the component of soil carbon. Chin. Agric. Bull. 2015, 31, 137–141. [Google Scholar]
  21. Calvo, P.; Nelson, L.; Kloepper, J.W. Agricultural uses of plant biostimulants. Plant Soil 2014, 383, 3–41. [Google Scholar] [CrossRef]
  22. Zhao, Y.; Wang, S.; Li, Y.; Liu, J.; Zhuo, Y. Prospects of using flue gas desulfurization gypsum to ameliorate saline-alkaline soils. J. Tsinghua Univ. Sci. Technol. 2022, 62, 538–546. [Google Scholar]
  23. Shi, J.; Huang, C.; Liu, J.; Li, X.; Zhang, F. Effect of different application amounts of flue gas desulfurization gypsum on amelioration of saline-alkali soil and crop yield in Xinjiang, China. Chin. J. Environ. Eng. 2018, 12, 1800–1807. [Google Scholar] [CrossRef]
  24. Li, M.; Zhang, W.; Wang, S.; Li, Y.; Zhao, Y.; Liu, J.; Li, E.; Zhong, S. Suitable application of flue gas desulphurized gypsum to improve sunflower yield in saline-alkali soil in the Hetao irrigation areas of Inner Mongolia. Trans. Chin. Soc. Agric. Eng. 2022, 38, 76–83. [Google Scholar] [CrossRef]
  25. Yang, J.; Yao, R.; Wang, X.; Xie, W.; Zhang, X.; Zhu, W.; Zhang, L.; Sun, R. Research on salt-affected soils in China: History, status quo and prospect. Acta Pedol. Sin. 2022, 59, 10–27. [Google Scholar] [CrossRef]
  26. Liu, J.; Cui, J.; Liu, H.; Pan, Q.; He, X. Research progress of soil amelioration of acidified soil by soil amendments. J. Environ. Eng. Technol. 2022, 12, 173–184. [Google Scholar] [CrossRef]
  27. Zhao, P.; Huang, Z.B.; Ren, Z.X.; Yu, J.Y. Research and application on advance of soil conditioners of primary degraded soils in China. J. Drain. Irrig. Mach. Eng. 2022, 40, 618–625. [Google Scholar]
  28. Zhang, H.; Chen, X.; Fu, R.; Li, J.; Du, S. Effect of flue gas desulfurization gypsum on improvement of different coastal saline-alkali soils. Chin. J. Environ. Eng. 2017, 11, 4397–4407. [Google Scholar] [CrossRef]
  29. Xu, W.; Li, K.; Kong, W.; Geng, Y.; Li, Q.; Liu, C. Effect of application amount of desulphurization gypsum on water transport of coastal saline-alkali soil. J. Shandong Agric. Univ. Nat. Sci. 2021, 52, 110–114. [Google Scholar] [CrossRef]
  30. Du, X.; Yan, B.; Xu, Z.; Ren, X.; Qian, M. Effect of desulfurized gypsum on water-salt infiltration process of saline-sodic soils. Agric. Res. Arid Areas 2021, 39, 79–83. [Google Scholar] [CrossRef]
  31. Gao, X.; Wang, Y.; Bai, Y.; Ruan, X. Effects of desulfurized gypsum on one-dimensional horizontal imbibition characteristics and water movement parameters of saline-alkali soil. J. Soil Water Conserv. 2022, 36, 100–106. [Google Scholar] [CrossRef]
  32. Silveira, K.R.D.; Ribeiro, M.R.; Oliveira, L.B.D.; Heck, R.J.; Silveira, R.R.D. Gypsum-saturated water to reclaim alluvial saline sodic and sodic soils. Sci. Agric. 2008, 65, 69–76. [Google Scholar] [CrossRef]
  33. Mao, Y.; Li, X. Amelioration effect of flue gas desulfurization gypsum on coastal saline soil. Chin. Environ. Sci. 2016, 36, 225–231. [Google Scholar] [CrossRef]
  34. Lv, L.L. Determination of water-soluble potassium, calcium, sodium, and magnesium in soil by atomic absorption spectrometry. Xinjiang Nonferrous Met. 2020, 43, 60–62. [Google Scholar] [CrossRef]
  35. Bao, S.D. Soil Agrochemical Analysis; China Agriculture Press: Beijing, China, 2000. [Google Scholar]
  36. Richards, L.A. (Ed.) Diagnosis and Improvement of Saline and Alkali Soils; Agriculture Handbook No. 60; United States Department of Agriculture: Washington, DC, USA, 1954.
  37. Philip, J.R. The theory of infiltration: 1. The infiltration equation and its solution. Soil Sci. 1957, 83, 345–358. [Google Scholar] [CrossRef]
  38. Parhi, K.P.; Mishra, K.S.; Singh, R. A modification to Kostiakov and modified Kostiakov infiltration models. Water Resour. Manag. 2007, 21, 1973–1989. [Google Scholar] [CrossRef]
  39. Horton, R.E. An approach toward a physical interpretation of infiltration-capacity. Soil Sci. Soc. Am. J. 1941, 5, 399–417. [Google Scholar]
  40. Cheng, H.J.; Zhang, J.Y.; Wang, Q.J. Infiltration characteristics and applicability of models under vertical line-source irrigation with different emitter diameters. Water Sav. Irrig. 2020, 6, 29–32, 37. [Google Scholar]
  41. Mehdinejadiani, B.; Fathi, P. Analytical solutions of space fractional Boussinesq equation to simulate water table profiles between two parallel drainpipes under different initial conditions. Agric. Water Manag. 2020, 240, 106324. [Google Scholar] [CrossRef]
  42. Mehdinejadiani, B. A novel inverse model insensitive to initial guesses for estimating parameters of continuous time random walk-truncated power law model. J. Hydrol. 2025, 658, 133206. [Google Scholar] [CrossRef]
  43. Che, Z.; Wang, J.; Li, J. Effects of water quality, irrigation amount and nitrogen applied on soil salinity and cotton production under mulched drip irrigation in arid Northwest China. Agric. Water Manag. 2021, 247, 106738. [Google Scholar] [CrossRef]
  44. Ma, X.; Bai, Y.; Liu, X.; Wang, Y. Analysis of water infiltration characteristics and hydraulic parameters of sierozem soil under humic acid addition. Water 2023, 15, 1915. [Google Scholar] [CrossRef]
  45. Zhang, J.; Wang, Q.; Tan, S.; Xu, D. Effects of gypsum on water movement characteristics of saline-alkali soil under brackish water infiltration. J. Soil Water Conserv. 2016, 30, 130–135. [Google Scholar] [CrossRef]
  46. Liang, J.; Shi, W.; Wang, Q. Effects of gypsum on soil water infiltration characteristics. Bull. Soil Water Conserv. 2016, 36, 160–164. [Google Scholar] [CrossRef]
  47. Sun, Y.; Wu, J.; Qu, Z.; Han, N.; Lu, J.; Ma, Y.; Hu, Z. Effects of biochemical fulvic acid on the water–salt transport characteristics of soda saline–alkali soil with different textures. Trans. Chin. Soc. Agric. Eng. 2023, 39, 74–84. [Google Scholar] [CrossRef]
  48. Xiao, Q.; Wei, W.; Wu, H.; Wu, K.; Gong, X.; Li, M.; Wang, S.; Yin, L. Effect of combined application of desulfurization gypsum and soil amendment KIA on saline-alkali soil improvement. Agronomy 2024, 15, 53. [Google Scholar] [CrossRef]
  49. Bacilio, M.; Moreno, M.; Bashan, Y. Mitigation of negative effects of progressive soil salinity gradients by application of humic acids and inoculation with Pseudomonas stutzeri in a salt-tolerant and a salt-susceptible pepper. Appl. Soil Ecol. 2016, 107, 394–404. [Google Scholar] [CrossRef]
  50. Chen, W.; Guo, L.; Yan, B.; Gao, Y.; Ma, J.; Li, X. Effects of amendments on oat growth and soil physical properties in saline-alkali soils. J. Gansu Agric. Univ. 2024, 59, 65–76. [Google Scholar] [CrossRef]
  51. Wei, Z.; Wu, J.; Cai, L.; Ma, W. Effects of different improvement measures on water-soluble ions of farmland soil in the saline-alkali area of Dengmaying Lake, Gansu Province. Soils Fert. Sci. China 2021, 5, 226–232. [Google Scholar] [CrossRef]
  52. Yan, J.; Pang, C.; Zhang, Y.; Wu, Y.; Hou, Y.; Wang, J.; Qiao, M. Effects of desulfurized gypsum and humic acid interaction on soil and quinoa growth in saline-alkali land. Crops 2025, 41, 47–53. [Google Scholar] [CrossRef]
  53. Wang, H.; Wang, F.; Qin, W.; He, C.; Wang, F.; Liang, X.; Li, X. A critical review on the use of flue gas desulfurization gypsum to ameliorate saline-alkali soils and its prospect for reducing carbon emissions. Sci. Total Environ. 2024, 945, 174053. [Google Scholar] [CrossRef] [PubMed]
  54. Wang, Y.; Wang, Z.; Liang, F.; Jing, X.; Feng, W. Application of flue gas desulfurization gypsum improves multiple functions of saline-sodic soils across China. Chemosphere 2021, 277, 130345. [Google Scholar] [CrossRef]
  55. Tirado-Corbalá, R.; Slater, B.K.; Dick, W.A.; Bigham, J.; Muñoz-Muñoz, M. Gypsum amendment effects on micromorphology and aggregation in no-till Mollisols and Alfisols from western Ohio, USA. Geoderma Reg. 2019, 16, e00217. [Google Scholar] [CrossRef]
  56. Wang, S.J.; Chen, Q.; Li, Y.; Zhuo, Y.Q.; Xu, L.Z. Research on saline-alkali soil amelioration with FGD gypsum. Resour. Conserv. Recycl. 2017, 121, 82–92. [Google Scholar] [CrossRef]
  57. Gao, X.; Wang, Y.; Bai, Y.; Ruan, X.; Zhong, Y. Analysis of moisture infiltration in saline-alkali soil while adding desulfurized gypsum. Sci. Soil Water Conserv. 2022, 20, 66–74. [Google Scholar] [CrossRef]
  58. Shen, J.L.; Wang, B.; Tian, X.P.; Xu, X. Effect of improvement modes on physico-chemical characteristics of saline-alkali soil and rice yield. Jiangsu J. Agric. Sci. 2016, 32, 338–344. [Google Scholar] [CrossRef]
  59. Li, F.Z.; Huang, Z.B.; Ma, Y.; Sun, Z.J. Improvement effects of different environmental materials on coastal saline-alkali soil in Yellow River Delta. In Materials Science Forum; Trans Tech Publications Ltd.: Zurich, Switzerland, 2018; Volume 913, pp. 879–886. [Google Scholar] [CrossRef]
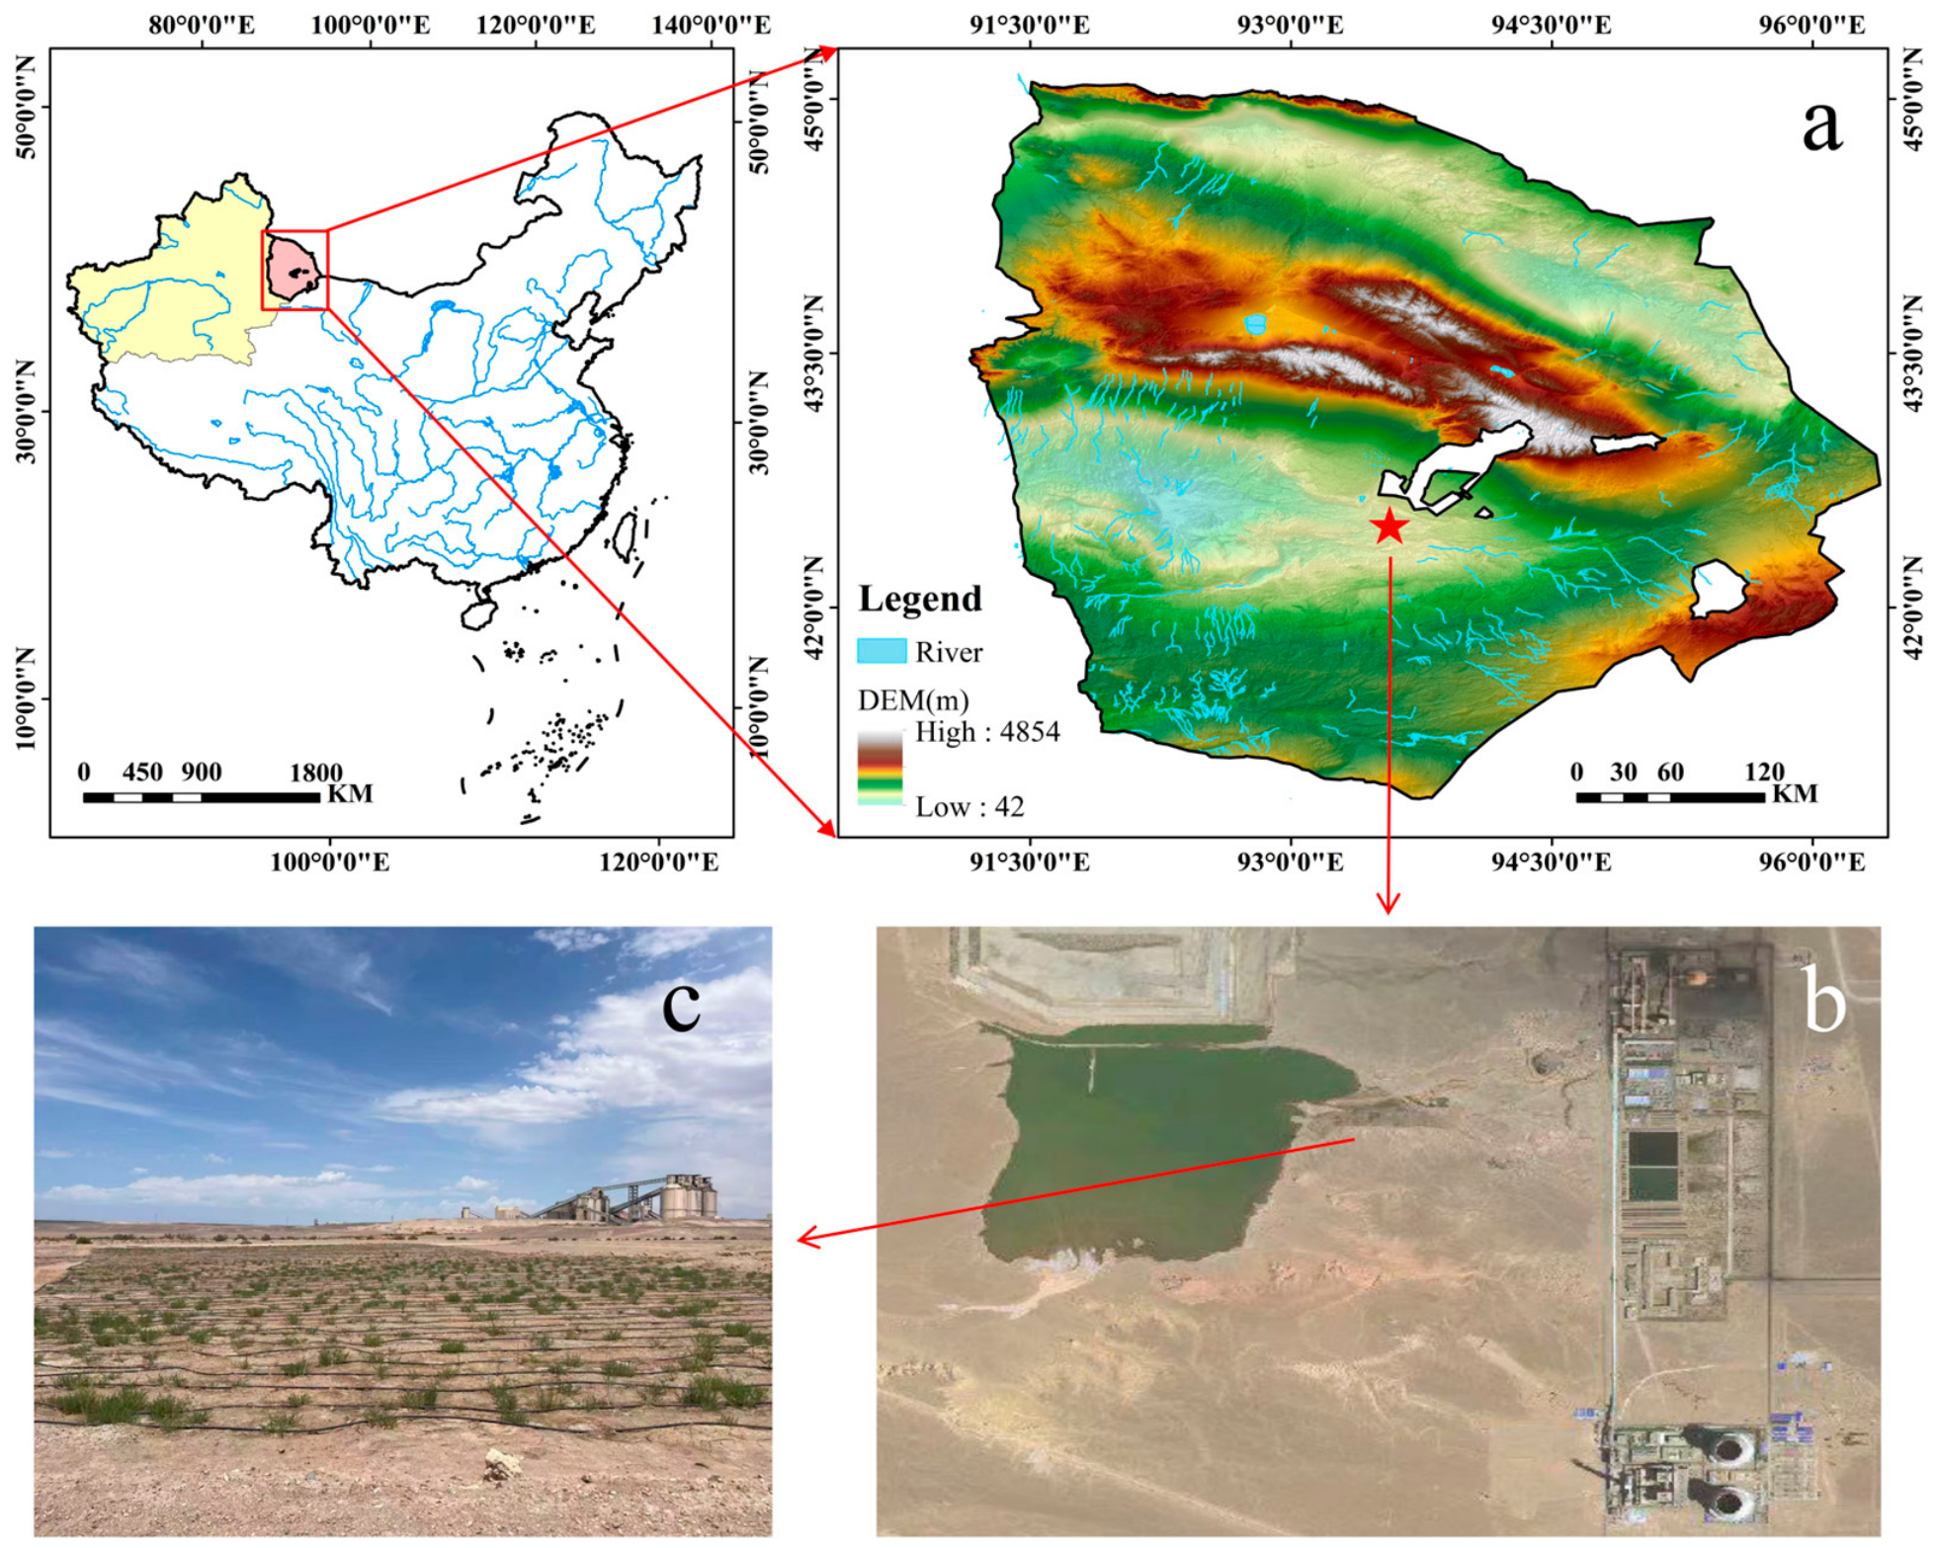
Figure 1. Overview of the sampling area. Note: Panel (a) shows the location and topographic map of the study area, panel (b) shows the satellite image of the experimental area, and panel (c) shows the field photograph of the experimental site.
Water 18 01253 g001
Figure 2. Photograph (a) and schematic diagram (b) of the one-dimensional constant-head vertical infiltration experimental setup.
Water 18 01253 g002
Figure 3. Variation in wetting front depth over time under saline water irrigation with different mineralization levels and sodium humate application rates.
Water 18 01253 g003
Figure 4. Variation in wetting front depth over time under saline water irrigation with different mineralization levels and desulfurized gypsum application rates.
Water 18 01253 g004
Figure 5. Effects of different sodium humate application rates on soil salt content under various saline water mineralization levels. Note: different lowercase letters indicate significant differences among treatments (p < 0.05).
Water 18 01253 g005
Figure 6. Effects of different desulfurized gypsum application rates on soil salt content under various saline water mineralization levels. Note: different lowercase letters indicate significant differences among treatments (p < 0.05).
Water 18 01253 g006
Figure 7. Effects of different soil amendments and application rates on Na+ distribution in soil under various saline water mineralization levels.
Water 18 01253 g007
Figure 8. Effects of different soil amendments and application rates on Ca2+ distribution in soil under various saline water mineralization levels.
Water 18 01253 g008
Figure 9. Effects of different soil amendments and application rates on Mg2+ distribution in soil under various saline water mineralization levels.
Water 18 01253 g009
Figure 10. Effects of different soil amendments and application rates on K+ distribution in soil under various saline water mineralization levels.
Water 18 01253 g010
Figure 11. Effects of different soil amendments and application rates on Cl distribution in soil under various saline water mineralization levels.
Water 18 01253 g011
Figure 12. Effects of different soil amendments and application rates on HCO3 distribution in soil under various saline water mineralization levels.
Water 18 01253 g012
Figure 13. Effects of different soil amendments and application rates on SO42− distribution in soil under various saline water mineralization levels.
Water 18 01253 g013
Figure 14. Effects of different soil amendments and application rates on soil sodium adsorption ratio (SAR) under various saline water mineralization levels.
Water 18 01253 g014
Figure 15. Effects of different soil amendments and application rates on soil exchangeable sodium percentage (ESP) under various saline water mineralization levels.
Water 18 01253 g015
Figure 16. Effects of different soil amendments and application rates on soil total exchangeable bases (TEB) under various saline water mineralization levels.
Water 18 01253 g016
Figure 17. Correlations among soil physicochemical parameters under different saline water mineralization levels and sodium humate application rates. Note: SSC represents soil salt content; SAR represents sodium adsorption ratio; ESP represents exchangeable sodium percentage; TEB represents total exchangeable bases. *, **, and *** indicate significance at the 0.05, 0.01, and 0.001 levels, respectively.
Water 18 01253 g017
Figure 18. Correlations among soil physicochemical parameters under different saline water mineralization levels and desulfurized gypsum application rates. Note: SSC represents soil salt content; SAR represents sodium adsorption ratio; ESP represents exchangeable sodium percentage; TEB represents total exchangeable bases. *, **, and *** indicate significance at the 0.05, 0.01, and 0.001 levels, respectively.
Water 18 01253 g018
Table 1. Physical properties of the saline–alkali soil used in the experiment.
Soil Depth (cm)Particle Composition (%)Bulk Density (g/cm3)θi (cm3/cm3)EC
(mS/cm)
Total Salt Content (g/kg)Soil pH
0.05~2.00
(mm)
0.002~0.05
(mm)
<0.002 (mm)
0~2091.37%3.23%5.40%1.620.0215.2920.928.73
Note: The soil particle composition was classified according to the USDA soil texture classification system.
Table 2. Ionic composition and related parameters of the tested saline–alkali soil.
Soil Sample
(cm)
Eight Major Ions/(g/kg)SAR
/(mmol/L)1/2
ESP
/%
ClSO42−Ca2+K+Mg2+Na+CO32−HCO3−
0~305.3734.5364.6240.0870.0446.234Not detected0.02311.2013.24
Note: “Not detected” indicates that the ion is either absent or below the detection limit of carbonate (0.03 mg/L).
Table 3. Initial ionic composition of mine water used for irrigation (mg/L).
Water SampleClSO42−Ca2+K+Mg2+Na+CO32−HCO3
mine water7165.1172530.555642.35025.952194.1255314.76Not detected174.511
Note: “Not detected” indicates that the ion is absent or below the detection limit for carbonate (0.03 mg/L).
Table 4. Theoretical dosages of chemical reagents used to prepare experimental water samples with different mineralization levels (g·L−1).
Mineralization LevelsNaClNa2SO4NaHCO3KClCaCl2MgCl2
83.1493.3540.0450.2151.6090.341
124.7235.0310.0680.3232.4140.511
166.2976.7080.0900.4303.2180.681
Table 5. Experimental treatment design.
No.TreatmentNo.TreatmentNo.Treatment
T1 (CK1)S0T13S12 + H4T25S8 + G5
T2 (CK2)S8T14S12 + H6T26S8 + G7.5
T3 (CK3)S12T15S12 + H8T27S8 + G10
T4 (CK4)S16T16S12 + H10T28S8 + G12.5
T5S0 + H4T17S16 + H4T29S12 + G5
T6S0 + H6T18S16 + H6T30S12 + G7.5
T7S0 + H8T19S16 + H8T31S12 + G10
T8S0 + H10T20S16 + H10T32S12 + G12.5
T9S8 + H4T21S0 + G5T33S16 + G5
T10S8 + H6T22S0 + G7.5T34S16 + G7.5
T11S8 + H8T23S0 + G10T35S16 + G10
T12S8 + H10T24S0 + G12.5T36S16 + G12.5
Note: S represents the salinity of irrigation water (g/L); H represents sodium humate (g/kg); G represents desulfurized gypsum (g/kg).
Table 6. Soil infiltration equations and fitting performance under different amendment types and application rates at an irrigation mineralization level of 0 g/L.
TreatmentModelInfiltration EquationsR2Adjusted R2GPI
T1Philip1.018 t0.50.94570.94404.402 × 10−2
Kostiakov1.842 t0.3650.99890.99885.691 × 10−8
Horton0.050 t + 4.772 (1 − e−0.264 t)0.98800.98682.746 × 10−5
T5Philip1.023 t0.50.92770.92547.652 × 10−2
Kostiakov1.940 t0.3510.99490.99453.048 × 10−6
Horton0.053 t + 4.504 (1 − e−0.437 t)0.99040.98943.509 × 10−6
T6Philip1.129 t0.50.93740.93515.925 × 10−2
Kostiakov2.027 t0.3600.99460.99423.213 × 10−6
Horton0.063 t + 4.654 (1 − e−0.434 t)0.99340.99271.755 × 10−6
T7Philip1.041 t0.50.92990.92767.557 × 10−2
Kostiakov1.950 t0.3540.99330.99287.314 × 10−6
Horton0.055 t + 4.493 (1 − e−0.497 t)0.99020.98921.932 × 10−6
T8Philip0.904 t0.50.98260.98202.121 × 10−3
Kostiakov1.240 t0.4290.99380.99341.058 × 10−5
Horton0.052 t + 3.585 (1 − e−0.336 t)0.9930.99243.435 × 10−6
T21Philip0.961 t0.50.89790.89532.019 × 10−1
Kostiakov2.093 t0.3290.99790.99781.749 × 10−7
Horton0.041 t + 5.130 (1 − e−0.291 t)0.98670.98562.413 × 10−5
T22Philip0.978 t0.50.89110.88785.103 × 10−1
Kostiakov2.070 t0.3370.99690.99679.494 × 10−7
Horton0.043 t + 5.114 (1 − e−0.334 t)0.9860.98491.606 × 10−5
T23Philip0.941 t0.50.87910.87612.983 × 10−1
Kostiakov2.173 t0.3190.99880.99874.998 × 10−9
Horton0.037 t + 5.380 (1 − e−0.246 t)0.97660.97481.088 × 10−4
T24Philip0.858 t0.50.93340.93197.023 × 10−2
Kostiakov1.701 t0.3540.99790.99786.151 × 10−8
Horton0.036 t + 4.695 (1 − e−0.228 t)0.98520.98352.438 × 10−4
Table 7. Soil infiltration equations and fitting performance under different amendment types and application rates at an irrigation mineralization level of 8 g/L.
TreatmentModelInfiltration EquationsR2Adjusted R2GPI
T2Philip1.033 t0.50.94220.94045.112 × 10−2
Kostiakov1.865 t0.3640.99540.99513.592 × 10−6
Horton0.055 t + 4.500 (1 − e−0.428 t)0.98800.98685.996 × 10−6
T9Philip1.159 t0.50.88740.88372.776 × 10−1
Kostiakov2.455 t0.3240.99420.99383.178 × 10−6
Horton0.058 t + 5.273 (1 − e−0.493 t)0.99070.98972.141 × 10−6
T10Philip1.207 t0.50.85030.84505.035 × 10−1
Kostiakov2.735 t0.3040.99660.99647.262 × 10−7
Horton0.058 t + 5.603 (1 − e−0.463 t)0.99060.98965.324 × 10−5
T11Philip1.089 t0.50.92720.92488.782 × 10−2
Kostiakov2.067 t0.3500.99660.99631.276 × 10−6
Horton0.057 t + 4.760 (1 − e−0.424 t)0.98790.98666.938 × 10−6
T12Philip1.001 t0.50.92420.92199.011 × 10−2
Kostiakov1.944 t0.3480.99530.99502.374 × 10−6
Horton0.050 t + 4.580 (1 − e−0.428 t)0.98270.98111.198 × 10−5
T25Philip1.003 t0.50.94790.94654.326 × 10−2
Kostiakov1.812 t0.3670.99850.99851.620 × 10−7
Horton0.048 t + 4.781 (1 − e−0.267 t)0.98670.98543.155 × 10−5
T26Philip0.964 t0.50.90850.90611.652 × 10−1
Kostiakov2.038 t0.3370.99630.99613.798 × 10−7
Horton0.041 t + 5.139 (1 − e−0.285 t)0.98960.98888.720 × 10−6
T27Philip0.967 t0.50.89790.89542.246 × 10−1
Kostiakov2.130 t0.3290.99890.99892.240 × 10−8
Horton0.039 t + 5.387 (1 − e−0.250 t)0.97950.97798.690 × 10−5
T28Philip0.894 t0.50.92720.92559.809 × 10−2
Kostiakov1.799 t0.3510.99490.99474.096 × 10−6
Horton0.039 t + 4.711 (1 − e−0.350 t)0.98570.98461.011 × 10−5
Table 8. Soil infiltration equations and fitting performance under different amendment types and application rates at an irrigation mineralization level of 12 g/L.
TreatmentModelInfiltration EquationsR2Adjusted R2GPI
T3Philip1.108 t0.50.92970.92759.118 × 10−2
Kostiakov2.094 t0.3520.99610.99592.338 × 10−7
Horton0.057 t + 4.911 (1 − e−0.408 t)0.98960.98853.223 × 10−5
T13Philip1.460 t0.50.90950.90541.652 × 10−1
Kostiakov2.753 t0.3350.99710.99683.368 × 10−8
Horton0.083 t + 5.752 (1 − e−0.416 t)0.9950.99421.642 × 10−6
T14Philip1.193 t0.50.96130.95981.970 × 10−2
Kostiakov1.902 t0.3860.99540.99503.344 × 10−6
Horton0.073 t + 4.497 (1 − e−0.425 t)0.99390.99311.684 × 10−6
T15Philip1.144 t0.50.91650.91341.162 × 10−1
Kostiakov2.210 t0.3420.99490.99452.127 × 10−6
Horton0.061 t + 4.883 (1 − e−0.453 t)0.99280.99191.505 × 10−6
T16Philip0.964 t0.50.96390.96261.729 × 10−2
Kostiakov1.729 t0.3900.99520.99495.307 × 10−6
Horton0.062 t + 4.312 (1 − e−0.422 t)0.99050.98953.982 × 10−6
T29Philip0.916 t0.50.98010.97953.141 × 10−3
Kostiakov1.331 t0.4170.99640.99625.804 × 10−7
Horton0.048 t + 4.079 (1 − e−0.198 t)0.99040.98961.896 × 10−5
T30Philip0.899 t0.50.95290.95172.841 × 10−2
Kostiakov1.601 t0.3730.99770.99752.117 × 10−7
Horton0.041 t + 4.509 (1 − e−0.216 t)0.99190.99121.416 × 10−5
T31Philip0.896 t0.50.94530.94404.648 × 10−2
Kostiakov1.676 t0.3650.99780.99773.094 × 10−7
Horton0.039 t + 4.711 (1 − e−0.220 t)0.98890.98802.886 × 10−5
T32Philip0.907 t0.50.90930.90721.728 × 10−1
Kostiakov1.963 t0.3370.99750.99745.024 × 10−7
Horton0.037 t + 5.114 (1 − e−0.276 t)0.98320.98193.508 × 10−5
Table 9. Soil infiltration equations and fitting performance under different amendment types and application rates at an irrigation mineralization level of 16 g/L.
TreatmentModelInfiltration EquationsR2Adjusted R2GPI
T4Philip1.083 t0.50.94200.94005.123 × 10−2
Kostiakov1.933 t0.3650.99480.99453.543 × 10−6
Horton0.059 t + 4.589 (1 − e−0.418 t)0.99210.99122.544 × 10−6
T17Philip1.318 t0.50.98480.98411.619 × 10−3
Kostiakov1.779 t0.4230.99870.99857.951 × 10−8
Horton0.085 t + 4.772 (1 − e−0.234 t)0.99480.99405.627 × 10−6
T18Philip1.242 t0.50.93710.93455.559 × 10−2
Kostiakov2.195 t0.3570.99810.99796.807 × 10−8
Horton0.071 t + 4.916 (1 − e−0.379 t)0.99250.99153.788 × 10−6
T19Philip1.193 t0.50.95150.94963.319 × 10−2
Kostiakov2.020 t0.3710.99830.99811.870 × 10−7
Horton0.068 t + 4.769 (1 − e−0.356 t)0.99100.98998.001 × 10−6
T20Philip1.066 t0.50.95360.95202.875 × 10−2
Kostiakov1.829 t0.3730.99820.99811.251 × 10−7
Horton0.056 t + 4.656 (1 − e−0.285 t)0.99190.99109.891 × 10−6
T33Philip1.092 t0.50.96060.95932.320 × 10−2
Kostiakov1.820 t0.3820.99850.99842.250 × 10−7
Horton0.058 t + 4.747 (1 − e−0.282 t)0.98810.98692.925 × 10−5
T34Philip1.011 t0.50.93190.92997.462 × 10−2
Kostiakov1.940 t0.3530.99880.99875.278 × 10−9
Horton0.046 t + 5.028 (1 − e−0.234 t)0.98890.98792.932 × 10−5
T35Philip0.885 t0.50.91770.91581.241 × 10−1
Kostiakov1.856 t0.3420.99750.99735.530 × 10−7
Horton0.037 t + 4.882 (1 − e−0.269 t)0.98500.98393.185 × 10−5
T36Philip0.754 t0.50.94090.93985.086 × 10−2
Kostiakov1.446 t0.3680.99040.99012.166 × 10−5
Horton0.031 t + 4.218 (1 − e−0.324 t)0.99100.99053.774 × 10−6
Disclaimer/Publisher’s Note: The statements, opinions and data contained in all publications are solely those of the individual author(s) and contributor(s) and not of MDPI and/or the editor(s). MDPI and/or the editor(s) disclaim responsibility for any injury to people or property resulting from any ideas, methods, instructions or products referred to in the content.