
Correlation Analysis of Wetland Pattern Changes and Groundwater in Kaifeng Downstream of the Yellow River, China

Abstract
1. Introduction
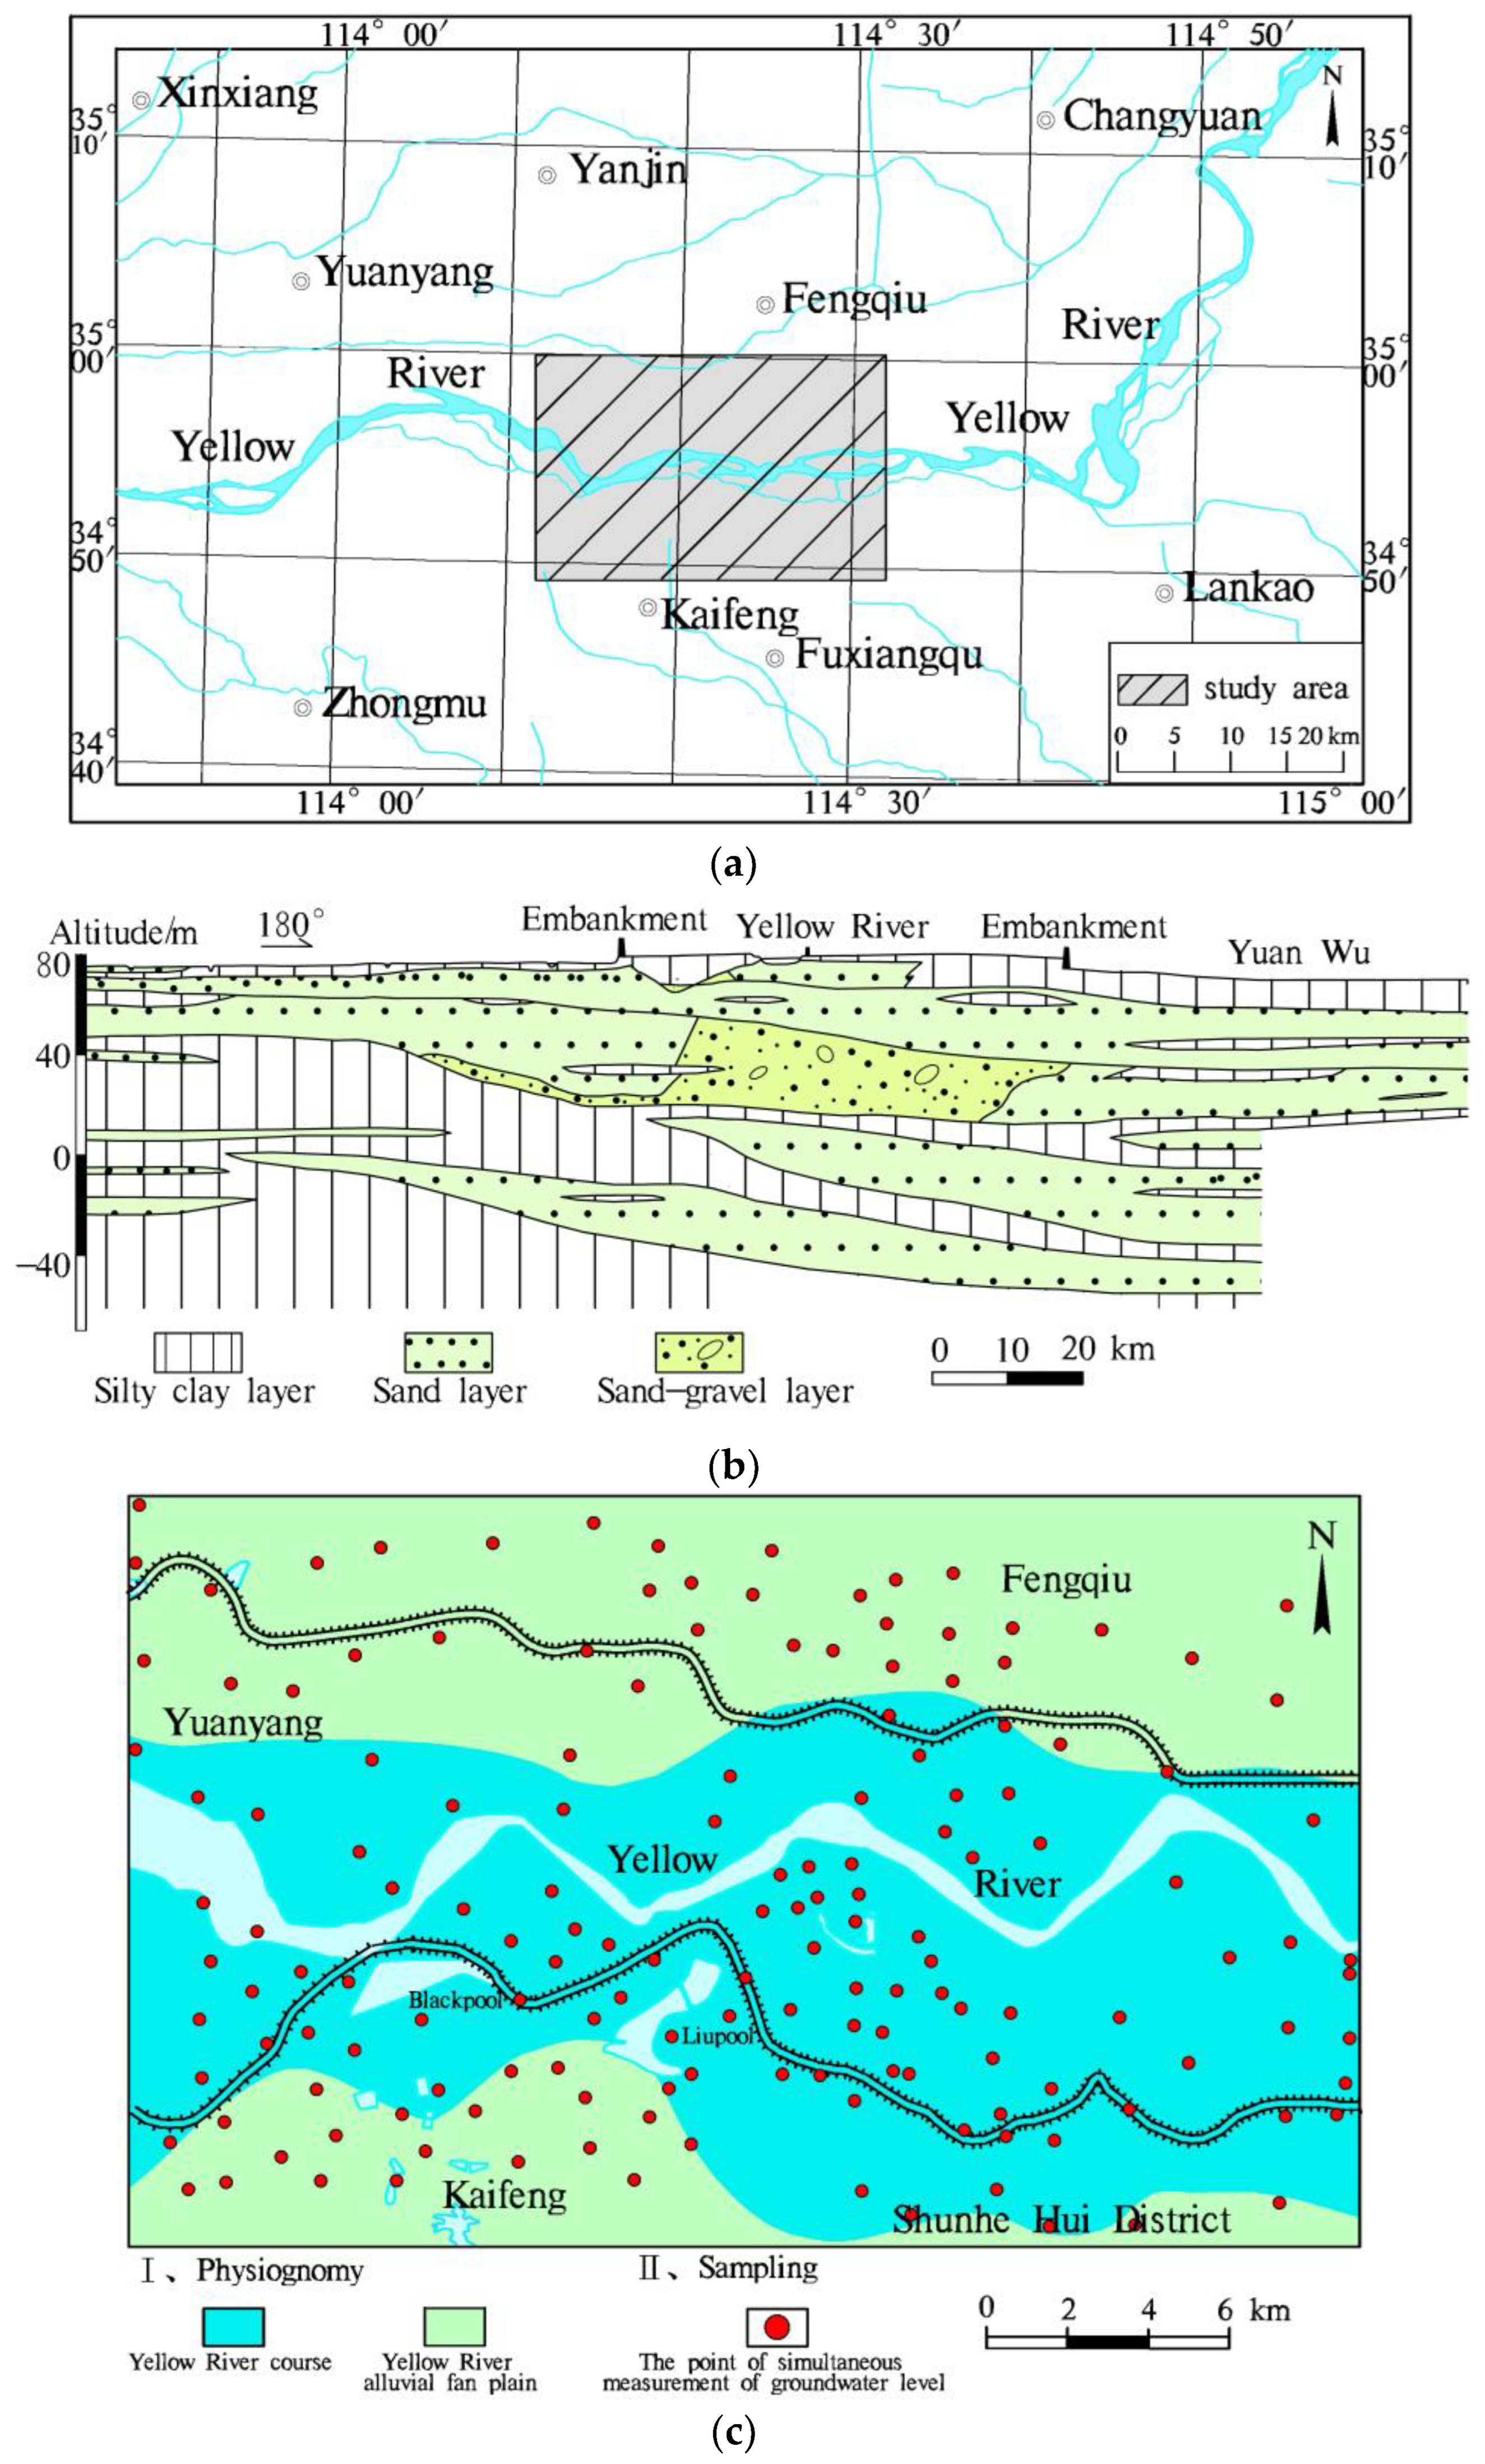
2. Study Area
3. Research Data and Methods
3.1. Research Data
3.2. Method
3.2.1. Remote Sensing Interpretation
3.2.2. Mann–Kendall Test
3.2.3. Absolute Principal Component Score-Multiple Linear Regression Model
4. Results and Discussion
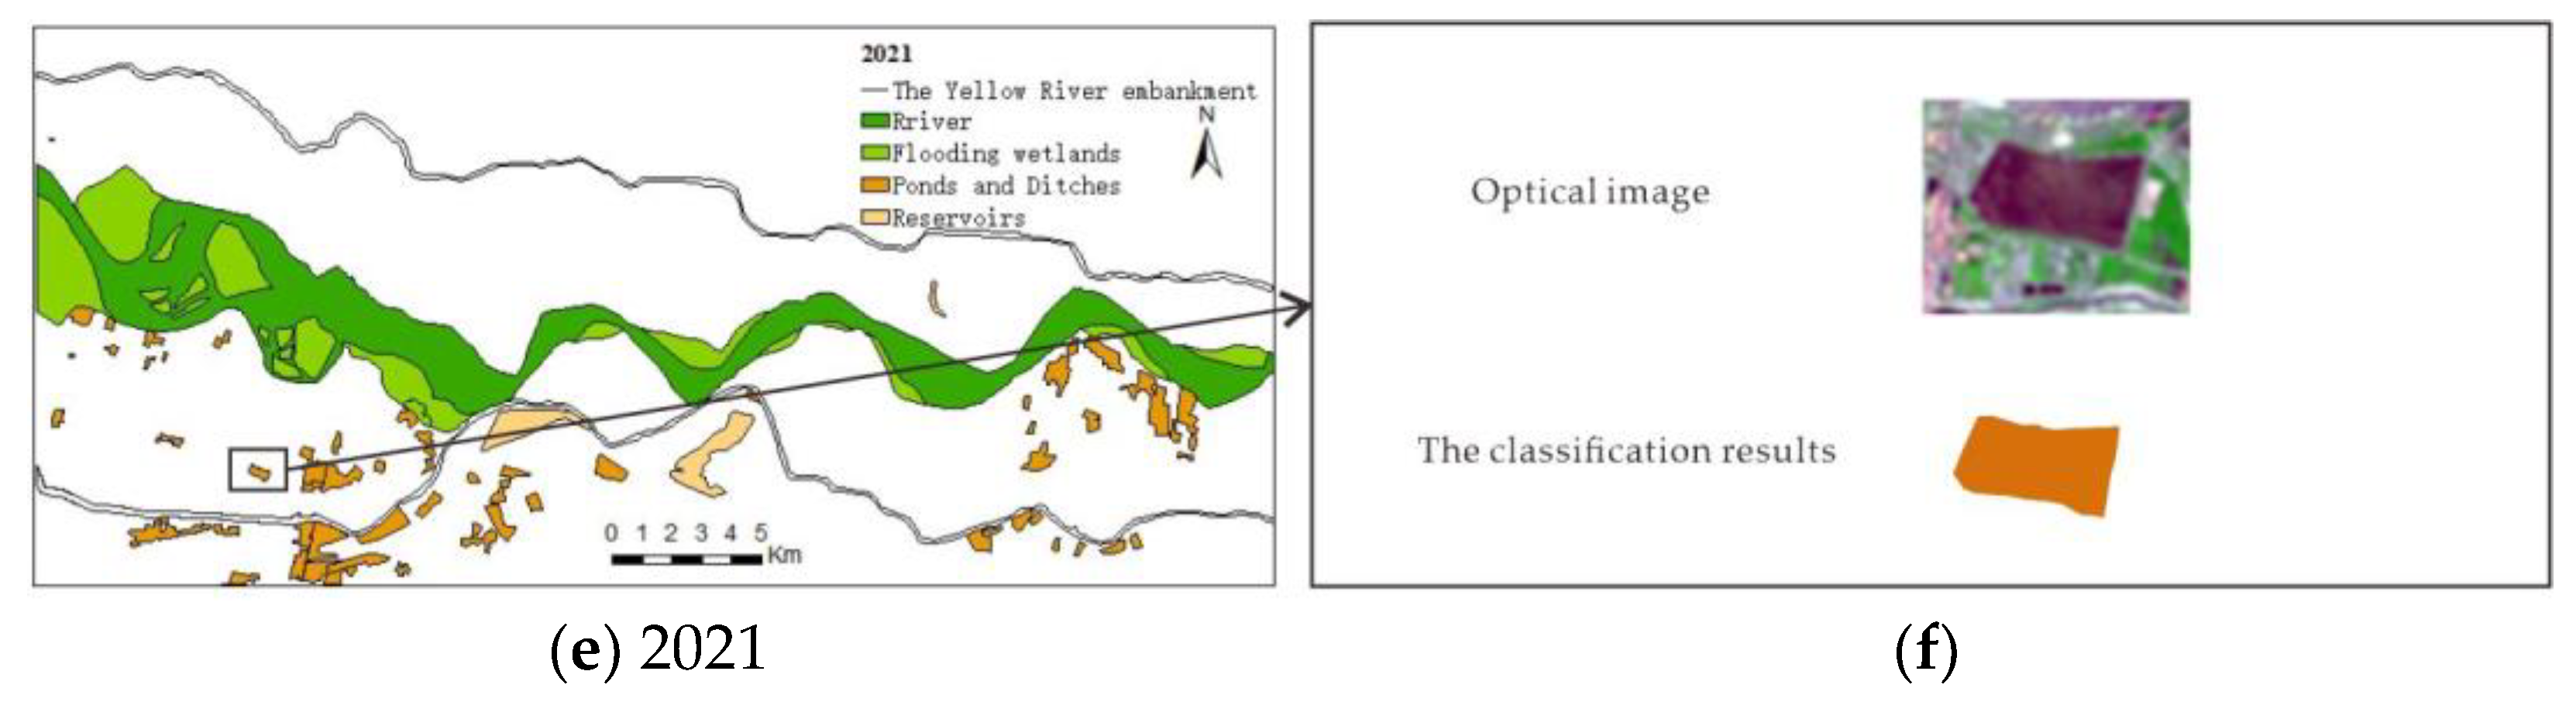
4.1. Spatial and Temporal Variations in the Wetland Area in the Lower Yellow River
4.2. Wetland Hydrological Conditions
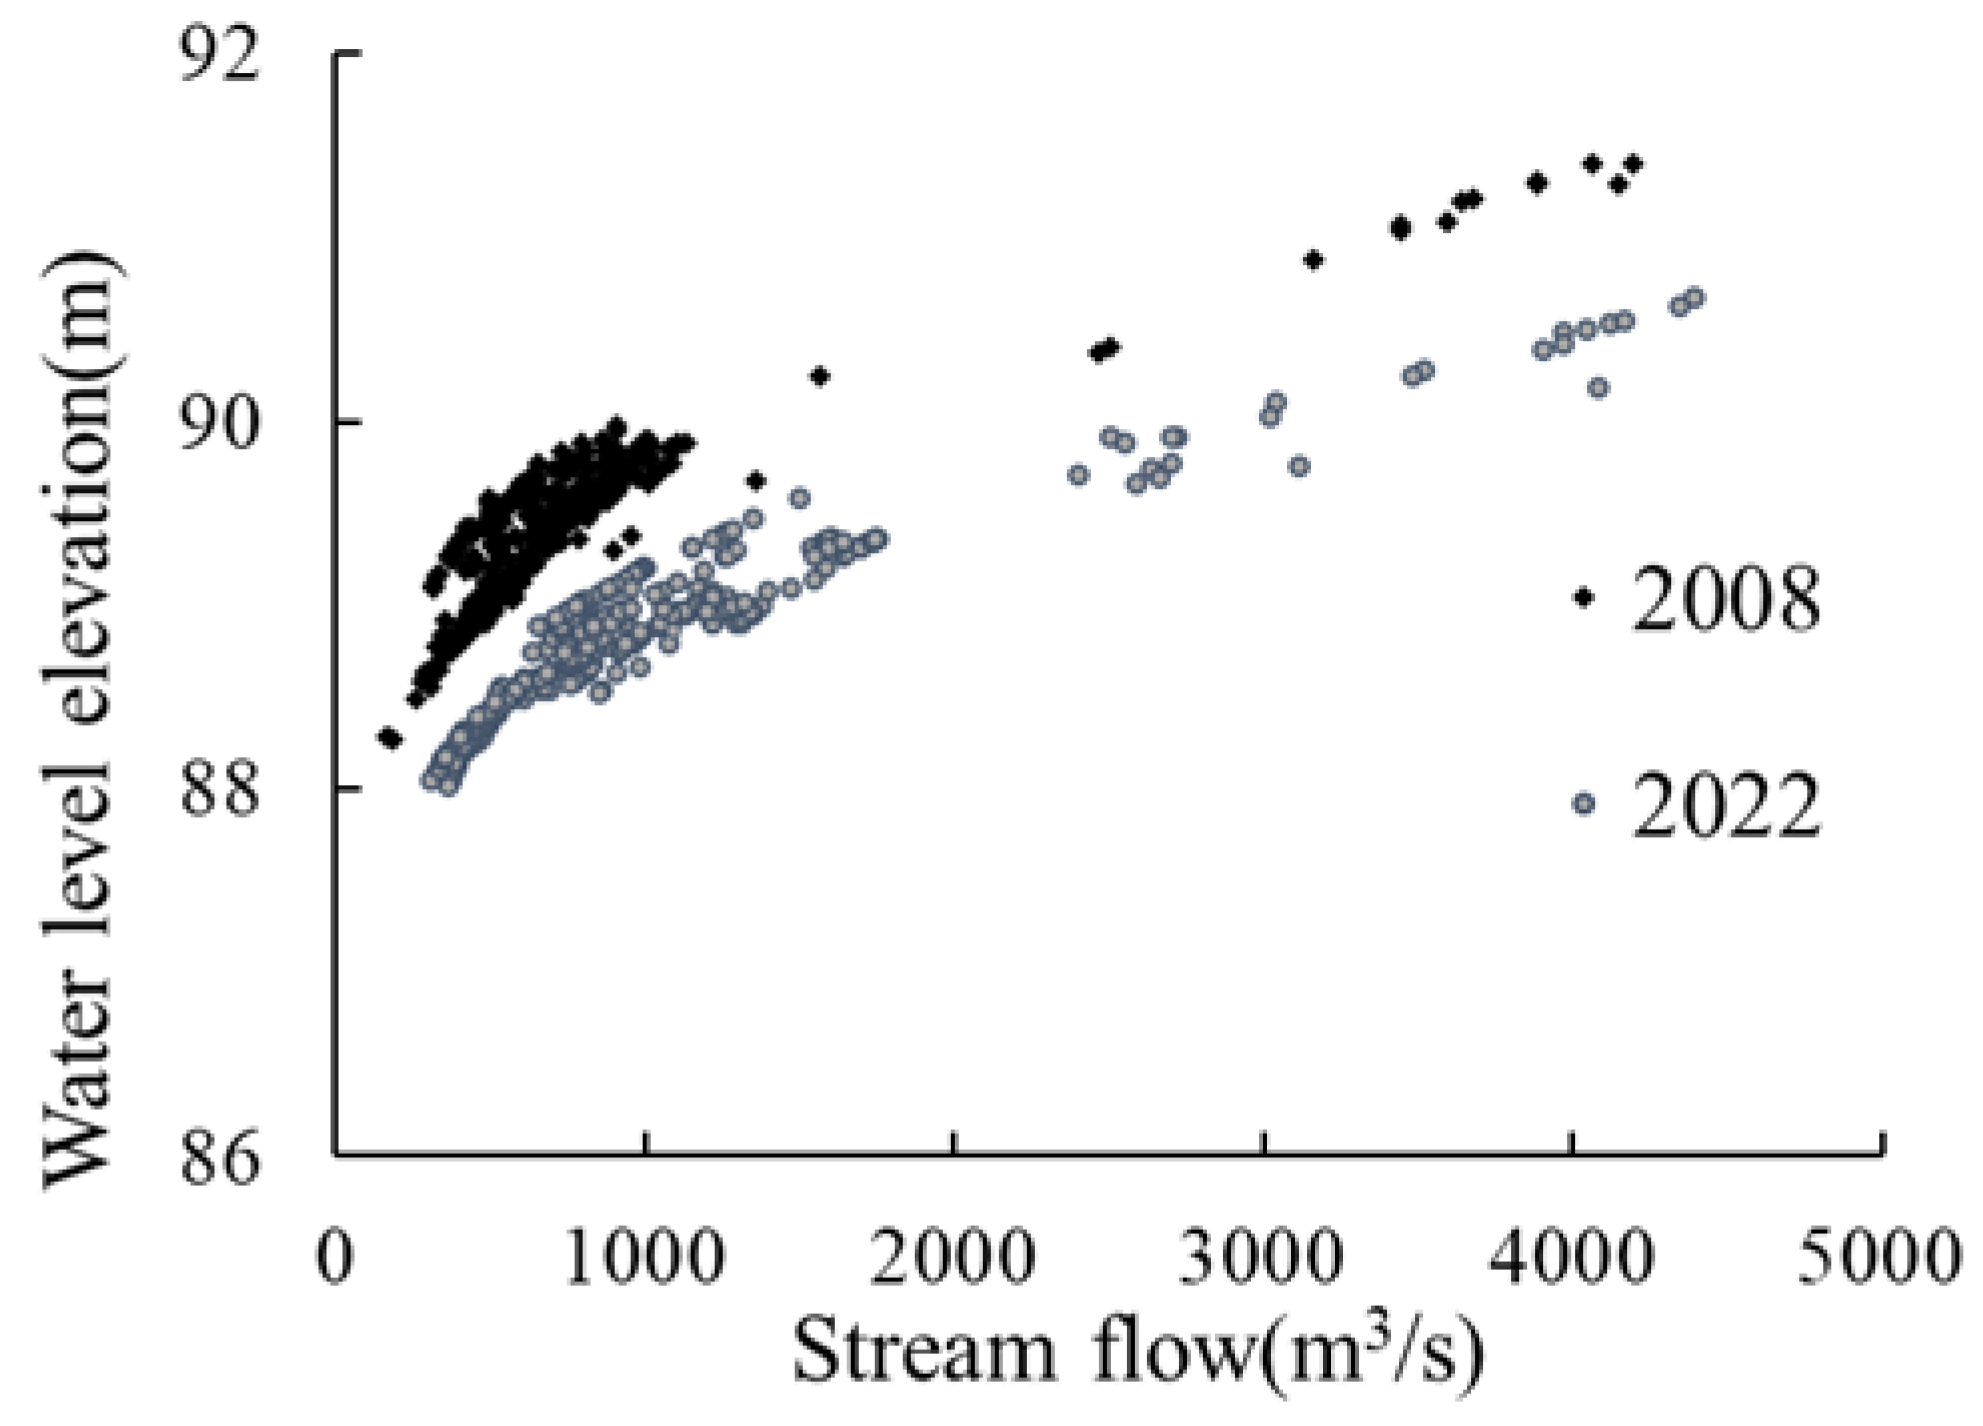
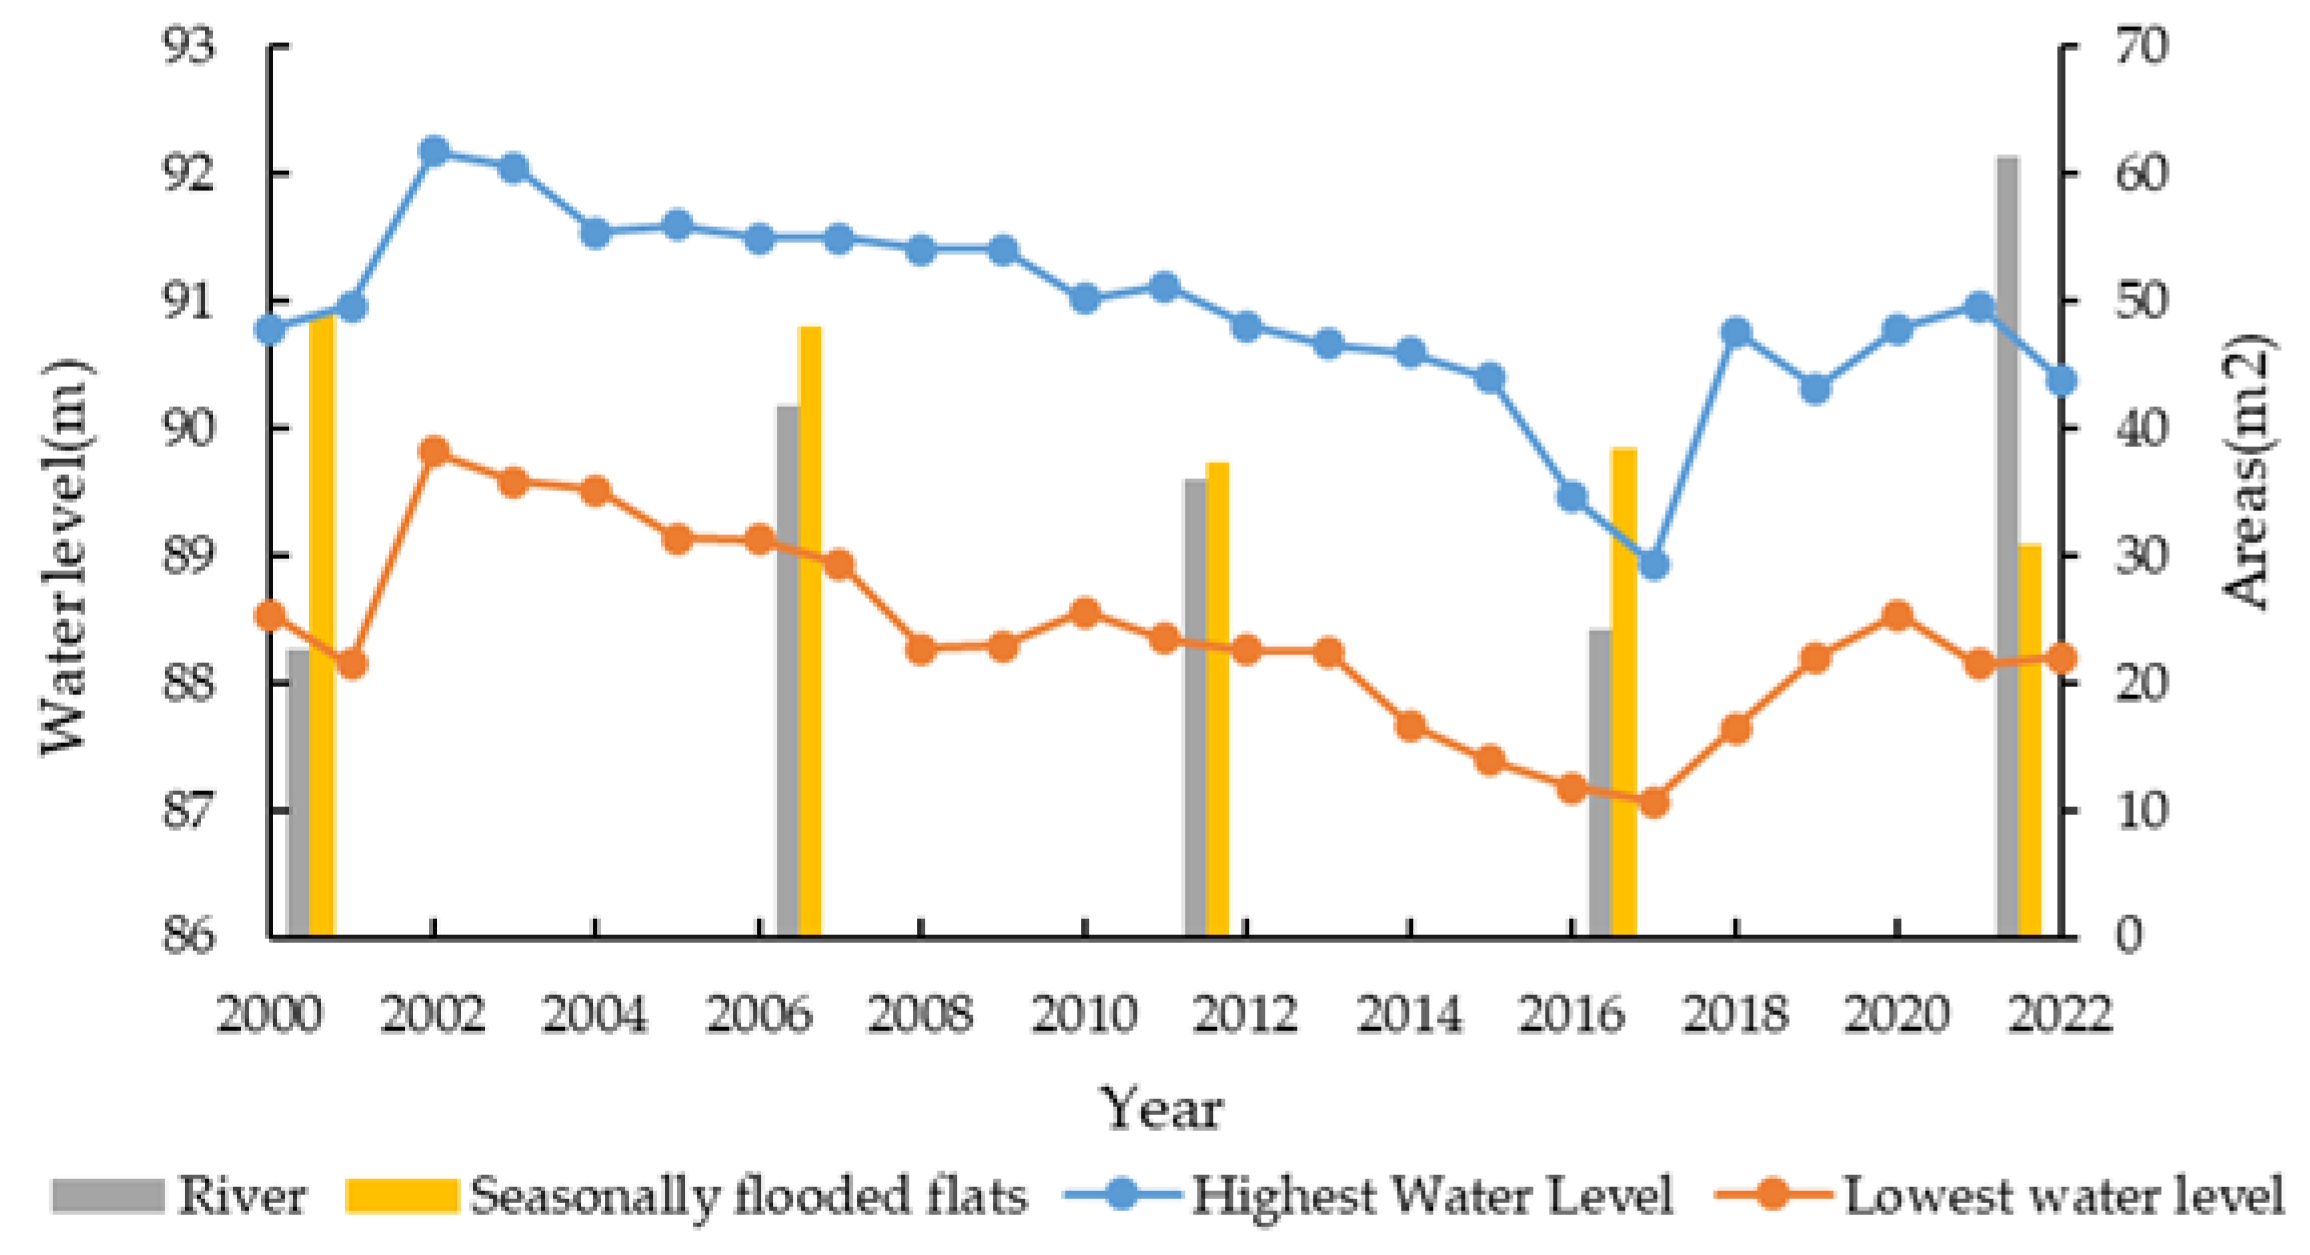
4.2.1. Variation in Discharge Characteristics of Yellow River Flow
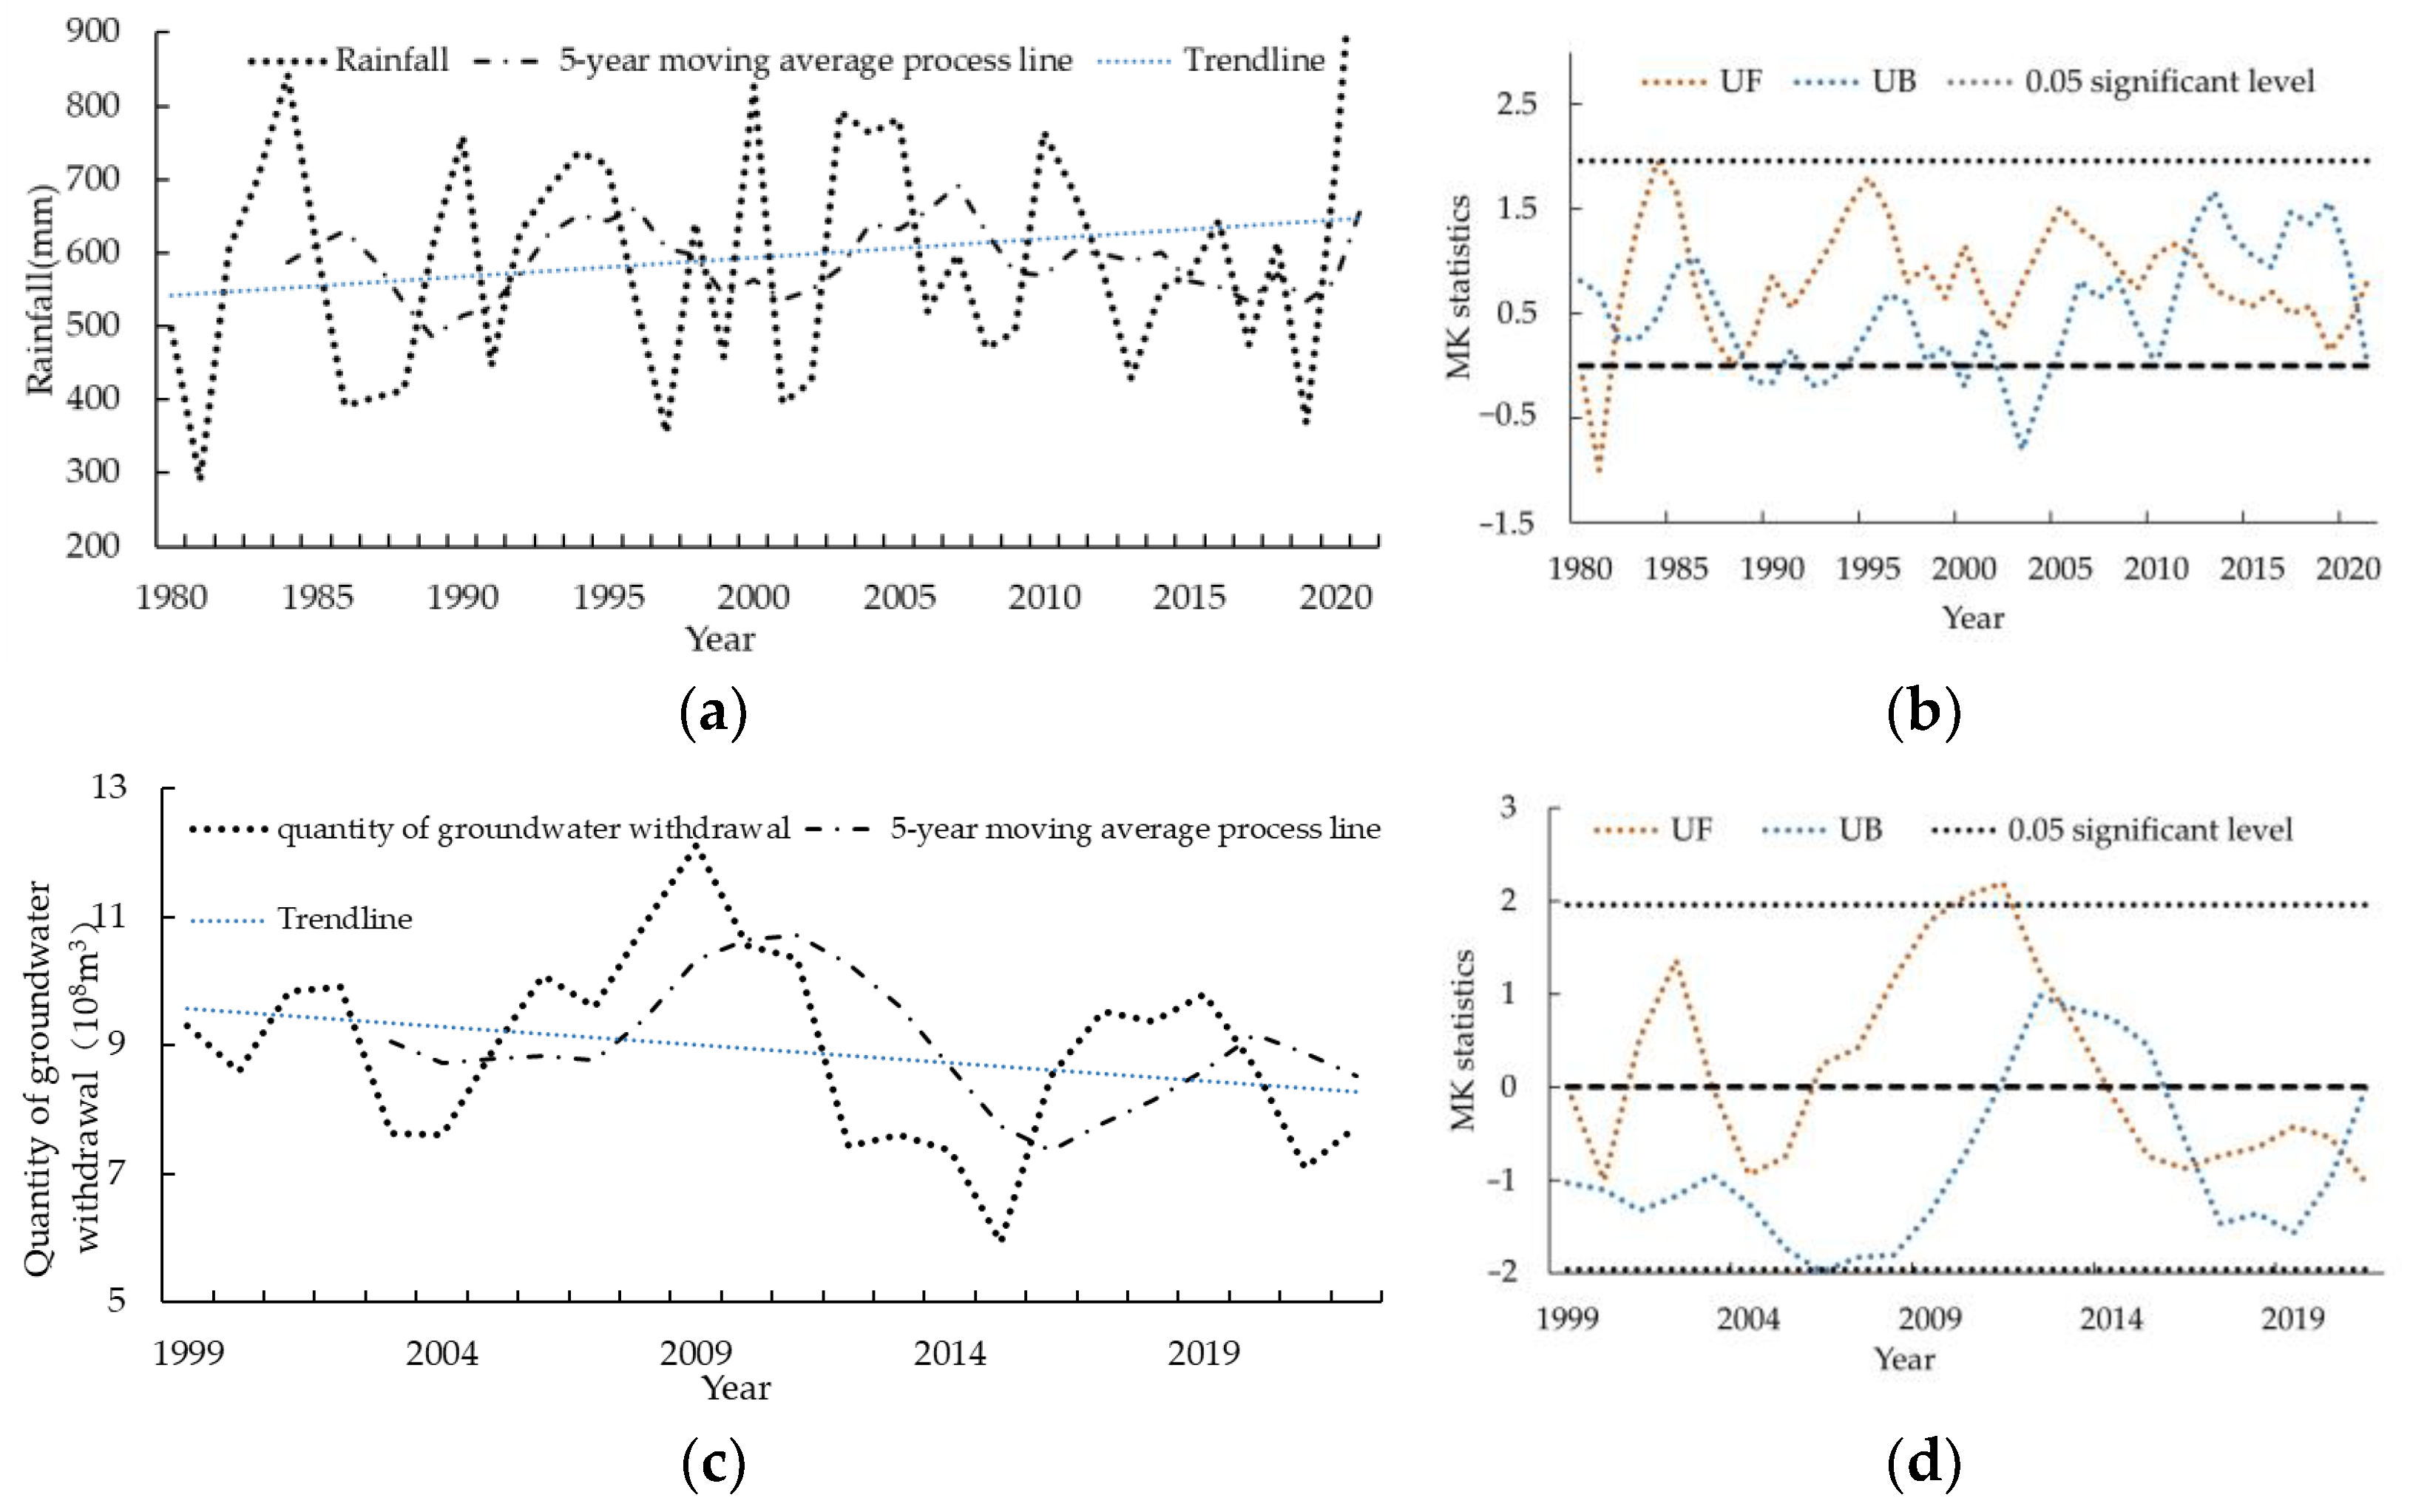
4.2.2. The Variation Law of Rainfall and Produced Quantity
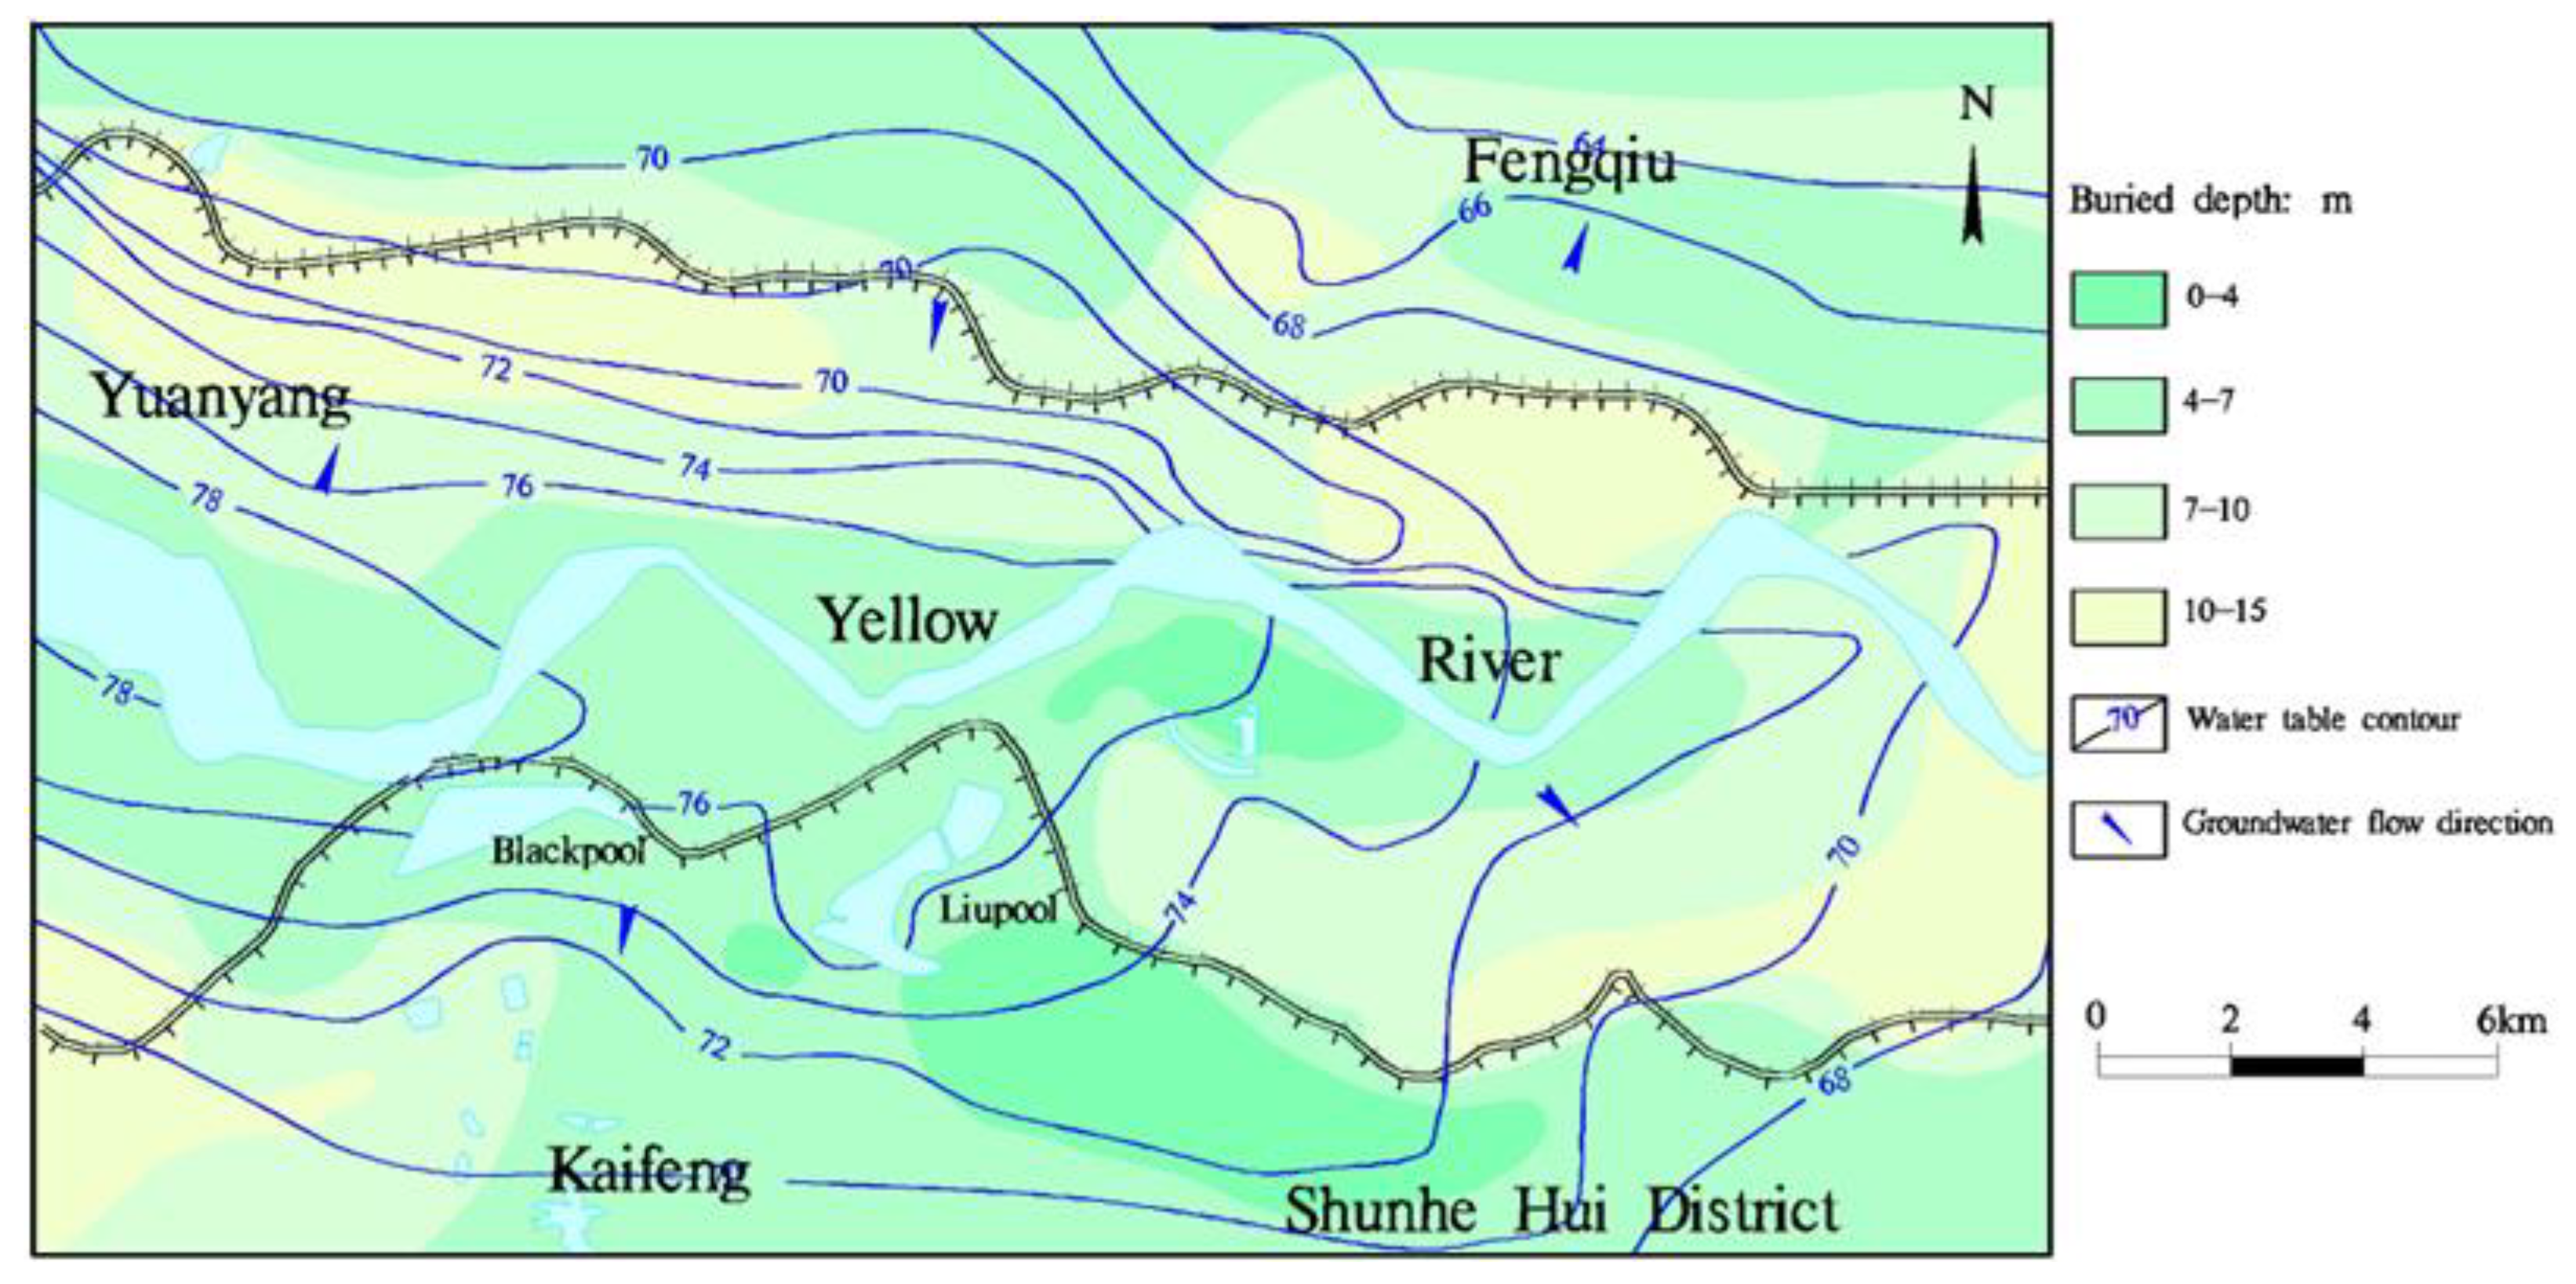
4.2.3. Characteristics of Groundwater Flow Field and Its Influencing Factors
4.3. Drivers of Wetland Landscape Change
4.3.1. Correlation Analysis of the Yellow River on Wetland Formation Conditions
4.3.2. Correlation Analysis of the Groundwater Flow Field on Wetland Patterns
4.4. APCS-MLR Analysis
5. Conclusions
- (1)
- With natural wetland as its major wetland type, the study area saw an increase in the total wetland area from 2000–2021. For natural wetlands, the total area of rivers increased while that of flooding wetlands decreased. For artificial wetlands, the total area increased.
- (2)
- The erosion of the riverway in the region made flooding increasingly less likely. The main riverway, even worse, was a typical wandering stream with significant oscillations, directly impacting the area of river water and flooding wetlands. The degraded areas of artificial wetlands were mainly distributed at the northern embankment of the Yellow River, where the groundwater burial depth decreased significantly. In contrast, at the southern embankment, for the sake of the irrigation canal diverted from the Yellow River, new artificial wetlands had formed, adding to the artificial wetland area.
- (3)
- Three influencing factors of wetland area along the Yellow River were identified in the study area, namely human factors, Yellow River runoff, and meteorological factors. According to the APCSMLR model, the influence of meteorological conditions on wetland area was small. The area of ditches and ponds was mainly affected by human factors, the area of river water surface was affected by human factors and the runoff of the Yellow River, and flooding wetlands was greatly affected by unknown sources.
- (4)
- The reduction of groundwater exploitation and an adequate supply of diverted Yellow River water were conducive to the development of wetlands in the back river depressions outside the Yellow River embankment.
Author Contributions
Funding
Data Availability Statement
Conflicts of Interest
References
- Dou, X.; Guo, H.; Zhang, L.; Liang, D.; Zhu, Q.; Liu, X.; Zhou, H.; Lv, Z.; Liu, Y.; Gou, Y.; et al. Dynamic landscapes and the influence of human activities in the Yellow River Delta wetland region. Sci. Total Environ. 2023, 899, 166239. [Google Scholar] [CrossRef] [PubMed]
- Tore, S.; Mitsch, W.J.; Turner, R.K. Valuation of wetlands in a landscape and institutional perspective. Ecol. Econ. 2000, 35, 1–6. [Google Scholar]
- Huang, W.; Gao, Y.; Xi, C.; Wu, C.; Huang, C. Correlation Analysis of Wetland Evolution and Measured Runoff in the Lower Yellow River. J. Hydrol. 2022, 43, 1–7. [Google Scholar]
- Yang, M.; Zhu, L.; Liu, J.; Zhang, Y.; Zhou, B. Influence of water conservancy project on runoff in the source region of the Yellow River and wetland changes in the Lakeside Zone, China. J. Groundw. Sci. Engi. 2023, 11, 333–346. [Google Scholar] [CrossRef]
- Zhou, Q.; Cheng, J.; Zhang, P.; Yan, J.; Liu, X.; Wang, X. Research on Ecological Safety and Utilization Pattern on the Lower Reaches Wetland of the Yellow River in Kaifeng City. Procedia Environ. Sci. 2011, 10, 2654–2658. [Google Scholar]
- Hong, Z.; Zhao, Q.; Chang, J.; Peng, L.; Wang, S.; Hong, Y.; Liu, G.; Ding, S. Evaluation of Water Quality and Heavy Metals in Wetlands along the Yellow River in Henan Province. Sustainability 2020, 12, 1300. [Google Scholar] [CrossRef]
- Hong, Z.; Ding, S.; Zhao, Q.; Geng, Z.; Qiu, P.; Zhang, J.; Wang, A.; Zhang, P. Relative contribution of multi-source water recharge to riparian wetlands along the lower Yellow River. J. Environ. Manag. 2022, 321, 115804. [Google Scholar] [CrossRef]
- Zhang, Q.; Adrian, D.; Werner, b. Hysteretic relationships in inundation dynamics for a large lake–floodplain system. J. Hydrol. 2015, 527, 160–171. [Google Scholar] [CrossRef]
- Li, Y.; Yao, J.; Zhao, G.; Zhang, Q. Evidences of hydraulic relationships between groundwater and lake water across the large floodplain wetland of Poyang Lake, China. Water Sci. Technol. Water Supply 2018, 18, 698–712. [Google Scholar] [CrossRef]
- Liu, Y.; Li, Y. Safe development model of flood plain in the Yellow River downstream. China Water Res. 2012, 6, 30–32. [Google Scholar]
- Li, J.; Xia, J.; Kong, L.; Ji, Q.; Li, L.; Chen, F. Geomorphic adjustments of channel bars in the braided reach of the lower Yellow river from 1986 to 2018. Catena 2024, 236, 107735. [Google Scholar] [CrossRef]
- Jing, H.; Zhong, D.; Zhang, H.; Wang, Y.; Huang, H. Riverbed adjustment characteristics in braided reaches of lower Yellow River under small and medium discharges. J. Hydroelectr. Eng. 2020, 39, 33–45. [Google Scholar]
- Liu, C. Evolution Processes and Conservation Approach of Urban Wetland Landscape in Zhengzhou. Ph.D. Thesis, Henan Agricultural University, Zhengzhou, Henan, 2022. [Google Scholar]
- Hao, C. Research on Spatial-Temporal Evolution of Landscape Pattern Along the Yellow River in Zhengzhou Section. Master’s Thesis, North China University of Water Resources and Electric Power, Zhengzhou, Henan, 2022. [Google Scholar]
- Stephen Pitchaimani, V.; Narayanan, M.S.S.; Abishek, R.S.; Aswin, S.K.; Jerin Joe, R.J. Delineation of groundwater potential zones using remote sensing and Geographic Information Systems (GIS) in Kadaladi region, Southern India. J. Groundw. Sci. Eng. 2024, 12, 147–160. [Google Scholar]
- Ganie, P.A.; Posti, R.; Garima; Kunal, K.; Pandey, N.; Pandey, P. Morphometric analysis and hydrological implications of the Himalayan River Basin, Goriganga, India, using Remote Sensing and GIS techniques. J. Groundw. Sci. Eng. 2024, 12, 360–386. [Google Scholar] [CrossRef]
- Huang, L.; Xu, L. Spatiotemporal evolution of the oasis and change of landscape pattern in the Manas River Basin. Arid Zone Res. 2019, 36, 1261–1269. [Google Scholar]
- GB/T 24708-2009; Wetland Classification. Standard Press of China. National Forestry and Grassland Administration: Beijing, China, 2009.
- Yang, C.; Yan, Z.; Zhou, D. Precipitation change characteristics in the upper reaches of the Yellow River during 1967–2016. Desert Oasis Meteorol. 2020, 14, 43–49. [Google Scholar]
- Zhang, J.; Wang, G. Impact of Climate Change on Hydrology and Water Resources Research; Science Press: Beijing, China, 2007. [Google Scholar]
- Liu, H.; Ma, J.; Taj, R.; Xu, M.; Lou, F.; Liu, W.; Xu, Y.; Xu, J.; Xu, Y.; Liu, D. Quantitative assessment of ecological risk from pollution source based on geostatistical analysis and APCS-MLR model. Environ. Sci. Pollut. Res. 2024, 31, 34953–34961. [Google Scholar] [CrossRef]
- Zhang, H.; Cheng, S.; Li, H.; Fu, K.; Xu, Y. Groundwater pollution source identification and apportionment using PMF and PCA-APCA-MLR receptor models in a typical mixed land-use area in Southwestern China. Sci. Total Environ. 2020, 741, 140383. [Google Scholar] [CrossRef]
- Wang, Y.; Wu, B.; Zhong, D. Adjustment in the main-channel geometry of the lower Yellow River before and after the operation of the Xiaolangdi Reservoir from 1986 to 2015. J. Geogr. Sci. 2020, 30, 468–487. [Google Scholar] [CrossRef]
- Liu, C.; Wei, H.; Zhang, Y.; Tian, W.; Luan, J. Analysis on the Attribution of Runoff Changes in the Mainstream of the Yellow River and Discussion on Related Issues. Yellow River 2021, 43, 1–6. [Google Scholar]
- Wang, G. Definition of Water Conservation Areas in the Yellow River Basin. J. China Hydrol. 2022, 42, 65. [Google Scholar]
- Ma, Y.; Li, G.; Ye, S.; Zhang, Z.; Zhao, G.; LI, J.; Zhou, C.; Ding, W.; Yang, X. Response of the distributary channel of the Huanghe River estuary to water and sediment discharge regulation in 2007. J. Oceanol. Limnol. 2010, 28, 1362–1370. [Google Scholar] [CrossRef]
- Liu, Y.; Wang, Y.; Jiang, E. Stability index for the planview morphology of alluvial rivers and a case study of the lower Yellow River. Geomorphology 2021, 389, 107853. [Google Scholar] [CrossRef]
- Wang, G.; LI, Y.; LI, P.; Zhang, S. Analysis of groundwater environment conditions in Huanghuai plain county-a case study of Tongxu county, Kaifeng city. Ground Water 2023, 45, 21–25. [Google Scholar]


| Wetland Types | Type Declarations | Remote Sensing Image Interpretation Signs | |
|---|---|---|---|
| Natural wetlands | River | The water surface between the natural or artificially excavated river water level shoreline (excluding the reservoir water surface). |  |
| Flooding wetlands | Tidal flats between naturally formed or artificially excavated river flood level shorelines. | 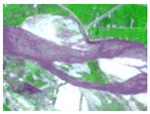 | |
| Artificial wetlands | Ponds and ditches | Artificial excavation of water storage area. |  |
| Reservoirs | An area of natural formation or artificial excavation in which the surface is permanently covered by water. | 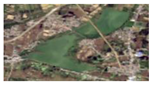 | |
| 2000 | 2021 | |||||
|---|---|---|---|---|---|---|
| Non-Wetland | River | Flooding Wetlands | Reservoirs | Ponds and Ditches | Total | |
| Non-wetland | 657.15 | 19.59 | 10.06 | 5.34 | 0 | 692.14 |
| river | 0 | 19.51 | 4.69 | 0 | 0 | 24.20 |
| Flooding wetlands | 0 | 22.40 | 16.10 | 0 | 0 | 38.50 |
| Ponds and ditches | 2.30 | 0 | 0 | 13.11 | 0 | 15.41 |
| Reservoirs | 0.11 | 0 | 0 | 0 | 4.98 | 5.09 |
| Total | 659.56 | 61.50 | 30.85 | 18.45 | 4.98 | 775.34 |
| Indicator | Component 1 | Component 2 | Component 3 |
|---|---|---|---|
| Pond and ditches | 0.94 | 0.10 | −0.17 |
| River | 0.22 | 0.83 | 0.17 |
| Flooding wetlands | −0.01 | 0.89 | −0.25 |
| Yellow River water level | −0.14 | 0.73 | 0.10 |
| Rainfall | −0.07 | 0.03 | 0.76 |
| Groundwater burial depth (Jinglonggong) | 0.87 | −0.03 | −0.07 |
| Groundwater burial depth (Chenqiao) | 0.90 | −0.01 | −0.25 |
| Quantity of groundwater withdrawal | 0.65 | 0.10 | −0.17 |
| Characteristic value | 3.90 | 3.07 | 1.31 |
| Contribution % | 30.86 | 30.78 | 18.65 |
| Cumulative contribution % | 30.86 | 61.64 | 80.29 |
Disclaimer/Publisher’s Note: The statements, opinions and data contained in all publications are solely those of the individual author(s) and contributor(s) and not of MDPI and/or the editor(s). MDPI and/or the editor(s) disclaim responsibility for any injury to people or property resulting from any ideas, methods, instructions or products referred to in the content. |
© 2025 by the authors. Licensee MDPI, Basel, Switzerland. This article is an open access article distributed under the terms and conditions of the Creative Commons Attribution (CC BY) license (https://creativecommons.org/licenses/by/4.0/).
Share and Cite
Cui, X.; Guo, L.; Zhang, X.; Meng, S.; Lei, S.; Cao, W.; Li, X. Correlation Analysis of Wetland Pattern Changes and Groundwater in Kaifeng Downstream of the Yellow River, China. Water 2025, 17, 1374. https://doi.org/10.3390/w17091374
Cui X, Guo L, Zhang X, Meng S, Lei S, Cao W, Li X. Correlation Analysis of Wetland Pattern Changes and Groundwater in Kaifeng Downstream of the Yellow River, China. Water. 2025; 17(9):1374. https://doi.org/10.3390/w17091374
Chicago/Turabian StyleCui, Xiangxiang, Lin Guo, Xueqing Zhang, Suhua Meng, Shan Lei, Wengeng Cao, and Xiangzhi Li. 2025. "Correlation Analysis of Wetland Pattern Changes and Groundwater in Kaifeng Downstream of the Yellow River, China" Water 17, no. 9: 1374. https://doi.org/10.3390/w17091374
APA StyleCui, X., Guo, L., Zhang, X., Meng, S., Lei, S., Cao, W., & Li, X. (2025). Correlation Analysis of Wetland Pattern Changes and Groundwater in Kaifeng Downstream of the Yellow River, China. Water, 17(9), 1374. https://doi.org/10.3390/w17091374