Article

Optimizing the Arrangement of Semi-Cylindrical Structures for Bank Protection Effectiveness Using the Multi-Objective Genetic Algorithm

1
Jiangsu Hydraulic Research Institute, Nanjing 210017, China
2
College of Mechanics and Engineering Science, Hohai University, Nanjing 211100, China
3
Water Resources Information Center, Nanjing 210029, China
4
The National Key Laboratory of Water Disaster Prevention, Hohai University, Nanjing 211100, China
*
Author to whom correspondence should be addressed.
Water 2025, 17(9), 1360; https://doi.org/10.3390/w17091360
Submission received: 25 March 2025 / Revised: 23 April 2025 / Accepted: 26 April 2025 / Published: 30 April 2025
(This article belongs to the Section Water Erosion and Sediment Transport)

Abstract

:
To address the problem of concave bank scour in a 120° bend river, this study designed and explored the bank protection effect of different arrangements of semi-cylinder sandbags. Based on the actual riverbed structure, a simplified geometric model of the bend riverbed was constructed, and the bank protection effect of sandbags arranged at different angles and spacings under different flow conditions was evaluated by using a multi-objective genetic algorithm (MOGA). The optimization results showed that the net sediment mass flow rate of the riverbed in the curved riverbed model using one semi-cylinder sandbag was maximum when the angle between the semi-cylinder sandbag and the concave bank of the riverbed was 158°. Further, the results of the analyses of velocity and spacing indicated that the effect of inlet flow velocity on the effectiveness of bank protection is 1.5 times greater than the spacing of the throw pillows in a bend channel with two semi-cylindrical sandbags. In the conventional flow velocity range of 1~2 m/s, the net sediment mass flow rate in the riverbed is the largest when the throw pillow distance is set at 49 m, which is about 9.4 kg/s, which can provide a better bank protection effect and can provide a certain reference for the design of engineering bank protection.

1. Introduction

China has numerous rivers that form a complex network of waterways through their interconnections. With the continuous development of hydraulic engineering and the increasing demand for river management, riverbed scouring is becoming more serious, which may lead to deformation of the river channel and ecological damage. For example, Petts [1] pointed out that the construction of reservoirs is the human activity that has the greatest impact on natural rivers, while Kondolf [2] explored the negative impacts of dams and sand mining on riverbeds, emphasizing the issue of riverbed scouring caused by the phenomenon of ‘hungry water’. To address riverbed scour, a variety of protective measures have been implemented in actual projects, including spur dikes [3], sand-bagging [4], vegetation restoration [5], and ecological engineering [6]. Specifically, by rock dumping, using sandbags, changing the local structure of buildings, and introducing vegetation, the stability of the riverbed can be effectively enhanced, and the flow field can be optimized, thus reducing the scouring of both the riverbed and the buildings on it by the water flow. Studies have shown that there is a complex relationship between water conservancy projects and riverbed changes, making scientific management of river ecology particularly important.
Many experts and scholars have conducted in-depth studies on riverbed scour and bank protection. Niu et al. [7] simulated the erosion phenomena of 90° and 180° bends based on the Eulerian–Lagrangian method, Chen et al. [8] predicted the maximum scour depth of the riverbed in the case of subway tunnels under the river by using five various methods, and they found that the results obtained from the scour model experiment and the numerical simulation methods are reliable. Abbaspour et al. [9] experimentally analyzed the effect of buried lithium plates on the erosion bed on the downstream scour depth. Khosravinia et al. [10] used trapezoidal rings to mitigate localized scour around a bridge abutment. Ataie-Ashtiani and Ballio [11,12,13] conducted an experimental study on localized scour around pile clusters and abutments in stabilized clear-water scour conditions. Zhang et al. [14] used a modeling approach to mitigate downstream scour by installing dissipative piers on a concrete revetment, and Yao et al. [15] conducted an applied experimental study on the revetment effect of two new types of revetment materials. Kong et al. [16] performed bank protection by planting vegetation on the concrete surface and conducted scour protection analysis. Studies have shown that most of the riverbed scour problems are closely related to the structure of the riverbed and the buildings on the riverbed (bridges, sightseeing platforms, sluices, etc.). Although several studies have been conducted to investigate the relationship between riverbed scour and riverbed structures and buildings on them, effective solutions to riverbed scour problems in practical engineering applications are still insufficient, especially in curved riverbeds, where research is relatively limited.
Riverbed scour is a dynamic process of water erosion of the river bottom and banks [17], which triggers a chain effect reflected in three key dimensions. First, channel morphology changes lead to hydrological characteristics alienation, and deepening and widening of the riverbed will break the balance of water flow and sand transport, inducing oscillation of the river and weakening the stability of river ecosystems [18]. Second, the excessive suspended sediment produced by erosion not only reduces the light transmittance of the water body, but also alters the distribution pattern of dissolved oxygen, which directly threatens the sensitive habitats of aquatic organisms [19,20]. Finally, the continuous recession of the bank slopes results in the loss of land resources along the banks, and this progressive erosion may evolve into sudden bank failure during flooding, jeopardizing the safety of infrastructure such as embankments and bridges, posing a potential threat to adjacent farmland and residential areas [21]. Harasti et al. [22] conducted a study on the use of rock casting for scour protection around bridge abutments. They also investigated the structure of riprap and concluded that the inclined structure of riprap is more effective for bridge abutment protection. Tian et al. [5] proposed a new sandbag bank protection technology for the bank slope collapse and destabilization problems caused by scouring. The advantage of this technology lies in its strong integrity, stable structure, and good scour resistance. Sun et al. [23] conducted a study on the protective effect of different shapes of sandbags in bend scouring, and the results pointed out that, compared with other shapes of sandbags, semi-cylinder sandbags have the best protective effect on bend scouring. In recent years, sandbag bank protection technology has been widely used in actual projects, so the in-depth study of a new sandbag bank protection method is particularly important.
This study proposes a technical solution for sandbag bank protection in the Bagua-zhou bend section of the Yangtze River, where scouring pits have been exacerbated. The construction process follows a standardized workflow: “material preparation, structural design, precise implementation, effects verification”. First, the sand accumulation area on the convex bank is selected as the local sand source, ensuring material supply through short-distance transportation. Subsequently, the sandbag structural parameters are designed based on granulometric characteristics (particle shape, size distribution, mechanical properties, and permeability coefficients). Then, hydrodynamic analysis is conducted to locate high-risk scour zones and determine the sandbag deployment coordinates. Finally, measurement techniques are employed to validate the spatial consistency between sandbag placement and design specifications. Compared with conventional methods, the core innovation lies in rapid response capability via standardized processes, which effectively inhibits scour expansion and mitigates channel instability risks in emergency scenarios.
On the basis of engineering practice, this study further constructs a numerical optimization framework for scour protection. We will use the Eulerian multiphase flow model [24] based on computational fluid dynamics (CFD) [25] to calculate the mass flow rate of the sediment in the riverbed under different operating conditions and to analyze the flow field and riverbed volume fraction of the sediment on the bottom surface. Finally, the optimal sandbag parameters will be selected through the optimization analysis using a multi-objective genetic algorithm (MOGA) [26], with a view to providing a more scientific and effective solution for the prevention and control of riverbed scour in the actual project.

2. Materials and Methods

2.1. Theory of Two-Fluid and Multi-Objective Genetic Algorithms

Bed sediment transport occurs through two primary modes: bed load and suspended load [27]. This study investigates the sediment-blocking efficacy of sandbag structures, with a focus on bed load dynamics. Near the inlet region, suspended load dominates owing to the stochastic vertical distribution of the sediment particles at the inlet boundary. As gravitational settling deposits particles onto the channel bed, the transport regime shifts to bed load dominance. This phase transition is governed by the dynamic equilibrium between the hydrodynamic drag and the particle buoyancy. To systematically analyze such multiphase flow problems with substantial density contrasts, we adopt a Eulerian multiphase flow model.
The aim of this paper is to investigate the transport processes of riverbed sediment particles using a simplified two-phase fluid model, comprising a water phase and a sediment phase. In this framework, both phases are treated as continuous media co-occupying the entire computational domain. At any spatial point within the domain, the two phases coexist, resulting in interphase interactions governed by momentum and mass exchange mechanisms. The volume fraction is defined as α q = V q / V , where V q is the volume of the q phase in the control volume V . It can be concluded that [28]:
α f + α s = 1
According to the principles of the conservation of mass and the conservation of momentum, the following equations of motion control for the q phase can be obtained [29,30].
The conservation of mass equation is the following:
t ( α q ρ q ) + ( α q ρ q v q ) = 0
where q = f is the fluid phase, q = s is the particle phase, ρ q is the density of the q phase, and v q is the velocity of the q phase.
The momentum balance equations for the fluid and particle phase are written as:
t ( α f ρ f v f ) + ( α f ρ f v f v f ) = α f p + τ f + α f ρ f g + K s f ( v s v f )
t ( α s ρ s v s ) + ( α s ρ s v s v s ) = p s α s p + τ s + α s ρ s g + K f s ( v f v s )
where K s f = K f s is the momentum exchange coefficients between the particle phase and the fluid phase.
K s f = 3 C D α s α f ρ f 4 d s | v s v f | α f 2.65
C D = 24 α f R e s [ 1 + 0.15 ( α f R e s ) 0.687 ]
where R e s is the relative Reynolds number, R e s = ρ g d s | v s v f | μ g , τ f , a n d   τ s are the stress tensor of the fluid and particle phases, respectively, and g is the acceleration of gravity. p is the pressure common to both phases, and p s is the solid pressure of the particle.
p s = α s ρ s θ s + 2 ρ s ( 1 + e s ) α s 2 g 0 θ s
where e s = 0.7 is the particle-phase collision recovery coefficient; g 0 is the radial distribution function characterizing the inter-particle collision frequency, g 0 = [ 1 ( α s α s , m a x ) 1 / 3 ] 1 , and α s , m a x is the maximum volume fraction allowed for the particle phase. θ s is the particle-phase temperature, which is directly proportional to the particle-phase kinetic energy, and for the sake of simplifying the model, we only discuss the case of θ s = 0.001.
A multi-objective genetic algorithm (MOGA) derived from a global random optimization algorithm [31] is used in this work. The basic principle involves first encoding the solution of the optimization problem as a chromosome and then randomly generating an initial population. Next, each individual in the population is evaluated for fitness and selected based on multiple objective values. New individuals are generated by crossover and mutation operations, and non-dominated sorting is performed to identify solutions on the Pareto front. The advantages of MOGA lie in its ability to deal with complex multi-objective optimization problems, to provide a set of non-dominated solutions, be flexible, and can be used in combination with other algorithms, which are widely used in many fields, such as engineering design, environmental science, and artificial intelligence, and have become an important tool for finding the balance of objectives. The basic arithmetic steps of MOGA are as follows.
(1) Rank the superiority of individuals in a population.
At the population of n t h generation of individuals, the individual rank is defined by the following equation:
r a n k ( m , n ) = 1 + p ( n )
where m is a particular individual in the n t h generation, r a n k ( m , n ) is the rank of m individuals in the population of the n t h generation, and p ( n ) is the number of individuals better than m in the population of the n t h generation.
In the numerical simulation, this study initializes a population before MOGA optimization to 16 samples and establishes an individual superiority assessment system based on the net sediment mass flux rate. First, individuals of the population are ranked in descending order according to the net sediment mass flux rate (the larger the flux rate, the higher the rank), and are assigned an integer rank value starting from one (the rank value is inversely proportional to the superiority). After the completion of the rank division of all individuals, the initial fitness value is linearly assigned based on the rank sequence to achieve the baseline fitness calibration before optimization.
(2) Calculate the average of the fitness value.
The initial fitness is averaged across all individuals, with the purpose of ensuring that the higher fitness values are available for individuals in the better rank.
Fonseca et al. [32] introduced diverse microhabitats to better achieve the solution. The standardized distance between any individuals a and b (where a and b are the input parameters) can be solved for in the same generation by means of an objective function with the following solution equation:
t a b = s = 1 l   f s ( a ) f s ( b ) f s m a x f s m i n 2
where t a b is the normalized spacing between any a and b , f s ( a ) and f s ( b ) are the values of the s t h objective function for a and b , and f s m a x and f s m i n are the maximum and minimum values of the s t h objective function.
For a , the standardized spacing for all b (including a ) that have the same rank as a can be solved by using the following equation.
S h t a b = 1 t a b δ s h a r e H , t a b δ s h a r e 0 ,                                               t a b > δ s h a r e ,
where S h t a b is the standardized spacing to all b (including a ) having the same rank as a , and δ s h a r e is the radius of the microhabitat.
The number of microhabitats is the sum of all shared function values, as shown in the following equation.
n c a = b = 1 μ ( r a )   S h ( t a b )
where n c a is the number of microhabitats, r a is the rank of a , and μ ( r a ) is the total number of all individuals with the same rank as a .
The shared function method was used in MOGA, in which the fitness value of each individual was divided by the number of its microhabitats to obtain the shared fitness value.

2.2. Riverbed Model and Sediment Transport Simulation

On the bed of a bend, the flow increases significantly due to sharp diversions, especially on the concave bank side, which may trigger scouring of the riverbed [33]. To effectively minimize scour, sandbags can be placed on the concave bank side of the bend. The cross-section of the riverbed where sandbags are placed can effectively disperse the impulsive force of the water flow and reduce the direct impact of the water flow on the riverbed, thus reducing the risk of riverbed scour. Therefore, when arranging sandbags, the sandbags should be reasonably configured according to the flow direction and water level of the river to ensure maximum interception of the scouring water flow. According to a previous study [23], this work simplifies the riverbed into a 120° bend, with both sides of the riverbank inclined at 45°. Considering the partial burial of the sandbags, the physical model used for calculation is shown in Figure 1.
Considering that the riverbed is a curved channel model and that there are semi-cylinder block features, the computational domain presents an irregular shape. So, the mesh division adopts the local encryption strategy based on the model of the smallest feature size to set the reference mesh, and the minimum mesh resolution is controlled in the order of one-tenth of the feature size. The mesh size of the computational domain is 1.92 m, and the mesh size near the pillow surface is 0.96 m. All bottom meshes are encrypted with expansion inflation, and the first layer of the mesh size is 0.4 m. The expansion is 1.4, and four layers are set up. The total number of meshes is 552,102. The figure below shows the grid division of the riverbed calculation domain, and the computational domain meshing is shown in Figure 2.
The gravitational acceleration is 9.81 m/s2. The sediment phase is added with a density of 2650 kg/m3, a diameter of 0.3 mm, and a viscosity determined according to Gidaspow’s formula. The density of water flow is 998 kg/m3, and the viscosity is 0.001 kg/(m·s). The Eulerian two-phase flow model is used to describe the sediment movement under the entrainment of water flow at the bottom of the riverbed, and the inter-phase forces include the virtual mass force and the Gidaspow trailing force. Considering the disturbed flow that may be induced by the pillow throw, the realizable κ-ε turbulence model is used to portray the dynamic behavior of the two phases of water and sand. The current inlet flow velocity is set to 1 m/s (the range of the inlet flow velocity is 0.5 m/s~2.5 m/s, when it is used as an input parameter for the optimization calculation), and the volume fraction of the sediment phase is 0.06. The turbulence is characterized by the Intensity and viscosity ratio method. The outlet of the computational domain is set as a pressure boundary, and the direction of sediment phase return at the outlet and the volume fraction are specified according to the information of the neighboring grid cells. The bottom of the computational domain, i.e., the riverbed, is bounded by a wall boundary, and the upper boundary is bounded by a zero-gradient boundary. The bottom of the computational domain (riverbed) is bounded by a wall, and the upper boundary is bounded by a zero-gradient boundary condition, details of which are given in Table 1.
The transient state is used for the computation, and the time step is set to 0.4 s according to the CFL stability condition, with a total of 4000 steps and a total duration of 1600 s, see Figure 3 for details.
In the Workbench platform, the basic idea of response surface optimization (RSO) [34] is to approximate complex physical models by constructing a response surface model, so that optimization can be achieved with less computational resources. Response surface modeling is a mathematical model established by regression analysis to describe the relationship between the design variables and the response variables, which is usually expressed in polynomial or other functional forms. The main advantage of response surface optimization is that it can significantly reduce computational time and cost, while effectively handling complex nonlinear problems, so that the performance of different design alternatives can be quickly evaluated without the need for extensive simulation. This technique is particularly suitable for optimization problems that require multiple simulations. The optimization process adopts an iterative architecture, which first defines the design variables and output parameters based on the geometric model, and samples the design space through the optimal filling strategy. Then, it constructs the genetic aggregation response surface model, verifies its accuracy, and corrects the model parameters cyclically when it fails to meet the standard. After passing the verification, the multi-objective genetic algorithm (MOGA) is initiated to conduct the global optimization search, and the offending solution is excluded through constraint checking. The compliant candidates are carried out in the engineering verification. After verification, the MOGA is activated for global optimization, the offending solutions are eliminated by constraint checking, the compliant candidates are subjected to engineering validation, and the optimal solution with comprehensive performance is finally selected based on the weight configuration of the objective function. The flow of sandbag key parameter optimization is shown in Figure 4.
This study focuses on the casting phase of the sandbag bank protection workflow. Throwing involves determining the throwing position of the sandbag, the spacing between the sandbags, and the throwing angle between the sandbag and the riverbank. In the numerical simulation, this paper selects the semi-cylinder as the simplified structure of the sandbag and optimizes the design for the angle between the semi-cylinder and the concave bank.
The characteristics of the riverbed through the scouring process indicate that sand flux is a key parameter to characterize the scouring behavior of the riverbed. When the sand flux increases, it indicates that scouring is occurring on the riverbed. When the sand flux decreases, it indicates that siltation is occurring on the riverbed. When the sand flux remains unchanged, it indicates that the riverbed is in an equilibrium of deposition and erosion. Therefore, in this paper, the net sediment mass flux rate of the riverbed is chosen as the output parameter to characterize the scour feedback of the riverbed.
This study focuses on the parameter optimization of mattress revetment engineering through a systematic analytical framework. The first phase conducts multi-scenario comparative calculations to determine the optimal angle set (70–230°) for sediment stabilization efficiency under upstream/downstream flow conditions. Subsequently, a coupling optimization model is established between flow velocity (0.5–2.5 m/s) and mattress spacing (20–70 m, equivalent to 2.5–9 times the diameter). To enhance the exploration efficiency in multidimensional nonlinear space, the optimal space-filling design (OSFD) methodology was introduced—an experimental design technique that generates 16 globally representative sample points based on the maximum distance criterion. This approach mathematically ensures a uniform coverage of the multidimensional parameter space, effectively overcoming the local clustering defects inherent in traditional sampling methods.
The innovation further lies in adopting non-parametric regression (NPR) for constructing response surface models. By employing kernel smoothing and locally weighted techniques, NPR dynamically captures the complex nonlinear relationships between variables, breaking through the preset functional constraints of parametric regression. This advancement enables a precise mechanistic analysis of the sediment stabilization effects relative to engineering parameters. The integrated technical pathway ultimately achieves collaborative optimization across the angle–velocity–spacing dimensions, with the specific optimization results detailed in Table 2. This methodology provides a novel paradigm for solving high-dimensional nonlinear optimization problems in hydraulic engineering design.

3. Results and Discussions

The optimization results for the angle, spacing distance, and flow velocity with 16 design points are shown in Table 2.

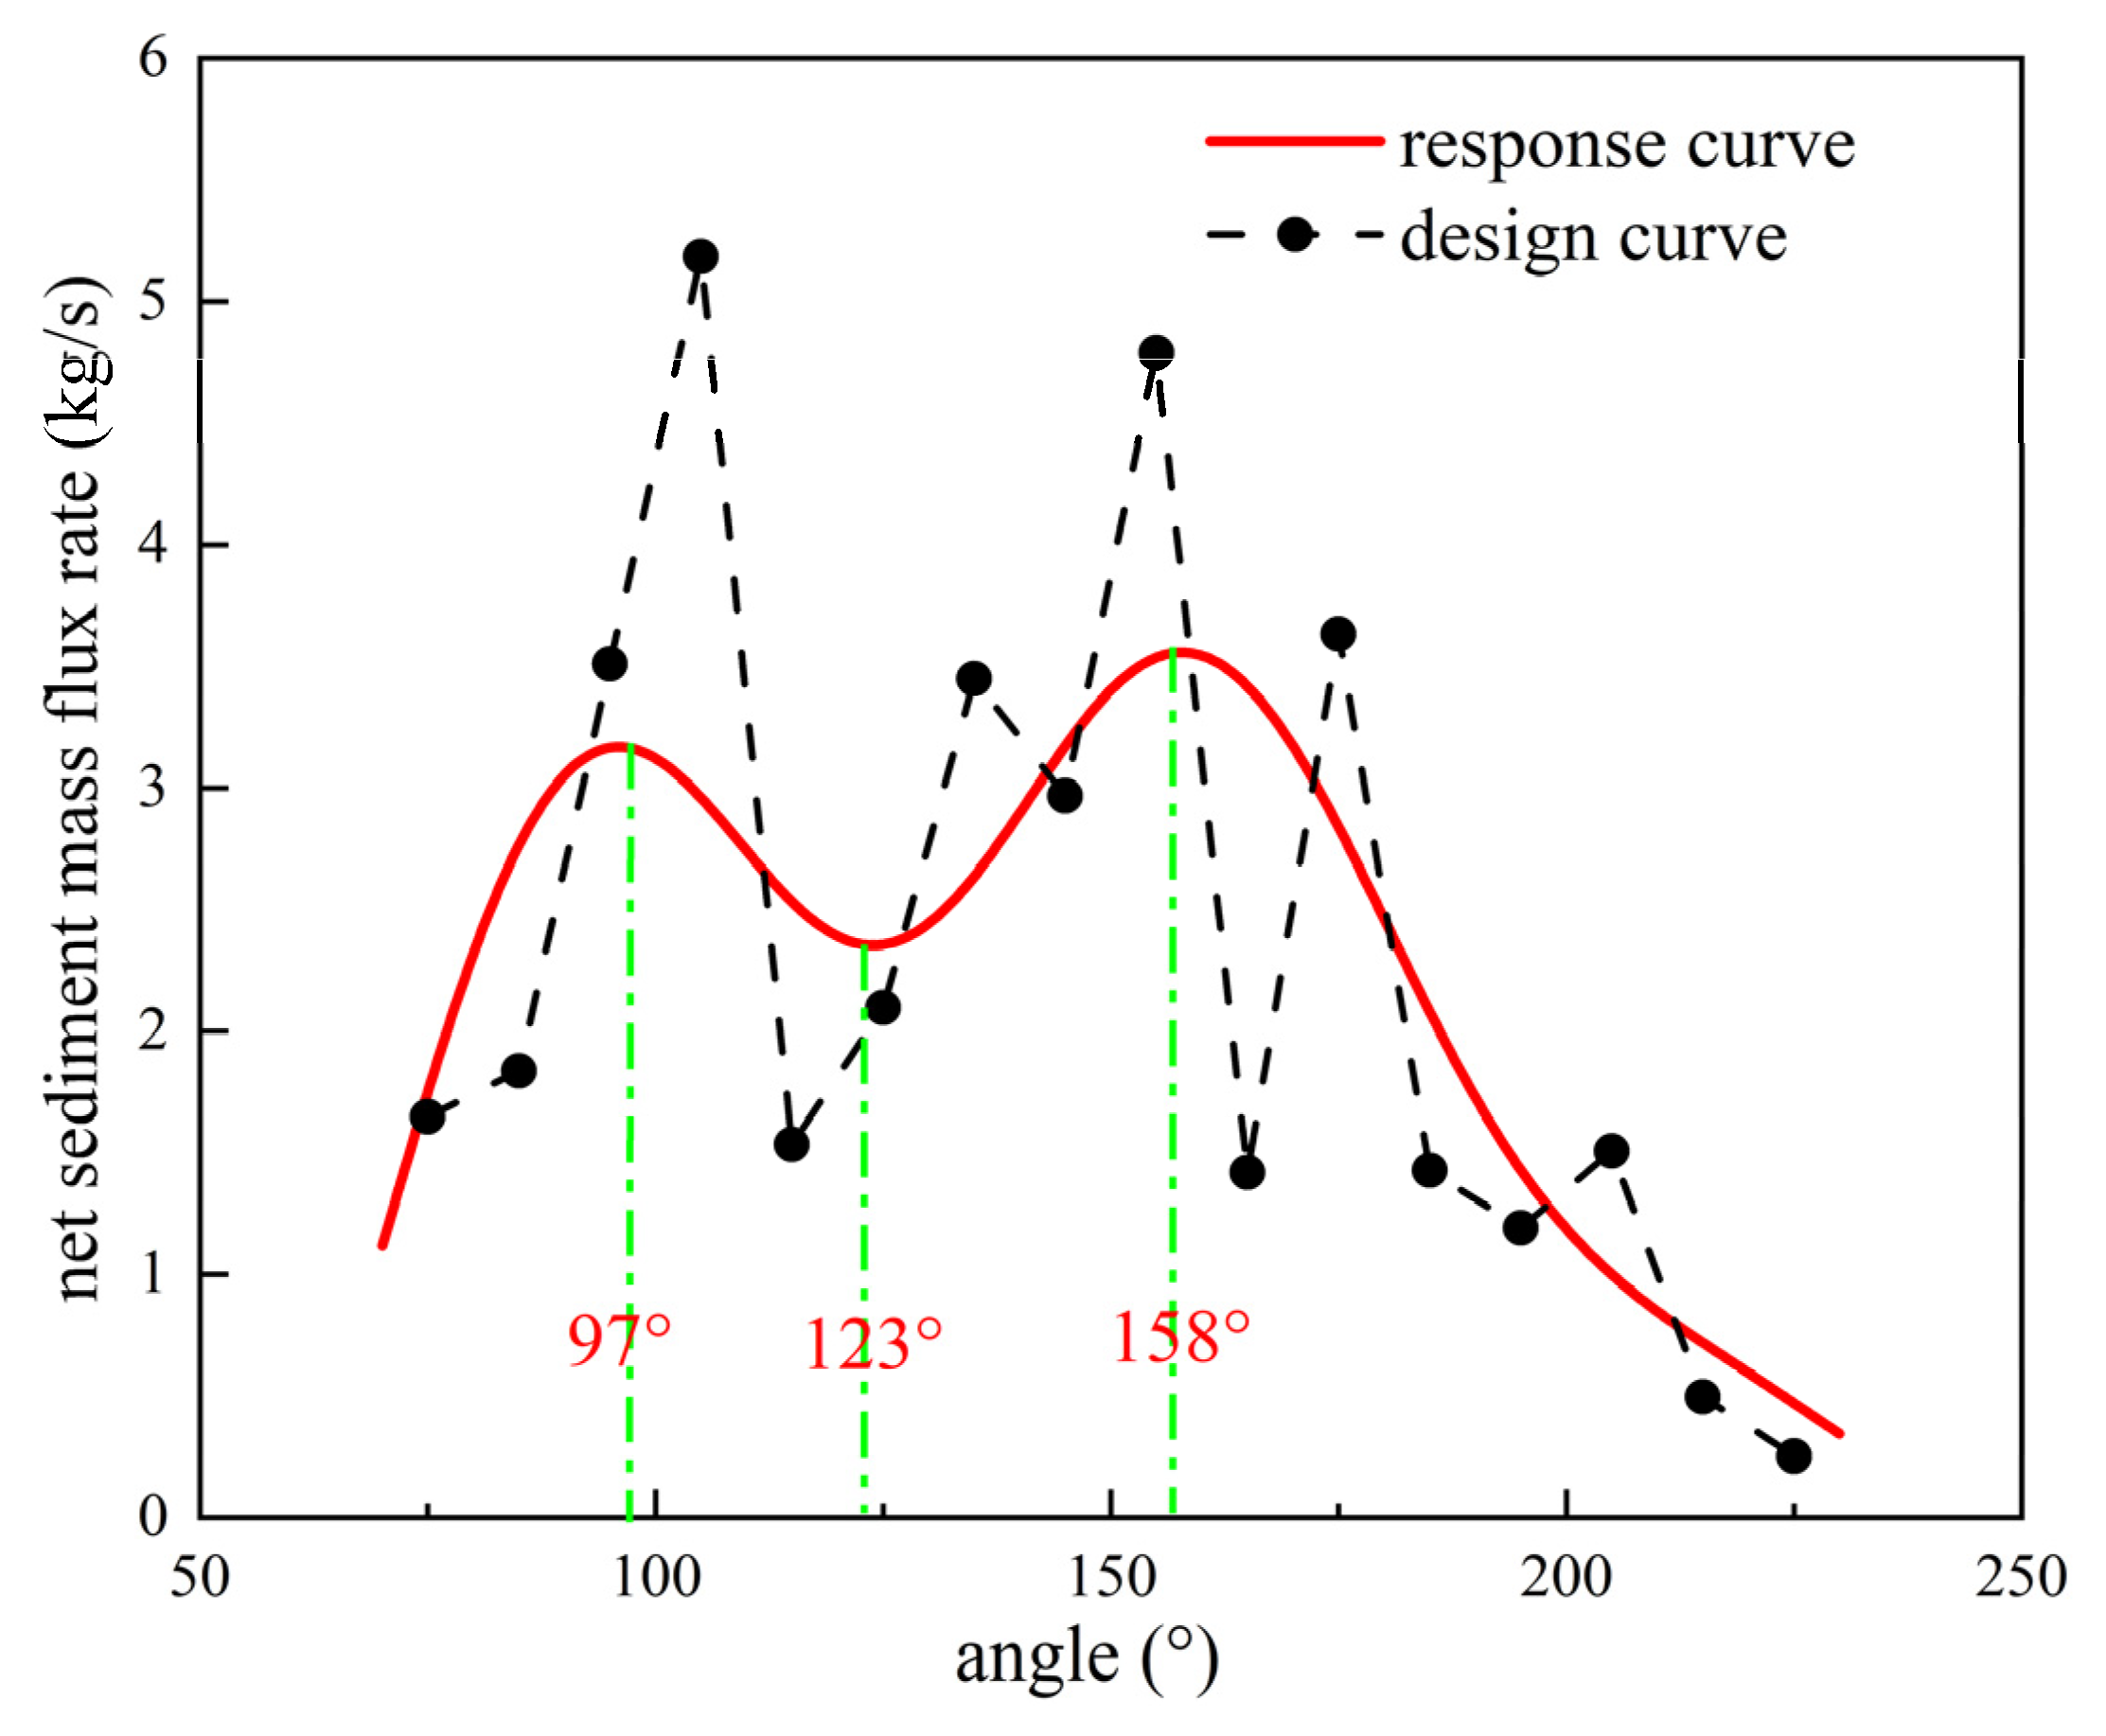
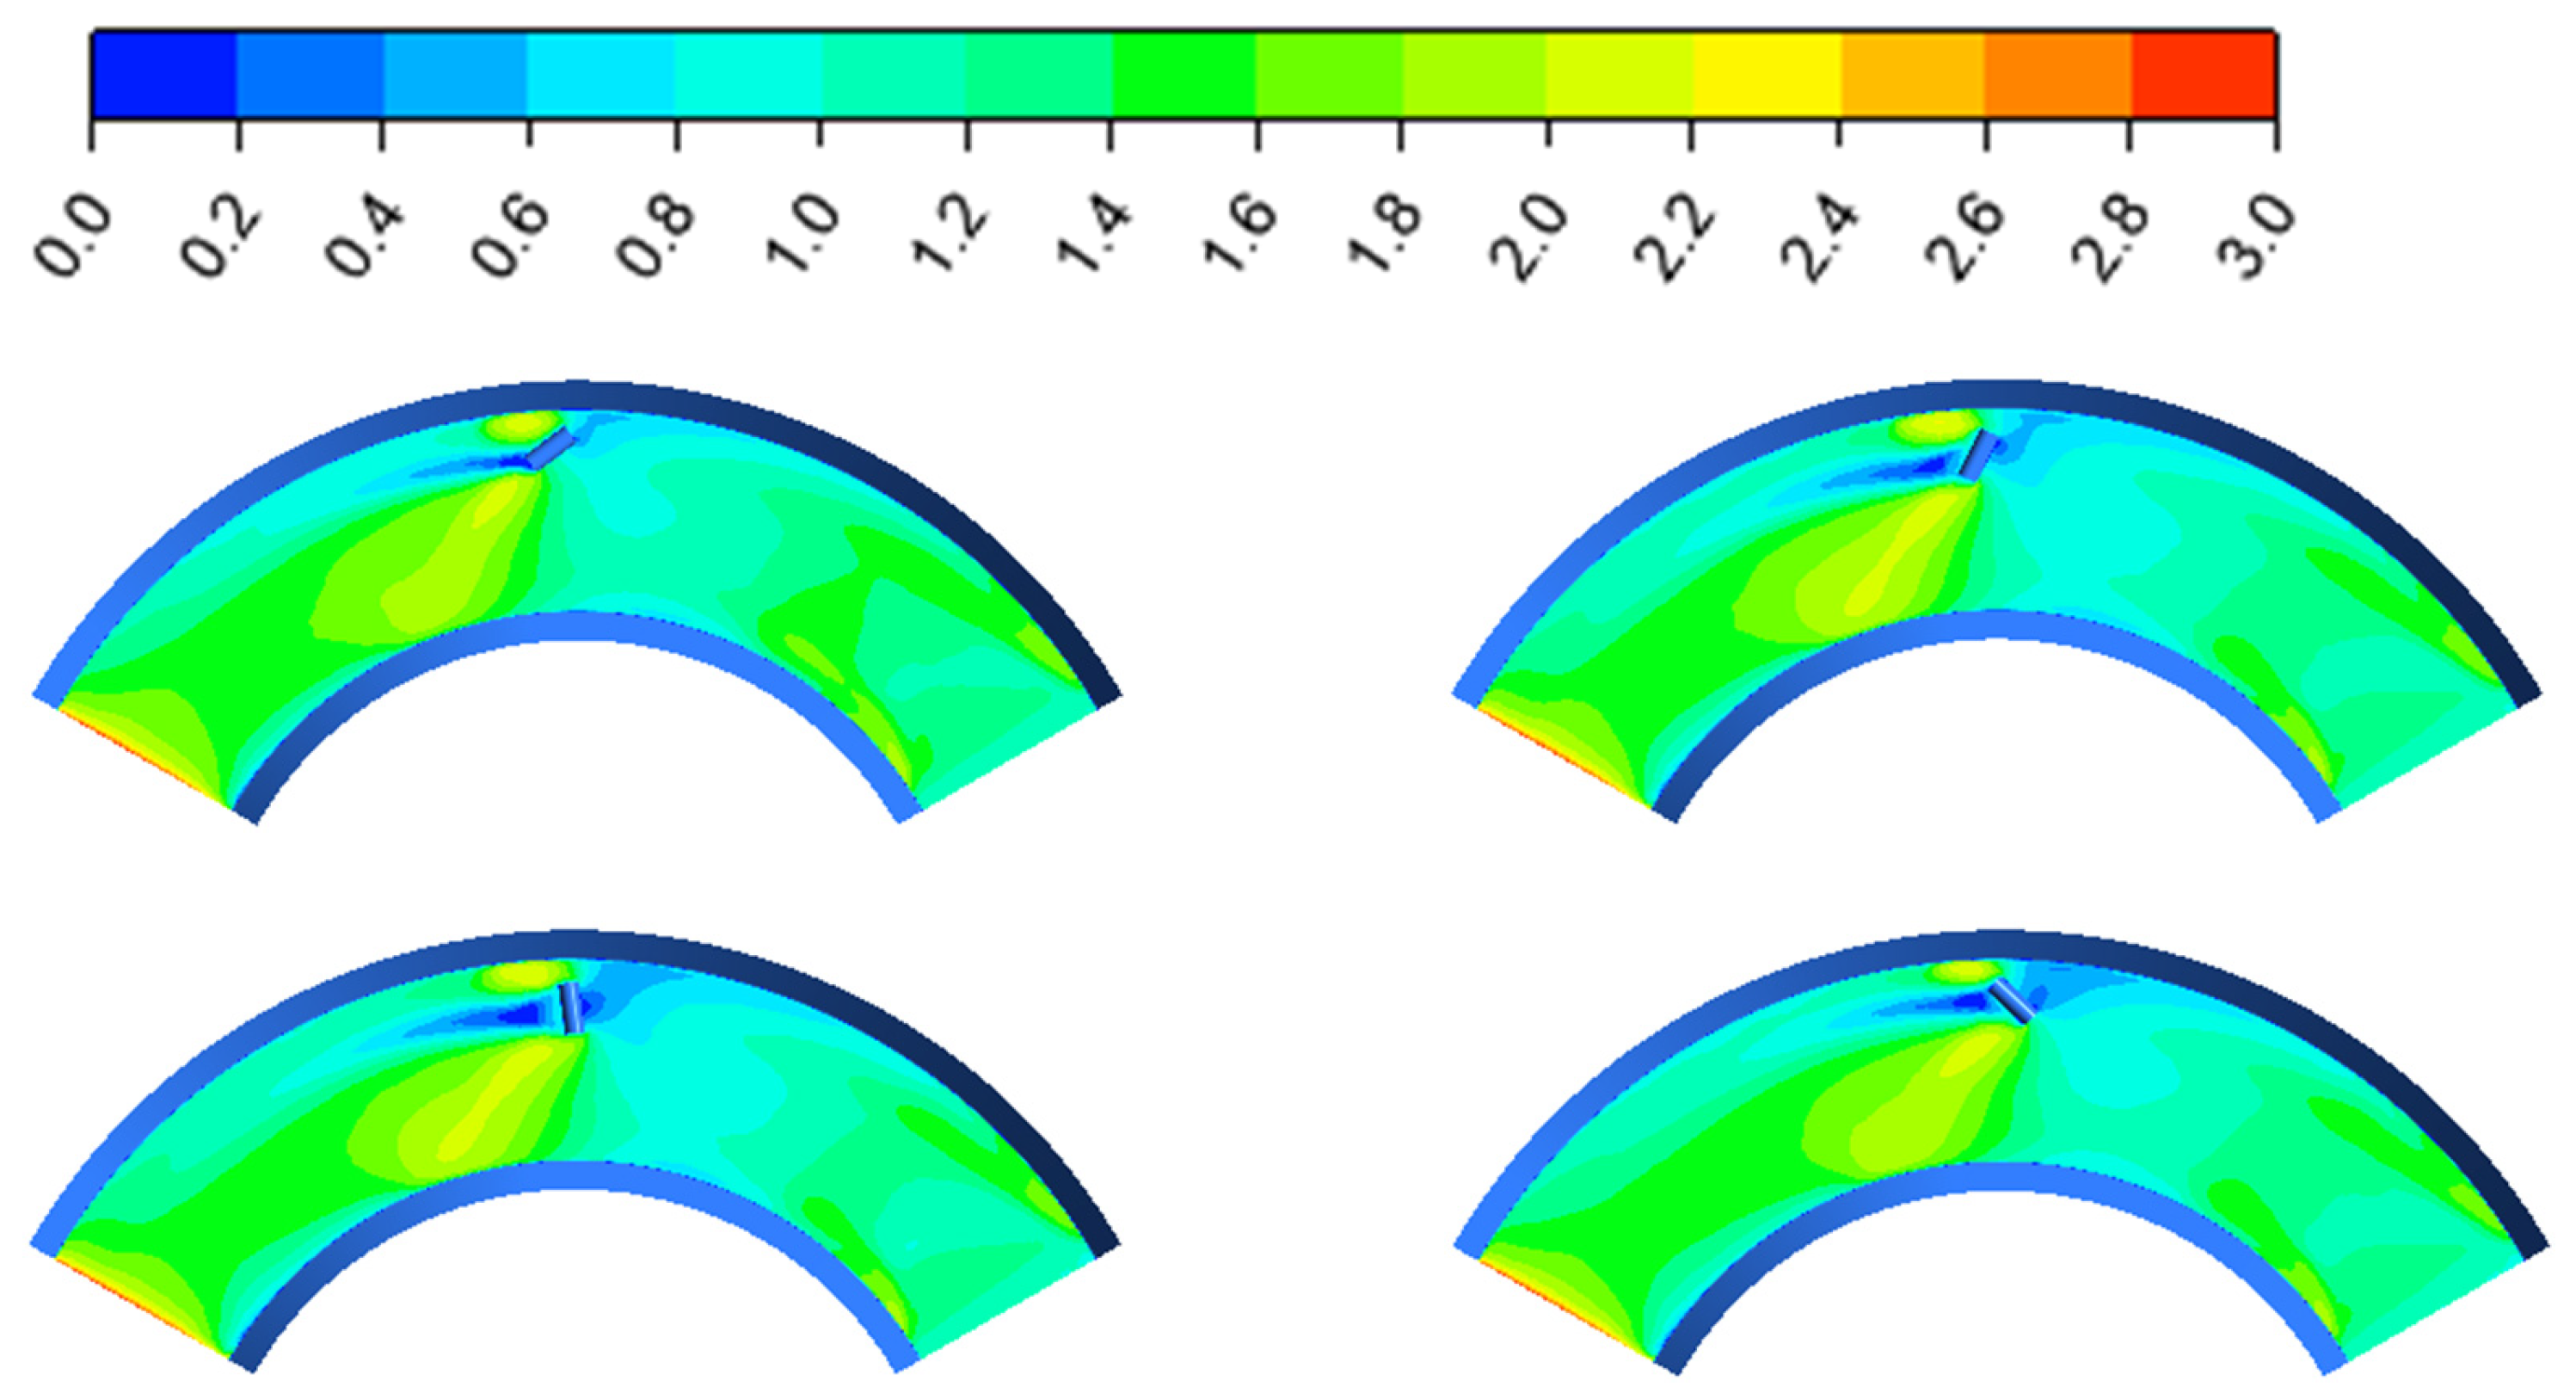
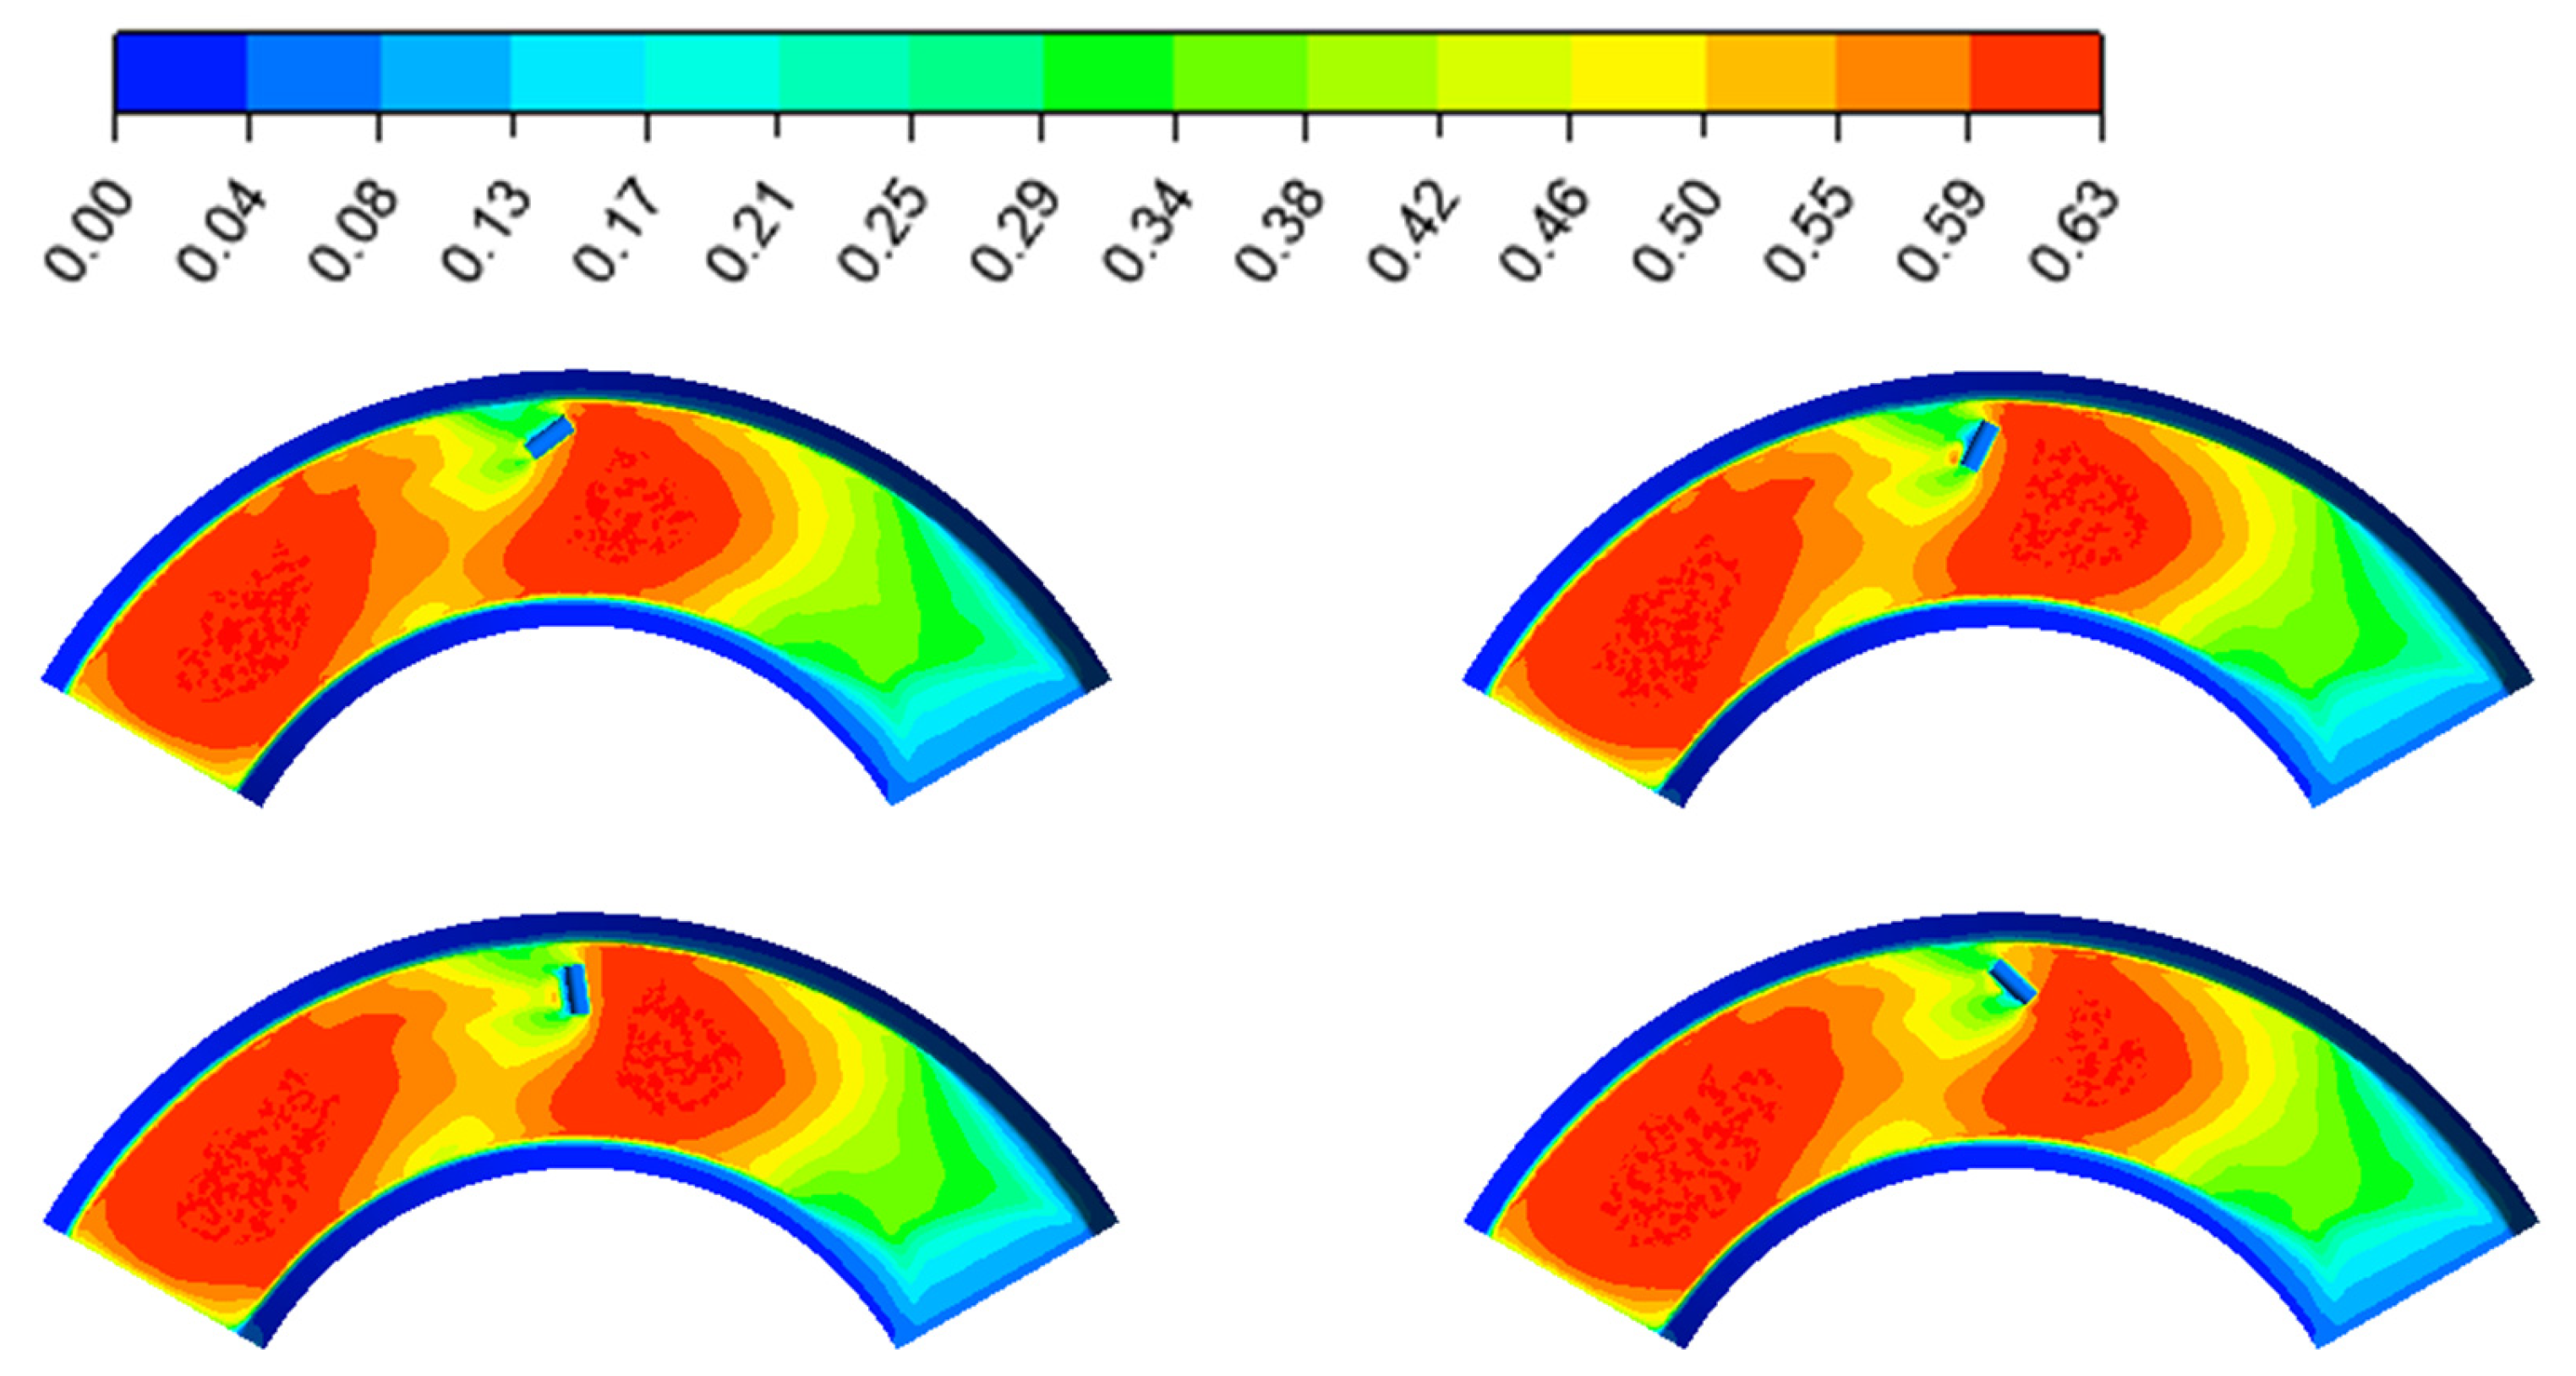
3.1. Clamp Angle Optimization Result Analysis

The relationship between the value range of the parameter block, a concave bank angle of 70°~230°, and θ in Figure 1 is shown in the following equation by entering the parameter block and concave bank angle in the workbench.
  θ = 70 ° ~ 230 ° 90 ° = 20 ° ~ 140 °
Therefore, the value of the input parameter baffle versus the concave bank angle is equivalent to a rotation of θ from −20° to 140°. Figure 5 shows the folded line and response surface fitted baffle vs. the concave bank angle vs. the net sediment mass flux rate in the riverbed calculated from the experimental design. The net sediment mass flux rate of the riverbed shows significant nonlinear characteristics with the angle. Extreme responses occur at 97°, 123°, and 158°, respectively, with 97° and 158° corresponding to locally very large values and 123° to locally very small values. It is worth noting that the response curve reaches the global maximum at 158°, which is 16.1% higher than the 97° extreme value, indicating that this angle is the optimal flow–sediment coupling effect.
In this study, we systematically investigated the regulation mechanism of the relationship between the sandbag arrangement angle and the concave bank geometry on the riverbed siltation dynamics by combining extreme value sampling and randomized validation [35]. Based on the extreme value characteristics of the net sediment mass flux rate, three key angles, 97°, 123° and 158°, were selected, and 197° was randomly introduced as a control parameter, focusing on analyzing the coupled response law of the flow field characteristics near the bed 0.5 m from the bottom surface and the sediment volume fraction at the bed surface. The results of the flow field visualization show (Figure 6) that a significant flow acceleration zone is formed on the convex bank side, and this flow pattern achieves a dual regulatory effect by enhancing the sand-carrying capacity of the water flow. On the one hand, the momentum transfer generated by the acceleration zone effectively inhibits sediment deposition on the convex bank [36], and on the other hand, it alleviates the scouring of the concave bank through the energy compensation mechanism. The sediment distribution data show (Figure 7) that, at the exit of the bend (concave and convex banks), there is sediment deposition, which is in line with the results of Sylvester’s study [37]. In addition, a heart-shaped high concentration aggregation zone with a volume fraction greater than 0.55 is developed in the front part of the bed at a 158° condition, and its upstream and downstream symmetrically distributed sediment retention zones form a dynamic equilibrium zone, which, combined with the results of the previous optimization, confirms that this angle is optimal for optimal mechanical matching between the distribution of the water flow shear and the sediment transport paths to reach the peak of the protection effectiveness.
A spatial analysis showed that the flow field reconstruction generated by the sandbag arrangement formed a heart-shaped sediment enrichment zone on the bottom surface of the first half of the riverbed, and the volume fraction of this zone was significantly higher than that of the surrounding areas (Figure 7). The symmetrically developed sediment retention zones upstream and downstream of the heart-shaped zone have a clear engineering protection value. The upstream retention zone reduces the direct impact energy of the concave bank by retaining the pushover mass in advance, while the downstream retention zone forms a natural anti-filter layer to inhibit backwater scouring. This spatial distribution pattern reveals that the sandbag forms a coupled “acceleration-retention” chain in the concave bank protection zone by changing the three-dimensional hydrodynamic structure of the near-bed layer, and the core mechanism is to optimize the local distribution of the water flow energy. The acceleration zone enhances the transport capacity of the suspended mass to reduce siltation. The results show that the 158° arrangement angle based on the principle of mechanical matching can coordinate the dynamic balance of flushing and siltation to the maximum extent, which provides a theoretical basis for the spatial optimization of the protective structure in the river-training project.

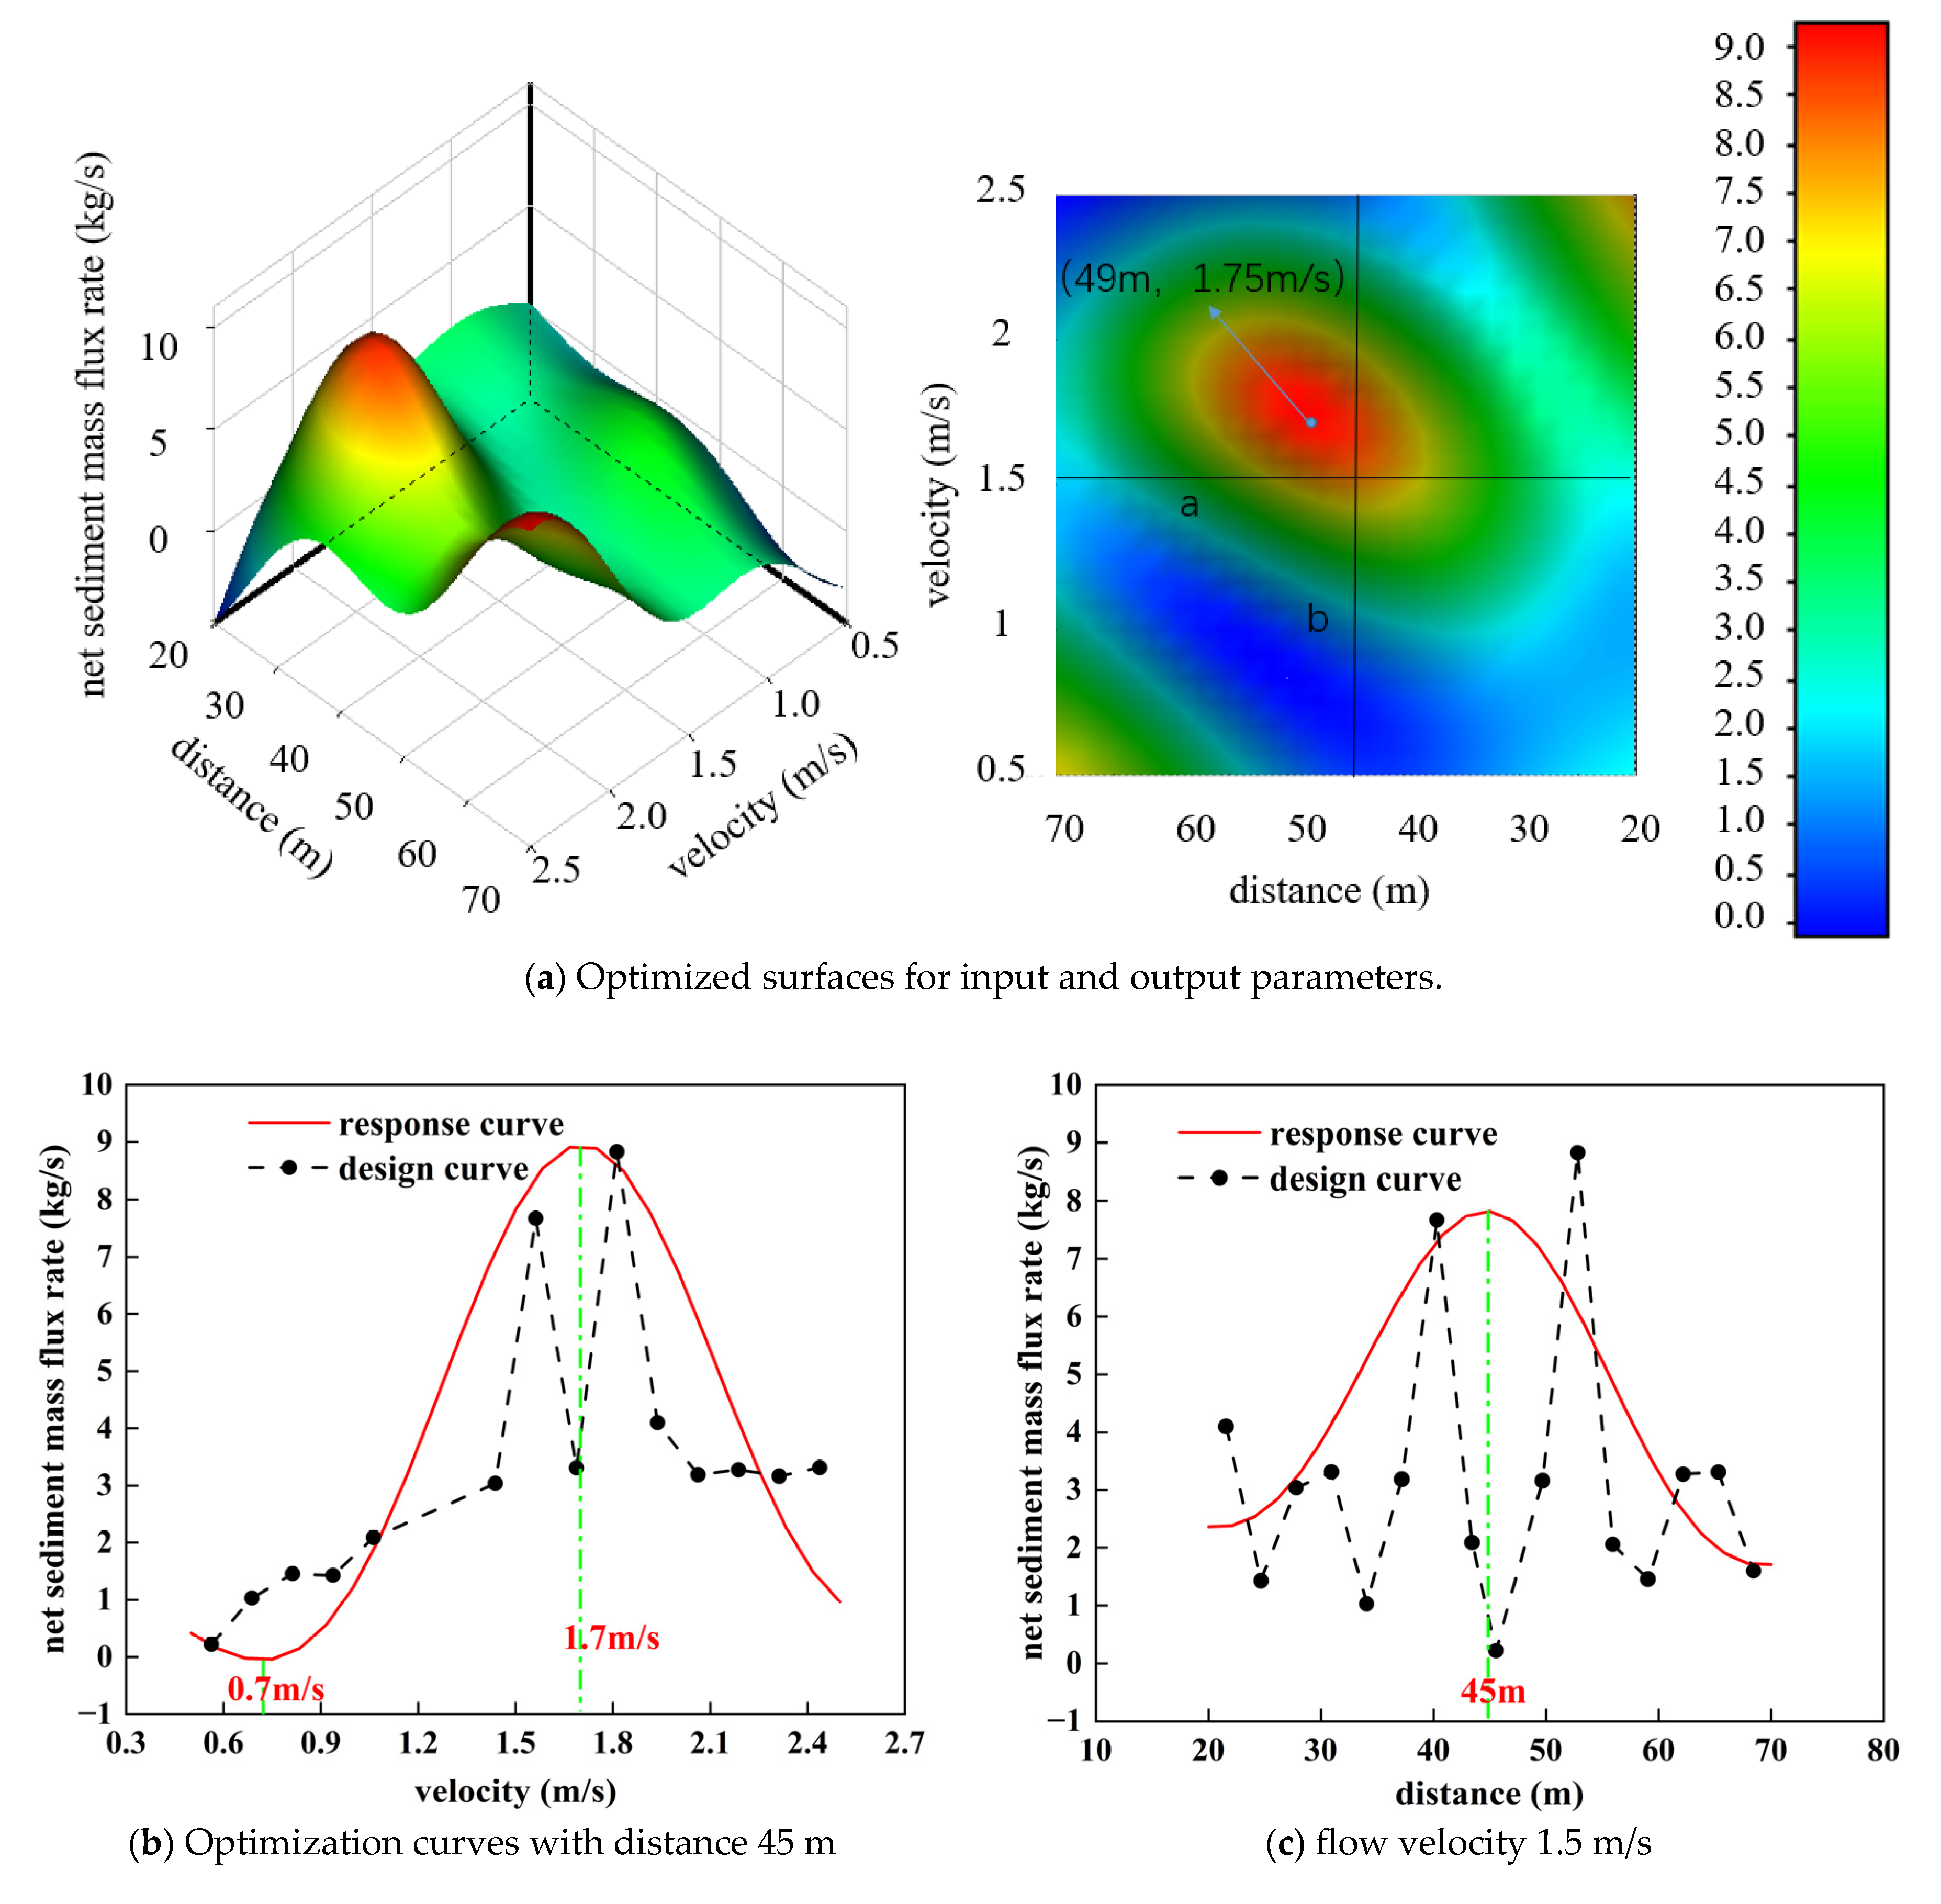
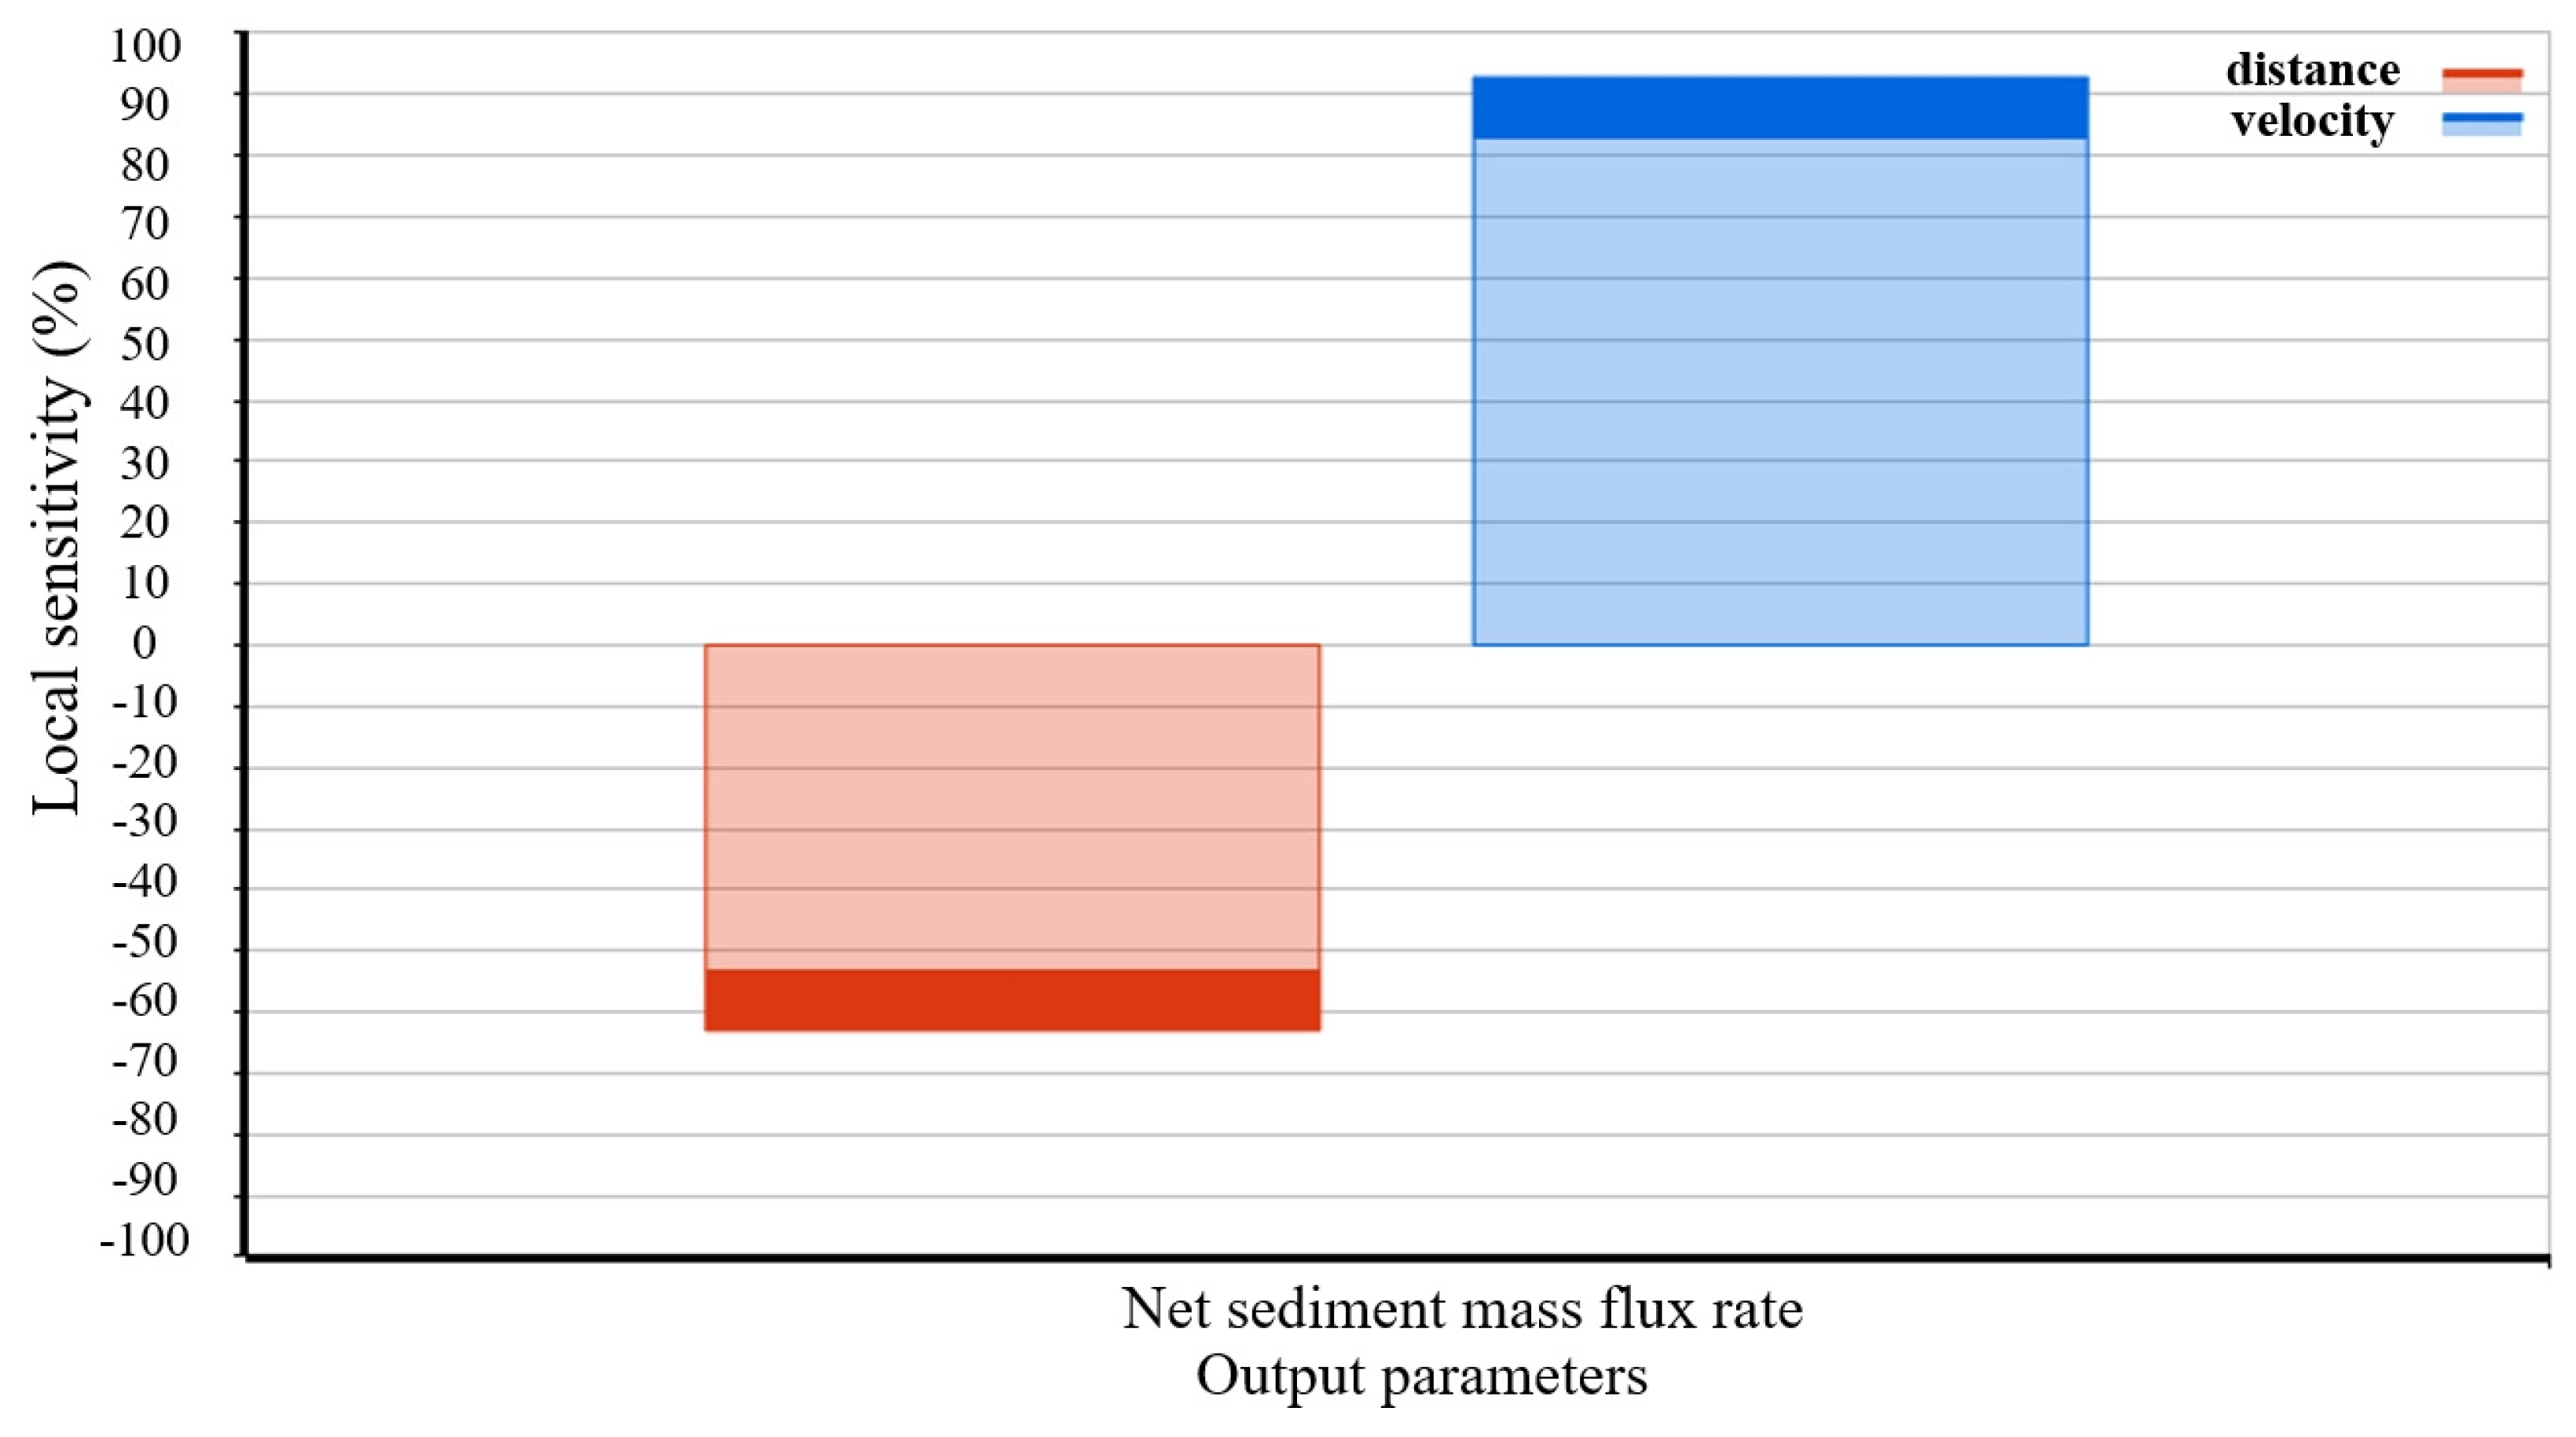
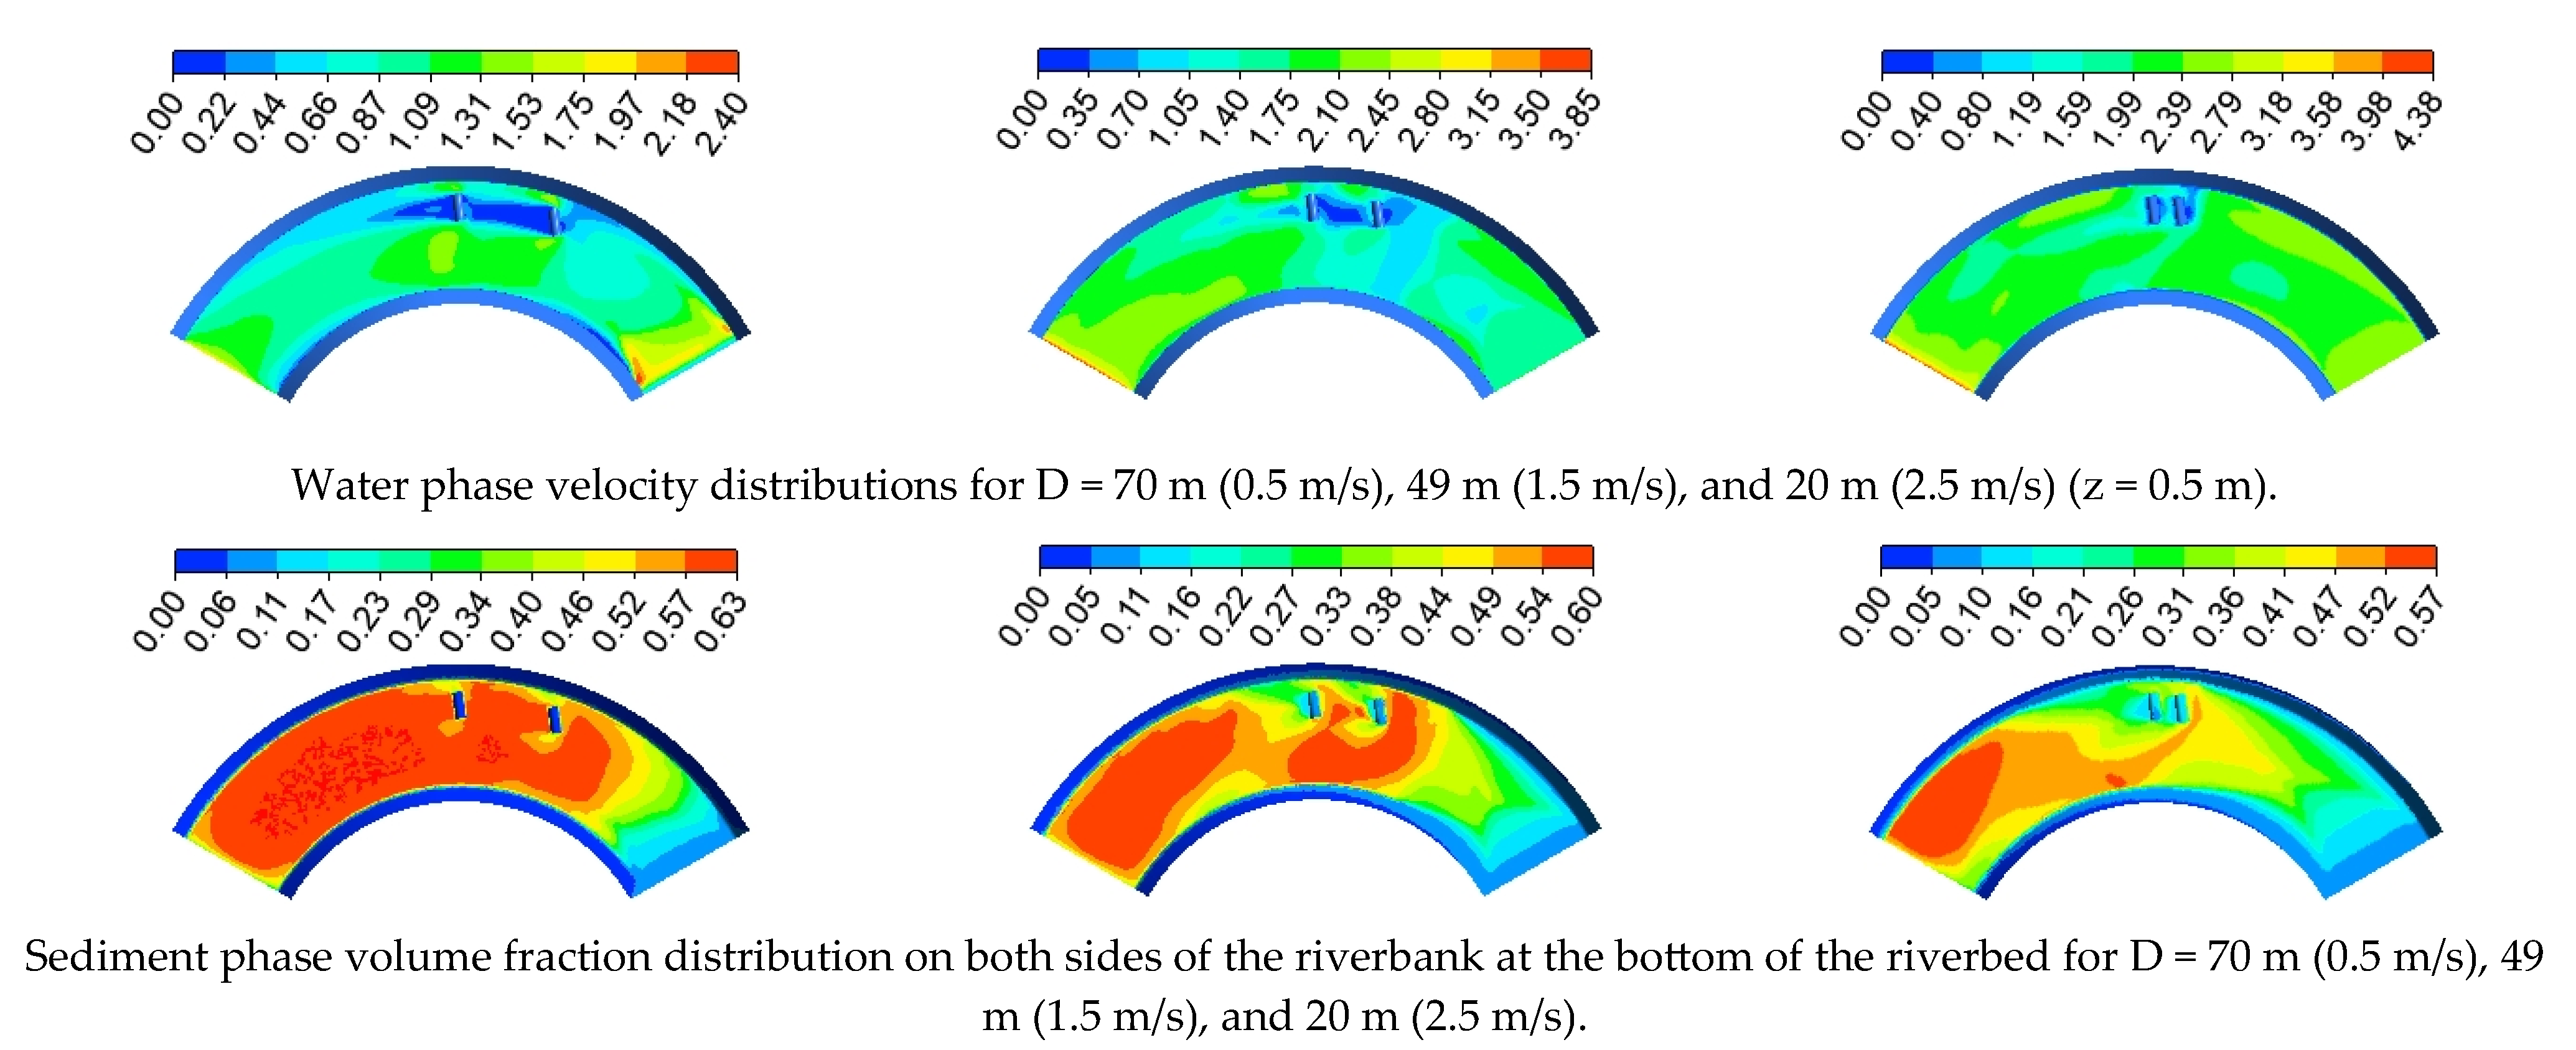
3.2. Analysis of Flow Rate and Spacing Optimization Results

The riverbed flow velocity shows significant seasonal fluctuation characteristics, and the dramatic increase in flow rate during the heavy rainfall period leads to frequent flow rate peaks. So, the design of sandbag spacing needs to take the inlet flow rate as a key synergistic variable. The three-dimensional response surface in Figure 8a shows that the inlet flow velocity (V) and sandbag spacing (D) jointly regulate the net sediment mass flow rate (Q) in the riverbed, and the vertical lines in the top-view projection (a, b) reveal the parameter-coupling law. When (V = 1.7 m/s, D = 49 m), Q reaches the global maximum value, and this critical point corresponds to the optimal hydraulic regulation.
Figure 8b,c reveal the quantitative relationship between the inlet flow velocity (V), the sandbag spacing (D), and net sediment mass flux rate (Q), respectively. In Figure 8b, V = 0.7 m/s (Q extreme) and V = 1.7 m/s (Q minimal) constitute a bipolar response, whose response surface curve is mathematically correlated with the line in the cross-section in Figure 8a. Figure 8c shows that Q reaches a peak value at D = 49 m, which corresponds to the extreme value of the line b cross-section. Further analysis shows that the dynamics of V (0.5~2.5 m/s) in the actual working condition requires a differentiated design of sandbag spacing. The optimal spacing is 70 m in the slow section (0.5~1.0 m/s), 49 m in the normal section (1.0~2.0 m/s), and 20 m in the rapid section (2.0~2.5 m/s). The gradient law reveals the synergistic regulation mechanism of V and D on Q, which provides key evidence for the optimization of the parameters of the bank protection project under dynamic water flow conditions.
At an angle of 158° between the sandbags and the concave bank, the sensitivity analysis of the input parameters (inlet flow velocity at the riverbed entrance and spacing of sandbags) on the output parameter (net riverbed sediment mass flux rate) is shown in Figure 9.
In the local sensitivity analysis of the input and output parameters, it was found that the sensitivity of the riverbed inlet current velocity to the net sediment mass flux rate in the riverbed was about 1.5 times the absolute value of the sensitivity of the distance between sandbags to the net sediment mass flux rate in the riverbed. This phenomenon can be further elucidated by previous studies. For example, a long-term evolution study of beaches in Southeastern Xiamen Island showed that sediment supply conditions dominated the spatial and temporal variability of sediment transport, with hydrodynamics playing a key role in the longitudinal variability of the response of the beach profile [38]. At the same time, slope stability analyses pointed out that the scouring action of the water flow significantly affects the erosion rates by altering the footwall support conditions, and its sensitivity is much higher than that of the erosion rates. The erosion rate and its sensitivity are much higher than the other geometric parameters [39]. Together, the above studies indicate that the regulation of the sediment transport system by water flow dynamics is universal. The quantitative results of this study further confirm that the sensitivity advantage of streamflow velocity at the riverbed inlet is closely related to the kinetic mechanism of sediment transport, and its change will trigger a more drastic response. Therefore, riverbed inlet flow velocity should be a key factor to be prioritized in the optimization of riverbed management and sediment transport models.
Three inlet flow rates of 0.5 m/s, 1.5 m/s, and 2.5 m/s are used as boundary conditions to analyze the effect of sandbag spacing on riverbed scour. By constructing numerical models for the three sandbag spacings of 70 m, 49 m, and 20 m, we focused on analyzing the characteristics of the flow field at 0.5 m from the bottom of the riverbed and the distribution law of the sediment volume fraction in the bottom bed. The analysis of the flow field and sediment volume fraction distribution based on Figure 10 shows that the double-sandbag arrangement can significantly expand the range of the deceleration zone in the near-bottom flow field, which can effectively inhibit the scour of the riverbed. Among them, the sediment volume fraction on the bottom bed under the conditions of 70 m spacing and 0.5 m/s inlet flow rate maintains a higher level overall. Combined with the results of the sensitivity analysis, it can be learned that the main reason for this condition is the low velocity of the inlet flow.
The evaluation of sand barrier effectiveness based on sediment net mass flux rate (Q) shows (Figure 11a) that there is a nonlinear coupling relationship between sandbag spacing (D) and water velocity (V). Q decreases with the increase of V under the condition of large spacing (D = 70 m), and Q increases with the rise of V under the condition of small spacing (D = 20 m). Q increases with the rise of V under the condition of medium spacing (D = 45 m, 49 m), and the whole condition shows a single-peaked curve with the increase of V and then a decrease. The curve of medium spacing (D = 45 m, 49 m) shows a single peak first increasing and then decreasing, and the great value point is concentrated near V = 1.75 m/s. This law reveals that the sandbag space needs to follow the dynamic matching principle—the slow-speed section (V < 1.0 m/s) adopts small spacing (D < 45 m), the normal-speed section (1.0 m/s ≤ V ≤ 2.0 m/s) is suitable for medium spacing (45~49 m), and the rapid-speed section (V > 2.0 m/s) needs large spacing (D > 49 m) to balance the sand transport restraint and the structural stability.
Figure 11b further verifies the flow rate dependence of the Q-D relationship. When V = 1.75 m/s, Q reaches a maximum value at D = 49 m. Meanwhile, the spacing corresponds to a very small value of Q for the V = 0.5 m/s and 2.1 m/s conditions. This suggests that there is a critical flow rate threshold for the density of sandbag space low flow velocity (V < 1.0 m/s), which requires sparse space (D > 49 m) to avoid the overuse of sandbags, and a high flow rate (V > 2.0 m/s) requires dense space (D < 45 m) to enhance the scouring resistance. This dual-threshold regulation mechanism provides a gradient optimization strategy for riverbed protection under dynamic flow conditions.

4. Conclusions

In this study, the anti-scouring mechanism of half-cylinder sandbags in a 120°-bend riverbed was systematically revealed by integrating response surface optimization and a multi-objective genetic algorithm (MOGA). The results show that the angle between the sandbag and the concave bank has a significant nonlinear modulation effect on the bank protection effect. When the angle is 158°, the net sediment mass flux rate of the riverbed with a single-sandbag layout reaches a peak of 9.4 kg/s, which is the best bank protection effect. The double-sandbag synergistic analysis further shows that the coupling effect of the flow velocity gradient and spacing parameter presents a flow velocity dominant feature (the sensitivity coefficient is about 1.5 times the spacing). The optimization framework based on the flow velocity partition shows that the optimal sandbag spacing of 49 m in the normal velocity section (1.0~2.0 m/s) ensures the best bank protection effect.
This study attempts to construct a parametric synergistic analysis framework of flow velocity–angle–spacing, aiming to provide a complementary perspective to the traditional single-factor test method. Although the current results can provide a quantitative reference for the selection of design parameters for bend bank protection projects, they do not take into account the effect of sudden turbulence caused by the non-uniform structure of the riverbed, and the conclusions still need to be verified by more measured data of riverbed morphological evolution. The development of optimization algorithms for adaptive terrain dynamics will be a critical breakthrough that needs to be focused on in subsequent research.

Author Contributions

Conceptualization, M.W. and H.S.; methodology, L.W.; software, L.H.; validation, M.W., L.W. and H.S.; formal analysis, H.W. and J.C.; investigation, L.H. and J.C.; resources, M.W. and H.W.; data curation, L.W.; writing—original draft preparation, L.H.; writing—review and editing, L.H., L.W. and H.S.; supervision, H.S.; funding acquisition, M.W. and L.W. All authors have read and agreed to the published version of the manuscript.

Funding

This research was funded by the Water Conservancy Science and Technology Project of Jiangsu Province, grant number 523074712.

Data Availability Statement

The dataset is available upon request from the authors.

Conflicts of Interest

The authors declare no conflicts of interest.

References

  1. Petts, G.E.; Nestler, J.; Kennedy, R. Advancing science for water resources management. Hydrobiologia 2006, 565, 277–288. [Google Scholar] [CrossRef]
  2. Kondolf, G.M. Hungry water: Effects of dams and gravel mining on river channels. Environ. Manag. 1997, 21, 533–551. [Google Scholar] [CrossRef] [PubMed]
  3. Pradhan, K.T.; Malasani, C.G.; Reddy, K.S.; Chandra, V. Investigation on scouring and turbulence characteristics around T-head spur dike. J. Appl. Water Eng. Res. 2024, 12, 323–338. [Google Scholar] [CrossRef]
  4. Khatun, S.; Jamal, M.; Adil, R.M.; Ghosh, A.; Sen, D. Investigation of river bank protection using riprap under drawdown condition. Indian Geotech. J. 2024; in press. [Google Scholar] [CrossRef]
  5. Tian, Z.H.; Chi, F.H.; Xiao, Y.; Li, T. Construction technology for deep-water revetment with sandbags in the Nanjing section of the Yangtze River. Constr. Technol. 2013, 42, 47–50. (In Chinese) [Google Scholar]
  6. Yang, Y.H.; Yang, S.Q.; Wang, X.; Wang, C.; Wang, J. Study on the influence of ecological vegetation revetment on river flow and sediment environment. Water Supply 2020, 20, 3141–3155. [Google Scholar] [CrossRef]
  7. Niu, Y.Y.; Tsao, J.C. Numerical evaluation of erosion in curved ducts. Numer. Heat Transf. Part A Appl. 2002, 41, 341–356. [Google Scholar] [CrossRef]
  8. Chen, J.; Tang, H.W.; Li, Z.; Dai, W.H. Multi-approach analysis of maximum riverbed scour depth above subway tunnel. Water Sci. Eng. 2010, 3, 431–442. [Google Scholar]
  9. Abbaspour, A.; Parvini, S.; Dalir, A.H. Effect of buried plates on scour profiles downstream of hydraulic jump in open channels with horizontal and reverse bed slopes. Water Sci. Eng. 2016, 9, 329–335. [Google Scholar] [CrossRef]
  10. Khosravinia, P.; Malekpour, A.; Hosseinzadehdalir, A.; Farsadizadeh, D. Effect of trapezoidal collars as a scour countermeasure around wing-wall abutments. Water Sci. Eng. 2018, 11, 53–60. [Google Scholar] [CrossRef]
  11. Ataie-Ashtiani, B.; Beheshti, A.A. Experimental investigation of clear-water local scour at pile groups. J. Hydraul. Eng. 2002, 132, 1100–1104. [Google Scholar] [CrossRef]
  12. Ballio, F.; Teruzzi, A.; Radice, A. Constriction effects in clear-water scour at abutments. J. Hydraul. Eng. 2009, 135, 140–145. [Google Scholar] [CrossRef]
  13. Ataie-Ashtiani, B.; Baratian-Ghorghi, Z.; Beheshti, A.A. Experimental investigation of clear-water local scour of compound piers. J. Hydraul. Eng. 2010, 136, 343–351. [Google Scholar] [CrossRef]
  14. Zhang, X.L.; Jiao, J. The application of wide tail piers and energy dissipators in the Bandao Hydropower Station. Northwest Hydropower 2008, 4, 24–26+48. (In Chinese) [Google Scholar]
  15. Yao, S.M.; Lu, J.Y. Experimental study on the application of two kinds of new materials to bank protection. J. Sediment. Res. 2006, 2, 17–21. [Google Scholar]
  16. Kong, L.L.; Wang, X.M.; Guo, W.C.; Zhang, Y.C. Effects of municipal solid waste on planting properties and scouring resistance of vegetation concrete. Int. J. Environ. Res. Public Health 2022, 19, 8143. [Google Scholar] [CrossRef]
  17. Wang, C.; Yu, X.; Liang, F.Y. A preliminary design of apparatus for scour resistance test in riverbed sediments. In Proceedings of the IFCEE 2018: Recent Developments in Geotechnical Engineering Practice, Orlando, FL, USA, 5–10 March 2018; Volume 294, pp. 746–757. [Google Scholar]
  18. Yu, W.C.; Zhang, Z.L. Evolution trend of basic channel scour and morphological adjustment in Yangtze River estuary from 2002 to 2018. J. Change River Sci. Res. Inst. 2021, 38, 1–8. [Google Scholar]
  19. Stout, J.C.; Belmont, P.; Schottler, S.P.; Willenbring, J.K. Identifying sediment sources and sinks in the root river, southeastern Minnesota. Ann. Assoc. Am. Geogr. 2014, 104, 20–39. [Google Scholar] [CrossRef]
  20. McCarney-Castle, K.; Childress, T.M.; Heaton, C.R. Sediment source identification and load prediction in a mixed-use Piedmont watershed, South Carolina. J. Environ. Manag. 2017, 185, 60–69. [Google Scholar] [CrossRef]
  21. Liu, W.T.; Li, Y.Y. Three dimensional numerical analyses of bridge piled-raft foundation under riverbed erosion. In Proceedings of the 2nd International Conference on Civil Engineering, Architecture and Building Materials (CEABM 2012), Yantai, China, 25–27 May 2012; Volume 1802, pp. 2373–2377. [Google Scholar]
  22. Harasti, A.; Gilja, G.; Potocki, K.; Lacko, M. Scour at bridge piers protected by the riprap sloping structure: A review. Water 2021, 13, 3606. [Google Scholar] [CrossRef]
  23. Sun, H.G.; Hong, L.Z.; Wang, M.M.; Wang, L. Benefit analysis of different ecological throw pillow protection based on CFD-DPM modeling. J. Chang River Sci. Res. Inst. 2025, 42, 19–26. (In Chinese) [Google Scholar]
  24. Andreini, A.; Bianchini, C.; Puggelli, S.; Demoulin, F.X. Development of a turbulent liquid flux model for Eulerian-Eulerian multiphase flow simulations. Int. J. Multiph. Flow 2016, 81, 88–103. [Google Scholar] [CrossRef]
  25. Nagawkar, B.R.; Passalacqua, A.; Subramaniam, S. A study on the scale dependence of mixing indices for Eulerian multiphase models. AiChe J 2024, 70, e18589. [Google Scholar] [CrossRef]
  26. Wang, X.P. Pareto genetic algorithm for multi-objective optimization design. Syst. Eng. Electron. 2003, 25, 1558–1561. (In Chinese) [Google Scholar]
  27. Kim, H.; Yoo, H.; Paik, K.; Kim, D.-H. Qualitative assessment model for longitudinal riverbed erosion and deposition based on suspended sediment impacts and hydraulic geometry relationship. J. Hydrol. 2025, 657, 133049. [Google Scholar] [CrossRef]
  28. Fan, C.; Dong, M.; Xu, M.; Mou, J.; Han, P. Visualization experiment of solid-liquid two-phase flow transportation in a jet pump. J. Phys. Conf. Ser. 2024, 2854, 012056. [Google Scholar]
  29. Ranjbari, P.; Ebrahimi, M.; Ein-Mozaffari, F.; Upreti, S.; Lohi, A. A critical review of the coupled CFD-DEM method for the simulation of two-phase liquid-solid systems. Powder Technol. 2025, 454, 120677. [Google Scholar] [CrossRef]
  30. Zhou, Z.Y.; Kuang, S.B.; Chu, K.W.; Yu, A.B. Discrete particle simulation of particle-fluid flow: Model formulations and their applicability. J. Fluid Mech. 2010, 661, 482–510. [Google Scholar] [CrossRef]
  31. Ge, J.K.; Qiu, Y.H.; Wu, C.M.; Pu, G.L. Summary of genetic algorithms research. Appl. Res. Comput. 2008, 25, 2911–2916. (In Chinese) [Google Scholar]
  32. Fonseca, C.M.; Fleming, P.J. Multiobjective optimization and multiple constraint handling with evolutionary algorithms-Part II: Application example. IEEE Trans. Syst. Man Cybern. Part A Syst. Hum. 1998, 28, 38–47. [Google Scholar] [CrossRef]
  33. Hackney, C.; Best, J.; Leyland, J.; Darby, S.E.; Parsons, D.; Aalto, R.; Nicholas, A. Modulation of outer bank erosion by slump blocks: Disentangling the protective and destructive role of failed material on the three-dimensional flow structure. Geophys. Res. Lett. 2015, 42, 10663–10670. [Google Scholar] [CrossRef]
  34. Qin, L.; Lu, X.X.; Li, L.; Han, H.; Chai, M.; Yan, X.; Chen, S.; Wang, H.; Ma, W. Optimization of G1 micromixer structure in two-fluid mixing based on CFD and response surface methodology. Processes 2024, 12, 122. [Google Scholar] [CrossRef]
  35. Strnad, F.; Moravec, V.; Markonis, Y.; Máca, P.; Masner, J.; Stočes, M.; Hanel, M. An index-flood statistical model for hydrological drought assessment. Water 2020, 12, 1213. [Google Scholar] [CrossRef]
  36. Biswas, P.; Barbhuiya, A.K. Scour at river bend: A parametric study. Iran. J. Sci. Technol. Trans. Civ. Eng. 2020, 44, 1001–1021. [Google Scholar] [CrossRef]
  37. Sylvester, Z.; Durkin, P.R.; Hubbard, S.M.; Mohrig, D. Autogenic translation and counter point bar deposition in meandering rivers. GSA Bull. 2021, 133, 2439–2456. [Google Scholar] [CrossRef]
  38. Zhu, X.J.; Qi, H.S.; Lei, G.; Cai, F.; Zhao, S.; Liu, G.; Chen, C. The study of the difference of beach response under sediment supply in southeast of Xiamen Island. Mar. Geol. Quat. Geol. 2022, 42, 96–108. [Google Scholar]
  39. He, Z.; Jiang, Q.Y. Discussion on the stability analysis and prevention measures of slop engineering. Mine Eng. 2021, 9, 210–213. (In Chinese) [Google Scholar] [CrossRef]
Figure 1. Riverbed modeling diagram.
Water 17 01360 g001
Figure 2. Computational area meshing.
Water 17 01360 g002
Figure 3. (a) Residual curves for each parameter and (b) variation curve of sediment mass flux.
Water 17 01360 g003
Figure 4. Flowchart for optimization of sandbag critical parameters.
Water 17 01360 g004
Figure 5. Optimized curve of the angle between the sandbag and the concave bank.
Water 17 01360 g005
Figure 6. Flow field information at angles of 97°, 123°, 158°, and 197° (z = 0.5 m).
Water 17 01360 g006
Figure 7. Sediment volume fraction distributed on the bottom of the riverbed and both sides of the riverbank at angles of 97°, 123°, 158°, and 197°, respectively.
Water 17 01360 g007
Figure 8. (a) A 3D optimized surface and (b,c) 2D curves for sand bag and water velocity and spacing under angle 158°.
Water 17 01360 g008
Figure 9. Comparison of sensitivity of sandbag distance and inlet flow velocity to net sediment mass flux rate in the streambed.
Water 17 01360 g009
Figure 10. Presentations of the flow velocity and sediment volume fraction distribution at the riverbed under conditions where the net riverbed sediment mass flux rate reaches its maximum value.
Water 17 01360 g010
Figure 11. Variation curves of net mass flow rate of sediments under different current velocities and sandbag spacing conditions.
Water 17 01360 g011
Table 1. Boundary conditions.
PhaseTitleBoundary ConditionsValues
riverinletvelocity inletv = 1 m/s
outletpressure outletPr = 0 Pa
top surfacezero-gradient boundary/
bottom and banks on both sideswall boundary/
particleinletvelocity inletv = 1 m/s
outletescape/
other surfacereflection/
Table 2. Response calculation results for angle, flow velocity, and throw pillow spacing.
CasesAngle (°)Net Sediment Flux (kg/s)Spacing Distance (m)Velocity
(m/s)
Net Sediment Flux (kg/s)
11554.788643.4381.06252.0885
21851.428668.4381.18751.5980
3751.649321.5631.93754.0976
41753.632930.9382.43753.3102
5851.836955.9381.31252.0567
62250.252945.5630.56250.2216
71651.419752.8131.81258.8269
82150.496949.6882.31253.1601
91151.535359.0630.81251.4570
101055.183765.3131.68753.3078
111353.448627.8131.43753.038
12953.509140.3131.56257.6727
131452.966962.1882.18753.2738
141951.192534.0630.68751.0304
151252.096624.6880.93751.4280
162051.506937.1882.06253.1864
Disclaimer/Publisher’s Note: The statements, opinions and data contained in all publications are solely those of the individual author(s) and contributor(s) and not of MDPI and/or the editor(s). MDPI and/or the editor(s) disclaim responsibility for any injury to people or property resulting from any ideas, methods, instructions or products referred to in the content.

