Abstract
Groundwater plays a leading role in ecological environment protection in semi-arid regions. The Huangshui River Basin is located in the Tibetan Plateau and Loess Plateau transition zone of semi-arid areas. Its ecological environment is relatively fragile, and there is an urgent need for systematic study of the basin to develop a groundwater environment and realize the rational and efficient development of water resources. In this study, methodologically, we combined the following: 1. Field sampling (271 groundwater samples across the basin’s hydrogeological units); 2. Comprehensive laboratory analysis of major ions and physicochemical parameters; 3. Multivariate statistical analysis (Pearson correlation, descriptive statistics); 4. Geospatial techniques (ArcGIS kriging interpolation); 5. Hydrochemical modeling (Piper diagrams, Gibbs plots, PHREEQC simulations). Key findings reveal the following: 1. Groundwater is generally weakly alkaline (pH 6.94–8.91) with TDS ranging 155–10,387 mg/L; 2. Clear spatial trends: TDS and major ions (Na+, Ca2+, Mg2+, Cl−, SO42−) increase along flow paths; 3. Water types evolve from Ca-HCO3-dominant (upper reaches) to complex Ca-SO4/Ca-Cl mixtures (lower reaches); 4. Water–rock interactions dominate hydrochemical evolution, with secondary cation exchange effects; 5. PHREEQC modeling identifies dominant carbonate dissolution (mean SIcalcite = −0.32) with localized evaporite influences (SIgypsum up to 0.12). By combining theoretical calculations and experimental results, this study reveals distinct hydrochemical patterns and evolution mechanisms. The groundwater transitions from Ca-HCO3-type in upstream areas to complex Ca-SO4/Cl mixtures downstream, driven primarily by dissolution of gypsum and carbonate minerals. Total dissolved solids increase dramatically along flow paths (155–10,387 mg/L), with Na+ and SO42− showing the strongest correlation to mineralization (r > 0.9). Cation exchange processes and anthropogenic inputs further modify water chemistry in midstream regions. These findings establish a baseline for sustainable groundwater management in this ecologically vulnerable basin.
1. Introduction
Water is one of the three fundamental natural resources intimately associated with human survival, development, and social activity [1,2,3]. The freshwater environment is under significant global pressure [4,5,6,7]. Groundwater resources, as a component of water resources of considerable importance, play a pivotal role in supporting residential water use and urban development in numerous cities across the globe [8,9]. Nevertheless, in recent years, due to global climate change and accelerated population and economic expansion, a series of groundwater ecological and environmental problems have emerged in some regions, such as the decline of groundwater levels [10,11,12], pollution of groundwater quality [13,14], the gradual shrinkage of lakes and wetlands [15,16], and seawater intrusion [17,18,19,20,21]. A comprehensive understanding of groundwater dynamics and hydrochemical evolution patterns and drivers can provide a robust foundation for the rational development, utilization, and protection of groundwater resources and serve as a significant basis for pollution prevention and control [22,23,24,25,26]. While groundwater dynamics in semi-arid regions globally have been extensively studied, the unique hydrogeological transition between the Tibetan and Loess Plateaus remains underexplored, particularly in terms of basin-scale hydrochemical evolution [27].
The ongoing deepening of Western Development and the implementation of the Qinghai Development Strategy have brought to the fore the issue of groundwater resources on the Tibetan Plateau [28,29]. A growing body of scholars, both domestically and internationally, has embarked on conducting research in the Huangshui River Basin. These studies encompass the vulnerability of the Huangshui River groundwater, the chemical characteristics of the water, the quality assessment of the water environment, and the development of countermeasures to prevent pollution [30,31]. It also includes investigating the potential of water resources in the Huangshui River Basin and the irrigation water cycle law in the Huangshui River Basin [32,33]. Furthermore, some studies consider spatial and temporal changes in water reserves in the Huangshui River Basin [34,35]. Some studies use an ecological footprint analysis to assess the sustainable development capacity of the Huangshui River Basin [36]. Furthermore, Song [37], Fang [38], and other scholars have studied the groundwater level in Qinghai Lake, the northeastern edge of the Qinghai–Tibetan Plateau and other areas, revealing the dynamic characteristics of the groundwater level and its influencing factors, and making it clear that surface water and atmospheric precipitation are the primary sources of groundwater recharge, and that fluctuating changes in the groundwater level are mainly affected by the amount of exploitation, followed by factors closely related to temperature and topography. Zhou et al. studied the characteristics of groundwater chemistry in the Huangshui River Basin in Qinghai Province, utilizing water chemistry techniques to identify the controlling factors of groundwater chemistry in the region. The findings of this study demonstrate that a comprehensive understanding of the evolution of groundwater chemistry and its controlling factors is imperative to prevent groundwater deterioration and ensure sustainable groundwater use [31].The study of the Huangshui River Basin, however, has identified a lack of identification of pollution sources from the control of the complete process of the watershed management system framework. This study proposes the identification of pollutants and an emission reduction framework and its application to the Huangshui River Basin, and the use of new pollutant flux changes in the method of calculating different spatial and temporal scales of the pollutant contribution rate. The identification of the main sources of pollutants is fundamental to the development of strategies for the emission reduction of point sources [39]. In order to solve the problem of water use for residential life and industrial development in the watershed, there are also studies on the ecological impact of Huangshui River Basin’s land use, vegetation pattern, and farmland changes [33,40,41].
However, for the whole Huangshui River Basin, groundwater environment research results are still insufficient, especially in the entire basin on the long time series of the groundwater chemical characteristics of the evolution of the law and its causes. The existing studies mainly focus on localized areas, exploring groundwater quality and its influencing factors [42]. Previous studies in the Huangshui River Basin primarily relied on limited data from isolated hydrological units. This fragmented approach contrasts with international studies in similar semi-arid basins, which integrate multidisciplinary methods (isotopes, statistical modeling, and catchment-scale sampling) to reveal systemic groundwater evolution mechanisms [27]. The lack of such comprehensive frameworks in the Huangshui Basin hinders a holistic understanding of its hydrogeochemical dynamics. Existing studies fail to comprehensively reflect the basin’s hydrogeological characteristics and chemical evolution, resulting in a still limited understanding of groundwater changes in the Huangshui River Basin. In addition, the sparseness of monitoring sites and uneven data distribution make it difficult to comprehensively capture the spatial and temporal changes in groundwater chemical characteristics and their interrelationships. Such data gaps limit the practical assessment of changes in groundwater dynamics and affect the basis for scientific management and policy formulation [43,44]. Therefore, integrating existing hydrogeological survey information and monitoring data to construct a comprehensive and systematic groundwater research framework is a technical challenge that needs to be addressed urgently.
This study pioneers a multidisciplinary framework combining high-density spatial sampling (271 sites), advanced geostatistical interpolation (ArcGIS kriging), and quantitative hydrogeochemical modeling (PHREEQC) to decode the basin’s hydrochemical evolution. This approach addresses critical gaps in spatial coverage (entire basin vs. isolated units), process quantification (e.g., mineral saturation indices), and anthropogenic impact differentiation. By integrating experimental data with forward/reverse geochemical modeling, we establish a novel linkage between hydrochemical facies transitions and plateau-specific geological forcing—a paradigm shift from classical Chebotarev sequences observed in other arid basins. To achieve this, we synthesize multi-scale datasets (hydrogeological surveys, long-term meteorological/hydrological monitoring, and census data) across the Huangshui River Basin. Unlike prior fragmented analyses, our systematic integration of field measurements and numerical tools (e.g., hydrochemical diagrams, ion ratios) quantitatively resolves the spatiotemporal controls on groundwater chemical evolution, from water–rock interactions to human-induced perturbations.
2. Materials and Methods
2.1. Study Area
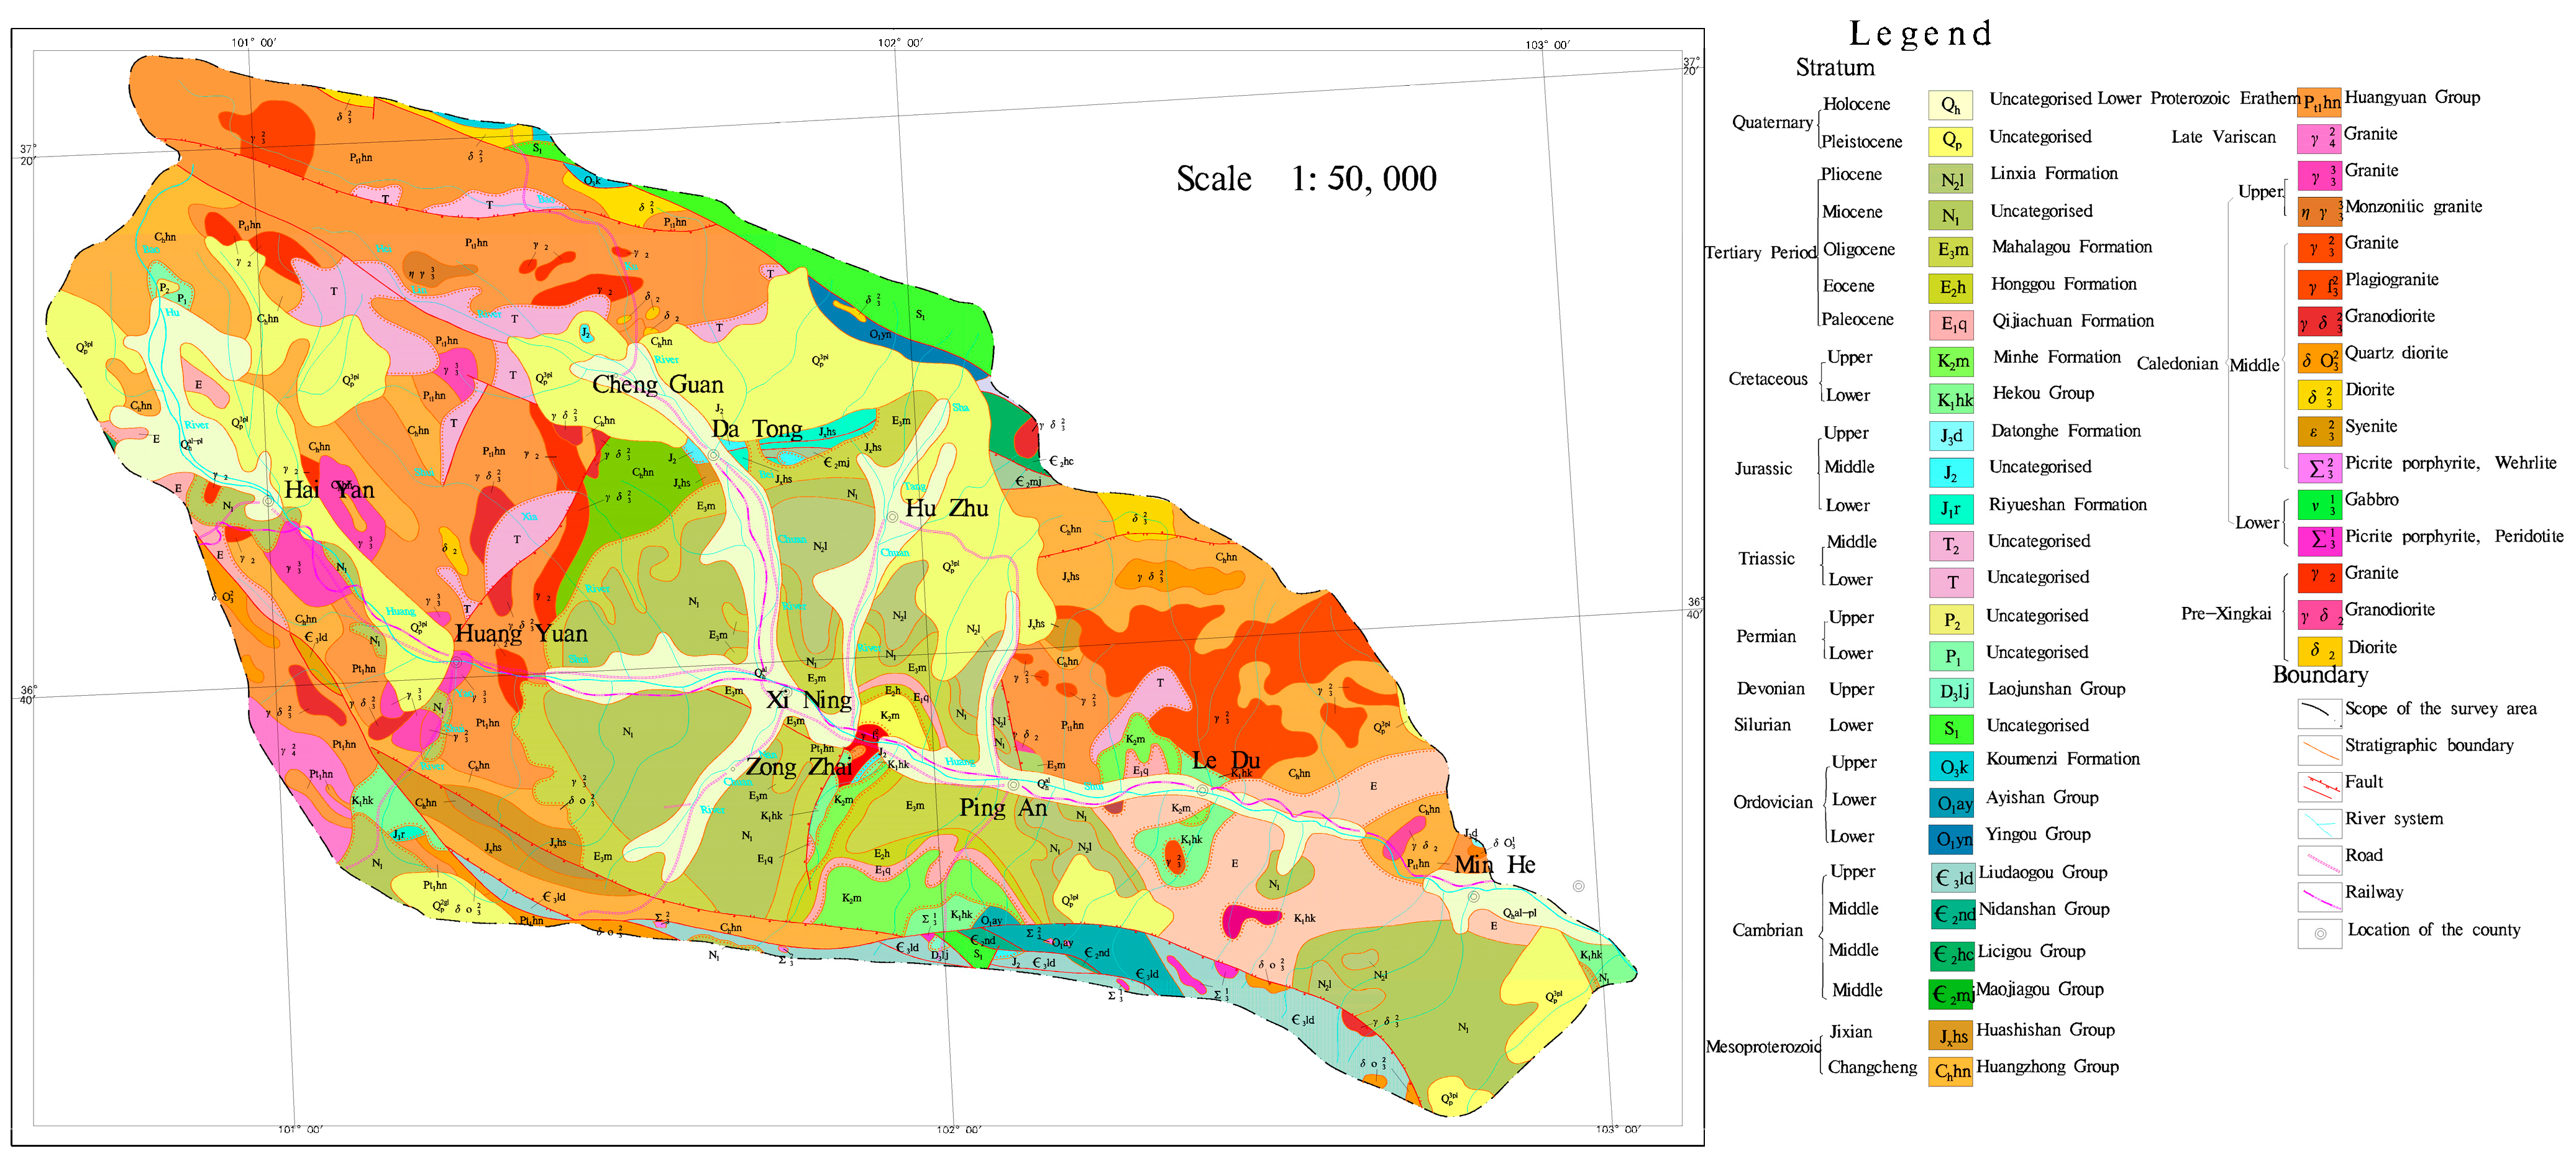
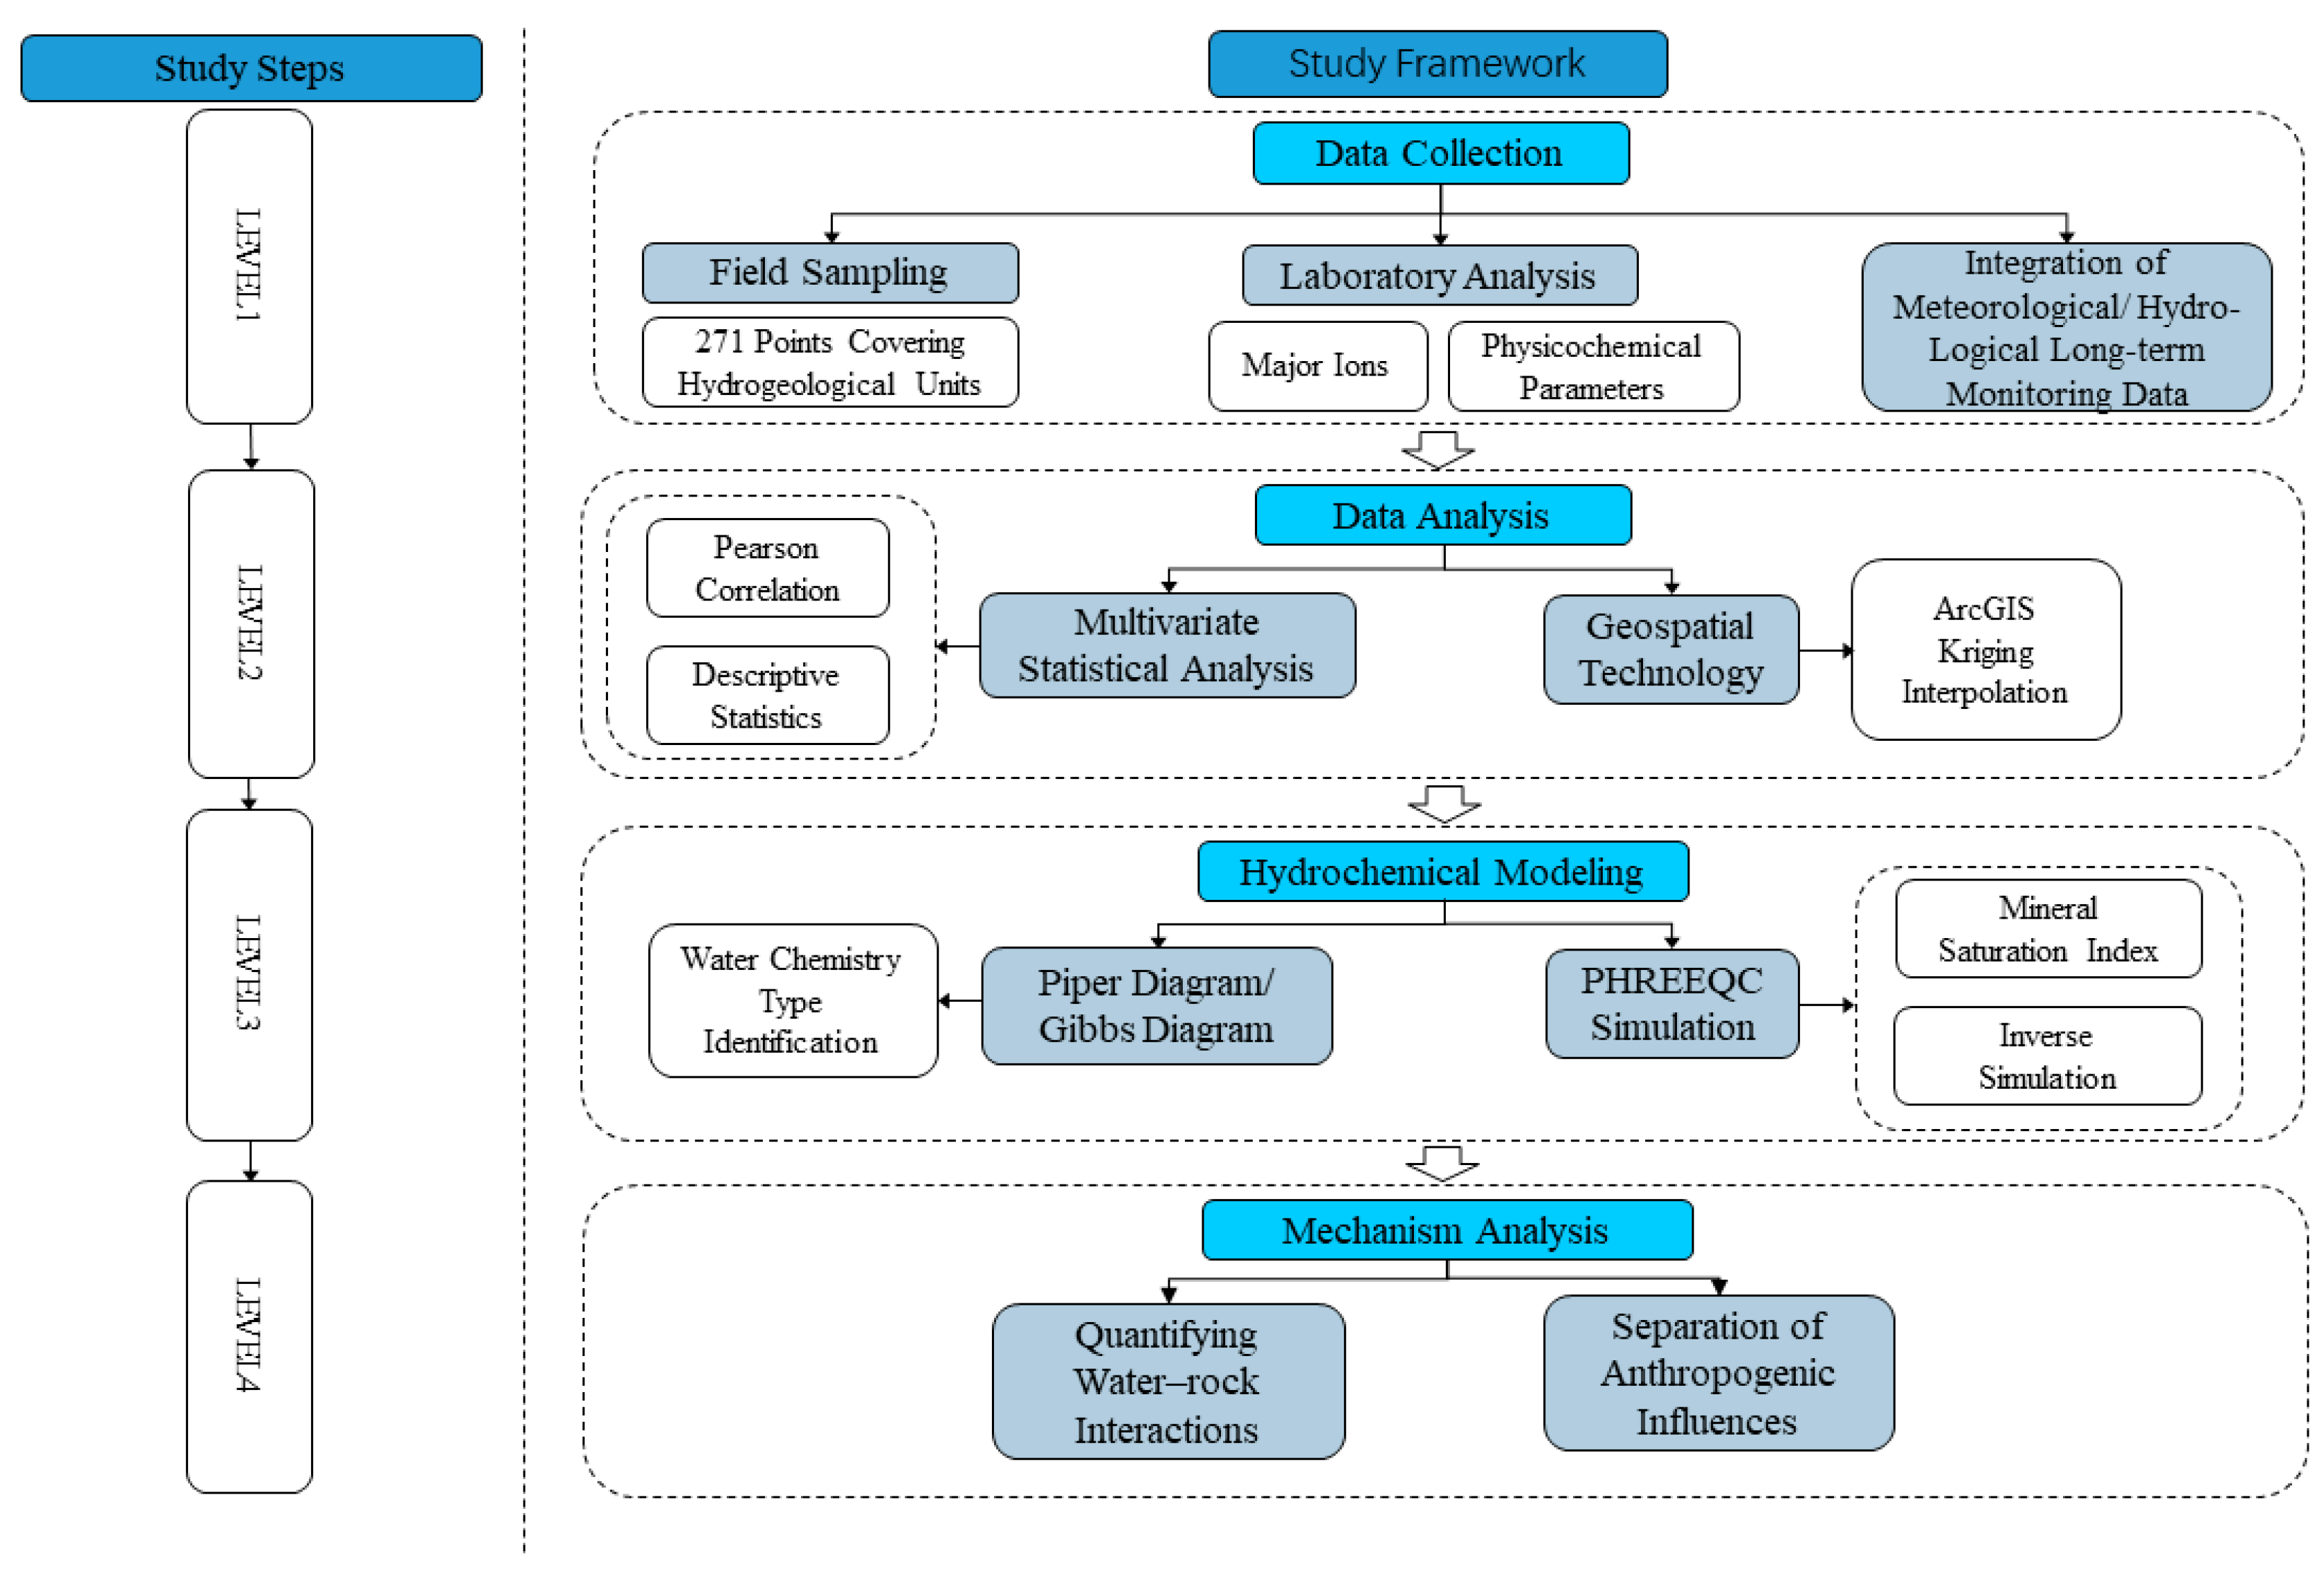
The study area is located in the eastern part of Qinghai Province, China (coordinates: 100°42′ to 103°04′ E, 36°02′ to 37°28′ N). The basin area is about 1.6 × 10⁴ km2. The climate of the Huangshui River Basin belongs to the arid and semi-arid plateau continental climate. The average annual temperature in the basin ranges from −3 °C to 8 °C. The average yearly rainfall is 250 to 350 mm in the main rivers and valleys. The average annual precipitation ranges from 250 to 350 mm in the main streams and valleys and from 500 to 700 mm in the mountainous areas; the average annual evaporation is about 1000 mm in the main streams and valleys and from 800 to 900 mm in the mountainous regions, and the annual evaporation of the whole basin ranges from 1500 to 2200 mm. Huangshui River Basin is located in the Tibetan Plateau and Loess Plateau transition zone. The terrain undulation is more significant, showing the northwest high and southeast low characteristics, a highest elevation of about 4900 m, a lowest elevation of about 1650 m, and a maximum elevation difference of about 3250 m. The main geomorphological types of the basin include glaciers, karst, erosion accumulation, and loess red layer hills. The geological map is shown in Figure 1; the stratigraphy mainly covers the former Quaternary and Paleozoic; the Cenozoic covers a variety of stratigraphy, of which the soluble layer including the small gorges in Ping’an. Huangshui mainstream on both sides of the Paleocene stratigraphy of the upper grey-green gypsum rock is interbedded between calcium manganese and grey-yellow marl. The middle of the grey-green strips of muddy gypsum rock and brownish-red, brick-red mudstone interbedded with the Holocene chemical sedimentary layer is seen in Ping’an County Zhang Jia Zhai Temple Gully Yakusui Beach, Ping’an County, the three towns of Billing Mountain, on Yaozhuang, etc. Huangshui River runoff imainly from precipitation, snowmelt, and groundwater; the average annual flow is about 51 m3/s, the maximum yearly average flow can be about 99 m3/s. The study framework is shown in Figure 2.

Figure 1.
Geological map of the Huangshui River Basin.
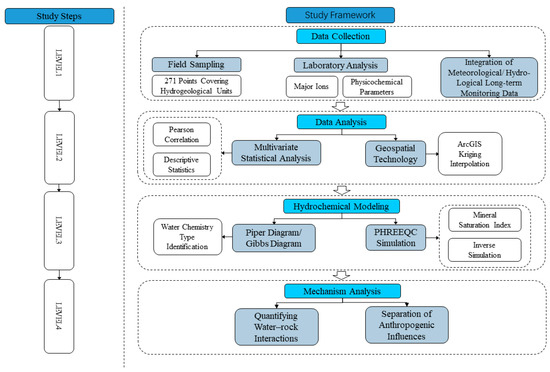
Figure 2.
Study framework.
2.2. Sample Collection and Preparation
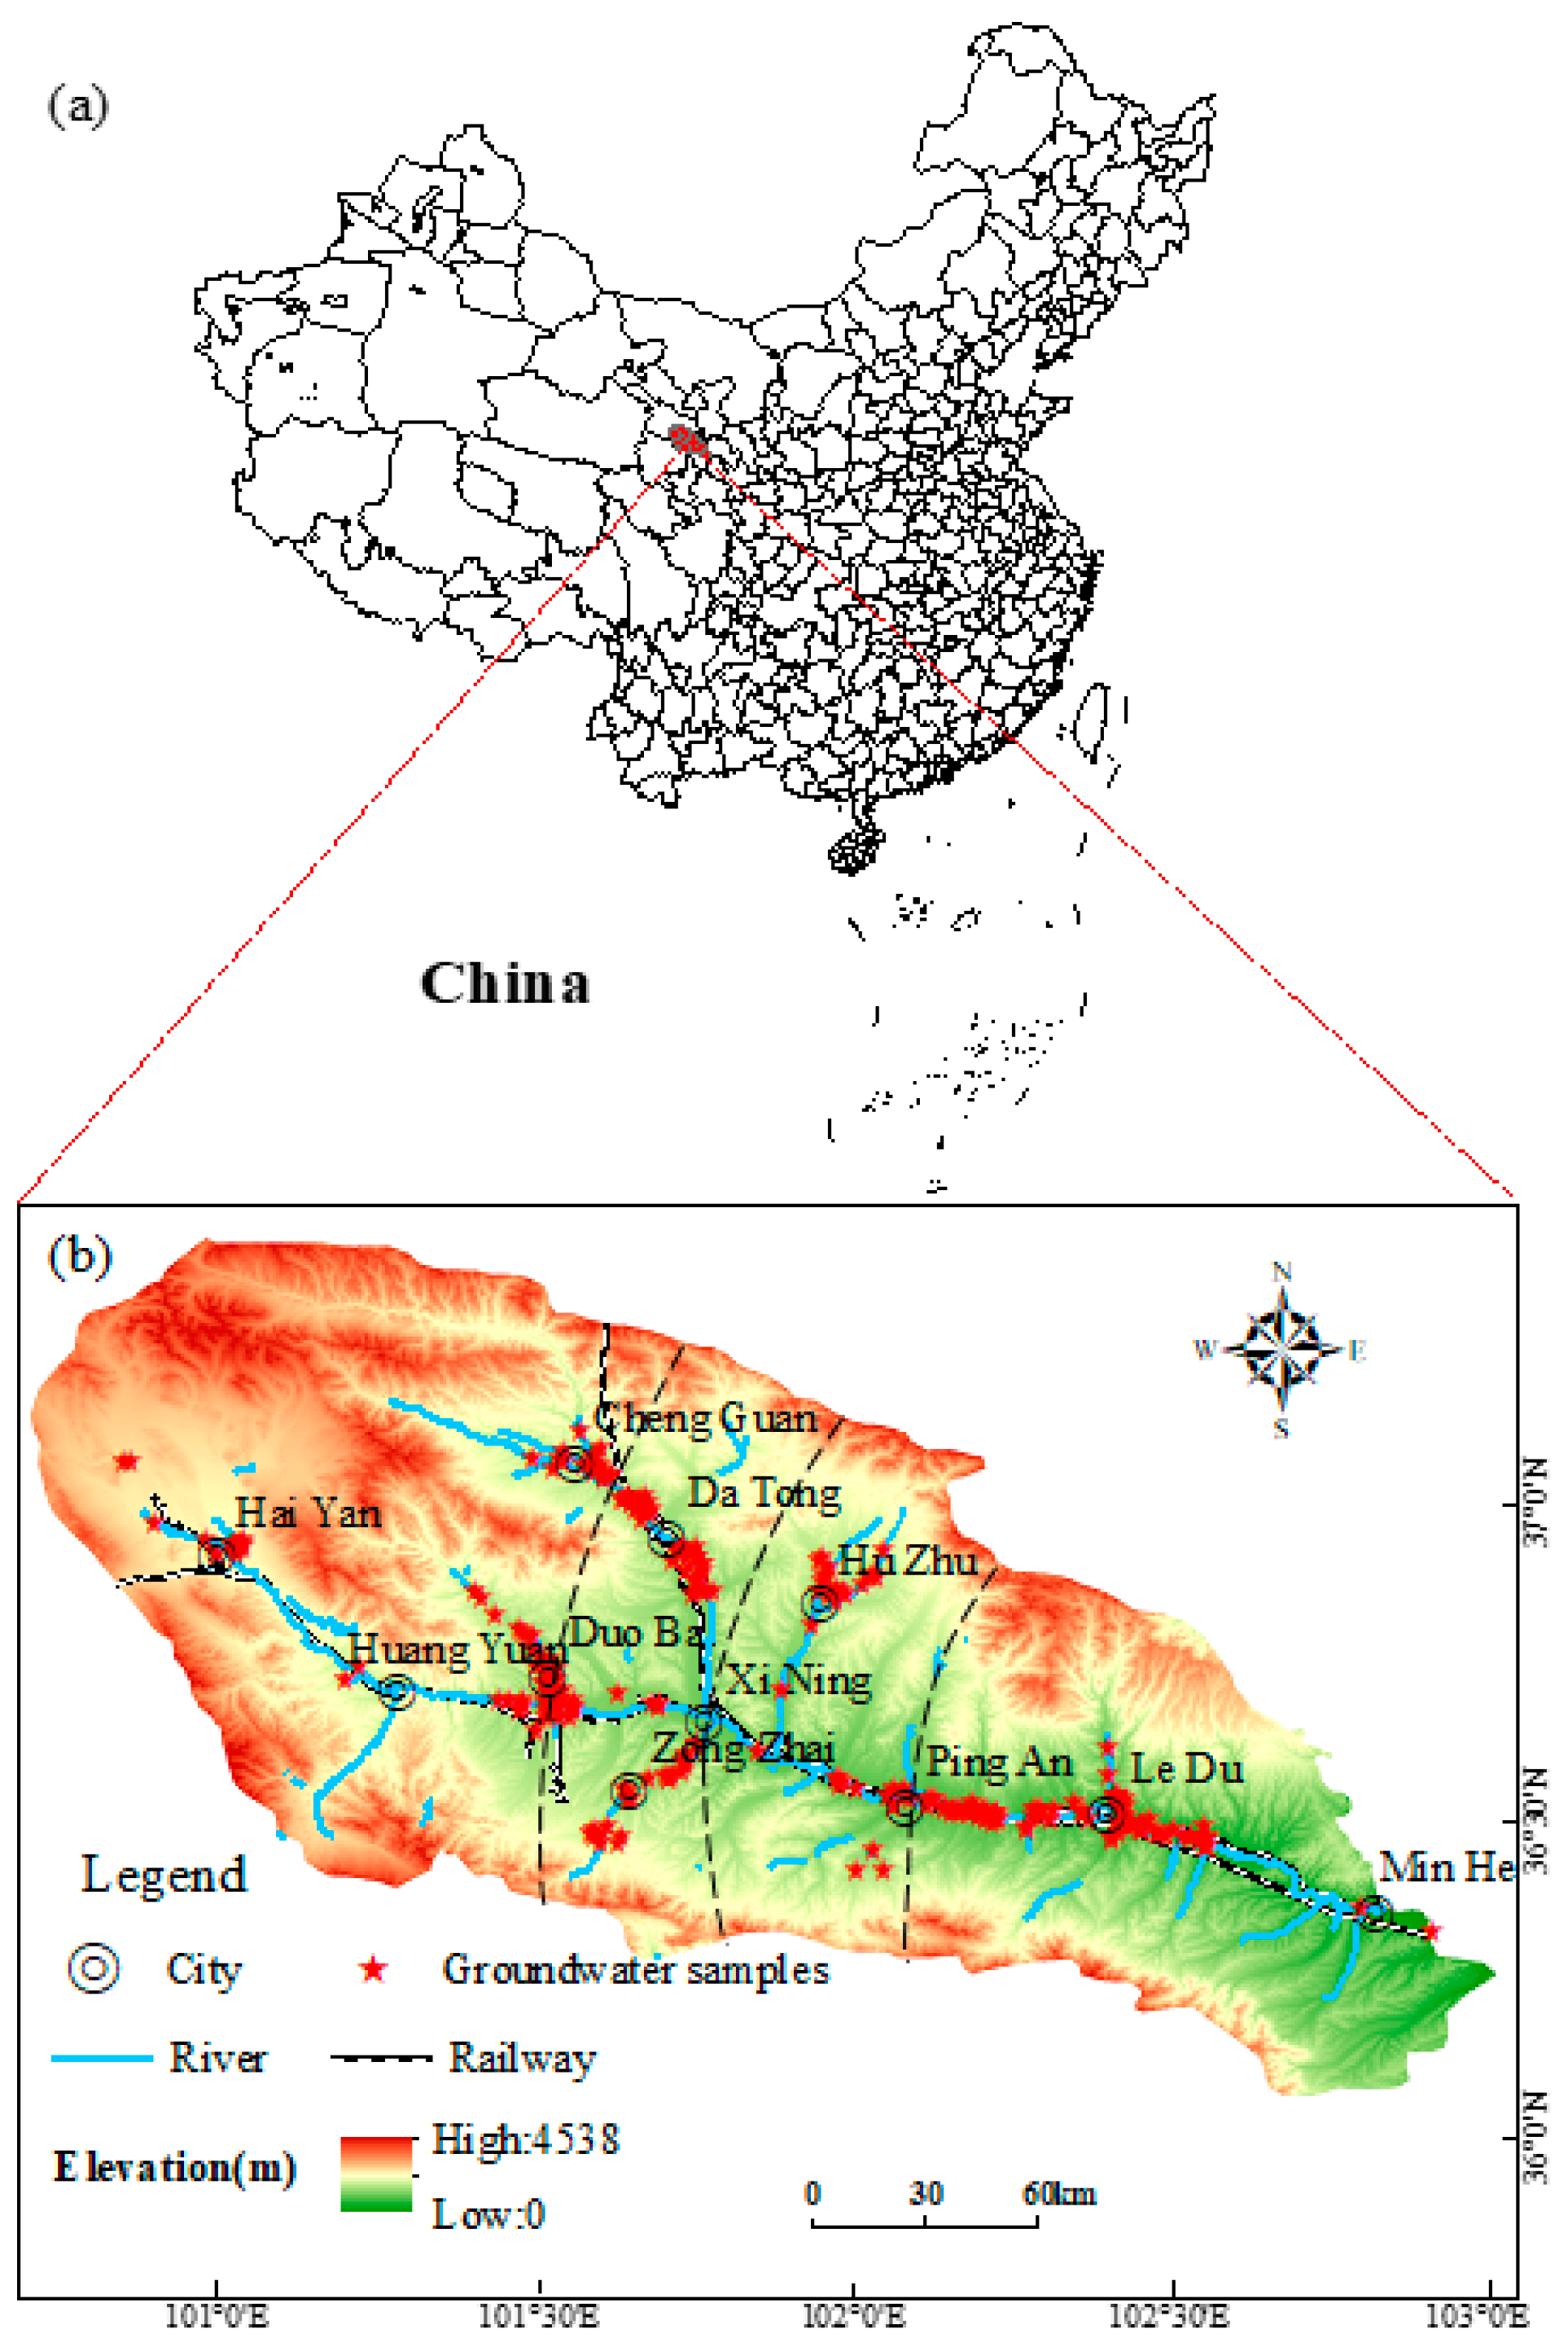
The distribution of sampling sites is shown in Figure 3. A total of 271 groups of groundwater samples were collected. Data were collected on the chemical constituents of the water, including pH, total hardness, total dissolved solids (TDS), fluoride ions (F−), and the seven significant ions common to groundwater, Na++K+, Ca2+, Mg2+, Cl−, SO42−, and HCO3−. The field test program includes depth to the water table, water temperature, pH, and TDS. Groundwater samples and field parameters were collected from two validated sources: 192 automated monitoring stations (127 national/provincial stations operational since 2019–2021) managed by Qinghai Geological Environment Monitoring Center, covering Quaternary phreatic aquifers in key sub-basins with hourly level/temperature data and partial water quality measurements; and 24 civil/industrial wells in Ping’an-Ledu districts (2021–2022), providing monthly manual water-level records and 155 supplemental water samples to address spatial gaps in mid-lower reaches (Section 3.1.2). Field measurements (pH, TDS) used calibrated portable meters, with laboratory-analyzed major ions (Na+, Ca2+, Cl−, SO42−, etc.). Data consistency was ensured by <5% deviation between automated and manual measurements in overlapping zones, while spatial representativeness was confirmed by low interpolation errors (<15%) in TDS/ion distribution maps. The 271 groundwater samples were collected during 2021–2022, covering a full hydrological year to capture seasonal variations in recharge (wet/dry seasons). Ion chemistry results were analyzed primarily using annual averaged concentrations for spatial trend characterization (Figure 3, Figure 4, Figure 5, Figure 6, Figure 7 and Figure 8), supplemented by monthly resolution for wells with continuous monitoring (24 civil/industrial wells in Ping’an-Ledu).

Figure 3.
Map of hydrogeology and sampling sites in the study area: (a) China; (b) Map of Huangshui River Basin.
2.3. Analysis of Water Chemistry Data
This study is based on unified measurement data collected from 271 sampling locations in the Huangshui River Basin, Haidong City, during 2021–2022. The sampling sites were strategically distributed to cover the main hydrogeological units and valley areas of the basin, ensuring spatial representativeness. The uniformity and density of the sampling points were designed according to the following scientific criteria: 1. Hydrogeological Zoning: sampling sites were aligned with the basin’s hydrogeological stratification to capture spatial variability in groundwater chemistry; 2. Spatial Coverage: Kriging interpolation maps showing smooth TDS/ion concentration gradients aligned with flow paths, with no abrupt spatial outliers. Although long-term time series data are ideal for characterizing groundwater evolution, this study prioritized high-resolution, basin-wide spatial coverage (271 samples across heterogeneous hydrogeological units) over multi-year sampling.
Pearson correlation coefficient analyses of the hydrochemical parameters were carried out using SPSS 26.0 statistical analysis software, which measures the linear correlation between two variables and reveals the interrelationships between the components through the correlation matrix to gain a deeper understanding of their hydrogeochemical processes. To effectively classify the groundwater types, this study plotted Piper trilinear diagrams using AqQA 1.5.1.1 software to analyze the hydrochemical types and their distribution characteristics to show the relationship between different hydrochemical types clearly. In addition, this study used Origin2024 software to draw Gibbs plots, mainly by calculating the ratio of sodium to calcium and the ratio of chloride to bicarbonate in water samples, to reveal the chemical genesis of groundwater and its evolution mechanism and to effectively distinguish between the main formation mechanisms of groundwater, including water–rock interaction, evaporation and concentration, and the influence of atmospheric precipitation, to gain a deeper understanding of the chemical characteristics of groundwater and its changes over time. To further explore the genesis of water chemistry, this study also calculated the primary ion ratios and plotted the associated graphs using Origin2024 software. By analyzing the ratios of ions such as sodium, calcium, chloride, and bicarbonate, the types of water chemistry and the mechanisms of change in groundwater can be effectively identified; this study employed an integrated hydrogeochemical simulation approach combining forward modeling (to assess mineral saturation states) and inverse modeling (to quantify water–rock reaction pathways along groundwater flow directions).
3. Results and Discussion
3.1. Chemical Characteristics of Groundwater
3.1.1. Chemical Composition Characteristics of Groundwater
The descriptive statistical details of the chemical constituents of each water sample are shown in Table 1. The pH values of the water samples indicated a slightly alkaline nature, as shown in Table 1, indicating that the water body was generally slightly alkaline. Total dissolved solids (TDS) concentrations ranged from 155 to 10,387 mg/L with a mean of 1225.59 mg/L, showing a regional distribution trend of gradual increase along the direction of groundwater flow. In addition, fluoride ion (F−) concentrations ranged from 0.05 to 3.71 mg/L. The concentration of groundwater anions was ranked as SO42− > HCO3− > Cl−, and the concentration of cations was Na++K+ > Mg2+ > Ca2+. The order of concentration of Na++K+, Mg2+, Cl−, SO42−, F−, and TDS had coefficients of variation greater than 1, indicating significant regional differences in the spatial distribution of these ions with more complex influencing factors. In contrast, the coefficients of variation for Ca2+ and HCO3− were less than 1, indicating a more homogeneous regional distribution with relatively simple drivers. In addition, the coefficient of variation for pH was 0.04, indicating less spatial variability and a more uniform distribution.

Table 1.
Statistics of groundwater hydrochemistry in the study area (mg/L).
To gain a more profound comprehension of the proportional distribution of the major ions in the groundwater of the study area, a pie chart was constructed to illustrate the average percentage of major ions, which is seen in Figure 4. The results indicate that the cations present in the groundwater of the study area are predominantly composed of Ca2+ and Na+ ions, with Na+ accounting for 44.5%, which is slightly higher than the 39.3% contribution of Ca2+ and collectively accounts for 83.8% of the total number of cations. Mg2+ ions exhibit the lowest content, accounting for 16.2%. Anions are dominated by SO42−, accounting for 42%, followed by HCO3−, accounting for 38.6%, and together these account for 80.6% of the total amount of anions; the lowest content is Cl−, accounting for 19.5%. In summary, the influence of the Huangshui River valley area groundwater hydrochemical characteristics of the primary ions for Na+, Ca2+, HCO3−, and SO42− is demonstrated.
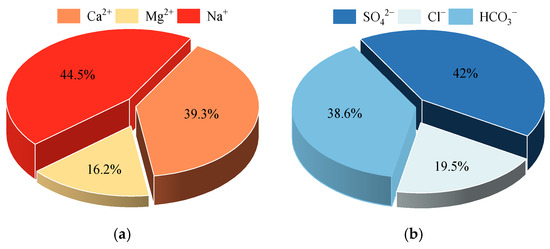
Figure 4.
The proportion of anion and cation content in groundwater in Huangshui River Valley: (a) cation; (b) anions.
Figure 4.
The proportion of anion and cation content in groundwater in Huangshui River Valley: (a) cation; (b) anions.
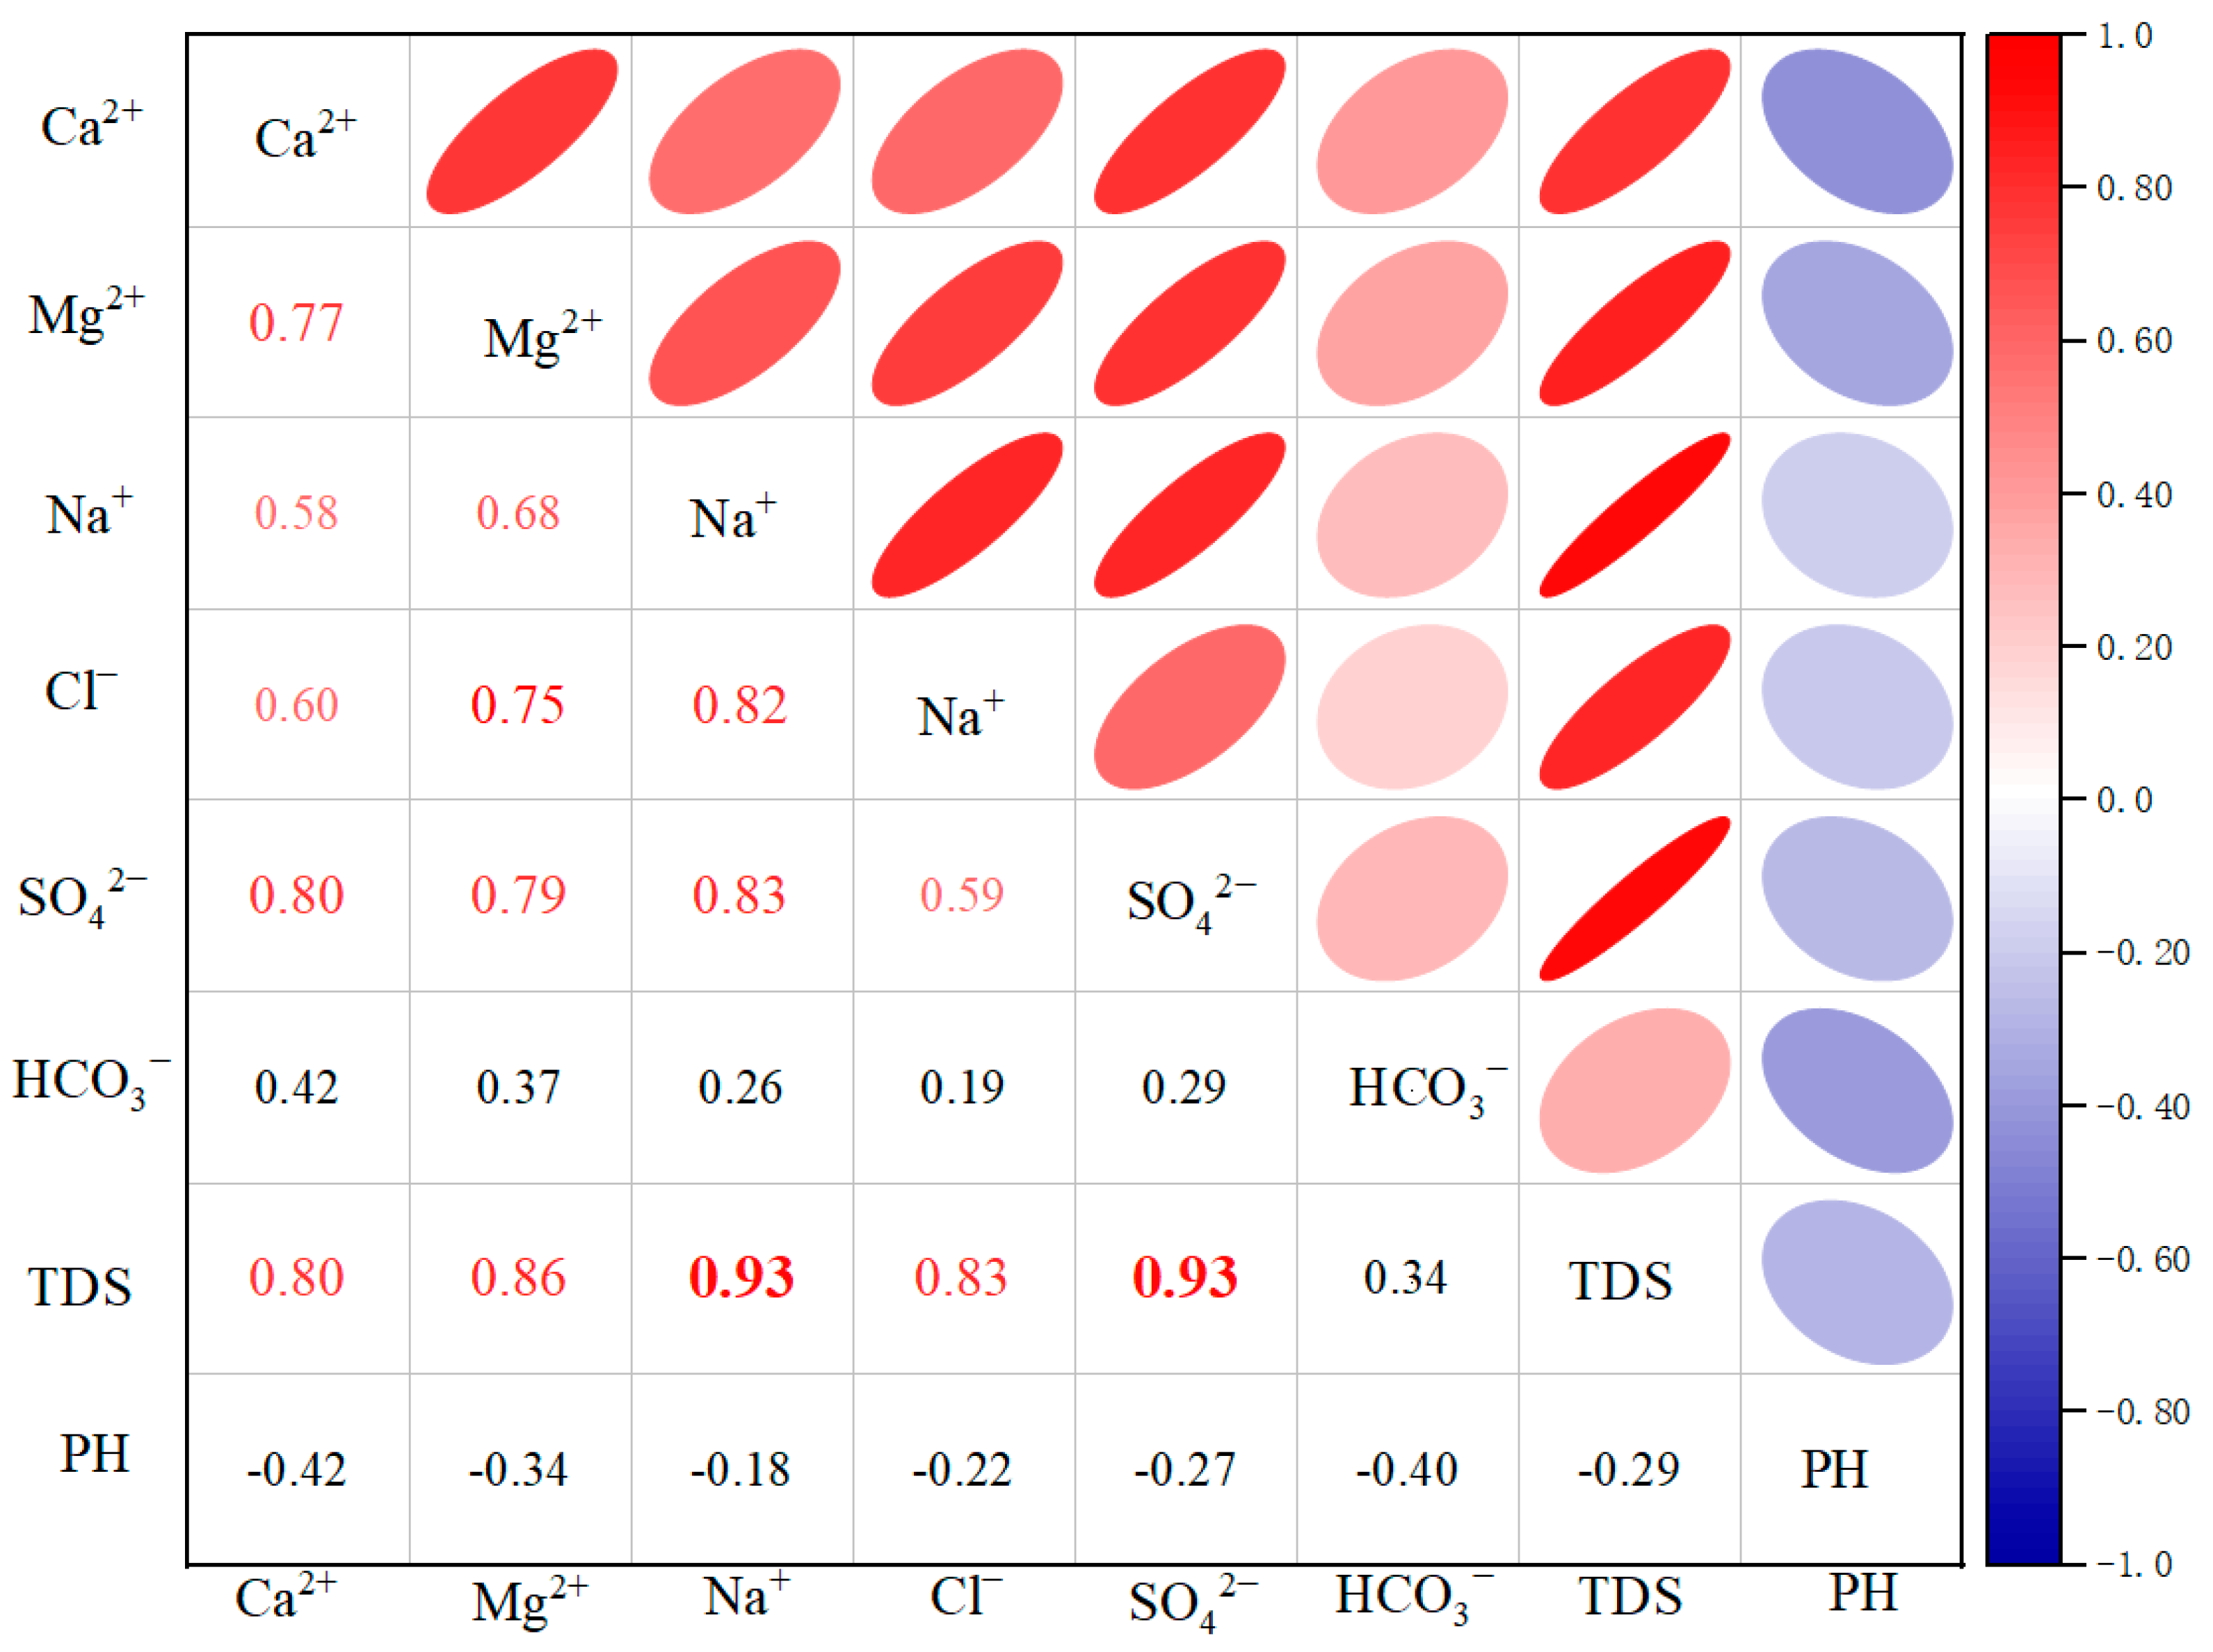
The Pearson correlation coefficient, a more commonly used method in water chemistry studies, is analyzed by the correlation matrix to obtain the association between components [45]. This, in turn, reveals the relationship between elements and hydrogeochemical processes. As demonstrated in Figure 5, the Pearson correlation coefficients of TDS with Ca2+, Mg2+, Na+, Cl−, and SO42− were 0.80, 0.86, 0.93, 0.83, and 0.93, respectively. These findings indicate that these components are the primary factors controlling TDS in the valley area of the Huangshui River Basin. Of particular note are the correlation coefficients of TDS with Na+ and SO42−, which exceeded 0.9, indicating an extremely high degree of correlation. In addition, the correlation coefficients with Ca2+, Mg2+, and Cl− all surpassed 0.8, suggesting a high degree of correlation. Conversely, TDS exhibited the lowest correlation coefficient with HCO3− of 0.34, indicating a comparatively low correlation. In addition, the correlation coefficients of pH with TDS and other components were negative and low. The correlation coefficient of Na+ with Cl− was 0.82, indicating a high degree of similarity, and it was hypothesized that the source of Na+ and Cl− might be the dissolution of halite. The correlation coefficients of Na+ with SO42−, Ca2+, and Ca2+ showed a high correlation. The correlation coefficients of Ca2+ and SO42− and Ca2+ and Mg2+ have been found to be high, which provides indirect evidence that minerals such as manganese, gypsum, and dolomite may have undergone dissolution. The correlation coefficient between Mg2+ and Cl− is 0.75, which primarily reflects the compounding effects of evaporite dissolution and cation exchange [46].
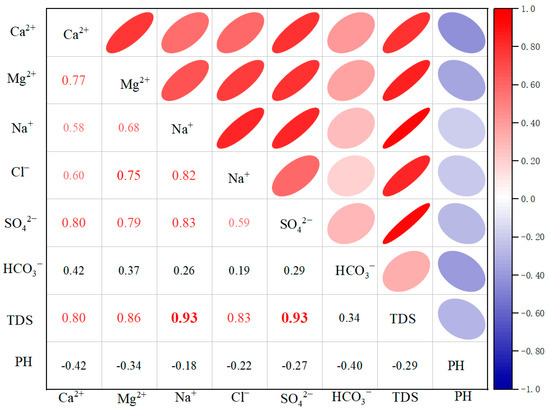
Figure 5.
Pearson correlation coefficient matrix of TDS and primary ions. The color of the circles indicates the direction and strength of the correlation (red for positive, blue for negative, with stronger correlations in darker shades), while the size of the circles represents the absolute value of the correlation coefficient (larger circles signify stronger correlations).
3.1.2. Hydrochemical Types and Spatial Distribution Characteristics of Groundwater
According to the spatial distribution characteristics of the major ions, the valley area of the Huangshui River Basin is divided into four zones from upstream to downstream, which are the upstream section above Duoba, the middle and upstream section from Duoba to Xining, the middle and downstream section from Xining to Ping’an, and the downstream section from Ping’an to Minhe. The rationale for this zoning scheme is as follows: topographic gradient (elevation decreases from >3000 m upstream to <2000 m downstream) and hydrological nodes (three major hydrological cross sections at Doba, Xining, and Ping’an); consideration of the geologic construction control, with Precambrian metamorphic rocks upstream, Tertiary cream-bearing mudstones developing in the mid- and upper-stream transition zones, Quaternary loess dominating the middle and lower-stream, an alluvial drainage area downstream, and the Laji Mountain Fracture Zone serving as a middle–downstream demarcation; hydrochemical data validation shows that each zone is characterized by significant features (85% Ca-HCO3-type in the upstream, a sudden increase in SO42−/HCO3− ratio to 2.3 in the middle and upstream, and an anthropogenic signal of NO3− > 10 mg/L in the middle and downstream. Downstream shows Cl−/Na+ > 1.5 evaporative concentration feature). Comparative analyses of groundwater chemistry in each zone were carried out further to investigate the changes in water chemistry in each region. The distribution of water chemistry types in the Piper trilinear diagrams can help to explain the evolution of groundwater chemistry along the flow paths, as shown in Figure 6, which uses the Piper trilinear diagrams to show the groundwater chemistry characteristics of the different zones in sequence [47].
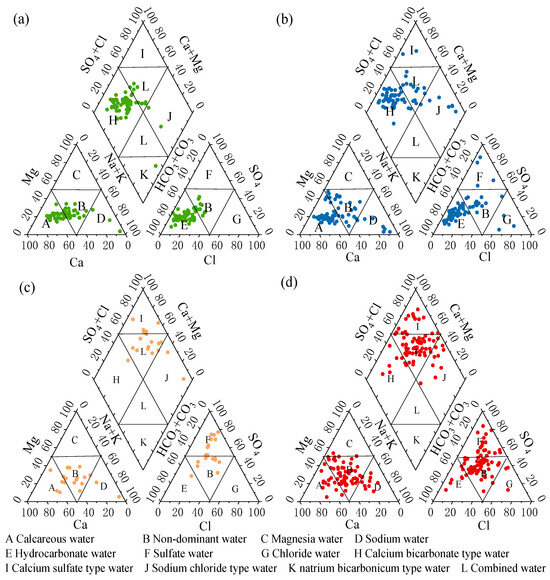
Figure 6.
Piper trilinear diagrams of groundwater in different sections of Huangshui River Basin: (a) above Duoba section; (b) Duoba to Xining section; (c) Xining to Ping’an section; (d) Ping’an to Minhe section.
Figure 6.
Piper trilinear diagrams of groundwater in different sections of Huangshui River Basin: (a) above Duoba section; (b) Duoba to Xining section; (c) Xining to Ping’an section; (d) Ping’an to Minhe section.
As demonstrated in Figure 6a, the upstream section above Duoba was dominated by calcium bicarbonate-type water, indicating a specific hydrochemical characteristic in this region, indicating that calcium bicarbonate-type water is dominant, followed by combined-type water. Of the remaining three monitoring points, two were sodium chloride-type water, and one was sodium bicarbonate-type water. As demonstrated in Figure 6b, the distribution of monitoring points in the Piper diagram for the section from Duoba to Xining exhibits slightly more excellent dispersion than that for the upstream section from Haiyan to Duoba. A gradual transition from bicarbonate-type water to nondominant water was observed, as depicted in Figure 6a. While bicarbonate-type water maintained dominance, the proportion of nondominant and sodium chloride-type water increased. Notably, calcium sulfate-type water samples emerged for the first time. In the section extending from Xining to Ping’an, as illustrated in Figure 6c, the distribution of monitoring points exhibited a further spread. While the majority remained concentrated within the domain of nondominant water, there was a notable increase in the content of intense acid radical ions, such as SO42− and Cl−, compared to weak acid radical ions, such as HCO3−. Furthermore, sodium chloride-type water and calcium sulfate-type water were still present, but calcium bicarbonate-type water had almost disappeared. As illustrated in Figure 6d, a notable increase in the distribution of monitoring points in the area of nondominant water types was observed in the Ping’an to Minhe section, suggesting a more intricate water chemistry, with a gradual transition of the water samples from bicarbonate-type water to sulfate-type water and combined-type water.
The hydrochemical facies evolution in the Huangshui River Basin exhibits distinct transitional patterns that deviate from classical groundwater flow models. Upstream (Haiyan-Duoba), Ca-HCO3 type water dominates, reflecting carbonate weathering in bedrock recharge areas, while sporadic Na-Cl-type samples hint at localized influences. Mid-upstream (Duoba-Xining) shows progressive dispersion toward nondominant facies with emerging Ca-SO4-type waters—a notable departure from standard Chebotarev sequences where sulfate dominance typically occurs farther downstream. This early SO42− enrichment stems from Paleogene gypsum-bearing strata dissolution, accelerated by the arid climate. The mid-downstream (Xining-Ping’an) demonstrates enhanced mixing with SO42−+Cl−, surpassing HCO3−, contrasting with conventional alluvial systems where bicarbonate usually persists longer. Downstream (Ping’an-Minhe) evolves into complex Na-Cl/Ca-SO4 mixtures rather than pure Na-Cl-type waters, attributable to (1) loess-derived cation exchange, and (2) industrial NaCl inputs elevating Cl−/Na+ ratios. Compared to global basinal groundwater trends, this system uniquely combines plateau margin geology with intensive anthropogenic forcing, producing a “stretched” facies sequence where sulfate and chloride phases coexist over extended flow paths.
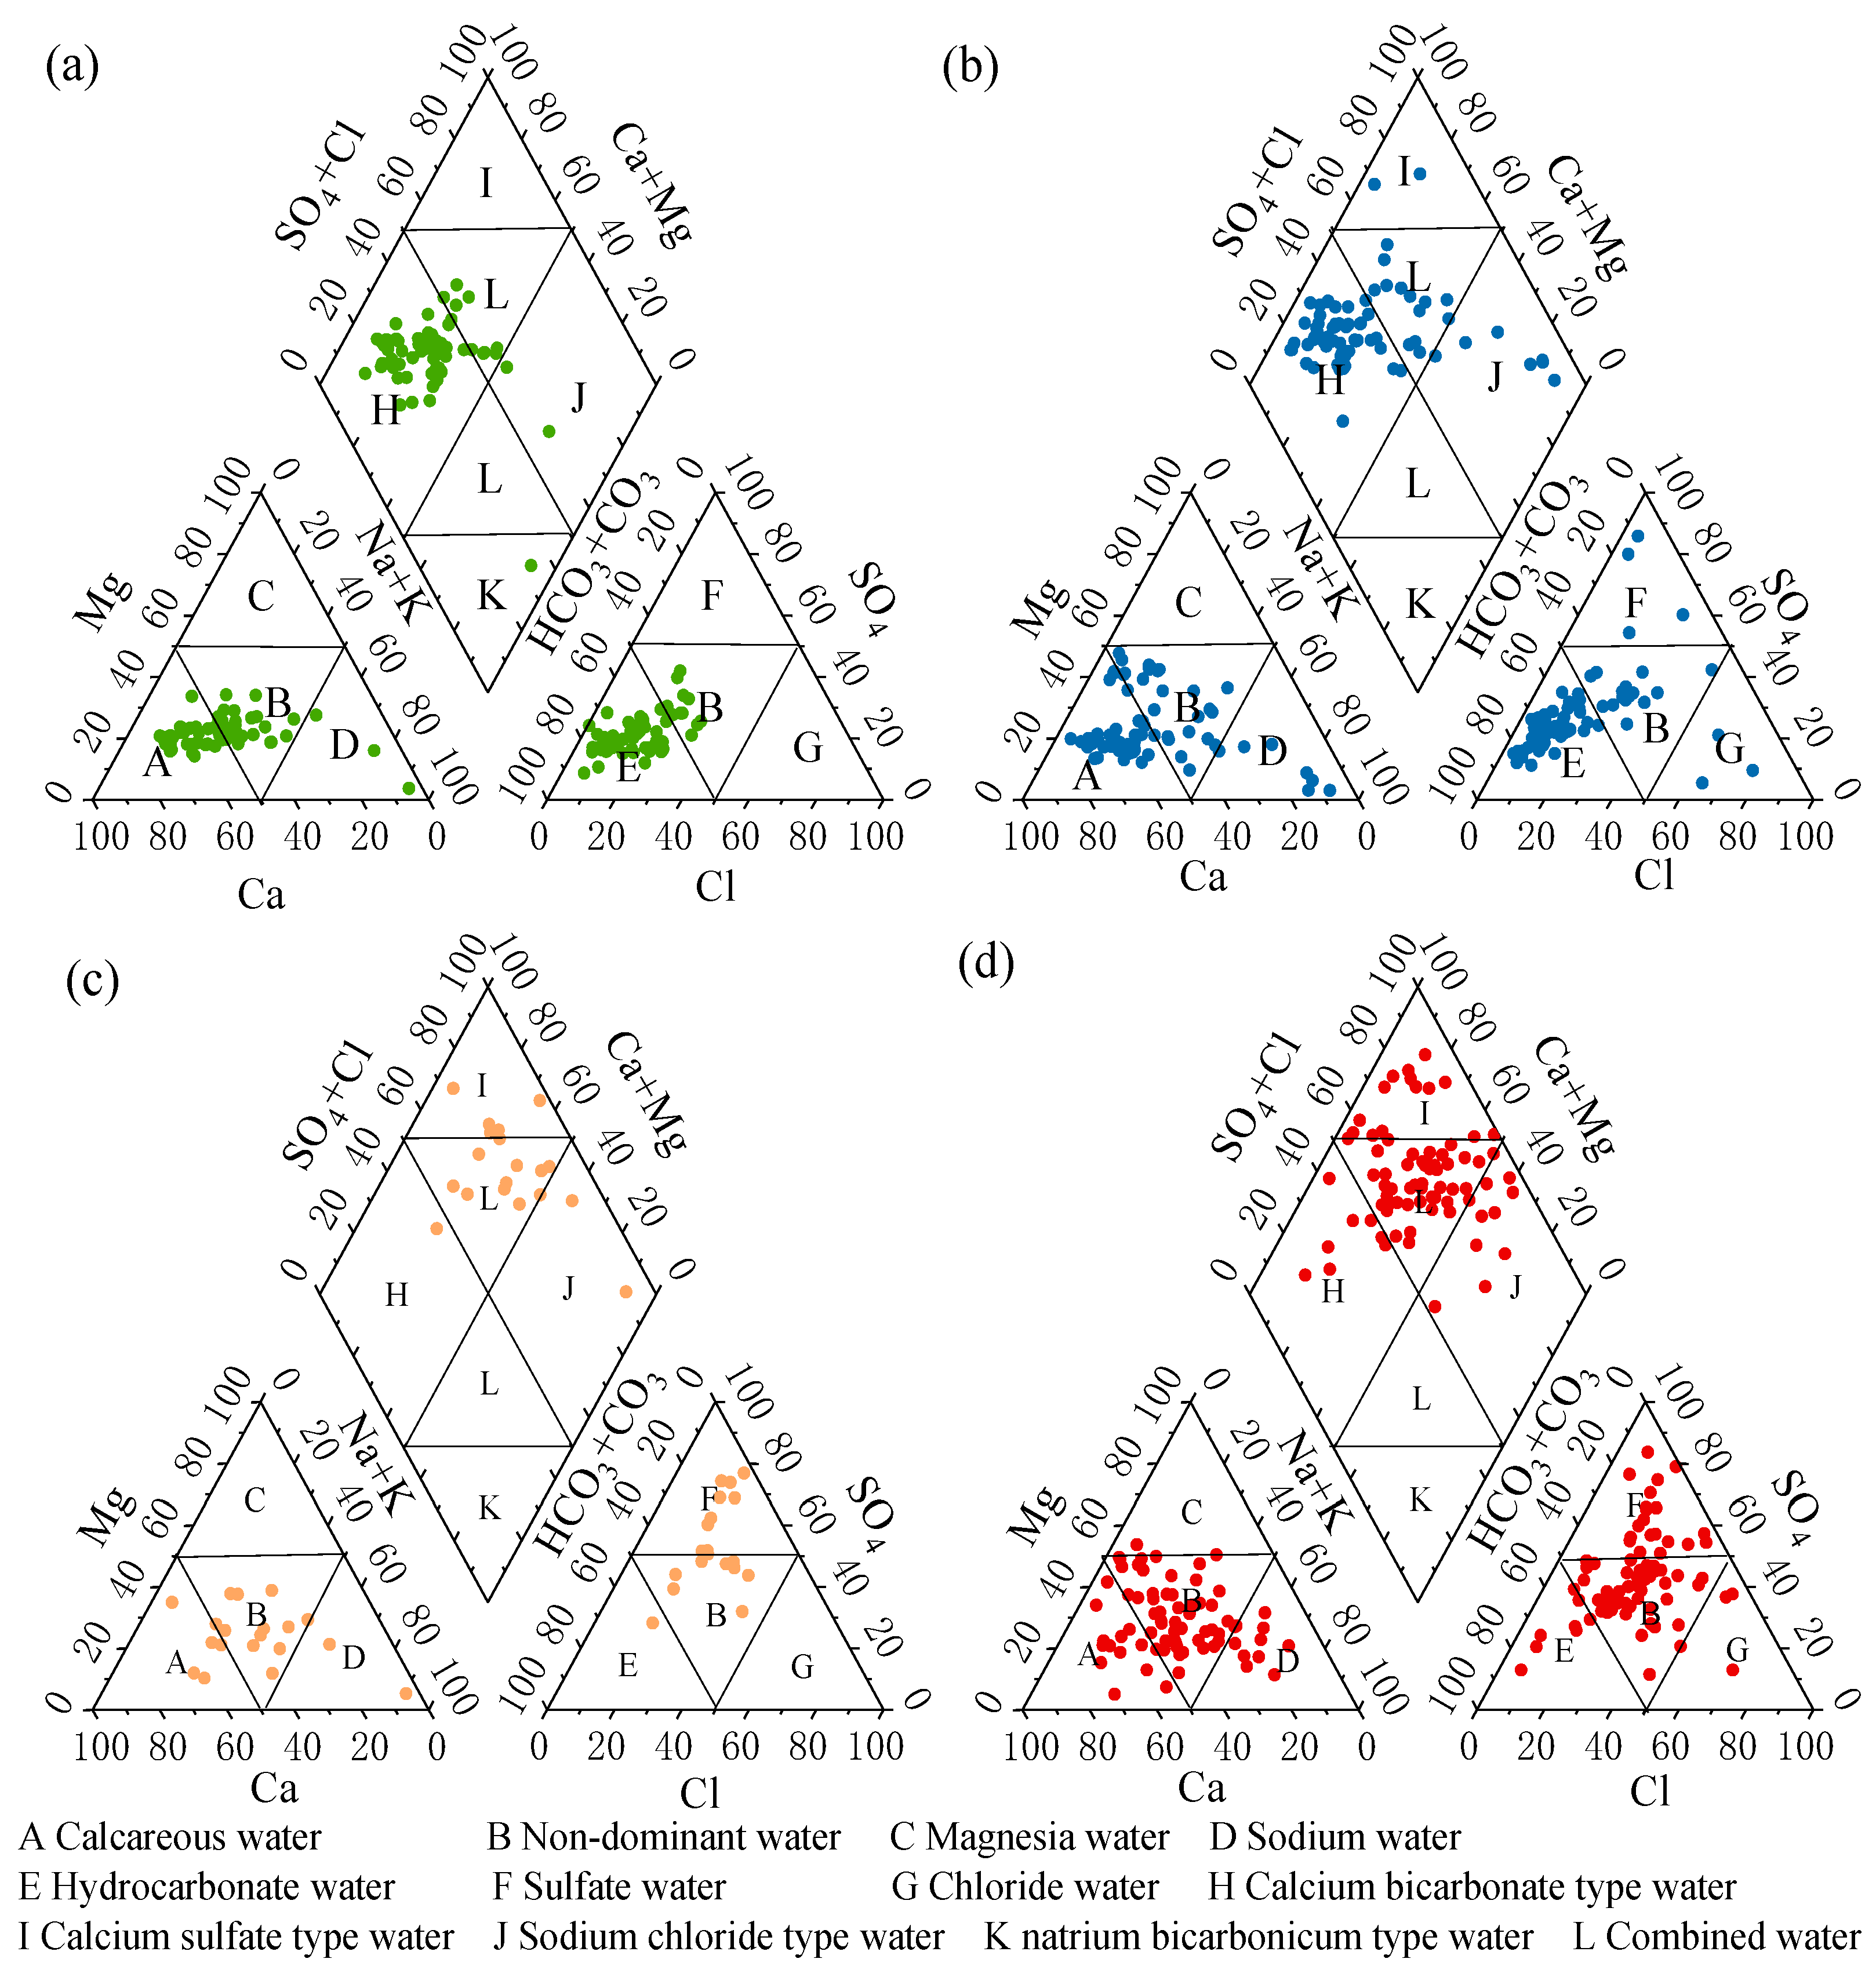
Since the triangular plots of major anions and cations do not deliver any information on the Total Ionic Salinity, it is advisable to inspect the correlation plot of Ca+Mg+HCO3+SO4 vs. Na+K+Cl. In fact, the TIS of water samples can be appreciated in this diagram, by comparing their position with respect to the lines of slope −1 which are iso-TIS lines [48]. Figure 7 shows that the four chemical types previously identified have different TIS values [49].

Figure 7.
Correlation diagram of Ca+Mg+HCO3+SO4 vs. Na+K+Cl for the Huangshui River groundwaters.
Figure 7.
Correlation diagram of Ca+Mg+HCO3+SO4 vs. Na+K+Cl for the Huangshui River groundwaters.
3.2. Spatial Distribution of Groundwater Chemical Composition
This study developed spatial distribution maps of TDS and major anions and cations based on 271 sets of groundwater quality data from January 2022 to December 2022. This study aimed to investigate the spatial distribution characteristics of major ions in groundwater.
3.2.1. Spatial Distribution of TDS
The TDS concentration in the Huangshui River Basin valley area varied significantly, as detailed in Table 1 and Table 2. Generally, it increased along the groundwater flow direction, as shown in Figure 8. Of these samples, 60 percent were freshwater (TDS ≤ 1000 mg/L), 26.9 percent were brackish water (1000 mg/L < TDS ≤ 3000 mg/L), and 6.6 percent were brackish water (TDS > 3000 mg/L). Only 0.4 percent of the sample (a monitoring point) was salt water (TDS > 10,000 mg/L). The Huangshui River Basin valley area exhibited the most extensive distribution of fresh water, while the distribution of brackish and saltwater was comparatively limited.
Table 2.
Statistics of TDS content in the study area.
The spatial distribution of groundwater TDS in the Huangshui River Basin is illustrated in Figure 8. The TDS classification uses a hierarchy: freshwater (≤1000 mg/L), brackish water (1000–3000 mg/L), saline water (3000–10,000 mg/L), and brine (>10,000 mg/L). The standard is based on the USGS system, but the classic brackish water range (1000–10,000 mg/L) is subdivided into two levels to better reflect the stepwise changes in TDS [50]. The analysis indicates that TDS within the basin displays a discernible regional distribution pattern, characterized by an increase in TDS values along the trajectory of groundwater runoff. In the dry flow area of the upstream Haiyan County and Huangyuan County, the groundwater TDS value is generally low, with most of the monitoring points exhibiting TDS levels below 500 mg/L, predominantly in the freshwater category. As one progresses into the middle reaches of the Xining to Ledu section, a gradual rise in groundwater TDS is observed, with levels exceeding 2000 mg/L in the vicinity of Xining City. As the Huangshui River flows towards Ping’an and Ledu, the TDS value rises further, reaching 3000 mg/L in some areas. The TDS value of the Huangshui River Basin is higher than that of the Huangshui River. The TDS values in the Huangshui River Basin are consistently higher than those in the Ledu area. In the Minhe basin, the exit area exhibits a groundwater TDS concentration that exceeds 5000 mg/L. In the tributary areas, TDS also rises gradually from upstream to downstream along the direction of groundwater runoff. Still, the overall concentration remains low, with TDS values below 3000 mg/L recorded at most monitoring points.
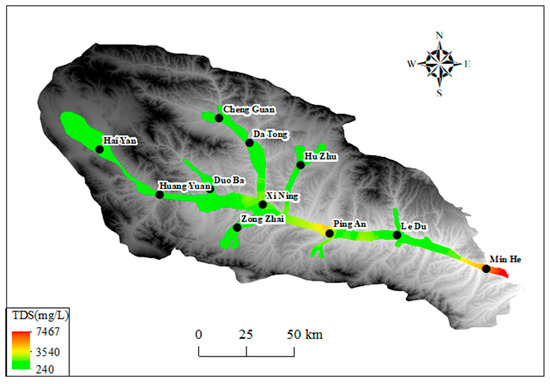
Figure 8.
The spatial distribution of groundwater TDS in Huangshui River Valley.
Figure 8.
The spatial distribution of groundwater TDS in Huangshui River Valley.

3.2.2. Spatial Distribution of Main Ions
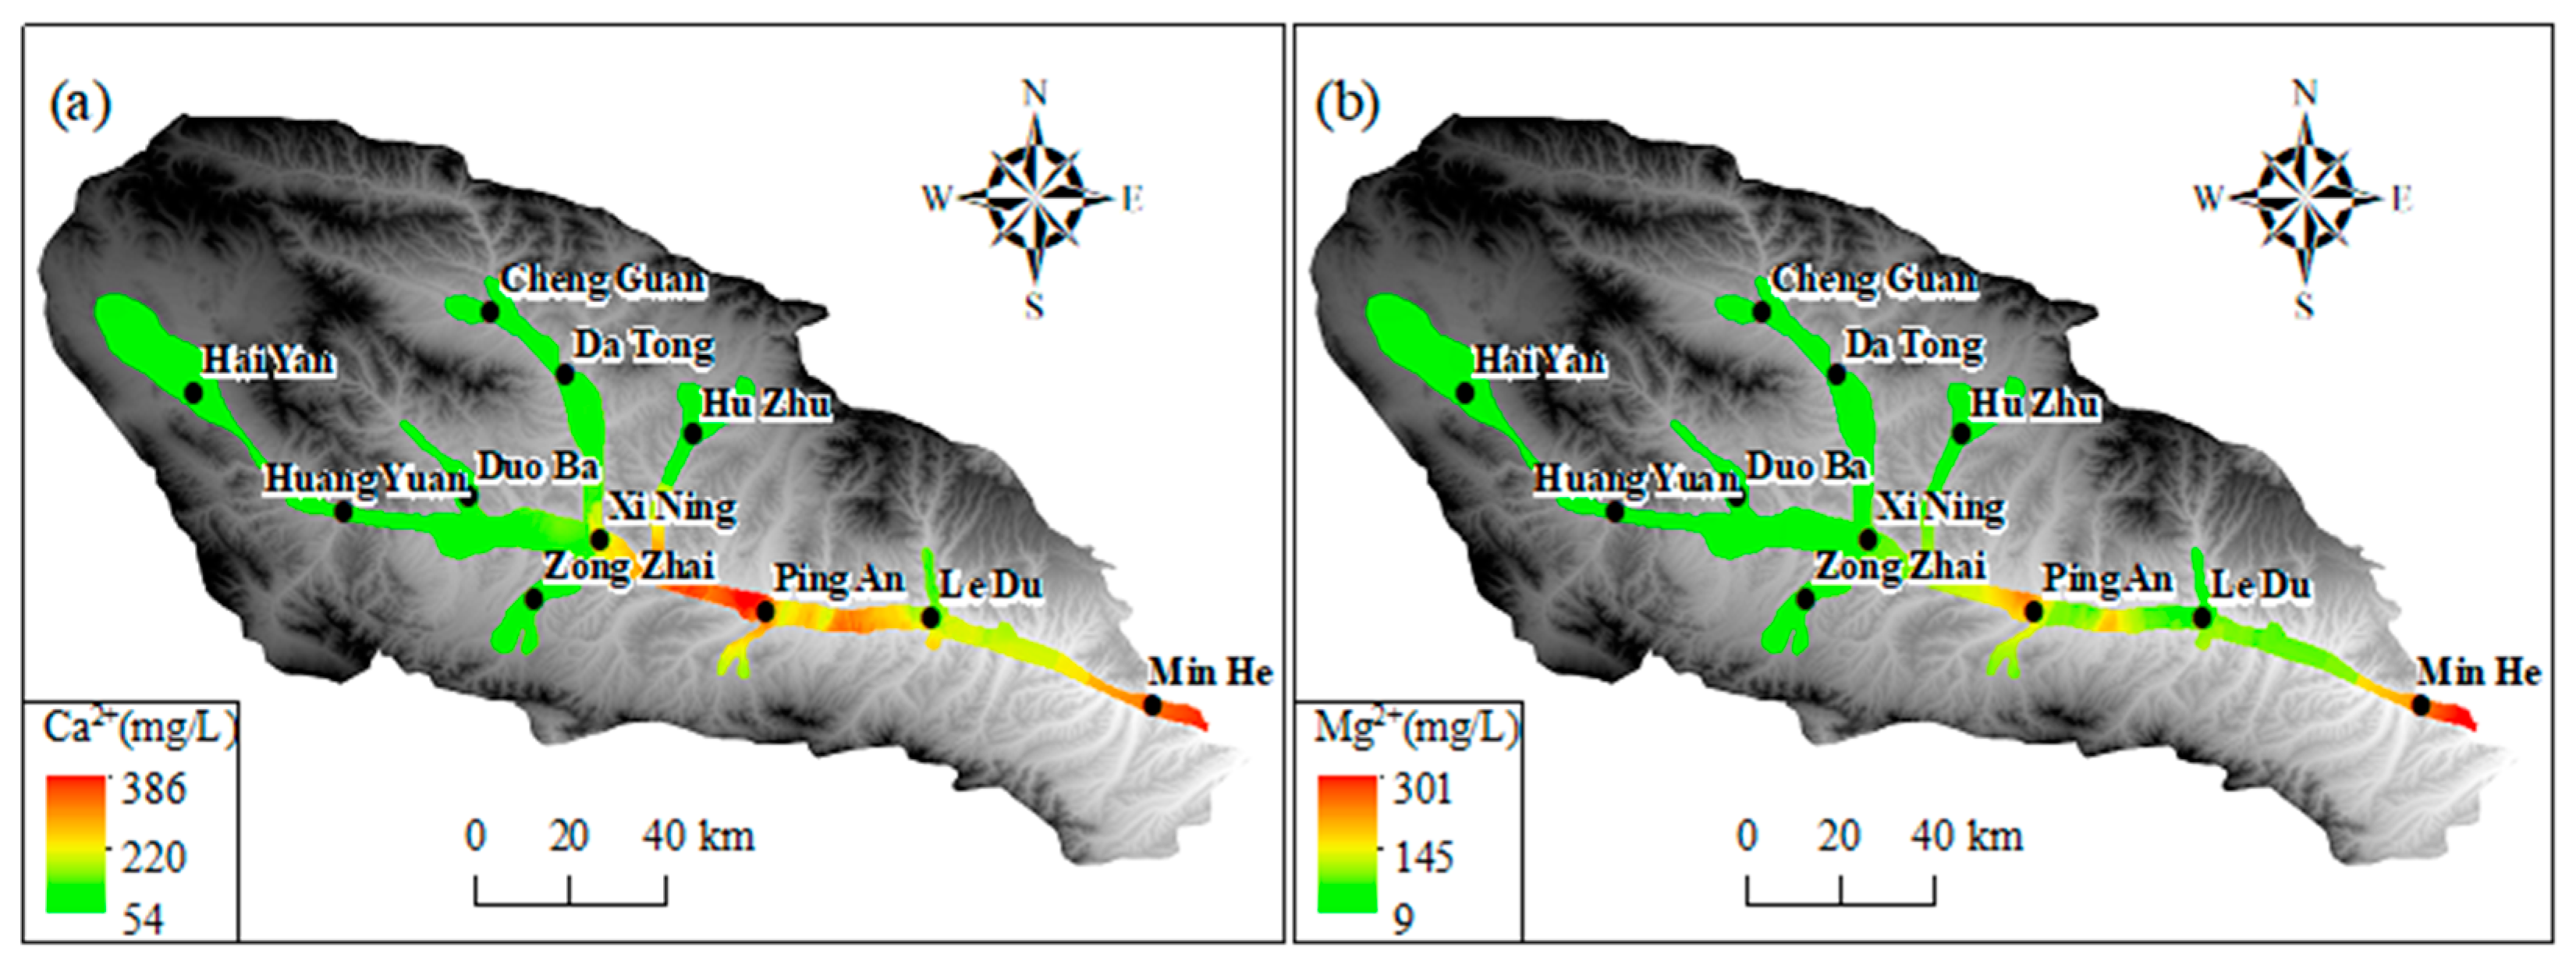
As illustrated in Figure 9a–c, the predominant cations (Na+, Ca2+, and Mg2+) in groundwater exhibited comparatively low levels in the upper and middle reaches of the basin within the Haiyan, Huangyuan, and Xining regions. In the upper and middle reaches of the basin, the concentrations of Mg2+, Na+, and Ca2+ were relatively low, as shown in Figure 9. This was likely due to the influence of local hydrogeological conditions. In the section from Xining to Ledu, the Mg2+ concentration was lower than 120 mg/L, and in the section between Xining and Ledu, the Mg2+ concentration was lower than 120 mg/L. Na+ and Ca2+ concentrations were lower than 120 mg/L. However, in the segment between Xining and Ledu, Mg2+ levels increased to approximately 80 mg/L, while Na+ and Ca2+ concentrations gradually increased to 200 mg/L. Conversely, the concentration of Mg2+ was found to be comparatively low at the basin outlet in Minhe. However, cation concentration was increased, with the average Mg2+ concentration approximating 200 mg/L, Na+ exceeding 700 mg/L, and Ca2+ surpassing 250 mg/L. Furthermore, an elevated average concentration of Ca2+ was observed in the section extending from Xining to Ledu. As illustrated in Figure 9d–f, the regional distribution trends of major anions (SO42−) and (Cl−) in groundwater exhibited comparable variations to those of TDS and significant cations. This pattern is consistent with the Pearson correlation coefficient analysis results, indicating that these components have a high correlation with TDS. The concentrations of SO42− and Cl− in the groundwater in the upper and middle reaches of the basin in the Haiyan, Huangyuan, and Xining areas were less than 150 mg/L and 80 mg/L, respectively. In the section extending from Xining to Ping’an, the SO42− concentration increased significantly, with the average SO42− concentration exceeding 1000 mg/L downstream to the Ledu and Minhe areas. The average SO42− and Cl concentrations in the watershed exceeded 1000 mg/L. The average concentration of SO42− exceeded 1000 mg/L, and that of Cl− exceeded 500 mg/L. Furthermore, the concentrations of HCO3− were found to be generally elevated and subject to spatial variation throughout the basin. The average HCO3− concentration remained at approximately 300 mg/L in the Haiyan, Huangyuan, Xining, Ledu, and Minhe regions. Concentrations of both NaHCO3 and NaCl were found to be approximately 300 mg/L.
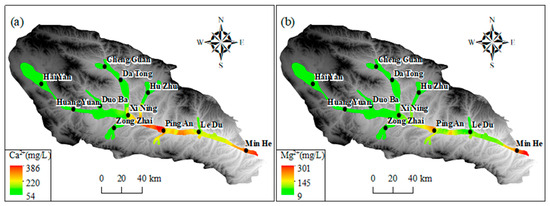
Figure 9.
The spatial distribution of primary ions in groundwater in Huangshui River Valley: (a) Ca2+; (b) Mg2+; (c) Na+; (d) Cl−; (e) SO42−; (f) HCO3−.
The spatial distribution of major ions in groundwater shows distinct trends. In the upper and middle reaches of the basin (Haiyan, Huangyuan, and Xining regions), the concentrations of predominant cations (Na+, Ca2+, and Mg2+) are relatively low. This is mainly because the upstream area is dominated by bedrock mountains, where groundwater is mainly recharged by precipitation and snowmelt. The water–rock interaction time is short due to the relatively fast water flow velocity, resulting in less mineral dissolution. As it progresses to the section from Xining to Ledu, the concentrations of Mg2+, Na+, and Ca2+ increase. This is attributed to the slowdown of water flow velocity, which prolongs the contact time between groundwater and surrounding rocks, enhancing water–rock interactions. Additionally, the dissolution of minerals containing these cations, such as gypsum, calcite, and dolomite, contributes to the increase in cation concentrations. At the basin outlet in Minhe, the Mg2+ concentration is relatively low, while the overall cation concentration is high. This might be influenced by human activities like agricultural irrigation and industrial wastewater discharge, as well as the dissolution of specific minerals in the local geological structure. For major anions (SO42− and Cl−), their concentrations are low in the upper and middle reaches. In the section from Xining to Ping’an, the SO42− concentration rises significantly. This is mainly due to the dissolution of sulfate minerals like gypsum in the strata. The increase in Cl− concentration may also be related to human activities. The HCO3− concentration is generally high and spatially variable across the basin, mainly originating from the dissolution of carbonate rocks. The consistent and widespread distribution of carbonate rocks leads to a relatively stable HCO3− concentration. These ion concentration changes are closely related to the behavior of the alluvial aquifer. The change in hydrodynamic conditions, from fast-flowing in the upstream to slow-flowing in the downstream, affects the water–rock interaction time and intensity. The differences in aquifer material composition in different regions, with more mineral-rich deposits in the middle and lower reaches, also contribute to the ion concentration variations. Moreover, cation exchange and adsorption processes in the alluvial aquifer play a role. In the middle and lower reaches, the slow-down of water flow enhances these processes. For example, Ca2+ and Mg2+ may be adsorbed by clay minerals, while Na+ is released, affecting the concentration ratios of these cations.
3.3. Analysis of the Causes of Groundwater Hydrochemical Types
3.3.1. Groundwater Chemical Control Mechanism
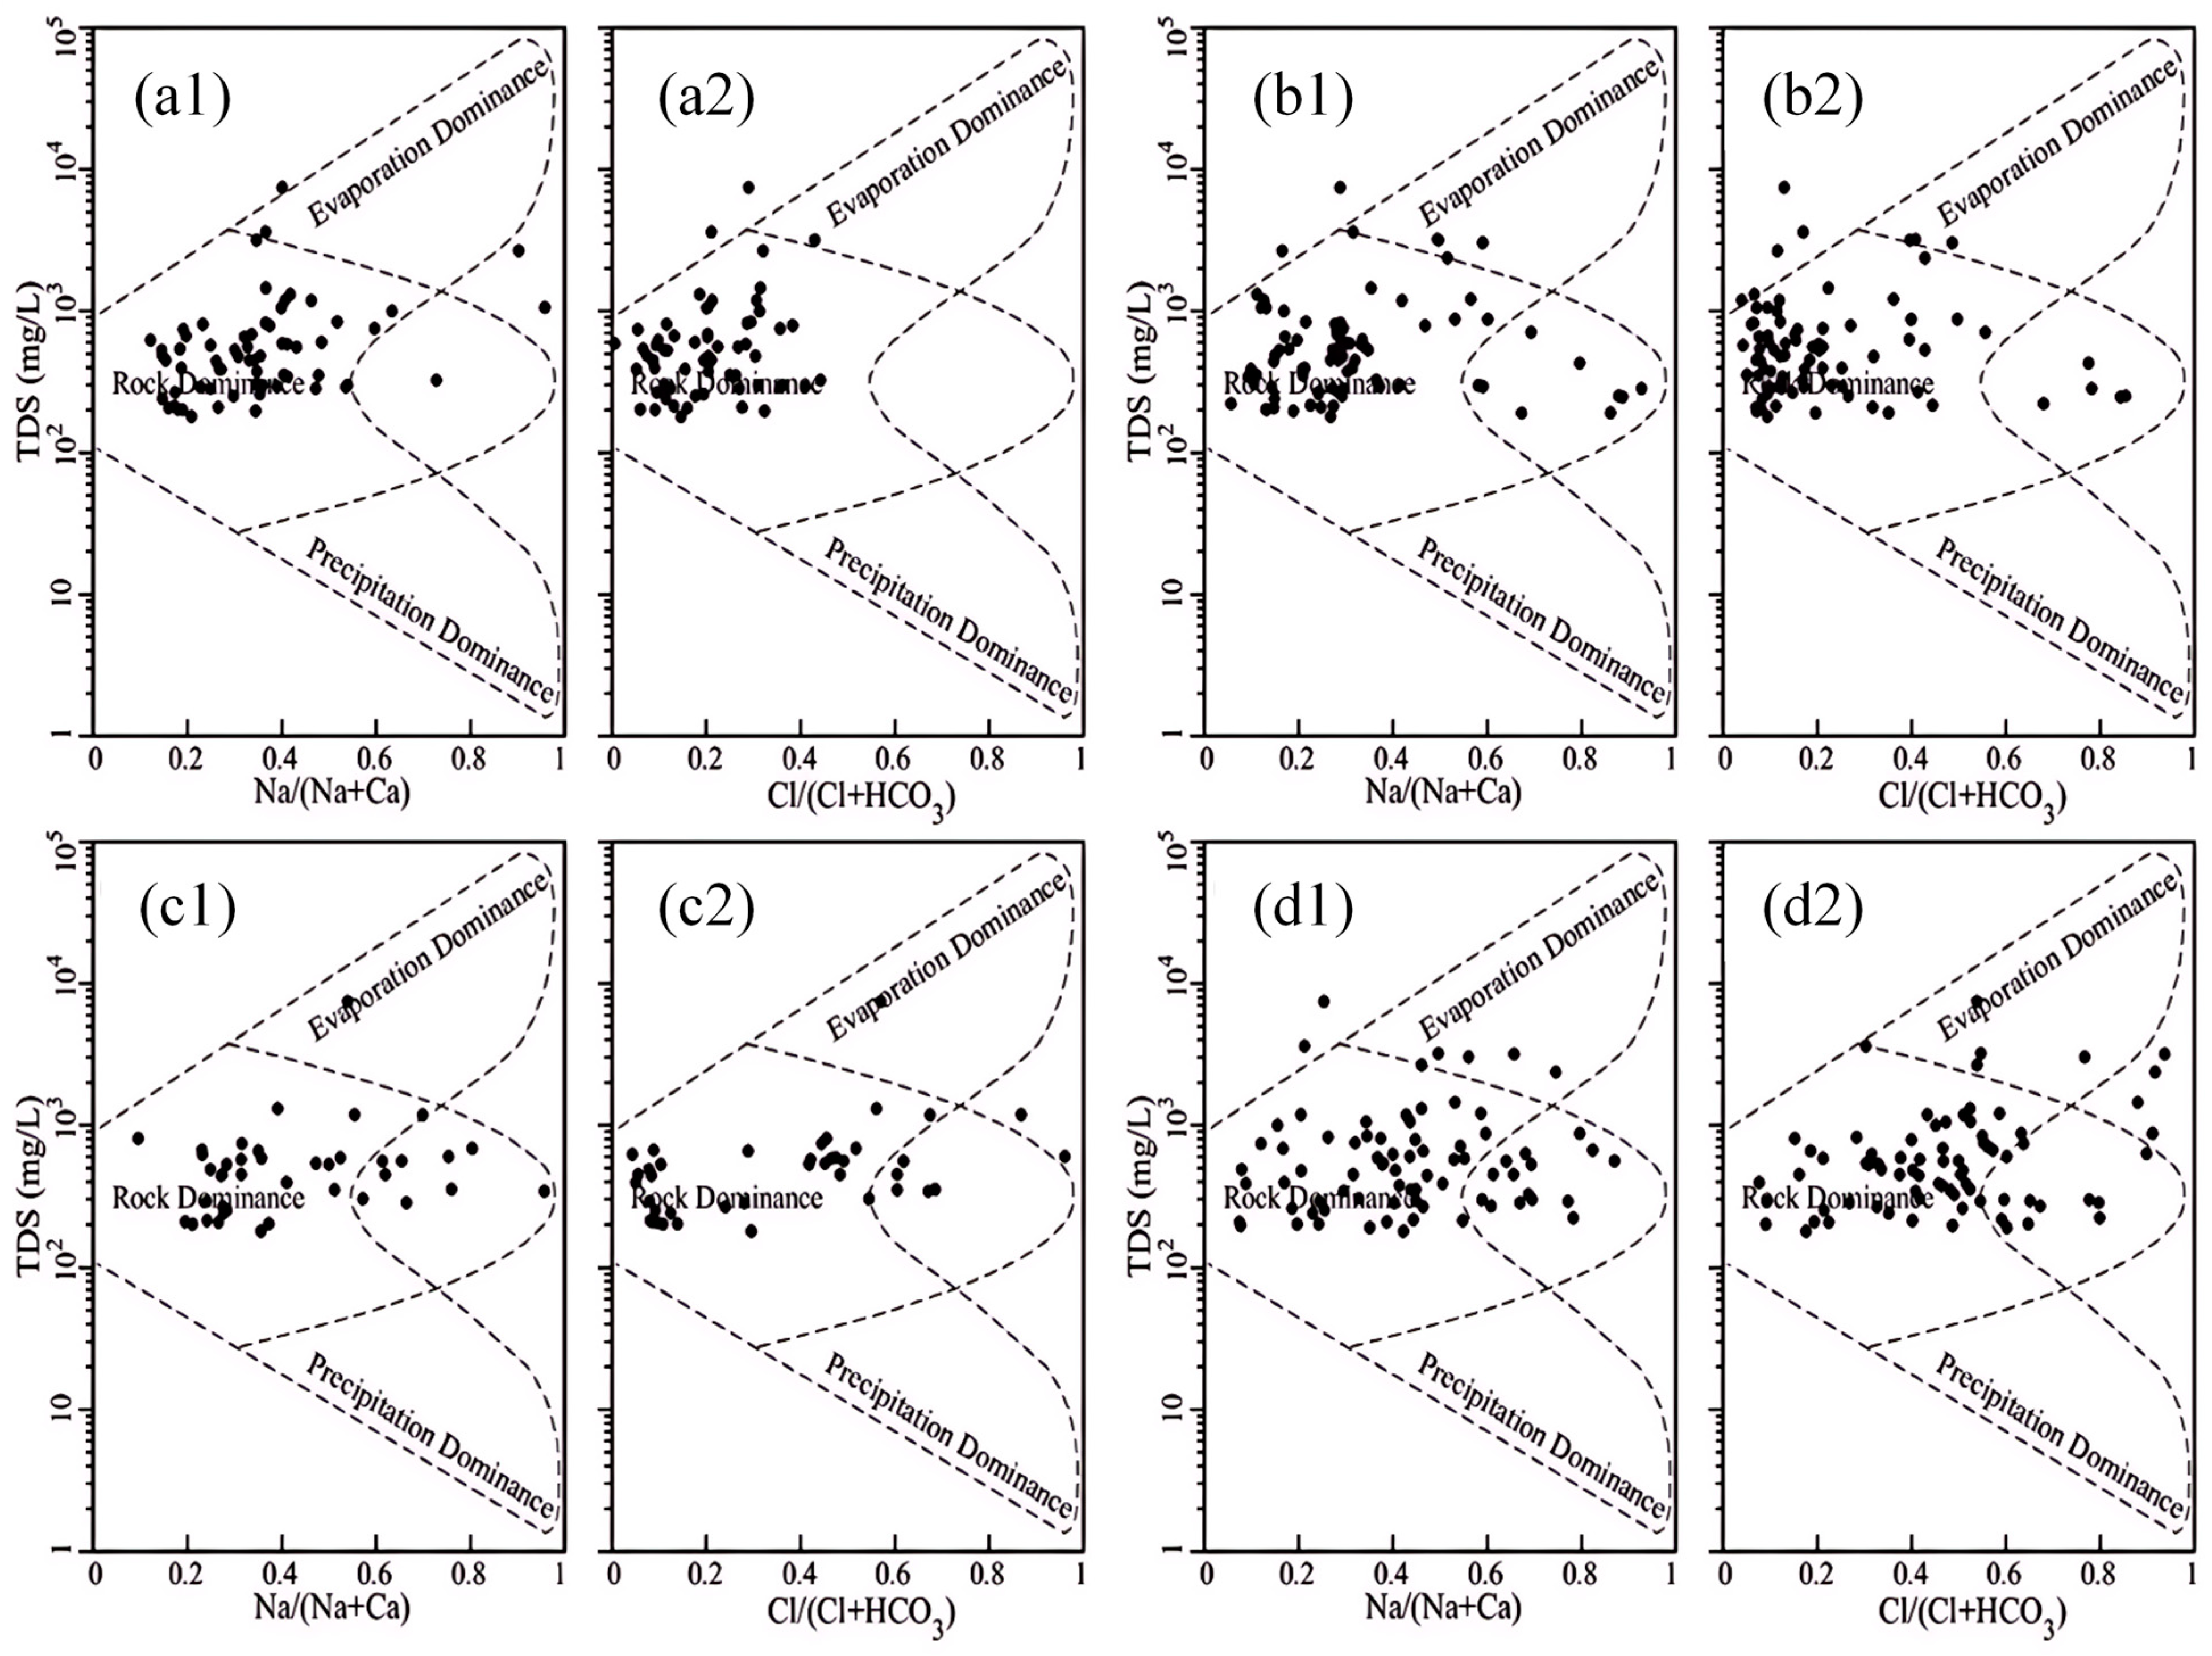
Gibbs diagrams have been utilized to elucidate the mechanism of the genesis of water chemistry components. The Gibbs diagram method is predicated on the qualitative determination of groundwater formation mechanisms by plotting the ratio of TDS versus Na+/(Na++Ca2+) and Cl−/(Cl−+HCO3−) [51]. The Gibbs plot provides a quantitative framework for interpreting the dominant process in a given monitoring point. Specifically, if the point falls within the upper right dashed line, evaporative concentration is the dominant process; if it falls within the middle dashed line, hydrological action is the dominant process; and if it falls within the lower right dashed line, atmospheric precipitation is the dominant process.
As demonstrated in Figure 10, the Na+/(Na++Ca2+) and Cl−/(Cl−+HCO3−) ratios in the Huangshui River Basin valley area, presented in Table 3, indicated that the groundwater chemical formation mechanism was mainly affected by water–rock interactions; TDS values were mainly concentrated in the range of 102 to 103 mg/L, and the TDS values of a few monitoring points exceeded 103 mg/L. The groundwater monitoring points in the four sub-areas were primarily located in the middle control zone of the Gibbs diagram, indicating that the chemical formation mechanism of groundwater in the valley area of the Huangshui River Basin is primarily affected by water–rock interactions. The Na+/(Na++Ca2+) values demonstrate an upward trend from upstream to downstream, as evidenced by Table 3, which shows that its mean values in the upstream section above Duoba, the middle and upstream section from Duoba to Xining, the middle and downstream section from Xining to Ping’an, and the downstream section from Ping’an to Minhe are 0.38, 0.35, 0.45, and 0.46, respectively, all showing an increasing trend, indicating a relative increase in Na+ concentration along the direction of groundwater runoff. However, the increase in TDS values was not significant, suggesting the presence of cation exchange along with water–rock interactions in the groundwater in the middle and lower reaches. Cations’ adsorption capacity depends on their valence number, with higher values indicating more substantial adsorption capacity. This suggests that Ca2+ has a greater adsorption capacity than Na+ and that cation exchange contributes to the observed trends. An increase in the Na+/(Na++Ca2+) ratio was observed in the middle and lower reaches, while TDS remained relatively constant. This finding indicates that cation exchange may have occurred, resulting in the displacement of Na+ from the original Ca2+.
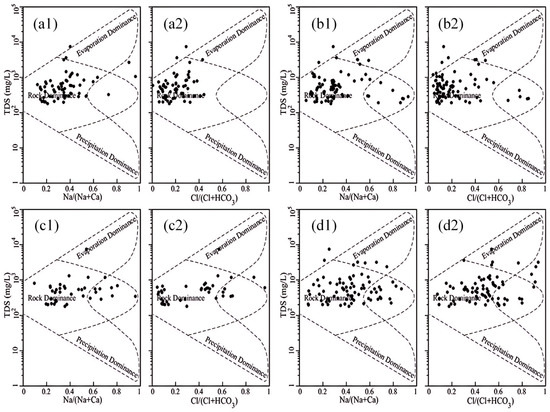
Figure 10.
Gibbs diagram of groundwater in different sections of Huangshui River Basin: (a1,a2) above Duoba section; (b1,b2) Duoba to Xining section; (c1,c2) Xining to Ping’an section; (d1,d2) Ping’an to Minhe section.
Table 3.
Summary of Na+/(Na++Ca2+) and Cl−/(Cl−+HCO3−) ratios in different regions.
3.3.2. Proportional Relationship of Main Ions
The ionic ratio relationship has been demonstrated to reflect the influence of different lithologies on the hydrochemical composition of groundwater to a certain extent. To further understand the hydrogeochemical evolution process and mechanism of groundwater in the study area, the mechanism of groundwater chemistry formation in the region was investigated in detail from three perspectives: dissolution-filtration, evaporation-concentration, and ion-alternation adsorption [52].
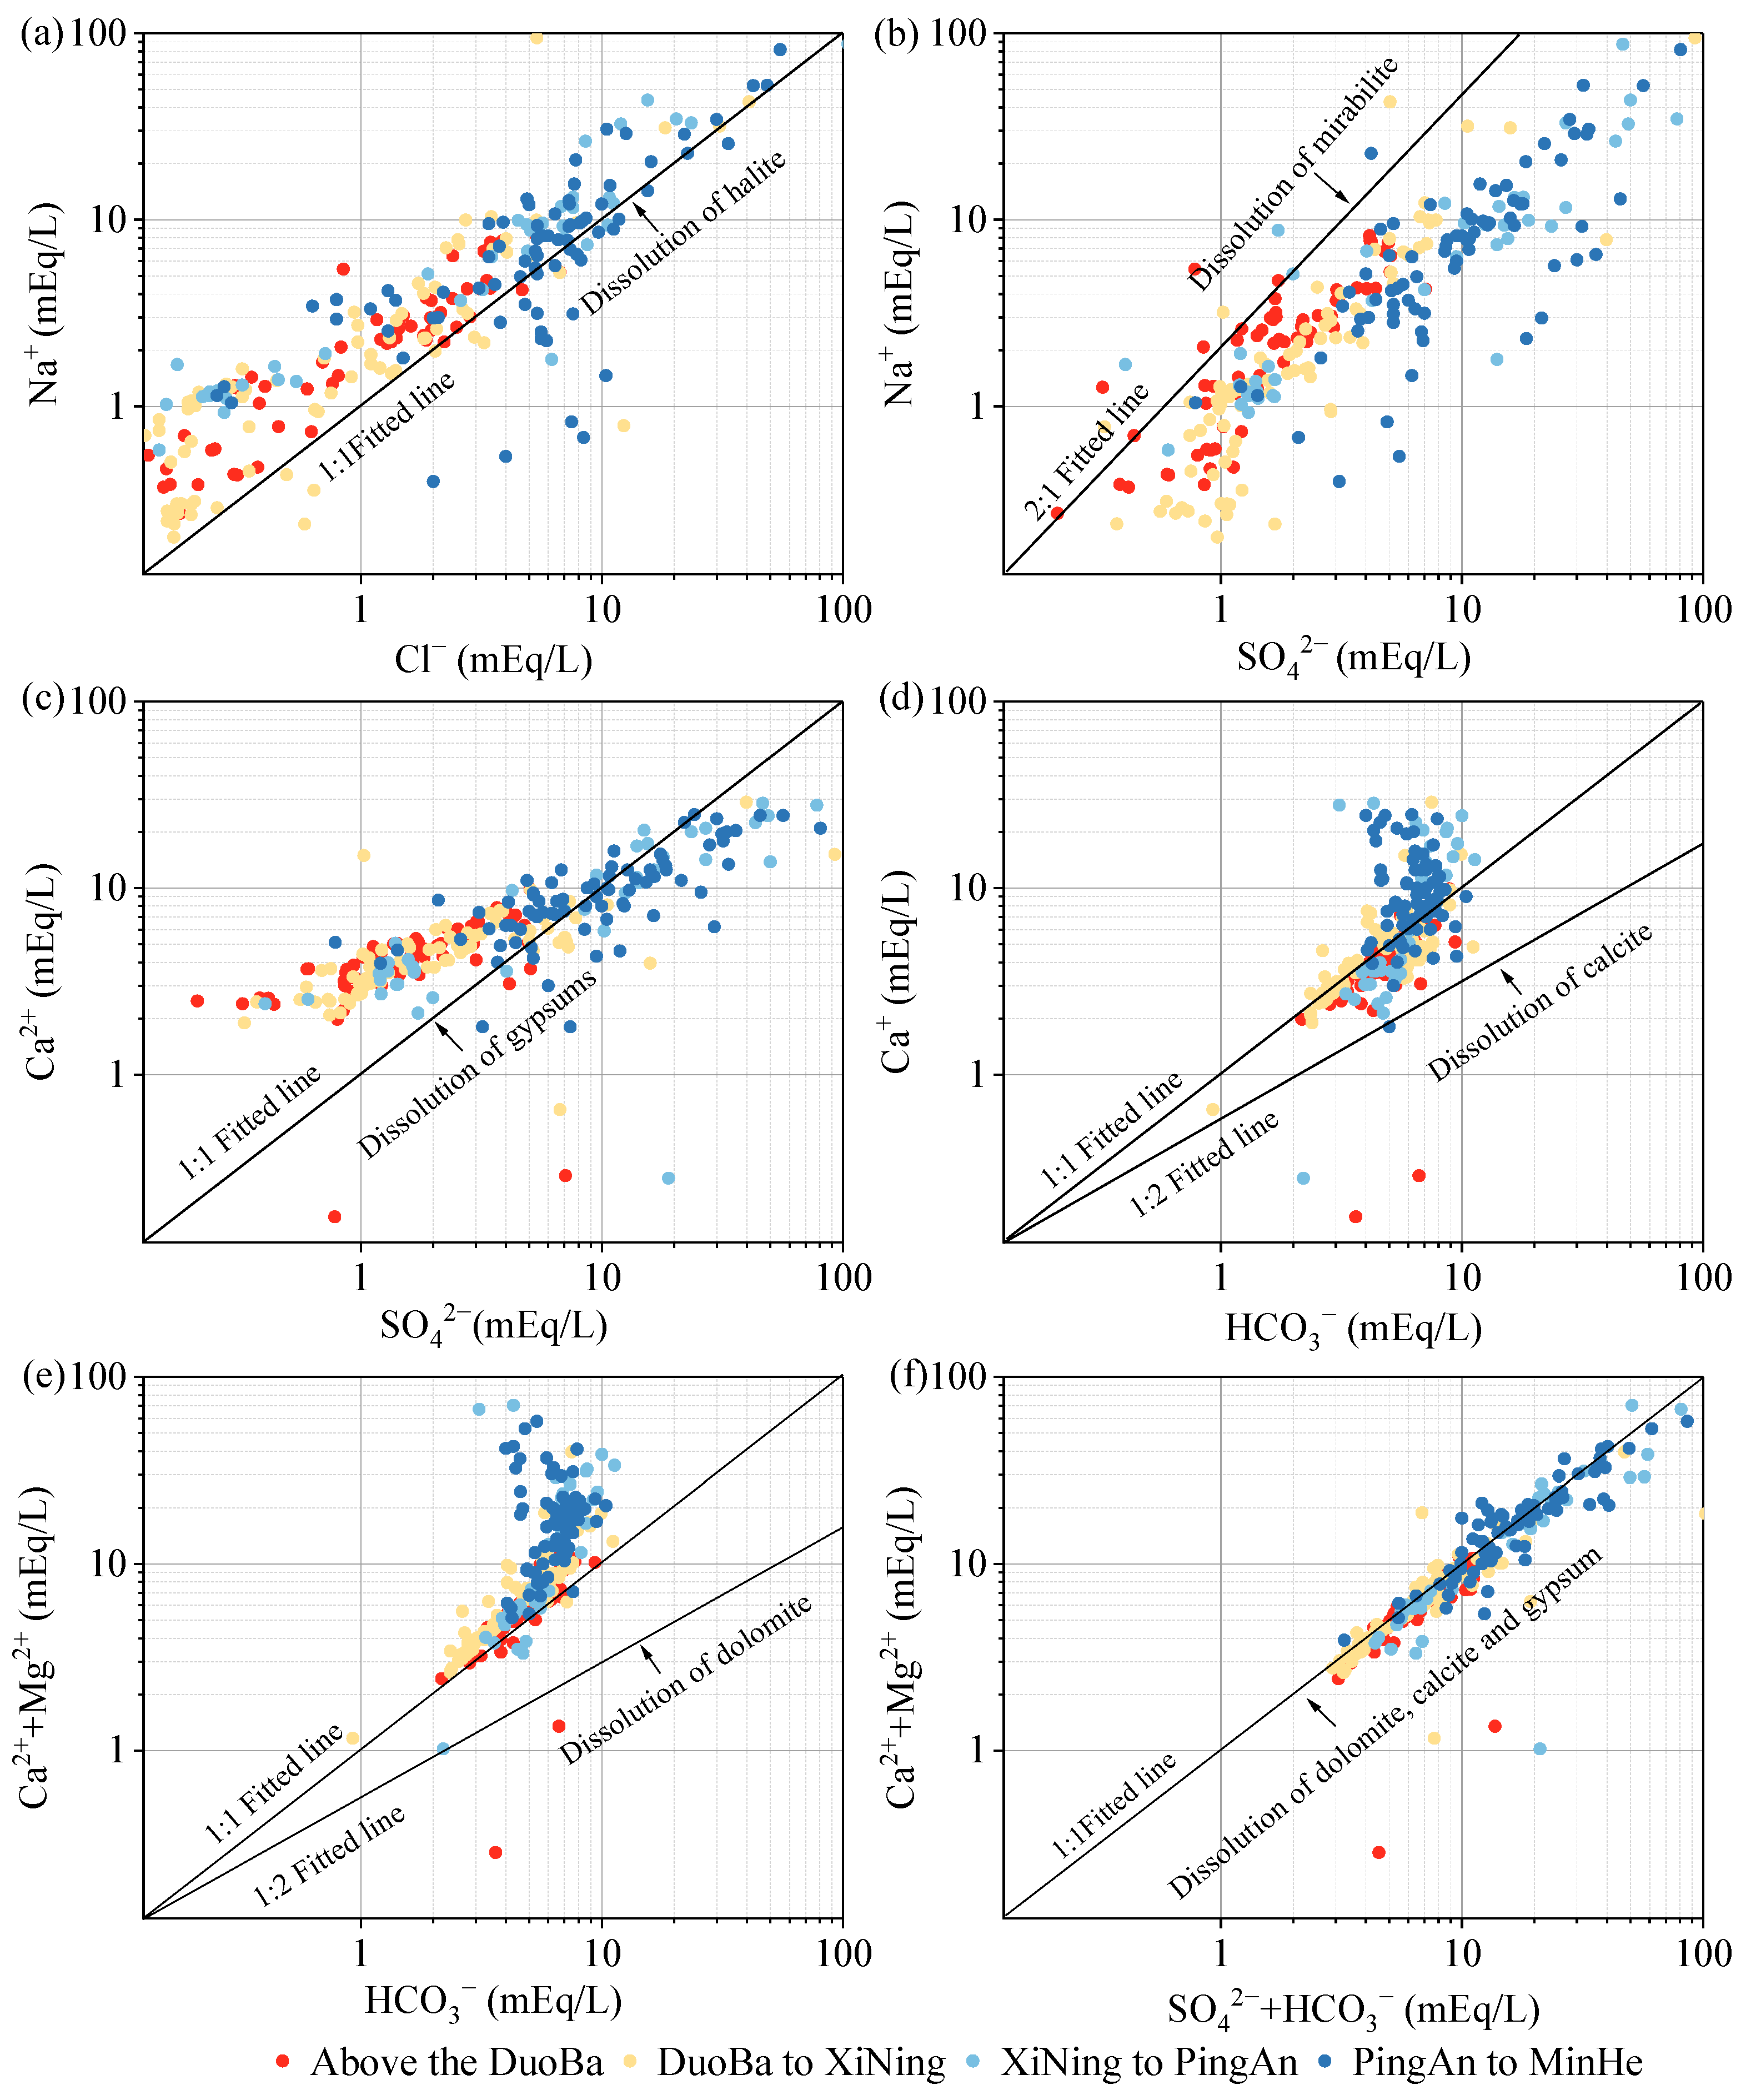
As demonstrated in Figure 11a, most of the monitoring points are above the 1:1 fitting line of γNa+/γCl−, suggesting that Na+ exhibits an advantage over Cl− in groundwater within the Huangshui valley area. Given the generally more stable nature of Cl− concentrations in groundwater, this suggests that Na+ is influenced not only by halite dissolution (Equation (1)) but also by the dissolution of other minerals, such as sodium feldspar (Equation (2)) and mannite (Equation (3)). The γNa+/γCl− ratios were found to be higher in the middle and downstream monitoring sites. Given the weaker migration capacity of Ca2+, it is hypothesized that the weakening of hydrodynamics in the middle and downstream may lead to cation exchange adsorption of Ca2+ with Na+. This process would increase Na+ concentration. The elevated Cl− concentrations in specific monitoring sites, relative to Na+, may be attributable to anthropogenic activities. As demonstrated in Figure 11b, most of the monitoring points are situated below the 2:1 fit line, indicating that SO42− is more prevalent in groundwater than Na+. The Pearson correlation coefficient analysis reveals a correlation coefficient of 0.87 between Na+ and SO42−, indicating their homologous nature. The dominance of SO42− in groundwater relative to Na+ sources suggests the involvement of sulfate minerals, such as gypsum (Equation (4)), in the leaching process. As demonstrated in Figure 11c, the presence of Ca2+ is more pronounced than SO42− in the middle and upper valley areas of the Huangshui River Basin. This observation indicates that weathering and dissolution of carbonate and silicate rocks play a significant role in this region. Conversely, the monitoring points in the middle and downstream areas demonstrate a preponderance of SO42−. When considered in conjunction with the stratigraphic lithology, these findings suggest the potential for manganite dissolution in the middle and downstream areas, or the weakening of hydrodynamic forces, which could trigger a cation exchange and adsorption effect, leading to a decrease in Ca2+ concentration. The dissolution of calcite and dolomite in groundwater is typically accompanied by the involvement of CO2, resulting in molar ratios of HCO3− to Ca2+ or Ca2++Mg2+ ranging from 1:1 to 2:1. As demonstrated in Figure 11d,e, the predominant sources of HCO3−, Ca2+, and Mg2+ in the groundwater within the valley area of the Huangshui River Basin are attributed to the weathering and dissolution of calcite (Equation (5)) and dolomite (Equation (6)). The ratio of Ca2+ to Mg2+ exhibits a correlation coefficient of 0.77, thereby further substantiating the analogy between Ca2+ and Mg2+, i.e., from the dissolution of dolomite. Furthermore, in the downstream area, as the concentrations of Ca2+ or Ca2++Mg2+ increased, there were higher concentrations of Ca2+ or Ca2++Mg2+ at HCO3− monitoring points, suggesting that other minerals containing Ca2+ and Mg2+, such as gypsum, may be undergoing dissolution downstream. The HCO3−+SO42− with Ca2++Mg2+ milligram-equivalent ratio is frequently utilized to ascertain the primary source of Ca2+ and Mg2+ in groundwater. When the ratio is greater than 1, it is generally indicative of weathering dissolution of minerals such as silicates or sulphates. Conversely, when the ratio is less than 1, it is predominantly suggestive of weathering dissolution of carbonate minerals. When the ratio approaches 1, it indicates that the constituents of the groundwater may have originated from the co-dissolution of carbonate and silicate minerals. As illustrated in Figure 11f, the ratio of HCO3− to Ca2++Mg2+ is predominantly distributed along the 1:1 fitting line, suggesting that Ca2+ and Mg2+ are predominantly derived from the co-dissolution of dolomite, calcite, and gypsum.
NaCl (halite) ⇌ Na+ + Cl−
2NaAlSi3O8 (albite) + 2CO2 + 11H2O ⇌ Na+ + Al2Si2O5(OH)4(kaolinite) + 4H4SiO4 + 2HCO3−
NaSO4 (mirabilite) ⇌ Ca2+ + SO42− + 2H2O
CaSO42H2O (gypsum) ⇌ Ca2+ + SO42 + 2H2O
CaCO3 (calcite) + CO2 + H2O ⇌ Ca2+ + 2HCO3−
CaMg(CO3)2 (dolomite) + 2CO2 + 2H2O ⇌ Ca2+ + Mg2+ + 4HCO3−
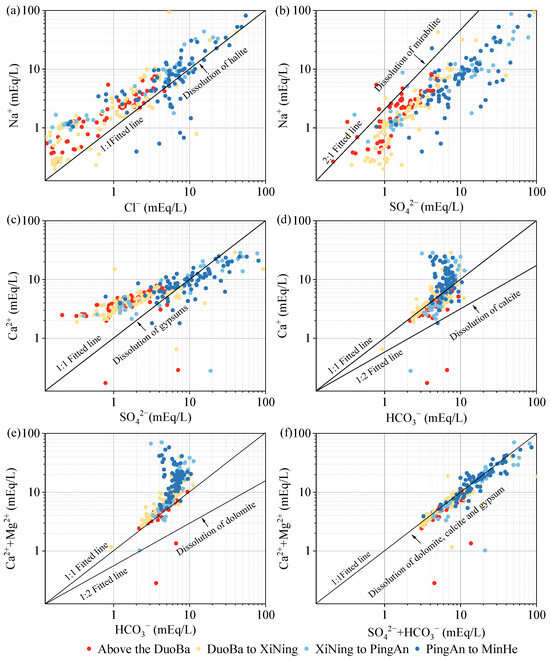
Figure 11.
The main ion ratio in Huangshui River Basin: (a) γNa+/γCl−; (b) γNa+/γSO42−; (c) γCa2+/γSO42−; (d) γCa2+/γHCO3−; (e) γ(Ca2++Mg2+)/γHCO3−; (f) γ(Ca2++Mg2+)/γ(SO42−+HCO3−).
The evaporative concentration process is a process that retains salts in the remaining groundwater by removing some of the water. Consequently, if groundwater formation is predominantly governed by evaporative concentration, Na+ and Cl− ions generally exhibit a proportional increase with rising TDS (Total Dissolved Solids) until they reach a state of saturation and precipitation. As demonstrated in Figure 12, the Na+/Cl− ratio is predominantly greater than 1, signifying that Na+ is a more abundant source than Cl−. Furthermore, the Na+/Cl− ratio remained relatively constant with increasing TDS, indicating that evapotranspiration concentration does not significantly influence the formation of groundwater fractions within the study area.
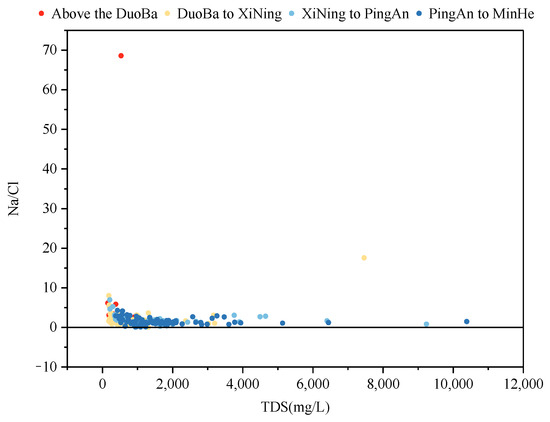
Figure 12.
The relationship between γ(Na+/Cl−) and the TDS ratio.
The ion ratio of γ(Na+-Cl−) and γ [(Ca2++Mg2+)- (SO42−+HCO3−)] is a significant indicator of cation exchange adsorption in groundwater. γ(Na+-Cl−) is indicative of the amount of Na+ remaining following the removal of dissolved halite, while γ [(Ca2++Mg2+)-(SO42−+HCO3−)] is representative of the Ca2+ and Mg2+ content remaining after the removal of dissolved minerals such as silicates, carbonates, and sulfates. Consequently, when cation exchange adsorption is more pronounced in groundwater, these ratios approximate 1. As demonstrated in Figure 13, when the monitoring point is situated on the 1:1 line at the bottom right of the ratio plot, reverse cation exchange is occurring in the groundwater, i.e., Na+ is being adsorbed, and Ca2+ and Mg2+ are being released. In contrast, the monitoring point on the 1:1 line at the upper left represented that cation exchange occurred, Ca2+ and Mg2+ were adsorbed, and Na+ was released. As illustrated in Figure 13, most of the monitoring points within the valley area of the Huangshui River Basin are positioned close to the 1:1 line in the lower left quadrant. This observation indicates that significant cation adsorption occurs in this particular area. When considered in conjunction with the geological characteristics of the study area, it can be deduced that the prevalence of silicate minerals such as quartz and feldspar, and clay minerals in the loose strata of the river valley area, engenders conducive conditions for cation exchange adsorption.
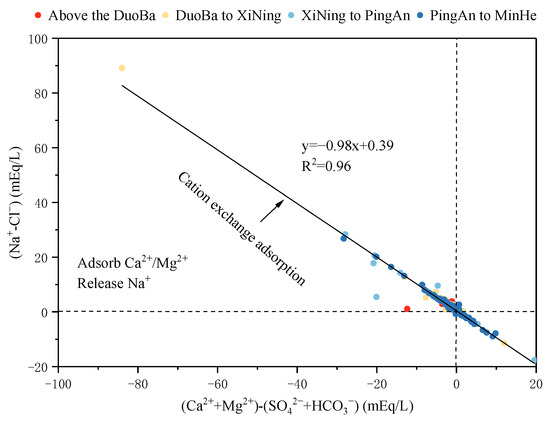
Figure 13.
The relationship between (Na+-Cl−) and [(Ca2++Mg2+)-(SO42−+HCO3−)].
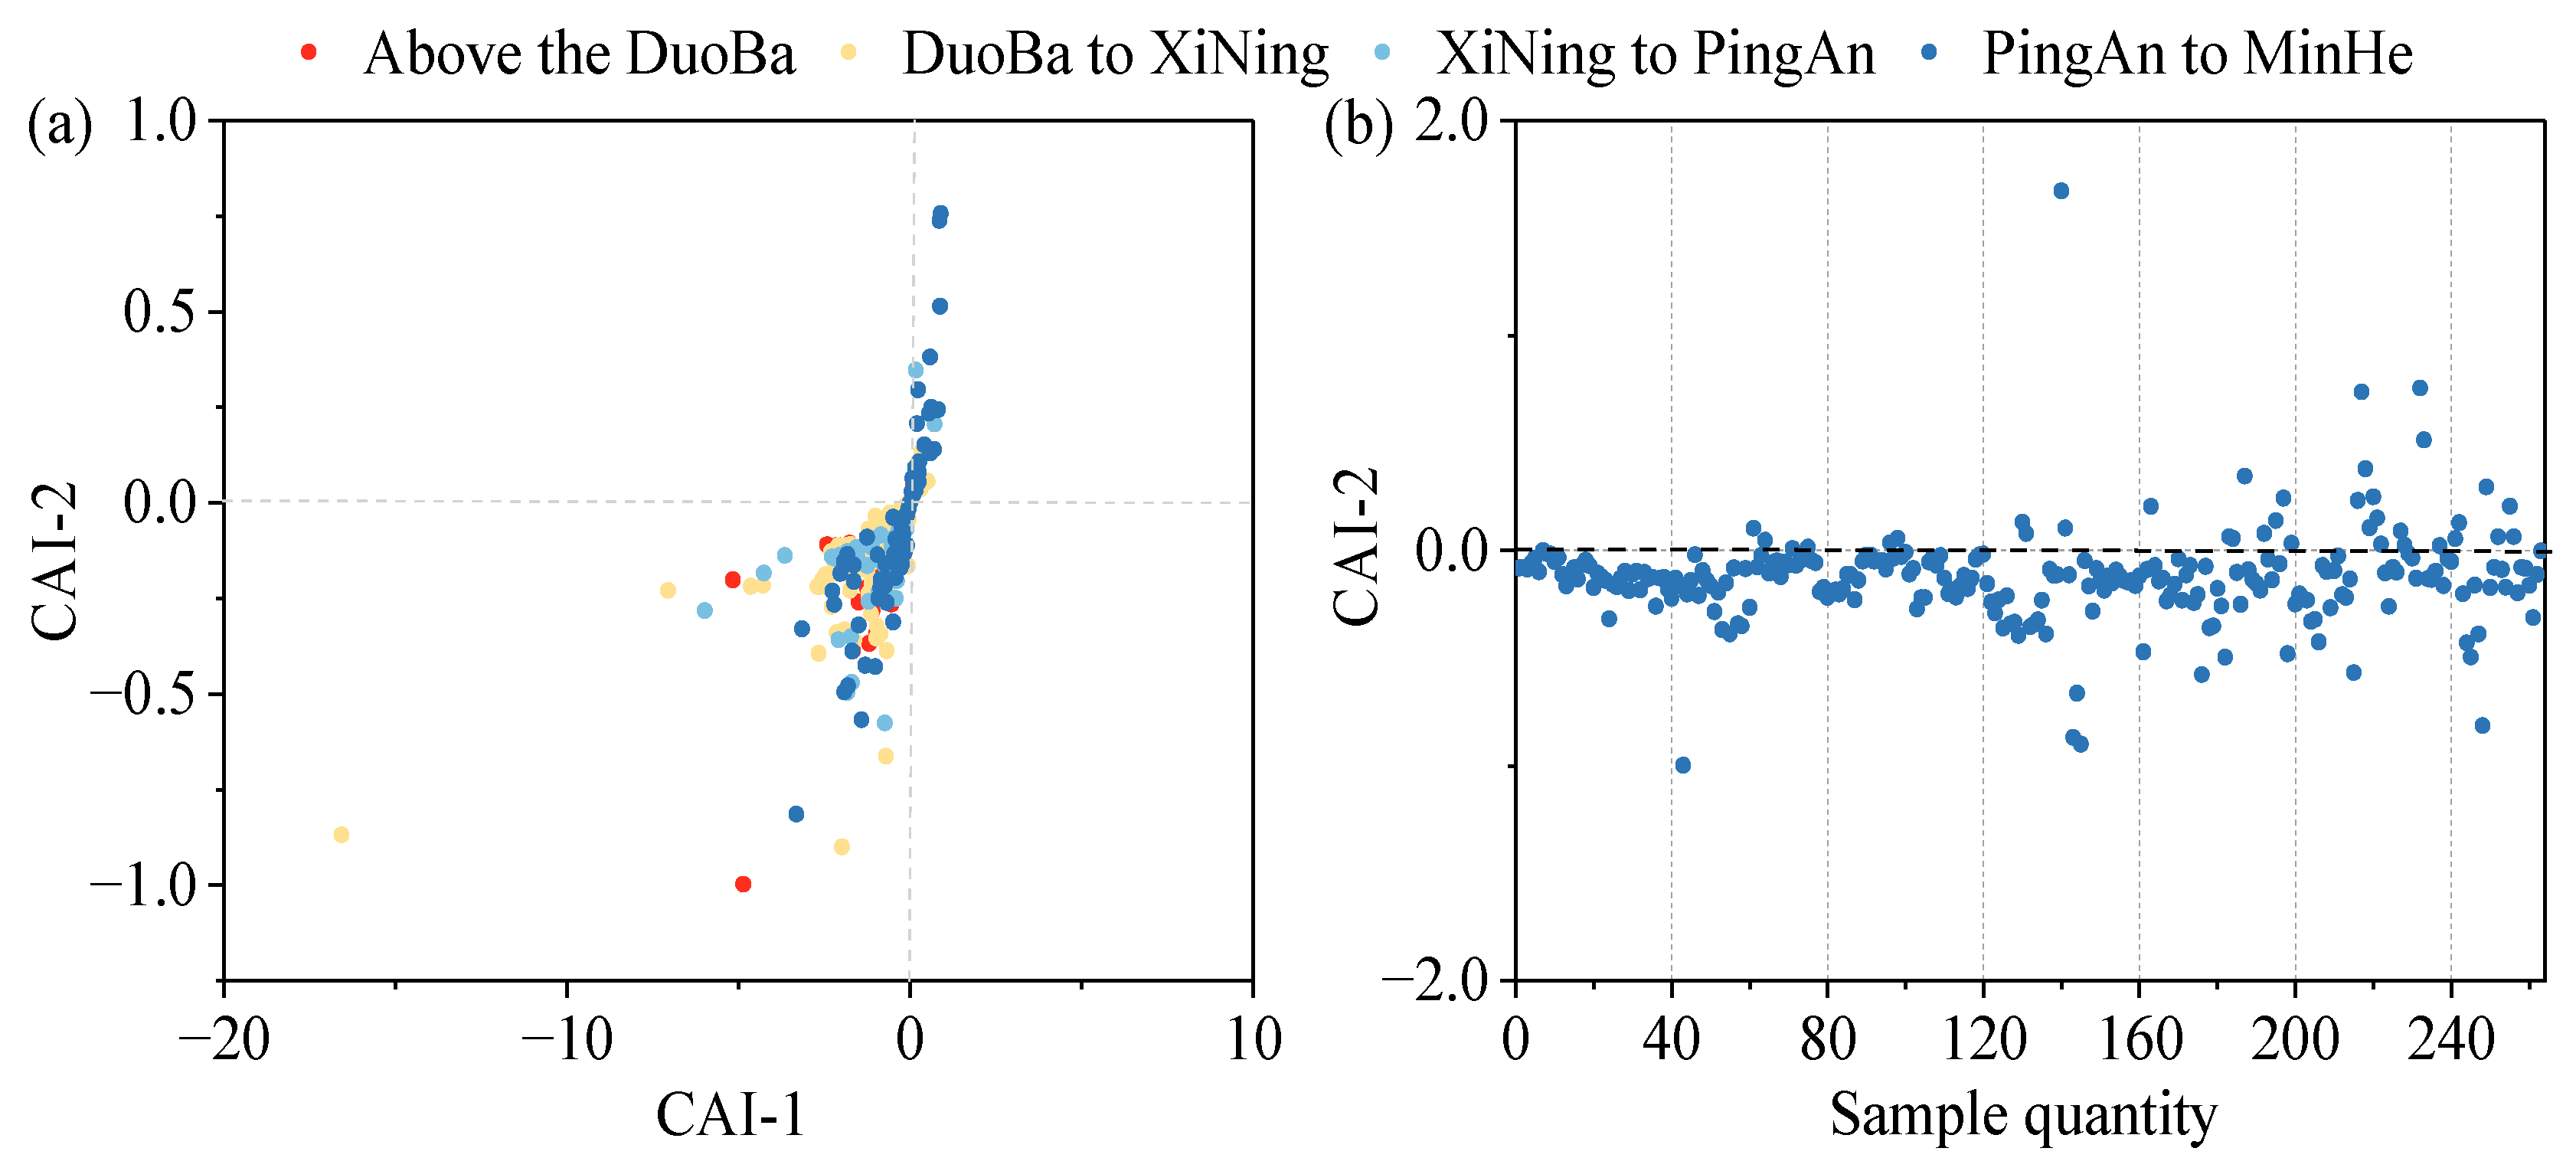
To further analyze the direction and intensity of the occurrence of alternating cation adsorption in the groundwater, the chloro-alkaline indices (Equations (7) and (8)) were introduced. When CAI-1 and CAI-2 are negative, this indicates that cation exchange occurs in the groundwater; conversely, if CAI-1 and CAI-2 are positive, this shows reverse cation exchange in the groundwater. Furthermore, it has been demonstrated that a more considerable absolute value of CAI-2 indicates a more pronounced ion exchange in groundwater [53].
CAI-1 = [Cl−− (Na+ + K+)]/Cl−
CAI-2 = [Cl−− (Na+ + K+)]/[SO42− + HCO3− + CO32− + NO3−]
As demonstrated in Figure 14, the CAI-1 and CAI-2 values at most of the monitoring points are less than 0, indicating the presence of a cation exchange effect within the valley area of the Huangshui River Basin. This effect is characterized by a decline in the concentrations of Ca2+ and Mg2+ ions in groundwater, concomitant with an increase in Na+ ions. Conversely, the negligible cation exchange effect in this region is evidenced by the low CAI-2 values, a finding corroborated by the Gibbs plot analysis results.
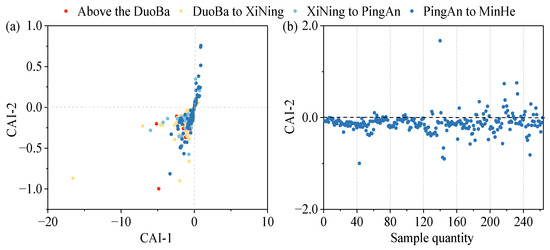
Figure 14.
Chloro-alkaline index of main chemical components: (a) CAI-1 and CAI-2 distribution; (b) CAI-2 index and sample number distribution.
3.4. Hydrogeochemical Simulation Analysis
The Huangshui River Basin is characterized by a complex hydrological cycle, with atmospheric precipitation contributing to groundwater recharge. The runoff process is characterized by a nested system of small cycle runoff components integrated within a more extensive cycle runoff system, ultimately discharging into the Huangshui River tributaries. The individual small-cycle runoff systems exhibit independence from one another, operating under distinct conditions. The bedrock mountainous areas present in situ recharge, nearby discharge characteristics, and part of the tributary section of groundwater to receive surface water recharge; in the central valley and large tributary valleys, groundwater and surface water conversion is very frequent. Broad river valleys and areas of the Quaternary System with substantial thickness are predominantly recharged by river water to groundwater. In contrast, areas with narrow river valleys primarily receive recharge from branch gorges and laterals in the bedrock mountainous areas on both sides. This section uses PHREEQC to calculate the saturation indices of significant minerals in the groundwater of the middle and lower reaches of the Xining to Ping’an section with high ionic concentrations. This enables determining the dissolution state of halite, gypsum, calcite, dolomite, and other minerals in the groundwater. Furthermore, inverse hydrogeochemical simulations are carried out to ascertain the contributions of the significant minerals to the evolution of the groundwater.
3.4.1. Mineral Saturation Index
A mineral’s saturation index (Equation (9)) provides a visual indication of the dissolution equilibrium of a component in groundwater. When SI = 0, it indicates that the mineral or gas is in dissolution–precipitation equilibrium; when SI > 0, the solution is oversaturated concerning the mineral or gas, and there is a tendency to precipitate; and when SI < 0, the solution is unsaturated concerning the mineral or gas, and there is a tendency for the mineral or gas to continue to dissolve [25]. Table 4 demonstrates the saturation indices of significant minerals such as halite, gypsum, calcite, and dolomite in the groundwater of the study area. The findings reveal that the saturation indices of halite, gypsum, calcite, and dolomite minerals in the middle and lower reaches from Xining to Ping’an are predominantly negative, indicating that these minerals are predominantly unsaturated. There is a propensity for CO2 to be dissolved, i.e., carbon dioxide may be dissolved from the gas phase or other phases into the solution. The solution is predominantly unsaturated for calcite, exhibiting substantial dispersion (standard deviation 0.903718), thereby signifying that the extent of unsaturation exhibits considerable variation among the samples. At the extreme value of 0.17, the solution is supersaturated with calcite and tends to precipitate. In the case of dolomite, the solution is typically unsaturated, exhibiting a substantial degree of dispersion (standard deviation 1.707804). This suggests that the degree of unsaturation varies significantly among samples and that, in most cases, there is a tendency to dissolve. However, precipitation is possible because the sample strongly influences this tendency. In conclusion, the dissolution of halite, gypsum, calcite, and dolomite is a significant source of material for Na+, Cl−, Ca2+, SO42−, Mg2+, and HCO3− in groundwater mineralization in the study area.
where
IAP (Ion Activity Product) is the product of the activities of dissolved ions in the solution, normalized to the stoichiometry of the mineral dissolution reaction.
K is the solubility product constant of the mineral at the solution temperature, representing equilibrium conditions.
Table 4.
The saturation index of main minerals in the middle and lower reaches of the study area.
Table 4.
The saturation index of main minerals in the middle and lower reaches of the study area.
| Main Minerals and Gases | Main Mineral Saturation Index | |||
|---|---|---|---|---|
| Minimum Value | Maximum Value | Mean Value | Standard Deviation | |
| SI(Anhydrite) | −2.18 | −0.42 | −0.84 | 0.52 |
| SI(Aragonite) | −0.53 | 0.00 | −0.21 | 0.20 |
| SI(Calcite) | −2.83 | 0.17 | −0.32 | 0.90 |
| SI(Dolomite) | −5.54 | 0.15 | −0.73 | 1.71 |
| SI(Gypsum) | −1.64 | 0.12 | −0.30 | 0.52 |
| SI(Halite) | −7.19 | −3.86 | −5.55 | 0.92 |
| SI(CO2) | −3.72 | −1.51 | −1.89 | 0.67 |
| SI(Fluorite) | −1.26 | −1.12 | −1.19 | 0.65 |
3.4.2. Inverse Geochemical Modeling
Reverse hydrogeochemical simulation is defined as utilizing material balance models to ascertain the quantity of mineral precipitation or dissolution between two discrete points (where hydrochemical data are available) along the groundwater flow line [54]. In essence, this involves the application of water and rock compositions to identify and quantify hydrogeochemical reactions, thereby elucidating the formation and evolution of hydrochemical compositions. In this study, to further validate the hydrogeochemical processes in the study area, based on the hydrogeological data of the study area and using the results of existing hydrochemical analyses, a simulation path in the downstream section from Ping’an to Ledu, where sufficient data are available, was selected to carry out reverse hydrogeochemical simulations using PHREEQC to represent the water–rock interaction processes quantitatively. The selection of mineral phases constitutes a pivotal step in the success of the reverse hydrogeochemical simulation, which is based on hydrochemical analyses, identifying rock minerals and characteristics of the water-bearing medium. According to the hydrochemical analyses, the primary mineral phases identified within the study area include calcite, dolomite, halite, and gypsum. Additionally, the hydrochemical evolution process necessitates the consideration of CO2(g) as a potential mineral phase, given its constant dissolution into the groundwater. The water chemistry measurements were then utilized to set constraining variables, including Na, Ca, Mg, C, S, and Cl.
Inverse geochemical modeling quantifies water–rock interactions along a defined groundwater flow path (Ping’an-Ledu section, hydraulic gradient: 0.5–1.2‰) through mass conservation equations. The workflow comprises four key steps: (1) selecting reactive mineral phases based on aquifer sediment XRD analysis (dominantly calcite, dolomite, gypsum, and halite) and saturation indices (SI); (2) establishing mass-balance equations constrained by major ions (Na+, Ca2+, Mg2+, Cl−, SO42−, HCO3−), allowing a concentration deviation of ±5%; (3) incorporating CO2(g) to represent open-system carbonate equilibria; and (4) iteratively solving mineral dissolution/precipitation extents (ξk) using the inverse modeling module in PHREEQC (with the phreeqc.dat thermodynamic database). The model successfully quantified solute contributions from halite dissolution (39.87 mmol/L) and gypsum dissolution (20.28 mmol/L), as well as calcite precipitation (−23.80 mmol/L) driven by CO2 degassing, aligning with the qualitative hydrochemical evolution mechanisms outlined in Section 3.3. The simulation results are displayed in Table 5. Along the groundwater flow path, the primary hydrological rock effects that resulted in alterations to the chemical composition of groundwater were as follows: precipitation of calcite (23.80 mmol/L); dissolution of dolomite, halite, and gypsum (11.31, 39.87, and 20.28 mmol/L); and escape of CO2 (0.82 mmol/L). The precipitation of calcite, halite, and gypsum resulted in an amount of CO2 of 0.82 mmol/L. The precipitation of calcite, halite, and gypsum resulted in elevated dissolved amounts of these minerals, leading to a minor efflux of CO2. This phenomenon occurred concurrently with abundant silicate minerals, such as quartz, within the rock formations. Feldspar and other clay minerals in the loose strata in the river valley area provided favorable conditions for cation exchange and adsorption, which were manifested by the fact that in terms of the cations, Ca2+, Mg2+, Na+, and Mg2+ concentrations increased; concentrations of anions such as SO42− and Cl− increased, while those of CO32− and HCO3− decreased. The increasing number of monitoring points in the region’s middle and lower reaches of nondominant water types indicates that the water chemistry types are becoming more complex, and the water samples are transitioning from bicarbonate-type water to sulfate-type water and combined water types. The predominant hydrological consequences of groundwater in the runoff direction, as deduced from reverse hydrogeochemical simulations, encompass the dissolution of halite, gypsum, and dolomite; the dissolution or precipitation of calcite; the positive cation exchange; and the local presence of dissolution of masonite and sodic feldspar, as well as carbon dioxide overflow. This finding aligns with and corroborates the outcomes of the qualitative analyses outlined in the preceding section. The inverse geochemical modeling results align with hydrochemical evolution patterns observed in semi-arid basins globally. The dissolution of halite (39.87 mmol/L) and gypsum (20.28 mmol/L) mirrors processes in siliciclastic systems where evaporite weathering dominates solute acquisition [55]. Similarly, calcite precipitation (−23.80 mmol/L) reflects CO2 degassing dynamics observed in volcanic aquifers, where carbonate saturation is enhanced by evaporative concentration. The spatial transition from Ca-HCO3 dominance to Ca-SO4/Cl mixtures parallels hydrochemical zoning reported in the Toluquilla Valley, Mexico, where anthropogenic inputs and evaporite dissolution synergistically modify groundwater facies. The absence of albite and gypsum saturation (SI < 0) further corroborates findings from volcanic and siliciclastic systems, where silicate weathering and evaporite dissolution prevail despite carbonate precipitation. Notably, the higher halite dissolution rate in the Huangshui Basin compared to rural zones in the Guadalajara system likely stems from localized evaporite enrichment in midstream strata—a phenomenon amplified by Quaternary loess–evaporite interactions in transitional basins [56].
Table 5.
Results of reverse hydrogeochemical simulation.
4. Conclusions
This study systematically analyzed the hydrochemical characteristics of groundwater in the valley area of the Huangshui River Basin, the distribution of types, and their genesis mechanisms, revealing the evolutionary trends and influencing factors of groundwater in different regions. Through mathematical and statistical analyses and correlation studies, it was found that Na++K+, Mg2+, Cl−, SO42−, F−, and TDS exhibited significant spatial variations, with Na+, Ca2+, HCO3−, and SO42− identified as the dominant ions. Pearson correlation analysis demonstrated that the TDS concentration was predominantly influenced by Ca2+, Mg2+, Na+, Cl−, and SO42−, and these ions were consistent with the distribution of TDS, exhibiting a gradual increase in the watershed from upstream to downstream. The chemical type of groundwater gradually evolved from calcium carbonate upstream to calcium sulphate, calcium chloride, and nondominant water downstream, under the combined effect of natural and anthropogenic factors. This trend indicates an increase in water chemistry complexity. The hydrochemical evolution of groundwater in the Huangshui River Basin is governed by a dynamic interplay of natural geological processes and anthropogenic activities, with their relative significance exhibiting distinct spatial patterns. Natural drivers dominate upstream regions, where carbonate dissolution and evaporite weathering account for >80% of hydrochemical variability. Evaporative concentration further amplifies salinity in low-lying valleys (TDS: 10,387 mg/L; Na+/Cl− > 1.5), aligned with aridity indices. Anthropogenic influences prevail mid-downstream, marked by agricultural inputs (NO3− > 10 mg/L; Cl− > 500 mg/L; R2 = 0.67 with fertilizer use), industrial sulfate anomalies, and over-extraction-induced water table declines. These activities contribute 45–60% of TDS increases, surpassing natural evaporative effects. The natural-to-anthropogenic influence ratio shifts from 4:1 upstream to 1:2 downstream, mirroring trends in global mining-impacted basins. To further resolve the specific contributions of geogenic versus anthropogenic salinity sources, future studies should integrate isotopic tracers (e.g., δ34S and δ18O for sulfate, 87Sr/86Sr for carbonate weathering), as recommended in groundwater salinization research [52]. Analysis using Gibbs diagrams demonstrates that the groundwater chemistry in the study area is predominantly influenced by water–rock interactions, with only a minor contribution from evapotranspiration and concentration. While natural geochemical processes define upstream signatures (e.g., Ca-HCO3-type waters), midstream anomalies such as SO42− > 1000 mg/L exceed background levels typical of undisturbed headwater systems [57], underscoring the growing influence of industrial and agricultural activities downstream. The analysis of ion scaling relationships indicates that diagenesis exerts a predominant influence on the composition of groundwater chemistry within this particular zone. The predominant sources of Na+ and Cl− ions are attributed to halite dissolution, with the dissolution of sodic feldspars and manganites also exerting a notable influence. Conversely, the presence of Ca2+ and Mg2+ ions is mainly attributable to dolomite, calcite, and gypsum dissolution. In the middle and lower reaches, cation exchange influenced Na+ and Ca2+ concentrations, and the increase in SO42− indicated that the water chemistry characteristics of this section were strongly influenced by gypsum and mannite dissolution. The primary water–rock effects of groundwater in the runoff direction in select sections of the middle and lower reaches were obtained through the utilization of reverse hydrogeochemical simulations. These simulations encompassed the dissolution of halite, gypsum, dolomite, the dissolution or precipitation of calcite, and positive cation exchange, among others. The local presence of dissolution of mansonite and sodic feldspar and carbon dioxide overflow was also considered. The outcomes of the simulations quantitatively corroborated the results concerning the primary water–rock effects derived from the qualitative analyses. Although this study utilizes a one-year dataset, the generalizability of its findings to longer-term trends is supported by the geological stability of dominant hydrochemical processes identified in the basin. The consistent spatial patterns of water–rock interactions (e.g., carbonate dissolution with mean SIcalcite = −0.32; gypsum weathering with SIgypsum up to 0.12; Section 3.4.1) reflect time-invariant controls of lithology, as evidenced by the persistent stratigraphic influence of Paleogene gypsum-bearing strata and Quaternary loess (Section 2.1). Furthermore, the basin-wide ion distribution trends (e.g., TDS increase from 155 mg/L upstream to 10,387 mg/L downstream; Section 3.2.1) align with the classical Chebotarev sequence of groundwater evolution, which operates over centennial scales. The present study proposes a framework for analyzing groundwater chemical evolution, revealing the spatial characteristics and central factors of the Huangshui River Basin groundwater, facilitating its rational water resource development and providing a basis for similar groundwater chemistry research management.
Author Contributions
Z.W.: Writing—original draft, Investigation.; T.L.: Methodology, Investigation.; S.L.: Investigation, K.Z.: Visualization, Data curation.; Y.G.: Data curation, Formal analysis.; B.W.: Data curation, Investigation.; Y.L.: Supervision, Funding acquisition. All authors have read and agreed to the published version of the manuscript.
Funding
This research was funded by the Qinghai Province Basic Research Project (No. 2024-ZJ-767).
Data Availability Statement
Data are contained within the article.
Conflicts of Interest
The authors declare that they have no known competing financial interests or personal relationships that could have appeared to influence the work reported in this paper.
References
- Gleick, P.H. Water in crisis: Paths to sustainable water use. Ecol. Appl. 1998, 8, 571–579. [Google Scholar] [CrossRef]
- Unfried, K.; Kis-Katos, K.; Poser, T. Water scarcity and social conflict. J. Environ. Econ. Manag. 2022, 113, 102633. [Google Scholar] [CrossRef]
- Wagner, J.R. The Social Life of Water; Berghahn Books: Oxford, UK, 2022. [Google Scholar]
- Wheater, H.S.; Gober, P. Water security and the science agenda. Water Resour. Res. 2015, 51, 5406–5424. [Google Scholar] [CrossRef]
- Reid, A.J.; Carlson, A.K.; Creed, I.F.; Eliason, E.J.; Gell, P.A.; Johnson, P.T.; Kidd, K.A.; MacCormack, T.J.; Olden, J.D.; Ormerod, S.J. Emerging threats and persistent conservation challenges for freshwater biodiversity. Biol. Rev. 2019, 94, 849–873. [Google Scholar] [CrossRef] [PubMed]
- Rodell, M.; Famiglietti, J.S.; Wiese, D.N.; Reager, J.; Beaudoing, H.K.; Landerer, F.W.; Lo, M.-H. Emerging trends in global freshwater availability. Nature 2018, 557, 651–659. [Google Scholar] [CrossRef] [PubMed]
- Somlyódy, L.; Varis, O. Freshwater under pressure. Int. Rev. Environ. Strateg. 2006, 6, 181–204. [Google Scholar]
- Giordano, M. Global groundwater? Issues and solutions. Annu. Rev. Environ. Resour. 2009, 34, 153–178. [Google Scholar] [CrossRef]
- Vázquez-Suñé, E.; Sánchez-Vila, X.; Carrera, J. Introductory review of specific factors influencing urban groundwater, an emerging branch of hydrogeology, with reference to Barcelona, Spain. Hydrogeol. J. 2005, 13, 522–533. [Google Scholar] [CrossRef]
- Holzer, T.L. Faulting caused by groundwater level declines, San Joaquin Valley, California. Water Resour. Res. 1980, 16, 1065–1070. [Google Scholar] [CrossRef]
- Le Brocque, A.F.; Kath, J.; Reardon-Smith, K. Chronic groundwater decline: A multi-decadal analysis of groundwater trends under extreme climate cycles. J. Hydrol. 2018, 561, 976–986. [Google Scholar] [CrossRef]
- Sishodia, R.P.; Shukla, S.; Graham, W.D.; Wani, S.P.; Garg, K.K. Bi-decadal groundwater level trends in a semi-arid south indian region: Declines, causes and management. J. Hydrol. Reg. Stud. 2016, 8, 43–58. [Google Scholar] [CrossRef]
- Sharma, K.; Raju, N.J.; Singh, N.; Sreekesh, S. Heavy metal pollution in groundwater of urban Delhi environs: Pollution indices and health risk assessment. Urban Clim. 2022, 45, 101233. [Google Scholar] [CrossRef]
- Balderacchi, M.; Benoit, P.; Cambier, P.; Eklo, O.M.; Gargini, A.; Gemitzi, A.; Gurel, M.; Kløve, B.; Nakic, Z.; Predaa, E. Groundwater pollution and quality monitoring approaches at the European level. Crit. Rev. Environ. Sci. Technol. 2013, 43, 323–408. [Google Scholar] [CrossRef]
- Mondal, B.; Dolui, G.; Pramanik, M.; Maity, S.; Biswas, S.S.; Pal, R. Urban expansion and wetland shrinkage estimation using a GIS-based model in the East Kolkata Wetland, India. Ecol. Indic. 2017, 83, 62–73. [Google Scholar] [CrossRef]
- Kiage, L.M.; Douglas, P. Linkages between land cover change, lake shrinkage, and sublacustrine influence determined from remote sensing of select Rift Valley Lakes in Kenya. Sci. Total Environ. 2020, 709, 136022. [Google Scholar] [CrossRef]
- Alcalá, F.J.; Martínez-Valderrama, J.; Robles-Marín, P.; Guerrera, F.; Martín-Martín, M.; Raffaelli, G.; de León, J.T.; Asebriy, L. A hydrological–economic model for sustainable groundwater use in sparse-data drylands: Application to the Amtoudi Oasis in southern Morocco, northern Sahara. Sci. Total Environ. 2015, 537, 309–322. [Google Scholar] [CrossRef]
- Tweed, S.; Leblanc, M.; Cartwright, I.; Favreau, G.; Leduc, C. Arid zone groundwater recharge and salinisation processes; an example from the Lake Eyre Basin, Australia. J. Hydrol. 2011, 408, 257–275. [Google Scholar] [CrossRef]
- Balasubramanian, M.; Sridhar, S.G.D.; Ayyamperumal, R.; Karuppannan, S.; Gopalakrishnan, G.; Chakraborty, M.; Huang, X. Isotopic signatures, hydrochemical and multivariate statistical analysis of seawater intrusion in the coastal aquifers of Chennai and Tiruvallur District, Tamil Nadu, India. Mar. Pollut. Bull. 2022, 174, 113232. [Google Scholar] [CrossRef]
- Chowdhury, S. Effects of seawater intrusion on the formation of disinfection byproducts in drinking water. Sci. Total Environ. 2022, 827, 154398. [Google Scholar] [CrossRef]
- Werner, A.D.; Bakker, M.; Post, V.E.; Vandenbohede, A.; Lu, C.; Ataie-Ashtiani, B.; Simmons, C.T.; Barry, D.A. Seawater intrusion processes, investigation and management: Recent advances and future challenges. Adv. Water Resour. 2013, 51, 3–26. [Google Scholar] [CrossRef]
- Frot, E.; Van Wesemael, B.; Vandenschrick, G.; Souchez, R.; Solé Benet, A. Origin and type of rainfall for recharge of a karstic aquifer in the western Mediterranean: A case study from the Sierra de Gador–Campo de Dalias (southeast Spain). Hydrol. Process. Int. J. 2007, 21, 359–368. [Google Scholar] [CrossRef]
- Konikow, L.F. Long-term groundwater depletion in the United States. Groundwater 2015, 53, 2–9. [Google Scholar] [CrossRef]
- Taylor, R.G.; Scanlon, B.; Döll, P.; Rodell, M.; Van Beek, R.; Wada, Y.; Longuevergne, L.; Leblanc, M.; Famiglietti, J.S.; Edmunds, M. Ground water and climate change. Nat. Clim. Change 2013, 3, 322–329. [Google Scholar] [CrossRef]
- Gastmans, D.; Hutcheon, I.; Menegário, A.A.; Chang, H.K. Geochemical evolution of groundwater in a basaltic aquifer based on chemical and stable isotopic data: Case study from the Northeastern portion of Serra Geral Aquifer, São Paulo state (Brazil). J. Hydrol. 2016, 535, 598–611. [Google Scholar] [CrossRef]
- Gning, A.A.; Orban, P.; Gesels, J.; Ngom, F.D.; Dassargues, A.; Malou, R.; Brouyère, S. Factors controlling the evolution of groundwater dynamics and chemistry in the Senegal River Delta. J. Hydrol. Reg. Stud. 2017, 10, 133–144. [Google Scholar] [CrossRef]
- Jasechko, S.; Perrone, D.; Befus, K.M.; Bayani Cardenas, M.; Ferguson, G.; Gleeson, T.; Luijendijk, E.; McDonnell, J.J.; Taylor, R.G.; Wada, Y. Global aquifers dominated by fossil groundwaters but wells vulnerable to modern contamination. Nat. Geosci. 2017, 10, 425–429. [Google Scholar] [CrossRef]
- Ge, S.; Wu, Q.; Lu, N.; Jiang, G.; Ball, L. Groundwater in the Tibet Plateau, western China. Geophys. Res. Lett. 2008, 35. [Google Scholar] [CrossRef]
- Xiang, L.; Wang, H.; Steffen, H.; Wu, P.; Jia, L.; Jiang, L.; Shen, Q. Groundwater storage changes in the Tibetan Plateau and adjacent areas revealed from GRACE satellite gravity data. Earth Planet. Sci. Lett. 2016, 449, 228–239. [Google Scholar] [CrossRef]
- Wang, Y.; He, Y.; Li, J.; Jiang, Y. Evolution simulation and risk analysis of land use functions and structures in ecologically fragile watersheds. Remote Sens. 2022, 14, 5521. [Google Scholar] [CrossRef]
- Zhou, B.; Wang, H.; Zhang, Q. Assessment of the evolution of groundwater chemistry and its controlling factors in the Huangshui River Basin of northwestern China, using hydrochemistry and multivariate statistical techniques. Int. J. Environ. Res. Public Health 2021, 18, 7551. [Google Scholar] [CrossRef]
- Fan, L.; Liu, L.; Hu, J.; Zhao, F.; Li, C.; Yi, Y. A Long-Term Evaluation of the Ecohydrological Regime in a Semiarid Basin: A Case Study of the Huangshui River in the Yellow River Basin, China. Hydrology 2024, 11, 168. [Google Scholar] [CrossRef]
- Wang, P.; Li, R.; Liu, D.; Wu, Y. Dynamic characteristics and responses of ecosystem services under land use/land cover change scenarios in the Huangshui River Basin, China. Ecol. Indic. 2022, 144, 109539. [Google Scholar] [CrossRef]
- Dong, B.; Qin, T.; Wang, Y.; Zhao, Y.; Liu, S.; Feng, J.; Li, C.; Zhang, X. Spatiotemporal variation of nitrogen and phosphorus and its main influencing factors in Huangshui River basin. Environ. Monit. Assess. 2021, 193, 292. [Google Scholar] [CrossRef]
- Feng, J.; Dong, B.; Qin, T.; Liu, S.; Zhang, J.; Gong, X. Temporal and Spatial Variation Characteristics of NDVI and Its Relationship with Environmental Factors in Huangshui River Basin from 2000 to 2018. Pol. J. Environ. Stud. 2021, 30, 3043–3063. [Google Scholar] [CrossRef]
- Zhang, X. Analysis of water pollution and calculation of ecological compensation standards in huangshui river basin based on ecological footprint. J. Phys. Conf. Ser. 2020, 1533, 022070. [Google Scholar] [CrossRef]
- Song, S.; Li, H.; Yang, M.; Gu, Z.; Wang, X.; Zhang, W.; Liu, Y. Study on Response Process and Time Delay Effect of Groundwater Dynamic in Northeastern Margin of Tibetan Plateau. Water 2023, 15, 2838. [Google Scholar] [CrossRef]
- Fang, J.; Li, G.; Rubinato, M.; Ma, G.; Zhou, J.; Jia, G.; Yu, X.; Wang, H. Analysis of long-term water level variations in Qinghai Lake in China. Water 2019, 11, 2136. [Google Scholar] [CrossRef]
- Wang, Y.; Ding, X.; Chen, Y.; Zeng, W.; Zhao, Y. Pollution source identification and abatement for water quality sections in Huangshui River basin, China. J. Environ. Manag. 2023, 344, 118326. [Google Scholar] [CrossRef]
- Li, J.; Liu, S.; Chen, J.; Zhao, Y.; Abebe, S.A.; Dong, B.; Wang, W.; Qin, T. Response of stream water quality to the vegetation patterns on arid slope: A case study of Huangshui River basin. Environ. Sci. Pollut. Res. 2024, 31, 9167–9182. [Google Scholar] [CrossRef]
- Wei, H.; Lu, C.; Liu, Y. Farmland changes and their ecological impact in the Huangshui River Basin. Land 2021, 10, 1082. [Google Scholar] [CrossRef]
- Liang, L.; Zhang, L.; Liu, C.; Zhu, J.; Wang, D. Groundwater Nitrate Contamination in Arid Areas of Haidong. Water 2023, 15, 4067. [Google Scholar] [CrossRef]
- McLean, M.; Evers, L.; Bowman, A.; Bonte, M.; Jones, W. Statistical modelling of groundwater contamination monitoring data: A comparison of spatial and spatiotemporal methods. Sci. Total Environ. 2019, 652, 1339–1346. [Google Scholar] [CrossRef]
- Varouchakis, Ε.; Hristopulos, D. Comparison of stochastic and deterministic methods for mapping groundwater level spatial variability in sparsely monitored basins. Environ. Monit. Assess. 2013, 185, 1–19. [Google Scholar] [CrossRef] [PubMed]
- Sedgwick, P. Pearson’s correlation coefficient. Bmj 2012, 345. [Google Scholar] [CrossRef]
- Smedley, P.L.; Kinniburgh, D.G. Molybdenum in natural waters: A review of occurrence, distributions and controls. Appl. Geochem. 2017, 84, 387–432. [Google Scholar] [CrossRef]
- Piper, A.M. A graphic procedure in the geochemical interpretation of water-analyses. Eos Trans. Am. Geophys. Union 1944, 25, 914–928. [Google Scholar]
- Tonani, F.; Nagao, K.; Moore, J.; Natale, G.; Sperry, T. Water and gas geochemistry of the Cove-Fort Sulphurdale geothermal system. In Proceedings of the Twenty-Third Workshop on Geothermal Reservoir Engineering, Stanford, CA, USA, 19–21 January 1998; Stanford University: Stanford, CA, USA, 1998; pp. 26–28. [Google Scholar]
- Vespasiano, G.; Cianflone, G.; Romanazzi, A.; Apollaro, C.; Dominici, R.; Polemio, M.; De Rosa, R. A multidisciplinary approach for sustainable management of a complex coastal plain: The case of Sibari Plain (Southern Italy). Mar. Pet. Geol. 2019, 109, 740–759. [Google Scholar] [CrossRef]
- Hem, J.D. Study and Interpretation of the Chemical Characteristics of Natural Water; Department of the Interior, US Geological Survey: Reston, VA, USA, 1985; Volume 2254.
- Gibbs, R.J. Mechanisms controlling world water chemistry. Science 1970, 170, 1088–1090. [Google Scholar] [CrossRef]
- Sunkari, E.D.; Abu, M.; Zango, M.S. Geochemical evolution and tracing of groundwater salinization using different ionic ratios, multivariate statistical and geochemical modeling approaches in a typical semi-arid basin. J. Contam. Hydrol. 2021, 236, 103742. [Google Scholar] [CrossRef]
- Schoeller, H. Arid zone hydrology: Recent developments. Soil Sci. 1960, 90, 150. [Google Scholar] [CrossRef]
- Soumya, B.S.; Sekhar, M.; Riotte, J.; Audry, S.; Lagane, C.; Braun, J.-J. Inverse models to analyze the spatiotemporal variations of chemical weathering fluxes in a granito-gneissic watershed: Mule Hole, South India. Geoderma 2011, 165, 12–24. [Google Scholar] [CrossRef]
- Belkhiri, L.; Boudoukha, A.; Mouni, L.; Baouz, T. Application of multivariate statistical methods and inverse geochemical modeling for characterization of groundwater—A case study: Ain Azel plain (Algeria). Geoderma 2010, 159, 390–398. [Google Scholar] [CrossRef]
- Morán-Ramírez, J.; Ledesma-Ruiz, R.; Mahlknecht, J.; Ramos-Leal, J.A. Rock–water interactions and pollution processes in the volcanic aquifer system of Guadalajara, Mexico, using inverse geochemical modeling. Appl. Geochem. 2016, 68, 79–94. [Google Scholar] [CrossRef]
- Kumar, H.; Sarkar, A.; Singh, U.; Singh, N.; Jain, S.; Dutta, A. Water chemistry and estimation of local geochemical background values of elements in headwater streams of Ken–Betwa catchment of Yamuna River, India. Environ. Earth Sci. 2025, 84, 51. [Google Scholar] [CrossRef]


Disclaimer/Publisher’s Note: The statements, opinions and data contained in all publications are solely those of the individual author(s) and contributor(s) and not of MDPI and/or the editor(s). MDPI and/or the editor(s) disclaim responsibility for any injury to people or property resulting from any ideas, methods, instructions or products referred to in the content. |
© 2025 by the authors. Licensee MDPI, Basel, Switzerland. This article is an open access article distributed under the terms and conditions of the Creative Commons Attribution (CC BY) license (https://creativecommons.org/licenses/by/4.0/).