Article

Enhanced Nitrification of High-Ammonium Reject Water in Lab-Scale Sequencing Batch Reactors (SBRs)

Department of Process, Energy, and Environmental Technology, University of South-Eastern Norway (USN), 3918 Porsgrunn, Norway
*
Author to whom correspondence should be addressed.
Water 2025, 17(9), 1344; https://doi.org/10.3390/w17091344
Submission received: 13 March 2025 / Revised: 24 April 2025 / Accepted: 25 April 2025 / Published: 30 April 2025

Abstract

:
Dewatering anaerobic digested sludge leaves a liquid fraction known as reject water, a liquid organic fertilizer containing high amounts of ammonium nitrogen (NH4-N). However, its concentration should be enhanced to produce commercial fertilizer. Thus, reject water nitrification for stabilization as well as for nitrate capture in biochar to be used as a slow-release fertilizer is proposed. This study attempted to accomplish enhanced nitrification by tuning the operating parameters in two lab-scale sequential-batch reactors (SBRs), which were fed reject water (containing 520 ± 55 mg NH4-N/L). Sufficient alkalinity as per stoichiometric value was needed to maintain the pH and free nitrous acid (FNA) within the optimum range. A nitrogen loading rate (NLR) of 0.14 ± 0.01 kg/m3·d and 3.34 days hydraulic retention time (HRT) helped to achieved complete 100% nitrification in reactor 1 (R1) on day 61 and in reactor 2 (R2) on day 82. After a well-developed bacterial biomass, increasing the NH4-N concentration up to 750 ± 85 mg/L and NLR to 0.23 ± 0.03 kg/m3·d did not affect the nitrification process. Moreover, a feeding sequence once a day provided adequate contact time between nitrifying sludge and reject water, resulting in complete nitrification. It can be concluded that enhanced stable nitrification of reject water can be achieved with quick adjustment of loading, alkalinity, and HRT in SBRs.

Graphical Abstract

1. Introduction

Due to the energy crisis and an increase in global food demand, fertilizer prices are increasing, and the supply is limited coupled with environmental restrictions. Proper and effective nutrient utilization from wastewater is therefore becoming a good alternative. Moreover, the mismanagement of nutrients and its improper handling results in environmental pollution with redundant nitrogen (N) accumulation in soil and water bodies. Major environmental problems due to the release of untreated wastewater to open habitats are eutrophication, ammonia toxicity, soil and water acidification, greenhouse gases emissions, and ground level ozone [1]. Traditionally ammonium is not recovered but removed from wastewater by converting chemical-bound nitrogen into gas, mainly nitrous oxide (N2O) and nitrogen (N2). Nitrous oxide has strong global warming potential, creating a negative impact on the environment [2]. Thus, valuable nutrients are released into the atmosphere. The use of industrially produced fertilizers can be reduced by recycling nutrients obtained from domestic waste. This level of nutrient recycling can help meet the increasing global fertilizer demand and reduce or stabilize synthetic fertilizer prices [1].
Reject water, from the dewatering of anaerobically digested (AD) sludge, contains high ammonium concentration. Most digestors are fed protein-rich municipal organic waste. Protein metabolism results in the formation of ammonium [1]. Moreover, in AD, ammonium is also produced through additional nitrogen-rich organic compounds like urea and amino acids that cannot be further degraded without aerobic conditions [3]. This nitrogen nutrient from reject water needs to be recycled for sustainable nutrient recovery.
One recycling method might be the direct application of reject water as nitrogen fertilizer in small-scale farmlands. Most farmers considered it a good fertilizer because of its quicker nitrogen effect on crops than the raw manure. However, from a health perspective, direct application is restricted in many countries, as it contains heavy metals and other toxic substances that have adverse effects on human health. Moreover, it has not been appropriate for commercial purposes because of low nutrient concentrations, resulting in high transport and handling costs. In addition, the odor and color of reject water makes it unacceptable for public use due to its poor aesthetic quality [4].
Reject water nutrients can be concentrated by direct evaporation for commercial use, but the ammonium is unstable at pH 8.5 (and above) and higher temperatures. Le et al. [5] found that approximately 20% of the total ammonium concentration existed in a free ammonia form at an operating condition of pH 8.5 and a temperature of 30 °C [5]. Hence, most of the nutrients present as ammonium in reject water might be released as ammonia (NH3) gas [1]. It has been stated in the literature that 50% of the global NH3 loss per year (32 Tg/year) is coming from agricultural activities, in which chemical N fertilizer contributes 34% to NH3 emissions [6]. Another problem is the imbalance between the N fertilizer application to the soil and consumption by plants/crops. This leads to N leaching, which will eventually run off to the water bodies, causing eutrophication and groundwater pollution [7]. Therefore, recovery of nitrogen from the wastewater in a stable form and binding it with a good absorbent is necessary to reduce the NH3 emissions and nitrate leaching from the soil.
Biochar is a solid material with high carbon content produced from the pyrolysis of different types of biomasses under high temperatures in the absence of oxygen. Biochar can be produced from different sources such as plant waste, municipal sewage sludge, animal manures, and food waste. The type of feedstock and pyrolysis conditions influences the biochar physiochemical properties such as fine and rich porous morphology, high specific surface area, low solubility, strong ion exchange potential, high physical and chemical stability, and pH buffering capability. However, the low N contents of biochar, which are released as gases during the pyrolysis process, are a significant barrier to their application in agriculture. The nitrogen content of the resulting biochar decreases with increasing the pyrolysis temperature. Therefore, concentrated nitrate after enhanced reject water nitrification can help enrich biochar with sufficient N and can become a promising option in agriculture as a slow-release biofertilizer [8].
Functional groups present on the surface of the biochar are responsible for the absorption of nitrate [7]. Nitrate-enriched biochar may have a potential to be used as a slow-release fertilizer, which could prevent nitrate leaching from agroecosystems as well as decrease the global N-fertilizer demands [9]. Yuan et al. [10] reported that nitrogen-enriched biochar enhances the crops’ productivity by properly utilizing the nitrogen and making it available for longer periods of time, thereby increasing nitrogen use efficiency (NUE) [10]. Enhancement in crop productivity will encourage the use of biochar as an amendment in agriculture and strengthen the ideas of the circular economy and sustainable practices [8].
The first reasonable step for stabilizing nitrogen is through complete nitrification. Nitrification is a two-step biological oxidation of ammonium ( N H 4 + ) into nitrite ( N O 2 ) by ammonia-oxidizing bacteria (AOB) and then into nitrate ( N O 3 ) by nitrite-oxidizing bacteria (NOB) under aerobic conditions. These microbes are chemoautotrophs, relying on carbon dioxide (CO2)/bicarbonate (HCO3) as their carbon source, and obtain cellular energy by oxidizing inorganic compounds in the presence of dissolved oxygen [11]. The converted nitrate remains stable in the soil and acts as a good nutrient source for lower and higher plants [1].
Reject water has a very high ammonium concentration, usually ranging from 500 to 1500 mgNH4-N/L, which makes it difficult for efficient nitrogen removal in wastewater treatment plants (WWTPs) [12]. The reject water is circulated back to the treatment process, which elevates the ammonium level in the plant, resulting in poor ammonium removal efficiency [12,13]. Due to this problem, many WWTPs are facing challenges to meet the wastewater discharge quality and are required to upgrade the technology to meet the regulations set by the revised European union (EU) urban wastewater treatment Directive (EU) 2024/3019 [14]. While many studies have focused on efficient nitrogen removal, nitrogen recovery from reject water (containing high ammonium levels) through complete nitrification is still underexplored. In particular, the effect of different operating parameters on the high-ammonium reject water nitrification during the startup phase and long-term stable operation need to be further investigated.
The aim of this study is to perform a stable nitrification of reject water containing high levels of ammonium using a suspended growth process in two lab-scale sequencing batch reactors (SBRs) by investigating and tuning the different operating parameters. This study examinates the effect of different nitrogen loading rates (NLRs), feeding sequences, alkalinity concentrations, pH values, and HRT conditions for efficient and complete nitrification of reject water to be used for biochar impregnation as a slow-release nitrate in soil amendment. It also analyzes the effect of pH on free nitrous acid (FNA) and free ammonia (FA) concentration, which also impact the overall nitrification process [15]. This study will not only contribute to the circular economy through nitrogen recovery but also plays a role in achieving sustainable development goals (SDGs) numbers 6, 12, and 13 of the 2030 agenda, which state clean water and sanitation, responsible consumption and production, and climate action [16].

2. Materials and Methods

2.1. Reject Water Chemical Characteristics

Reject water is produced after dewatering anaerobically digested sludge from the full-scale municipal WWTP (Knarrdalstrand, Telemark, Porsgrunn, Norway). This reject water contains 520 ± 55 mg/L of ammonium nitrogen (NH4-N) and was used as a feed for the experiments performed in this study. The characteristics and constituents of the reject water are given in Table 1.
In addition to the reject water, this study also tested synthetic feed to see the effect of the carbon-to-nitrogen ratio (C/N) in the nitrification process. Ammonium chloride (NH4Cl) and sodium bicarbonate (NaHCO3) were used to provide ammonium concentration and adequate alkalinity for the nitrification. Tap water was used to prepare the synthetic feed solution. Vitamin and mineral solutions at a rate of 1 mL/L of synthetic feed were provided to promote bacterial growth. Table 2 represents the ingredients of these vitamins and minerals [17]. The concentration of NH4-N in both reject water and synthetic feed was kept at the same level.

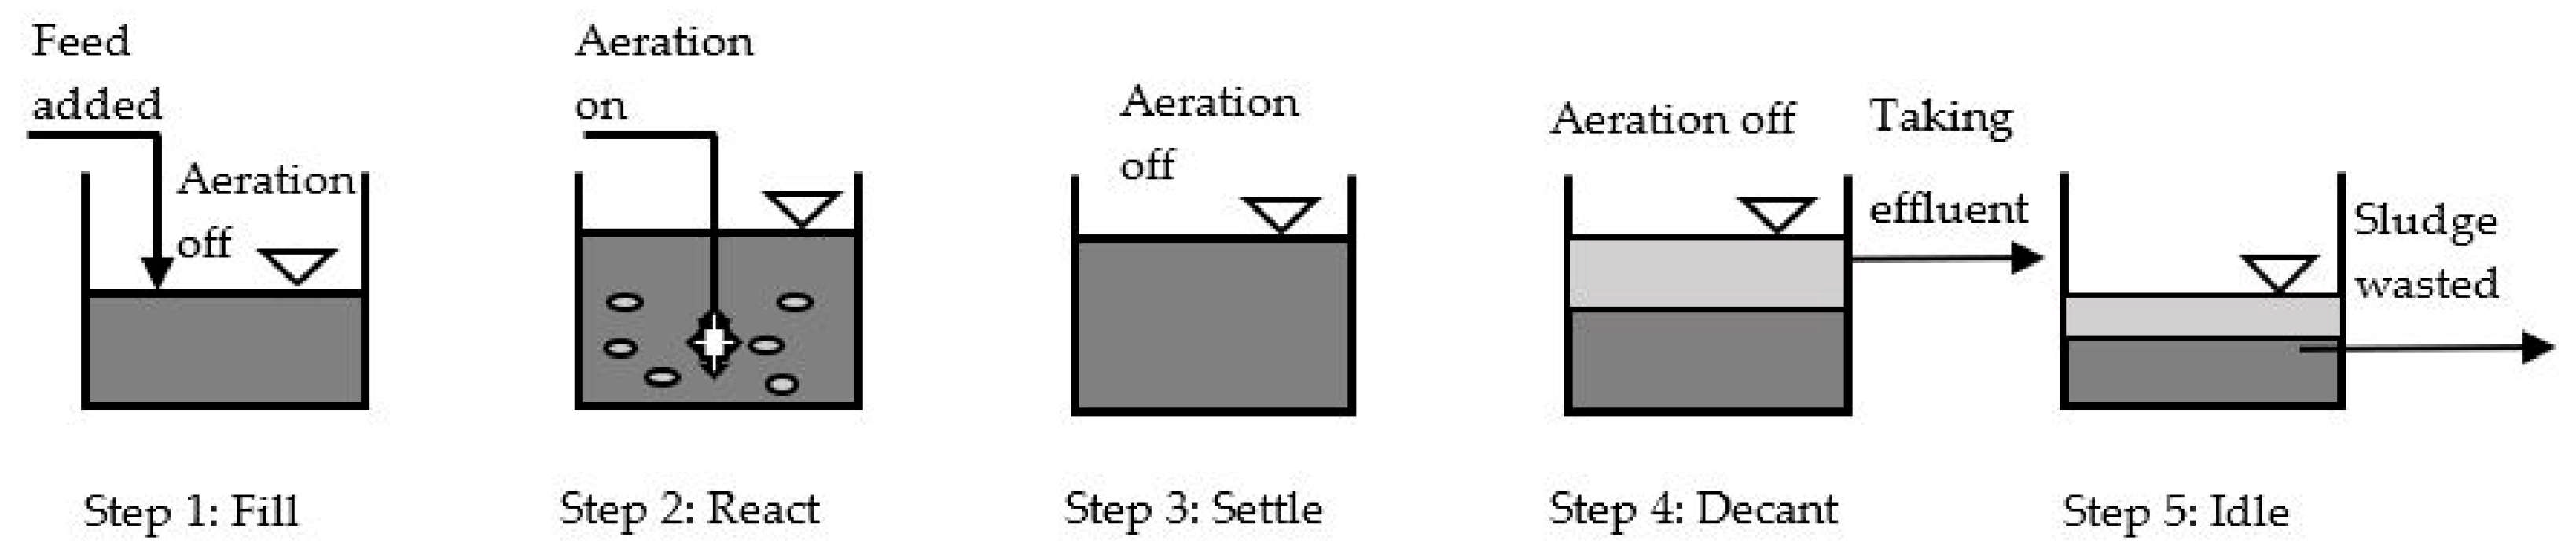
2.2. Nitrification Reactor Configuration and Operating Principle

Two laboratory-scale nitrification reactors noted as R1 and R2 were set up as a sequential batch reactor (SBR) as shown in Figure 1. The design specifications of SBRs are presented in Table 3.
As can be seen in Figure 1, aeration supply, feeding, and collecting samples were done with the help of three Tygon® tubes. The aeration and feeding tubes goes all the way to the bottom of the reactors, whereas the sampling tube was placed only up to the halfway point to avoid flushing out sludge during operation. The flow of the tube was controlled with plastic tubing adjustable clamps. A rubber stopper at the top of the reactor served as a cap to prevent the liquid overflow. Aeration was supplied through an air compressor and controlled at a constant rate of 25 L/h with an airflow meter throughout the experimental period, which ensured proper mixing and adequate dissolved oxygen (DO) inside the reactors. The used inoculum was obtained from a biological WWTP in Risør, Norway, which was basically a mixture of aerobic and anaerobic culture. Inoculum contributed one-third (1/3) of the reactors’ volume, whereas the rest of the working volume was filled with reject water. Seventy percent of the total reactors’ volume was used as the working volume. The feeding rate to the reactors varies from 10% to 30% of the working volume depending upon the performance of the reactors. Different feeding sequences were tried (i.e., one, two, and three times per day) to investigate and tune the optimum operating condition in the reactors.
The fundamental operating principle of SBR is well depicted by the schematic diagram in Figure 2. The first step is the fill step, where the substrate is added to the reactor either with aeration ON or OFF, which depends upon the requirement to grow specific types of bacterial biomass. In this study, static fill was used to maintain the high food-to-microorganisms (F:M) ratio, which is suitable for floc-forming bacteria, improving the sludge settling characteristics. The second step is the react phase, where aeration is provided for adequate DO and mixing inside the reactor. In this phase, microorganisms react with the influent wastewater and carry out the respective task. The third step is the settle step, where aeration is turned off for the separation of solid particles. The fourth step is decant to withdraw the supernatant liquid from the reactor, and the final step is the idle step, which is the stage between withdraw and fill. It is used for removing the excess sludge. However, sludge removal is not frequent in SBR and is generally done once every 2 to 3 months [18].

2.3. Operation of Reactors

At the beginning (0th day) of this study, in both reactors, the feeding rate was only 20% of the working volume, the feeding sequence was three times per day, HRT was 1.67 days, NLR was 0.33 kg/m3·d, and the concentration of alkalinity was 1920 mgCaCO3/L. Both reactors were fed with reject water until day 30. From day 31, R2 feed was changed to synthetic feed. The aeration flow rate was constant for the whole period at 25 L/h, and the reactors’ temperature was 18 ± 2 °C. Table 4 includes the operating conditions applied to different phases of the operation period.

2.4. Analytical Procedures

Wastewater sample analyses were performed usually twice a week, and sampling was carried out during feeding time. Sample analyses for obtaining N H 4 + , N O 2 , N O 3 , and alkalinity concentrations were performed using spectrophotometric methods (Spectroquant®), which are analogous to the APHA standard methods for examination of water and wastewater [19]. The Spectroquant® catalog numbers used for the measurement of N H 4 + , N O 2 , N O 3 , and alkalinity were 53, 197, 30, and 208, respectively [20]. Dissolved oxygen (DO) and temperature were measured using a WTW Oxi 3310 oxygen meter (Weilheim, Germany). A Beckman-390 pH meter was used to measure the pH.
Ammonium removal efficiency (ARE) and nitrogen transformations were estimated based on the expressions given in Equations (1)–(3). Free ammonia (FA), free nitrous acid (FNA), nitrogen loading rate (NLR), and hydraulic retention time (HRT) were calculated based on Equations (4)–(9) [11,15].
Ammonium removal efficiency   ( A R E )   [ % ]   =   C N H 4 N , i n C N H 4 N , o u t C N H 4 N , i n × 100
N i t r i t e   a c c u m u l a t i o n   r a t e   ( N A R )   [ % ]   =   C N O 2 N , o u t C N O 2 N , i n C N H 4 N , i n C N H 4 N , o u t × 100
N i t r a t e   p r o d u c t i o n   r a t e   ( N P R )   [ % ]   =   C N O 3 N , o u t C N O 3 N , i n C N H 4 N , i n C N H 4 N , o u t × 100
F A   ( m g / L ) =   17 14 × C N H 4 N , i n ( m g / L ) × 10 p H k b k w   + 10 p H
k b k w = e ( 6344 / 273 + ° C )
F N A   ( m g / L ) = 46 14 × C N O 2 N , o u t ( m g / L ) k a × 10 p H
k a = e ( 2300 / 273 + ° C )
N L R   ( k g / m 3 d a y ) = C N H 4 N , i n ( m g / L ) H R T ( d a y s ) 1000
H R T   d a y s = V ( L ) Q ( L / d a y )
where C N H 4 N , i n = inlet ammonium nitrogen (NH4-N) concentration [mg/L], C N H 4 N , o u t = outlet ammonium nitrogen concentration [mg/L], C N O 2 N , i n = inlet nitrite nitrogen (NO2-N) concentration [mg/L], C N O 2 N , o u t = outlet nitrite nitrogen concentration [mg/L], C N O 3 N , i n = inlet nitrate nitrogen (NO3-N) concentration [mg/L], C N O 3 N , o u t = outlet nitrate nitrogen concentration [mg/L], k b = ionization constant of the ammonium equilibrium equation, k w = ionization constant of water, k a = ionization constant of the nitrous acid equilibrium equation, V = working volume of the reactor [L], and Q = feeding or discharge rate [L/day].

2.5. Data Analysis

Interpretation of data (i.e., data processing, calculation, and plotting graphs), obtained from the chemical analysis of wastewater samples, was done with the use of Microsoft Excel. The average values were used for the comparison between different time periods. Nitrogen mass balance was done to calculate the nitrogen gas. Standard deviation was calculated to measure the variability of data values. Moreover, correlation analysis was done to analyze the dependencies between the parameters. For data points representing very short periods of time (1 week or less), 10% standard deviation is assumed due to limited data measurements to represent expected variation. If there are no error bars in the bar graph, that means that their standard deviation was zero.

3. Results and Discussion

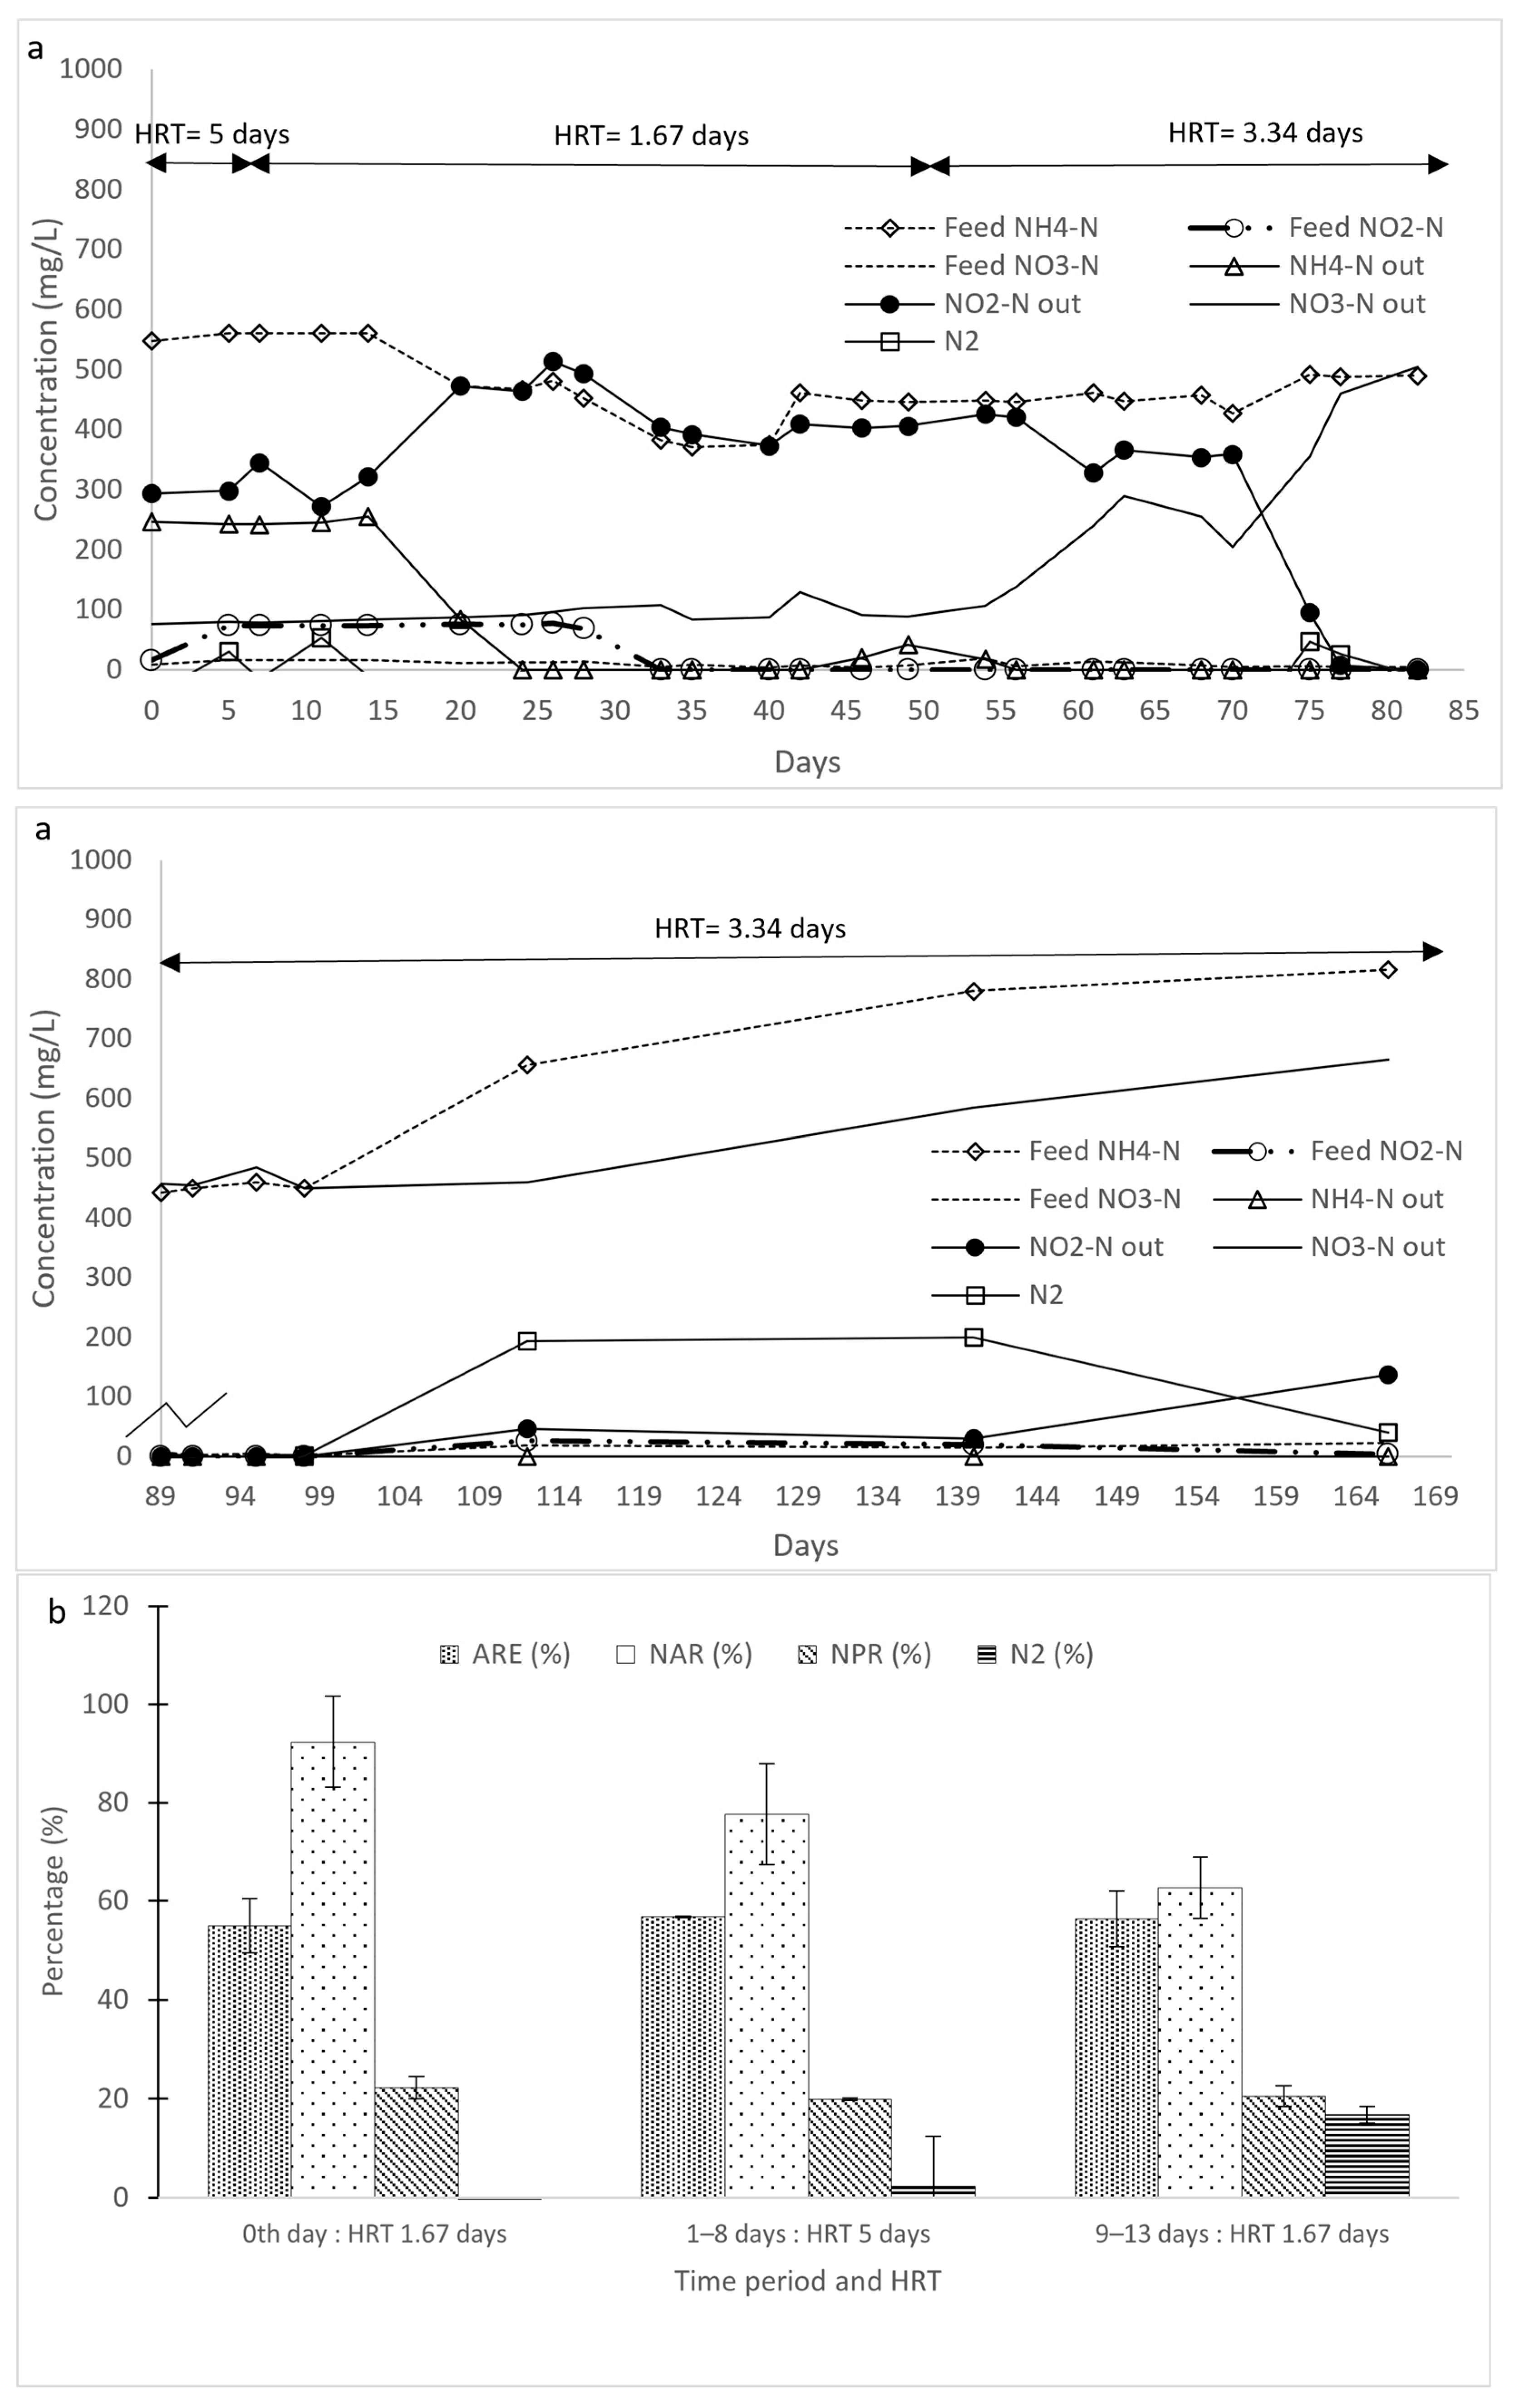
3.1. Initial Ammonium Transformation in Reactors R1 and R2

At the beginning (0th day) of this study, the reactors were in operating conditions of NLR 0.33 kg/m3·d, HRT 1.67 days, feeding rate 20% of working volume, and feeding sequence three times a day (Table 4).
On day 0, as shown in Figure 3a, the influent NH4-N, NO2-N, and NO3-N concentrations of R1 were 548, 16, and 9 mg/L, whereas the effluent NH4-N, NO2-N, and NO3-N concentrations were 235, 346, and 83 mg/L, respectively. From the nitrogen mass balance, it is shown that there was no production of nitrogen gas on the 0th day. Furthermore, in Figure 3b, it is shown that ARE in R1 was 57 ± 5.7%, whereas NAR was 105 ± 10.5%, and NPR was 24 ± 2.4%. The total nitrogen transformation greater than 100% might be due to minor instrumental error or dead biomass cells contributing to extra nitrogen. Overall, in R1, it can be noticed that there was a significant amount of nitrite accumulation inside the reactor at the startup of the experimental period.
Moreover, in Figure 4a, on day 0, it can be seen that with similar influent concentration as the R1, the effluent NH4-N, NO2-N, and NO3-N concentrations in R2 were 247, 294, and 76 mg/L, respectively. From the nitrogen mass balance, there was no production of N2 gas in R2 either during the startup. Moreover, on day 0, the ARE in R2 was 55 ± 5.5%, whereas the NAR was 92 ± 9.2%, and the NPR was 22 ± 2.2% (Figure 4b). Like in R1, there was a significant amount of nitrite accumulation in R2 at the beginning.
In both reactors, R1 and R2, similar ammonium transformations were observed during the startup period (0–13 days). Only 55% of the ammonium present in the reject water was converted, mostly to nitrite, resulting in its accumulation in the reactors (Figure 3b and Figure 4b). As the nitrification begins, the conversion of ammonium to nitrite generates hydrogen ions (H+), thus decreasing pH [5]. The pH was between 6 and 6.5 for 0–13 days, which elevated the FNA level, resulting in low ARE and high nitrite accumulation in the reactors [15]. Moreover, at the initial stage, the nitrifying population might be low, resulting in lower nitrification rates, as seen in this study [5]. Denitrification activity, seen at an early stage (1–13 days) through minor production of nitrogen gas (10%), might be due to the fact that nitrifying bacteria takes a longer period for enrichment due to slow growth [21]. In addition, in the later stage (112–140 days) in R2, when the feed was changed back to reject water, 20% nitrogen gas production (Figure 4a) was seen, which might be due to the presence of active heterotrophic bacteria in the reject water [22]. However, no denitrification activity was seen in other stages, which indicates complete inhibition of denitrifying bacteria and enrichment of the nitrifying community. Moreover, DO higher than 0.5 mg/L completely inhibits denitrification [23]. In this study, DO level was maintained well above this threshold.

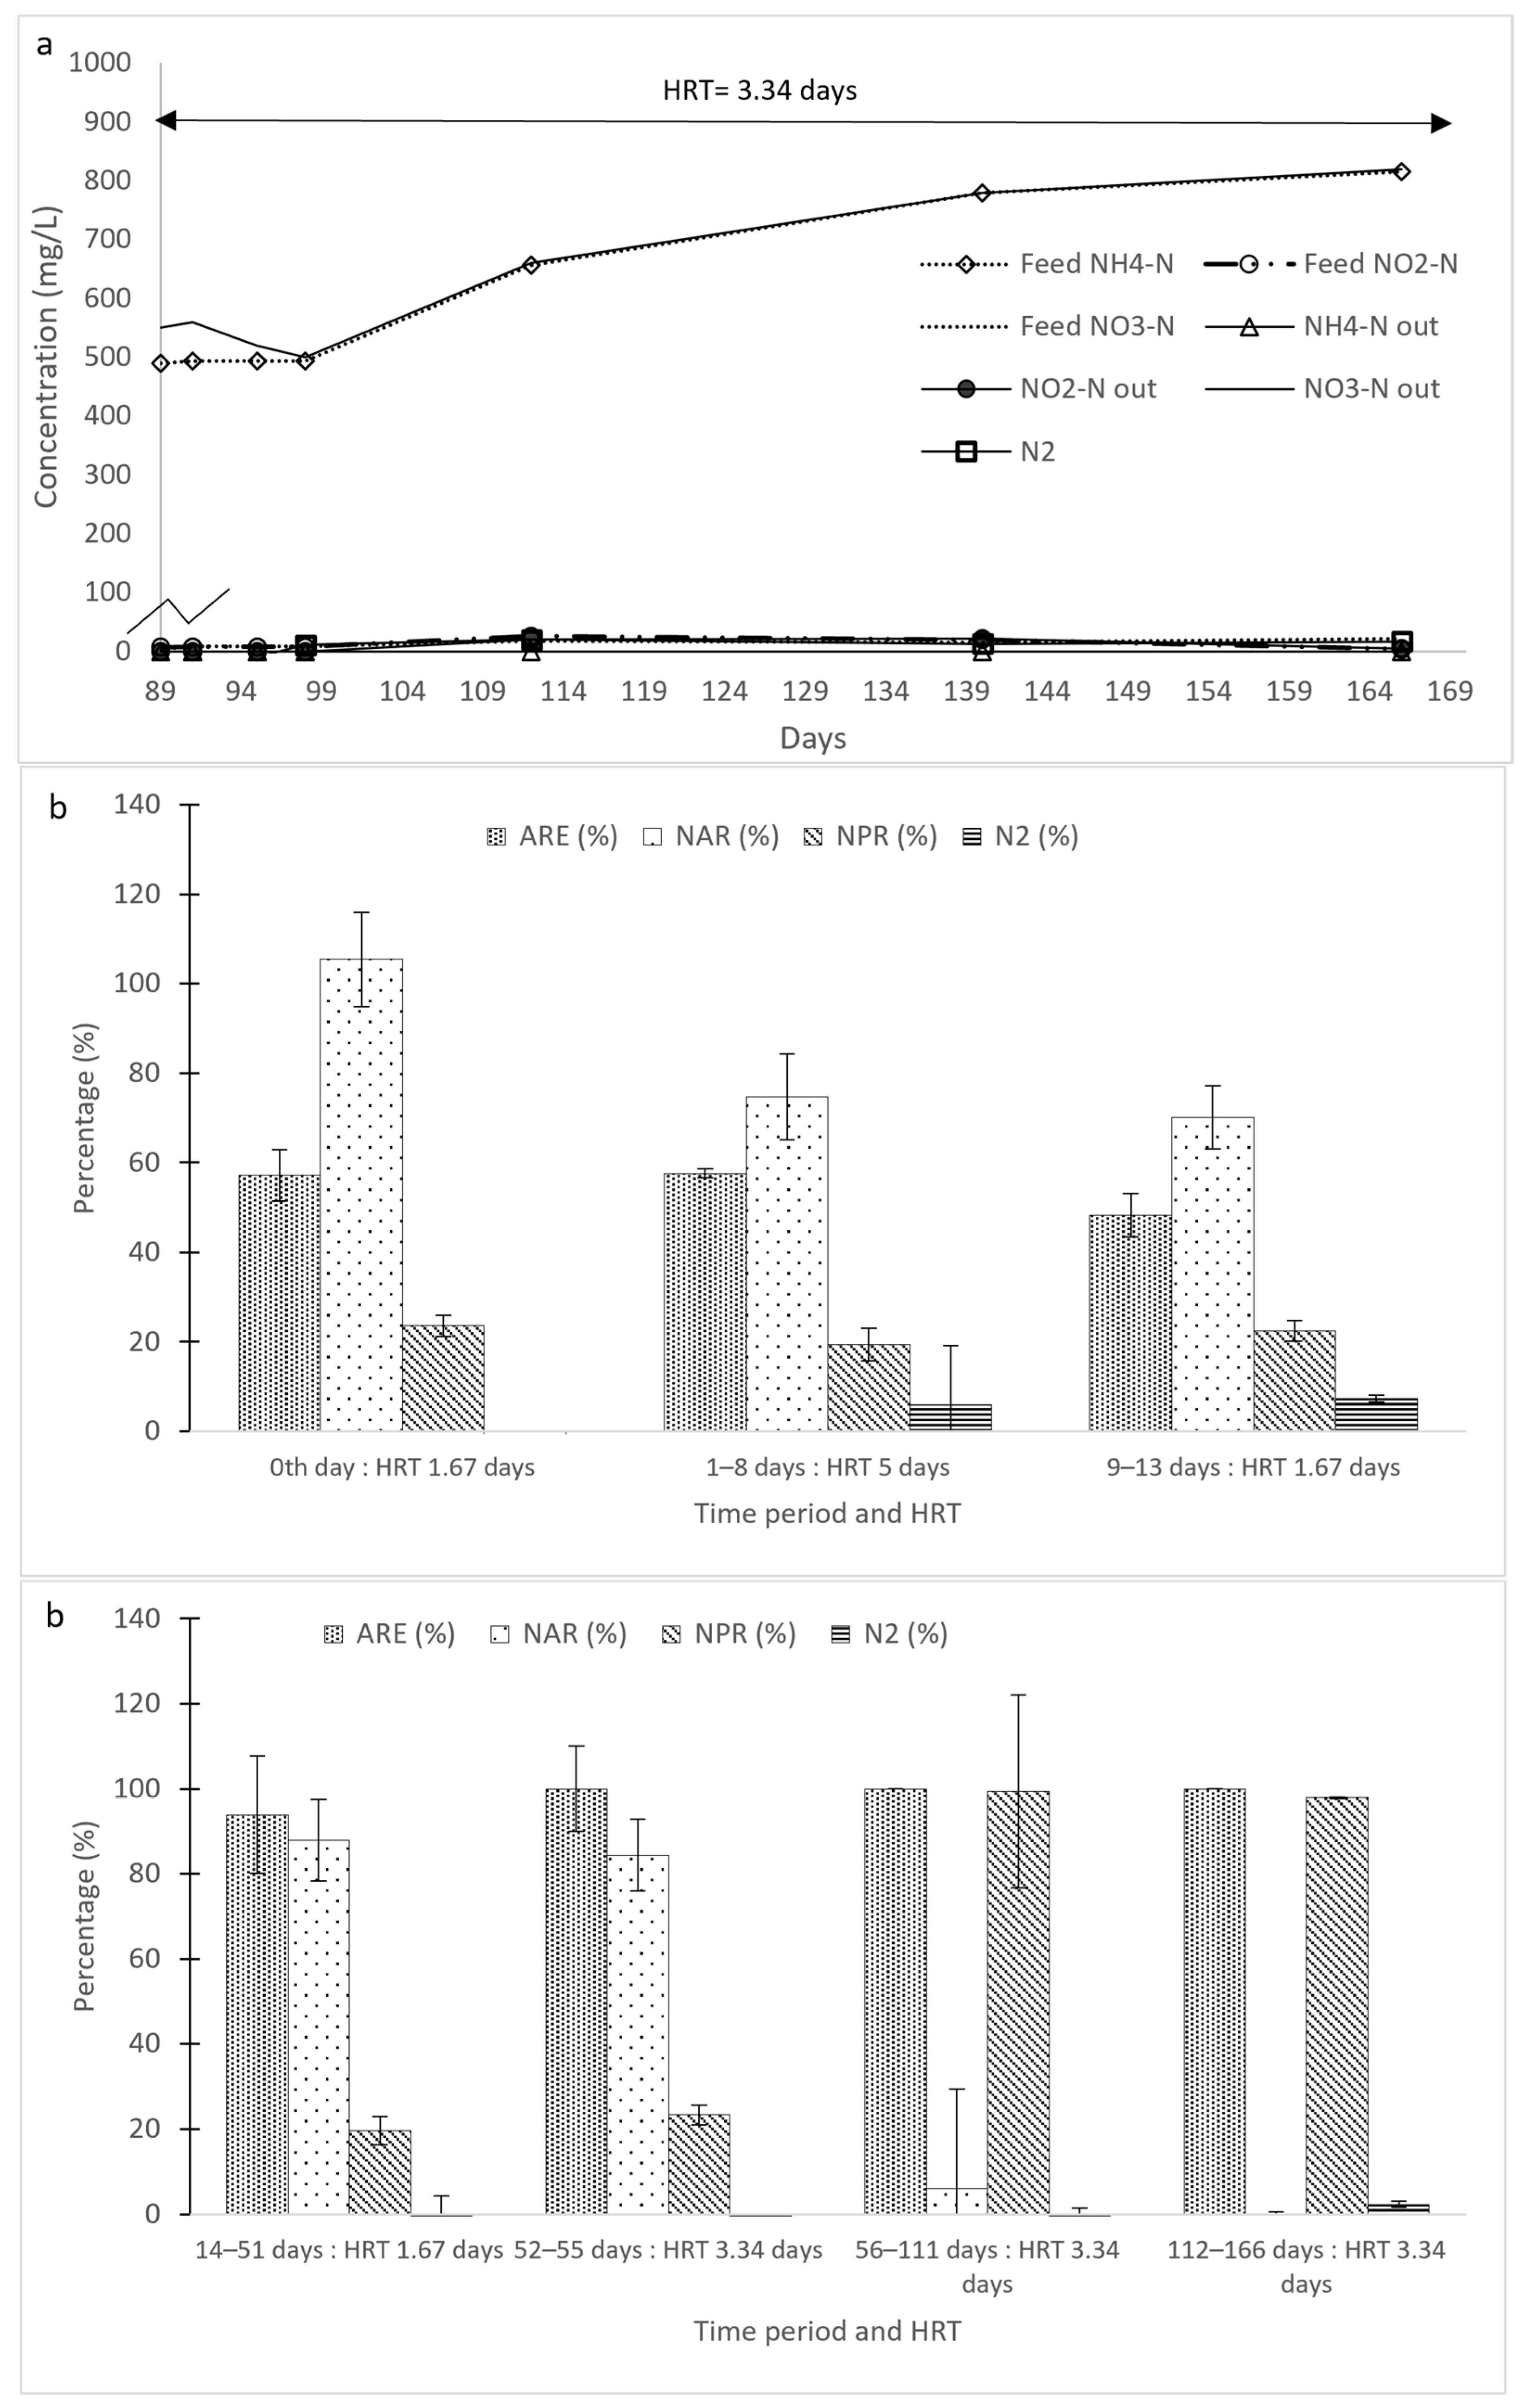
3.2. Change in Operational Conditions in Reactors R1 and R2

3.2.1. Effect of NLR Reduction

There are several factors contributing to nitrite accumulation inside the reactors in the initial phase of the operation. Several studies have shown that low dissolved oxygen (DO) could result in nitrite accumulation due to lower oxygen affinity of NOB [24]. When there is low dissolved oxygen, the rate of ammonium oxidation might be higher than the rate of nitrite oxidation [25]. However, in this study, DO was high (close to 9 mg/L) for both reactors. Hence, DO was not the main factor for the nitrite accumulation. Yusof et al. [26] summarized that increased ammonia load influences nitrite accumulation due to the faster growth of AOB. In addition, high NLR provides more ammonium inside the reactor, creating favorable conditions for nitrite accumulation [26]. Statistical correlation analysis (Figure 5) in this study also shows a strong positive correlation between NLR and NAR in R1, which means that increased NLR resulted in a corresponding increase in NAR and vice versa. Zhang et al. [24] reported that NLR of 0.25 kg/m3·d resulted in 82.2% ARE, and complete nitrification was observed in a shorter period. However, he observed that when the NLR was increased to 0.40 kg/m3·d, it showed short-term accumulation of nitrite, and further increase in NLR to 0.6 kg/m3·d resulted in 90% NAR [24]. Hence, in this study, the startup of the reactors at an NLR of 0.33 kg/m3·d was considered high NLR and thus reduced to 0.11 ± 0.01 kg/m3·d in both reactors for the period of eight days. However, despite decreasing the NLR, no difference in the results was seen, and the nitrite accumulation was still high in both R1 and R2 (Figure 3b and Figure 4b).

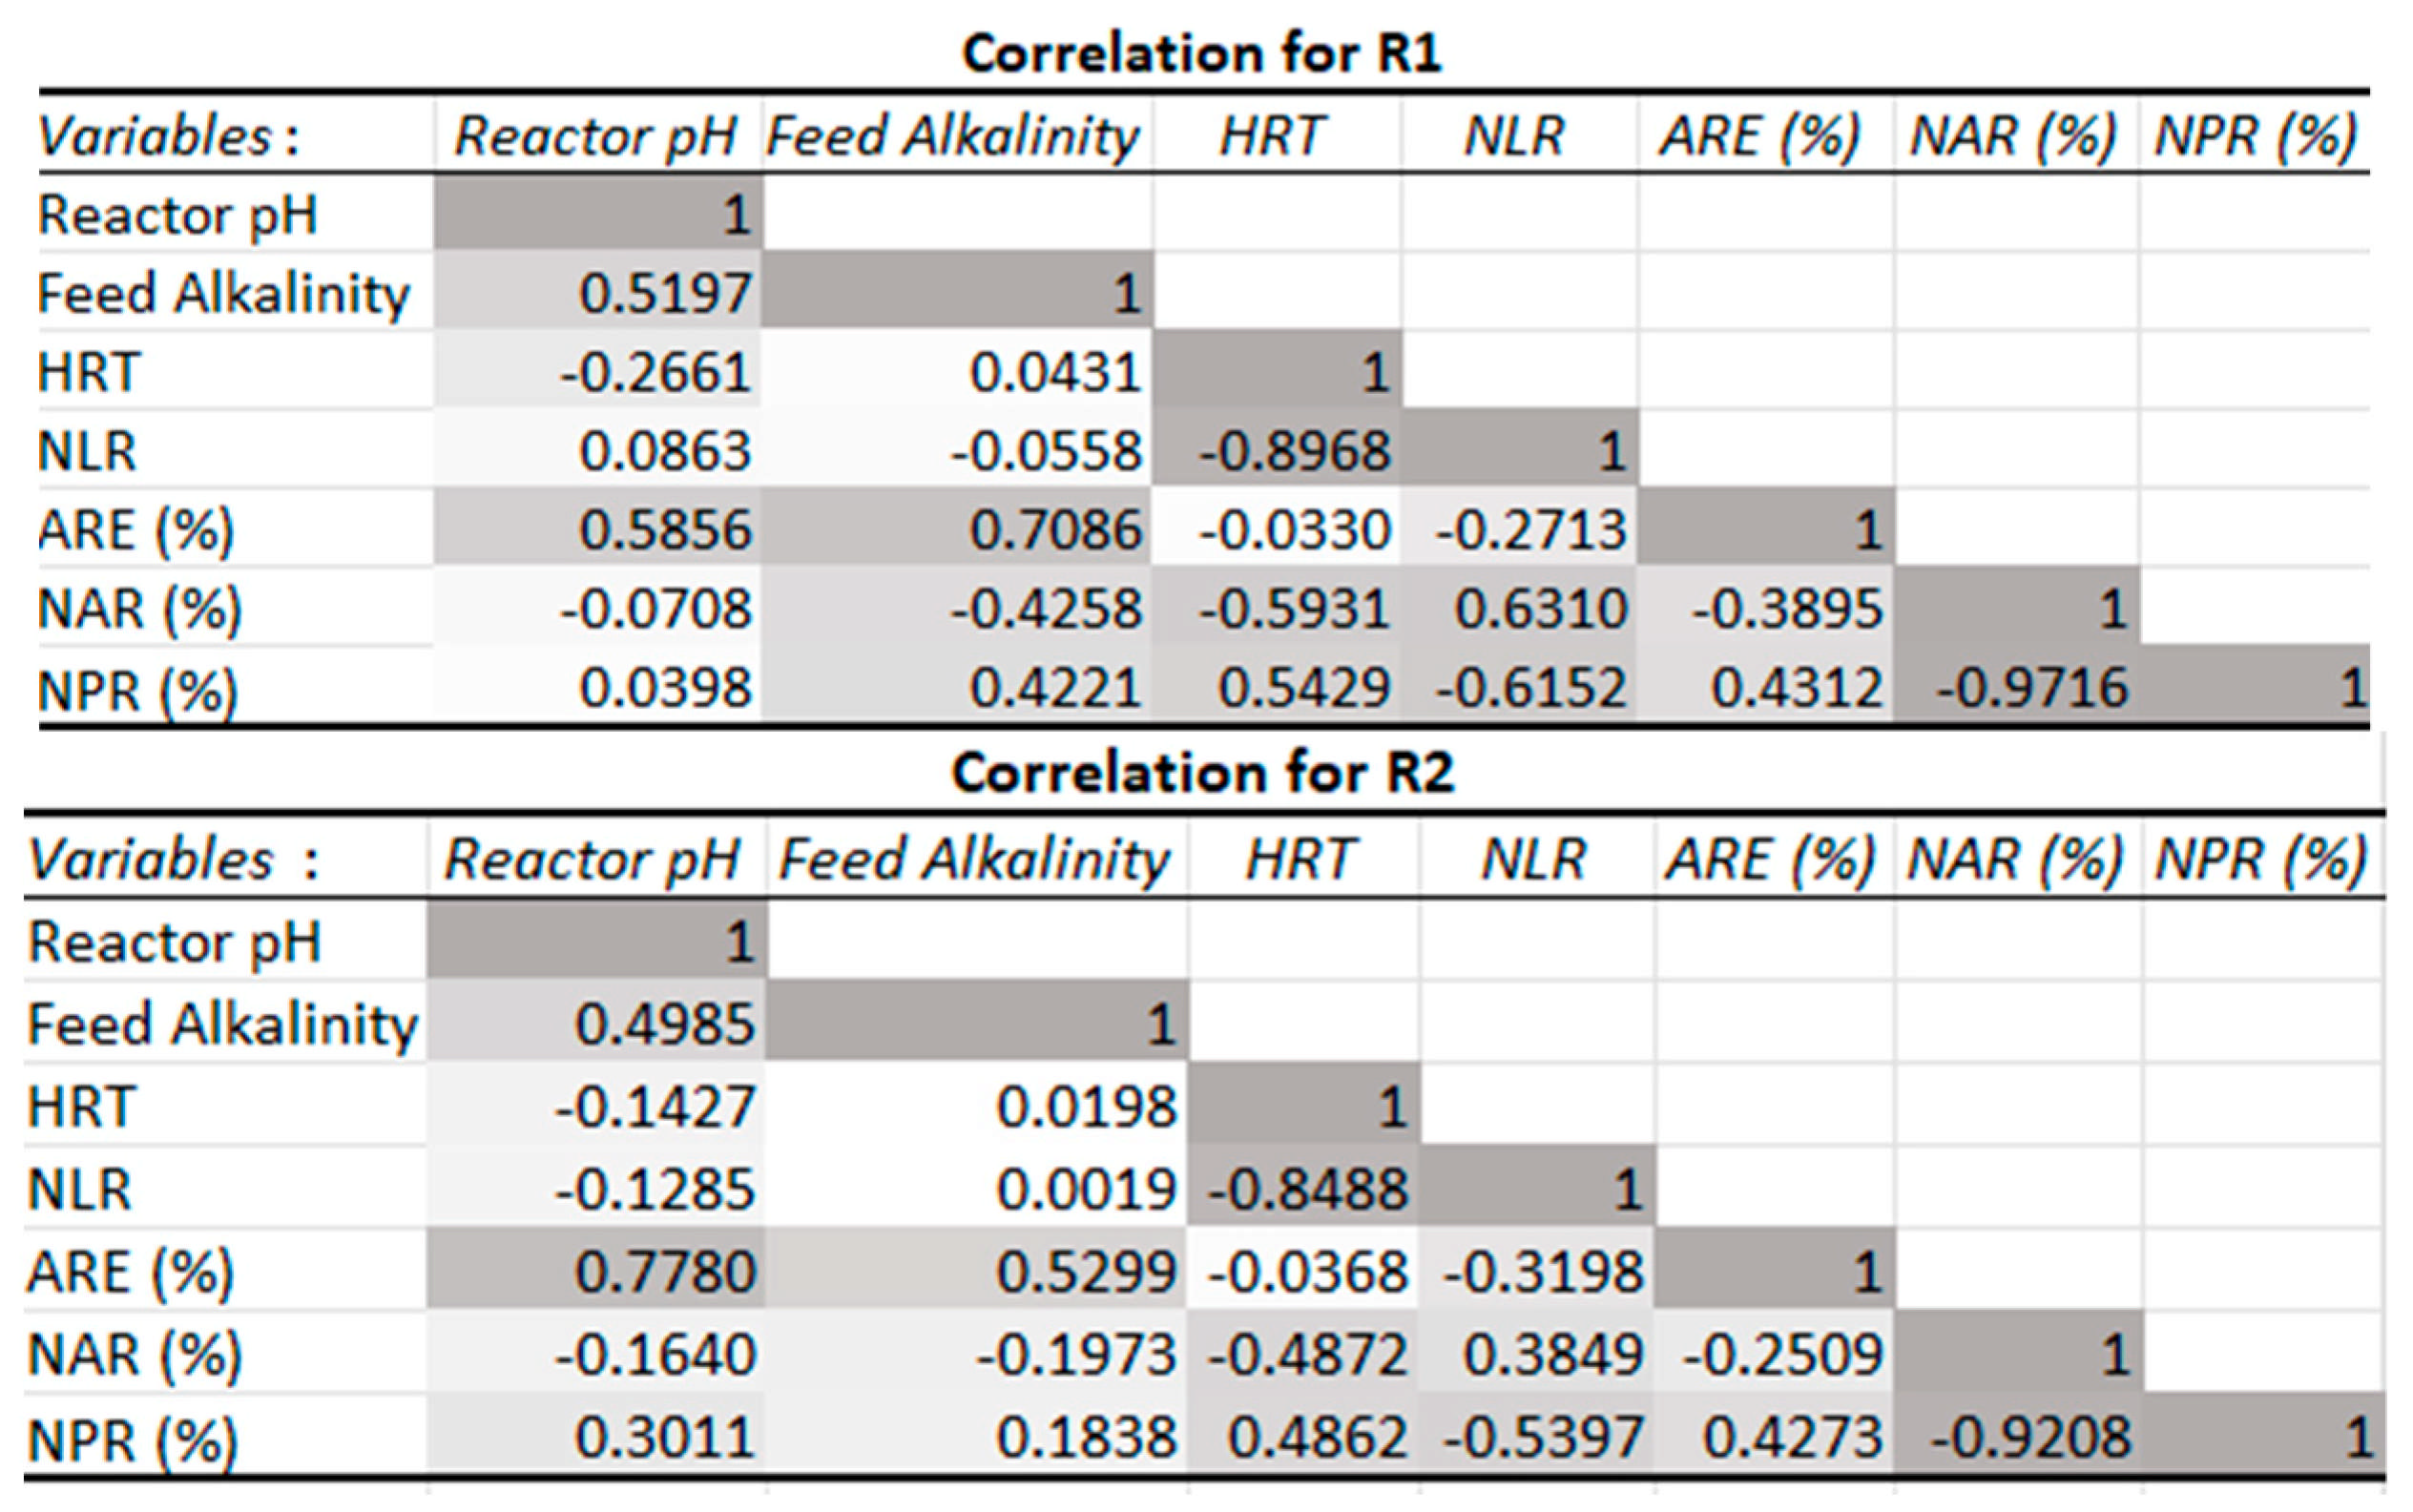
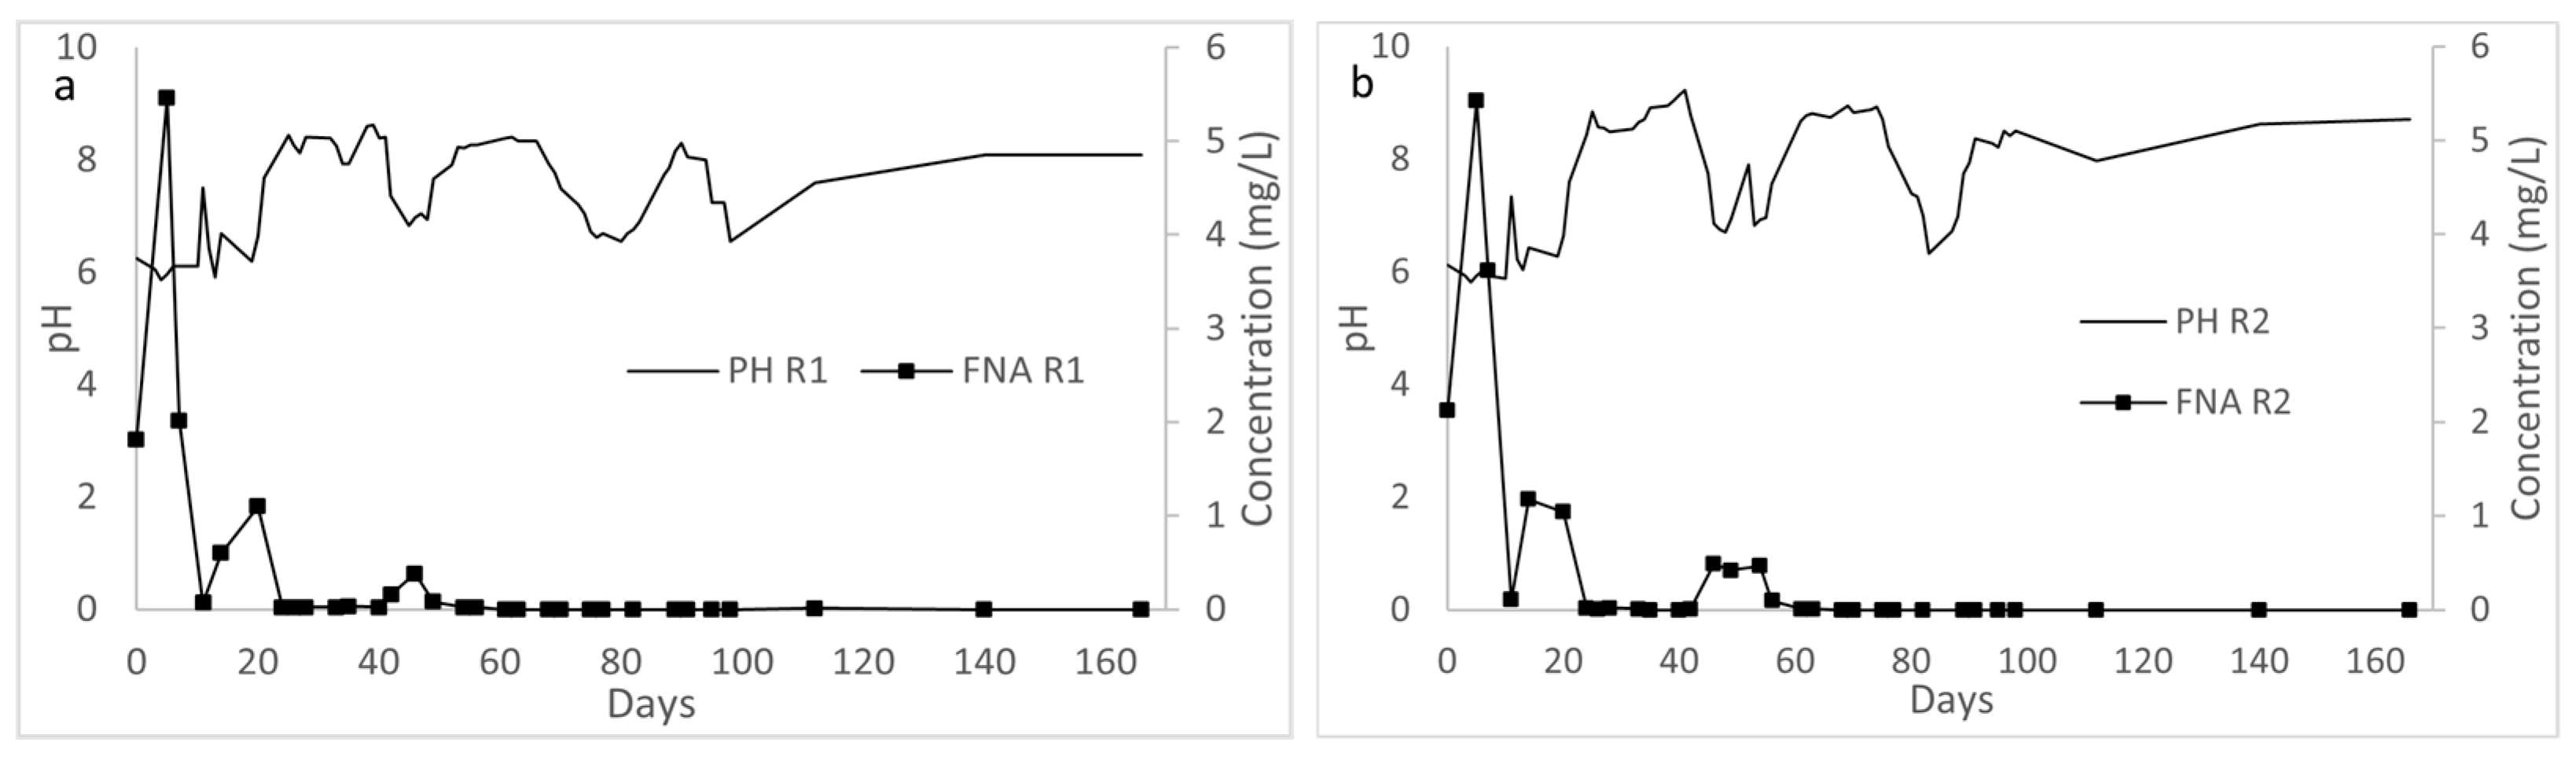
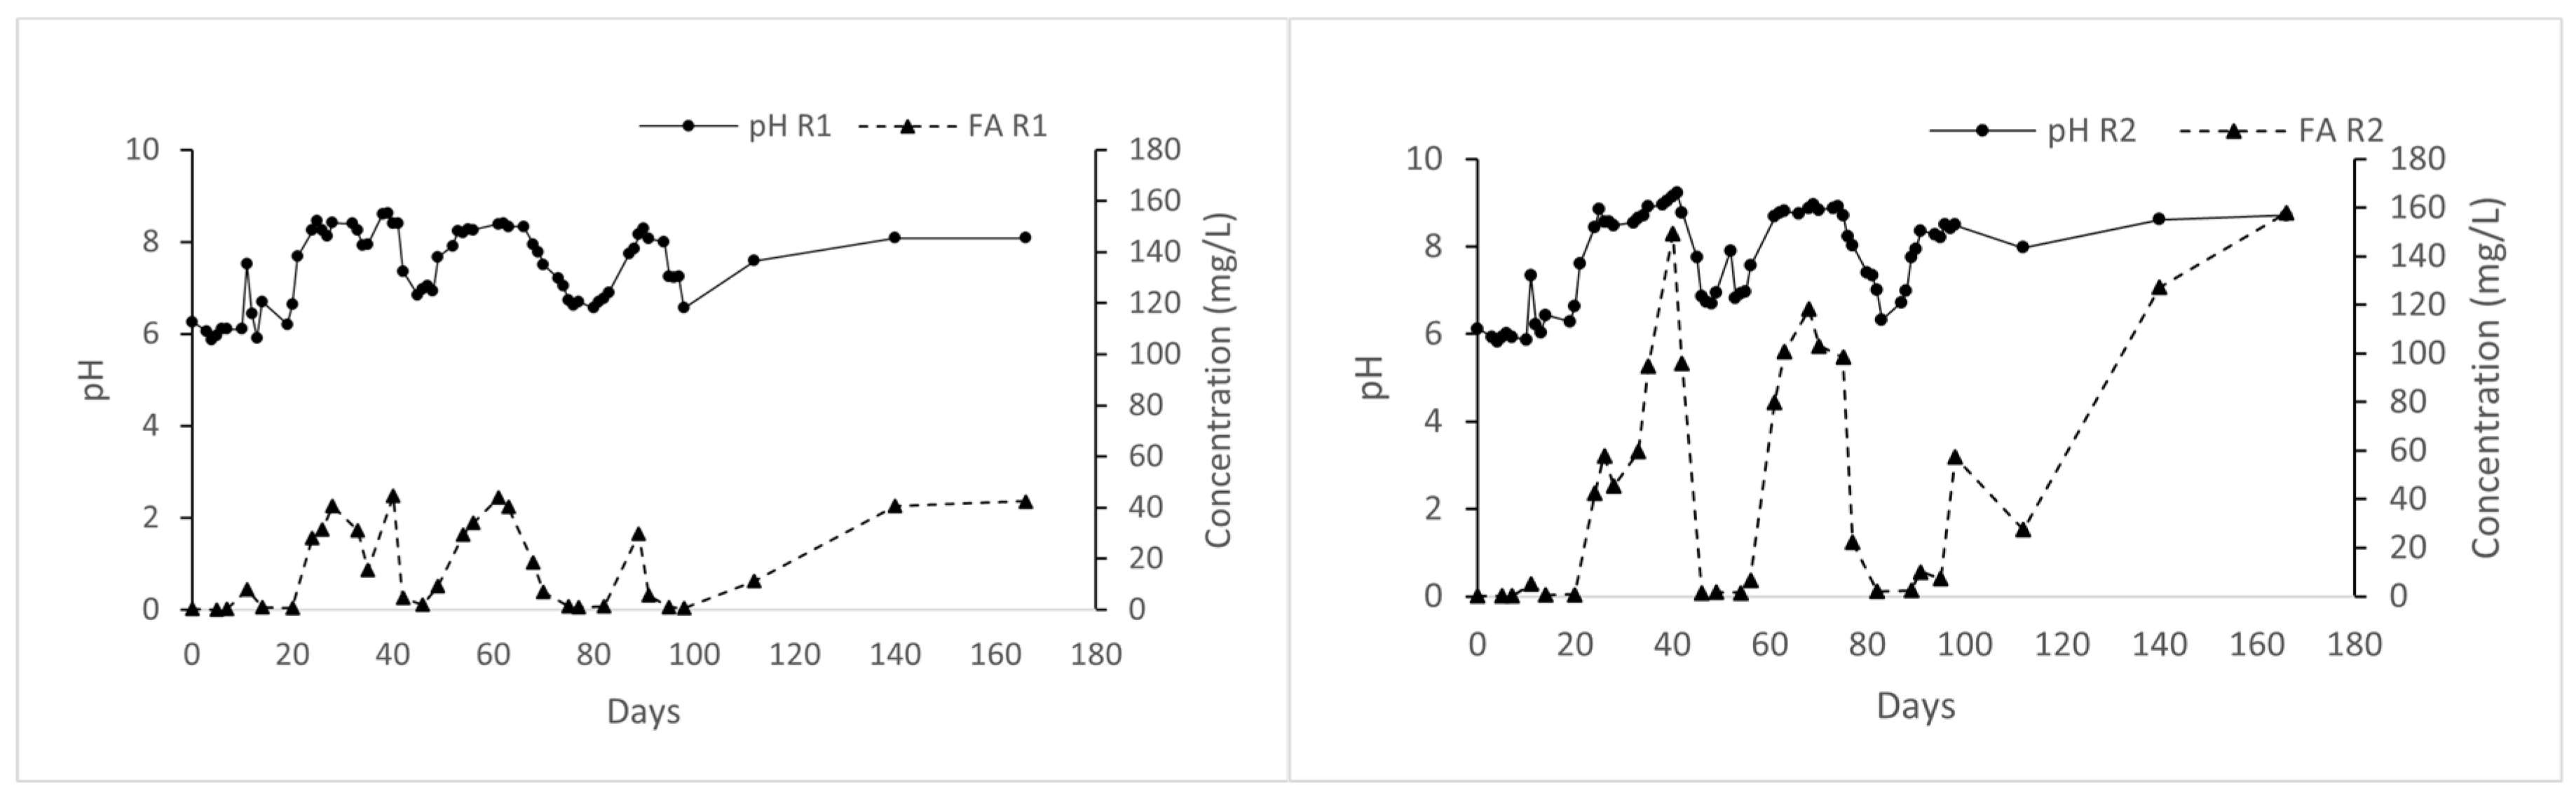
3.2.2. Effect of pH and Alkalinity Concentration

Since nitrite accumulation was observed even when the NLR decreased to 0.11 ± 0.01 kg/m3·d, the NLR was adjusted back to 0.34 ± 0.03 kg/m3·d during the period of 9–13 days to recover the initial performance of the reactors. However, only 48 ± 4.8% ARE in R1 was observed, which was lower when compared to the initial phase. This can be mainly due to the fact that the microorganisms takes time to adapt to the alteration in environmental conditions over a very short period of time [24]. The average pH during these periods (i.e., day 1 to day 13) (Figure 6) was around 6 in R1 and R2, except on day 11. The pH was 7.5 in R1 and 7.3 in R2 on day 11 because it was measured just after the fill stage. The average FNA during the same period was around 2 mg/L in R1 and 3 mg/L in R2, except on day 5, it was 5.4 mg/L in both reactors due to the drop in pH below 6. This is because as the nitrification begins, N H 4 + is oxidized to N O 2 (Equation (10)), which generates H + , resulting in decreased pH to an extent depending upon the buffering capacity of the biological system. The resulting nitrite will be in equilibrium with its unionized form, FNA (Equation (11)). A further drop in pH elevates the concentration of FNA, which will significantly impact the activity of both Nitrosomonas (AOB) and Nitrobacter (NOB) bacterial biomasses [15]. The optimal pH for Nitrosomonas ranges from 7.0 to 8.0, whereas Nitrobacter has an optimum pH range between 7.5 to 8.0 [27]. Meanwhile, the concentration of FNA ranging from 0.22 to 2.8 mg/L significantly inhibits both of these nitrifying microorganisms [15]. In this study, during the period between the start of the experiment until day 13, pH was not at the required optimum range. On top of that, FNA was in the range in both reactors that potentially inhibited the nitrification process and resulted in nitrite accumulation even though the NLR was reduced during the period of 1–8 days.
2 N H 4 + + 3 O 2 A O B 2 N O 2 + 4 H + + 2 H 2 O
H + + N O 2 H N O 2
Looking at the pH and FNA trends (Figure 6), it can be concluded that the available alkalinity (1980 ± 200 mg CaCO3/L) in the time period (1–13 day) was not enough to counteract the hydrogen ions produced during the nitrification process. An amount of 7.14 g of alkalinity (as CaCO3 equivalent, i.e., 2 × (50g CaCO3/eq)/14) is required to oxidize 1 g of ammonium nitrogen during the nitrification process [11]. Hence, when compared to the NH4-N concentration (560 ± 55 mg/L) present in the reject water during the 1–13 days period, the alkalinity present was only around half of the needed stoichiometric value. Moreover, carbonate alkalinity not only neutralizes the hydrogen ions produced during nitrification but also provides inorganic carbon necessary for cellular synthesis and nitrifying microbial growth [28]. Hence, alkalinity in terms of sodium bicarbonate (NaHCO3) was added in the reject water on day 18 to enhance nitrification and maintain the pH level as per the stoichiometric value. After the addition of alkalinity in the form of sodium bicarbonate (NaHCO3), the pH was recovered and was between 7.5 and 8.5 in both reactors. The FNA concentration decreased below 1 mg/L and became almost 0 mg/L after day 23 (Figure 6). The correlation analysis (Figure 5) also shows that there is a strong positive correlation between feed alkalinity and ARE, which means that an increase in feed alkalinity resulted in improved ARE and vice versa. Hence, the ARE increased to 94 ± 13.8% in R1 and 93 ± 14% in R2. The NAR increased to 88 ± 9.6% in R1 and 95 ± 8.5% in R2, behaving as partial nitrification after the addition of alkalinity (Figure 3b and Figure 4b).

3.2.3. Chemical Oxygen Demand-to-Nitrogen (COD/N) Ratio

From day 31, synthetic feed was given to R2 after partial nitrification to study the effect of COD/N ratio in the nitrification process. Reject water used in this study contained a COD/N ratio around 4. A high COD/N ratio supports the growth of heterotrophic bacteria due to the presence of adequate carbon in the wastewater, which can rapidly outcompete autotrophic bacteria, reducing nitrification efficiency, whereas a low COD/N value limits carbon availability, restricting the growth of heterotrophic bacteria [29]. Phanwilai et al. [30], in their study, found that a COD/N ratio of 4 creates carbon source limitation, increasing autotrophic bacteria activity [30]. In this study, partial nitrification was still going on even after the change in feed to synthetic in R2 from day 31. Hence, this leads to the conclusion that the COD/N value of 4 was not the problem for nitrification in this study.

3.2.4. Combined Effect of Reduced NLR and Longer HRT

Achieving optimum nitrifying activity in a nitrification process depends upon the growth balance between AOB and NOB because of their sequential roles in the oxidation process. Faster growth of AOB as compared to NOB can lead to a higher ammonia-oxidizing rate than the nitrite-oxidizing rate, resulting in nitrite accumulation in the reactor [31]. It has been observed in this study (14–51 days) that NH4-N was mostly converted to NO2-N, with limited conversion to NO3-N, which implies that the growth of AOB was higher than that of NOB in the reactors (Figure 3a and Figure 4a). For an enhanced nitrification process, the bacterial population and interlinkage of AOB and NOB play an important role [31].
Therefore, the NLR was further decreased to 0.14 ± 0.01 kg/m3·d by reducing the feeding sequence to once per day, from day 52, in both reactors, which increased the contact time between microorganisms and wastewater. The combined effect of reduced NLR and increased contact time immediately resulted in NAR being reduced from 88 ± 9.6% to 84 ± 8.4% and NPR being increased from 20 ± 3.3% to 23 ± 2.3% in R1 during the period of 52–55 days (Figure 3b). However, NAR in R2 did not drop immediately, as the pH in R2 during 52–55 days was around 7, which is not the optimum pH for Nitrobacter (NOB) [27]. Over time, as the process advanced, both reactors started performing well. Complete nitrification was achieved on day 61 in R1 and on day 82 in R2 (Figure 3a and Figure 4a).
The delay in complete nitrification in R2 compared to R1 might be due to the FA level increasing to around 100 mg/L during the period of 63–75 days due to the increase in the pH level around 8.8–8.9 in R2, as can be seen in Figure 7, whereas in R1, the FA level was below 45 mg/L, and the pH was mostly below 8.5, which did not affect the nitrification process. Zhang et al. [32] also observed that an FA level in the range of 18.08–24.95 mg/L had a minor effect on NOB activity, whereas an FA level of 36.06–50.66 mg/L reduced the NOB activity [32].
In this study, more nitrogen transformation observed compared to the input might be due to the endogenous decay of sludge contributing extra nutrients to the bacteria [33]. Overall, low NLR supported the growth of NOB bacteria and helped to maintain a growth balance between AOB and NOB. Moreover, the feeding sequence once a day provided adequate contact time between reject water and nitrifying biomass [34]. The correlation analysis of R1 (Figure 5) also showed a strong positive correlation between HRT and NPR, which means that increased HRT increased the NPR and vice versa.
As the nitrification continued, the NLR was increased to 0.23 ± 0.03 kg/m3·d in both reactors by increasing the NH4-N concentration to 750 ± 85 mg/L in the feed. NH4-N concentration was increased in reject water in terms of ammonium chloride (NH4CL), and the alkalinity requirement was added as per the stoichiometric value mentioned above in Section 3.2.2. An elevated ammonium level in the feed did not affect nitrification, resulting in 98 ± 0.1% NPR in R1. The NPR in R2 was affected by FA level elevation due to increased pH around 8.6–8.7 in the time period of 140–166 days, as can be seen in Figure 7. However, R2 showed good adaptation to both high FA level and feed transition from synthetic to reject water (from day 112) with a slight decline in the NPR of 73 ± 5.7%. The contact time played a significant role in achieving the enhanced nitrification. This result shows that once the SBR reactor is tuned, it can quickly adapt to sudden changes in loading rate, feed, and even FA level to some extent without significant performance reduction.

3.3. Cost-Benefit Insights on the Feasibility of Nitrification

An adopted method at industrial scale for nitrogen recovery from reject water is ammonia stripping, which involves increasing the pH of the reject water to around 10 using strong bases and evaporating ammonia at a high temperature (50–85 °C). Then, the stripped ammonia gas is captured using strong acid (H2SO4) [35]. This process have both economical and logistical disadvantages due to the involvement of strong mineral acid [36]. Hence, a biological process like nitrification might be a better option for nitrogen recovery. Recovered nitrate, when combined with biochar, can be used as a slow-release organic fertilizer, reducing the use of synthetic fertilizers and contributing to a circular economy [8]. The high ammonium concentration in WWTPs, due to the recycled reject water, product of sludge dewatering, creates a challenge for maintaining the overall treatment efficiency. WWTPs might need to upgrade treatment facilities to meet the discharge limits, potentially leading to extra cost [37]. The proposed method can treat the high-ammonium reject water with 100% ARE and 98 ± 0.1% NPR, as seen in R1. The longer HRT and aeration required for the proposed method may result in higher costs; however, these might be balanced with the benefits it provides, such as nutrient recovery from waste, environmental benefits, a better solution for WWTPs for treating high-ammonium reject water and contributing to the development of sustainable practices in agriculture by reducing the use of synthetic fertilizer.

4. Conclusions

Enhanced nitrification of reject water (containing high ammonium levels) helps to recover nitrate (a valuable nutrient), which can be combined with biochar for an effective organic fertilizer, contributing to the circular economy and sustainable agriculture. Nitrification of reject water up to 750 ± 85 mg NH4-N/L concentration was achieved in SBR with fine adjustment of loading, alkalinity, and retention time. At the initial stage of the SBR operation, the NLR should be 0.14 ± 0.01 kg/m3·d to enhance NOB bacteria and maintain the growth balance between AOB and NOB. Even though it is believed that the reject water has adequate alkalinity, it should be stoichiometrically sufficient to counteract the hydrogen ions produced during oxidation of NH4-N and to maintain pH and FNA within the optimum range. A feeding sequence once a day helped to maintain longer HRT (3.34 days), providing adequate contact time between nitrifying biomass and reject wastewater. After complete nitrification was achieved, NLR was increased up to 0.23 ± 0.03 kg/m3·d by increasing the NH4-N level to 750 ± 85 mg/L, which did not affect the nitrification process in R1. However, at this elevated ammonium nitrogen level, careful monitoring of pH is necessary to control the FA formation. In this study, during a short time, pH values higher than 8.5 (in R2) contributed to the formation of FA at a level (greater than 50 mg/L), affecting the NPR in R2.
This study recovered nitrogen in the form of nitrate from high-ammonium reject water, which has the potential for sustainable reuse as a nutrient source in agriculture when combined with biochar-based fertilizers. However, a comprehensive study of cost-benefit analysis is recommended to evaluate the trade-offs between nutrient recovery, environmental benefits, and operational cost of SBR prior to full-scale implementation.

Author Contributions

Conceptualization, S.G. and C.D.; methodology, S.G., E.J. and C.D.; formal analysis, S.G.; data curation, S.G.; writing—original draft preparation, S.G.; writing—review and editing, S.G., E.J. and C.D.; supervision, E.J. and C.D.; funding acquisition, C.D. All authors have read and agreed to the published version of the manuscript.

Funding

This research was funded by the Research Council of Norway, grant number 296286, project Decarbonize: New sustainable technology for decentralize production of biochar as fertilizer and soil improvement, and the APC was funded by the University of South-Eastern Norway.

Data Availability Statement

The original contributions presented in this study are included in the article. Further inquiries can be directed to the corresponding author.

Conflicts of Interest

The authors declare no conflicts of interest.

References

  1. Botheju, D.; Svalheim, O.; Bakke, R. Digestate Nitrification for Nutrient Recovery. Open Waste Manag. J. 2010, 3, 1–12. [Google Scholar] [CrossRef]
  2. Van der Hoek, J.; Duijff, R.; Reinstra, O. Nitrogen Recovery from Wastewater: Possibilities, Competition with Other Resources, and Adaptation Pathways. Sustainability 2018, 10, 4605. [Google Scholar] [CrossRef]
  3. Bernet, N.; Delgenes, N.; Akunna, J.C.; Delgenès, J.-P.; Moletta, R. Combined Anaerobic–Aerobic SBR for the Treatment of Piggery Wastewater. Water Res. 2000, 34, 611–619. [Google Scholar] [CrossRef]
  4. Di Costanzo, N.; Cesaro, A.; Di Capua, F.; Esposito, G. Exploiting the Nutrient Potential of Anaerobically Digested Sewage Sludge: A Review. Energies 2021, 14, 8149. [Google Scholar] [CrossRef]
  5. Le, T.T.H.; Fettig, J.; Meon, G. Kinetics and Simulation of Nitrification at Various pH Values of a Polluted River in the Tropics. Ecohydrol. Hydrobiol. 2019, 19, 54–65. [Google Scholar] [CrossRef]
  6. Govindasamy, P.; Muthusamy, S.K.; Bagavathiannan, M.; Mowrer, J.; Jagannadham, P.T.K.; Maity, A.; Halli, H.M.; G.K., S.; Vadivel, R.; T.K., D.; et al. Nitrogen Use Efficiency—A Key to Enhance Crop Productivity under a Changing Climate. Front. Plant Sci. 2023, 14, 1121073. [Google Scholar] [CrossRef]
  7. He, Z.; Wang, C.; Cao, H.; Liang, J.; Pei, S.; Li, Z. Nitrate Absorption and Desorption by Biochar. Agronomy 2023, 13, 2440. [Google Scholar] [CrossRef]
  8. Jellali, S.; El-Bassi, L.; Charabi, Y.; Usman, M.; Khiari, B.; Al-Wardy, M.; Jeguirim, M. Recent Advancements on Biochars Enrichment with Ammonium and Nitrates from Wastewaters: A Critical Review on Benefits for Environment and Agriculture. J. Environ. Manag. 2022, 305, 114368. [Google Scholar] [CrossRef]
  9. Hagemann, N.; Kammann, C.I.; Schmidt, H.-P.; Kappler, A.; Behrens, S. Nitrate Capture and Slow Release in Biochar Amended Compost and Soil. PLoS ONE 2017, 12, e0171214. [Google Scholar] [CrossRef]
  10. Yuan, X.; Gu, X.; Liang, R.; Ban, G.; Ma, L.; He, T.; Wang, Z. Comparing Combined Application of Biochar and Nitrogen Fertilizer in Paddy and Upland Soils: Processes, Enhancement Strategies, and Agricultural Implications. Sci. Total Environ. 2024, 933, 173160. [Google Scholar] [CrossRef]
  11. Tchobanoglous, G.; Burton, F.L.; Stensel, H.D. Wastewater Engineering: Treatment and Reuse, 4th ed.; Inc. Metcalf & Eddy, Ed.; McGraw-Hill Series in Civil and Environmental Engineering; McGraw-Hill: Boston, MA, USA, 2003; ISBN 978-0-07-041878-3. [Google Scholar]
  12. Karmann, C.; Mágrová, A.; Jeníček, P.; Bartáček, J.; Kouba, V. Advances in Nitrogen Removal and Recovery Technologies from Reject Water: Economic and Environmental Perspectives. Bioresour. Technol. 2024, 391, 129888. [Google Scholar] [CrossRef] [PubMed]
  13. Yang, X.; Zhang, L.; Li, S.; Zhang, H.; Zhang, S.; Wan, Y.; Yu, H. Fast Start-up of Partial Nitrification for High-Ammonia Wastewater Treatment Using Zeolite with in-Situ Bioregeneration. J. Water Process Eng. 2024, 59, 105077. [Google Scholar] [CrossRef]
  14. Directive-EU-2024/3019-EN-EUR-Lex. Available online: https://eur-lex.europa.eu/eli/dir/2024/3019/oj/eng (accessed on 13 April 2025).
  15. Anthonisen, A.C.; Loehr, R.C.; Prakasam, T.B.S.; Srinath, E.G. Inhibition of Nitrification by Ammonia and Nitrous Acid. J. Water Pollut. Control Fed. 1976, 48, 835–852. [Google Scholar]
  16. THE 17 GOALS|Sustainable Development. Available online: https://sdgs.un.org/goals (accessed on 13 April 2025).
  17. Sivalingam, V.; Ahmadi, V.; Babafemi, O.; Dinamarca, C. Integrating Syngas Fermentation into a Single-Cell Microbial Electrosynthesis (MES) Reactor. Catalysts 2020, 11, 40. [Google Scholar] [CrossRef]
  18. Dohare, E.D.; Bochare, E.P. Sequential Batch Reactors: Taking Packaged Wastewater Treatment to New Heights—A Review. Int. J. Civ. Eng. Technol. IJCIET 2014, 5, 131–138. [Google Scholar]
  19. American Public Health Association. Standard Methods for the Examination of Water and Wastewater; Eaton, A.D., Franson, M.A.H., Eds.; APHA-AWWA-WEF: Washington, DC, USA, 2005; ISBN 978-0-87553-047-5. [Google Scholar]
  20. Analytical Procedures and Appendices Spectroquant Prove 300. Available online: https://chem.eng.psu.ac.th/new_chem/upload/manual/144/SQ%20Prove%20300%20-%20Analytical%20Procedures%20and%20Appendices%202017-07%20(1).pdf (accessed on 3 March 2025).
  21. Wu, J.; Xu, W.; Xu, Y.; Su, H.; Hu, X.; Cao, Y.; Zhang, J.; Wen, G. Impact of Organic Carbons Addition on the Enrichment Culture of Nitrifying Biofloc from Aquaculture Water: Process, Efficiency, and Microbial Community. Microorganisms 2024, 12, 703. [Google Scholar] [CrossRef]
  22. Janka, E.; Pathak, S.; Rasti, A.; Gyawali, S.; Wang, S. Simultaneous Heterotrophic Nitrification and Aerobic Denitrification of Water after Sludge Dewatering in Two Sequential Moving Bed Biofilm Reactors (MBBR). Int. J. Environ. Res. Public. Health 2022, 19, 1841. [Google Scholar] [CrossRef]
  23. Abdolvand, Y.; Sadeghiamirshahidi, M.; Keenum, I. Denitrification Processes, Inhibitors, and Their Implications in Ground Improvement. Biogeotechnics 2025. [Google Scholar] [CrossRef]
  24. Zhang, L.; Zhang, S.; Han, X.; Gan, Y.; Wu, C.; Peng, Y. Evaluating the Effects of Nitrogen Loading Rate and Substrate Inhibitions on Partial Nitrification with FISH Analysis. Water Sci. Technol. 2012, 65, 513–518. [Google Scholar] [CrossRef]
  25. Sánchez, O.; Bernet, N.; Delgenès, J.-P. Effect of Dissolved Oxygen Concentration on Nitrite Accumulation in Nitrifying Sequencing Batch Reactor. Water Environ. Res. 2007, 79, 845–850. [Google Scholar] [CrossRef]
  26. Yusof, N.; Hassan, M.; Phang, L.-Y.; Tabatabaei, M.; Othman, M.R.; Mori, M.; Wakisaka, M.; Sakai, K.; Shirai, Y. Nitrification of Ammonium-Rich Sanitary Landfill Leachate. Waste Manag. 2010, 30, 100–109. [Google Scholar] [CrossRef] [PubMed]
  27. U.S. Environmental Protection Agency (EPA) Nitrification. Available online: https://www.epa.gov/sites/default/files/2015-09/documents/nitrification_1.pdf (accessed on 3 March 2025).
  28. Biesterfeld, S.; Farmer, G.; Russell, P.; Figueroa, L. Effect of Alkalinity Type and Concentration on Nitrifying Biofilm Activity. Water Environ. Res. 2003, 75, 196–204. [Google Scholar] [CrossRef] [PubMed]
  29. Ma, J.; Wang, Z.; Zhu, C.; Liu, S.; Wang, Q.; Wu, Z. Analysis of Nitrification Efficiency and Microbial Community in a Membrane Bioreactor Fed with Low COD/N-Ratio Wastewater. PLoS ONE 2013, 8, e63059. [Google Scholar] [CrossRef]
  30. Phanwilai, S.; Noophan, P.; Li, C.-W.; Choo, K.-H. Effect of COD:N Ratio on Biological Nitrogen Removal Using Full-Scale Step-Feed in Municipal Wastewater Treatment Plants. Sustain. Environ. Res. 2020, 30, 24. [Google Scholar] [CrossRef]
  31. Yao, Q.; Peng, D.-C. Nitrite Oxidizing Bacteria (NOB) Dominating in Nitrifying Community in Full-Scale Biological Nutrient Removal Wastewater Treatment Plants. AMB Express 2017, 7, 25. [Google Scholar] [CrossRef]
  32. Zhang, F.; Yang, H.; Wang, J.; Liu, Z.; Guan, Q. Effect of Free Ammonia Inhibition on NOB Activity in High Nitrifying Performance of Sludge. RSC Adv. 2018, 8, 31987–31995. [Google Scholar] [CrossRef]
  33. Aqeel, H.; Liss, S.N. Autotrophic Fixed-Film Systems Treating High Strength Ammonia Wastewater. Front. Microbiol. 2020, 11, 551925. [Google Scholar] [CrossRef]
  34. Wu, H.; Yang, T.; Zhang, M.; Li, A.; Huang, D.; Xing, Z. Effect of HRT on Nitrogen Removal from Low Carbon Source Wastewater Enhanced by Slurry and Its Mechanism. Chem. Eng. J. 2023, 477, 147159. [Google Scholar] [CrossRef]
  35. Rizzioli, F.; Bertasini, D.; Bolzonella, D.; Frison, N.; Battista, F. A Critical Review on the Techno-Economic Feasibility of Nutrients Recovery from Anaerobic Digestate in the Agricultural Sector. Sep. Purif. Technol. 2023, 306, 122690. [Google Scholar] [CrossRef]
  36. Alhelal, I.I.; Loetscher, L.H.; Sharvelle, S.; Reardon, K.F. Nitrogen Recovery from Anaerobic Digestate via Ammonia Stripping and Absorbing with a Nitrified Solution. J. Environ. Chem. Eng. 2022, 10, 107826. [Google Scholar] [CrossRef]
  37. Kim, I.-T.; Lee, Y.-E.; Jeong, Y.; Yoo, Y.-S. A Novel Method to Remove Nitrogen from Reject Water in Wastewater Treatment Plants Using a Methane- and Methanol-Dependent Bacterial Consortium. Water Res. 2020, 172, 115512. [Google Scholar] [CrossRef] [PubMed]
Figure 1. Laboratory-scale SBRs with inlet, outlet, air diffusers, and air flow meter.
Water 17 01344 g001
Figure 2. Schematic diagram representing operating principle of SBR [18].
Water 17 01344 g002
Figure 3. (a) Concentration of influent and effluent nitrogen compounds and (b) nitrogen compounds removal and conversion percentage in R1.
Water 17 01344 g003aWater 17 01344 g003b
Figure 4. (a) Concentration of influent and effluent nitrogen compounds and (b) nitrogen compounds removal and conversion percentage in R2.
Water 17 01344 g004aWater 17 01344 g004b
Figure 5. Correlation analysis of different parameters for both R1 and R2: the darker colors indicate a strong correlation, while the lighter colors indicate a weaker correlation.
Water 17 01344 g005
Figure 6. (a) pH and FNA variations in R1; (b) pH and FNA variations in R2.
Water 17 01344 g006
Figure 7. pH and free ammonia in R1 and R2.
Water 17 01344 g007
Table 1. Reject water characteristics.
ParameterValueUnits
Total chemical oxygen demand (tCOD)3000 (±545)mg/L
Soluble chemical oxygen demand (sCOD)1940 (±375)mg/L
pH7.6 (±0.1)
NH4-N520 (±55)mg/L
Alkalinity2220 (±305)mg CaCO3/L
Table 2. The vitamin and mineral composition used in the synthetic feed preparation [17].
Vitamin Constituent (g/L)Mineral Constituent (g/L)
Nicotinic acid: 0.05 H3BO3: 0.05
Pantothenic acid: 0.05FeSO4·7H2O: 2.7
Biotin: 0.02ZnSO4·7H2O: 0.088
Riboflavin: 0.05 CuSO4·5H2O: 0.055
Thioctic acid: 0.05 MnSO4·H2O: 0.04
Pyridoxine hydrochloride: 0.1CoCl2·6H2O: 0.05
p-aminobenzoic acid: 0.05NiCl2·6H2O: 0.1
Vitamin B12: 0.001 -
Folic acid: 0.02-
Thiamine: 0.05-
Table 3. Design parameters of the lab-scale SBRs denoted as R1 and R2.
ParametersR1R2Units
Reactor volume2.10.96L
Internal diameter4.23cm
Height151.5136.5cm
Working volume1.470.68L
Table 4. Both reactors’ operating conditions over different periods of time.
ParametersOperation Period in Days
01–89–1314–5152–111112–166
Feeding rate (%)202030303030
Feeding/day312211
HRT (day)1.6751.671.673.343.34
NLR (kg/m3·d)0.330.11 ± 0.010.34 ± 0.030.28 ± 0.010.14 ± 0.010.23 ± 0.03
Alkalinity (mg CaCO3/L)19201980 ± 2001980 ± 2003200 ± 1253190 ± 2105215 ± 465
Disclaimer/Publisher’s Note: The statements, opinions and data contained in all publications are solely those of the individual author(s) and contributor(s) and not of MDPI and/or the editor(s). MDPI and/or the editor(s) disclaim responsibility for any injury to people or property resulting from any ideas, methods, instructions or products referred to in the content.

