
Construction and Application of Marine Ecological Restoration Project Effect Assessment System Based on Analytic Hierarchy Process


Abstract
1. Introduction
2. Materials and Methods
2.1. Constructing an Evaluation Indicator System Based on AHP
2.1.1. Construction of Indicator Hierarchy
2.1.2. Determination of Indicator Weights
- (1)
- Constructing the discriminant matrix
- (2)
- Weight calculation and consistency test
2.2. Quantification and Evaluation Methods of Indicators
2.2.1. Quantification of Indicators
2.2.2. Indicators Score Determination
2.2.3. Comprehensive Assessment Method for the Effects of Marine Ecological Restoration Projects
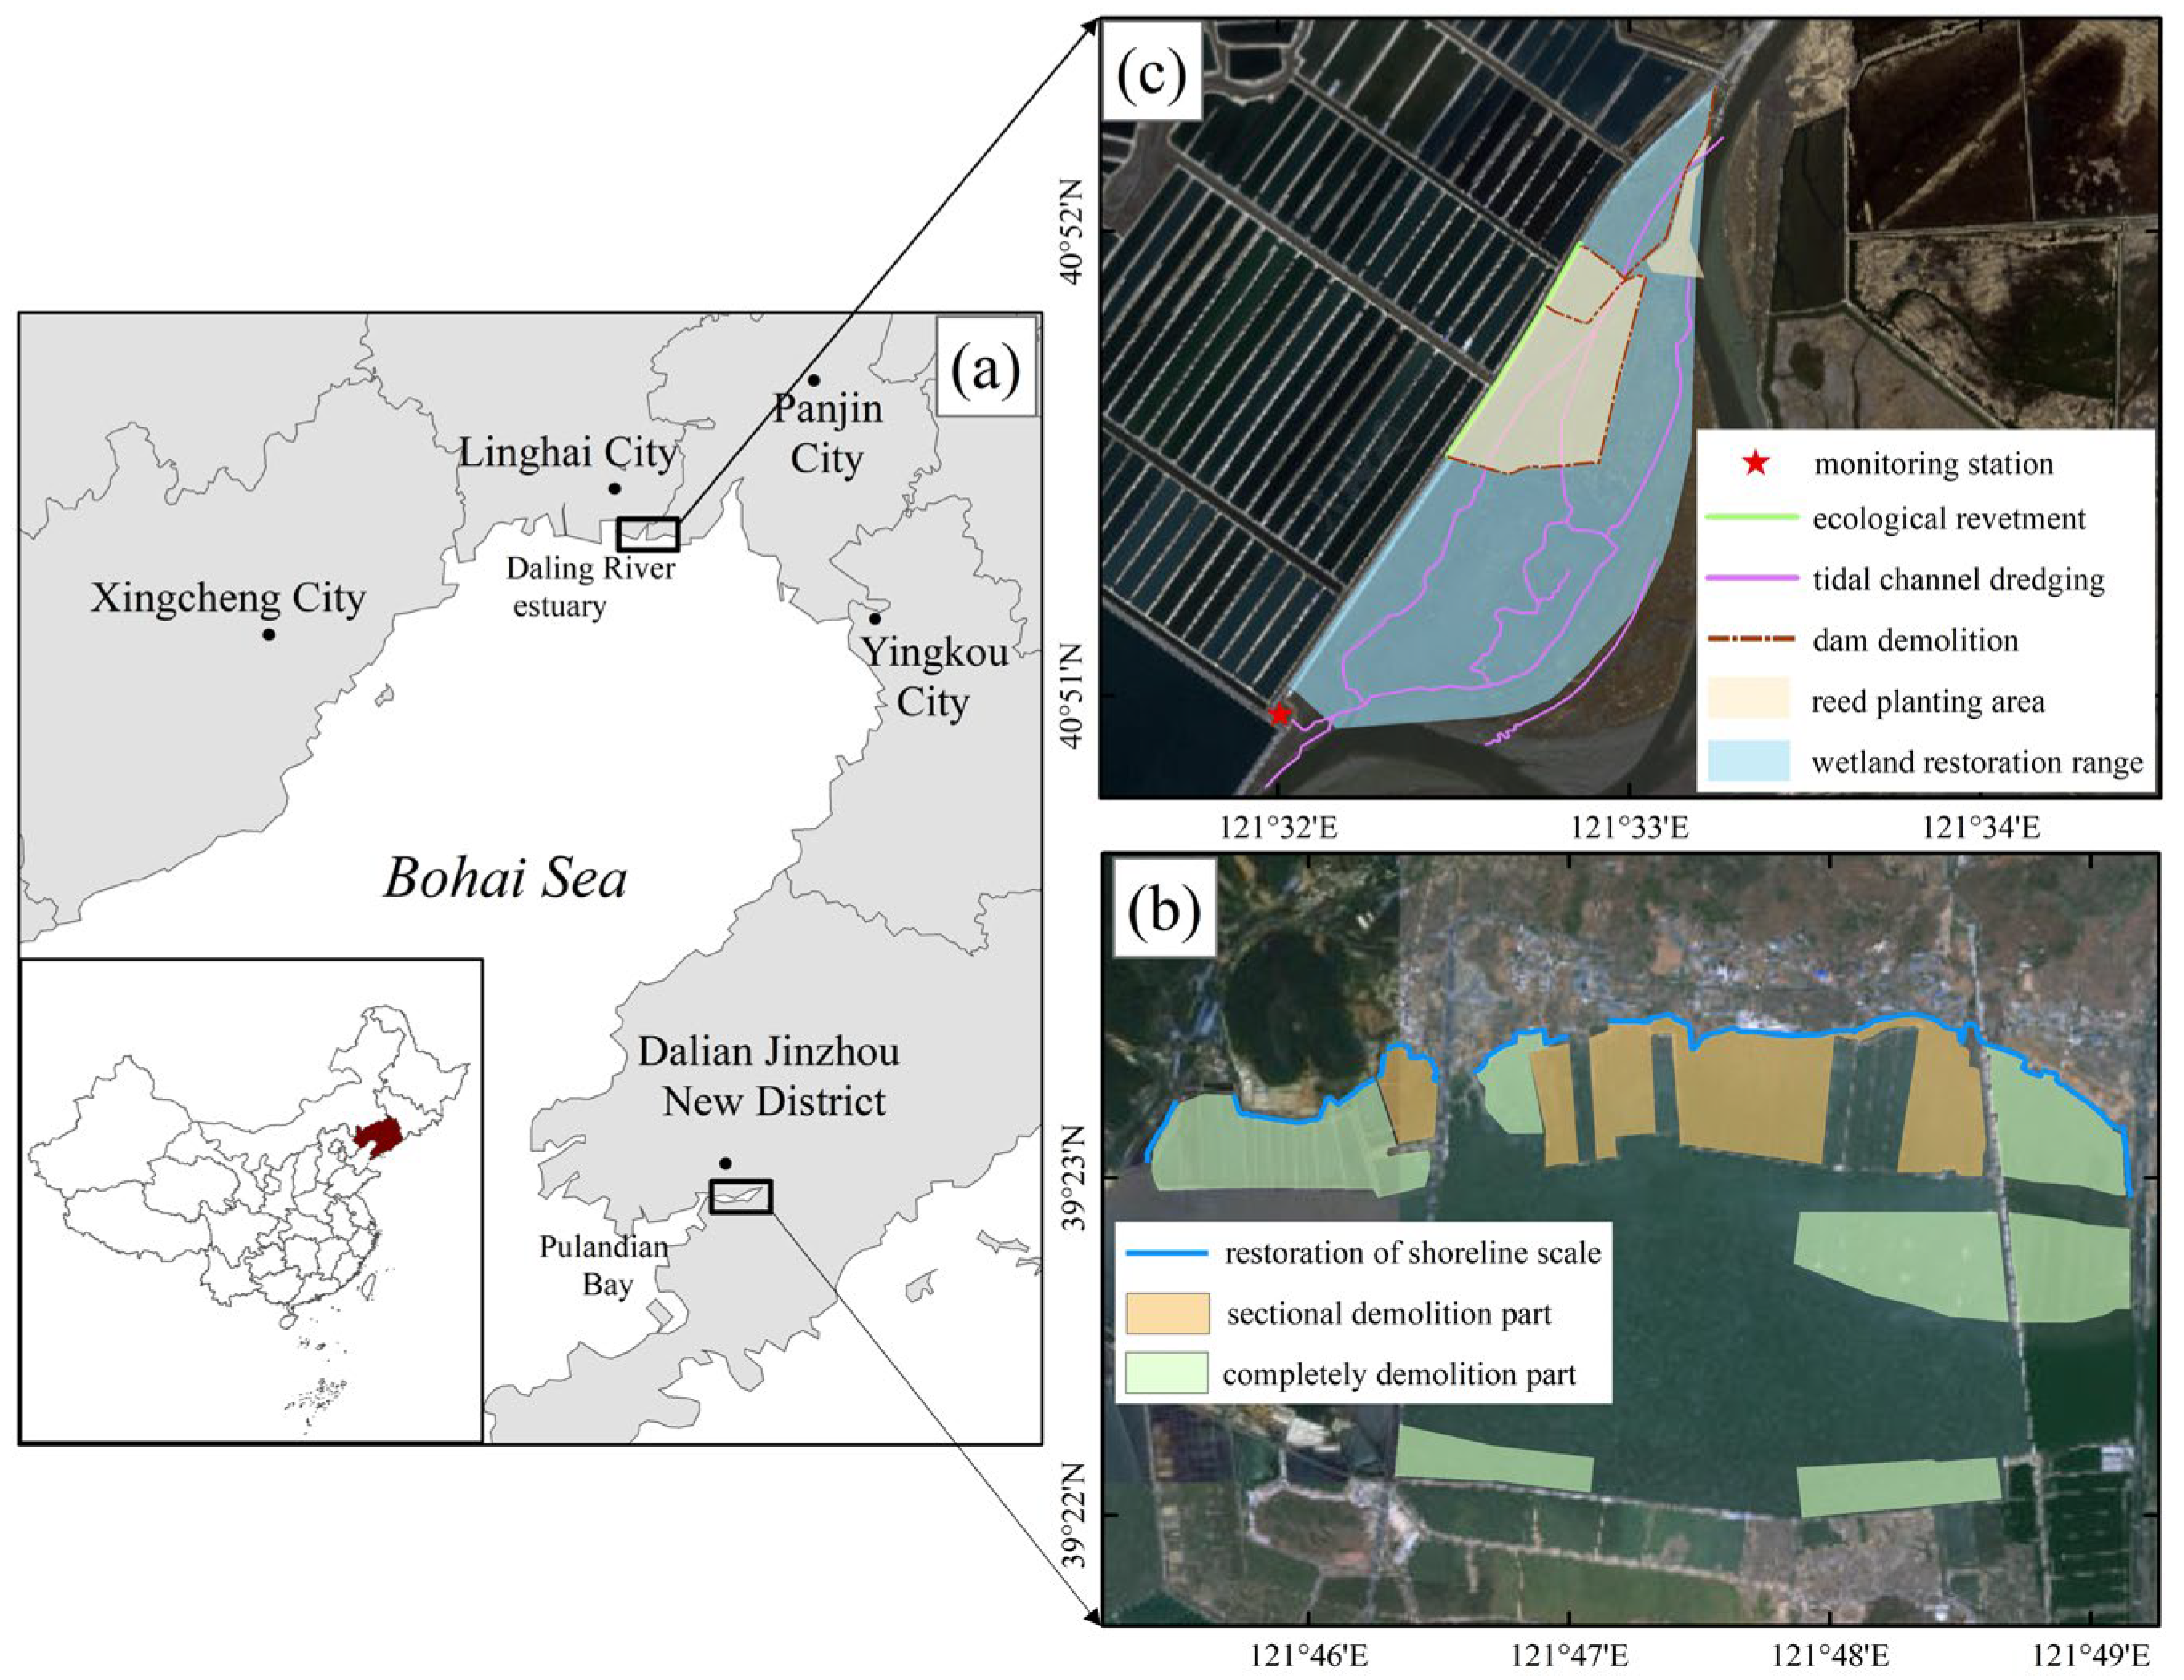
2.3. Case Study
2.4. Data Source and Processing
3. Results and Analysis
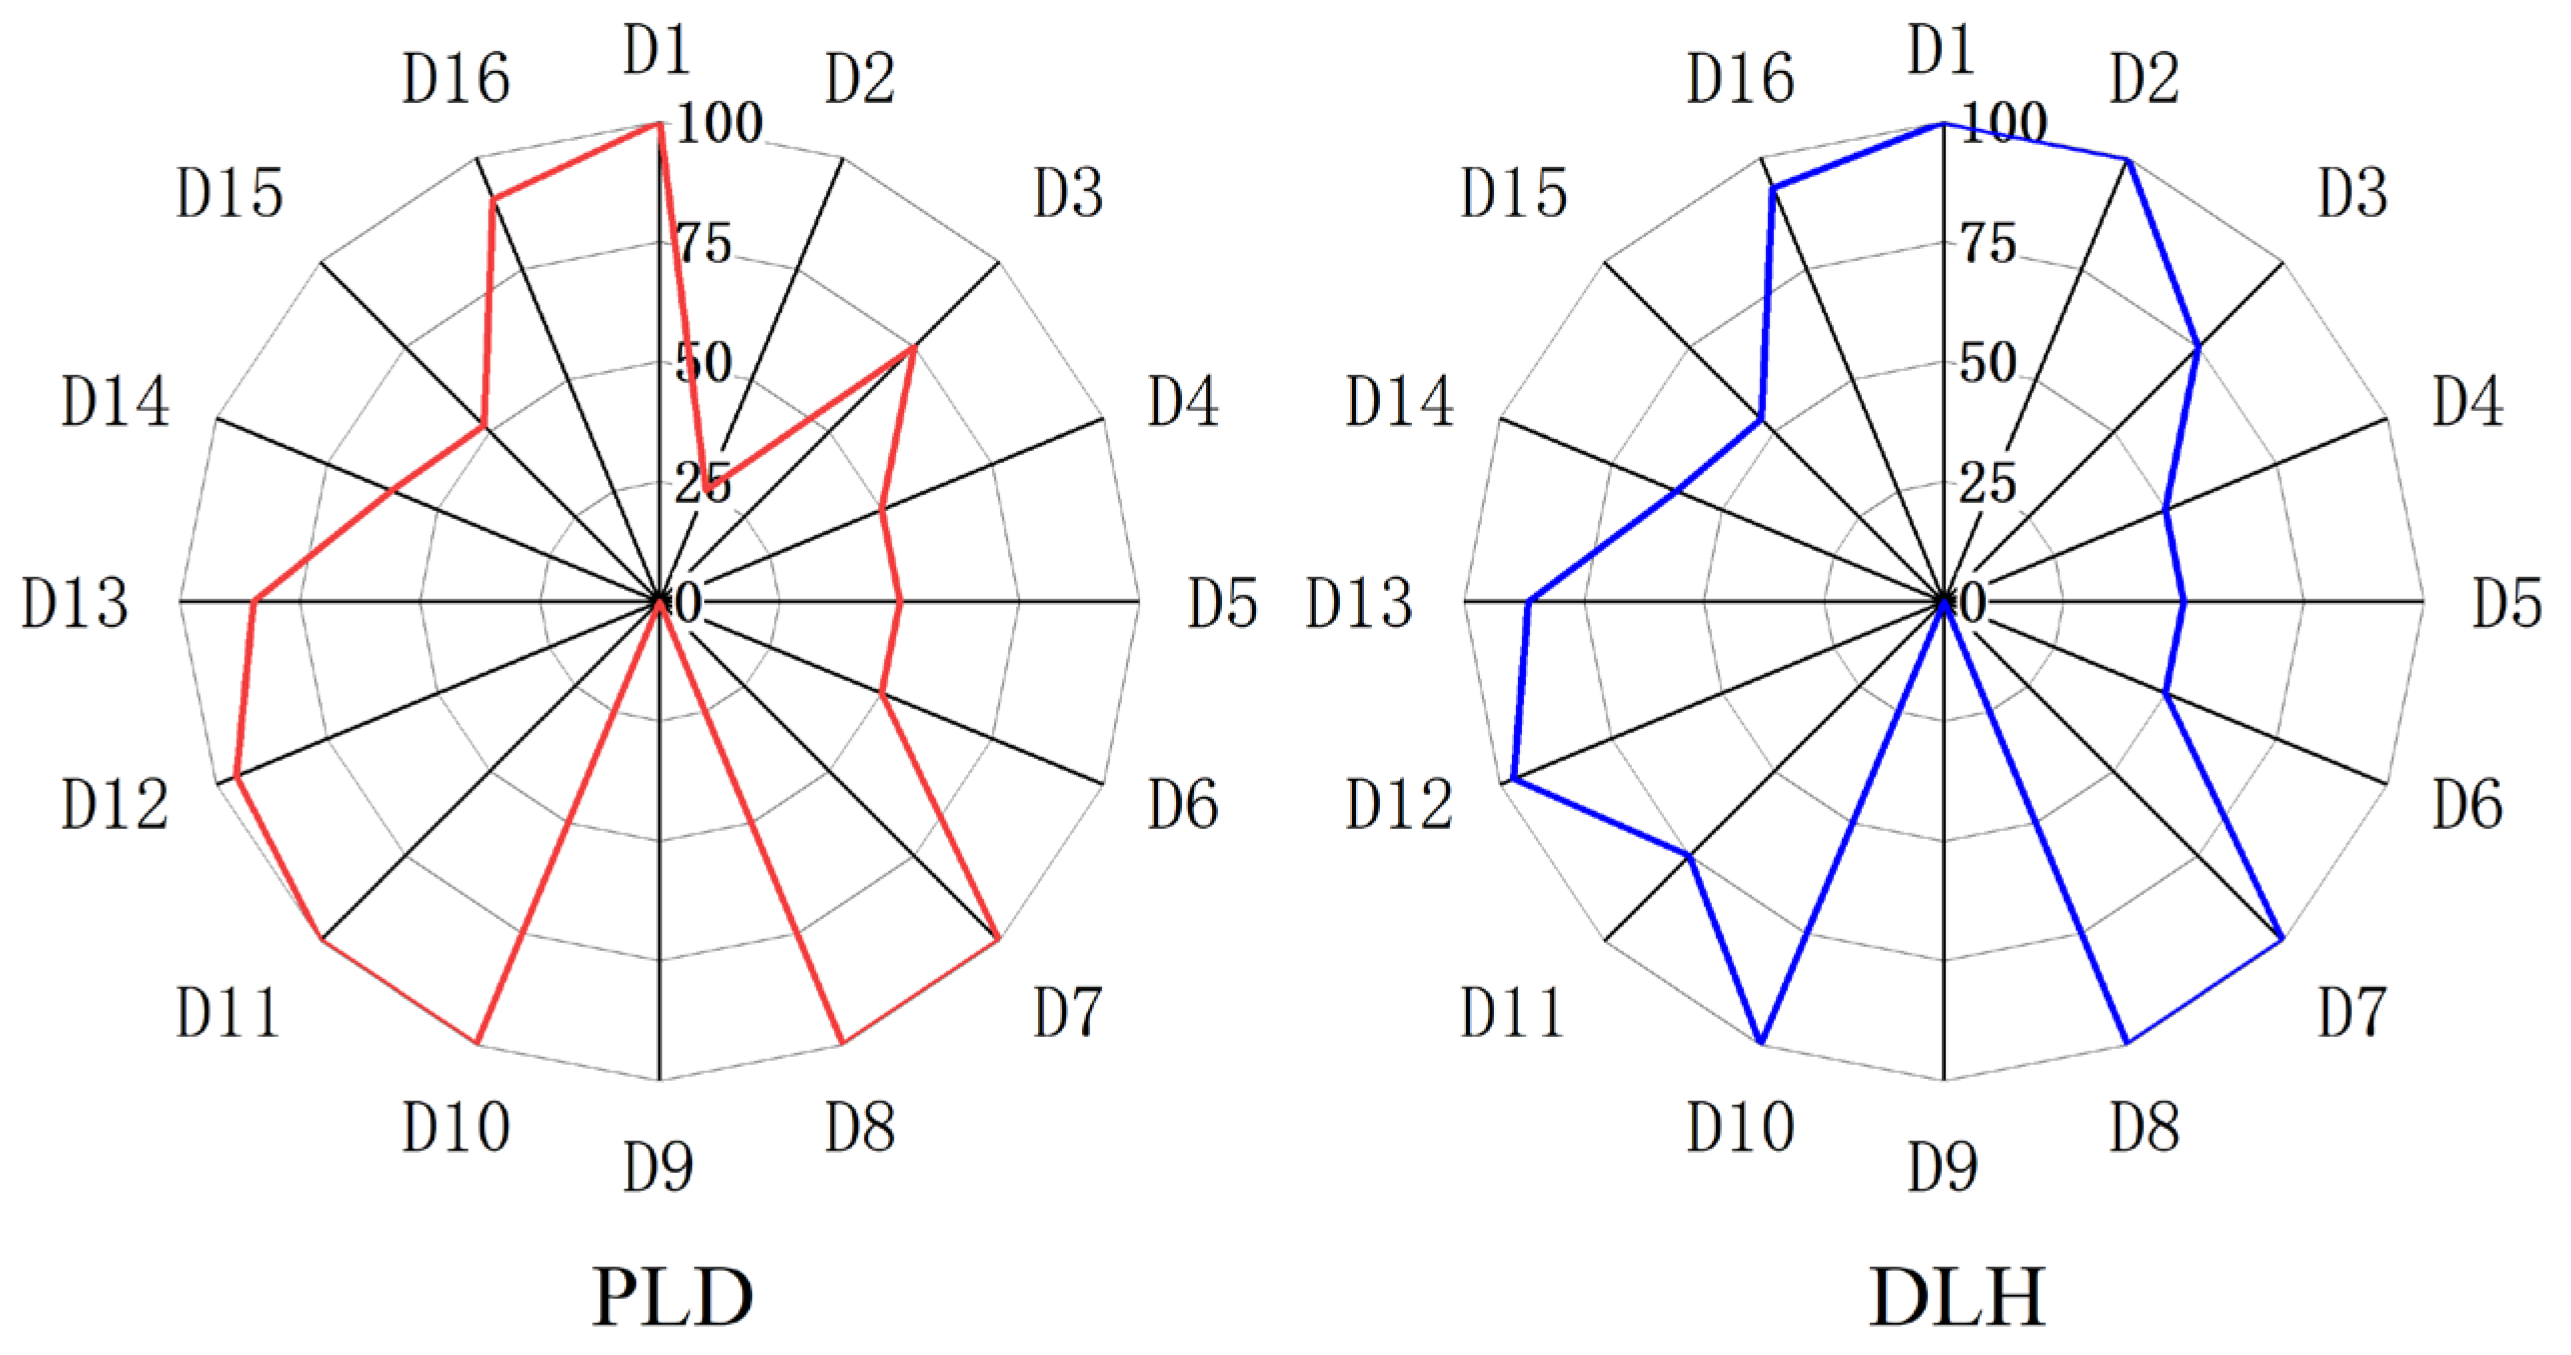
3.1. Monitoring Indicators
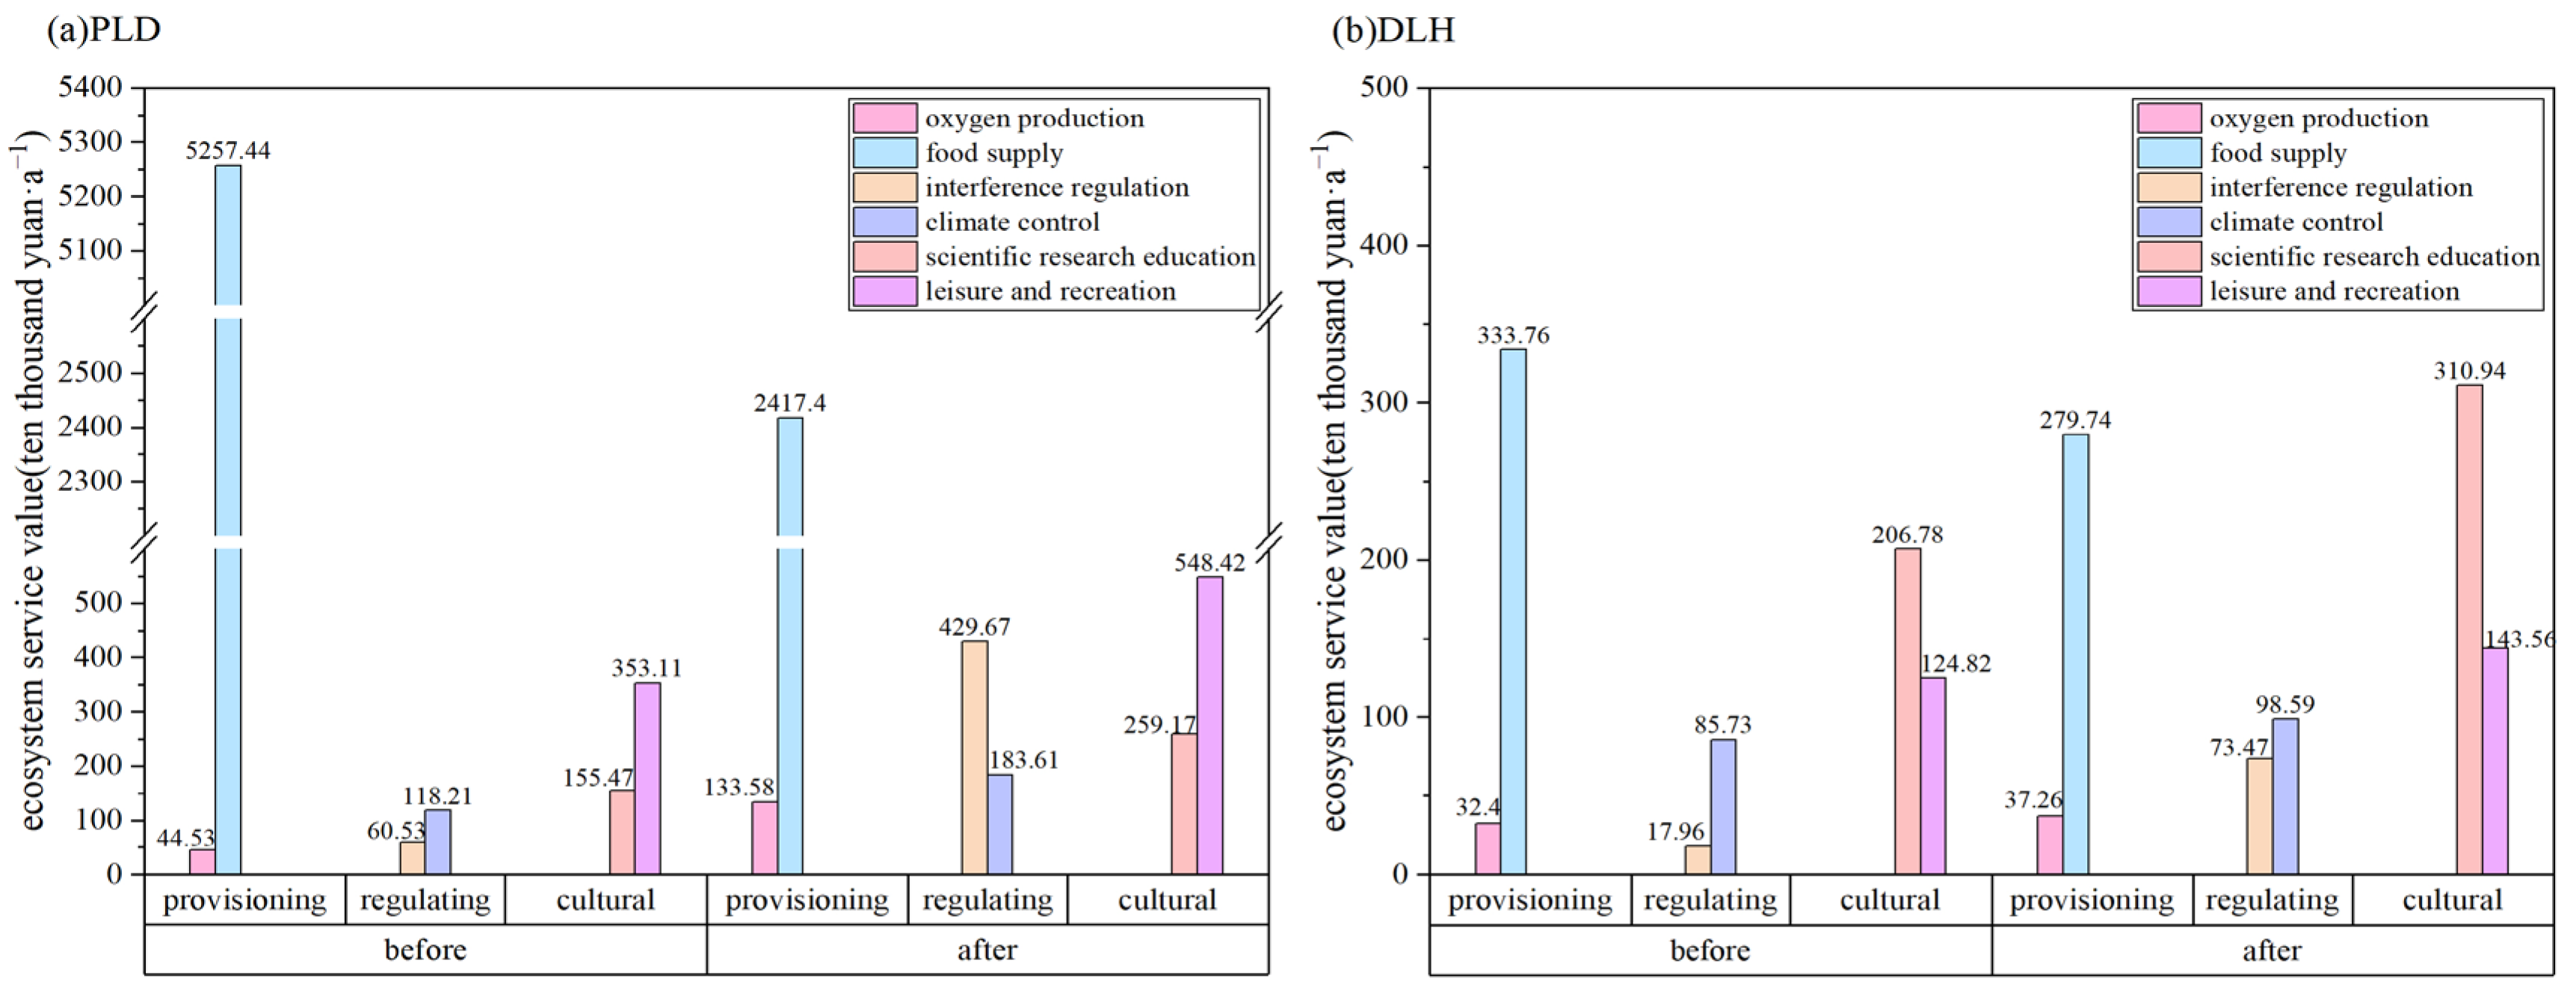
3.2. Ecosystem Services
3.3. Questionnaire
3.4. Comprehensive Assessment
4. Discussion
4.1. Indicator Weight Analysis
4.2. Analysis of Reasons for Differences in Assessment Results
4.3. Significance of Restoration Project Assessment and Improvement Recommendations
4.4. Recommendations for the Sustainability of Ecological Restoration
5. Conclusions
- (1)
- The assessment results show that the ecological restoration project of Pulandian Bay scored 77.18, with a “good” restoration effect, and the ecological restoration project of Daling River Estuary scored 80.19, with a “excellent” restoration effect. Both projects realized the goals of improving the regional ecological environment, upgrading the ecosystem service function, improving the quality of life of the residents, and improving the ecosystem service functions.
- (2)
- Compared with the previous evaluation system, the system constructed in this paper has the following advantages: on the one hand, the indicators covered in the system can fully reflect the impact of ecological restoration on the ecological environment and economic society; on the other hand, by calculating the value of ecosystem services, the benefits of this marine ecological restoration project can be intuitively displayed, reflecting the contribution of the ecosystem to human well-being.
- (3)
- However, the applicability of the system to specific restoration projects still needs to be further explored. For example, vegetation restoration projects need to increase vegetation coverage indicators, and sandy coastal projects need to consider beach resource indicators. In addition, management indicators (such as project progress, construction quality, tracking and monitoring) can be added to fully reflect the implementation of the project. In the future, more case optimization indicators and quantitative standards will be combined to further improve the comprehensiveness and applicability of the system.
- (4)
- In addition, this assessment is based on the periodic survey data before and after restoration, which only reflects the short-term effect, and some restoration effects (such as species diversity restoration) need long-term monitoring to fully reflect. It is recommended that follow-up studies extend the assessment time to 3–5 years or longer, and continue to monitor data to assess the repair effect more comprehensively and accurately.
Author Contributions
Funding
Data Availability Statement
Acknowledgments
Conflicts of Interest
References
- Duarte, C.M.; Agusti, S.; Barbier, E.; Britten, G.L.; Castilla, J.C.; Gattuso, J.-P.; Fulweiler, R.W.; Hughes, T.P.; Knowlton, N.; Lovelock, C.E.; et al. Rebuilding Marine Life. Nature 2020, 580, 39–51. [Google Scholar] [CrossRef] [PubMed]
- Purandare, J.; de Sousa de Saboya, R.; Bayraktarov, E.; Boström-Einarsson, L.; Carnell, P.E.; Eger, A.M.; Le Port, A.; Macreadie, P.I.; Reeves, S.E.; van Kampen, P.; et al. Database for Marine and Coastal Restoration Projects in Australia and New Zealand. Ecol. Manag. Restor. 2024, 25, 14–20. [Google Scholar] [CrossRef]
- Liu, L.; Wang, H.; Yue, Q. China’s Coastal Wetlands: Ecological Challenges, Restoration, and Management Suggestions. Reg. Stud. Mar. Sci. 2020, 37, 101337. [Google Scholar] [CrossRef]
- Bell-James, J.; Foster, R.; Shumway, N. The Permitting Process for Marine and Coastal Restoration: A Barrier to Achieving Global Restoration Targets? Conserv. Sci. Pract. 2023, 5, e13050. [Google Scholar] [CrossRef]
- Chen, W.; Wallhead, P.; Hynes, S.; Groeneveld, R.; O’Connor, E.; Gambi, C.; Danovaro, R.; Tinch, R.; Papadopoulou, N.; Smith, C. Ecosystem Service Benefits and Costs of Deep-Sea Ecosystem Restoration. J. Environ. Manag. 2022, 303, 114127. [Google Scholar] [CrossRef]
- Waltham, N.J.; Elliott, M.; Lee, S.Y.; Lovelock, C.; Duarte, C.M.; Buelow, C.; Simenstad, C.; Nagelkerken, I.; Claassens, L.; Wen, C.K.-C.; et al. UN Decade on Ecosystem Restoration 2021–2030—What Chance for Success in Restoring Coastal Ecosystems? Front. Mar. Sci. 2020, 7, 71. [Google Scholar] [CrossRef]
- Liu, N.; Ma, Z. Ecological Restoration of Coastal Wetlands in China: Current Status and Suggestions. Biol. Conserv. 2024, 291, 110513. [Google Scholar] [CrossRef]
- Konisky, R.A.; Burdick, D.M.; Dionne, M.; Neckles, H.A. A Regional Assessment of Salt Marsh Restoration and Monitoring in the Gulf of Maine. Restor. Ecol. 2006, 14, 516–525. [Google Scholar] [CrossRef]
- Muko, S.; Iwasa, Y. Long-Term Effect of Coral Transplantation: Restoration Goals and the Choice of Species. J. Theor. Biol. 2011, 280, 127–138. [Google Scholar] [CrossRef]
- Scapin, L.; Zucchetta, M.; Sfriso, A.; Franzoi, P. Predicting the Response of Nekton Assemblages to Seagrass Transplantations in the Venice Lagoon: An Approach to Assess Ecological Restoration. Aquat. Conserv. Mar. Freshw. Ecosyst. 2019, 29, 849–864. [Google Scholar] [CrossRef]
- Kutcher, T.E.; Raposa, K.B. Assessing Long-Term Outcomes of Tidal Restoration in New England Salt Marshes. J. Environ. Manag. 2023, 338, 117832. [Google Scholar] [CrossRef] [PubMed]
- Danovaro, R.; Aronson, J.; Bianchelli, S.; Boström, C.; Chen, W.; Cimino, R.; Corinaldesi, C.; Cortina-Segarra, J.; D’Ambrosio, P.; Gambi, C.; et al. Assessing the Success of Marine ECOSYSTEM Restoration Using Meta-Analysis. Nat. Commun. 2025, 16, 3062. [Google Scholar] [CrossRef] [PubMed]
- Wang, N.; Li, J.; Zhou, Y. Mechanism of action of marine ecological restoration on ecological, economic, and social benefits—An empirical analysis based on a structural equation model. Ocean Coast. Manag. 2024, 248, 106950. [Google Scholar] [CrossRef]
- Jones, K.; Hanna, E. Design and Implementation of an Ecological Engineering Approach to Coastal Restoration at Loyola Beach, Kleberg County, Texas. Ecol. Eng. 2004, 22, 249–261.006. [Google Scholar] [CrossRef]
- Lithgow, D.; Martínez, M.L.; Gallego-Fernández, J.B. The “ReDune” Index (Restoration of Coastal Dunes Index) to Assess the Need and Viability of Coastal Dune Restoration. Ecol. Indic. 2015, 49, 178–187. [Google Scholar] [CrossRef]
- Jones, K.; Pan, X.; Garza, A.; Lloyd-Reilley, J. Multi-Level Assessment of Ecological Coastal Restoration in South Texas. Ecol. Eng. 2010, 36, 435–440. [Google Scholar] [CrossRef]
- Daily, G.C. Nature’s Services: Societal Dependence on Natural Ecosystems; Island Press: Washington, DC, USA, 1997; pp. 220–221. [Google Scholar]
- Li, C.F.; Li, P.J.; Liu, L.C.; Wang, W.T. Ecological restoration zoning of provincial territorial space in the ecologically fragile areas of northwest China. Chin. Soc. Agric. Eng. 2020, 36, 254–263. [Google Scholar]
- Meli, P.; Rey Benayas, J.M.; Balvanera, P.; Martínez Ramos, M. Restoration Enhances Wetland Biodiversity and Ecosystem Service Supply, but Results Are Context-Dependent: A Meta-Analysis. PLoS ONE 2014, 9, e93507. [Google Scholar] [CrossRef]
- Fu, B.; Liu, Y.; Lü, Y.; He, C.; Zeng, Y.; Wu, B. Assessing the Soil Erosion Control Service of Ecosystems Change in the Loess Plateau of China. Ecol. Complex. 2011, 8, 284–293. [Google Scholar] [CrossRef]
- Feng, X.; Fu, B.; Lu, N.; Zeng, Y.; Wu, B. How Ecological Restoration Alters Ecosystem Services: An Analysis of Carbon Sequestration in China’s Loess Plateau. Sci. Rep. 2013, 3, 2846. [Google Scholar] [CrossRef]
- Gómez-Baggethun, E.; Tudor, M.; Doroftei, M.; Covaliov, S.; Năstase, A.; Onără, D.-F.; Mierlă, M.; Marinov, M.; Doroșencu, A.-C.; Lupu, G.; et al. Changes in Ecosystem Services from Wetland Loss and Restoration: An Ecosystem Assessment of the Danube Delta (1960–2010). Ecosyst. Serv. 2019, 39, 100965. [Google Scholar] [CrossRef]
- Chen, B.; Yu, W.W.; Chen, G.C.; Zheng, X.Q.; Huang, H.P.; Hu, W.J.; Ma, Z.Y. Coastal wetland restoration: An overview. J. Appl. Oceanogr. 2019, 38, 464–473. [Google Scholar]
- Wu, Y.F.; Ai, Y.; Zheng, Z.L.; Zhuang, M.; Li, Z.H. Evaluation for the effectiveness of four mangrove wetland restoration projects in Xiamen. Chin. J. Ecol. 2023, 42, 2419–2424. [Google Scholar]
- Zheng, X.Q.; Zhang, H.; Chen, B.; Yu, W.W. Advance of indicator system for the evaluation of coral reef restoration effectiveness. Appl. Oceanogr. 2021, 40, 126–141. [Google Scholar]
- Zhang, M.H.; Sun, Z.C.; Liang, S.X.; Sun, J.W.; Suo, A.N. A study on fuzzy comprehensive evaluation for sandy coast repairing effect: A case in the Moon Bay of Yingkou. Mar. Sci. Bull. 2019, 38, 698–706. [Google Scholar]
- Yang, J.Y.; Luo, F.S.; Wang, A.J.; Yu, D.S. Comprehensive evaluation for silted bay restoration: A case study in Xiamen Bay. J. Appl. Oceanogr. 2020, 39, 389–399. [Google Scholar]
- Shao, X.L.; Xing, M.N.; Wang, J.M.; Yang, R.; Wang, Y.; Liu, H.L.; Zhou, B.; Wang, N.L. Evaluation on the ecological restoration effect of returning fishpond to wetland: A case study in Qilihai wetland, Tianjin, China. Chin. J. Environ. Eng. 2022, 16, 3102–3112. [Google Scholar]
- Wu, W.; Li, C.X.; Cheng, X.C. Evaluation of the effectiveness of a coastal ecological restoration project based on ecosystem services: A case study on Yingwuzhou Wetland, China. J. East China Norm. Univ. Nat. Sci. 2020, 3, 98–108. [Google Scholar]
- Liang, F.G.; Yan, Y.R.; Zhang, G.; Jiang, W. Evaluation of coastal zone restoration effect of Sanwei Port in Xiangshui, Jiangsu Province. J. Geol. 2022, 46, 405–410. [Google Scholar]
- Dai, J.; Fang, J.; Guo, Z.; Hou, J. Research on Ecological Restoration Assessment and Eco-Economic Development of Sea Area by Introducing the K-Means Clustering Algorithm. Environ. Sci. Pollut. R. 2023, 30, 118318–118331. [Google Scholar] [CrossRef]
- Wang, W.Y.; Xu, C.K.; Sun, J.W. Study on Evaluation Index System of the Effect of Ecological Transformation and Restoration in the Artificial Coasts. Coast Eng. 2020, 39, 70–76. [Google Scholar]
- Lai, M.; Ouyang, Y.R.; Wu, Y.J.; Dai, J.J.; Fang, J.; Fu, S.F. Indicator system for assessing the comprehensive benefits of marine ecological restoration at the regional level. Acta Ecol. Sin. 2024, 44, 6965–6975. [Google Scholar]
- Ouyang, Y.R.; Dai, J.J.; Wu, Y.J.; Fang, J.; Lai, M.; Cai, L.; Wu, L. Study on the performance evaluation indicator system for marine ecological restoration projects. J. Appl. Oceanogr. 2021, 40, 91–99. [Google Scholar]
- Chen, S.; Ren, D.C.; Xia, T.; Li, J.M.; Du, G.Y.; Wang, D.; Wang, Q.X.; Zhang, T. Marine ecological capital: Valuation methods of marine ecosystem services. Acta Ecol. Sin. 2013, 33, 6254–6263. [Google Scholar] [CrossRef]
- de Barros, M.S.F.; Rodriguez, A.R.; Bland, A.; Baker, R. Assessing Habitat Enhancement by Living Shoreline Restoration: Exploring Potential Caveats of Nekton Community Metrics. Restor. Ecol. 2023, 31, e13935. [Google Scholar] [CrossRef]
- Saunders, M.I.; Doropoulos, C.; Bayraktarov, E.; Babcock, R.C.; Gorman, D.; Eger, A.M.; Vozzo, M.L.; Gillies, C.L.; Vanderklift, M.A.; Steven, A.D.L.; et al. Bright Spots in Coastal Marine Ecosystem Restoration. Curr. Biol. 2020, 30, R1500–R1510. [Google Scholar] [CrossRef]
- Osland, A.C.; Shao, C.; Skilton, L. Did It Work? Shifting Strategies for How We Assess Benefits to Communities from Long-Term Coastal Restoration Projects. Estuaries Coasts 2025, 48, 49. [Google Scholar] [CrossRef]
- Clarke, B.; Thet, A.K.; Sandhu, H.; Dittmann, S. Integrating Cultural Ecosystem Services Valuation into Coastal Wetlands Restoration: A Case Study from South Australia. Environ. Sci. Policy 2021, 116, 220–229. [Google Scholar] [CrossRef]
- Li, S.J.; Zheng, X.; Duo, Y.Z. Research progress in evaluation of ecological restoration effects. Acta Ecol. Sin. 2021, 41, 4240–4249. [Google Scholar]
- Chen, Z.Y.; Dai, Z.H. Application of group decision-making AHP of confidence index and cloud model for rock slope stability evaluation. Comput. Geosci. 2021, 155, 104836. [Google Scholar] [CrossRef]
- GB 3097-1997; Sea Water Quality Standard. Standards Press of China: Beijing, China, 1997.
- HY/T 0455.3-2024; Technical Specification for Effectiveness Assessment of Marine Ecological Restoration—Part 3: Bay. Standards Press of China: Beijing, China, 2024.
- Wang, J.; Li, H.Z. Study on chlorophyll and primary production in inshore waters of the Bohai Sea. Prog. Fish. Sci. 2002, 1, 23–28. [Google Scholar]
- Hu, P.; Yang, L.J. Preliminary Study on the Evaluation Method of Coastline Ecological Value. Price Theory Pract. 2019, 10, 133–136. [Google Scholar]
- Liu, X.; Wang, Y.; Costanza, R.; Kubiszewski, I.; Xu, N.; Gao, Z.; Liu, M.; Geng, R.; Yuan, M. Is China’s Coastal Engineered Defences Valuable for Storm Protection? Sci. Total Environ. 2019, 657, 103–107. [Google Scholar] [CrossRef]
- Zhang, Q.F.; Bai, J.; Ma, Y.Y.; Gao, W.S.; Tu, J.B. Research on the method for evaluating ecological restortaion effect in the coastal zone of Tianjin. Mar. Environ. Sci. 2019, 38, 782–789. [Google Scholar]
- Xie, G.D.; Zhi, L.; Lu, C.X.; Xiao, Y.; Chen, C. Expert Knowledge Based Valuation Method of Ecosystem Services in China. J. Nat. Resour. 2008, 5, 911–919. [Google Scholar]
- GB 18668-2002; Marine Sediment Quality Standard. Standards Press of China: Beijing, China, 2002.
- Kenny, I.; Connell, S.D.; Drew, G.; Wright, A.; Carruthers, S.; McAfee, D. Aligning Social and Ecological Goals for Successful Marine Restoration. Biol. Conserv. 2023, 288, 110357. [Google Scholar] [CrossRef]
- Ouyang, Y.R.; Cai, L.; Li, Q.S.; Dai, J.J.; Fang, J.; Wu, Y.J. Practice and Exploration on the Marine Ecological Restoration of the Large-scale Reclamation Projects. Ocean Dev. Manag. 2021, 38, 74–79. [Google Scholar]
- Li, J.L.; Shen, M.H.; Ma, R.F.; Yang, H.S.; Chen, Y.N.; Sun, C.Z.; Liu, M.; Han, X.Q.; Hu, Z.D.; Ma, X.G. Marine resource economy and strategy under the background of marine ecological civilization construction. J. Nat. Resour. 2022, 37, 829–849. [Google Scholar] [CrossRef]

| Target Layer | Criterion Layer | Factor Layer | Indicator Layer | Index Description |
|---|---|---|---|---|
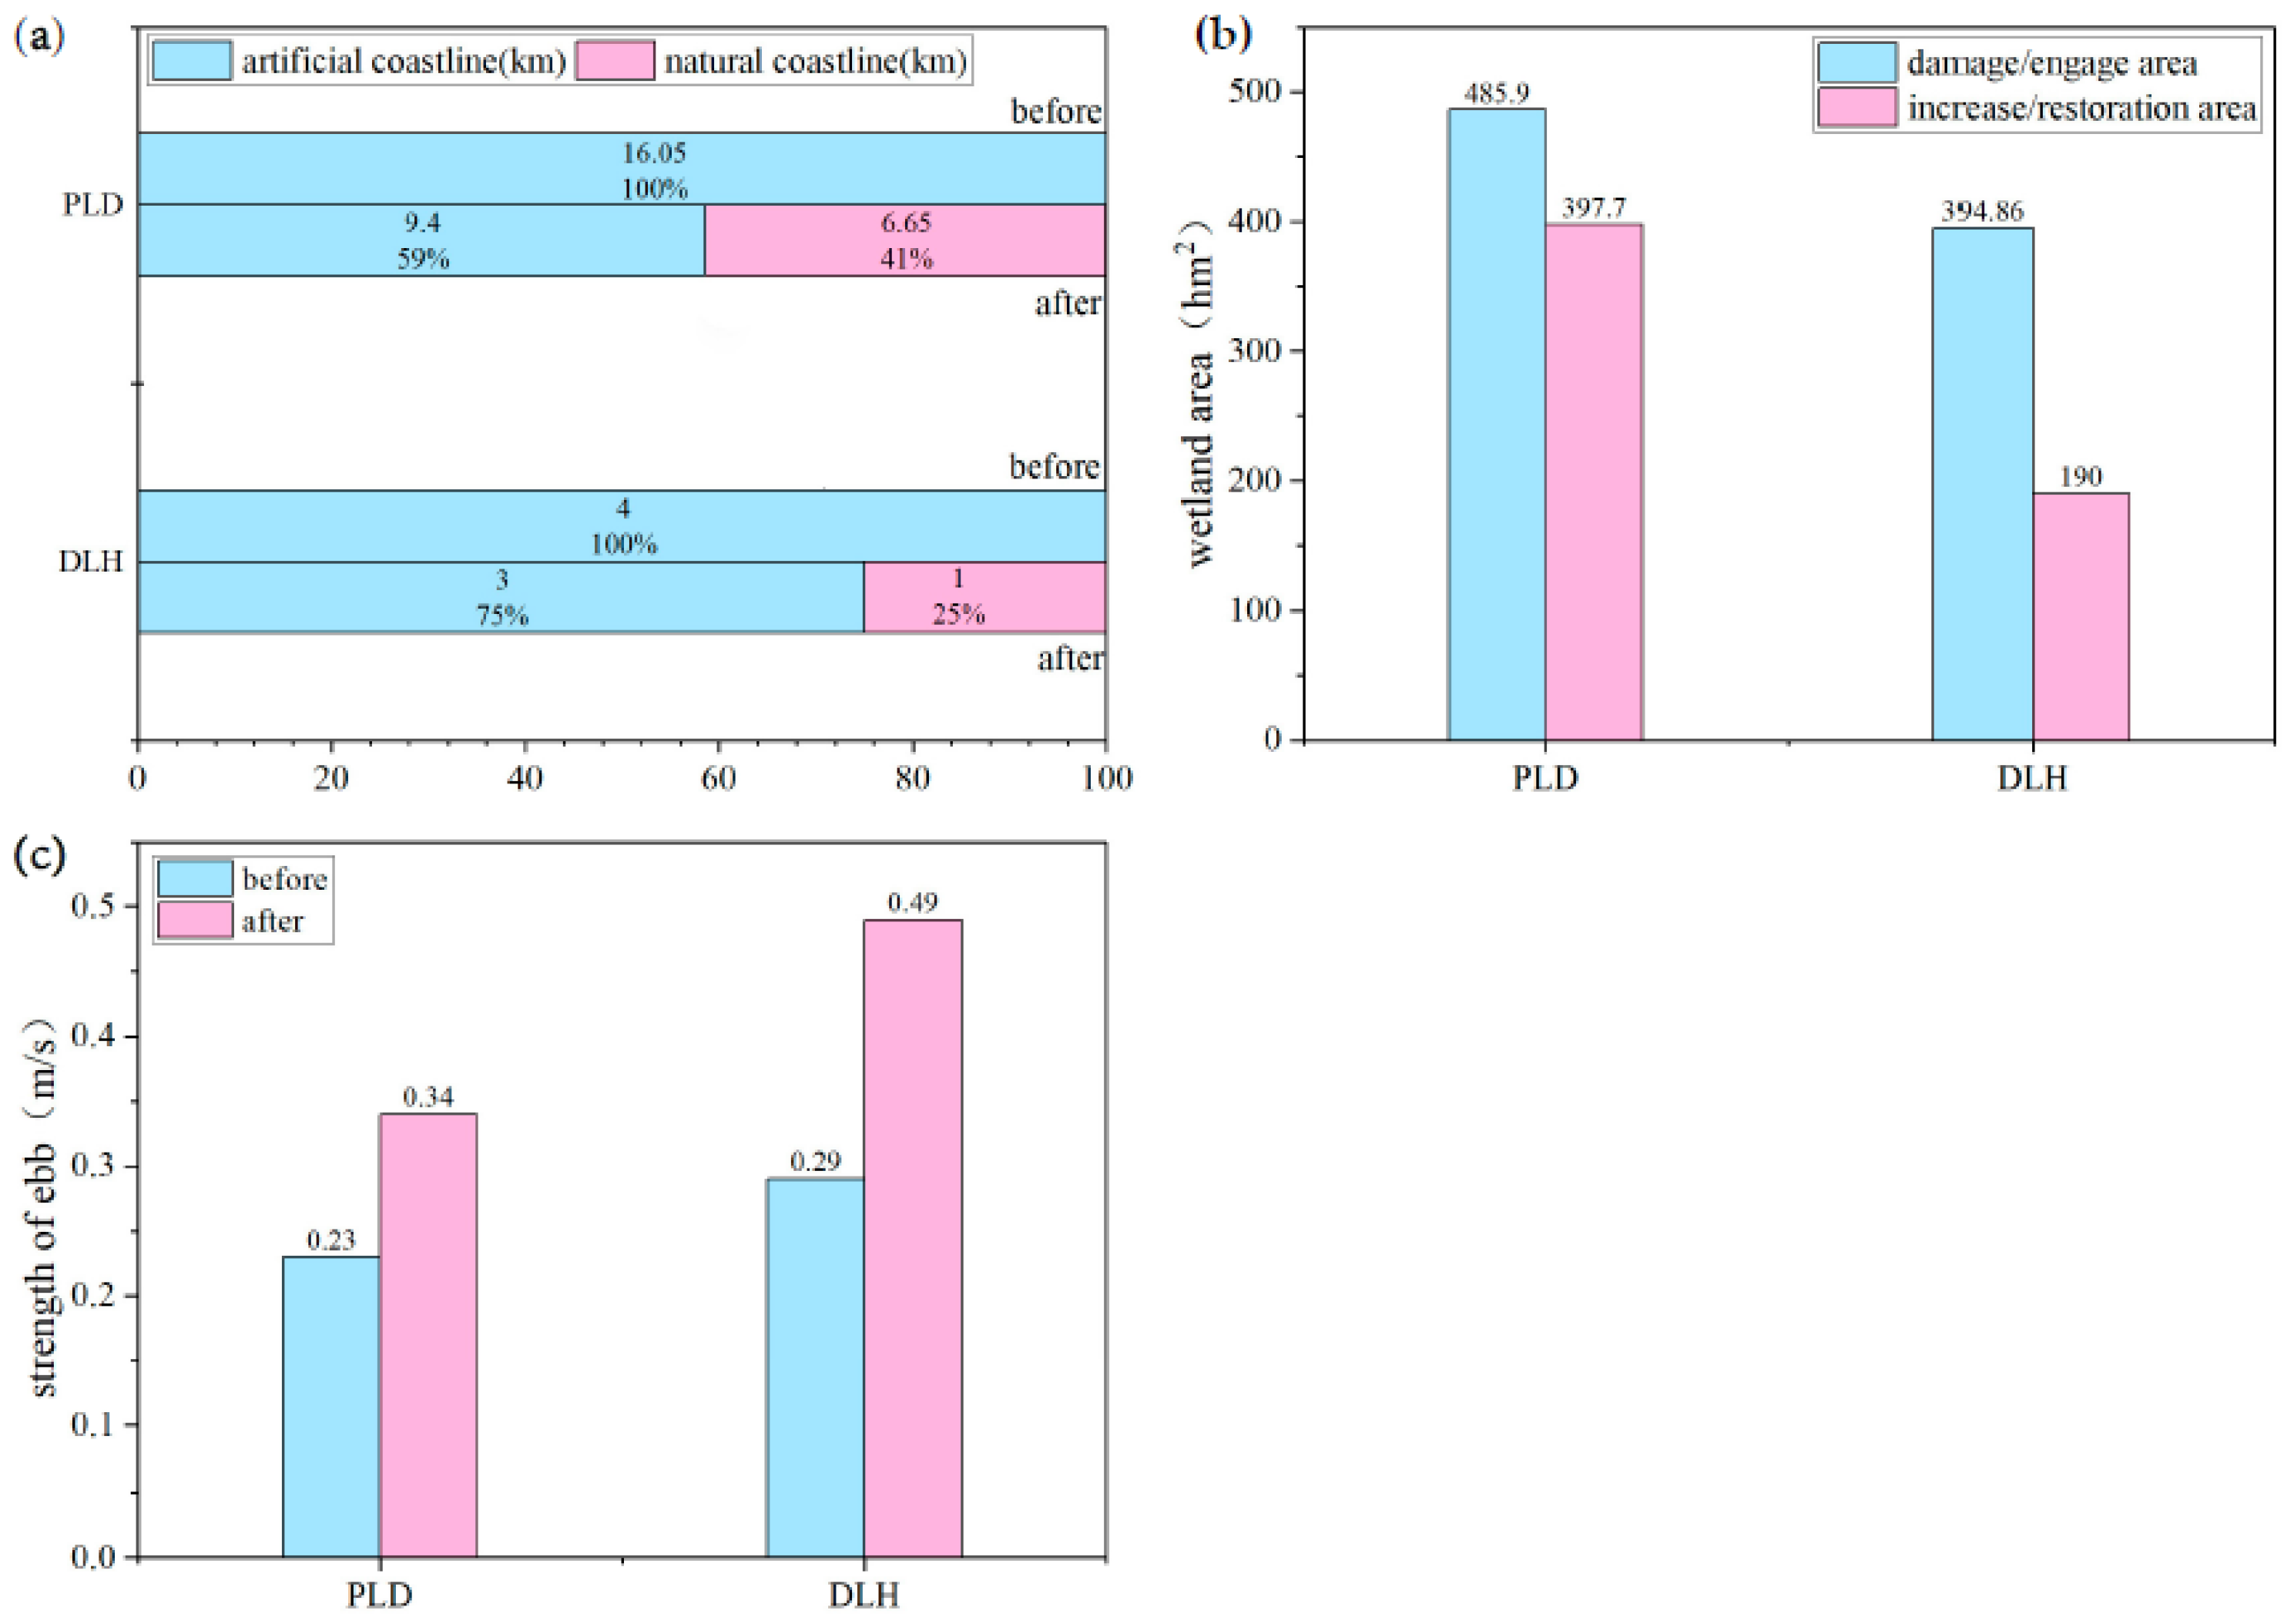
| A Effectiveness of marine ecological restoration projects | B1 Ecological environment | C1 Environmental quality | D1 Strength of ebb | The average velocity change of surface ebb tide in sea area |
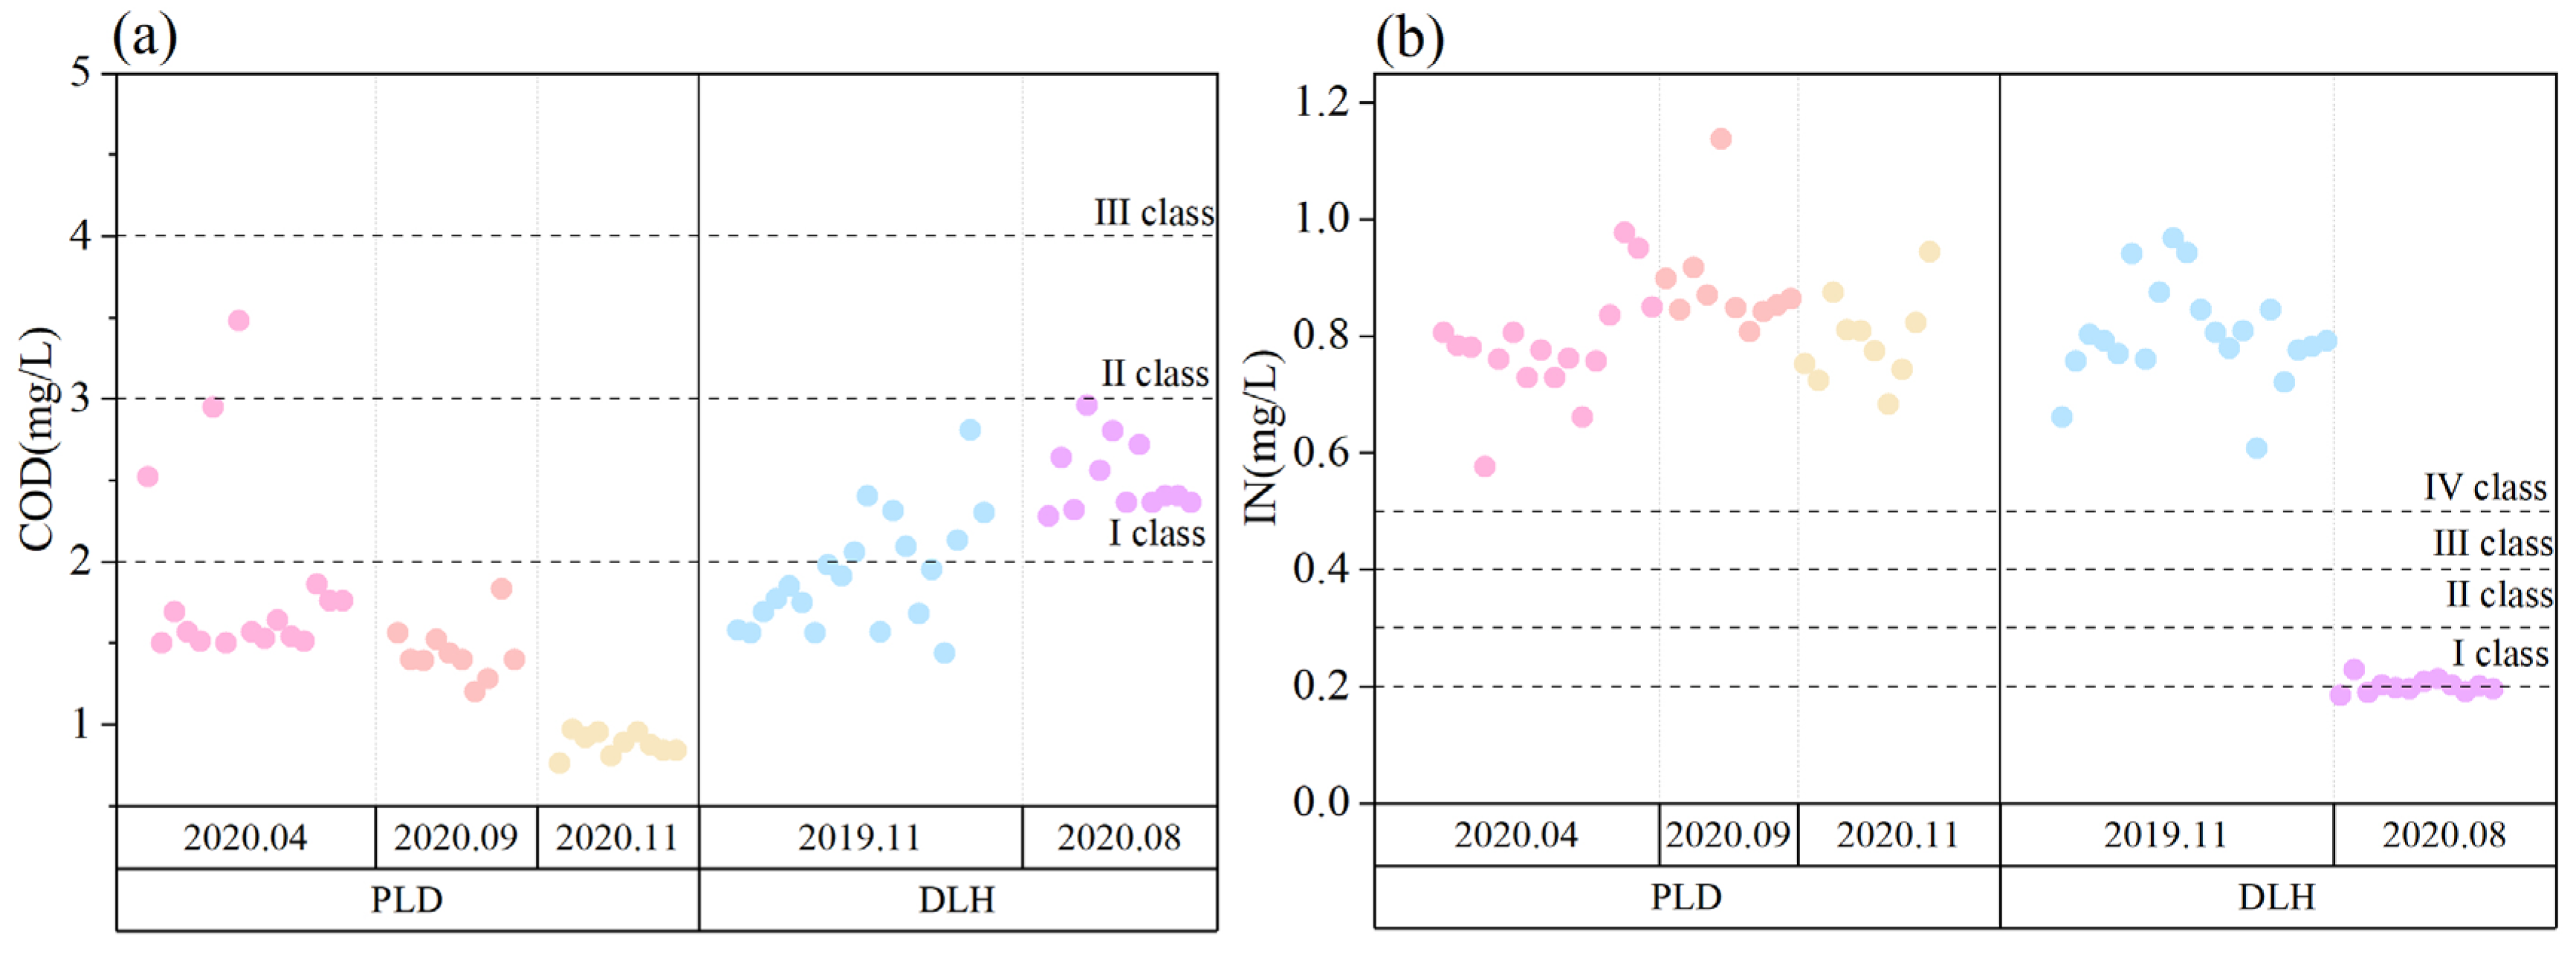
| D2 Seawater quality | Change degree of seawater quality index | |||
| D3 Sediment quality | Change degree of sediment quality | |||
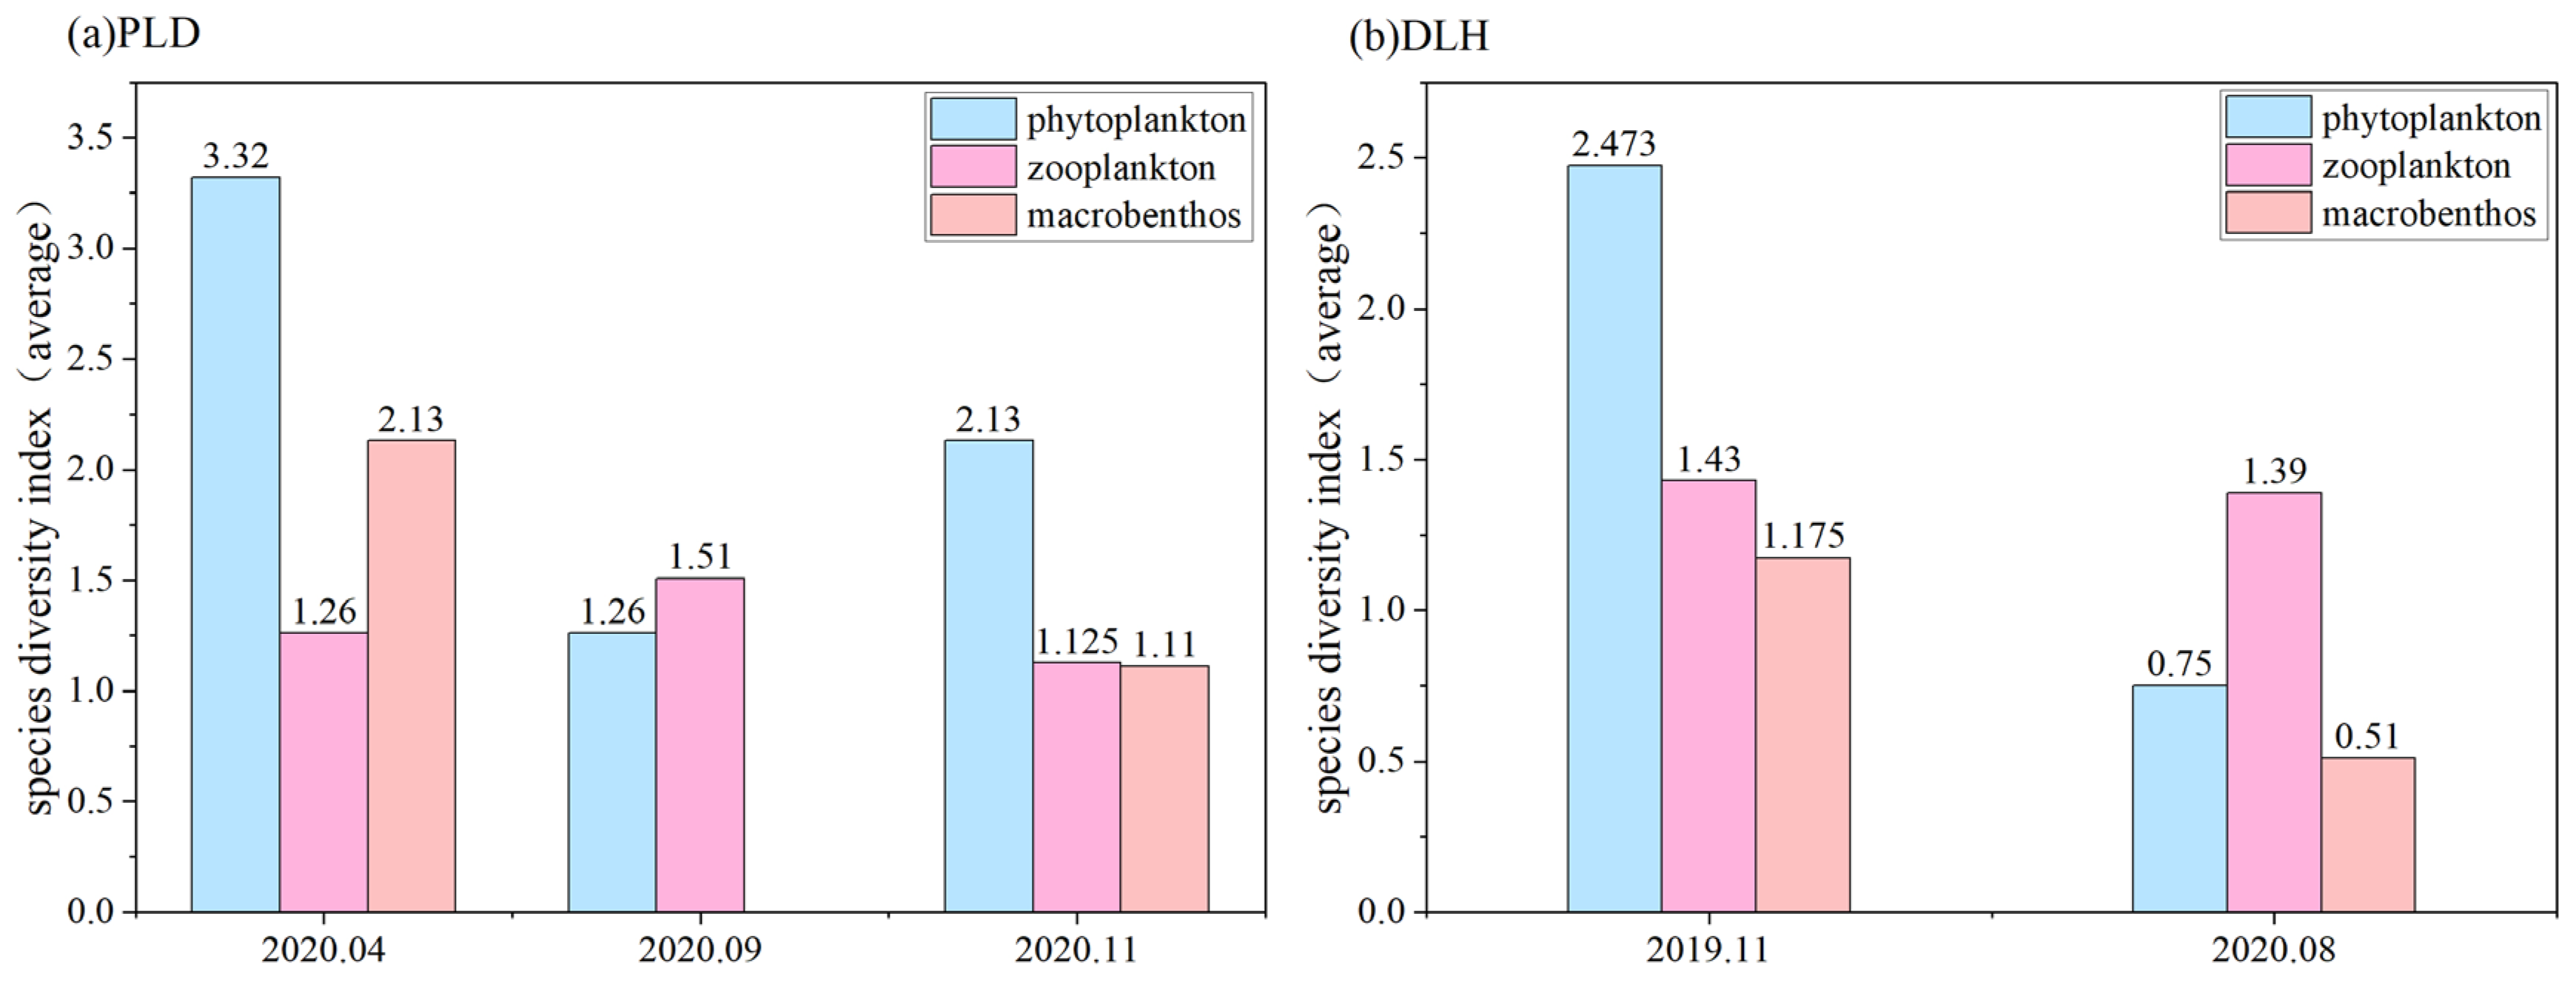
| C2 Biological environment | D4 Macrobenthos species diversity | Change of regional macrobenthos species diversity index | ||
| D5 Zooplankton species diversity | Change of regional zooplankton species diversity index | |||
| D6 Phytoplankton species diversity | Change of regional phytoplankton species diversity index | |||
| C3 Space scale | D7 Shoreline ecologization rate | The change ratio of the proportion of the length of the continental ecological shoreline | ||
| D8 Ecological restoration area | Restoration of ecological restoration area | |||
| C4 Ecosystem services | D9 Supply service | Rate of change in total value of supply service | ||
| D10 Regulation service | Rate of change in total value of regulation service | |||
| D11 Cultural service | Rate of change in total value of cultural service | |||
| B2 Social benefit | C5 Social satisfaction | D12 Repair effect satisfaction | Degree of public satisfaction with the ecological restoration projects in terms of improvement in the quality of the surrounding environment and enhancement of marine ecological functions | |
| C6 Social impact | D13 Public participation | Degree of public participation or intent to participate in ecological restoration projects | ||
| D14 Degree of impact on productive life | Extent of impact of ecological restoration works on the production and living conditions of the population | |||
| B3 Economic benefit | C7 Economic effect degree | D15 Income impact on residents | Extent of impact of ecological restoration on household income of the population | |
| C8 Social recognition of economic benefits | D16 Level of social recognition of economic benefits | Public recognition and acceptance of the project in terms of economic benefits |
| n | 1 | 2 | 3 | 4 | 5 | 6 | 7 | 8 | 9 | 10 |
|---|---|---|---|---|---|---|---|---|---|---|
| R.I. | 0 | 0 | 0.52 | 0.89 | 1.12 | 1.24 | 1.36 | 1.41 | 1.46 | 1.49 |
| B Layer | C Layer | D Layer | |||||
|---|---|---|---|---|---|---|---|
| Criterion Layer | A–B Weight | Factor Layer | B–C Weight | Index | C–D Weight | A–D Weight | Order |
| B1 | 0.7405 | C1 | 0.2384 | D1 | 0.4607 | 0.0813 | 4 |
| D2 | 0.2857 | 0.0504 | 9 | ||||
| D3 | 0.2536 | 0.0448 | 14 | ||||
| C2 | 0.1937 | D4 | 0.3333 | 0.0478 | 11 | ||
| D5 | 0.3333 | 0.0478 | 11 | ||||
| D6 | 0.3333 | 0.0478 | 11 | ||||
| C3 | 0.3036 | D7 | 0.5346 | 0.1202 | 1 | ||
| D8 | 0.4654 | 0.1046 | 2 | ||||
| C4 | 0.2643 | D9 | 0.2846 | 0.0557 | 7 | ||
| D10 | 0.4677 | 0.0916 | 3 | ||||
| D11 | 0.2477 | 0.0485 | 10 | ||||
| B2 | 0.1406 | C5 | 0.5614 | D12 | 1 | 0.0789 | 5 |
| C6 | 0.4386 | D13 | 0.4654 | 0.0287 | 16 | ||
| D14 | 0.5346 | 0.0330 | 15 | ||||
| B3 | 0.1890 | C7 | 0.4254 | D15 | 1 | 0.0506 | 8 |
| C8 | 0.5746 | D16 | 1 | 0.0683 | 6 | ||
| Indicator | Calculation of Indicator | Formula | Interpretation |
|---|---|---|---|
| Strength of ebb | Change rate of ebb flow velocity | —Total number of detection stations. | |
| Seawater quality | Change rate of seawater quality index | —Change rate of seawater quality —Sea water quality index before ecological restoration. | |
| —Grade number of seawater quality, with reference to GB3097-1997 [42] “seawater quality standard”; the seawater quality is divided into five grades: class I, class II, class III, class IV, and inferior class IV; —The total number of seawater quality testing stations [33]. | |||
| Sediment quality | Change rate of sediment quality | —Total number of sediment monitoring stations before ecological restoration [43]. | |
| Macrobenthos species diversity | Rate of change of macrobenthos diversity index | —Pre-restoration biodiversity index; —Number of all individuals at the survey station. | |
| Zooplankton species diversity | Rate of change of zooplankton diversity index | ||
| Phytoplankton species diversity | Rate of change of phytoplankton diversity index | ||
| Shoreline ecologization rate | Rate of change in shoreline ecologization rate | —Percentage of ecological shoreline length before ecological restoration (%). | |
| —Total shoreline length (km) [33]. | |||
| Ecological restoration area | Wetland area restoration rate | —Area of wetland destroyed/occupied before ecological restoration (hm2). |
| Ecosystem Services | Service Value Elements | Assessment Methodology | Formula | Interpretation |
|---|---|---|---|---|
| Supply service | Food supply | Market price method | —Sea area (hm2). | |
| Oxygen production | Substitute cost method | —Primary productivity of phytoplankton (327 mgC/m2d [44];—Unit cost of artificially production of oxygen (CNY/t) (CNY 400/t); 2.67—Coefficient of oxygen release from phytoplankton; S—Sea area (km2). | ||
| Regulation service | Interference regulation | Substitute cost method | —Artificial shoreline construction cost (30 million/km [45]); —Annual maintenance cost (CNY 4.49 million/km [46]) | |
| Climate regulation | Substitute cost method | [47]); 3.67—Phytoplankton carbon dioxide fixation coefficient; S—Sea area (km2) | ||
| Cultural service | Leisure and recreation | Result-checking method | [48]); S—Sea area (hm2) | |
| Scientific research and education | Direct Cost Method | —Input of scientific research funding per marine scientific and technological thesis (based on the China Marine Statistical Yearbook 2017 to obtain the funding for a single marine scientific and technological thesis in 2016, taking into account the year of general inflation and corrected calculated that the funding for thesis in 2020 is about CNY 1,554,700/paper). |
| Satisfaction Level of Restoration Effect | Assessment Criteria |
|---|---|
| very satisfied | (80,100] |
| more satisfied | (60,80] |
| general | (40,60] |
| unsatisfied | (20,40] |
| very dissatisfied | [0,20] |
| Score | 100 | 75 | 50 | 25 | 0 |
|---|---|---|---|---|---|
| Strength of ebb (%) | ≥30 | [20,30) | [10,20) | [0,10) | <0 |
| Seawater quality (%) | ≥10 | [6,10) | [3,6) | [0,3) | <0 |
| Sediment quality (%) | ≥10 | [6,10) | [3,6) | [0,3) | <0 |
| Macrobenthos species diversity (%) | ≥30 | [20,30) | [10,20) | [0,10) | <0 |
| Zooplankton species diversity (%) | ≥30 | [20,30) | [10,20) | [0,10) | <0 |
| Phytoplankton species diversity (%) | ≥30 | [20,30) | [10,20) | [0,10) | <0 |
| Shoreline ecologization rate (%) | ≥20 | [10,20) | [5,10) | [0,5) | <0 |
| Ecological restoration area (%) | ≥40 | [25,40) | [10,25) | [0,10) | <0 |
| Supply service (%) | ≥40 | [25,40) | [10,25) | [0,10) | <0 |
| Regulation service (%) | ≥40 | [25,40) | [10,25) | [0,10) | <0 |
| Cultural service (%) | ≥40 | [25,40) | [10,25) | [0,10) | <0 |
| Repair effect satisfaction | very satisfied | more satisfied | general | unsatisfied | very dissatisfied |
| Public participation | high participation or willingness to participate | higher participation or willingness to participate | general | lower participation or willingness to participate | low participation or willingness to participate |
| Degree of impact on productive life | obvious positive impact | some positive impact | general | some negative impact | obvious negative impact |
| Income impact on residents | obvious positive impact | some positive impact | general | some negative impact | obvious negative impact |
| Level of social recognition of economic benefits | very agree | comparative agree | general | disagree | very disagree |
| Marine Ecological Restoration Effect Grade | Assessment Criteria |
|---|---|
| excellent | (80,100] |
| good | (60,80] |
| general | (40,60] |
| worse | (20,40] |
| bad | [0,20] |
| Indicator | PLD | DLH | ||
|---|---|---|---|---|
| Evaluation | Score | Evaluation | Score | |
| Repair effect satisfaction | very satisfied | 95.52 | very satisfied | 96.92 |
| Public participation | higher participation or willingness to participate | 84.70 | higher participation or willing-ness to participate | 86.64 |
| Degree of impact on productive life | some positive impact | 60.45 | some positive impact | 60.27 |
| Income impact on residents | general | 51.86 | general | 53.77 |
| Level of social recognition of economic benefits | very agree | 90.67 | very agree | 93.15 |
| Indicator | Score | A–D Weight | Indicator Score | Factor Layer Score | Criterion Layer Score | Result |
|---|---|---|---|---|---|---|
| Strength of ebb | 100 | 0.0813 | 8.13 | C1 12.75 | B1 56.41 | A 77.18 |
| Seawater quality | 25 | 0.0504 | 1.26 | |||
| Sediment quality | 75 | 0.0448 | 3.36 | |||
| Macrobenthos species diversity | 50 | 0.0478 | 2.39 | C2 7.17 | ||
| Zooplankton species diversity | 50 | 0.0478 | 2.39 | |||
| Phytoplankton species diversity | 50 | 0.0478 | 2.39 | |||
| Shoreline ecologization rate | 100 | 0.1202 | 12.02 | C3 22.48 | ||
| Ecological restoration area | 100 | 0.1046 | 10.46 | |||
| Supply service | 0 | 0.0557 | 0 | C4 14.01 | ||
| Regulation service | 100 | 0.0916 | 9.16 | |||
| Cultural service | 100 | 0.0485 | 4.85 | |||
| Repair effect satisfaction | 95.52 | 0.0789 | 7.54 | C5 7.54 | B2 11.96 | |
| Public participation | 84.70 | 0.0287 | 2.43 | C6 4.42 | ||
| Degree of impact on productive life | 60.45 | 0.0330 | 1.99 | |||
| Income impact on residents | 51.86 | 0.0506 | 2.62 | C7 2.62 | B3 8.81 | |
| Level of social recognition of economic benefits | 90.67 | 0.0683 | 6.19 | C8 6.19 |
| Indicator | Score | A–D Weight | Indicator Score | Factor Layer Score | Criterion Layer Score | Result |
|---|---|---|---|---|---|---|
| Strength of ebb | 100 | 0.0813 | 8.13 | C1 16.53 | B1 58.98 | A 80.19 |
| Seawater quality | 100 | 0.0504 | 5.04 | |||
| Sediment quality | 75 | 0.0448 | 3.36 | |||
| Macrobenthos species diversity | 50 | 0.0478 | 2.39 | C2 7.17 | ||
| Zooplankton species diversity | 50 | 0.0478 | 2.39 | |||
| Phytoplankton species diversity | 50 | 0.0478 | 2.39 | |||
| Shoreline ecologization rate | 100 | 0.1202 | 12.02 | C3 22.48 | ||
| Ecological restoration area | 100 | 0.1046 | 10.46 | |||
| Supply service | 0 | 0.0557 | 0 | C4 12.8 | ||
| Regulation service | 100 | 0.0916 | 9.16 | |||
| Cultural service | 75 | 0.0485 | 3.64 | |||
| Repair effect satisfaction | 96.92 | 0.0789 | 7.65 | C5 7.65 | B2 12.13 | |
| Public participation | 86.64 | 0.0287 | 2.49 | C6 4.48 | ||
| Degree of impact on productive life | 60.27 | 0.0330 | 1.99 | |||
| Income impact on residents | 53.77 | 0.0506 | 2.72 | C7 2.72 | B3 9.08 | |
| Level of social recognition of economic benefits | 93.15 | 0.0683 | 6.36 | C8 6.36 |
Disclaimer/Publisher’s Note: The statements, opinions and data contained in all publications are solely those of the individual author(s) and contributor(s) and not of MDPI and/or the editor(s). MDPI and/or the editor(s) disclaim responsibility for any injury to people or property resulting from any ideas, methods, instructions or products referred to in the content. |
© 2025 by the authors. Licensee MDPI, Basel, Switzerland. This article is an open access article distributed under the terms and conditions of the Creative Commons Attribution (CC BY) license (https://creativecommons.org/licenses/by/4.0/).
Share and Cite
Yuan, Y.; Song, J.; Liu, M.; Li, J.; Yang, J.; Zhang, Y. Construction and Application of Marine Ecological Restoration Project Effect Assessment System Based on Analytic Hierarchy Process. Water 2025, 17, 1334. https://doi.org/10.3390/w17091334
Yuan Y, Song J, Liu M, Li J, Yang J, Zhang Y. Construction and Application of Marine Ecological Restoration Project Effect Assessment System Based on Analytic Hierarchy Process. Water. 2025; 17(9):1334. https://doi.org/10.3390/w17091334
Chicago/Turabian StyleYuan, Yitong, Jun Song, Ming Liu, Jingwen Li, Jun Yang, and Yan Zhang. 2025. "Construction and Application of Marine Ecological Restoration Project Effect Assessment System Based on Analytic Hierarchy Process" Water 17, no. 9: 1334. https://doi.org/10.3390/w17091334
APA StyleYuan, Y., Song, J., Liu, M., Li, J., Yang, J., & Zhang, Y. (2025). Construction and Application of Marine Ecological Restoration Project Effect Assessment System Based on Analytic Hierarchy Process. Water, 17(9), 1334. https://doi.org/10.3390/w17091334