Abstract
This study investigates the incipient motion and scouring of sediments around simulated submarine cables in a controlled flume experiment, focusing on five distinct grain sizes in an experimental pool. The measured incipient velocity values were compared with predictions from three established formulas, leading to a modification of the Sun Zhilin formula for improved accuracy. By incrementally increasing flow velocity, the scour depth and scour duration were measured required to expose cables buried at varying depths for different sediment sizes, and the relationships between scour rate, relative flow rate, and Froude number were analyzed. The results indicate that as the Froude number increases, both the relative flow velocity and scour rate increase, thereby enhancing the erosion of sediment. The modified formula demonstrated a higher consistency with observed scour depths, providing a reliable tool for assessing submarine cable exposure risks. These findings offer valuable insights for developing effective protection strategies to enhance cable stability in complex marine environments. This research highlights the importance of understanding sediment dynamics and their impact on submarine cable stability, contributing to the development of more effective protection strategies for submarine cables in dynamic seabed conditions.
1. Introduction
Since the deployment of the world’s first submarine cable in the 1950s, seabed scouring has been identified as the primary cause of most submarine cable failures [1,2]. To mitigate the impact of scouring induced by ocean currents and wave action, submarine cable routes are meticulously pre-planned, incorporating advanced construction techniques such as mechanical trenching [3]. This method involves burying the cable at depths ranging from 1 to 2.5 m beneath the seabed, significantly reducing its exposure to erosive forces. Consequently, the implementation of anti-scouring protection measures, along with ongoing maintenance and management of submarine cables, is of paramount importance to ensuring their long-term stability and functionality [4,5,6,7,8].
Scholars have extensively studied sediment transport mechanisms and developed multiple sediment incipient velocity formulas by integrating sedimentology research with controlled scouring experiments [9,10,11]. Their findings indicate that when hydrodynamic velocity and energy exceed critical thresholds, sediment particles begin to move, initiating the scouring process. As hydrodynamic forces intensify, sediment transport accelerates, potentially exposing and jeopardizing buried submarine cables. Understanding these dynamics is crucial for designing effective anti-scouring strategies, optimizing cable burial depths, and enhancing the resilience of submarine communication and power transmission networks. Recent studies employing stochastic and modified sediment transport methodologies have further corroborated the positive correlation between incipient velocity and water depth in both cohesive and non-cohesive sediments [12,13,14]. For instance, Dodaro et al. developed a modified Einstein sediment transport model to simulate scour evolution, emphasizing the role of hydrodynamic shear stress and sediment cohesion in regulating scour dynamics [12]. Tafarojnoruz and Sharafati extended this understanding by formulating stochastic models for velocity thresholds in storm sewers, revealing that sediment mobility in natural channels depends critically on flow depth and turbulence characteristics [13]. Similarly, Sharafati et al. utilized a stochastic framework to predict pier scour depth in cohesive beds, demonstrating that water depth significantly influences the equilibrium between erosive forces and sediment resistance [14]. These approaches highlight the importance of considering sediment properties and hydrodynamic conditions in predicting scour dynamics.
Most existing studies primarily focus on verifying prediction formulas for non-uniform sediment particle sizes and their incipient velocities through laboratory experiments and field observations. However, current experimental research on sediment scouring is largely concentrated on local scouring around hydraulic structures [15,16], such as piers and dikes, with relatively limited studies addressing natural scouring in the absence of artificial structures. This gap in research highlights the need for a more comprehensive understanding of sediment transport dynamics in complex marine environments. This gap in research highlights the need for a more comprehensive understanding of sediment transport dynamics in complex marine environments. Fredsøe and Hansen proved that potential theory can well predict the final gap under the pipeline [17]. Because potential flow theory predicts that the flow velocity under the pipeline near the bed is much larger than the velocity above, they modified the potential flow description, adding a vortex tube to ensure a more accurate description of the flow under the pipeline. For sediment transport as steady flow [18,19,20,21,22], the near-bed flow velocity under the pipeline decreases to equal the far-field velocity at the riverbed, and the model predicted the scour depth under the pipeline; however, downstream of the pipeline, the evolution of the riverbed profile is too complex, and simple models cannot obtain the true profile of the scoured seabed [23].
Extensive research has focused on local scouring around hydraulic structures such as piers and pipelines [24,25]. Moreover, the natural scour processes within the environment of submarine cables have become a significant focus of contemporary research [26]. Particularly challenging is the fact that submarine cable routes frequently traverse dynamic seabeds composed of cohesive and heterogeneous sediments, complicating the study of these environments [27].
This study seeks to identify a more applicable incipient velocity formula suited for the complex hydrodynamic conditions along the target submarine cable route. Using clear-water mobile bed experiments with five characteristic sediment sizes, this study systematically investigates the relationships between sediment incipient motion and key hydrodynamic factors, such as the influences of sediment size, water depth, constant flow velocity, and scouring duration on sediment erosion processes. These findings contribute to a deeper understanding of natural seabed scouring and provide valuable insights for the design and maintenance of submarine cable burial strategies.
2. Materials and Methods
2.1. Simulated Submarine Cable
For typical submarine power grid installations, mechanical jet trenching is commonly employed to excavate seabed trenches for cable laying. The submarine cable used in such applications is a standard composite fiber-optic triple-tube design with 48-core G652. Optical fibers and steel armor protection, featuring an outer diameter of 200 mm. The detailed cable structure is shown in Figure 1.

Figure 1.
Composite 3 tubes × 48 core G652 optical fiber.
Figure 1 presents a schematic diagram of the submarine cable structure, illustrating the arrangement of optical fibers and conduits. This design allows the cable to effectively transmit electrical signals while providing protection against marine challenges. The installation of submarine cables requires careful planning tailored to specific engineering needs and seabed topography. Our experimental methodology simulates scour conditions at varying elevations within the flume, directly relevant to the seabed conditions where cables are embedded. As the cable is buried, local scour does not affect our experiments; instead, we focus on the incipient velocity of sediment under natural scour conditions. This study establishes a theoretical framework essential for understanding sediment movement in relation to submerged cables, aligning theoretical insights with practical engineering considerations for cable protection.
To simulate scouring effects, the model cable adopts a BVR4 square millimeter three-core flexible copper wire compliant with national standards. The conductor material is 99.99% oxygen-free pure copper, insulated with eco-friendly polyvinyl chloride (PVC), and colored black. The average outer diameter of the model cable is 2 mm, resulting in a geometric scaling ratio of for this experiment.
2.2. Experimental Equipment and Instruments
The experiment was conducted in a flume at the Ocean College of Zhejiang University, measuring 5 m in length, 5 m in width, and 1.2 m in depth. To achieve uniform flow conditions, a baffle was installed at the inlet, facilitating the generation of transverse two-dimensional planar flow. Additionally, energy dissipation devices were incorporated at the outlet to minimize flow disturbances. A centrifugal pump was utilized to create a recirculating water flow, as illustrated in Figure 2. The flume contains five sediment test zones for non-uniform natural sands with distinct characteristic particle sizes. Each zone features five 18 × 38 cm sediment recesses filled with five different-sized natural sands. The remaining areas are covered with a phenolic resin powder base layer in Figure 3. Figure 3 illustrates the arrangement of sediments with varying particle sizes before scouring. In this setup, sediments of different sizes were placed side by side in the flume, allowing for the observation of interactions between the various particle sizes. Within the model zones (sediment blocks), simulated submarine cables are embedded at depths of 1 cm, 2 cm, and 3 cm below the sediment surface across all five particle size groups.
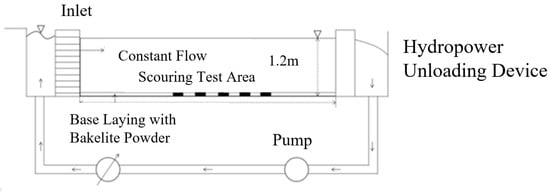
Figure 2.
Arrangement of flushing test flume.

Figure 3.
Layout of scouring test areas with different sediment particle sizes. (a) 10 μm and 50 μm test area; (b) 5 μm and 10 μm test area; (c) 150 μm and 350 μm test area; (d) Internal arrangement of single sediment scouring area.
The flume’s 1.2 m depth enables water flow conditions ≤1.2 m, corresponding to the actual cable route’s water depth range of 5–52.8 m. Water depth decreases near the coast. Using a depth scaling ratio of , the experimental water depth was designed within 0.05–0.55 m.
Flow velocity is regulated by the pump and measured using an LYS-89A digital current meter, produced in the China. Scouring commences once a steady flow is achieved, with the velocity stabilized and uniformly distributed across the model section. Water depth is calibrated using a side-mounted scale and verified vertically with an H-40 laser rangefinder, produced in the China. Post-sediment initiation, an i-speed high-speed camera (2000 fps) captures particle movement to determine instantaneous velocities.
2.3. Model Design
Along the submarine cable route, 83 seabed sediment samples were collected in the East China Sea, revealing an average water depth of 5~25 m. The tidal waves in the East China Sea advance in the form of progressive waves, moving from the southeast to the northwest. As these waves propagate into the Zhoushan archipelago, they are fragmented by a series of islands, including Liuheng, Taohua, Zhujiajian, Daishan, Qushan, and Shengsi, resulting in multiple tidal currents. The study area is located between Qushan Island and Sijiaoshan, characterized by numerous islands of varying sizes that significantly influence the local topography. As a result, the direction of the flood currents predominantly trends northwest or west, while the ebb currents generally flow southeast or east. The maximum flood current velocity recorded at the measurement points reaches 192 cm/s, while the maximum ebb current velocity attains 235 cm/s. The occurrence frequency of vertical mean flow velocities exceeding 153 cm/s ranges between 1.5% and 10.0%. During typhoon events, the maximum storm surge current velocity in this region can reach as high as 3.5 m/s [28].
Based on the dimensions of the basin and the sea area, appropriate scale ratios can be established. The initial water depth of the prototype basin is maintained at 0.25 m, and the selected scale ratios for the model are determined as follows: the depth scale ratio is , and the velocity scale ratio is .
Particle size analysis via mastersizer 2000 laser granulometer, produced in the UK, showed sediment diameters ranging from 3 to 350 μm, with median diameters (D50) between 7 and 31 μm. Median diameters decreased near the coast and increased offshore. Five characteristic sediment sizes were selected to measure incipient velocity, scouring depth, and duration.
2.4. Experimental Procedures
The experimental sediment consisted of phenolic resin powder with a particle size range of 500–1000 μm. The formal experiment began with the preparation of the model zones: five sediment types with distinct particle sizes were placed and leveled within the model area to a thickness of approximately 30 cm. A pump was then activated to initiate slow water inflow, ensuring minimal disturbance to the underlying sediment. Water was gradually raised to the target depth, and a high-speed camera was directed at the sediment blocks in the test area to confirm no sediment movement. The pump output was incrementally adjusted to achieve the calculated flow velocity in the flume.
Flow velocities were recorded using the Acoustic Doppler Velocimeter (ADV) meter positioned 5 cm above the sediment bed. Scour depths were measured every 5 min using an H-40 laser rangefinder, and sediment initiation was verified via i-speed high-speed camera footage (2000 fps). Data analysis focused on time-averaged velocities and equilibrium scour depths, with uncertainties quantified using a ±2% error margin for velocity and ±1 mm for depth.
Water depth was regulated via a tailgate, with 11 predefined depth groups for sediment initiation: 0.05 m, 0.1 m, 0.15 m, 0.2 m, 0.25 m, 0.3 m, 0.35 m, 0.4 m, 0.45 m, 0.5 m, and 0.55 m. Based on the average water depth of 5~25 m from 83 sampling points, the initial experimental water depth was set to 0.25 m. For scouring analysis, three additional depth groups (0.26 m, 0.27 m, and 0.28 m) were established, corresponding to cables buried at 1 cm, 2 cm, and 3 cm depths within the sediment blocks.
When the initial water depth reached 0.25 m, the high-speed camera immediately recorded minor sediment movement and the corresponding instantaneous incipient velocity. Sustained scouring under steady flow continued until the cable buried at a depth of 1 cm (equivalent to a water depth of 0.26 m) became exposed, with the scouring duration recorded. Following this procedure, the flow velocity was gradually increased to monitor the exposure of cables buried at 2 cm (0.27 m) and 3 cm (0.28 m) depths. The instantaneous incipient velocities and scouring durations for these depths were documented. Subsequent increases in flow velocity, combined with applicable incipient velocity formulas, enabled the calculation of natural scouring depths.
For each test group, the instantaneous flow velocity at sediment initiation, the scouring duration until cable exposure, and the equilibrium scouring depth were recorded. After each trial, the sediment was replenished, and the flume was drained to prepare for subsequent experiments.
3. Experimental Results and Discussion
3.1. Sediment Incipient Velocity Formulas
Numerous scholars worldwide have conducted experimental and theoretical studies on sediment incipient motion, particularly focusing on uniform and non-uniform sediments. Zhang Ruijin, a pioneering researcher in China, proposed in 1961 the concept of cohesive force in sediments, incorporating atmospheric pressure, water column pressure, and hydrodynamic effects on particles. Through experiments and theoretical derivation, he established a unified incipient velocity formula for cohesive uniform sediments applicable to varying particle sizes (Equation (1)):
where and represent the densities of sediment and water, respectively. In this experimental setup, natural sediment with and water density were adopted. Here, denotes the incipient particle diameter corresponding to the critical velocity , is the mean particle diameter, represents the water depth, and is the gravitational acceleration.
Dou Guoren refined cohesive uniform sediment incipient velocity formulas from 1974 to 1999, considering interparticle cohesive forces exceeding gravitational and hydrostatic pressures. His modified practical formula (Equation (2)) is as follows:
where denotes the dry density of sediment, which ranges from 1.15 to 1.45 t/m3 for unconsolidated natural sediment. represents the stabilized dry density of sediment, taken as 1.6 t/m3 for natural sediment. is the characteristic thickness of interparticle voids, set to 2 × 10⁻⁷ m, and denotes the comprehensive cohesion parameter with a value of 1.75 × 10⁻⁶ m3/s2. For particle sizes , is assigned 5 × 10⁻⁴ m, and the bed roughness height is specified as 0.001 m.
Sediment incipient motion involves stochastic mechanical and geometric factors, including drag, lift, submerged weight, and cohesive forces. Sun Zhilin’s formula integrates probability theory and mechanics to derive the incipient friction velocity for cohesive non-uniform sediments. Using a logarithmic velocity distribution, the friction velocity is converted to depth-averaged velocity (Equation (3)) [10]:
where represents the bed roughness taken as , and the standard deviation indicates the non-uniformity degree of sediment composition. denotes the additional hydraulic head from molecular adhesion. Existing experiments demonstrate that ranges from 1.226 to 10 m, and the geometric mean of these values () is generally adopted. Based on Sun Zhilin’s measured data [10], the constant is determined to be 0.03–0.05, and a value of 0.04 is selected for this study.
3.2. Experimental Results of Sediment Incipient Velocity
As shown in Table 1 and Figure 4, the measured incipient velocities generally increase with water depth across all sediment sizes. These findings are of significant reference value for understanding the initiation behavior of riverbed sediments and for related engineering designs. The observations indicate that the critical flow velocity of the modeled sediment is influenced by water depth and exhibits a degree of particle size dependency. At shallower depths (h < 0.3m), incipient velocities for all five particle sizes (5–350 μm) remain relatively low (0.1–0.6 m/s). As the water depth increases, the critical flow velocity for sediment mobilization shows a discernible trend. Coarser sediments exhibit relatively minor variations in flow velocity across different water depths, indicating a lower variance and suggesting a more stable critical flow velocity. However, once the water depth exceeds 0.3 m, a significant change in the critical flow velocity of the five sediment sizes is observed. This variability may be attributed to alterations in hydrodynamic conditions resulting from the increased water depth, which subsequently affects the mobilization behavior of the sediments.

Table 1.
Measured incipient velocity statistics (m/s).
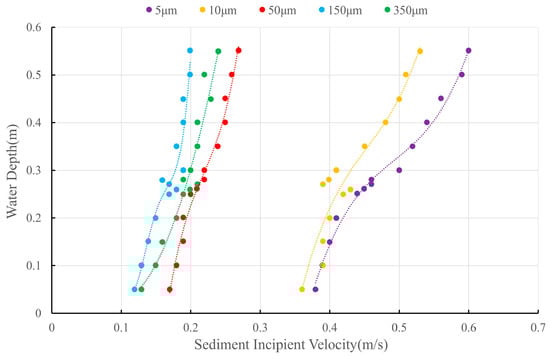
Figure 4.
Measured incipient velocity of model sand.
Based on the data presented in Table 1 and Figure 4, the 5 μm sediment exhibited the highest average incipient velocity (0.47 m/s), while the 150 μm sediment showed the lowest (0.17 m/s). Notably, the 50 μm and 350 μm sediments displayed higher incipient velocities than the 150 μm group. Larger particles (e.g., 150 μm) demonstrated minimal velocity variance with depth changes (maximum–minimum difference: 0.08 m/s), whereas smaller particles (e.g., 5 μm) exhibited significant velocity increases (0.19 m/s variation between 0.2–0.55 m depth).
The 10 μm sediment showed anomalous behavior at 0.26–0.28 m depths, likely due to experimental variability or measurement errors. The largest velocity gap (0.22 m/s) occurred between the 10 μm and 50 μm groups, highlighting substantial incipient velocity changes in this size range.
The observed differences in velocity profiles among various particle sizes can be attributed to the distinct behaviors of fine and coarse sediments. For finer particles, such as those around 150 μm, cohesive forces play a significant role, leading to a reduction in the incipient motion velocity as particle size increases. Conversely, for coarser particles, such as those measuring 350 μm, gravitational forces dominate, resulting in an increase in the incipient motion velocity with larger particle sizes. This duality in the effects of cohesion and gravity explains why the velocity of the larger particles is greater than that of the smaller ones.
These results confirm a positive correlation between incipient velocity and water depth. Comparative analysis of the three formulas reveals that smaller particles (5–10 μm), dominated by cohesive forces, require higher drag for initiation, while larger particles (150–350 μm), governed by gravitational forces, exhibit lower and more stable incipient velocities. For the studied cable route (average depth: 25 m), sediments in the 50–150 μm range are most susceptible to scouring. Smaller particles (5–10 μm) demonstrate strong cohesion, making them resistant to initiation, whereas intermediate sizes (50 μm) balance cohesive and gravitational effects, showing pronounced scouring vulnerability.
Key observations include the following:
- 5 μm sediment: Most sensitive to depth changes, with a 0.19 m/s increase between 0.2 and 0.55 m.
- 10 μm sediment: Anomalous velocities at intermediate depths (0.26–0.28 m), suggesting experimental variability.
- 50 μm sediment: Marked velocity differences from the 10 μm group, indicating critical transitional behavior.
- 150 μm sediment: Minimal velocity variation (0.08 m/s range), lowest average velocity (0.12 m/s at 0.05 m).
- 350 μm sediment: Intermediate velocities between the 50 μm and 150 μm groups.
These findings align with theoretical predictions: cohesive forces dominate for fine sediments (<50 μm), requiring higher initiation velocities, while gravitational effects govern coarser particles (>150 μm). The 50–150 μm range represents a critical transition zone with optimal scouring susceptibility under typical marine conditions.
Figure 5 illustrates the scour depths of sediments with varying particle sizes at different water depths. For the 5 μm model sediment, the measured incipient velocities were consistently lower than the values predicted by all three formulas. Notably, both the calculated and measured velocities exhibited an increasing trend with rising water depth. As shown in Figure 5, Equation (2) aligned most closely with the measured values for 5 μm sediment, averaging only 0.14 m/s higher than the measured values. When the water depth exceeded 0.3 m, the measured values exhibited significantly accelerated growth and approached Equation (2) results. For water depths of 0.05–0.2 m, Equation (3) closely matched Equation (2), with an average deviation of only 0.07 m/s. Notably, Equation (1) yielded significantly higher values than the other two, averaging 47.35% above measured values, while Equation (3) showed an average deviation of 35.52%. Since a deviation threshold below 30% is required for applicability [11], Equations (1) and (3) are unsuitable for 5 μm sediment in this experiment. Equation (2), with an average deviation of 21.87%, proved applicable.

Figure 5.
Comparison between measured and calculated incipient velocity.
For the 10 μm model sediment (Figure 5), measured values remained lower than all three formula-calculated results. At water depths of 0.05–0.1 m and 0.4–0.55 m, measured values nearly overlapped with Equation (2), but, between 0.15 and 0.35 m, the measured values fluctuated slightly without clear depth-dependent trends. Equation (1) remained the highest, while Equation (3) fell between Equations (1) and (2). During the 0.25–0.3 m depth intervals, the 1 cm spacing in experimental depth settings likely introduced measurement variability due to external factors. Equation (1) showed an average deviation of 38.48%, rendering it inapplicable, while Equations (2) and (3) exhibited average deviations of 7.99% and 25.99%, respectively, meeting applicability criteria.
For the 50 μm model sediment, the measured and calculated velocities all fell below 0.5 m/s, aligning closely with Equations (3) and (2) (deviation: 1.95%). The sediment > 50 μm exhibited markedly lower incipient velocities than 5 μm and 10 μm. Equation (1) remained higher than the others, averaging 32.56% above Equation (3). With an average deviation of 32.75%, Equation (1) was inapplicable, while Equations (2) and (3) showed deviations <2%, demonstrating suitability.
For the 150 μm and 350 μm model sediment, Equation (1) significantly overestimated results compared to others. Equations (2) and (3) remained closely aligned, with average deviations of 0.005 m/s and 0.014 m/s, respectively. Equation (1) was inapplicable, while Equations (2) and (3) showed deviations <15%, with Equation (3) performing best (3.07% and 6.24% deviations).
3.3. Modification of Sediment Incipient Velocity Formula
Equations (1) and (2) are incipient motion formulas for uniform sediment, whereas the sediment in the cable-laying sea area is non-uniform. The model sediment used in this experiment is natural sediment, with the standard deviations () of the particle size distributions as follows: 4.31 for 5 μm, 4.22 for 10 μm, 3.35 for 50 μm, 2.77 for 150 μm, and 3.53 for 350 μm. Equation (3), designed for cohesive non-uniform sediment, better aligns with the actual conditions of the target sea area and this experimental study. Further exploration of Equation (3)’s applicability to fine-grained sediments with particle sizes below 50 μm will yield greater practical value.
Based on the experimental results, Equation (3) has been revised by calibrating the bed roughness and constant . Considering the characteristics of cohesive sediment, is set as for particle sizes exceeding 50 μm, while a fixed value is adopted for . Since tends to overestimate results for smaller particles, a value smaller than 0.04 was sought. Iterative calculations were performed to fit the measured incipient velocity data of 5 μm and 10 μm cohesive sediment under varying water depths, minimizing the sum of absolute deviations between calculated and measured values.
The optimized parameters are determined as follows: for the 5 μm and 10 μm particles, (0.000045 m) and , yielding absolute deviations of 0.05 m/s and 0.02 m/s from the measured velocity averages, respectively.
The revised Equation (3) is expressed as follows:
Parameter selection criteria:
- For median sediment particle sizes ≥ 50 μm, the results are as follows:
- For median sediment particle sizes < 50 μm, the results are as follows:
As shown in Figure 6 and Table 2, the deviations between calculated results from the revised Equation (3) and measured data are 1.01% and 4.20%, demonstrating its applicability for incipient velocity prediction of cohesive sediments.

Figure 6.
Comparison between the corrected calculated and measured values.
Table 2.
Comparison between modified calculated and measured values of incipient velocity.
3.4. Scour Duration Test Results and Analysis
This experiment involved clear-water live-bed scour tests. For each sediment size, the incipient velocity at a water depth of 0.25 m was used as the sustained flow velocity in the flume. The measured incipient velocities were 0.44 m/s for 5 μm sediment, 0.42 m/s for 10 μm, 0.2 m/s for 50 μm, 0.17 m/s for 150 μm, and 0.19 m/s for 350 μm. Two sustained scour velocities (0.2 m/s and 0.4 m/s) and a control group (0.5 m/s) were established. The durations required to expose cables by 1 cm, 2 cm, and 3 cm were recorded for each sediment size (Table 3 and Figure 7).
Table 3.
Duration of the scouring test for model sands (mins).
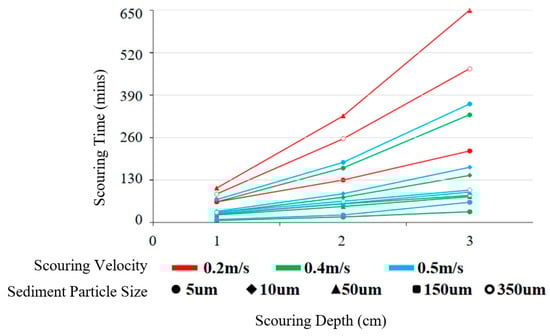
Figure 7.
Scouring duration with scouring depth.
Starting scour tests at a 25 cm water depth, exposure depths of 1 cm, 2 cm, and 3 cm were recorded as scour duration milestones. Figure 8 illustrates the relationship between sediment size, scour depth, and duration. As shown in Table 2, within the 5–350 μm range, smaller incipient velocities corresponded to greater scour extent, shorter durations, and faster depth progression.
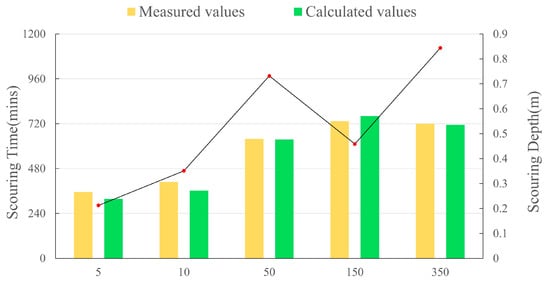
Figure 8.
Measured scouring depth of model sand.
The experimental results demonstrate a direct correlation between cable burial depth and scouring dynamics. For instance, at a water depth of 0.26 m (equivalent to 1 cm burial depth), the equilibrium scour depth was achieved faster due to reduced sediment cover (Table 3). This phenomenon can be attributed to the altered local flow patterns around the exposed cable, which intensify shear stress and accelerate sediment entrainment. Similar observations were reported by Chiew [18], who noted that partial exposure of submerged structures significantly amplifies localized turbulence, thereby reducing the time required to reach scour equilibrium. The accelerated scouring at shallow burial depths underscores the importance of optimizing cable burial strategies to mitigate exposure risks in dynamic marine environments.
The experiment utilized open-channel flow, where water directly contacts the atmosphere. Beyond fluid viscosity and inertia, gravity dominated, quantified by the Froude number :
where denotes the flow velocity in the basin, is the water depth, and represents gravitational acceleration. When the Froude number = 1, the flow is critical; when > 1, it transitions to supercritical flow; and, when < 1, the flow becomes subcritical. A scour rate formula is established as , where is the scour depth and is the duration. Using Table 3, scour rates for five sediment sizes under varying velocities were calculated and analyzed against the Froude number Fr and relative velocity (the ratio of scour velocity to critical velocity). Table 4 compares measured relative velocities (based on field data) with calculated relative velocities derived from Equation (3).
Table 4.
Statistics of scouring depth-related parameters.
For fine-grained sediments (5 μm and 10 μm), no scour occurred at 0.2 m/s. In contrast, 150 μm sediment exhibited the shortest durations t to reach scour depths of 1 cm, 2 cm, and 3 cm, yielding the highest scour rates . The scour rate directly correlates with critical velocity —a smaller corresponds to a larger . Additionally, inversely relates to water depth : greater depths reduce scour rates. The Froude number reflects flow intensity; at constant velocity, increasing decreases , weakening flow intensity and scour rates.
At 0.4 m/s, all five sediment sizes experienced scour. For 5 μm sediment, scour equilibrium (minimum ) occurred at = 28 cm. The remaining four sizes scoured three cable trenches, with average scour rates ranked in descending order: 150 μm > 350 μm > 50 μm > 10 μm. Both measured and calculated relative velocities () confirm that higher relative velocities amplify scour rates. When > 1, scour velocity exceeds critical velocity, significantly intensifying erosion. Natural sediment with particle size variances >1 was used in this experiment, explaining minor scour even at < 1. Since represents depth-averaged velocity and statistically corresponds to the velocity initiating motion for 5% of particles, partial scour persists at < 1.
At = 25 cm and = 0.5 m/s (exceeding all critical velocities), the factors influencing are most evident. Larger and correlate with higher , demonstrating enhanced sediment mobility under stronger hydrodynamic conditions.
The observed inverse relationship between scour rate and sediment size in Table 4 aligns with recent studies on cohesive sediment dynamics [26], which emphasized the dominance of cohesive forces in fine-grained sediments. However, our results diverge from conventional models by demonstrating that intermediate-sized particles (50–150 μm) exhibit transitional behavior, balancing cohesion and gravitational effects, as highlighted in recent analyses of non-uniform sediment transport [27]. This insight refines the understanding of sediment mobilization thresholds and provides a mechanistic basis for predicting scour vulnerability in submarine cable routes.
3.5. Scour Depth Test Results and Analysis
The revised Equation (3) in this experiment is applicable to sediment incipient motion in this study. Since sediment incipient motion initiates scour, the critical velocity can be utilized to calculate scour depth.
Typically, seabed sediment in natural marine environments remains stable (neither scoured nor deposited) under astronomical tidal currents. However, during typhoon-induced storm surges, sediment initiates motion when flow velocity exceeds the critical velocity (), triggering bed scour. Assuming a constant unit-width discharge , flow velocity decreases as scour depth increases, while critical velocity rises with scour depth until a new equilibrium is reached. At this stage, sediment returns to a critical incipient motion state, and flow velocity theoretically becomes lower than .
Substituting the revised critical velocity formula (Equation (3)) into the unit-width discharge equation yields Equation (5).
where is the only unknown variable, representing the calculated scour depth. The calculated scour depth is then validated using the constant unit-width discharge and compared with measured scour values.
This experiment investigates natural scour depth in a clear-water movable-bed flume. During the scouring phase, a flow velocity of 0.5 m/s was maintained to study scour progression. For each sediment size, scouring was conducted at a constant water depth of 0.25 m with unchanged unit-width discharge (). Scour equilibrium was defined as no further increase in depth over 2 h, measured using an H-40 laser rangefinder. Calculated scour depths based on Sun Zhilin’s formula were then compared with measured values.
According to the experimental design, the unit-width discharge was consistently maintained at 0.125 m2/s. Measured scour depths and calculated values from the revised Sun Zhilin’s formula are recorded in Table 5. Additionally, the measured unit-width discharge ( = measured critical velocity × measured scour depth) was verified against the constant design discharge to ensure consistency.
Table 5.
Depth at scouring equilibrium for model sands.
The 5 μm sediment, as shown in Table 2 of the scour duration records, exhibited the least scouring among the five sediment sizes. According to Sun Zhilin’s formula, a flow velocity of 0.5 m/s at h = 0.25 m precisely initiates bed sediment motion. Experimentally, after 170 min of scouring, equilibrium was achieved with no depth change for 120 min, yielding an extremely slow scouring process and a stabilized scour depth of 0.27 m. Given the standard deviation () of 1.46 for 5 μm sediment, this implies that particles significantly larger than 5 μm were likely entrained during scouring. The measured scour depth exceeded the calculated equilibrium value by 7.4%.
For 10 μm sediment, after 362 min of scouring, the measured depth stabilized at 0.31 m with a critical velocity and unit-width discharge . Using Sun Zhilin’s formula, the calculated scour depth is 0.275 m, resulting in an 11.3% overestimation by measurements.
Similarly, 50 μm sediment reached a stable scour depth of 0.48 m after 882 min, with a measured . The formula predicts a depth of 0.477 m at , showing a negligible deviation of 0.07%—the closest agreement.
Notably, 150 μm sediment, with the smallest critical velocity, demonstrated the most pronounced scouring. After 630 min, a 30 cm-thick sediment layer was fully eroded, achieving a scour depth of 0.55 m (highlighted in Figure 8). The calculated depth of 0.57 m aligns with experimental trends but exceeds the preset limit of 0.55 m.
For the largest size (350 μm), equilibrium required 1037 min, followed by 120 min of stability, yielding the maximum scour depth of 0.54 m. The formula predicts 0.51 m, differing by 5.6%.
The scour depth experiments confirm that Sun Zhilin’s formula, which slightly underestimates measured depths, remains applicable to 5 μm, 10 μm, 50 μm, and 350 μm sediments in this study. Calculated depths generally exceeded measurements by an average of 6.09%. With errors within 30%, the formula is suitable for submarine cable scour protection design in the target marine area.
4. Conclusions
This study systematically investigated the relationships among critical velocity, scour duration, and scour depth for five different sediment sizes under controlled experimental conditions. By evaluating various sediment incipient motion formulas, a particular focus was placed on identifying and refining a formula suitable for predicting sediment transport characteristics in the target marine environment. The findings provide valuable insights into sediment mobility and the mechanisms governing scour processes, which are essential for the design and protection of submarine cables.
Research indicates that the initiation flow velocity is correlated with water depth, with greater depths corresponding to higher sediment mobilization velocities. Empirical measurements and calculations confirm that, at the same water depth, sediment particles smaller than 150 μm exhibit an inverse relationship between particle size and initiation flow velocity; specifically, smaller particles require lower velocities to mobilize. Conversely, for particles larger than 150 μm, the initiation flow velocity increases with particle size. In this study, the maximum measured initiation flow velocity of approximately 0.6 m/s was observed for 5 μm sediment at a depth of 0.55 m.
The performance of the revised formula proposed in this study was evaluated across different sediment sizes. For particles equal to or larger than 50 μm, the formula exhibited strong agreement with experimental measurements, with an average deviation of 3.7%. However, for finer particles (<50 μm), deviations from measured velocities were observed, necessitating modifications to improve accuracy. By introducing refined parameters (= 0.045 mm and c = 0.033), the revised formula successfully reduced deviations to less than 5%, demonstrating its improved predictive capability for finer sediments.
The analysis of scour dynamics revealed that lower critical velocities are associated with shorter times required to achieve equilibrium scour depths and increased scour rates. This suggests that finer sediments, which are more readily mobilized, experience a more rapid evolution of scour compared to coarser sediments. Furthermore, higher Froude numbers (Fr) and relative velocities (/) significantly enhance scour rates, underscoring the critical role of hydrodynamic forces in sediment transport processes. These findings highlight the importance of flow conditions in determining scour depth and duration, particularly in marine environments where strong currents and wave action significantly influence sediment stability.
The practical applicability of the revised formula was further assessed through scour depth predictions for sediments of 5 μm, 10 μm, 50 μm, and 350 μm. The formula demonstrated reliable performance, with an average error of 6.09%, and all discrepancies remained within 30%. This validation confirms the formula’s suitability for estimating natural scour depths, providing a robust theoretical foundation for submarine cable protection design and other marine engineering applications.
Overall, this study advances the understanding of sediment transport mechanisms by systematically analyzing the influence of sediment size, water depth, and flow velocity on scour dynamics. The refined predictive model enhances the accuracy of scour depth estimations, contributing to improved engineering designs for coastal and offshore infrastructure. Future work should prioritize field-scale validation under real-world tidal and storm conditions, alongside investigations into sediment cohesion variability with moisture and clay content. Integrating stochastic frameworks and multi-phase flow models could further bridge gaps between laboratory predictions and natural scour behavior, ultimately advancing global submarine cable resilience.
Author Contributions
Conceptualization, F.C.; methodology, W.Y.; software, F.C.; validation, F.C.; investigation, F.C.; resources Z.S.; writing—original draft preparation, W.Y. and F.L.; writing—review and editing, F.C. and L.Z.; writing—original draft, F.C. and F.L. All authors have read and agreed to the published version of the manuscript.
Funding
This study received support and funding from the National Key R&D Program of China (2023YFC3008100) and Major Scientific and Technological Project of Zhoushan City: “Early Warning and Disaster Prevention of Scour around Cross Sea Bridge Foundation (2024C03006)”.
Data Availability Statement
The data used to support the findings of this study are available from the corresponding author upon request.
Conflicts of Interest
No potential conflicts of interest were reported by the authors.
References
- Zhao, M.; Cheng, L.; Zang, Z. Experimental and Numerical Investigation of Local Scour around a Submerged Vertical Circular Cylinder in Steady Currents. Coast. Eng. 2010, 57, 709–721. [Google Scholar] [CrossRef]
- Zhang, M.; Huang, Y.; Bao, Y. The Mechanism of Shallow Submarine Landslides Triggered by Storm Surge. Nat. Hazards 2016, 81, 1373–1383. [Google Scholar] [CrossRef]
- Yang, Q.H.; Yang, Q.; Zhang, Y.Q. Numerical Investigation of the Flow-Field Characteristics around the Suspended Pipeline under Oblique Flows. Water Supply 2022, 22, 4361–4372. [Google Scholar] [CrossRef]
- Zhao, X.F.; Ba, Q.; Li, L.; Gong, P.; Ou, J.P. A Three-Index Estimator Based on Active Thermometry and a Novel Monitoring System of Scour under Submarine Pipelines. Sens. Actuators A Phys. 2012, 183, 115–122. [Google Scholar] [CrossRef]
- Lee, Y.S.; Kim, S.; Yu, Y. A Study on the Selection of Target Ship for the Protection of Submarine Power Cable. J. Korean Soc. Mar. Environ. Saf. 2018, 24, 662–669. [Google Scholar] [CrossRef]
- Wargo, R.; Davenport, T. Protecting Submarine Cables from Competing Uses. In Submarine Cables; Brill Nijhoff: Leiden, The Netherlands, 2014; pp. 255–279. [Google Scholar]
- Yoon, H.S.; Na, W.B. Anchor Drop Tests for a Submarine Power-Cable Protector. Mar. Technol. Soc. J. 2013, 47, 72–80. [Google Scholar] [CrossRef]
- Matsumoto, H.; Araki, E.; Kimura, T. Detection of Hydroacoustic Signals on a Fiber-Optic Submarine Cable. Sci. Rep. 2021, 11, 2797. [Google Scholar] [CrossRef]
- Dou, G.R. On the Starting Velocity of Sediment. J. Hydraul. Eng. 1960, 4, 44–60. (In Chinese) [Google Scholar]
- Zhang, R.J.; Xie, J.H.; Chen, W.B. River Dynamics; China Industry Press: Beijing, China, 1961. (In Chinese) [Google Scholar]
- Sun, Z.L.; Xie, J.H.; Duan, W.Z.; Xie, B.L. Research on the Starting Law of Non-Uniform Sand Grading. J. Water Resour. 1997, 10, 26–33. (In Chinese) [Google Scholar]
- Dodaro, G.; Tafarojnoruz, A.; Sciortino, G.; Adduce, C.; Calomino, F.; Gaudio, R. Modified Einstein Sediment Transport Method to Simulate the Local Scour Evolution Downstream of a Rigid Bed. J. Hydraul. Eng. 2016, 142, 04016041. [Google Scholar] [CrossRef]
- Tafarojnoruz, A.; Sharafati, A. New Formulations for Prediction of Velocity at Limit of Deposition in Storm Sewers Based on a Stochastic Technique. Water Sci. Technol. 2020, 81, 2634–2649. [Google Scholar] [CrossRef] [PubMed]
- Sharafati, A.; Tafarojnoruz, A.; Yaseen, Z.M. New Stochastic Modeling Strategy on the Prediction Enhancement of Pier Scour Depth in Cohesive Bed Materials. J. Hydroinform. 2020, 22, 457–472. [Google Scholar] [CrossRef]
- Guo, Z.; Zhou, W.; Zhu, C.; Yuan, F.; Rui, S. Numerical Simulations of Wave-Induced Soil Erosion in Silty Sand Seabeds. J. Mar. Sci. Eng. 2019, 7, 52. [Google Scholar] [CrossRef]
- Pike, S.M.; van Zyl, J.E.; Clayton, C.R.I. Scouring Damage to Buried Pipes Caused by Leakage Jets: Experimental Study. J. Pipeline Syst. Eng. Pract. 2018, 9, 04018020. [Google Scholar] [CrossRef]
- Fredsøe, J.; Hansen, E.A. Lift Forces on Pipelines in Steady Flow. J. Waterw. Port Coast. Ocean Eng. 1987, 113, 139–155. [Google Scholar] [CrossRef]
- Chiew, Y.M. Prediction of Maximum Scour Depth at Submarine Pipelines. J. Hydraul. Eng. 1991, 117, 452–466. [Google Scholar] [CrossRef]
- Hossein Kazeminezhad, M.; Yeganeh-Bakhtiary, A.; Etemad-Shahidi, A. Two-Phase Simulation of Wave-Induced Tunnel Scour beneath Marine Pipelines. J. Hydraul. Eng. 2012, 138, 517–529. [Google Scholar] [CrossRef]
- Rui, S.; Guo, Z.; Wang, L.; Wang, H.; Zhou, W. Inclined Loading Capacity of Caisson Anchor in South China Sea Carbonate Sand Considering the Seabed Soil Loss. Ocean Eng. 2022, 260, 111790. [Google Scholar] [CrossRef]
- Melville, B.; van Ballegooy, S.; Coleman, S.; Barkdoll, B. Scour Countermeasures for Wing-Wall Abutments. J. Hydraul. Eng. 2006, 132, 563–574. [Google Scholar] [CrossRef]
- Jung, C.K.; Park, H.S.; Yang, B.M. Establishment of EMTP Modeling Method Using Searching Coil Test for HVDC Submarine Cables. Trans. Korean Inst. Electr. Eng. 2010, 59, 1593–1599. [Google Scholar]
- Zhao, X.; Yan, X.; Zhang, X. Progress of Active Thermometry Method in Submarine Pipeline Scour Monitoring. In Proceedings of the ASME 2018 Conference on Smart Materials, Adaptive Structures and Intelligent Systems, San Antonio, TX, USA, 10–12 September 2018; Volume 2, p. V002T05A014. [Google Scholar]
- Yang, S.; Tang, G.; Liu, Y.; Zhang, W.; Sun, J. CFD and machine learning approach based-predictive modeling of scouring below submarine pipeline under wave and current condition. J. Mar. Sci. Technol. 2024, 1–22. [Google Scholar]
- Welzel, M.; Raaijmakers, T.C.; van der Woude, J.H.; de Vet, P.L.M.; Hulscher, S.J.M.H. Scour variability across offshore wind farms (OWFs): Understanding drivers from field data and implications for prediction methods. Wind Energy Sci. Discuss. 2025, 1–35. [Google Scholar]
- Guo, Z.; Zhu, C.; Zhang, P.; Yuan, F.; Wang, X. Numerical Study of the Local Scouring Process and Influencing Factors of Semi-Exposed Submarine Cables. J. Mar. Sci. Eng. 2023, 11, 1349. [Google Scholar] [CrossRef]
- Paterson, D.M.; Hope, J.A.; Kenworthy, J.; Stark, J. Sticky stuff: Biological cohesion for scour and erosion prevention. Environ. Technol. 2022, 43, 4427–4438. [Google Scholar]
- Sun, Z.; Ding, K.; Li, Z. An Analytic Model of Typhoon Wind Field and Simulation of Storm Tides. Front. Mar. Sci. 2023, 10, 1253357. [Google Scholar] [CrossRef]
Disclaimer/Publisher’s Note: The statements, opinions and data contained in all publications are solely those of the individual author(s) and contributor(s) and not of MDPI and/or the editor(s). MDPI and/or the editor(s) disclaim responsibility for any injury to people or property resulting from any ideas, methods, instructions or products referred to in the content. |
© 2025 by the authors. Licensee MDPI, Basel, Switzerland. This article is an open access article distributed under the terms and conditions of the Creative Commons Attribution (CC BY) license (https://creativecommons.org/licenses/by/4.0/).