Abstract
Mathematical models and methods serve as fundamental tools for studying ice-related phenomena in the Yellow River. River ice is driven and constrained by hydrometeorological and geographical conditions, creating a complex system. Regarding the Yellow River, there are some uncertainties that manifest in unique features in this context, including ice–water–sediment mixed transport processes and the distribution of sediment both within the ice and on its surface. These distinctive characteristics are considered to different degrees across different scales. Mathematical models for Yellow River ice developed over the past few decades not only encompass models for the large-scale deterministic evolution of river ice formation and melting, but also uncertainty parameter schemes for deterministic mathematical models reflecting the Yellow River’s particular ice-related characteristics. Moreover, there are modern mathematical results quantitatively describing these characteristics with uncertainty, allowing for a better understanding of the unique ice phenomena in the Yellow River. This review summarizes (a) universal equations established according to thermodynamic and hydrodynamic principles in river ice mathematical models, as well as (b) uncertainty sources caused by the river’s characteristics, ice properties, and hydrometeorological conditions, embedded in parametric schemes reflecting the Yellow River’s ice. The intractable uncertainty-related problems in space–sky–ground telemetric image segmentation and the current status of mathematical processing methods are reviewed. In particular, the current status and difficulties faced by various mathematical models in terms of predicting the freeze-up and break-up times, the formation of ice jams and dams, and the early warning of ice disasters are presented. This review discusses the prospects related to the uncertainties in research results regarding the simulation and prediction of Yellow River ice while also exploring potential future trends in research related to mathematical methods for uncertain problems.
1. Introduction
The formation of river ice is a process controlled by thermal, dynamical, and morphological factors. Considering its temperature-sensitive nature and proximity to human habitats, river ice has exhibited significant changes in the context of global warming, reflecting the difficulties that humans face in adapting to its impacts. Prowse et al. [1] classified these issues into ecological and socio-economic effects and adaptations, including six dimensions: lentic and lotic water ecosystems, river delta ecosystems, cold region infrastructure, transportation, traditional lifestyles, and hydropower generation.
In both the natural and engineering sciences, mathematical tools are essential for comprehending and quantitatively describing the essence of research subjects. The complexity of a research subject determines the mathematical methods required for its analysis. Indeed, the application degree of mathematics serves as an indicator of a scientific field’s maturity. Zheng [2], citing reports from other scholars, has stated that the maturity of any scientific discipline is largely dependent on the successful integration of mathematical tools.
As mankind’s understanding of the change rule of river ice advances, there is an increasing demand for more precise assessment and prediction methodologies. Mathematical models and methods play a crucial role in this field, enabling researchers to simulate ice evolution processes under diverse hydrometeorological conditions and transform qualitative observations into quantifiable mathematical representations. The laws and characteristics of ice formation and melting process can be accurately expressed through analytical or numerical calculations [3,4]. While certain river ice processes remain mathematically unmodeled, various mathematical tools facilitate deeper understanding of the complex phenomena and laws governing its evolution. These tools aid in elucidating the behavioral characteristics [5] and predicting the development of ice [6].
The complexity of natural sciences necessitates the development of mathematical models that reflect essential characteristics while emphasizing the primary cause of the problem, thereby facilitating mathematical derivation. A judiciously simplified mathematical model must ensure that a computed result with acceptable error margins is obtained while satisfying the necessary preconditions of the chosen mathematical methodology. Multiple mathematical models can be formulated for a natural problem, with the optimal model emerging through iterative testing and comparative analysis during the research process.
Mathematical models undergo continuous refinement through iterative testing and application, evolving from problem-specific models into universal models describing the same natural phenomenon [7]. In river ice research, two primary mathematical models predominate: deterministic models [3,4] and stochastic models [6,8]. Deterministic models employ various mathematical equations to characterize regular ice phenomena governed by fixed causes, while stochastic models utilize traditional and contemporary mathematical techniques to represent probabilistic ice phenomena. The research object is treated as a stochastic process, which follows statistical laws while encompassing multiple possible outcomes. Notably, the deterministic and stochastic aspects of river ice phenomena are not completely separate. Certain existing deterministic models introduce multiple stochastic factors, resulting in the formation of mathematical models such as statistical equations. The inherent randomness can also be expressed using specified parameter ranges, manifesting as bifurcated and chaotic stochastic behavior, which are established through corresponding mathematical parameterization schemes [9].
Various mathematical models of ice encompass multi-factor and multi-process coupled equations. Contemporary model development is carried out by expanding upon the foundational ideas of one-dimensional river ice mathematical models. Numerous parametric schemes persist, which aim to capture the uncertainties in the fundamental process equations of these models. As examples of one-dimensional river ice mathematical models, this review delves into the mathematical models and methodologies pertinent to four aspects of river ice: ice forming and melting, river ice applications, space–air–ground/ice integrated investigation, and ice disaster warning. Consequently, the study encompasses deterministic models, statistical equations for certain parameters within some deterministic models, and the latest advancements in stochastic modeling. In addition to scrutinizing mathematical models and methodologies, this review succinctly delineates the essential characteristics of the Yellow River’s ice. It also sheds light on existing research gaps, challenges, and future research directions, with the aim of improving mathematical models and methods for the study of ice phenomena.
2. Mathematical Equations and Methods for the Processes of River Ice Formation and Melting
2.1. General Processes of River Ice Formation and Melting
The evolution of river ice formation and melting is primarily controlled by three types of factors: thermal, dynamical, and morphological factors. Thermal factors include heat exchange at air, ice, water, and riverbed interfaces, driven by hydrometeorological conditions including solar radiation, convective heat exchange, evaporation/condensation latent heat, precipitation/snowfall, and riverbed thermal flux. Dynamic factors comprise meteorological and hydraulic elements that influence the transport of frazil ice and ice floes, primarily flow rate, flow velocity, water level, and wind. Morphological factors include the horizontal and vertical boundary constraints affecting the movement of water, wind, and ice, mainly including channel alignment, geographic location, and topography. Different stages of the ice formation process in the Yellow River have been documented in detail [10,11,12].
During the river ice period, the evolution of river ice formation and melting according to the time scale can be categorized into following periods: supercooled water, ice runs, ice cover formation, freeze-up thermal growth, and break-up [13]. Ice crystal formation initiates when the water’s temperature decreases to the freezing point (around 0 °C) or below due to cold air. In this process, two primary ice formation patterns emerge. Ice crystals accumulate along riverbanks where flow velocities are low, forming incipient border ice. Under sustained negative temperatures, this incipient border ice increases in thickness and extends toward the channel’s center, eventually forming a stable ice cover connected to the riverbank. Continuous heat loss in the river’s central region increases the volume of frazil particles developed by crystal nuclei. When the buoyant forces acting on these particles exceed the vertical downward mixing forces induced by turbulent flow, a dense layer of frazil particles accumulates at the water’s surface. The frazil particles aggregate into dense, flocculent frazil particle clusters due to continued heat release. These frazil particle clusters transform into ice disk-shaped frazil particles when the water inside the pores of the clusters freezes, resulting in increased bond strength and thickness. As these ice disk-shaped frazil particles are transported downstream, their volume and strength increase continuously, while their edges become upturned through repeated collisions, forming distinctive ice pans. These ice pans typically accumulate at downstream river bends, channel constrictions, and hydraulic structures, forming initial ice covers through mechanical obstruction. These ice covers subsequently impede the movement of continuous floating ice blocks, leading to upstream ice accumulation and ice cover development. The rate of upstream progression of the ice cover’s leading edge is governed by two primary factors: the incoming ice volume and the thickness of the newly formed ice cover, which is determined by hydrodynamic conditions at the ice cover’s leading edge. Under low-velocity conditions, a single-layer ice cover forms with thickness approximating that of ice pans, which is called juxtaposed freeze-up ice. Conversely, high-velocity conditions promote the squeezing, overlapping, and accumulation of floating ice blocks, resulting in thicker composite ice covers. Once the broken ice freezes, these formations develop into deposition freeze-up ice [11]. When flow velocities at the ice cover’s leading edge exceed a critical threshold, floating ice blocks and frazil particles are forced beneath the existing ice cover rather than accumulating upstream. These submerged ice blocks either accumulate beneath the existing ice cover or continue downstream to unfrozen river sections [12].
During this period, thermal exchange processes at the interface can be categorized into two cases: air–water heat exchange persists on the open water surface, while air–ice heat exchange exists on the ice-covered surface. The presence of ice cover transforms the river’s hydrodynamic pattern from an open flow to a pressurized flow under the ice cover, consequently reducing its water conveyance capacity. However, ice formation and melting do not occur only at the bottom of ice covers during this period.
The onset of positive temperatures, coupled with increased solar radiation at mid-latitudes, initiates the river’s break-up period. The melting process typically begins with border ice, which detaches from riverbanks due to accelerated warming at the bank. As air temperatures continue to rise, hydraulic and wind forces fragment the melting ice covers into discrete floating ice blocks. The subsequent behavior of this ice varies, according to local hydrodynamic conditions. In reaches with weak hydrodynamic forces, ice blocks primarily drift with the water flow while undergoing thermal melt, reducing the probability of ice jam or ice dam formation [14,15]. Conversely, in reaches with strong hydrodynamic forces, fast-moving ice accumulates and extrudes at locations where the river channel is obstructed, significantly increasing the probability of ice jam or ice dam development [11,14]. In 1986, the IAHR Working Group on River Ice Hydraulics defined an ice jam as a stationary accumulation of fragmented ice or frazil which restricts flow that occurs in ice runs during ice formation periods, whereas an ice dam is radically different from other jams in the ice decay and run period [14,15,16].
It can be concluded that the evolution process of river ice represents a complex system full of uncertainties. There are many spatiotemporal variations in the evolution of river ice, particularly in the Yellow River, due to its distinctive geographical characteristics. Mathematical equations and methods serve as crucial tools in river ice research. Based on the understanding of river ice, natural processes have been simplified into various mathematical equations. Through numerical analysis of the intrinsic connections and constraints of air–ice–water–riverbed systems, researchers can develop comprehensive insights into complex phenomena and establish practical solutions for scientific and engineering challenges. In the study of natural phenomena, two mathematical approaches are primarily employed: mechanistic analysis and statistical analysis [17]. Mechanistic analysis utilizes classical mathematical tools to analyze the causal relationships relating to phenomena, while statistical analysis involves the application of classical mathematical tools to determine statistical laws from extensive observational data through parameterizations of certain deterministic models. The setting up of more modern stochastic models using extensive observational data is also an important research method. Finally, the phenomenon of interest is described using some mathematical relationship or pattern. To date, the main mathematical models used in river ice research include analytical models, numerical models, and multivariate statistical models. Analytical models are limited to simplified scenarios in which ice can be simplified to a homogeneous and continuous medium, the water flow under the ice is stable, and the river channel is regular. For more complex situations, which are beyond the scope of analytical models, numerical models employing corresponding partial differential equations can provide numerical solutions. As river ice is a multivariate system, multivariate statistical models have also been used in an attempt to solve associated problems. In recent years, new mathematical methods and techniques have emerged [18,19,20].
There are certain differences between the deterministic models of Yellow River ice with physical basis developed by various researchers, reflecting their respective research objectives and problems. These models have been derived from the conditions, phenomena, information, and data on the evolution, formation, and melting of river ice obtained through field investigations and/or laboratory experiments.
2.2. Key Characteristics of the Yellow River Ice and Its Investigations
The evolution of river ice is influenced by a multitude of factors, with the most significant influences arising from air temperature conditions, hydraulic conditions, and the geomorphological traits of the river channel. Foundational river ice models are constructed based upon these factors, then subsequently honed to provide precise representations of specific rivers, accounting for their distinctive features. The Yellow River—distinguished by its unique geographical, hydrological, and meteorological conditions—presents both similarities and notable differences in its ice evolution process when compared with rivers elsewhere in the world.
In addition to the typical characteristics of freezing rivers in cold regions, Wang et al. [13] have summarized the main features of the Yellow River ice and applied the Canadian river ice model River1D [21] to simulate the ice formation process in the Yellow River. The Yellow River, which originates from the Qinghai–Tibet Plateau and flows into the Bohai Sea, stretches across a total length of 5464 km. The section of the river from the Qinghai–Tibet Plateau to Ningxia is primarily mountainous. After that, it carries a large amount of suspended yellow sand from the Loess Plateau, which imparts the river with its characteristic yellow hue and makes it the river with the highest sediment concentration among the world’s major rivers. Since 1974, the construction of the Liujiaxia, Longyangxia, Wanjiazhai, and Xiaolangdi reservoirs has significantly mitigated ice flood disasters in the Yellow River Basin [22]. However, the northernmost section of the Inner Mongolia Reach still frequently suffers from ice flood disasters [19,23]. Existing research on ice disasters in the Yellow River has mainly focused on the Inner Mongolia Reach, which spans over 823 km (from 37°35′ N to 41°50′ N and 106°10′ E to 112°50′ E) and is primarily characterized as a plain river.
The Inner Mongolia Plateau and its surrounding mountains significantly influence the movement and intensity of cold air, with cold waves in the Yellow River Basin predominantly originating from the north, northwest, west, and east. Among these, the northern cold waves lead to the strongest temperature drops, and the northwest cold waves are the most recurrent. Due to variations in cold air paths each winter and late spring, the ice-on and ice-off locations in the Inner Mongolia Reach can vary, with initial ice often occurring between Sanhuhekou and Baotou. Ice formation in the Inner Mongolia Reach typically starts downstream and moves upstream, while ice-off starts upstream and moves downstream. The average ice run date before ice freeze-up is from 17 November to 1 December, the average ice freeze-up date is between 1 December and 4 January, the average ice break-up date is 4 March, and the ice-off date is 27 March. The average ice period in the Inner Mongolia Reach is 117 days, with the longest in recent history being 150 days in 1969/1970 and the shortest being 76 days in 1989/1990 [24]. At the top of the large inverted U-shaped bend in the Inner Mongolia Reach, the water flows from west to east with a total drop of only 162.5 m, and it is frequently frozen. The riverbed gradually changes from narrow and deep to wide and shallow from upstream to downstream, with a gradient of only 0.09‰ to 0.11‰ from Zhaojunfen to Toudaoguai. The widest point (at Dukoutang) is 400 m to 1200 m, and the narrowest (at Zhaojunfen) is 200 m to 600 m. Along its course, shallow areas, bends, and branches are common, often causing ice blocks to become stuck and form ice jams or dams. The section from Guaishang to Wanjiazhai flows from north to south with a large gradient and high velocity, and it generally did not freeze before the construction of the Wanjiazhai Reservoir. After its construction, the water surface gradient and velocity decreased at the backwater end, reducing the area with ice transport capacity, thus extending the area of increasing ice jams and dams upstream. As such, previously unfrozen sections have become frozen. In recent years, due to global climate warming and human activities, the ice conditions in the Inner Mongolia section of the Yellow River have exhibited new characteristics [25]. Particularly, frequent extreme temperature fluctuations in winter and strong mid-latitude solar radiation have led to overall higher air temperatures and larger air temperature differences. Since the 1990s, influenced by rising temperatures, reduced water volume, and winter irrigation, the dates of ice-on in the Inner Mongolia Reach have been delayed, while the date of ice-off has advanced. The number of stable freeze-up days has decreased, and the ice cover thickness has become thinner. The river sometimes experiences two freezing and melting cycles. Generally, ice coverage exceeds 80% of the total reach area [24]. Approximately 20% of the river surface typically remains ice-free, allowing for continued frazil particle formation. These frazil particles either consolidate beneath open water surfaces to form new ice covers at the downstream side of the open water zone/pond, according to recent field observations, or are transported beneath existing ice cover, where they accumulate and freeze to form frazil ice or continue downstream to open water zones/ponds. For an assessment of the future ice condition trend under global climate warming, Zhou et al. [26] used eight global climate models from CMIP6 to simulate the ice conditions in the Inner Mongolia Reach of the Yellow River from 2015 to 2100 and predicted that, by 2070, the Yellow River might not experience complete freezing. In the near term, the duration of ice runs before river freeze-up and after break-up will continue to increase, while the period of stable ice cover will shorten.
The likelihood of ice jams and dams increases significantly in areas with gentle gradients, sharp bends, and water conservancy structures that narrow the river channel. Moreover, the construction of over 20 reservoirs in the upper reaches of the Yellow River has significantly altered the thermal, dynamic, and hydraulic conditions due to the discharged water volume. The regulated water volume and heat not only alter the river’s natural properties but also change the sediment and thermal conditions due to reservoir discharge, resulting in downstream sections remaining unfrozen due to higher water temperatures (Figure 1a). During reservoir regulation, elevated water levels worsen ice jam disasters during ice freeze-up but reduce the occurrence of ice dams during ice break-up. This directly affects the length of the frozen river downstream of the reservoir, as well as the dates of ice runs during freezing and melting. The several “n–shaped” bends and constructed bridges in the Inner Mongolia Reach of the Yellow River constrain the flow of ice. Throughout the Inner Mongolia Reach, juxtaposed ice cover, hummocky ice cover, and open water zones/ponds coexist, leading to a reduction in the length of frozen river sections in the Inner Mongolia Reach (Figure 1b). Once a stable ice cover forms, the increased roughness beneath the ice leads to greater water storage in the river channel, resulting in the coupled flow of ice, water, and sediment in the Inner Mongolia section. During ice break-up, a larger water discharge volume can accelerate the process and lead to a “violent ice break-up”, while a lower water discharge volume typically results in a “tranquil ice break-up”. These scenarios are closely linked to the mechanical properties of the ice cover under hydrodynamic forces [27]. Sediment is not only present in the river water but also within the ice, making it a distinctive feature of Yellow River ice [28]. From a composite material perspective, the sediment influences the density, thermal, electrical, optical, and mechanical properties of the ice. Combined with the river’s mid-latitude location, where ice temperatures are relatively higher and solar radiation is stronger compared with high-latitude regions, the Yellow River ice can be viewed as a four-phase composite material comprising air, ice, water, and sediment. Additionally, sediment inclusions are often found in hummocky ice, and the non-frozen water content is higher in ice during spring. Although snowfall is typically not an important factor, dust particles tend to settle on ice surfaces during spring sandstorms in the Inner Mongolia Reach of the Yellow River, being located in one of the arid and semi-arid regions in China.
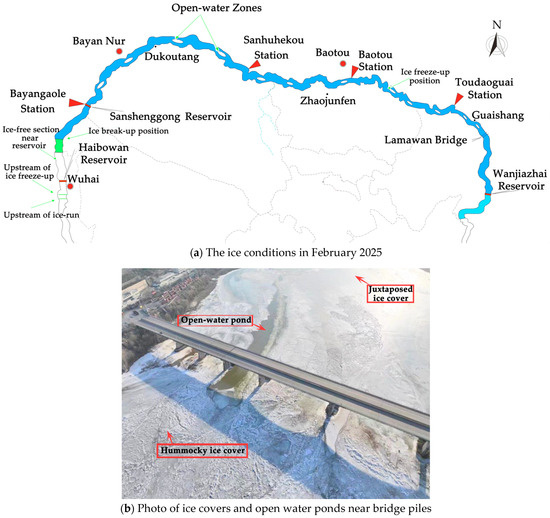
Figure 1.
Distributions of ice covers and image of open water zones/ponds of ice cover in the Inner Mongolia Reach of the Yellow River.
Since the 1950s, extensive research on the Yellow River ice has been conducted by scholars, spanning various aspects. Early studies included field observations of its conditions [29,30] and investigations into the characteristics of ice in sediment-laden rivers [31]. In recent years, significant progress has been achieved in Yellow River ice research, due to enhanced field methods and the development of new observational instruments. Beyond comprehensive ice surveys using air–space–ground/ice integrated methods (see Figure 2), studies have been conducted on the crystal structure, sediment content [32], mechanical properties [33], and dielectric constant [34] of this river ice. Particularly, the sediment in the Inner Mongolia reaches of the Yellow River—whether on the riverbed or banks—is influenced not only by the physical and mechanical properties of the sediment but also by hydrodynamic forces, especially those under the ice cover [35,36]. Recent systematic winter surveys of under-ice velocity profiles at the Shensifenzi Bend in Inner Mongolia have revealed some flow field patterns [37,38] and the mechanical properties of riverbank sediment [39]. However, theoretical concepts alone are insufficient for river ice models; extensive field data, including high-precision river topography, real-time hydrological, and meteorological data, are required for such modeling. At present, research efforts regarding the Yellow River—particularly riverbank or ice surface surveys—are still sparse and scattered across certain sections and stations, with most river sections lacking sufficient measured data to fully support the validation and refinement of deterministic and stochastic mathematical models.
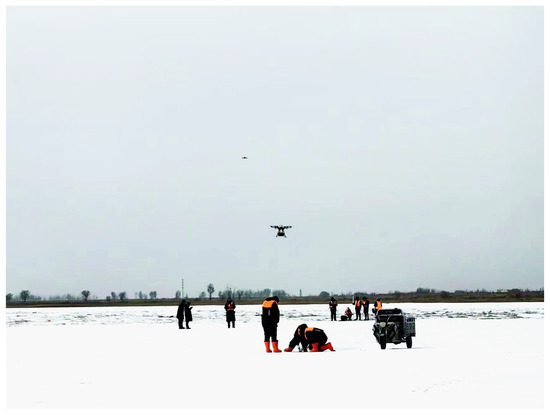
Figure 2.
Photo of comprehensive space–sky–ground integrated ice investigation.
3. Uncertainties in Deterministic Mathematical Models for the Evolution of River Ice Formation and Melting
3.1. Development Status of Evolutionary Models of River Ice Formation and Melting
When analyzing mathematical models of river ice in terms of their mathematical universality, the greatest differences in ice formation and melting processes globally stem from differences in river characteristics and water flow parameters. A comprehensive mathematical model of river ice that can completely describe the process of river icing, freezing, and thawing should incorporate three sub-models: hydraulic, thermal, and thermodynamic models [17,40]. These sub-models reflect interconnected relationships, wherein hydraulic conditions influence thermal exchange and freezing processes, thermal conditions govern freezing processes, and freezing processes influence both hydraulic and thermal conditions.
Shen et al. [41] made a significant advancement by combining the one-dimensional non-steady Saint-Venant equation with equilibrium equations for river ice motion, mass conservation, and floating ice concentration. This foundation for river ice dynamics modeling allows for the effective simulation of both ice movement and ice jam development processes. Building upon this work, Lal and Shen [42] developed a one-dimensional non-steady flow river ice model (RICE). This model incorporates simulations of frazil ice, floating ice, border ice, and ice jam processes while accounting for water temperature variations, thermal growth processes, and ice flow interactions. Subsequently, Shen et al. [43] improved the RICE model to create the RICEN model, which incorporates additional modules for complex river networks, anchor ice, and frazil ice transport based on ice transport rates. The RICEN model was successfully implemented to simulate the formation of ice jams in the backwater area of the Sanshenggong Water Control Structure in the Inner Mongolia Reach, which was in good agreement with the actual observed backwater height [44]. Then, this one-dimensional river ice model was further upgraded to the CRISSP1D and RICE–E models, which provide comprehensive simulation capabilities for the entire lifecycle of river ice formation, development, and evolution [45,46,47]. Pan et al. [48] extended the CRISSP1D model by incorporating an anchor ice flood wave module that accounts for the growth and release of anchor ice. This enhancement enabled analysis of the riverbed’s topographic elevation, cross-sectional flow changes, and variations in comprehensive riverbed roughness caused by anchor ice formation. Notably, their research identified that changes in bed roughness due to anchor ice significantly influence the water level and flow fluctuations.
To address the effects of complex terrain and riverbanks, Shen et al. [49] developed a two-dimensional river ice dynamics model (DynaRICE), extending their previous one-dimensional approach. This model integrates a Eulerian-based finite element method to solve two-dimensional shallow water equations with a Lagrangian-based meshless smooth particle method for computation of the motion of river ice. Building upon this foundation, Liu et al. [50] introduced CRISSP2D, a comprehensive two-dimensional mathematical modeling system that is capable of simulating river ice formation and melting. CRISSP2D can simulate multiple processes, including complex topographical flow dynamics; temperature fluctuations influenced by solar radiation and wind patterns; various ice formation processes (frazil ice, anchor ice, border ice, and floating ice); transport and subsidence processes of floating ice under ice cover; the formation, development, and release processes of ice jams or ice dams; thermal growth and melting of the ice cover; and the process of mechanical ice cover break-up. Knack and Shen [51] coupled the two-dimensional river ice module with the numerical sand module to develop CRISSP2D into a river ice–sand thermodynamic model. This enhancement enabled the simulation of bed load, suspended load sediment transport, and bed deformation processes in ice-affected northern rivers. Pan and Shen [52] subsequently evolved CRISSP2D into RICES2D, considering sediment transport, riverbed morphological changes, and bank erosion under ice conditions, thereby establishing a framework for studying water–ice–sand coupling mechanisms. Notably, efforts in the development of both two- and three-dimensional mathematical river ice models continue to build upon the initial one-dimensional mathematical river ice models [4,42,43,53]. Based on the plane body-fitted coordinate transformation and the vertical σ coordinate transformation, a three-dimensional river ice model was established for the Yellow River, and the finite volume method was used to discretize the control equation of the k–ε turbulence model. To avoid fluctuation of the pressure field, the velocity equation at the interface of the control body was derived through momentum interpolation, and the accumulation of ice was numerically simulated [54,55].
The theoretical foundation for mathematical river ice modeling traces back to the 1960s, when Pariset and Hausser applied the basic equations of hydraulics to ice jam analysis. This pioneering work sparked extensive scholarly contributions to ice jam theory and mathematical models of river ice [4,14,56,57]. Based on the static equilibrium theory, Flato and Gerard [58] developed a non-equilibrium ice jam model (ICEJAM) under a one-dimensional steady flow. Beltaos [59] created the wide river ice jam model (RIVJAM), which considers the effect of water seepage in ice jams.
Following on from the above ice models, static equilibrium ice jam theory was subsequently integrated into commercial non-steady one-dimensional models such as HEC–RAS [60]. There are also a number of other comprehensive river ice models, such as RIVICE, MIKE11–ICE [61], and River1D [21]. While these models can effectively predict ice thickness and water levels under extreme conditions, they are limited by their inability to simulate dynamic ice movement processes or predict ice jam formation locations.
3.2. Uncertainties in Parametric Schemes for One-Dimensional River Ice Mathematical Models
Xu [40] provided a comprehensive summary of one-dimensional river ice models, identifying twenty-five distinct mathematical formulations. Beyond the continuity equation and the set of momentum equations in hydraulic models, there were six basic mathematical equations. The others included mathematical models of the water temperature distribution, frazil ice concentration, floating ice transport, ice jams or ice dams, and thermal ice formation and melting processes. While one-dimensional river ice mathematical models enable simulation of the complete evolution of ice (icing, freezing, and thawing) and support the analysis of specific ice processes through their sub-models, the accuracy of their predictions often deviates from observed conditions. These discrepancies can be primarily attributed to the selection of parametric schemes and parameter values within the models.
3.2.1. Uncertainties Caused by Ice Bottom Roughness in One-Dimensional River Ice Mathematical Models
The composite roughness coefficient plays a crucial role in ice–water dynamics, which is related to the riverbed’s roughness, ice bottom’s roughness, and freeze-up conditions. This coefficient exhibits both spatial and temporal variability. Guo et al. [62] investigated the uncertainties associated with this parameter and identified multiple contributing factors within the composite roughness calculation, as expressed in Equation (1):
where f = (B − B0)/B is the percentage of ice coverage width to the total river width, B is the total river width, B0 is the width of the open water surface, nc is the composite roughness, nb is the riverbed roughness, ni is the ice bottom roughness, and P is the wetted perimeter of the channel (for wide and shallow channels, B/P ≈ 1).
Variations in the ice bottom’s roughness are influenced by multiple factors, including the specific types of floating ice, ice layer characteristics, meteorological conditions, and their change rates. During the initial ice cover formation period, the ice layer primarily comprises floating ice and frazil ice, characterized by low ice thickness and high ice bottom roughness. As the ice layer thickens and undergoes continuous water flow exposure, its bottom surface progressively smoothens, resulting in decreased roughness. The ice layer’s bottom surface roughness exhibits temporal dependency, decreasing with prolonged ice bottom flow scour until reaching an equilibrium value. Therefore, the temporal evolution of the ice layer bottom’s roughness can be expressed mathematically through Equation (2) [42]. In reality, it is difficult to accurately determine the ice bottom’s roughness from ice cover formation through to the break-up period.
where ni,e is the ice layer’s bottom surface roughness at the beginning of the ice break-up period (it is believed that this value is close to 0.008~0.015 when the bottom surface of the ice layer is smooth); k is the attenuation coefficient, which varies according to winter conditions (flat winter, warm winter, cold winter) and freezing degree, with the range of this parameter being 0.02~0.03 when the ice layer has no open water surface [63]; tic is the number of freezing days; and ni,i is the initial bottom surface roughness of the ice layer. This initial ice bottom roughness, which exhibits considerable variation range, is dependent on the ice layer’s characteristics and the morphology of the river channel.
Numerous observational studies have investigated the ice layer bottom surface’s roughness and obtained comprehensive roughness coefficients [63], resulting in value tables. However, significant variability exists in the measured roughness values, with the initial ice roughness ranging from 0.015 to 0.050. The standards published by the Ministry of Water Resources of the People’s Republic of China [64] specify a range of 0.015 to 0.100. In Equation (2), the change rate ∂ni/∂ni,i of ni relative to ni,i is larger than the change rate ∂ni/∂ni,e of ni relative to ni,e during the initial ice cover formation period. Uncertainties in the value of ni,i significantly influence the bottom surface roughness of ice layer, consequently affecting variations in composite roughness.
Moreover, the Yellow River’s riverbed contains substantial sediment, necessitating the incorporation of ice–water–sediment coupled transport equations [12]. Consequently, the riverbed roughness exhibits temporal and spatial variability which is more complex than that of ice bottom roughness, thereby amplifying the uncertainties in composite roughness calculations.
3.2.2. Uncertainties in the Physical and Thermal Properties of Ice in One-Dimensional River Ice Mathematical Models
Understanding of the ice growth mode has evolved to cover a range of complex processes. However, one-dimensional river ice mathematical models continue to rely on simplified computational approaches. These approaches are primarily founded on one-dimensional ice thermal growth principles under static water conditions, making them more applicable to lake and reservoir ice formation [65]. According to the actual situation of river ice, a given model may undergo subsequent modifications to develop a more suitable river ice growth model.
Stefan (1891) pioneered the development of an analytical model for calculating the formation of ice under static water conditions [66]. This model operates under the assumption that the ice surface temperature is equal to the ambient air temperature. Therefore, one only needs to consider the heat balance at the bottom of ice layer while assuming a linear distribution of ice temperature.
where hi is the thickness of the ice; t is the time; ki, ρi, and Li are the thermal conductivity (W/m∙K), density (g/cm3), and latent heat of freezing (J/g) of ice, respectively; Tsfc is the surface temperature of ice (°C); and Tf is the ice bottom temperature (which is also called the freezing temperature).
Assuming that tf is the terminal moment of the computation, both sides of Stefan’s formula are integrated with respect to time t = [0, tf].
When the integration time step dt = 1 d, FDD is the cumulative freezing-degree days (°C∙d). In this case, the ice thickness hi is calculated as shown in Equations (6) and (7).
As river ice contains frazil particles, Shen et al. [67] have proposed an improved method for determination of cumulative freezing degree-days to simulate winter ice thickness variations. Although the formula is simple, the method requires a variable coefficient. This coefficient takes different values for the ice layer growth and melting periods; thus, there is uncertainty in the model parameters. In the RICE model, the thermal growth and melting of the ice layer can be described by Equation (8) [42].
where hf is the thickness of frazil ice in the lower part of ice layer, hi is the thickness of thermally grown ice, Tsfc is the ice surface temperature, Tf is the freezing temperature, Tw is the water temperature, kwi is the heat exchange coefficient at the ice–water interface, and ka is the linear heat exchange coefficient at the air–ice interface. When a frazil deposit exists on the underside of the cover, Equation (8) should be replaced by Equations (9) and (10):
where ef denotes the porosity of the frazil accumulation [4], which reflects the portion of water in frazil.
As can be seen from Equations (8)–(10), porosity, the heat exchange coefficient at the ice–water interface, and that at the air–ice interface have significant influences on the variation in ice thickness. Other factors, including air temperature and flow rate, are measured values. The value of kwi has been expressed in reference [42] as a nonlinear function of flow velocity and water depth. The value of ka is influenced by various factors, such as latitude, humidity, and meteorological conditions. Shen et al. [67] took the typical value of ka as 20 W/(m2∙°C) in their calculations, while reference [68] took ka as 21.87 W/(m2∙°C) when calculating the ice thickness in different sections of the Yellow River. However, setting ka as 10 W/(m2∙°C) when calculating the thickness of Yellow River ice has also been reported [69].
In the one-dimensional river ice mathematical model summarized by Xu [40], the ice thickness formula was further simplified based on Stefan’s equation [66]:
where hi is the ice thickness (cm), A′ is an empirical coefficient, ζis is an empirical index, and FDD is the cumulative freezing degree-days (°C∙d), counted from the day when the temperature turns negative steadily. The two empirical coefficients in Equation (11) are specified in the specification of the Ministry of Water Resources of the People’s Republic of China [70]. For Northeast China, ζis = 0.50~0.56 and A′ = 2.0~2.3; and for North China, ζis = 0.50~0.56 and A′ = 2.6~3.0. Therefore, all of the parameters in Equation (6) are empirical values that can be determined geographically. While ice formation and melting involve multiple processes, the thermal growth process of ice, which is mainly controlled by cumulative freezing degree-days, predominates within the entirety of ice processes. A detailed analysis of the Yellow River ice can be found in the referenced study [71].
The roots of these uncertainties are essentially caused by uncertainties in the physical and thermal properties of ice. Both simple and complex ice growth models require parameters such as the latent heat of freezing (Li), ice density (ρi), ice thermal conductivity (ki), freezing temperature (Tf), heat exchange coefficient at the ice–water interface (kwi), and linear heat exchange coefficient at the air–ice interface (ka). As the Yellow River ice is natural ice, it generally consists of pure ice, gas, unfrozen water, and sediment. Therefore, all the parameters of ice characteristics involved in the one-dimensional river ice mathematical model deviate from reality.
According to the continuous high-frequency measured vertical ice temperature profile data, the thermal conductivity, specific heat, and density are treated as a unified coefficient ki/(ci∙ρi), termed the thermal conductivity coefficient. The effective thermal conductivity coefficients of reservoir ice are obtained by mathematically inverting the measured data, which are obtained as a linearly distributed section of ice temperature profiles below the ice surface and above the ice bottom [72]. These coefficients vary with the composition of ice, particularly with respect to the content of impurities. Such variations introduce uncertainties in the thermal conductivity of natural ice, subsequently affecting the accuracy of ice simulation calculations during the freeze-up period. The inversion results of these ice thermal properties have been summarized by Li et al. [73].
3.2.3. Uncertainties in the Linear Heat Exchange Coefficients at the Air–Ice and Ice–Water Interfaces in One-Dimensional River Ice Mathematical Models
The accurate determination of heat exchange coefficients at both the ice–water and air–ice interfaces remains a significant challenge in ice growth models [62]. Shen et al. (1995) have addressed this challenge by developing a parameterization scheme for river ice models, introducing a linear approximation formula to calculate heat exchange at air–water/ice interfaces [43,74]:
where ϕ is the net heat flux lost from the river surface (W/m2), ϕs is the heat flux from solar radiation (W/m2), β is the local climate and morphology-related empirical heat flux (W/m2), ka is the heat exchange coefficient at the air–water/ice interface (W/(m2∙°C)), Tsfc is the water/ice surface temperature (°C), and Ta is the air temperature (°C). For long-term, large-scale numerical simulations of river ice for rivers with lengths exceeding hundreds of kilometers providing forecasts over two weeks in advance, Equation (12) can be further simplified to Equation (13) [43,74]:
where α′ is the comprehensive heat exchange coefficient (W/(m2∙°C)), which takes into account solar radiation and other heat losses.
While parametric schemes exist for radiation, convection, and conduction in the heat balance equation at the air–water/ice interface on clear days, these schemes lack comprehensive consideration of cloudiness and latitude effects. The complexity of ice surface albedo parameterization in the heat exchange at the air–ice interface varies with the scale of numerical simulation [65]. Large-scale models employ the simplest approach, merely assigning albedo values to specific ice types. Regional climate models incorporate surface temperature effects, while detailed ice physics studies necessitate the consideration of multiple factors, including the solar altitude angle, atmospheric properties, visible and near-infrared band variations, surface temperature, snow thickness, and ice thickness [75]. These varying albedo parameterization schemes yield significantly different simulation outcomes [76].
In lake ice model analysis, Yang [65] selected Shine’s parameterization scheme for incident shortwave radiation [77] in conjunction with Bennett’s suggested reflection coefficients for shortwave radiation from cloud cover [78]. This scheme treated the effect of cloud cover as a linear relationship. Incident longwave radiation was chosen from Efimova’s [79] parameterization scheme for incident longwave radiation and Jacobs’s parameterization scheme for cloud cover in relation to longwave radiation, which also treated the effect of cloud cover as a linear relationship [80].
Cao et al. [81] obtained a linear relationship between solar radiation flux and cloud cover for the semi-arid region of Western China:
where ϕc1 is solar radiation in the presence of clouds (W/m2) and C1 is the cloud cover, which is divided into 10 levels (where C1 = 0 means a clear sky without clouds and C1 = 10 means full coverage of clouds).
This statistical formula demonstrated significant dispersion from observed values, resulting in low correlation coefficients. To solve the river ice problem in China, Wang et al. [13] applied the methodology developed by Ashton and Kennedy [82], utilizing Equation (15) to estimate solar radiation under both clear and cloudy conditions.
where ϕ denotes the solar radiation in the absence of clouds.
Comparative analysis between Wang et al.’s [13] parameterization scheme and the data measured by Cao [81] revealed limitations regarding this equation’s accuracy. Li et al. [83] addressed these limitations by re-analyzing the same dataset using a logistic function approach. Their analysis demonstrated that solar radiation exhibited a gradual decrease with increasing cloud cover, from 550 W/m2 when cloud cover was below 50%, followed by a pronounced decline at higher cloud coverage, ultimately reaching 170 W/m2 under complete cloud cover. This approach achieved a correlation coefficient of 0.8845 at the 0.01 significance level. This logistic approach provided superior representation of the variable rates of solar radiation decreasing with increasing cloud cover when compared with previous linear and parabolic parameterization schemes, effectively addressing the tendency to overestimate radiation at low cloud coverage and underestimate it at high coverage.
The fitting results from Equation (16) aligned well with observed solar radiation values in the Wuliangsuhai region along the Yellow River, which ranged from 160 W/m2 to 770 W/m2. As noted by Wang et al. [13], the absence of comprehensive cloud cover data poses a significant challenge in establishing parametric relationships between local solar radiation and cloud coverage. Nevertheless, logistic models show promise for future applications as cloud observation data becomes more readily available and valued. Wang et al. [13] further demonstrated that the albedo of the water surface is correlated with both the water’s turbidity and suspended sediment content. Similarly, Li [84] established that the albedo of ice varies with the quantity of sand deposited on its surface. In practice, the river ice albedo differs from place to place. Traditional mathematical models often neglect these albedo effects in solar radiation calculations, resulting in inaccurate heat exchange estimations. To address this limitation, researchers have implemented varying albedo values to reflect the changes in solar reflectance for different temporal periods and river ice conditions, deriving coefficients that express solar reflectance through model inversion. The coefficient is classified into six types of reflectance in ice simulations, including those associated with the early part of the ice run period Rb1, ice cover formation period Rb2, ice freeze-up period Rb3, early period of ice break-up Rb4, ice break-up period Rb5, and snow-covered ice Rb6 [13]. While these improvements have reduced uncertainties in solar radiation parameterization, some degree of uncertainty still remains, as has been discussed by Yang et al. [85].
Furthermore, whatever river ice mathematical model is used, meteorological information is required as a driving condition. As far as existing weather forecast information is concerned, in the context of ice forecasting and warning systems for the Yellow River, the reliability of forecasted ice conditions exhibits a temporal gradient: predictions within a three-day window demonstrate high credibility and forecasts extending from four to seven days show increasing uncertainty, while projections beyond seven days (up to fourteen days) serve merely as indicative estimates.
Under identical meteorological conditions, heat exchange at the ice–water interface on the ice bottom is significantly lower than that at the air–water/ice interface on the surface, with their ratio ranging from 0.205 to 0.970. Xu [40] incorporated this ratio to replace the heat flux from the water body under the ice in a one-dimensional river ice model. The parameterization of heat flux at the ice–water interface on the ice bottom during static water freezing remains a subject of international debate, with various studies reporting different results across multiple lakes [86]. In river ice, it is more difficult to determine the flux from water under the ice. Bai et al. [87] have performed mathematical inversion calculations of in-ice thermal conductivity coefficients using long-term continuous monitoring data of vertical ice temperature profiles from lakes and reservoirs, assuming constant ice–water heat flux during data analysis. Cao [88] proposed novel perspectives on temperature and radiative transfer within ice based on long-term lake ice observations, although these findings remained qualitative rather than quantitative. For the ice of the Yellow River’s Shisifenzi bend, Li [84] employed mathematical inversion techniques to determine the short-term heat flux at the ice–water interface, assuming constant thermal conductivity within the ice for engineering applications. It is obvious that the heat flux at the ice–water interface remains an uncertainty problem when the conjoint analysis of air–ice interface and the ice–water interface is conducted asynchronously. Yang et al. [85] also reported similar conclusions.
4. Uncertainties in Other Deterministic Models of Yellow River Ice with Physical Basis
4.1. Uncertainties of Mechanical Properties in Yellow River Ice Layer Bearing Capacity Models
The Yellow River embankment is protected through the deployment of gabion mattresses on ice, with the efficacy of this technique being primarily dependent on the bearing capacity of the ice. International researchers have developed various mechanistic models for the ice layer’s bearing capacity, founded on plate and shell mechanical principles, which have subsequently been adopted by Chinese researchers. While these models predominantly address transient loads on single-point circular contact surfaces [89], some account for load distributions of varying geometries. The ice bearing capacity can be derived as a function of flexure strength, elastic modulus, and ice thickness, regardless of the mechanical theory employed.
The internal temperature of ice significantly influences both its flexure strength and elastic modulus. When gabion mattresses are deployed on the ice surface, increased intra-ice temperatures can lead to diminished strength of the ice layer. An expression for the ice layer’s bearing capacity incorporating ice thickness, ice temperature, and decay time after sinking gabion mattresses can be theoretically derived through the combination of physical indicators relating to the Yellow River, such as those associated with ice crystals, density, sediment content [32], and the flexure strength and elastic modulus of the ice layer [33]. There remain uncertain parameters in the physical and thermodynamic models of ice layers, as well as uncertainties in the experimentally determined parameters reflecting the mechanical properties of ice.
Li et al. [90] employed the HIGHTSI model [91] to calculate the temperature of each layer of ice, enabling subsequent calculations of equivalent flexure strength and elastic modulus for corresponding layers. Then, the long-term loaded flexure strength and elastic modulus of ice layer were established through the power function form of the long-term strength of ice, including a time variable. In this way, the long-term flexure strength and elastic modulus of ice could be calculated.
Li et al. [90] analyzed ice deformation measurements around gabion mattresses to identify the moment of ice destabilization, subsequently determining the attenuation coefficient regarding the long-term strength of ice to be 0.08 through iterative calculations. While this represents the first quantitative estimate for long-term ice bearing capacity assessment, its applicability to ice conditions in other rivers remains uncertain.
4.2. Uncertainties in Dielectric Constants for Single-Point Radar Thickness Measurement Applications in the Yellow River Ice Layer
The advantages of radar-based ice thickness detection have been shown in Yellow River ice surveys. The physical basis for detecting ice thickness relies on the speed of electromagnetic wave propagation within ice, which is determined by the ice’s dielectric constant. The propagation speed of radar waves in air is 0.30 m/ns, and the dielectric constants vary significantly across different media: 3.17 for pure ice, 81 for pure water, and 1 for air [92]. Natural ice exhibits dielectric constants of 3.15 ± 0.05 [93], while ice containing air shows values of 3.18 ± 0.002 [94] and free water exhibits a dielectric constant of 80.37 [95]. At present, Yellow River ice thickness measurements generally employ the pure ice dielectric constant of 3.17. However, the Yellow River ice typically contains air bubbles and solid impurities [28,32], necessitating consideration of their effects on radar wave speed for improved measurement accuracy. Theoretically, freshwater ice can be characterized as a three-phase composite of pure ice, air bubbles, and unfrozen water. At lower temperatures, when unfrozen water around crystals solidifies, it becomes a two-phase pure ice–air bubble composite. The Yellow River ice presents additional complexity due to its non-uniform sediment distribution [32]. According to the sediment content within the ice, a four-phase pure ice–air bubble–unfrozen water–sediment composite can be considered. In such composite materials, phase components are randomly distributed in size and shape. When these components are smaller than the radar wavelength, scattering effects become negligible. At this time, the composite’s dielectric constant model considers only the volume fraction of each phase component, disregarding their shapes and sizes. Theoretically, the presence of unfrozen water decreases radar wave speeds, while sediment content increases them. The dielectric constants in the range of 2.5–4.5 reported by Fu et al. [28] for Yellow River ice reflect the combined influence of both unfrozen water and sediment content.
During winter of 2020–2021, thirteen ice thickness measurements were conducted on juxtaposed freeze-up ice beneath a fixed radar installation, as well as ice sampling at one point. Measurements included ice temperature at sampling time, along with subsequent analysis of ice crystal structure and density profiles. The measured data were used to analyze the variation in radar wave speed in both juxtaposed freeze-up ice and deposition freeze-up ice formations in the Yellow River. The investigation examined three key relationships: the dependence of radar wave speed (or dielectric constant) on unfrozen water content within the ice, the influence of ice temperature on unfrozen water content, and the combined effects of air temperature, radiation, and ice thickness on ice temperature. These findings led to the development of a parameterization scheme for radar wave speed correction based on air temperature and ice thickness. The average dielectric coefficient and radar wave speed of the granular or columnar ice were calculated by summing the radar wave travel times through different ice layers. The results revealed average dielectric constants of 3.1605 for granular ice, 3.1607 for granular ice with sediment, and 3.1586 for columnar ice. These values are marginally lower than the pure ice constant of 3.17, attributable to the presence of air bubbles in the Yellow River ice.
Under the principle of mass conservation in Yellow River ice, the volumes of unfrozen water and ice fluctuate with temperature variations. Minor changes in the proportion of unfrozen water can significantly affect the dielectric coefficient. Although the variation range of unfrozen water content within ice is small and its relationship with the dielectric constant is relatively straightforward, the unfrozen water content within ice is nonlinearly related to the ice’s temperature which, in turn, is nonlinearly related to external hydrometeorological environmental factors. Li et al. [34] validated the physical basis and feasibility of their parameterization approach through a field study. They conducted measurements at 13 drill sites during winter, collecting data on ice thickness and meteorological parameters including air temperature, radiation, wind speed, and cloud cover. The researchers integrated these measurements with a one-dimensional thermodynamic ice model to compute ice temperature profiles and thicknesses [65,90]. Subsequently, they established a continuous record of thermodynamic ice formation and melting processes using fixed radar observations during the winter of 2020–2021. The collected data enabled the researchers to characterize the relationship between the air temperature and radar wave propagation speed in both granular and columnar ice structures. This relationship served as the foundation for temperature-based corrections of radar wave speed. The radar wave speed within the ice exhibited a nonlinear distribution with the ratio of two phases, falling between the speeds observed in completely frozen Yellow River ice and liquid water. To maintain the accuracy of the simulation results, the researchers employed a logistic statistical model. The system was treated as a three-phase composite (ice–air–sediment) at low temperatures and as a two-phase composite (water–sediment) at high temperatures. Ice profiles were successfully expressed using these four parameters [34].
5. Uncertainties in Mathematical Models for Yellow River Ice Investigations and Disaster Warning
River ice phenomena present complex variability in response to hydrometeorological conditions, and field investigations remain indispensable in understanding these phenomena. The analysis of survey data—particularly for complex phenomena—necessitates the application of stochastic mathematical models; however, it is also an undeniable fact that field investigations and data processing are difficult.
5.1. Uncertainties in Mathematical Image Processing Techniques for Geometric Characterization of Parameters of Floating Ice Surfaces in Space–Air–Ground/Ice Integrated Investigations
During freeze-up periods, integrated space–air–ground/ice monitoring systems enable the progression from qualitative to quantitative description of river ice phenomena. These systems facilitate the acquisition of comprehensive data, including the locations where rivers freeze and open; the concentration, morphology, and flow velocities of ice; and the formation of ice jams or dams. Contemporary monitoring techniques have evolved to capture multiple parameters across temporal and spatial dimensions throughout the entire process. However, the diversity of monitoring methodologies has led to variations in the methods for extraction and the accuracy of floating ice parameters, resulting in different mathematical formulations. Furthermore, the varying focuses and objectives of researchers can yield distinct mathematical expressions, even when analyzing data obtained using identical monitoring techniques.
In general, space–air–ground/ice monitoring systems typically comprise three tiers: satellites in space [96,97], unmanned aerial vehicles (UAVs) in the sky [98,99], and equipment on the ground [100,101]. Satellite monitoring offers extensive spatial coverage that is unrestricted by geographical or political boundaries. However, its effectiveness is constrained by revisit intervals spanning several days, and satellites offering shorter revisit periods often tend to be either costly or low-resolution, limiting their real-time observation capabilities. While UAV systems provide rapid deployment and minimal terrain-based interference, their operational duration remains limited. Ground-based monitoring installations enable continuous data collection but face significant siting constraints, particularly in mountainous terrain.
During the ice freeze-up period, detection sensors generate graphical representations that capture various characteristics of ice, including freeze-up locations, the morphological features of the freeze-up ice, and the location, shape, and size of open water surfaces. Image analysis primarily employs mathematical techniques focused on image segmentation and quantitative data analysis. While river ice image analysis methodologies build upon established sea ice analysis techniques [102], they require additional refinement to account for topographical influences. For image segmentation, three approaches are predominantly utilized: traditional thresholding methods, machine learning algorithms, and neural network-based techniques. To obtain accurate geometric characterization parameters of floating ice, a variety of mathematical techniques need to be continuously developed, improved, and validated. However, existing mathematical approaches for ice image segmentation remain in developmental stages, with significant uncertainties in their application and reliability.
In recent decades, image processing techniques for ice analysis have evolved significantly. Early approaches primarily utilized classical histogram threshold segmentation methods and clustering algorithms [103]. This foundation was subsequently expanded to include more sophisticated methodologies, such as watershed algorithms [104], wavelet transforms [105], active contour models [106], gradient vector flow (GVF) [107], snake models [108], Markov random fields, spectral clustering, and neural networks [109]. The Otsu algorithm and k-means clustering algorithm remain fundamental techniques, providing a theoretical and technical framework for traditional histogram-based separation of background and foreground in grayscale images. Accurate ice concentration and velocity measurements fundamentally depend on precise morphological characterization. However, the complexity of floating ice imagery often precludes its successful analysis using a single mathematical approach. When ice blocks exhibit small contrast with the surrounding water, automated computer processes struggle to effectively delineate the ice’s boundaries or extract its surface morphology and melt pool characteristics. These challenges are further compounded by the presence of tightly connected and overlapping ice edges [110], which introduce additional segmentation complexities.
Watershed segmentation techniques exhibit over-segmentation when applied to ice surfaces with non-uniform illumination and ice blocks, which vary in size and shape [111]. While an enhanced watershed method incorporating neighboring region merging algorithms can improve edge detection performance [102], its reliance on binary images results in information loss at overlapping ice block boundaries. The marker-controlled watershed (MCW) technique [112], which integrates nonlinear support vector machine (SVM) analysis with traditional watershed algorithms, was developed to avoid over-segmentation issues. However, this approach remains inadequate for the analysis of irregular ice blocks with ambiguous boundaries and uneven illumination conditions. The gradient vector flow (GVF) method [107,113] attempts to address the complex shapes of ice through a multi-step process: separating seemingly connected ice blocks, highlighting the ice’s morphology through enhancement algorithms, identifying individual ice formations, and finally recognizing various complex shapes of floating ice blocks. Nevertheless, this methodology proves insufficient for distinguishing tightly packed ice blocks under conditions of uneven illumination and indistinct boundaries.
Recent advancements in machine learning (ML) have facilitated promising applications in the ice image processing field, including deep machine learning methods for river ice segmentation [114]. While ML models have gained widespread adoption across various domains, their application in ice recognition remains an emerging field requiring further development. In summary, traditional threshold methods—which rely on grayscale values for image segmentation—possess the advantages of simple computation and high accuracy [111]. However, these methods are susceptible to noise and brightness, making it challenging to determine appropriate threshold values. Although traditional machine learning techniques perform adequately in simple scenes, they exhibit limitations when processing complex scenes, often requiring human intervention and potentially compromising segmentation accuracy. In contrast, deep learning approaches—specifically, convolutional neural network-based semantic segmentation—offer superior nonlinear fitting and learning capabilities when compared with traditional methods. These advanced approaches show considerable promise for future developments in ice image processing [115].
Liu et al. [116] have developed a river ice identification method utilizing Landsat-7 ETM and images to distinguish river ice from water in remote sensing data of the Yellow River. This foundational work has paved the way for more sophisticated ice type classification approaches incorporating advanced image processing techniques and machine learning algorithms. Building upon this research, Huang et al. established a supervised classification method for river ice based on PolSAR data [117] and an unsupervised decision tree-based river ice classification method [118].
5.2. Uncertainties in Mathematical Techniques for Space–Air–Ground/Ice Integrated Investigation of River Ice Thickness
If there are technical difficulties in the space–sky monitoring of geometric parameters of floating ice, it is even more difficult to measure the thickness of ice along the vertical axis. Nevertheless, research in this domain continues to advance. Recent comprehensive reviews by Chinese researchers have documented the progress made in terms of river ice remote sensing monitoring techniques [119]. In the specific area of ice thickness detection, Yang [120] studied ice thickness inversion methodologies for the upstream section of the Wanjiazhai reservoir in the Yellow River. Their study employed varying albedo for ice thickness inversion, with the Lebedev model serving as a validation tool to demonstrate the effectiveness of the methodology.
Prior to the advent of unmanned aerial vehicles (UAVs), helicopters served as the primary monitoring platform for sea ice observations [121]. Contemporary river ice monitoring has shifted toward cost-effective UAV systems, which have demonstrated significant advantages in terms of river ice detection [98,122]. The predominant ice thickness measurement techniques employed by UAVs involve ground-penetrating radar (GPR) systems. Initially, GPR measurements were conducted by towing radar equipment across ice surfaces, with data interpretation being carried out with respect to established physical and mathematical principles developed in other fields. The complexity of ice analysis necessitates diverse mathematical approaches due to several key factors. Natural ice, being a multiphase anisotropic composite material, requires signal processing techniques similar to those used in geotechnical applications [123]. The presence of large air bubbles within ice structures calls for mathematical methods analogous to those used in determining the dielectric coefficients of cavity-containing concrete [124]. Additionally, the thin nature of ice layers demands mathematical techniques developed for target recognition in shallow radar images [125]. The Yellow River ice presents additional complexities beyond these characteristics, including its crystalline properties and the presence of sediment. Consequently, comprehensive applications incorporate not only the aforementioned mathematical techniques but also the influence of various factors on the radar propagation velocity, including unfrozen water content, sediment content, and ice crystal morphology, determined through field test data [34]. This mathematical principle is based on propagation formulas for composite anisotropic materials in different directions. The uncertainties in ice thickness measurements stem not from mathematical formulations but from variations in phase component proportions and their spatial distribution patterns within the ice. These represent the uncertainty sources for radar detection of ice thickness at a single point at different times and thus do not represent the uncertainties in towed radar [28] or airborne radar detection of ice thickness at different spatial scales at the same time. Furthermore, spatial analyses of ice thickness must account for additional uncertainties arising from the non-uniform distribution of ice thickness and radar resolution limitations.
5.3. Uncertainties in Prediction Models for River Freeze-Up and Break-Up Dates
The evolution of freeze-up date prediction methods has progressed through several distinct phases. Initial methods relied primarily on indicator methods, where freeze-up date predictions were based on changes in selected relevant indicators according to observation data. The 1960s marked the development of empirical correlation methods grounded in physical principles, leading to the establishment of numerous predictive formulas that played a great role in ice date prediction for preventive purposes. The 1980s witnessed the emergence of mathematical methods for the prediction of freeze-up and break-up dates; this development process has been documented in detail by Ji [126].
Contemporary freeze-up and break-up date prediction methods for the Yellow River predominantly employ thermal and hydraulic factor correlation methods and mathematical models [127], in alignment with international methods. Empirical formulas are established for prediction based on various parameters including water storage, ice thickness, and cumulative positive temperatures when the air temperature turns positive. Among empirical models, neural networks developed first, with machine learning applications currently being in exploratory phases. Ice forecasting systems have been expanded through the implementation of artificial intelligence-based approaches. Chen and Ji [9] successfully applied fuzzy optimal selection back propagation (BP) neural networks to predict freeze-up and break-up dates in the Ningxia–Inner Mongolia Reach of the Yellow River. However, classical BP neural networks, based on gradient descent methods, exhibited limitations including slow network approximation and susceptibility to local minima, which impeded their learning capabilities. To address these constraints, the Levenberg–Marquardt algorithm was implemented to enhance the performance of the BP neural network in terms of ice dam prediction. This algorithm allows for performance optimization by replacing the mean square error with the squared error to minimize the sum of squared errors, combining the advantages of both Newton’s method and gradient descent approaches. The Levenberg–Marquardt algorithm has demonstrated superior convergence rates when compared with gradient descent methods [23]. Guo et al. [128] developed a comprehensive ice prediction database for the Ningxia–Inner Mongolia Reach of the Yellow River, implementing a geographic information system (GIS)-based decision support system for ice forecasting. Since its implementation in 2004, this system has been shown to possess a long forecast period, high prediction accuracy, and stable operation.
5.4. Uncertainties in Prediction Models for Ice Jams or Dams
Ice jam and dam formation in the Yellow River has been highly regarded in the relevant literature. Sun et al. [10] conducted systematic field observations investigating the formation mechanisms of ice jams resulting from frazil ice accumulation beneath ice layers, which yielded empirical formulas for riverbed roughness and ice jam water levels. The formation and evolution of ice dams during ice break-up periods emerge from complex interactions among hydrological, meteorological, hydraulic, thermal, and dynamic forces. The complexity of these influencing factors has limited the number of mathematical models that are capable of accurately predicting and simulating ice dams during break-up periods. Since the 1990s, the China Yellow River Conservancy Commission has performed decades-long systematic observations of the Yellow River’s ice conditions, establishing several practical thermodynamics-based methods for forecasting freeze-up dates, break-up dates, and ice jams or dams [68,69,129]. While recent advances in river ice numerical modeling have shown promise, several fundamental problems remain unresolved.
The inherent complexity of ice jams or dams exceeds the descriptive capabilities of deterministic mathematical models, while non-deterministic stochastic models can only reflect a part of the actual phenomena. For ice jams or dams that are difficult to express via deterministic and stochastic expressions, Ji [126] applied mathematical fuzzy set theory to characterize their uncertainties. This approach conceptualized the uncertainties of ice jams or dams through the dual aspects of randomness and fuzziness, leading to the development of fuzzy optimal selection neural network prediction models. Additionally, various mathematical methods for image segmentation, aside from fuzzy theory, have been extensively applied to ice jam and dam analysis [130], further highlighting the uncertainties and challenges in predicting ice jams or dams.
Artificial neural networks (ANNs) have the characteristics of strong approximation ability for complex nonlinear mapping relations, good robustness and fault tolerance for information processing, and strong adaptability to fuzzy and incomplete information. These attributes make ANNs particularly suitable for ice dam prediction as it is a complex nonlinear problem influenced by multiple factors that resist precise correlation analysis. Different neural network-based methods for different types of river ice are still being explored, including clustering algorithms [131], genetic algorithms [132], and swarm intelligence algorithms [133]. Notable advances in this field include Wang et al.’s development of a neural network prediction model for ice jam water levels and ice thickness in curved channels, utilizing data derived from laboratory curved channel section experiments [134].
5.5. Uncertainties in Warning Models of Ice Disasters in the Yellow River
Ice flood risks in the Yellow River mainly include riverbank inundation caused by backwater, backward flow in dike-through drainage ditches, overflow, and levee-breach ice flood, which may cause damage to engineering facilities [135]. Gao et al. [136] and Song et al. [137] sorted the research status of river ice’s basic theory, prototype observation, and regime forecasting while also analyzing recent flood characteristics and reservoir management practices along the Yellow River. Guo et al. [138] investigated the factors influencing ice floods and the characteristics of disaster evolution in the Ningxia–Inner Mongolia Reach of the Yellow River, utilizing historical ice regime measurements and disaster statistics. Yuan et al. [139,140] and Tian [130] have systematically studied the one- to two-dimensional coupled model and a two-dimensional hydrodynamic model spanning from river channels to floodplains. Their research analyzed ice flood disaster mechanisms in the Ningxia–Inner Mongolia Reach of the Yellow River, while a series of quantitative technical methods were proposed, such as ice jam hazard diagnosis, flood embankment evaluation, and ice flood risk assessment.
The main factors leading to ice flood disasters include the thermal environment, dynamic factors, river boundary conditions, and human activities. Human activities mainly include reservoir regulation, embankment and river training projects, and the joint regulation of ice flood–diversion zones. The joint dispatch of the Longyangxia Reservoir and Liujiaxia Reservoir in the upper reaches of the Yellow River, the river regulation project in the Ningxia–Inner Mongolia reaches of the Yellow River, and the emergency regulation of ice flood–diversion zones are important measures for the defense and emergency response to ice flood disasters. Through comprehensive literature reviews and analytical investigations, researchers have identified four primary factors affecting ice flood disasters relating to the Yellow River: air temperature, water level, floating ice concentration, and ice thickness. These parameters serve as warning indicators, with quantified early warning thresholds establishing a warning system comprising blue, yellow, orange, and red alert levels [141].
The presence of human factors introduces significant uncertainties into ice flood risk assessment methodologies. Luo et al. [8], Luo [142], and Luo et al. [143] have proposed a three-parameter interval gray number evaluation method to handle fuzzy multiple indicators for assessing ice jam disaster risk in the Ningxia–Inner Mongolia reaches of the Yellow River. Subsequently, they introduced assessment methods incorporating gray information combined with flood disaster risk models for the Yellow River, as well as a VIKOR extension method, and applied these approaches to evaluate ice flood disaster risks across different regions of the Yellow River’s Inner Mongolia section. Wu et al. [144] have developed a comprehensive ice disaster risk evaluation model integrating projection pursuit, fuzzy clustering, and accelerating genetic algorithms to assess the ice disaster risk in the Ningxia–Inner Mongolia reaches of the Yellow River from 1991 to 2010. Li [145] constructed a grey decision model for ice jam and dam risk assessment in the Inner Mongolia section of the Yellow River, while Wu [146] applied a mutation evaluation method to evaluate the risk of ice flood disasters on the Yellow River. A loss assessment system for ice flood disasters was established to assess the post-disaster loss of Yellow River ice flood disasters. Further methodological advances include Wang et al.’s [147] mutation theory-based ice flood risk assessment for the Bayannur region of Inner Mongolia, as well as Hu’s [148] refinement of the mutation evaluation method to provide highly comprehensive evaluation values. The risk evaluation of flooding disasters in the Inner Mongolia section of the Yellow River was carried out according to this improved method. However, these approaches collectively fail to account for uncertainties in the subjective perceptions of decision-makers.
6. Research Gaps, Challenges, and Future Directions for Mathematical Models of Yellow River Ice
The natural phenomena associated with river ice conditions in cold regions worldwide share both similarities and unique characteristics. In contrast to river ice in North America, Northern Europe, Russia, and other regions, the Yellow River’s ice conditions resist full explication through mathematical models. There are numerous common challenges in mathematical modeling and methodologies, as well as unique gaps due to differences in geographical and physical characteristics. For the Yellow River ice, the scientific obstacles faced at present are multifaceted, arising from the complexity and randomness of the natural phenomena associated with the formation of ice. The technical difficulties in detecting these phenomena, especially during the long and segmented ice run periods, pose high risks for ice surveys, and there is a need to improve mathematical models and methods through the efforts of both mathematical and natural scientists. While the common challenges posed by river ice can be addressed through advancements in international ice research, the unique problems relating to the Yellow River must be tackled by Chinese scholars. Here, we focus on the uncertainties and current development status of mathematical models and methods for the Yellow River’s ice conditions, proposing common issues to advocate for international collaboration and emphasizing the principle of independent development to address unique problems. Some preliminary and partial ideas are presented here, inviting academic peers to discuss and provide constructive feedback to propel advancements in this research domain.
6.1. Major Research Gaps in the Improvement of Mathematical Models and Methods for Yellow River Ice
(1). Parts of the Yellow River are located in arid and semi-arid regions, where the deposition of spring dust on the ice surface directly affects its solar albedo. Although there is international research on the impact of black carbon dust on the albedo of ice, studies of dust deposition on ice surfaces are rare. There is also limited international research on dust deposition on glacier surfaces in arid and semi-arid regions, though there have been explorations of the impacts of gravel on the albedo of glacier surfaces. Addressing this gap requires worldwide efforts from scholars.
(2). The joint influence of mid-latitude temperature and radiation on the physical, thermal, electrical, and mechanical properties of ice covers is a common issue for freezing water bodies in mid-latitude cold regions. Improving coupled air–ice–water models controlled by hydrometeorological factors requires mutual learning among scholars globally. However, the presence of sediment in the Yellow River ice—particularly in frazil ice—is a unique phenomenon. Although investigations into the physical characteristics of the Yellow River ice (including ice crystals and sediment within the ice) have been initiated, and it has been recognized that the presence of sediment within the ice is related to frazil ice [32], these single-point ice sample surveys have not yet determined the proportion of different ice types in the Inner Mongolia Reach of the Yellow River. This means that it is not possible to assess how much sediment is contained within the ice at different locations which, in turn, affects the evaluation of the physical, thermal, electrical, optical, and mechanical properties of the ice in specific sections of the Yellow River and impacts the refinement of associated models. In the future, Chinese scholars should seek to develop a four-phase (air, ice, water, sediment) composite model for Yellow River ice, which will be valuable for the evaluation of its physical, thermal, electrical, and mechanical properties.
(3). The sediment in the Inner Mongolia section of the Yellow River is distinctive. Although ice jam/dam models incorporate ice–water–sediment coupling, the mathematical description of ice block shapes and stacking porosity in the Yellow River ice dams, controlled by factors such as ice thickness, temperature, hydraulic conditions, and transport distance, remains a challenge. Chinese scholars need to overcome the difficulties of random ice dam locations and their short durations of occurrence through extensive research, thus developing models for ice block mechanics, ice dam formation, and breach patterns.
(4). The integration of space–air–ground surveys with artificial intelligence and traditional ice surface and ground surveys is a hot topic in international research. Advanced imaging techniques for segmenting ice flow block images are affected by ice block compression, stacking, and the distribution of light and shadow in the river channel image, posing a common challenge for scholars worldwide. However, developing models for ice block morphology parameters that reflect the joint influence of multiple factors such as the variable and multi-point ice break-up locations, uneven ice thickness, temperature fluctuations, accumulated temperature alternations, and ice block transport distances in the Yellow River requires further efforts by Chinese scholars.
(5). The Yellow River has many wandering channels characterized by varying water depths and significant spatiotemporal changes in hydraulic conditions. While models for river ice in straight and curved channels and the feedback mechanisms of sediment transport on riverbed and ice bottom roughness have been explored internationally, the branching channels of the Yellow River—especially the topographic changes caused by sediment-induced water depth variations—require further research by Chinese scholars.
(6). The stable ice coverage in the Inner Mongolia Reach of the Yellow River is about 80%. The formation, development, and disappearance processes of open water areas and their impact on ice jams/dams and ice break-up methods have not been well studied. This is another gap to be addressed by Chinese scholars.
(7). Quantifying the impacts of extreme climate events (e.g., warm winters) on the ice conditions of the Yellow River, as well as developing a coupled climate–hydrology–ice model and integrating it into ice disaster warning systems for the Yellow River require further efforts and improvement. While research has revealed that, under the eight global climate models of CMIP6, the Yellow River may not undergo complete freezing by 2070 [26], it is evident that the duration of ice runs before freeze-up and after break-up will persistently increase, while the period of stable ice freeze-up will diminish in the future. Particularly in high-risk areas for ice jams and dams, such as sections with gentle slopes, sharp bends, and bridges and/or water conservancy structures, it is imperative for Chinese scholars to amalgamate artificial intelligence and big data technologies, introduce regional economic assessments, and develop more astute warning systems and disaster loss assessment frameworks. The establishment of a minute-level ice dam risk warning model is fundamental to address the shortcomings of traditional models.
6.2. Some Research Challenges of Potential Mathematical Models and Methods for Yellow River Ice
Aside from the mathematical developments relating to the Yellow River ice in China, there are some mathematical models and methods that can be used for ice-related problems in general, some of which have potential for application to Yellow River ice problems. In particular, the following three methods can be considered in future studies.
(1). Logistic regression models with upper and lower limits provide essential limits for ice-related physical phenomena, such as the effect of cloud cover on solar irradiance. Shortwave radiation in the air–ice heat balance in one-dimensional mathematical river ice models is typically considered only for clear days. Although the Yellow River region experiences predominantly sunny conditions during winter, cloudy days are not uncommon. Some regions utilize solar irradiance measurements from clear days as upper limits and cloudy day measurements as lower limits (with the cloud cover parameter set as 0 and 10, respectively) [83]. While linear relationships between solar irradiance and cloud cover have been established using available data [13], quadratic relationships fail to accurately represent conditions within the considered range of cloud cover values (0 and 10). This highlights a critical limitation: statistical relationships derived only within the range of measured data may not align with theoretical logic when data under limiting conditions are lacking.
In other parameterized statistics regarding the Yellow River ice, logistic regression models have been successfully applied to correlate intra-ice radar wave speed with air temperature [34]. It is recommended that this statistical relationship be used between thermal diffusion coefficients and broad ice temperature ranges [149].
(2). Wavelet analysis has proven effective in analyzing periodic ice problems, such as ice temperature variations [150] and ice forces on structures [151]. In studies of daily variations in Yellow River and lake border ice conditions [152], wavelet analysis combined with local meteorological data provided a robust mathematical framework for understanding meteorological driving forces. Bai et al. [153] have analyzed the daily process of dissolved oxygen in Finland’s Valkea-Kotinen Lake using wavelet analysis. This lake is at a high latitude such that it experiences short days and long nights for long periods in winter. While the influence of meteorological factors on this lake appears less pronounced than in the Yellow River, the success of wavelet analysis suggests promising applications for characterizing daily ice variations in the Yellow River. In 2024, a paper on the water channel ice was published, which used a wavelet-based method for the Chinese north-to-south water division channel [154]. Similar mid-latitude ice is influenced not only by distinct daily variations in temperature but also by distinct daily variations in radiation. Consequently, wavelet analysis shows potential for examining ice phenomena governed by fundamental physical properties such as temperature and water content within the ice.
The winter sunshine duration varies with latitude and Julian day across regions. The integration of wavelet analysis with geophysical concepts enables the precise calculation of sunrise, sunset, and local noon times across different latitudes and Julian days [83]. This approach also addresses the mathematical challenge of asymmetric waveform midpoints resulting from seasonal variations in the day–night duration across geographical locations. It should also be noted that the problem of asymmetric midpoint position in waveforms caused by variations in winter day–night duration at different places also has a mathematical solution.
(3). Fractal geometry is characterized by the property of self-similarity, which can be absolute or statistical. Fractal dimensions can describe irregular and fragmented geometrical forms, making it particularly suitable for characterizing the complex forms of natural materials. While natural river and lake ice exhibit diverse morphological characteristics, their shapes fundamentally reflect break-up and drift processes driven by external forces, which are ultimately a reflection of the ice’s microstructure as a crystalline material. The growth environment’s complexity leads to varied ice crystal morphologies; however, all such morphologies maintain characteristics derived from ice’s fundamental hexagonal crystal system, which imparts both distinctive and similar features across ice crystals. This internal crystalline structure fundamentally determines the initial shape and dimensions of the ice. Preliminary research has documented these characteristics in natural lake ice [155] and river ice broken up in different ways [156]. Therefore, fractal theory is a powerful mathematical tool to study ice blocks and cracks, which needs to be further developed by more scholars.
6.3. Future Research Directions for the Development of Mathematical Methods in Yellow River Ice
(1). The modeling of ice–water–sediment interactions in the Yellow River necessitates further refinement. While existing models already encompass hydrodynamics, thermodynamics, and sediment transport, the unique topography of the Inner Mongolia Reach of the Yellow River introduces certain complexities. Factors such as the gentle slope gradient, variations in channel width (from wide to narrow and vice versa), bend curvature, water depth, tributaries, hidden shoals, the physical and mechanical properties of sediment, the content and distribution of sediment within the ice, and dust deposition from sandstorms on the ice surface all influence the river’s water behavior and heat exchange processes. Thus, employing the mathematical principles of fractal geometry and clustering, the Inner Mongolia Reach of the Yellow River can be divided into units of different types. These units can then be further classified into more refined categories, based on hydrodynamic, thermodynamic, and sediment behavior parameters, which are specific to different terrains. This approach would enable the development of a multidimensional model that integrates hydrodynamics, thermodynamics, and morphological changes in the river channel, systematically reflecting the river’s flow velocity, temperature distribution, and morphological evolution. Subsequently, leveraging the dominant hydrological and meteorological factors in current models, the evolution of flow velocity, sediment transport, and temperature distribution under varying flow rates and temperature conditions could be intuitively simulated. This would incorporate changes in river morphology along the Yellow River (e.g., sediment suspension, rolling, and deposition; channel erosion and siltation), hydrodynamic changes (e.g., velocity distribution and flow lines), and regional thermal variations (e.g., the water temperature distribution, driven by hydrological and meteorological factors) into mathematical models and/or methods. This would yield an enhanced multidimensional model of the Yellow River ice, overcoming the present challenge of sparse data at certain cross-sections, as a few cross-sections are insufficient to represent the entire Inner Mongolia section of the river.
(2). While deterministic models have been developed to study ice jams and dams, significant uncertainties persist regarding their spatial and temporal occurrence. Ice jams and dams result from complex interactions between hydrometeorological dynamic and thermal processes, ice behaviors, and river conditions. On the one hand, thermodynamic factors control the thickness and strength of ice, while on the other hand, dynamic factors control the fracture, movement, and accumulation of frazil ice or ice layers. The stable formation of ice jams and dams represents an equilibrium between the shear resistance of bonding among frazil ice or ice blocks and external hydrometeorological forces within the river channel’s constraints. Although the physical mechanisms of these processes are relatively clear, definitive conclusions regarding the size and shape of ice blocks during disintegration and transport remain elusive, particularly under varying ice thicknesses [156]. While the size and shape of frazil ice and ice blocks significantly influence the internal porosity and overall cohesion of accumulations, shear mechanics-based constitutive relations for destabilization processes remain underdeveloped. While studies focused on the Yellow River’s ice have referenced critical parameters from Ettema and Urroz [157] and Beltaos [158], these applications lack validation through direct observations of the Yellow River. Similarly, numerical simulations of frazil ice distribution patterns under ice layers during early freeze-up periods rely heavily on certain assumptions [159]. In order to realize the formation and melting processes of ice jams and dams, modern monitoring tools are first needed to obtain the shape and size of ice blocks. The size distribution of frazil ice or ice blocks may be described according to block shape parameters, such as the roundness, flatness, elongation, and relative width for calculation of the shape index; normalized shape factor; morphological complexity index; comprehensive morphological index; and standardized morphological index [160]. Methods for determination of the rolling resistance of granular materials may have potential value [161]. Meanwhile, the accumulation shape of ice jams and dams can be obtained through the use of monitoring tools, with the shape and complexity of ice blocks potentially being described according to their fractal dimensions. Future research on ice jams and dams can draw lessons from research on the accumulation shapes of polar sea ice ridges [162], which progress from individual investigations to mathematical indicators at macro scales. Resolving the problem of ice dam-related damage requires an integrated approach combining mathematical descriptive expressions of ice ridges, block shear constitutive relations, hydrometeorological dynamics-based calculation methods, and river channel mathematical characterizations.
(3). The fundamental process of heat balance on ice surfaces is heat exchange, leading to the formation and melting of ice by means of thermal convection, thermal radiation, and thermal conduction. In the context of the Yellow River, two distinctive characteristics significantly influence these processes: the presence of impurities within the ice structure [28,32] and the presence of dust particles on ice surfaces, deposited during spring sandstorms. These characteristics alter the ice’s thermal properties in two critical ways. First, surface dust accumulation modifies the ice’s color, significantly affecting the albedo of its surface. Second, internal impurities alter the ice’s thermal conductivity, necessitating the application of composite media thermal conductivity models rather than consideration of pure ice’s simple thermal constants. This demands both the introduction of established composite thermal conductivity models and the development of advanced mathematical stochastic models to address these challenges [84].
(4). Frozen rivers experience varying weather conditions during winter, being sometimes sunny and sometimes cloudy. In addition to considering the variation in solar radiation intensity and sunlight duration with latitude on clear days, the impact of cloud cover on radiation intensity requires further investigation. Li et al. [83] have demonstrated that linear regression models inadequately represent the relationship between cloud cover and radiation intensity, instead proposing a logistic model for statistical analysis of this relationship. While this statistical approach aligns with both physical laws and mathematical principles in parameterizing river ice models, further comprehensive research is necessary to validate and refine these methods.
(5). Advances in modern monitoring technologies have overcome safety limitations in traditional ice monitoring projects, enabling comprehensive space–air–ground/ice integrated ice monitoring approaches. This technological evolution allows for intelligent, multi-element monitoring of ice conditions throughout its entire lifecycle. However, the validation and refinement of deterministic and stochastic mathematical models for river ice require not only space–air–ground/ice integrated ice condition survey data but also extensive field data, including high-precision river topography, real-time hydrological data, and meteorological data. To date, research and survey efforts on the Yellow River—particularly those focused on riverbanks or ice surfaces—remain sparse and scattered across certain cross-sections and stations. There is a need to enhance space–ground/ice monitoring data. Additionally, the use of different monitoring techniques, each targeting different elements, necessitates different mathematical methods and models for data processing. In this context, the development of mathematical methodologies for data fusion across various technological platforms becomes crucial. As manual monitoring methods transition to intelligent monitoring systems, the processed data must not only be transmitted to users but also enable the system to intelligently determine and decide on subsequent monitoring methods, relevant monitoring elements, and preventive and mitigation measures. Such advanced capabilities require robust mathematical methods including image recognition algorithms, fuzzy clustering algorithms, and neural network algorithms.
(6). The Yellow River region plays a vital role in China’s economic development, and the prevention and mitigation of ice disasters in the Yellow River represents a combination of natural and socio-economic sciences. This necessitates the implementation of a comprehensive scientific management program from risk identification to risk assessment and risk assessment to risk control. In the past, when quantitative assessment indicators were identified, there was a lack of quantification of uncertainties in decision-makers’ subjective cognitions. This limitation has created information gaps in the assessment of ice flood disaster risk, that is, uncertainty. Uncertainty measurement theory offers a solution to address incomplete objective information while minimizing human subjective bias in scenarios characterized by limited data [163]. Set pair analysis provides a systematic theoretical approach to deal with certainty and uncertainty, unifying the complex relationships between objective things through the principles of identity, difference, and opposition. By coupling uncertainty measurement theory with set pair analysis, the ice flood-prone areas of the Yellow River can be systematically analyzed in sections. This integrated approach is expected to enable the establishment of localized ice flood disaster risk assessment models, introducing novel methodologies for studying ice flood disaster risk throughout the Yellow River.
7. Conclusions
This review comprehensively addressed the inherent uncertainties in mathematical models for ice processes in rivers, with a particular focus on the Yellow River. It emphasized the sources, impacts, and methods for potential resolution of these uncertainties from the perspectives of physical and mathematical theories, the natural conditions of the Yellow River, the capabilities of space–air–ground/ice integrated observation technology, and ice disaster warning systems. The key findings are summarized as follows:
- The sediment content and unfrozen water within the Yellow River ice play pivotal roles in influencing its density, thermal conductivity, specific heat, dielectric properties, mechanical properties, and more. These factors drive the spatial and temporal variations in the basic properties of the Yellow River ice, thereby introducing significant uncertainties. These uncertainties notably affect the applicability of mathematical models and the accuracy and universality of mathematical methods. They also highlight challenges in terms of numerical simulations of ice thermodynamics and thickness inversion using radar. Future developments must concentrate on advanced models tailored to the four-phase composite medium of air–ice–water–sediment within the Yellow River.
- To address uncertainties in deterministic models related to the Yellow River’s ice conditions—such as ice bottom roughness, heat exchange coefficients at the air–ice/water interfaces, effects of cloud cover on solar radiation, and the basic properties of ice—the development and integration of advanced mathematical tools, high-resolution monitoring systems, and interdisciplinary collaborative approaches is necessary. Short-term focuses should prioritize validating theoretical presumptions through the use of field data while enhancing the predictive accuracy of the developed models.
- The Yellow River, situated in the mid-latitudes, exhibits distinct regional characteristics regarding the formation and melting of ice. Its freezing and thawing locations are intricately linked to the paths of cold air. The rate of air temperature decline determines the time from drifting ice to stable ice cover, while the rate of air temperature increase determines the time from ice melting to the disappearance of drifting ice. In addition, climate change has increased the frequency of extreme sudden and drastic cooling and warming events. The interactions between the rate of air temperature change, hydrodynamic forces, and ice morphology determine the total amount of drifting ice and the resistance between ice blocks, as well as between ice blocks and riverbanks, with respect to the local Froude number. These factors influence the likelihood of ice jams or dams, ultimately determining the probability of “tranquil” or “violent” river break-ups. Despite the use of long-term observational data from the Yellow River, empirical correlations, and the use of machine learning approaches (e.g., BP neural networks) to enhance the prediction of ice jams/dams, challenges persist in capturing the nonlinear interactions occurring under climate change.
- Advancements in modern monitoring technologies have facilitated multi-scale data acquisition through the utilization of space–air–ground integrated monitoring systems. Nevertheless, challenges persist regarding the development of effective intelligent segmentation techniques, primarily due to the presence of overlapping ice edges and uneven lighting in ice images. Additionally, differences in spatial and temporal scales pose new demands for data assimilation and fusion techniques in terms of ice condition monitoring. Future efforts should focus on strengthening the integration of multi-source data obtained from space-, air-, and ground-based sensor platforms, while utilizing AI-driven decision systems for real-time ice condition monitoring and risk management.
Author Contributions
Conceptualization, B.T. and Z.L.; validation, C.L., S.H. and L.Z.; investigation, C.L., H.J. and Y.D.; data curation, S.H. and L.Z.; writing—original draft preparation, B.T. and Z.L.; writing—review and editing, S.H., C.L., H.J. and Y.D.; project administration, Z.L.; funding acquisition, Z.L. All authors have read and agreed to the published version of the manuscript.
Funding
This research was supported by joint funds of the National Natural Science Foundation of China (U23A2012), Key Science Foundation for Universities of Henan Province (24A110008), Senior Foreign Expert Introduction Project of Henan Province (HNGD2025034), and Cultivation Project of the National Natural Science Foundation of China.
Data Availability Statement
Not applicable.
Conflicts of Interest
The authors declare no conflicts of interest.
Nomenclature
The following nomenclature is used in this manuscript.
| Symbols | |
| B | The total river width (m) |
| B0 | The width of the open water surface (m) |
| P | The wetted perimeter of the channel (m) |
| nc | The composite roughness |
| nb | The riverbed roughness |
| ni | The ice bottom roughness |
| ni,e | The ice layer’s bottom surface roughness at the end of freezing period |
| ni,i | The initial bottom surface roughness of the ice layer |
| k | The attenuation coefficient for roughness with time |
| t | The time (s, min, hr, d) |
| tic | The number of freezing days |
| hi | The thickness of thermally grown ice (cm) |
| h0 | The initial ice thickness (cm) |
| hf | The thickness of frazil ice in the lower part of the ice layer (cm) |
| Ta | The air temperature (°C) |
| Tsfc | The ice surface temperature (°C) |
| Tf | The ice freezing temperature (°C) |
| Tw | The water temperature (°C) |
| ρi | Ice density (g/cm3) |
| Li | Latent heat of freezing (J/g) |
| ki | The ice thermal conductivity (W/m∙K) |
| FDD | The cumulative freezing degree-days (°C∙d) |
| FDD0 | The initial cumulative freezing degree-days (°C∙d) |
| ef | The porosity of the frazil ice layer |
| ka | The linear heat exchange coefficient at the air–ice interface (W/(m2∙°C)) |
| kwi | The heat exchange coefficient at the ice–water interface (W/(m2∙°C)) |
| α′ | The comprehensive heat exchange coefficient (W/(m2∙°C)) |
| ϕ | The net heat flux lost from the river surface (W/m2) |
| ϕ0 | The solar radiation without clouds (W/m2) |
| ϕs | The heat flux from solar radiation (W/m2) |
| ϕc1 | The solar radiation in the presence of clouds (W/m2) |
| C1 | The cloud cover (0–10; 0 indicates clear sky without clouds, 10 is full coverage of clouds) |
| β | The climate-related empirical parameter (W/m2) |
| A′ | The empirical coefficient from reference [70] |
| ζis | The empirical index from reference [70] |
| Acronyms | |
| CRISSP1D | Comprehensive River Ice Simulation System—1D |
| CRISSP2D | Comprehensive River Ice Simulation System—2D |
| DynaRICE | Dynamic River Ice Model |
| HEC-RAS | Hydrologic Engineering Center’s River Analysis System |
| HIGHTSI | High-resolution Thermodynamic Sea Ice Model |
| ICEJAM | Ice Jam Model |
| IAHR | International Association for Hydraulic Research |
| RICE | River Ice Continuum Model |
| RICEN | River Ice Model with Enhanced Numeric |
| RICE-E | River Ice Model—Enhanced |
| RICES2D | River Ice Simulation Model—2D |
| RIVJAM | River Jam Model |
| MIKE11-ICE | MIKE 11 Ice Module |
| Landsat-7 ETM | Landsat-7 Enhanced Thematic Mapper |
| GIS | Geographic information system |
| GPR | Ground-penetrating radar |
| PolSAR | Polarimetric synthetic aperture radar |
| BP | Back propagation (neural network) |
| UAV | Unmanned aerial vehicle |
| ANN | Artificial neural network |
| GVF | Gradient vector flow |
| MCW | Marker-controlled watershed |
| ML | Machine learning |
| VIKOR | VlseKriterijumska Optimizacija Kompromisno Resenje |
References
- Prowse, T.; Alfredsen, K.; Beltaos, S.; Bonsal, B.R.; Bowden, W.B.; Duguay, C.R.; Korhola, A.; McNamara, J.; Vincent, W.F.; Vuglinsky, V.; et al. Effects of changes in arctic lake and river ice. Ambio 2011, 40, 63–74. [Google Scholar] [CrossRef]
- Zheng, J. Research in the mathematical sciences in view of some new areas of applied mathematics. Sci. Sci. Manag. Sci. Technol. 1994, 15, 22–24. (In Chinese) [Google Scholar]
- Leppäranta, M. A review of analytical models of sea-ice growth. Atmos. Ocean 1993, 31, 123–138. [Google Scholar] [CrossRef]
- Shen, H.T. Mathematical modeling of river ice processes. Cold Reg. Sci. Technol. 2010, 62, 3–13. [Google Scholar] [CrossRef]
- Beltaos, S. Threshold between mechanical and thermal breakup of river ice cover. Cold Reg. Sci. Technol. 2003, 37, 1–13. [Google Scholar] [CrossRef]
- Massie, D.D.; White, K.D.; Daly, S.F.; McDonald, R. Predicting ice jams with neural networks. In Proceedings of the International Conference on Offshore Mechanics and Arctic Engineering, Oslo, Norway, 23–28 June 2002; Volume 36134, pp. 669–673. [Google Scholar]
- Xu, G.H.; Li, X.Y.; Shi, C.H. The complexity-stability relationship: Progress in mathematical models. Biodivers. Sci. 2019, 27, 1364–1378. (In Chinese) [Google Scholar]
- Luo, D.; Mao, W.X.; Sun, H.F. Risk assessment and analysis of ice disaster in Ning–Meng reach of Yellow River based on a two-phased intelligent model under grey information environment. Nat. Hazards 2017, 88, 591–610. [Google Scholar] [CrossRef]
- Chen, S.Y.; Ji, H.L. Fuzzy optimization neural network approach for ice forecast in the Inner Mongolia reach of the Yellow River. Hydrol. Sci. J. 2005, 50, 319–330. [Google Scholar]
- Sun, Z.C.; Yao, K.Z.; Zhou, M.; Fu, Y.W. Analysis of cause for the ice run flooding in January of 1982 at Hequ section of the Yellow River. Yellow River 1990, 1, 19–22. (In Chinese) [Google Scholar]
- Ke, S.J. A Study of Freeze-Up Forecasting Mathematical Model in the Inner Mongolia Reach of the Yellow River. Master’s Thesis, Hefei University of Technology, Hefei, China, 2002. (In Chinese). [Google Scholar]
- Luo, H.C. Characteristics of Ice-Flow-Sediment Transport and Its Coupling Mechanism of Bed Evolution at Sharp Bend in Inner Mongolia Section of the Yellow River. Ph.D. Thesis, Inner Mongolia Agricultural University, Hohhot, China, 2021. (In Chinese). [Google Scholar]
- Wang, T.; Guo, X.L.; Liu, J.F.; Chen, Y.Z.; She, Y.T.; Pan, J.J. Ice process simulation on hydraulic characteristics in the Yellow River. J. Hydraul. Eng. 2024, 150, 05024001. [Google Scholar] [CrossRef]
- Beltaos, S. Progress in the study and management of river ice jams. Cold Reg. Sci. Technol. 2008, 51, 2–19. [Google Scholar] [CrossRef]
- IAHR. River ice jams: A state of the art report. In Proceedings of the 8th International Association for Hydraulics Research, Symposium on Ice; Working Group on Ice; Institute of Hydraulic Research University of Iowa: Iowa, IA, USA, 1986; Volume 3. [Google Scholar]
- Wang, T.; Liu, Z.P.; Guo, X.L.; Fu, H.; Liu, W.B. Prediction of breakup ice jam with Artificial Neural Networks. J. Hydraul. Eng. 2017, 48, 1355–1362. (In Chinese) [Google Scholar]
- Pan, J.J.; Shen, H.T.; Guo, X.L.; Wang, T. A two-dimensional flow-ice-sediment coupled model for rivers I: Theory and methods. J. Hydraul. Eng. 2021, 52, 700–711. (In Chinese) [Google Scholar]
- Hu, J.B.; Liu, L.; Huang, Z.P.; You, Y.; Rao, S.Q. Ice Breakup Date Forecast with Hybrid Artificial Neural Networks. In Proceedings of the 4th International Conference on Natural Computation, Jinan, China, 18–20 October 2008. [Google Scholar]
- Fu, C.; Popescu, I.; Wang, C.; Myneet, A.E.; Zhang, F. Challenges in modelling river flow and ice regime on the Ningxia–Inner Mongolia reach of the Yellow River, China. Hydrol. Earth Syst. Sci. 2014, 18, 1225–1237. [Google Scholar] [CrossRef]
- Rokaya, P.; Morales-Marin, L.; Lindenschmidt, K.E. A physically-based modelling framework for operational forecasting of river ice breakup. Adv. Water Resour. 2020, 139, 103554. [Google Scholar] [CrossRef]
- Blackburn, J.; She, Y. A comprehensive public-domain river ice process model and its application to a complex natural river. Cold Reg. Sci. Technol. 2019, 163, 44–58. [Google Scholar] [CrossRef]
- Bai, T.; Wei, J.; Chang, F.; Yang, W.; Huang, Q. Optimize multi-objective transformation rules of water-sediment regulation for cascade reservoirs in the upper Yellow River of China. J. Hydrol. 2019, 577, 123987. [Google Scholar] [CrossRef]
- Wang, T.; Yang, K.L.; Guo, Y.X. Application of artificial neural networks to forecasting ice conditions of the Yellow River in the Inner Mongolia reach. J. Hydrol. Eng. 2008, 13, 811–816. [Google Scholar]
- Yao, H.M.; Qin, F.X.; Shen, G.C.; Dong, X.N. Ice regime characteristics in the Ningxia-Inner Mongolia reach of Yellow River. Adv. Water Sci. 2007, 18, 893–899. (In Chinese) [Google Scholar]
- Xie, J.; Xu, Y.-P.; Wang, Y.; Gu, H.; Wang, F.; Pan, S. Influences of climatic variability and human activities on terrestrial water storage variations across the Yellow River basin in the recent decade. J. Hydrol. 2019, 579, 124218. [Google Scholar] [CrossRef]
- Zhou, Z.Y.; Wang, T.; Sun, Y.F.; Chen, Y.Z.; Lu, J.Z. Analysis of the evolution of ice characteristics in the Yellow River under future climate scenarios. J. Hydraul. Eng. 2024, 55, 355–366. (In Chinese) [Google Scholar]
- Wang, J.; Shi, F.Y.; Chen, P.P. Stress criterion for mechanical ice-cover breakup based on elastic-plastic theory. J. Hydrol. Eng. 2013, 44, 344–348. (In Chinese) [Google Scholar]
- Fu, H.; Liu, Z.P.; Guo, X.L.; Cui, H.T. Double-frequency ground penetrating radar for measurement of ice thickness and water depth in rivers and canals: Development, verification and application. Cold Reg. Sci. Technol. 2018, 154, 85–94. [Google Scholar] [CrossRef]
- Cai, L. Characteristics of River Ice Regime in China; Yellow River Conservancy Press: Zhengzhou, China, 2008. (In Chinese) [Google Scholar]
- Sui, J.; Karney, B.W.; Sun, Z.; Wang, D. Field investigation of frazil jam evolution: A Case Study. J. Hydraul. Eng. 2002, 128, 781–787. [Google Scholar] [CrossRef]
- Wang, J.; Sui, J.; Zhang, H.; Chen, P.; Hirshfield, F. Mechanisms of ice accumulation in a river bend—An experimental study. Int. J. Sediment Res. 2012, 27, 521–537. [Google Scholar] [CrossRef]
- Zhang, Y.D.; Li, Z.J.; Xiu, Y.R.; Li, C.J.; Zhang, B.S.; Deng, Y. Microstructural characteristics of frazil particles and the physical properties of frazil ice in the Yellow River, China. Crystals 2021, 11, 617. [Google Scholar] [CrossRef]
- Wang, J.K.; Cao, X.W.; Wang, Q.K.; Yan, L.H.; Li, Z.J. Experimental relationship between flexural strength, elastic modulus of ice cover and equivalent ice temperature. South North Water Transf. Water Sci. Technol. 2016, 14, 75–80. (In Chinese) [Google Scholar]
- Li, Z.J.; Li, C.J.; Yang, Y.; Zhang, B.S.; Deng, Y.; Li, G.H. Physical mechanism and parameterization for correcting radar wave velocity in Yellow River ice with air temperature and ice thickness. Remote Sens. 2023, 15, 1121. [Google Scholar] [CrossRef]
- Wang, J.; Fu, H.; Yi, M.K.; Sun, X.Y.; Chen, P.P. The simulation of flow velocity profile under ice cover. J. Glaciol. Geocryol. 2009, 31, 705–710. (In Chinese) [Google Scholar]
- Wang, J. A study on the relations about balance ice jam thickness with its flow conditions and ice discharge. J. Lanzhou Univ. Nat. Sci. 2002, 38, 117–121. (In Chinese) [Google Scholar]
- Wang, X.; Luo, H.; Ji, H.; Li, B. Experimental study on characteristics of subglacial circulation for Shisifenzi bend flow in Yellow River. Adv. Sci. Tech. Water Res. 2023, 43, 31–36+51. (In Chinese) [Google Scholar]
- Luo, H.; Ji, H.; Chen, Z.; Liu, B.; Xue, Z.; Li, Z. An analytical study for predicting incipient motion velocity of sediments under ice cover. Sci. Rep. 2025, 15, 1912. [Google Scholar] [CrossRef]
- Yang, Z.; Ji, H.L.; Li, H.; Mou, X.Y.; Mao, Y.X.; Song, H.Z. Investigating influence factors and developing regression model for sandy silt strength in Inner Mongolia section of Yellow River under freeze-thaw cycles. J. Arid Land Res. Environ. 2024, 38, 137–147. (In Chinese) [Google Scholar]
- Xu, G.B. One-dimensional mathematical models of river ice evolving process. J. Water Resour. Water Eng. 2011, 22, 78–83. (In Chinese) [Google Scholar]
- Shen, H.T.; Shen, H.; Tsai, S.M. Dynamic transport of river ice. J. Hydraul. Res. 1990, 28, 659–671. [Google Scholar] [CrossRef]
- Lal, A.W.; Shen, H.T. Mathematical model for river ice processes. J. Hydraul. Eng. 1991, 117, 851–867. [Google Scholar] [CrossRef]
- Shen, H.T.; Wang, D.S.; Lal, A.W. Numerical simulation of river ice processes. J. Cold Reg. Eng. 1995, 9, 107–118. [Google Scholar] [CrossRef]
- Shen, H.T. River Ice Research; Yellow River Water Resources Press: Zhengzhou, China, 2010. (In Chinese) [Google Scholar]
- Shen, H.T. CRISSP1D Programmer’s Manual; CEATI Report, No. T012700–0401; Department of Civil Engineering, Clarkson University: Potsdam, NY, USA, 2005. [Google Scholar]
- Chen, F.H.; Shen, H.T.; Jayasundara, N.C. A one-dimensional comprehensive river ice model. In Proceedings of the 18th IAHR International Symposium on Ice, Sapporo, Japan, 28 August–1 September 2006. [Google Scholar]
- Kandamby, A.; Jayasundara, N.; Shen, H.T.; Deyhle, C. A numerical river ice model for Elbe River. In Proceedings of the 20th IAHR International Symposium on Ice, Lahti, Finland, 14–18 June 2010. [Google Scholar]
- Uzuner, M.S.; Kennedy, J.F. Theoretical model of river ice jams. J. Hydraul. Div. 1976, 102, 1365–1383. [Google Scholar] [CrossRef]
- Shen, H.T.; Su, J.S.; Liu, L.W. SPH simulation of river ice dynamics. J. Comput. Phys. 2000, 165, 752–770. [Google Scholar] [CrossRef]
- Liu, L.W.; Li, H.; Shen, H.T. A two-dimensional comprehensive river ice model. In Proceedings of the 18th IAHR International Symposium on Ice, Sapporo, Japan, 28 August–1 September 2006. [Google Scholar]
- Knack, I.M.; Shen, H.T. A numerical model for sediment transport and bed change with river ice. J. Hydraul. Res. 2018, 56, 844–856. [Google Scholar] [CrossRef]
- Pan, J.J.; Shen, H.T. Modeling ice cover effect on river channel bank stability. Environ. Fluid Mech. 2022, 22, 1121–1133. [Google Scholar] [CrossRef]
- Ma, X.Y.; Fukushima, Y. A numerical model of the river freezing process and its application to the Lena River. Hydrol. Process. 2002, 16, 2131–2140. [Google Scholar] [CrossRef]
- Wang, J.; Chen, P.P.; Sui, J.Y. Numerical simulation of ice jams in natural channels. J. Hydraul. Eng. 2011, 42, 1117–1121. (In Chinese) [Google Scholar]
- Chen, P.P.; Wang, J. Study of the treatment technology of irregular boundaries for numerical simulating river ice. J. Glaciol. Geocryol. 2012, 34, 1353–1357. (In Chinese) [Google Scholar]
- Pariset, E.; Hauser, R. Formation and evolution of ice covers on rivers. Trans. Eng. Inst. Can. 1961, 5, 41–49. [Google Scholar]
- Tatinclaux, J.C.; Gogus, M. Asymmetric plane flow with application to ice jams. J. Hydraul. Eng. 1983, 109, 1540–1554. [Google Scholar] [CrossRef]
- Flato, G.M. Calculation of Ice Jam Profiles. Master’s Thesis, University of Alberta, Edmonton, AB, Canada, 1988. [Google Scholar]
- Beltaos, S. Numerical computation of river ice jams. Can. J. Civ. Eng. 1993, 20, 88–99. [Google Scholar] [CrossRef]
- Daly, S.F.; Vuyovich, C.M. Modeling river ice with HEC-RAS. In Proceedings of the 12th Workshop on the Hydraulics of Ice Covered Rivers, Edmonton, AB, Canada, 19–20 June 2003. [Google Scholar]
- Timalsina, N.P.; Charmasson, J.; Alfredsen, K.T. Simulation of the ice regime in a Norwegian regulated river. Cold Reg. Sci. Technol. 2013, 94, 61–73. [Google Scholar] [CrossRef]
- Guo, X.L.; Yang, K.L.; Fu, H.; Wang, T.; Guo, Y.X. Simulation and analysis of ice processes in an artificial open channel. J. Hydrodyn. 2013, 25, 542–549. [Google Scholar] [CrossRef]
- Yang, K.L.; Wang, T.; Guo, X.L.; Fu, H.; Guo, Y.X. Safety regulations of water conveyance in the middle route of south-to-north water diversion project in ice period. South North Water Transf. Water Sci. Technol. 2011, 9, 1–4. (In Chinese) [Google Scholar]
- Ministry of Water Resources of the People’s Republic of China. SL428-2008 Specification for Ice Flood Computation; China Water&Power Press: Beijing, China, 2008. (In Chinese)
- Yang, Y. Physical Parameter Identification and High Resolution Modeling in Ice and Snow Thermodynamic Processes. Ph.D. Thesis, Dalian University of Technology, Dalian, China, 2012. (In Chinese). [Google Scholar]
- Stefan, J. Über die Theorie der Eisbildung, insbesondere über die Eisbildung im Polarmeere. Ann. Phys. 1891, 278, 269–286. (In German) [Google Scholar] [CrossRef]
- Shen, H.T.; Yapa, P.D. A unified degree-day method for river ice cover thickness simulation. Can. J. Civ. Eng. 1985, 12, 54–62. [Google Scholar] [CrossRef]
- Zhao, S.; Shen, H.T.; Shi, X.; Li, C.; Li, C.; Zhao, S. Wintertime surface heat exchange for the Inner Mongolia Reach of the Yellow River. J. Am. Water Resour. Assoc. 2020, 56, 348–356. [Google Scholar] [CrossRef]
- Ke, S.J.; Lu, G.Q.; Ren, Z.Y. Study on mechanism of ice jam formation in Bayangaole section of Yellow River. J. Hydraul. Eng. 2000, 7, 66–69. (In Chinese) [Google Scholar]
- Ministry of Water Resources of the People’s Republic of China. SL278-2002 Regulation for Hydrology Computation of Water Resource and Hydropower Projects; China Water&Power Press: Beijing, China, 2002. (In Chinese)
- Wang, J.; Hou, Z.X. Simulation of ice cover thickness in Inner Mongolia Section of Yellow River. South North Water Transf. Water Sci. Technol. 2021, 19, 921–929. (In Chinese) [Google Scholar]
- Bai, Y.L.; Xu, H.; Shi, L.Q. Research on the optimal identification of thermal diffusivity of fresh ice in reservoirs of cold regions. In Proceedings of the 21st IAHR International Symposium on Ice, Ice Research for a Sustainable Environment, Dalian, China, 11–15 June 2012. [Google Scholar]
- Li, Z.J.; Fu, X.; Shi, L.Q.; Huang, W.F.; Li, C.J. Recent advances and challenges in the inverse identification of thermal diffusivity of natural ice in China. Water 2023, 15, 1041. [Google Scholar] [CrossRef]
- Shen, H.T. River ice processes. In Advances in Water Resources Management; Springer: Cham, Switzerland, 2016; pp. 483–530. [Google Scholar]
- Briegleb, B.; Bitz, C.; Hunke, E.; Lipscomb, W.; Holland, M.; Schramm, J.; Moritz, R.E. Scientific description of the sea ice component in the Community Climate System Model. Version 2004, 3, 70. [Google Scholar]
- Curry, J.; Schramm, J.; Perovich, D.; Pinto, J. Applications of SHEBA/FIRE data to evaluation of snow/ice albedo parameterizations. J. Geophys. Res. Atmos. 2001, 106, 15345–15355. [Google Scholar] [CrossRef]
- Shine, K. Parametrization of the shortwave flux over high albedo surfaces as a function of cloud thickness and surface albedo. Q. J. R. Meteorol. Soc. 1984, 110, 747–764. [Google Scholar] [CrossRef]
- Bennett, T.J., Jr. A Coupled Atmosphere-Sea Ice Model Study of the Role of Sea Ice in Climatic Predictability. Ph.D. Thesis, University of Illinois at Urbana-Champaign, Urbana-Champaign, IL, USA, 1982. [Google Scholar]
- Efimova, N. On methods of calculating monthly values of net longwave radiation. Meterol. Gidrol. 1961, 10, 28–33. [Google Scholar]
- Jacobs, J.D. Radiation climate of broughton island. In Energy Budget Studies in Relation to Fast-Ice Breakup Processes in Davis Strait; Barry, R.G., Jacobs, J.D., Eds.; University of Colorado, Institute of Arctic and Alpine Research: Boulder, CO, USA, 1978; pp. 105–120. [Google Scholar]
- Cao, Y.Q.; Zhang, W.; Yao, J.Y.; Wang, W. Variation of cloud fraction and its relationship with solar radiation over semi-arid region. J. Arid Meteorol. 2015, 33, 684–693. (In Chinese) [Google Scholar]
- Ashton, G.D.; Kennedy, J.F. Ripples on underside of river ice covers. J. Hydraul. Div. 1972, 98, 1603–1624. [Google Scholar] [CrossRef]
- Li, Z.J.; Wang, Q.K.; Tang, M.G.; Lu, P.; Li, G.Y.; Leppäranta, M.; Huotari, J.; Arvola, L.; Shi, L.J. Diurnal cycle model of lake ice surface albedo: A case study of Wuliangsuhai Lake. Remote Sens. 2021, 13, 3334. [Google Scholar] [CrossRef]
- Li, C.J. Comprehensive Applied Study of the Basic Properties of Freshwater Ice in the Yellow River Field Test. Doctor’s Thesis, Dalian University of Technology, Dalian, China, 2024. (In Chinese). [Google Scholar]
- Yang, J.; She, Y.; Loewen, M. Assessing the uncertainties in modeling water temperatures during river cooling and freeze-up periods. Cold Reg. Sci. Technol. 2023, 210, 103840. [Google Scholar] [CrossRef]
- Aslamov, I.A.; Kozlov, V.V.; Kirillin, G.B.; Mizandrontsev, I.B.; Kucher, K.M.; Makarov, M.M.; Gornov, A.Y.; Granin, N.G. Ice–water heat exchange during ice growth in Lake Baikal. J. Great Lakes Res. 2014, 40, 599–607. [Google Scholar] [CrossRef]
- Bai, Y.L.; Li, Z.J.; Feng, E.M.; Han, M.; Lu, P. Identification and optimization for effective thermal diffusivity of fresh ice. Chin. J. Comput. Mech. 2007, 24, 187–191. (In Chinese) [Google Scholar]
- Cao, X.W. Observation and Simulation Research on Growth and Decay Processes of Ice Cover on Lake Wuliangsuhai. Ph.D. Thesis, Dalian University of Technology, Dalian, China, 2021. (In Chinese). [Google Scholar]
- Masterson, D.M. State of the art of ice bearing capacity and ice construction. Cold Reg. Sci. Technol. 2009, 58, 99–112. [Google Scholar] [CrossRef]
- Li, C.J.; Li, Z.J.; Yang, Y.; Wang, Q.K.; Zhang, B.S.; Deng, Y. Theory and application of ice thermodynamics and mechanics for the natural sinking of gabion mattresses on a floating ice cover. Cold Reg. Sci. Technol. 2023, 213, 103925. [Google Scholar] [CrossRef]
- Launiainen, J.; Cheng, B. Modelling of ice thermodynamics in natural water bodies. Cold Reg. Sci. Technol. 1998, 27, 153–178. [Google Scholar] [CrossRef]
- Arcone, S.A.; Delaney, A.J. Airborne river-ice thickness profiling with helicopter-borne UHF short-pulse radar. J. Glaciol. 1987, 33, 330–340. [Google Scholar] [CrossRef]
- Evans, S. Dielectric properties of ice and snow–a review. J. Glaciol. 1965, 5, 773–792. [Google Scholar] [CrossRef]
- Koh, G. Complex dielectric constant of ice at 1.8 GHz. Cold Reg. Sci. Technol. 1997, 25, 119–121. [Google Scholar] [CrossRef]
- Lunt, I.A.; Hubbard, S.S.; Rubin, Y. Soil moisture content estimation using ground-penetrating radar reflection data. J. Hydrol. 2005, 307, 254–269. [Google Scholar] [CrossRef]
- Chu, T.; Lindenschmidt, K.E. Integration of space-borne and air-borne data in monitoring river ice processes in the Slave River, Canada. Remote Sens. Environ. 2016, 181, 65–81. [Google Scholar] [CrossRef]
- Romanov, P. Global multisensor automated satellite-based snow and ice mapping system (GMASI) for cryosphere monitoring. Remote Sens. Environ. 2017, 196, 42–55. [Google Scholar] [CrossRef]
- Liu, H.; Ji, H.L.; Luo, H.C.; Gao, G.M.; Zhang, B.S.; Mou, X.Y. Application of UAV radar in survey of ice thickness and ice structure. J. Drain. Irrig. Mach. Eng. 2021, 39, 630–636. (In Chinese) [Google Scholar]
- Zhang, X.; Zhou, Y.; Jin, J.; Wang, Y.; Fan, M.; Wang, N.; Zhang, Y. ICENETv2: A Fine-grained river ice semantic segmentation network based on UAV images. Remote Sens. 2021, 13, 633. [Google Scholar] [CrossRef]
- Bourgault, D. Shore-based photogrammetry of river ice. Can. J. Civ. Eng. 2008, 35, 80–86. [Google Scholar] [CrossRef]
- Ansari, S.; Rennie, C.; Seidou, O.; Malenchak, J.; Zare, S. Automated monitoring of river ice processes using shore-based imagery. Cold Reg. Sci. Technol. 2017, 142, 1–16. [Google Scholar] [CrossRef]
- Zhang, Q.; Skjetne, R.; Su, B. Automatic image segmentation for boundary detection of apparently connected sea-ice floes. In Proceedings of the 22nd International Conference on Port and Ocean Engineering Under Arctic Conditions, Espoo, Finland, 9–13 June 2013. [Google Scholar]
- Ostu, N. A threshold selection method from gray-level histograms. IEEE Trans. SMC 1979, 9, 62–66. [Google Scholar]
- Hu, S.B. Research on Ice Inversion Identification and Migration Process Based on UAV Low-Altitude Remote Sensing. Master’s Thesis, Northeast Agricultural University, Harbin, China, 2022. (In Chinese). [Google Scholar]
- Yang, X.J.; Chen, P. SAR image denoising algorithm based on Bayes wavelet shrinkage and fast guided filter. J. Adv. Comput. Intell. Intell. Inf. 2019, 23, 107–113. [Google Scholar] [CrossRef]
- Ahmadi, S.; Zoej, M.J.V.; Ebadi, H.; Moghaddam, H.A.; Mohammadzadeh, A. Automatic urban building boundary extraction from high resolution aerial images using an innovative model of active contours. Int. J. Appl. Earth Obs. Geoinf. 2010, 12, 150–157. [Google Scholar] [CrossRef]
- Zhang, X.Q.; Dong, G.G.; Xiong, B.L.; Kuang, G.Y. Refined segmentation of ship target in SAR images based on GVF snake with elliptical constraint. Remote Sens. Lett. 2017, 8, 791–800. [Google Scholar] [CrossRef]
- Lakshmi, K.G.A.; Surling, S.N.N.; Sheeba, O. A novel approach for the removal of artifacts in EEG signals. In Proceedings of the 2017 International Conference on Wireless Communications, Signal Processing and Networking (WiSPNET), Chennai, India, 22–24 March 2017. [Google Scholar]
- Singh, A.; Kalke, H.; Loewen, M.; Ray, N. River ice segmentation with deep learning. IEEE Trans. Geosci. Remote Sens. 2020, 58, 7570–7579. [Google Scholar] [CrossRef]
- Zhang, Q.; Skjetne, R.; Metrikin, I.; Løset, S. Image processing for ice floe analyses in broken-ice model testing. Cold Reg. Sci. Technol. 2015, 111, 27–38. [Google Scholar] [CrossRef]
- Akter, S.; Imtiaz, S.; Islam, M.; Ahmed, S.; Zaman, H.; Gash, R. Image based ice-field characterization and load prediction in managed ice field. Cold Reg. Sci. Technol. 2025, 231, 104381. [Google Scholar] [CrossRef]
- Parmiggiani, F.; Moctezuma-Flores, M.; Wadhams, P.; Aulicino, G. Image processing for pancake ice detection and size distribution computation. Int. J. Remote Sens. 2019, 40, 3368–3383. [Google Scholar] [CrossRef]
- Haugen, J.; Imsland, L.; Løset, S.; Skjetne, R. Ice observer system for ice management operations. In Proceedings of the 21st International Ocean and Polar Engineering Conference, Maui, HI, USA, 19–24 June 2011. [Google Scholar]
- Ansari, S.; Rennie, C.D.; Clark, S.P.; Seidou, O. IceMaskNet: River ice detection and characterization using deep learning algorithms applied to aerial photography. Cold Reg. Sci. Technol. 2021, 189, 103324. [Google Scholar] [CrossRef]
- Zhang, X.W.; Yue, Y.Z.; Han, L.; Li, F.; Yuan, X.Z.; Fan, M.H.; Zhang, Y.N. River ice monitoring and change detection with multi-spectral and SAR images: Application over yellow river. Multimed. Tools Appl. 2021, 80, 28989–29004. [Google Scholar] [CrossRef]
- Liu, L.M.; Xu, Q.; Yang, S.Q. Identification of river ice on the Yellow River using LANDSAT images. In Proceedings of the 18th International Conference on Geoinformatics, Beijing, China, 18–20 June 2010. [Google Scholar]
- Huang, P.P.; Shi, Q.; Xu, W.; Tan, W.X. Research on Yellow River ice supervised classification method based on polarimetric SAR data. In Proceedings of the IEEE International Conference on Signal, Information and Data Processing, Chongqing, China, 11–13 December 2019. [Google Scholar]
- Huang, P.P.; Shi, Q.; Tan, W.X.; Xu, W. Yellow River ice decision tree classification method based on polarimetric SAR data. In Proceedings of the IEEE International Geoscience and Remote Sensing Symposium, Yokohama, Japan, 28 July–2 August 2019. [Google Scholar]
- Li, H.J.; Li, H.Y.; Wang, J.; Hao, X.H. Advances in remote sensing of river ice. Adv. Earth Sci. 2020, 35, 1041–1051. (In Chinese) [Google Scholar]
- Yang, G. Inversion of Ice Thickness and Its Variation Characteristics in Wanjiazhai Reservoir Area Based on Remote Sensing Data. Master’s Thesis, Inner Mongolia Agricultural University, Hohhot, China, 2019. (In Chinese). [Google Scholar]
- Lalumiere, L.; Prinsenberg, S.; Peterson, I. Observing pack ice properties with a helicopter-borne video-laser-GPS sensor. In Proceedings of the 10th International Ocean and Polar Engineering Conference, Seattle, DC, USA, 28 May–2 June 2000. [Google Scholar]
- Zhang, B.S.; Gao, G.M. Experimental study on the monitoring technology of ice flow on Ningxia-Inner Mongolia section of the Yellow River. J. Eng. HeiLongjiang Univ. 2009, 36, 90–95. (In Chinese) [Google Scholar]
- Fang, H. Studying the Dispersion from Heterogeneous Underground Materials in Ground Penetration Radar. Ph.D. Thesis, China University of Geosciences (Beijing), Beijing, China, 2005. (In Chinese). [Google Scholar]
- Zhang, G.J.; Yu, C.; Huang, S.; Shu, Z.L.; Liu, B.X.; Wu, H.K. Mathematical problems in engineering detection of concrete structures with cavity defects by ground penetrating radar and meshless simulation based on improved weight function. Sci. Technol. Innov. 2022, 33, 122–126. (In Chinese) [Google Scholar]
- Li, W. ANN-Based Sub-Surface Objects Identification and Inversion of Dielectric Properties by Means of GPR. Master’s Thesis, Nanchang University, Nanchang, China, 2012. (In Chinese). [Google Scholar]
- Ji, H.L. Factor Analysis for Ice Flood and Model Research for Freeze-Up Time and Break-Up Time in the Inner Mongolia Reach of the Yellow River. Ph.D. Thesis, Inner Mongolia Agricultural University, Hohhot, China, 2002. (In Chinese). [Google Scholar]
- Sun, Y.F.; Wang, T.; Zhou, Z.Y. Ice prediction and identification of influence parameters affecting the initial freeze-up of the Inner Mongolia reach of the Yellow River. J. China Inst. Water Resour. Hydropower Res. 2024, 22, 149–158. (In Chinese) [Google Scholar]
- Guo, Y.X.; Wang, T.; Yang, K.L.; Huo, S.Q.; Rao, S.Q. Design and development of decision support system for ice regime forecast of Ningxia-Inner Mongolia reach of Yellow River. Water Resour. Hydropower Eng. 2005, 36, 70–72. (In Chinese) [Google Scholar]
- Chen, Z.T.; Ke, S.J. River ice modelling in lower reaches of the Yellow River and its utility in sanmen gorge reservoir regulation. J. Glaciol. Geocryol. 1994, 16, 211–217. (In Chinese) [Google Scholar]
- Tian, F.C. Driving Mechanism and Risk Diagnosis and Assessment Methods of Ice Flood Disasters in the Ningxia-Inner Mongolia Reach of Yellow River. Ph.D. Thesis, Tianjin University, Tianjin, China, 2020. (In Chinese). [Google Scholar]
- Guo, X.L.; Wang, T.; Fu, H.; Guo, Y.X.; Li, J.Z. Ice-jam forecasting during river breakup based on neural network theory. J. Cold Reg. Eng. 2018, 32, 04018010. [Google Scholar] [CrossRef]
- Wang, S.J. Research of the Ice Condition Forecasting Based on GA Artificial Neural Network. Master’s Thesis, Tianjin University, Tianjin, China, 2008. (In Chinese). [Google Scholar]
- Bu, S. Application of BP Neural Network Based on Swarm Intelligence Methods for Prediction of the Stage and Thickness for Ice Jam. Master’s Thesis, Hefei University of Technology, Hefei, China, 2009. (In Chinese). [Google Scholar]
- Wang, J.; Yi, M.K.; Fu, H.; Yin, Y.J.; Gao, Y.X. Application of artificial neural network to predict the increase in stage due to ice jam in a bend. J. Glaciol. Geocryol. 2006, 28, 782–786. (In Chinese) [Google Scholar]
- Hu, L.; Zhang, Q.; Wang, G.; Singh, V.P.; Wu, W.H.; Fan, K.K.; Shen, Z.X. Flood disaster risk and socioeconomic in the Yellow River Basin, China. J. Hydrol. Reg. Stud. 2022, 44, 101272. [Google Scholar] [CrossRef]
- Gao, G.M.; Yu, G.Q.; Wang, Z.L.; Li, S.X. Advances in break-up date forecasting model research in the Ningxia-Inner Mongolia reach of the Yellow River. In Proceedings of the 21th IAHR International Symposium on Ice, Dalian, China, 11–15 June 2012. [Google Scholar]
- Song, W.H.; Liu, H.Z.; Cui, P.; Xu, M.Y. Analysis of the characteristics of medium and small floods and reservoir operation in the upper reaches of the Yellow River in recent years. Yellow River 2020, 42, 34–39. (In Chinese) [Google Scholar]
- Guo, L.B.; Zhou, Y.H.; Tian, F.C.; Yuan, X.M.; Wang, L.N. Influence factors and evolution characteristics of ice flood disaster in the Ningxia-Inner Mongolia section of the Yellow River. Yellow River 2020, 42, 22–26. (In Chinese) [Google Scholar]
- Yuan, X.M.; Cao, L.G.; Jia, S.J.; Tian, F.C. Coupled modeling of bed deformation and stability analysis on a typical vulnerable zone on the Ningxia reach of the Yellow River during flood season. J. Flood Risk Manag. 2021, 14, e12704. [Google Scholar] [CrossRef]
- Yuan, X.M.; Zhang, X.Y.; Tian, F.C. Research and application of an intelligent networking model for flood forecasting in the arid mountainous basins. J. Flood Risk Manag. 2020, 13, e12638. [Google Scholar] [CrossRef]
- Wang, Z.M.; Ren, Y.F.; Yang, D. Research on the quantification of disaster warning index and warning index system of ice flood. Yellow River 2021, 43, 45–50. (In Chinese) [Google Scholar]
- Luo, D. Risk evaluation of ice-jam disasters using gray systems theory: The case of Ningxia-Inner Mongolia reaches of the Yellow River. Nat. Hazards 2014, 71, 1419–1431. [Google Scholar] [CrossRef]
- Luo, D.; Jia, H.D. Risk assessment of ice disaster in the Yellow River based on extended VIKOR method. J. N. China Univ. Water Resour. Electr. Power 2017, 38, 52–57. (In Chinese) [Google Scholar]
- Wu, C.G.; Wei, Y.M.; Jin, J.L.; Huang, Q.; Zhou, Y.L.; Liu, L. Comprehensive evaluation of ice disaster risk of the Ningxia–Inner Mongolia reach in the upper Yellow River. Nat. Hazards 2015, 75, 179–197. [Google Scholar] [CrossRef]
- Li, S. Research on the Grey Decision-Making Model and Its Application to the Yellow River Ice Disaster Risk Management. Master’s Thesis, North China University of Water Resources and Electric Power, Zhengzhou, China, 2016. (In Chinese). [Google Scholar]
- Wu, L. Risk Assessment and Disaster Assessment of Ice Flood Based on Catastrophe Theory. Master’s Thesis, Inner Mongolia Agricultural University, Hohhot, China, 2019. (In Chinese). [Google Scholar]
- Wang, T.J.; Ji, H.L.; Mou, X.Y.; Luo, H.C.; Zhang, B.S. Risk assessment of ice flood disaster in Bayan Nur of Inner Mongolia based on catastrophe theory. Water Resour. Power 2022, 40, 84–87. (In Chinese) [Google Scholar]
- Hu, Y.L. Risk Evaluation of Ice Flood Disaster of the Ningxia–Inner Mongolia Reach in the Yellow River. Master’s Thesis, Zhengzhou University, Zhengzhou, China, 2022. (In Chinese). [Google Scholar]
- Li, Z.J.; Fu, X.; Shi, L.Q.; Huang, W.F.; Li, C.J. Inversely identified natural ice thermal diffusivity by using measured vertical ice temperature profiles: Recent advancement and considerations. J. Glaciol. Geocryol. 2023, 45, 599–611. (In Chinese) [Google Scholar]
- Shamshiri, R.; Nahavandchi, H.; Joodaki, G. Seasonal variation analysis of Greenland ice mass time-series. Acta Geod. Geophys. 2018, 53, 1–14. [Google Scholar] [CrossRef]
- Bjerkås, M. Wavelet transforms and ice actions on structures. Cold Reg. Sci. Technol. 2006, 44, 159–169. [Google Scholar] [CrossRef]
- Deng, Y. Time scale variation of the Yellow River ice in the Inner Mongolia section using wavelet analysis. Appl. Mech. Mater. 2012, 220, 2184–2187. [Google Scholar] [CrossRef]
- Bai, Q.X.; Li, R.L.; Li, Z.J.; Leppäranta, M.; Arvola, L.; Li, M. Time-series analyses of water temperature and dissolved oxygen concentration in Lake Valkea-Kotinen (Finland) during ice season. Ecol. Inf. 2016, 36, 181–189. [Google Scholar] [CrossRef]
- Cheng, T.; Wang, J.; Sui, J.; Song, F.; Fu, H.; Wang, T.; Guo, X. Simulation and prediction of water temperature in a water transfer channel during winter periods using a new approach based on the wavelet noise reduction-deep learning method. J. Hydrol. Hydromech. 2024, 72, 49–63. [Google Scholar] [CrossRef]
- Yu, H.; Yu, F.J.; Liu, W.; Lin, H.; Chang, T. Information retrieve and preliminary study of reservoir ice—Surface cracks from digital photos. Water Conserv. Sci. Technol. Econ. 2010, 16, 1311–1313. (In Chinese) [Google Scholar]
- Zhang, H. Analysis of the Difference in Geometrical Characteristics Between Blasted and Natural Ice Blocks in the Yellow River. Master’s Thesis, Dalian University of Technology, Dalian, China, 2024. (In Chinese). [Google Scholar]
- Ettema, R.; Urroz, G.E. On internal friction and cohesion in unconsolidated ice rubble. Cold Reg. Sci. Technol. 1989, 16, 237–247. [Google Scholar] [CrossRef]
- Beltaos, S. River Ice Jams; Water Resources Publication: Highlands Ranch, CO, USA, 1995. [Google Scholar]
- Chen, P.P. Experimental and Numerical Simulation Study on the Hydraulic Characteristics of the Ice Jams Influenced by the Bridge Piers. Ph.D. Thesis, Hefei University of Technology, Hefei, China, 2023. (In Chinese). [Google Scholar]
- Hiçyilmaz, C.; Ulusoy, U.; Yekeler, M. Effects of the shape properties of talc and quartz particles on the wettability based separation processes. Appl. Surf. Sci. 2004, 233, 204–212. [Google Scholar] [CrossRef]
- Sun, H.; Gao, Z.; Wang, D. Equivalent rolling resistance of particle shape in stable packing of granular material. J. Water Res. Archit. Eng. 2022, 20, 26–33. (In Chinese) [Google Scholar]
- Tan, B.; Wang, T.; Wang, L.; Feng, E.M.; Lu, P.; Li, Z.J. Clustering and analyzing the pressure ridge morphology in northwestern Weddell Sea of Antarctic via an improved k-means clustering algorithm. Pac. J. Optim. 2016, 12, 623–633. [Google Scholar]
- Li, J.X.; Wang, C.M.; Wang, G.C. Landslide risk assessment based on combination weighting-unascertained measure theory. Rock Soil Mech. 2013, 34, 468–474. (In Chinese) [Google Scholar]
Disclaimer/Publisher’s Note: The statements, opinions and data contained in all publications are solely those of the individual author(s) and contributor(s) and not of MDPI and/or the editor(s). MDPI and/or the editor(s) disclaim responsibility for any injury to people or property resulting from any ideas, methods, instructions or products referred to in the content. |
© 2025 by the authors. Licensee MDPI, Basel, Switzerland. This article is an open access article distributed under the terms and conditions of the Creative Commons Attribution (CC BY) license (https://creativecommons.org/licenses/by/4.0/).