Abstract
Water ecological security is one of the key directions of current environmental protection. With the acceleration of urbanization and industrialization, the Shanghai region of the Yangtze River Basin faces various aquatic ecological issues, such as eutrophication and declining benthic biodiversity. Dissolved oxygen (DO), as a critical indicator for measuring water self-purification capacity and ecological health status, has been widely applied in water quality monitoring and early warning systems. Therefore, accurate prediction of dissolved oxygen concentration is of significant importance for the ecological and environmental protection of river basins. This study introduces a hybrid prediction model combining Variational Mode Decomposition (VMD), Improved Fruit Fly Optimization Algorithm (IFOA), and Attention-based Gated Recurrent Unit (Attention-GRU). The model first decomposes preprocessed dissolved oxygen data through VMD to extract multiple intrinsic mode functions, reducing non-stationarity and high-frequency noise interference. It then utilizes the Improved Fruit Fly Optimization Algorithm to adaptively optimize key parameters of the Attention-GRU network, enhancing the model’s fitting capability. Experiments demonstrate that the VMD-IFOA-Attention-GRU model achieves 0.286, 0.302, and 0.915 for Mean Absolute Error (MAE), Root Mean Square Error (RMSE), and coefficient of determination (R2), respectively, significantly outperforming other comparative models. The results indicate that this method can provide a reference for intelligent water quality prediction in typical regions such as the Yangtze River Basin.
1. Introduction
The accelerating development of urbanization and industrialization has significantly impacted water environment quality, particularly through issues such as excessive nitrogen and phosphorus nutrients, frequent black and odorous water bodies, and habitat destruction, which gradually intensify and seriously threaten basin ecological security. As one of the most important sections of the Yangtze River Basin, the Shanghai section bears significant management and protection responsibilities for ecological environmental quality while supporting economic and social development. Efficient and accurate modeling and prediction of regional basin water quality changes have become important tools for water resource regulation and pollution control.
Among various water quality indicators, dissolved oxygen is considered one of the most representative and critical indicators because it reflects water self-purification capacity and the survival status of aquatic organisms. Changes in DO are influenced by multiple factors such as temperature, pH, total nitrogen, and total phosphorus, exhibiting strong non-linear and non-stationary characteristics. High-precision prediction of DO not only helps environmental management departments implement scientific regulation but also provides a data foundation for decision support in basin ecological compensation and for early warning regarding pollution sources.
Among various water quality indicators, dissolved oxygen is regarded as one of the most representative and critical indicators, as it reflects water self-purification capacity and the survival status of aquatic organisms [1,2]. Traditional machine learning methods [3,4,5,6,7,8,9,10] exhibit limitations in predicting DO when complex functions are involved. These methods typically assume that the relationships in the data are linear, making it difficult to capture the complex, non-linear relationships between dissolved oxygen and environmental factors. Furthermore, machine learning methods are highly sensitive to noise and outliers, which can lead to instability in the prediction results. Deep learning, however, possesses robust data learning and generalization capabilities, enabling efficient approximation of high-dimensional functions and extraction of hidden information within the data [11]. Within deep learning models, recurrent neural networks (RNNs) [12] demonstrate significant efficacy in the prediction of parameters within time series analysis. Long Short-Term Memory networks (LSTMs) [13] and Gated Recurrent Units (GRUs) [14], through the introduction of gating mechanisms, significantly enhance the ability to process long sequential data. Cao et al. [15] proposed a DO prediction model for pond aquaculture based on K-means clustering and a GRU network. Whereas this model improved prediction accuracy, it still suffers from the vanishing gradient problem inherent to GRU structures and is less effective when handling large-scale datasets. To further address the vanishing gradient problem, researchers have integrated neural network models with attention mechanisms. Qin et al. [16] proposed a dual-stage attention-based recurrent neural network (DA-RNN) that employs temporal and feature attention layers to dynamically emphasize crucial patterns, substantially improving long-term dependency modeling capabilities. Yang et al. [17] proposed a hybrid model integrating Convolutional Neural Networks with Long Short-Term Memory networks (CNN-LSTM). This model utilizes convolutional layers to extract key features and employs an attention mechanism to weight time series features, thereby enhancing prediction accuracy. In addition, in recent years, the attention mechanism has been widely applied in multiple fields, such as air pollution prediction and water quality prediction [18,19,20,21], demonstrating excellent time series modeling capabilities and cross-domain adaptability.
However, the predictive performance of neural network models is also influenced by parameter settings. Currently, the selection of model parameters typically relies on researchers’ experience and iterative debugging, which consumes significant computational and human resources. To address this issue, intelligent optimization is gradually being introduced into hyperparameter configurations. By continuously iterating to search for the optimal parameters, the problems of low prediction accuracy and time-consuming parameter tuning caused by empirical parameter selection are avoided. The Fruit Fly Optimization Algorithm (FOA) is widely used due to its fast convergence speed and high efficiency [22,23,24]. In [25], improves the stability and prediction accuracy of the BP neural network by enhancing the fruit fly optimization algorithm. In addition, water quality data prediction also faces the problem of data non-stationarity and vulnerability to exogenous variables. To address this, experts have introduced signal decomposition to reduce data fluctuation and non-stationarity. Refs. [26,27] combined data decomposition techniques with neural network models, using Empirical Mode Decomposition (EMD) and Ensemble Empirical Mode Decomposition (EEMD), respectively, to decompose water quality data before inputting it into models for prediction, achieving relatively good prediction results. However, the EMD algorithm itself lacks a rigorous theoretical foundation and may encounter endpoint effects and mode mixing problems during decomposition; additionally, the EEMD algorithm, although overcoming the mode mixing problem to a certain extent, has not completely eliminated it, and also has issues such as slow parallel processing speed and overfitting noise [28]. Variational Mode Decomposition (VMD) can decompose complex, non-stationary sequences into multiple relatively stationary modal components while effectively avoiding the mode mixing problem [29], overcoming the shortcomings of EMD and EEMD.
In summary, this study introduces a hybrid predictive model integrating Variational Mode Decomposition (VMD), an Improved Fruit Fly Optimization Algorithm (IFOA), and an Attention-based Gated Recurrent Unit (Attention-GRU) neural network. The VMD method decomposes data into sub-modal components with finite bandwidths. The IFOA-Attention-GRU model is then applied to each component for prediction, and the final prediction results are obtained by superimposing the predicted values of each component. Experimental results show that this model can accurately predict dissolved oxygen in the Shanghai region of the Yangtze River Basin, providing an important reference for environmental monitoring in this region.
2. Materials and Methods
2.1. Attention-GRU Network Model
Compared with traditional GRU networks, the Attention-GRU network [30] introduces an attention mechanism, achieving adaptive weighted processing of input sequences, enabling the model to precisely identify and focus on key environmental factors affecting dissolved oxygen. Through a dynamic weight allocation mechanism, it effectively overcomes the limitations of traditional models in processing time series data. Especially in basin environments where dissolved oxygen concentrations are influenced by multiple factors, this network can optimize weights according to the actual contribution of each factor, thereby more accurately predicting the dynamic variation patterns of dissolved oxygen. Its structure is shown in Figure 1.
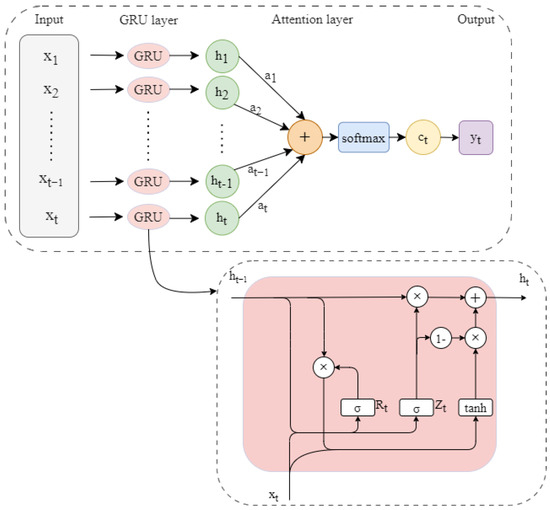
Figure 1.
Attention-GRU model.
The network workflow is as follows:
Initially, the input at the current time step is combined with the hidden state from the preceding time step. This combination undergoes a linear transformation and the application of a tanh activation function to produce an intermediate variable .
Subsequently, the intermediate variable is multiplied by the weight vector w and normalized via the softmax function, yielding the attention weight vector for the current time step:
The attention weight vector is multiplied by the input vector , yielding the weighted input vector :
In this formulation, S denotes the length of the input sequence.
Finally, the weighted input vector and the hidden state from the preceding time step , are inputted into the GRU layer. The GRU, through its gating mechanisms, manages the flow of information across time steps, thereby updating the hidden state
and denote the update gate and reset gate, respectively, , and represent the weight matrices for the input , while , and denote the weight matrices for the hidden state. Finally, , and correspond to the bias vectors.
2.2. Variational Mode Decomposition (VMD)
Variational Mode Decomposition (VMD) represents an effective methodology for time series signal processing, enabling the decomposition of a raw time series signal into a series of intrinsic mode functions (IMFs), each characterized by finite bandwidths and distinct center frequencies. This decomposition facilitates the extraction of underlying periodic characteristics within the data, thereby simplifying the signal’s complexity and mitigating non-stationarity inherent in the time series. The process is outlined as follows:
(1) Variational Problem Formulation
Following VMD, the initial signal undergoes decomposition into K constituent subsequences. Each of these subsequences is defined by a unique center frequency and a finite bandwidth. The primary objective is to minimize the bandwidth associated with each individual mode. The constraint expression is defined as:
The constraints are defined:
where is the function of each mode; is the center frequency of each mode; is the Dirac function; is the convolution operation; and is the original signal.
(2) Transformation into an unconstrained optimization problem
Introducing the augmented Lagrange function, the constrained problem is transformed into an unconstrained optimization problem with the following optimization expression:
where is the penalty parameter; λ is the Lagrange multiplier.
(3) Solve the center frequency and the components.
Combining the alternating direction multiplier method and Parseval theorem, Fourier transform, the center frequency and modal components can be solved by the following iterative steps to solve the saddle point of the Lagrange function and obtain the optimal solution. The specific iterative formula is:
Modal Component Update Equation:
Center frequency update formula:
Lagrange multiplier update formula:
where is the noise tolerance, , and , are the Fourier transforms of , , , , respectively.
2.3. Adaptive Mesh Division Optimization Fruit Fly Algorithm (IFOA)
The fruit fly algorithm has few parameters and high computational efficiency, but its fixed search span makes it prone to local optima and slow convergence, affecting the precision of the final optimization. Therefore, this paper proposes an Improved Fruit Fly Optimization Algorithm based on adaptive grid partitioning, which dynamically adjusts the grid size to achieve fine-grained search in high-fitness areas. Compared with traditional optimization algorithms, IFOA can rapidly explore globally in the early stage and conduct fine local searches in the later stage, effectively avoiding premature convergence issues, providing the Attention-GRU network with optimal parameter combinations, and enhancing the prediction accuracy of the model.
The adaptive grid partitioning formula is as follows:
where denotes the grid size at the i-th iteration, is the attenuation coefficient, and is the fitness function of Drosophila at position in the t-th iteration. When the fitness value of a region is high, the grid of that region is divided more finely. The specific steps are as follows:
- (1)
- Set the number of fruit flies N, the maximum grid size , and the scent source concentration constant D. The position of each fruit fly is denoted as , and the judgment value of the odor concentration is , where .
- (2)
- Adaptive gridding of the search space is performed, setting each grid as a possible solution. The odor concentration judgment value is calculated by the following equation:
- (3)
- Dynamically adjust the grid size according to the fitness value of the optimal solution;
- (4)
- Continue searching and adjusting the grid size in the new grid, which is satisfied if the average change in the location of the optimal solution is less than a set threshold value ϵ in Y consecutive iterations:
Then the algorithm determines convergence and stops the search. denotes the location of the global optimal solution at the t-th iteration;
- (5)
- Repeat steps 2 and 3 until the search stops when the location of the global optimal solution does not change in Y consecutive iterations.
- (6)
- When the algorithm terminates, the optimal solutions in all grids are compared, and the solution with the highest fitness value is selected as the global optimal solution. The optimized Drosophila position update formula is as follows:
2.4. VMD-IFOA-Attention-GRU Model
To enhance the model’s predictive accuracy on complex, high-frequency, and non-linear feature data, this study combines the Variable Modal Decomposition (VMD) technique with the Improved Fruit Fly Optimization Algorithm (IFOA) and the Attention-GRU model, and proposes a new model: VMD-IFOA-Attention-GRU. The procedure is as follows:
First, the VMD decomposes the original data into n subsequences, each of which contains different frequency components to help extract potential periodic and dynamic change features. The decomposition expression is:
is the i-th subsequence obtained from the VMD decomposition, and these subsequences superimposed can approximately describe the trend of the original sequence ; is the remaining trend term.
Each decomposed subsequence is input into the Attention-GRU model separately for training, and the parameters in Attention-GRU, including the sample batch, the number of hidden layers, the learning rate, etc., are optimized using the Improved Fruit Fly Optimization Algorithm (IFOA), to ensure that the model can fully capture the features of each subsequence.
The final prediction results are derived by aggregating all subsequence forecasting outputs. The structure of the VMD-IFOA-Attention-GRU network is shown in Figure 2.
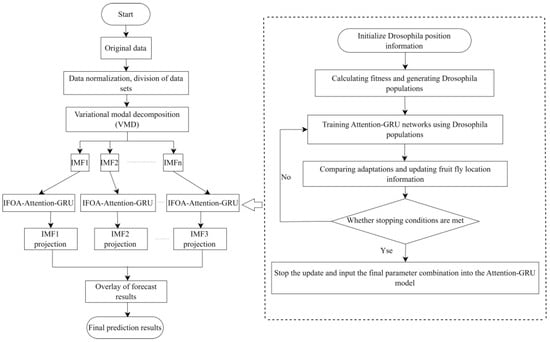
Figure 2.
VMD-IFOA-Attention-GRU algorithm flowchart.
3. Case Study
3.1. Data Source
The data for this study come from three typical cross-sections in the Shanghai region of the Yangtze River Basin, published by the Environmental Professional Knowledge Service System of the Chinese Research Academy of Environmental Sciences (http://www.cnemc.cn/, accessed on 1 April 2025), labeled as Site 1, Site 2, and Site 3. These cross-sections represent different water quality dynamic characteristics, with certain spatial representativeness, effectively reflecting the internal water quality dynamic differences within the basin. The data collection frequency is once every 4 h, showing good temporal continuity and representativeness.
The monitoring data includes nine water quality indicators: dissolved oxygen content (DO), water temperature (T), pH value (pH), conductivity (Cond), turbidity (NTU), potassium permanganate index (KMnO4), ammonia nitrogen content (NH3-N), total phosphorus content (TP), and total nitrogen content (TN).
3.2. Data Preprocessing
Data preprocessing was implemented to address data gaps and anomalies encountered during data acquisition. Specifically, linear interpolation was employed to impute missing values and rectify outliers. The computational formulation for linear interpolation is defined as:
where represents the imputed value at time t; denotes the data point at time j, which precedes and is a known value; and signifies the data point at time i, succeeding and also representing a known value.
The data underwent normalization, employing Equation (17) to map the model’s input parameters to the [0,1] interval. This procedure was implemented to enhance the convergence rate and predictive accuracy of the model.
denotes the normalized value, represents the sample data, signifies the maximum value within the sample data, and represents the minimum value of the sample data.
3.3. Determining the Environmental Factors Affecting DO
Since DO concentration in natural water bodies is influenced by multiple environmental factors, feature variables need to be reasonably screened before modeling to improve model prediction efficiency and reduce redundant input interference. This study used the Maximal Information Coefficient (MIC) to detect the non-linear correlation strength between DO and various water quality parameters and calculated the significance (p-value) of each correlation through permutation tests, as shown in Table 1.

Table 1.
Significance analysis of Maximum Information Coefficient (MIC) for water quality parameters.
Compared with traditional correlation indicators, MIC does not rely on functional relationship assumptions between variables and can automatically capture any form of dependency pattern. In water quality data with obvious non-linear and multi-source interference characteristics, MIC can more truly reflect the potential impact of factors on DO variation trends. The MIC results show that there is an obvious non-linear relationship between DO and other water quality factors.
When selecting feature variables, a random forest regression model was introduced to evaluate the importance of each water quality parameter, cross-validated with MIC assessment results, and finally, five indicators—pH, temperature, NH3-N, TP, and TN—were selected as input features to construct the prediction model, as shown in Figure 3.
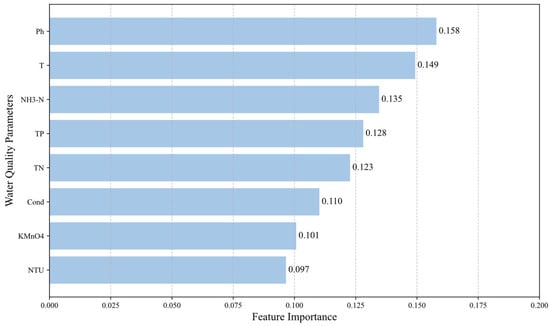
Figure 3.
Random forest feature importance for dissolved oxygen prediction. MIC > 0.5 indicates a strong non-linear correlation between variables; p < 0.05 signifies a statistically significant correlation within the dataset.
4. Results
4.1. Model Performance Evaluation Indexes
To comprehensively assess the predictive performance and generalization capabilities of the model, we employed Mean Absolute Error (MAE), Root Mean Square Error (RMSE), and the coefficient of determination (R2) as evaluation metrics. Lower values of RMSE and MAE, coupled with a higher R2 value, indicate superior model accuracy.
is the number of samples, represents the original data, is the predicted value, and is the mean of the true value.
4.2. Analysis of VMD Results
Before the VMD decomposition, the decomposition modulus number k needs to be determined, and its value directly affects the accuracy of the decomposition. In this paper, the center frequency observation method is used to evaluate the effect of different k values on the decomposition effect, and the value of k is gradually increased from k = 2, and the distribution characteristics of the center frequency are analyzed, as shown in Table 2. When k is increased to 6, the center frequency of the last modal component is always stable at about 0.484. If the value of k continues to increase, it is easy to generate additional noise components. Therefore, it can be determined that the optimal value of the decomposition modal number k in this paper is 6. The VMD decomposition results are shown in Figure 4.
Table 2.
Center frequencies corresponding to different modal numbers.
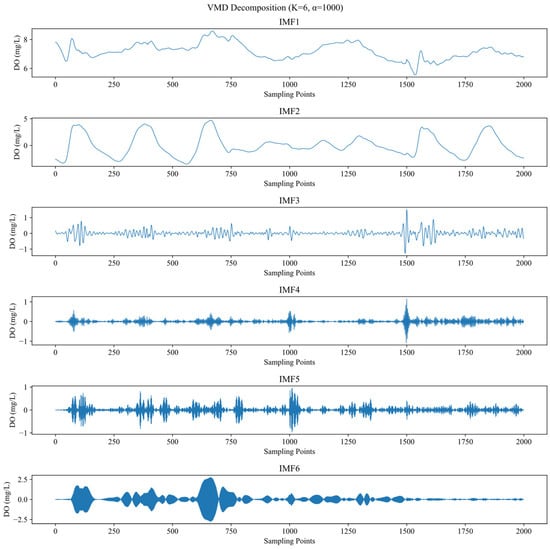
Figure 4.
Results of VMD decomposition.
The low-frequency component IMF1 reflects the overall trend of the original sequence over time; the mid-frequency components IMF2 to IMF5 contain the detailed information of the original sequence, demonstrating VMD’s capability in multi-scale feature extraction; the high-frequency component IMF6 has a higher fluctuation frequency, showing the most significant improvement in fitting effect for DO abnormal fluctuation segments. By separating multi-frequency signals through VMD, the model can focus on modeling relatively stable variation patterns within each frequency band, thereby significantly improving prediction accuracy.
4.3. Comparative Analysis of Different Models
To validate the enhanced efficacy of the proposed model within this study, it was compared with the following models, and the fitting results of each model are shown in Table 3 and Figure 5.
Table 3.
Performance evaluation of different models.
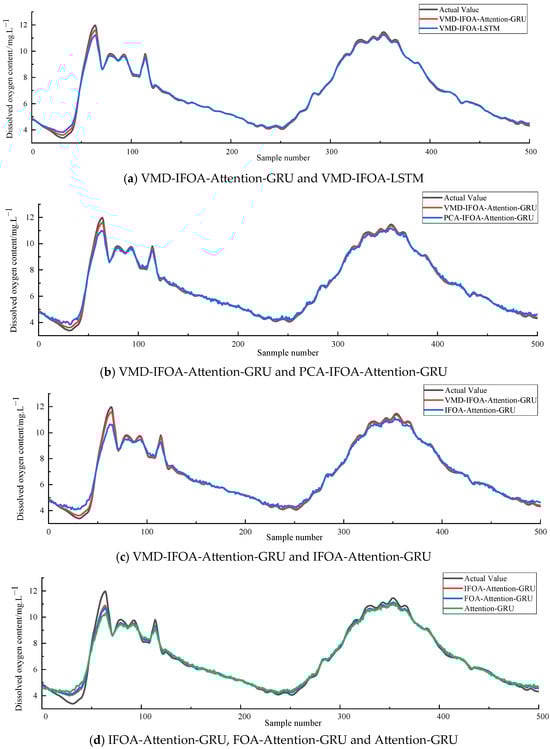
Figure 5.
Comparison of the predictive values of mass concentration of dissolved oxygen in six.
From the comparative experiment group (a), it can be observed that compared to the VMD-IFOA-LSTM model, the VMD-IFOA-Attention-GRU model shows a higher degree of alignment between the prediction curve and the measured curve. Not only is the overall trend well-aligned, but even in areas of intense short-term fluctuations, such as sudden increases or rapid decreases in DO levels, the model can still provide relatively accurate responses, demonstrating strong capability in capturing fluctuations.
In groups (b) and (c), the prediction curves of PCA-IFOA-Attention-GRU and IFOA-Attention-GRU models are relatively smooth, with poor fitting capability in peak and valley regions, easily resulting in underestimation or delayed response phenomena. In contrast, after introducing VMD, our proposed model accurately extracts the fluctuation trend information of the data, preserves key variation characteristics, and thus achieves superior fitting precision even during dramatic data fluctuations.
In group (d), the comparison among IFOA-Attention-GRU, FOA-Attention-GRU, and Attention-GRU indicates that although traditional FOA possesses certain parameter optimization capabilities, its convergence stability and result accuracy are inferior to the optimized IFOA. The improved IFOA enhances local search precision through an adaptive grid partitioning strategy, resulting in more optimal model parameter combinations, ultimately achieving significant improvements in three evaluation metrics: MAE, RMSE, and R2.
In summary, the integration of VMD for the decomposition of preprocessed dissolved oxygen data, coupled with the optimization of base model hyperparameters via an IFOA, demonstrably enhances model performance and elevates predictive accuracy.
4.4. Analysis of Ablation Experiments
In order to assess the independent and joint contributions of the VMD and the IFOA to the model performance, the following ablation experiments were designed in this study. Table 4 shows the role of each model in the ablation experiments.
Table 4.
Ablation experiment design.
As shown in Table 5, the individual introduction of either VMD or IFOA can improve prediction accuracy to some extent. However, the improvement becomes more significant when both VMD and IFOA modules are integrated. VMD transforms the complex and non-stationary DO time series into simpler and more stationary components, which capture the intrinsic variation characteristics of the data. These decomposed components provide a clearer signal structure for IFOA to perform optimization, enabling it to find the optimal hyperparameter combination for the Attention-GRU model. As a result, the MAE and RMSE are reduced by 47.7% and 57.5%, respectively, while the R2 increases by 27.8%. These findings indicate that the combined application of VMD and IFOA significantly enhances the model’s prediction accuracy and overall performance.
Table 5.
Comparison of prediction performance in ablation experiments.
In addition, according to Figure 6, after adding only the VMD or IFOA module, the model predictions were significantly weaker and more data points deviated from the 45° fit line; with the introduction of both VMD and IFOA (VMD-IFOA-Attention-GRU), the model performance was significantly enhanced. The distribution of data points is more centralized, the dispersion is significantly reduced, and the fit to the 45° fitting line is significantly improved.
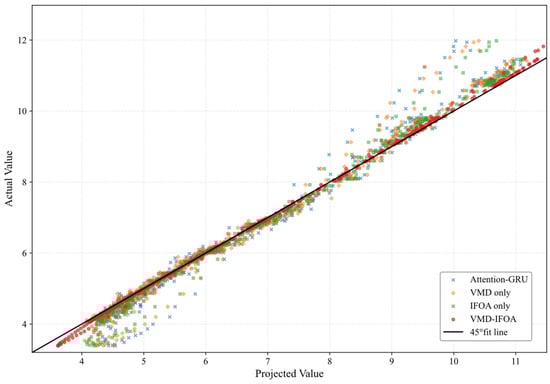
Figure 6.
Results of ablation experiments.
In summary, it can be seen that the introduction of the VMD module and the IFOA module plays an important role in improving the prediction accuracy of the model, and when they are used in combination, the prediction accuracy of the model can be further improved. The VMD reduces the interference of noise on the prediction by improving the smoothness of the data, whereas the IFOA improves the model’s fitting ability through adaptive parameter optimization. The experimental results show that the joint use of VMD and IFOA not only significantly improves the prediction accuracy but also enhances the robustness and generalization ability of the model under complex data conditions.
5. Conclusions
The VMD-IFOA-Attention-GRU hybrid model proposed in this study aims to improve the accuracy of dissolved oxygen prediction in the Shanghai section of the Yangtze River. By decomposing the original dissolved oxygen data through VMD, highly characteristic and relatively stable intrinsic mode functions are obtained, which facilitates subsequent prediction models to fully explore the fluctuation trends and detailed features of data during short-term oscillation processes, significantly enhancing the accuracy of dissolved oxygen prediction.
Experiments demonstrate that this model outperforms various comparative models in terms of Mean Absolute Error (MAE), Root Mean Square Error (RMSE), and coefficient of determination (R2), exhibiting excellent prediction accuracy, extreme value response capability, and generalization performance. Ablation experiments further indicate that VMD and IFOA modules have a significant synergistic effect in improving model performance.
The VMD-IFOA-Attention-GRU framework constructed in this study is not only applicable to dissolved oxygen prediction tasks, but its structural advantages and modeling approach can also be extended to the prediction of other important water quality indicators, showing wide adaptability, especially in complex time series data modeling tasks with strong noise disturbances and short-term non-linear mutation characteristics.
To further enhance the application scope of the model, future work could focus on deeply integrating this model with existing environmental monitoring platforms or decision support systems, exploring its application potential in multi-site collaborative prediction, heterogeneous water body adaptation, and real-time warning scenarios, thereby further improving the model’s engineering practicality and environmental governance support value.
Author Contributions
Conceptualization, Z.Z.; methodology, Z.Z.; software, Z.Z.; validation, Z.Z. and S.C.; formal analysis, Z.Z. and S.C.; investigation, Z.Z.; resources, S.C.; data curation, Z.Z.; writing—original draft preparation, Z.Z.; writing—review and editing, S.C.; visualization, Z.Z. and S.C. All authors have read and agreed to the published version of the manuscript.
Funding
This research was funded by the Shanghai Municipal Agricultural and Rural Committee through the Shanghai Agricultural Science and Technology Innovation Project (Grant No. I2023006); the Shanghai Collaborative Innovation Center for Breeding and Green Farming of Aquatic Animals (Grant No. A1-3605-21-0002); and the Shanghai Chongming District Agricultural and Rural Committee through the Shanghai Chongming District Agricultural Science and Technology Innovation Project (Grant No. 2021CNKC-05-06).
Data Availability Statement
The data were obtained from the real-time public data of the General Environmental Monitoring Station of China (http://www.cnemc.cn/, accessed on 1 April 2025).
Conflicts of Interest
The authors declare no conflicts of interest.
References
- Wu, Y.; Sun, L.; Sun, X.; Wang, B. A hybrid XGBoost-ISSA-LSTM model for accurate short-term and long-term dissolved oxygen prediction in ponds. Environ. Sci. Pollut. Res. 2022, 29, 18142–18159. [Google Scholar] [CrossRef] [PubMed]
- Guan, Z.Y.; Wang, S.; Zhang, S.S.; Xu, Y.; Ma, J.; Liu, D.F. Impact of stratification in different midstream reservoirs on vertical distribution of dissolved oxygen in Lancang River. J. China Three Gorges Univ. (Nat. Sci.) 2020, 42, 12–18. [Google Scholar]
- Alvarez Meza, A.M.; Daza Santacoloma, G.; Acosta Medina, C.D.; Castellanos Dominguez, G. Parameter selection in least squares-support vector machines regression oriented, using generalized cross-validation. Dyna 2012, 79, 23–30. [Google Scholar]
- Wu, H.Y.; Yang, R.J.; Zhang, Y.; Meng, Y.H. PCA-SVR-based prediction model for dissolved oxygen in ponds. J. Anhui Univ. (Nat. Sci. Ed.) 2016, 40, 103–108. [Google Scholar]
- Amid, S.; Mesri Gundoshmian, T. Prediction of output energies for broiler production using linear regression, ANN (MLP, RBF), and ANFIS models. Environ. Prog. Sustain. Energy 2017, 36, 577–585. [Google Scholar] [CrossRef]
- Liu, D.J.; Zou, Z.H. Application of optimal weighted combined forecasting method in water quality prediction. Acta Sci. Circumstantiae 2012, 32, 3128–3132. [Google Scholar]
- Liu, S.Y.; Xu, L.Q.; Li, Z.B.; Li, D.L. Prediction model for aquaculture water pH based on PCA-MCAFA-LSSVM. Trans. Chin. Soc. Agric. Mach. 2014, 45, 239–246. [Google Scholar]
- Yu, H.; Chen, Y.; Hassan, S.; Li, D. Dissolved oxygen content prediction in crab culture using a hybrid intelligent method. Sci. Rep. 2016, 6, 27292. [Google Scholar] [CrossRef]
- Sun, B.Y.; Dong, G.Q.; Zhang, R. Application of support vector machines in predicting chemical oxygen demand of source water. J. Environ. Health 2016, 33, 544–547. [Google Scholar]
- Liu, S.Y.; Xu, L.Q.; Li, D.L.; Zeng, L.H. A dissolved oxygen prediction model for crab aquaculture based on ant colony optimization and least squares support vector regression. Trans. Chin. Soc. Agric. Eng. 2012, 28, 167–175. [Google Scholar]
- Benuwa, B.B.; Zhan, Y.Z.; Ghansah, B.; Wornyo, D.K.; Banaseka Kataka, F. A review of deep machine learning. Int. J. Eng. Res. Afr. 2016, 24, 124–136. [Google Scholar] [CrossRef]
- Sherstinsky, A. Fundamentals of recurrent neural network (RNN) and long short-term memory (LSTM) network. Phys. D Nonlinear Phenom. 2020, 404, 132306. [Google Scholar] [CrossRef]
- Yu, Y.; Si, X.; Hu, C.; Zhang, J. A review of recurrent neural networks: LSTM cells and network architectures. Neural Comput. 2019, 31, 1235–1270. [Google Scholar] [CrossRef] [PubMed]
- Chung, J.; Gulcehre, C.; Cho, K.; Bengio, Y. Empirical evaluation of gated recurrent neural networks on sequence modeling. arXiv 2014, arXiv:1412.3555. [Google Scholar]
- Cao, X.; Liu, Y.; Wang, J.; Liu, C.; Duan, Q. Prediction of dissolved oxygen in pond culture water based on K-means clustering and gated recurrent unit neural network. Aquac. Eng. 2020, 91, 102122. [Google Scholar] [CrossRef]
- Qin, Y.; Song, D.; Chen, H.; Cheng, W.; Jiang, G.; Cottrell, G. A dual-stage attention-based recurrent neural network for time series prediction. arXiv 2017, arXiv:1704.02971. [Google Scholar]
- Yang, Y.; Xiong, Q.; Wu, C.; Zou, Q.; Yu, Y.; Yi, H.; Gao, M. A study on water quality prediction by a hybrid CNN-LSTM model with attention mechanism. Environ. Sci. Pollut. Res. 2021, 28, 55129–55139. [Google Scholar] [CrossRef]
- Zhu, Z.; Tang, C. Multi-site PM2.5 concentration prediction method based on GCN-GRU-Attention. J. Hubei Minzu Univ. 2025, 43, 67–72+85. [Google Scholar]
- Zhang, S.; Zuo, Q.; Zang, C.; Zhang, L.; Ba, Y. Runoff simulation and multi-scenario prediction in the Qinhe River Basin based on CNN-LSTM-Attention model. J. Water Resour. Water Eng. 2024, 35, 73–81. [Google Scholar]
- Chen, H.; Yang, J.; Fu, X.; Zheng, Q.; Song, X.; Fu, Z.; Wang, J.; Liang, Y.; Yin, H.; Liu, Z. Water quality prediction based on LSTM and attention mechanism: A case study of the Burnett River. Aust. Sustain. 2022, 14, 13231. [Google Scholar] [CrossRef]
- Chen, Z.; Li, X. Water quality prediction model of the Pearl River Estuary optimized by attention mechanism and BiLSTM. Environ. Sci. 2024, 45, 3205–3213. [Google Scholar]
- Gu, Q.; Chang, Y.; Li, X.; Chang, Z.; Feng, Z. A novel F-SVM based on FOA for improving SVM performance. Expert Syst. Appl. 2021, 165, 113713. [Google Scholar] [CrossRef]
- Niu, D.; Liang, Y.; Hong, W.-C. Wind speed forecasting based on EMD and GRNN optimized by FOA. Energies 2017, 10, 2001. [Google Scholar] [CrossRef]
- Tang, H.; Sun, W.; Yu, H.; Lin, A.; Xue, M.; Song, Y. A novel hybrid algorithm based on PSO and FOA for target searching in unknown environments. Appl. Intell. 2019, 49, 2603–2622. [Google Scholar] [CrossRef]
- Li, Z.; Qin, Y.; Hou, S.; Zhang, R.; Sun, H. Renewable energy system based on IFOA-BP neural network load forecast. Energy Rep. 2020, 6, 1585–1590. [Google Scholar] [CrossRef]
- Liu, S.; Xu, L.; Li, D. Multi-scale prediction of water temperature using empirical mode decomposition with back-propagation neural networks. Comput. Electr. Eng. 2016, 49, 1–8. [Google Scholar] [CrossRef]
- Yu, C.; Li, Y.; Bai, Y. Dissolved oxygen prediction based on ensemble empirical mode decomposition and support vector machine. Environ. Monit. Manag. Technol. 2018, 30, 27–31. [Google Scholar]
- Wang, Z.; Wang, Q.; Wu, T. A novel hybrid model for water quality prediction based on VMD and IGOA optimized for LSTM. Front. Environ. Sci. Eng. 2023, 17, 88. [Google Scholar] [CrossRef]
- Song, C.; Yao, L.; Hua, C.; Ni, Q. A water quality prediction model based on variational mode decomposition and the least squares support vector machine optimized by the sparrow search algorithm (VMD-SSA-LSSVM) of the Yangtze River, China. Environ. Monit. Assess. 2021, 193, 363. [Google Scholar] [CrossRef]
- Shu, X.; Zhang, L.; Qi, G.-J.; Liu, W.; Tang, J. Spatiotemporal co-attention recurrent neural networks for human-skeleton motion prediction. IEEE Trans. Pattern Anal. Mach. Intell. 2021, 44, 3300–3315. [Google Scholar] [CrossRef]
Disclaimer/Publisher’s Note: The statements, opinions and data contained in all publications are solely those of the individual author(s) and contributor(s) and not of MDPI and/or the editor(s). MDPI and/or the editor(s) disclaim responsibility for any injury to people or property resulting from any ideas, methods, instructions or products referred to in the content. |
© 2025 by the authors. Licensee MDPI, Basel, Switzerland. This article is an open access article distributed under the terms and conditions of the Creative Commons Attribution (CC BY) license (https://creativecommons.org/licenses/by/4.0/).