Article

Study on the Complex Erosion Characteristics and Specific Influencing Factor Mechanism in a Francis Hydraulic Turbine

1
Power Station Management Bureau, Y.R.WanjiazhaiWater Multi-Purpose Dam Project Co., Ltd., Xinzhou 036412, China
2
Department of Energy and Power Engineering, Tsinghua University, Beijing 100084, China
3
College of Hydraulic Science and Engineering, Yangzhou University, Yangzhou 225000, China
4
Safety Supervision Department, Power Station Management Bureau, Y.R.Wanjiazhai Water Multi-Purpose Dam Project Co., Ltd., Xinzhou 030000, China
*
Author to whom correspondence should be addressed.
Water 2025, 17(8), 1234; https://doi.org/10.3390/w17081234
Submission received: 24 February 2025 / Revised: 17 April 2025 / Accepted: 19 April 2025 / Published: 21 April 2025
(This article belongs to the Special Issue Hydrodynamic Science Experiments and Simulations)

Abstract

:
Sediment erosion of hydraulic turbines has gradually become a key factor affecting their long-term stable operation. There are many different factors that can cause erosion in the Francis hydraulic turbine; among them, the vortex occurs in the turbine, which is also a negative factor for the unit. In this paper, the purpose is to study the complex erosion characteristics and specific influencing factor mechanism. The method is based on numerical simulation, combined with the verification data on site. Research results show that the differences in flow patterns among various components correspond to the erosion distribution of the unit at the same location, indicating that local flow patterns affect the unit’s erosion. The highest total erosion rate is on the surface of the runner at 1.08 × 10⁻³ kg·s−1·m−2. The erosion rate on the guide vane wall is second highest, also at 9.8 × 10⁻⁴ kg·s−1·m−2. The total erosion rate in the clearance is lower than that on the guide vane wall at 7.03 × 10⁻⁴ kg·s−1·m−2. The lowest total erosion rate is found in the draft tube at 2.57 × 10⁻⁴ kg·s−1·m−2. The effect of local vortices not only exacerbate the microscopic damage on the blade surface but also leads to a more obvious nonuniform erosion distribution, especially at the clearance, where erosion is more severe. The vortex in the guide vane passage alters the particle trajectory at the guide vane outlet, increasing the erosion in the guide vane clearance. Similarly, the vortex in the draft tube increases particle rotation, enhancing erosion on the draft tube wall. Research indicates that eliminating vortices is beneficial for reducing sediment erosion within the unit. The research results provide a theoretical basis for the optimization design of Francis hydraulic turbine.

1. Introduction

The Francis hydraulic turbine is a commonly used power equipment in low and medium head hydropower stations, widely used in the field of hydropower generation [1]. With the growth of global energy demand and the continuous development of renewable energy, hydropower plays an increasingly important role in the global energy structure [2]. The Francis hydraulic turbine has become the core equipment of many hydropower stations due to its good adaptability, high efficiency, and relatively simple structure. However, during the long-term operation of hydraulic turbines [3], due to the complexity of water flow and frequent movement of mechanical components, the problem of component erosion becomes increasingly severe.
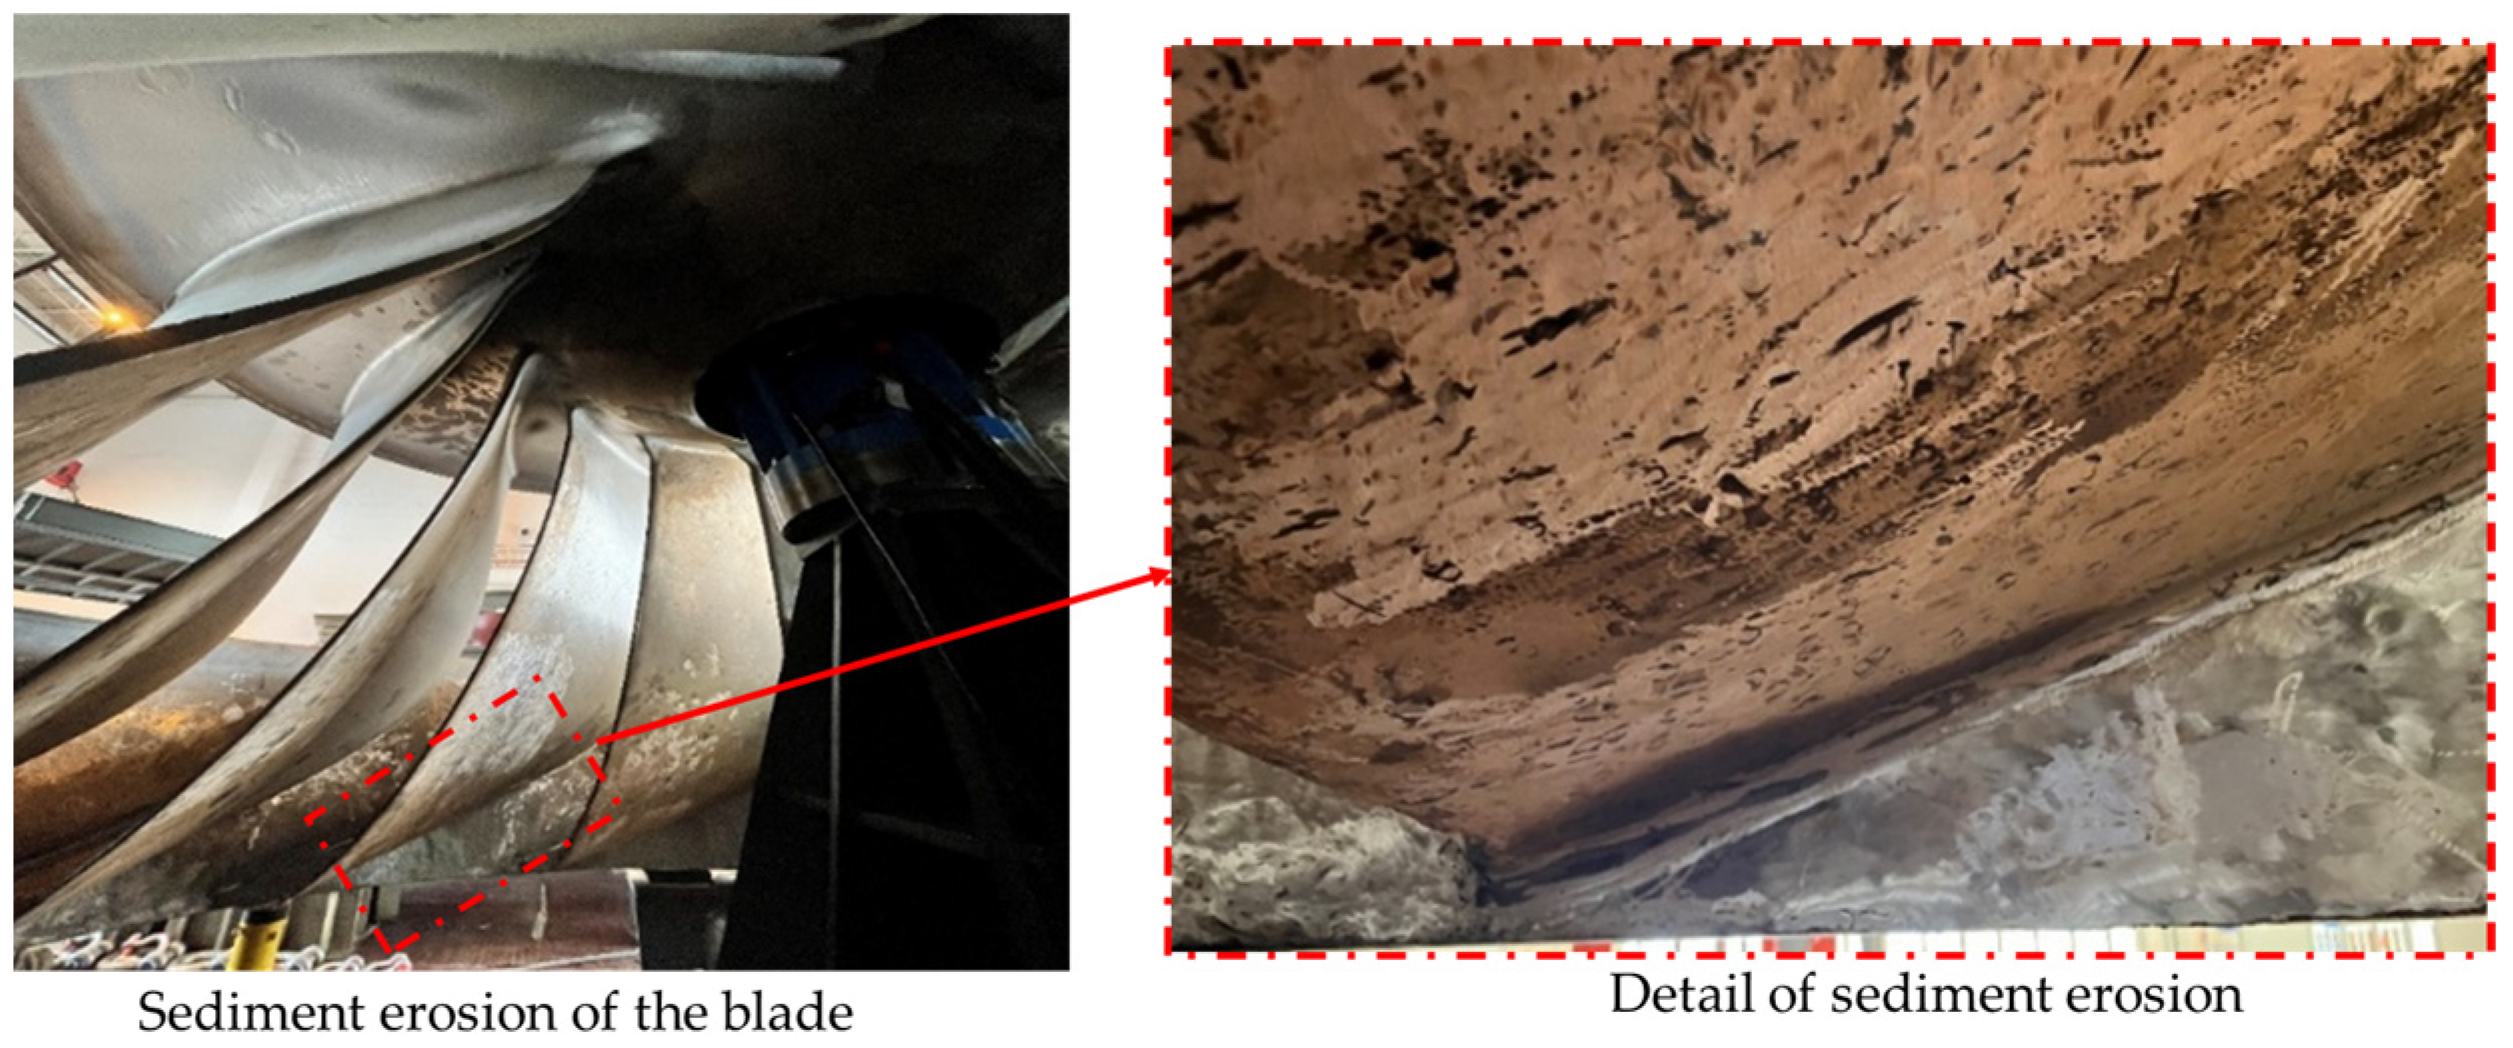
Research has shown that sediment erosion is a common form of damage during the operation of hydraulic turbines [4], especially on the surfaces of components such as blades and guide vanes. Sediment erosion is often caused by factors such as high-velocity fluid impact, friction, and material fatigue [5]. Long-term erosion can cause changes in the surface morphology of turbine blades, reduce their fluid dynamic performance, and, in severe cases, cause structural damage [6], leading to the failure and shutdown of the unit. In addition, the harm of turbine erosion is not limited to mechanical damage but may also lead to increased nonuniformity of water flow [7], thereby affecting the operational stability of the turbine. Especially under high-flow and high-velocity operating conditions, local erosion can cause flow field fluctuations and even lead to adverse interactions between fluid and solid interfaces, increasing system instability [8].
Among them, the complex vortices in the flow channel of the unit are one of the important flow characteristics [9]. The generation of vortices is often caused by factors such as uneven flow and inappropriate blade angles when the water flows through. The formation of vortices is usually accompanied by changes in flow velocity and sharp fluctuations in local pressure, resulting in more complex flow characteristics such as flow separation and reverse flow [10]. Especially in the Francis hydraulic turbine, due to the complex changes in the angle of the blades and guide vanes, the shape of the flow channel, and the velocity of the water flow, eddies occur frequently and have a certain degree of unpredictability [11]. The harm of these eddies to turbine components is not only caused by surface erosion but, in severe cases [12], they may also lead to resonance, cavitation, and blade fatigue induced by eddies, thereby exacerbating material damage. In some extreme working conditions, the intensity of local eddies can reach its limit, leading to destructive erosion or damage phenomena [13]. For designers of hydraulic turbines, accurately capturing the impact of eddy currents on components and effectively avoiding these issues during the design process has become one of the key challenges in improving turbine performance [14].
Many scholars have conducted research on turbine erosion and vortex through computational fluid dynamics (CFD) simulations. Friction [15] used CFD technology to conduct three-dimensional numerical simulations of the flow field of turbine blades and studied the influence of water flow on the blades. In addition, Ravi Koirala, Bhola [16] used the Large Eddy Simulation (LES) method to analyze the flow field characteristics of hydraulic turbines under different working conditions and obtained the regularity of vortex generation on the blade surface under high-velocity flow, providing a numerical basis for erosion prediction. Xin, L. et al. [17] proposed a hybrid model based on fluid dynamics and erosion theory for predicting the erosion of turbine blades. This model considers factors such as the corrosiveness of the fluid, the material properties of the blade surface, and the time of contact between the fluid and the blade. Han, W. [18] proposed a new erosion prediction model that combines numerical-simulation-based eddy current characteristics with physical erosion models to more accurately predict the erosion area and degree induced by eddy currents. The model obtained the erosion distribution map of water flow and blade interaction under different flow velocities and angles through numerical simulations and verified the consistency between its predicted results and experimental data.
Meanwhile, many studies have conducted extensive experimental verification work [19] in addition to numerical simulations to improve the reliability of the model. For example, Mamazhonov [20] conducted erosion tests on the surface of turbine blades and obtained erosion patterns consistent with numerical simulations. They further verified through experiments that eddy currents are an important cause of local erosion. Serrano, R.O.P. [21] conducted a three-dimensional flow field analysis of hydraulic turbine blades using CFD and obtained details of the interaction between water flow and the blade surface. By analyzing local eddies, the relationship between vortex generation and factors such as flow velocity and angle was revealed, providing theoretical support for subsequent erosion prediction. In [22], Pan, J studied the formation mechanism of surface vortices on hydraulic turbine blades based on their complex flow characteristics and analyzed the impact of vortices on erosion under different operating conditions through numerical simulations. These studies are of great significance for further optimizing the design of turbine blades.
However, despite some progress in research, the problem of localized eddy-current-induced erosion has not been completely resolved [23]. The research mainly focuses on qualitative analysis of erosion and visualization of flow fields, but there is still a lack of quantitative research on the erosion evolution process caused by eddy currents, erosion distribution, and the mechanism of eddy current action under different working conditions. In addition, there is still a lack of in-depth systematic research on the comprehensive analysis of multiple operating conditions and the interaction between vortices and erosion in complex flow fields [24]. Therefore, studying the erosion mechanism of hydraulic turbines, especially the erosion induced by local eddy currents, has become a key focus in improving the operating efficiency and extending the service life of hydraulic turbines. Based on the findings of this study, it is known that vortices have a significant impact on turbine wear, accelerating localized wear. In engineering practice, it is certain that rapid localized wear can significantly reduce the lifespan of the turbine. Therefore, it is necessary to eliminate vortices within the turbine wheel. According to the relevant literature, vortices primarily occur under non-design operating conditions. Hence, during actual operation, it is essential to ensure that the unit operates under design conditions to avoid the formation of vortices within the turbine runner, thereby preventing accelerated localized wear caused by the vortices.
This study combines computational fluid dynamics (CFD) with erosion prediction models to explore in depth the erosion mechanism induced by local eddies in Francis hydraulic turbines, providing theoretical support for the design optimization of hydraulic turbines. The research results not only contribute to improving the operational stability and economy of hydraulic turbines but also have the potential to provide new ideas and technological means for the long-term reliable operation of hydropower stations and the extension of equipment lifespan.

2. Materials and Methods

2.1. Research Object

The research object of this paper is a Francis hydraulic turbine, which is located in the Yellow River Basin and has been operating for many years with severe sediment erosion. Figure 1 on the left shows the actual distribution of wear on the entire runner, with the main wear occurring on the backside of the runner blades at the blade outlet edge, as indicated by the red markings. The detailed view on the right is an enlargement of the marked area on the left, revealing that the blade surfaces after wear output a very uneven state. Therefore, this paper focuses on studying the wear and its causes in this hydro turbine unit. The hydropower station is located on the Yellow River, with a rated operating head of 68 m and a rated output of 183.7 MW.
The specific designing parameters of the unit are shown in Table 1. The specific parameters in Table 1 reflect the operating and design parameters of the unit. The runner model data in Table 1 correspond to the design parameters of the runner shown in Figure 1.

2.2. Physical Model

A three-dimensional computational model was established, including the volute, seat ring, guide vanes, runner, clearance between the upper and lower crown cavities of the runner, and draft tube, as shown in Figure 2. The volute evenly directs water flow into the runner, ensuring uniform water velocity and pressure distribution; guide vanes adjust the flow rate and direction of water entering the runner, controlling the turbine’s output power; the runner converts the kinetic and potential energy of the water flow into mechanical energy, driving the generator to produce electricity; the discharge channel guides water out of the runner, ensuring smooth water discharge and minimizing energy loss. And different components are connected through interfaces.
And a hybrid form of structured and unstructured grids was adopted to partition the computational model into grids, as shown in Figure 3. In order to capture the flow in the guide vane clearance, a fine structured mesh needs to be drawn to generate the internal fluid domain of the clearance.
The mesh near the wall is refined, with y+ values within 30 for the blade section and within 100 for the rest. The number of meshes affects both computational accuracy and efficiency, necessitating a mesh independence analysis. As shown in Figure 4, as the number of meshes increases, the change in turbine efficiency gradually stabilizes. Considering both computational precision and cost, the total number of meshes chosen for the entire flow path is 12.8 million, with 3.6 million meshes for the runner.

2.3. Particle Motion Model

In the Lagrangian framework, when particles move in a liquid, the force acting on the particles comes from the velocity difference between the particles and the fluid [25]. The particle motion equation is:
F = FD + FB + FG + FV + FP + FX
where t is time, mp is the particle mass, up is the particle velocity, FD is resistance, FB is Basset force, FG is gravity, FV is virtual mass force, FP is pressure gradient force, and FX is the sum of other external forces considered.
In this paper, since we are considering a situation with low particle concentration in the flow field, the fluid velocity of the continuous phase is relatively high, and there is a significant density difference between the continuous and discrete phases. Therefore, forces such as virtual mass force, pressure gradient force, Basset force, Safman force, and Magnus force acting on solid particles are not taken into account.

2.4. Numerical Simulation

(1)
Erosion model
ANSYS 2022R1 CFX is used for simulation, and the particle track model is used to simulate the flow field. The erosion model used for predicting erosion is the Tabakoff erosion model [26]. This erosion model is obtained from the study of the influence of different particle velocities and impact angles on the erosion of target materials. The Tabakoff erosion model is:
E = f γ V p V 1 2 c o s 2 γ 1 ( 1 V p V 3 s i n γ ) 2 + ( V p V 2 s i n γ ) 4
f ( γ ) = [ 1 + k 1 k 12 s i n γ π / 2 γ 0 ] 2
k 1 = 1     γ 2 γ 0 0     γ > 2 γ 0
where E is the dimensionless erosion mass; k1 and k12 are model constants; VP is the particle impact velocity; γ is the impact angle; f(γ) is a dimensionless function of the impact angle; and V1, V2, and V3 are particle collision velocity parameters.
(2)
Boundary conditions
Since the hydropower station has been operating at full opening for a long time, this paper selects a large opening (18°) condition for calculation. Both the inlet and outlet use pressure boundary conditions, with the inlet having a head of 66.15 m and the outlet using a static pressure boundary determined by the downstream water depth, which is set at 10.3 m. Based on the measured data from the hydropower station, the sediment particle size used in the calculation is 0.1 mm, with a concentration of 500 mg and a density of 2650 kg/m3. The liquid phase is clear water at room temperature and the solid phase is particles. The wall surface adopts non-slip wall surface.
(3)
Solution method
The turbulence model adopts RNG k-ε model, and the solid phase adopts a particle trajectory model. The solution adopts high-precision difference format and root mean square residual format, with a solution accuracy set at 10−5. The motion of solid particles in liquids with low solid content is analyzed, without considering collisions between particles. When particles collide with solid sidewalls, it is a completely elastic collision without considering energy loss. The pressure is discretized using the standard discrete format, while momentum, turbulent dissipation rate, and specific dissipation rate are discretized using the second-order upwind format. The solution method employs the SIMPLEC algorithm.

3. Result Analysis and Discussion

In this section, based on numerical simulation combined with comparison with real erosion on site, the sediment erosion characteristics and causes of each key component of the hydraulic turbine are analyzed and discussed, and the influence of vortex on erosion is further analyzed and discussed.

3.1. Analysis of the Whole Erosion in the Hydraulic Turbine

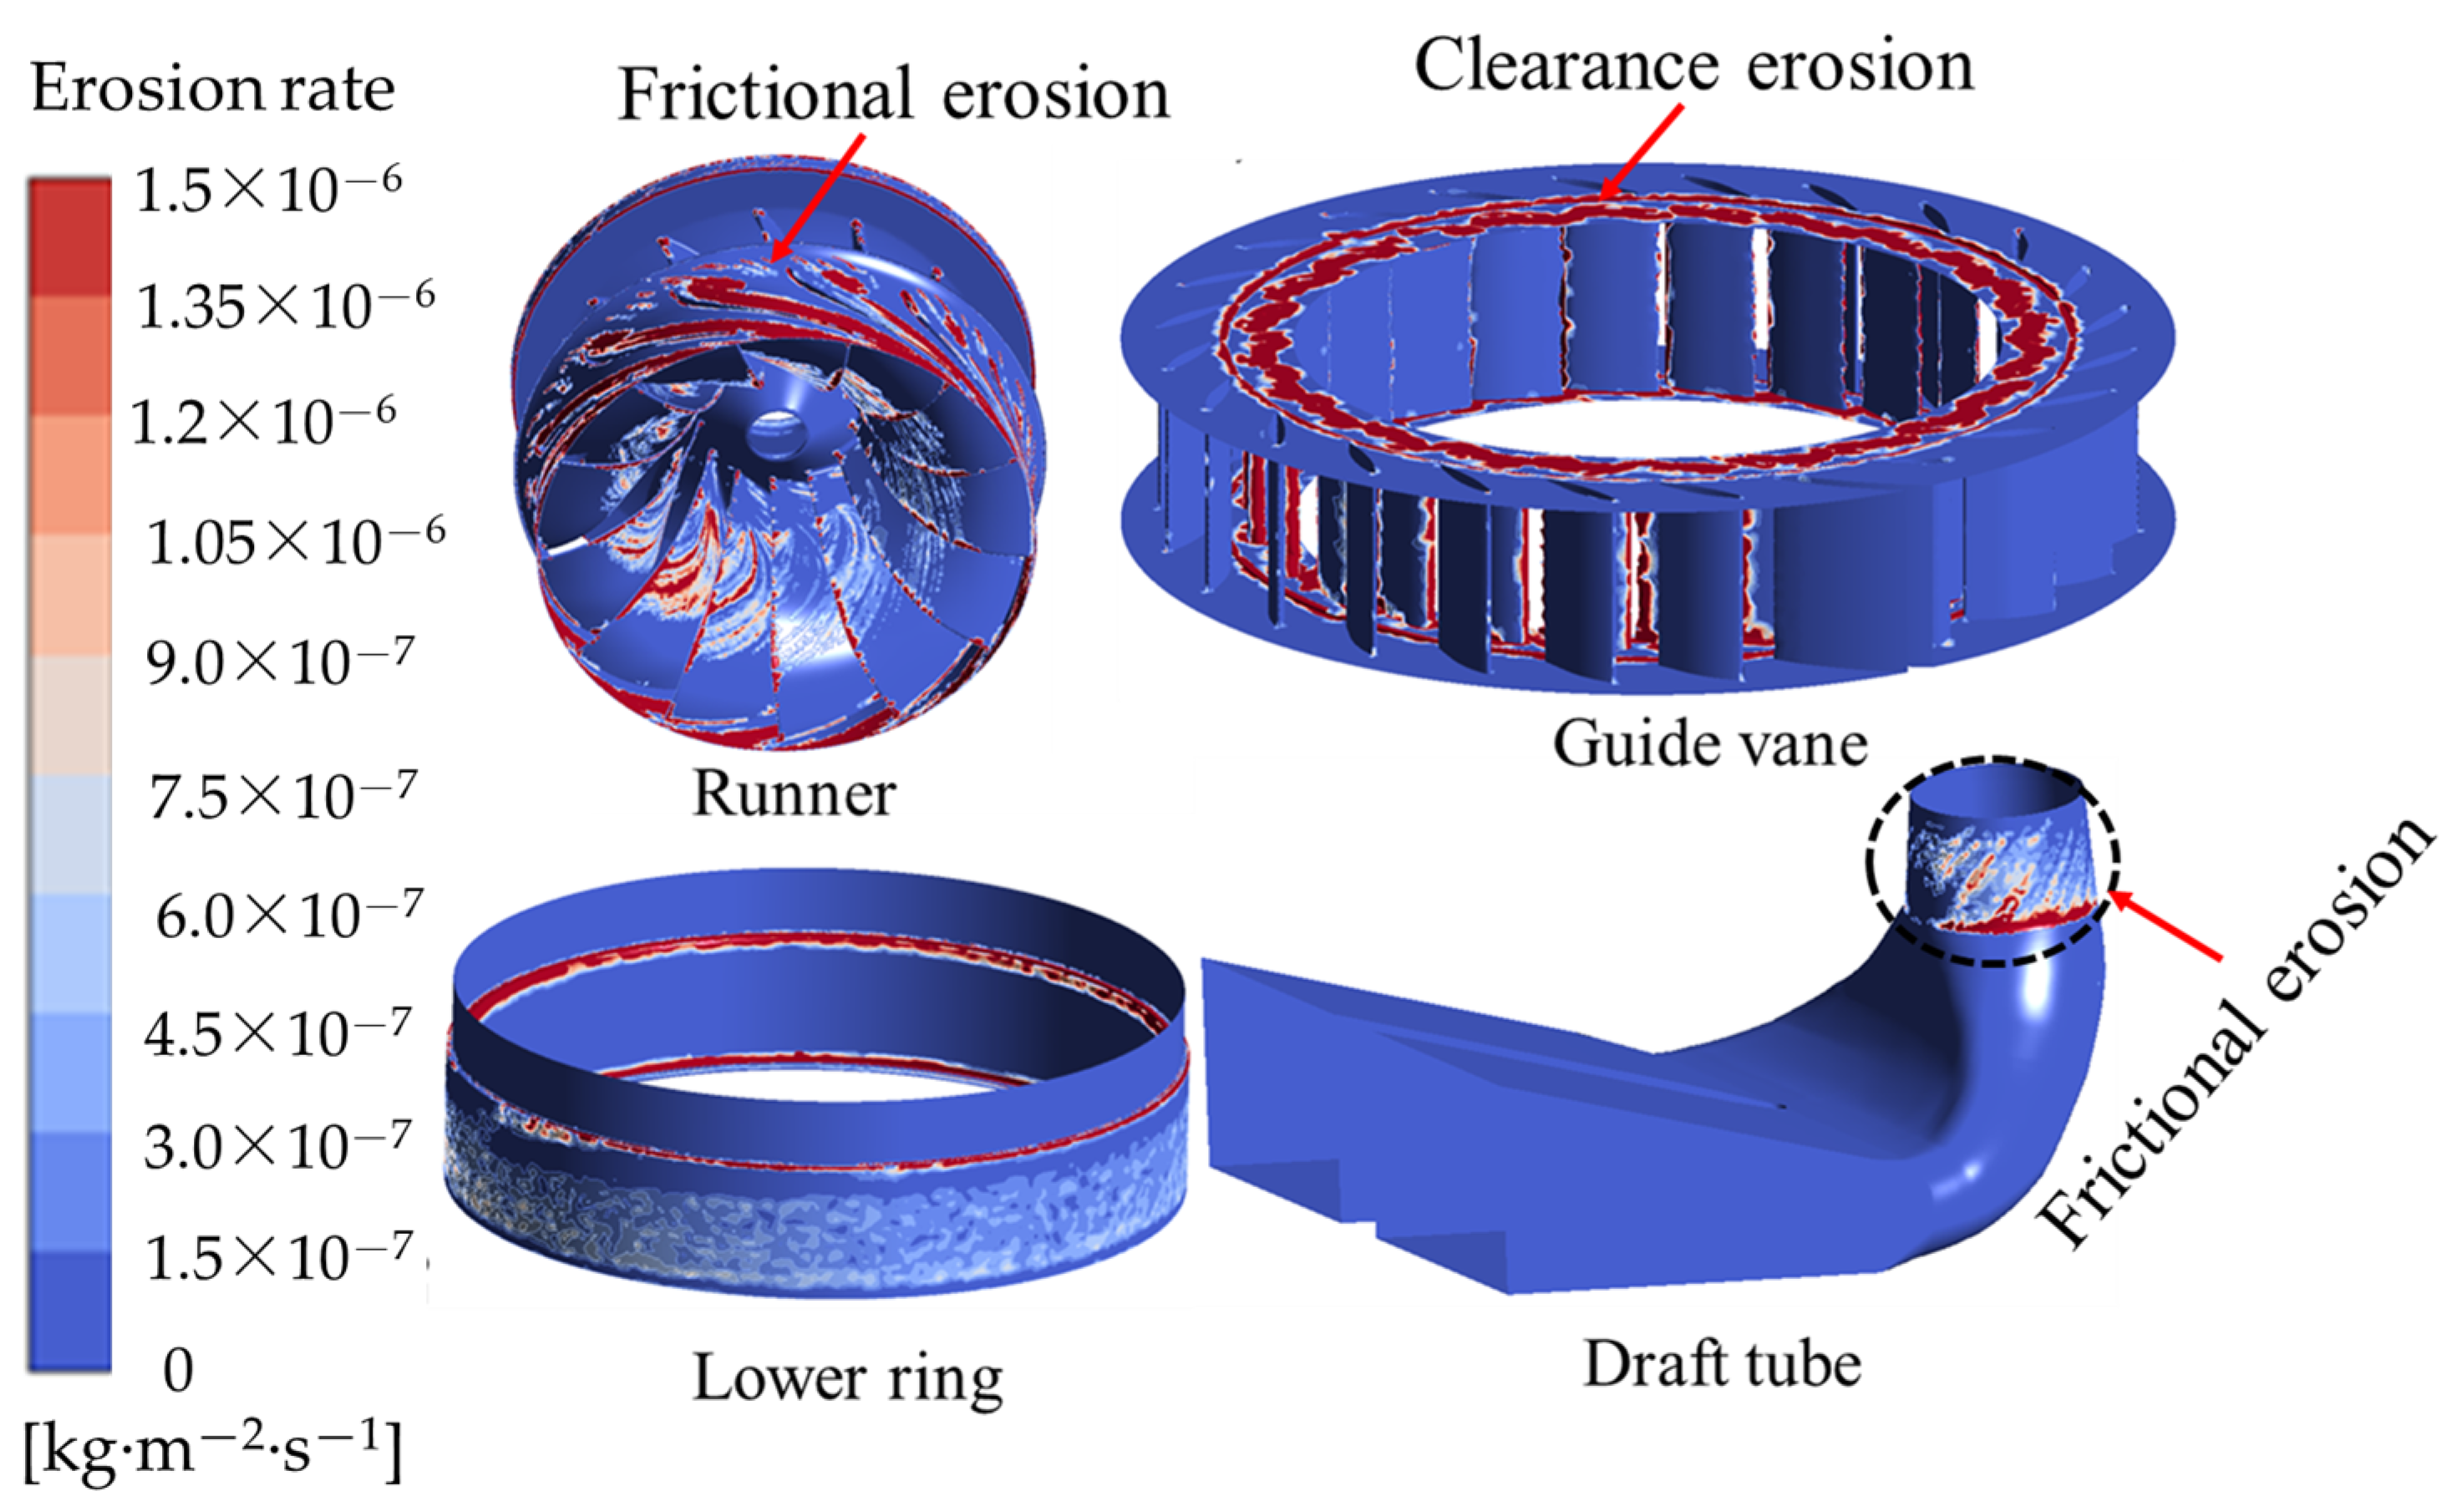
Figure 5 shows the distribution of erosion rates at different key positions of the unit. The erosion of the unit is mainly concentrated at the runner blade and the guide vanes. The erosion inside the runner is mainly distributed on the front outlet side, back outlet side, and near the inner side of the upper crown. There is slight erosion on the straight section of the draft tube. Friction erosion mainly occurs on the surface of the impeller, which is caused by the high-speed water flow passing through the main channel of the impeller, carrying sediment and acting on the surface of the turbine components, generating friction and causing erosion and damage to the surface of the unit; clearance erosion is mainly due to erosion and damage caused by high-speed water flow carrying sediment through the clearance between the movable guide vanes of the turbine. Effectively and reasonably distinguishing these erosion damages can provide assistance in clearly identifying the wear types of water turbines.
Figure 6 shows the total erosion rate and maximum particle impact velocity of different components obtained through numerical simulation analysis. In Figure 6, the total erosion rate and maximum particle impact velocity were obtained by tracking the trajectory of individual particles during CFX calculations to determine the maximum impact speed. The total wear rate was calculated by statistically analyzing the wear rate of each grid. The highest total erosion rate is on the surface of the runner at 1.08 × 10⁻³ kg·s−1·m−2. The erosion rate on the guide vane wall is second highest, also at 9.8 × 10⁻⁴ kg·s−1·m−2. The total erosion rate in the clearance is lower than that on the guide vane wall at 7.03 × 10⁻⁴ kg·s−1·m−2. The lowest total erosion rate is found in the draft tube at 2.57 × 10⁻⁴ kg·s−1·m−2. The maximum impact velocity on the runner surface is 36.4 m/s, while the maximum impact velocity on the guide vane wall is 32.5 m/s. The maximum impact velocity at the clearance is 42.6 m/s, occurring at the guide vane section clearance. The maximum impact velocity in the draft tube is 26.3 m/s. It can be observed that, except for the clearance, higher impact velocity results in higher erosion rates. Each component has a different impact velocity that causes erosion, which indicates that the maximum velocity in different erosion zones varies, leading to different erosion mechanisms. This provides theoretical support for optimizing design in engineering.
Figure 7 shows three-dimensional flow field distribution throughout the entire channel. 
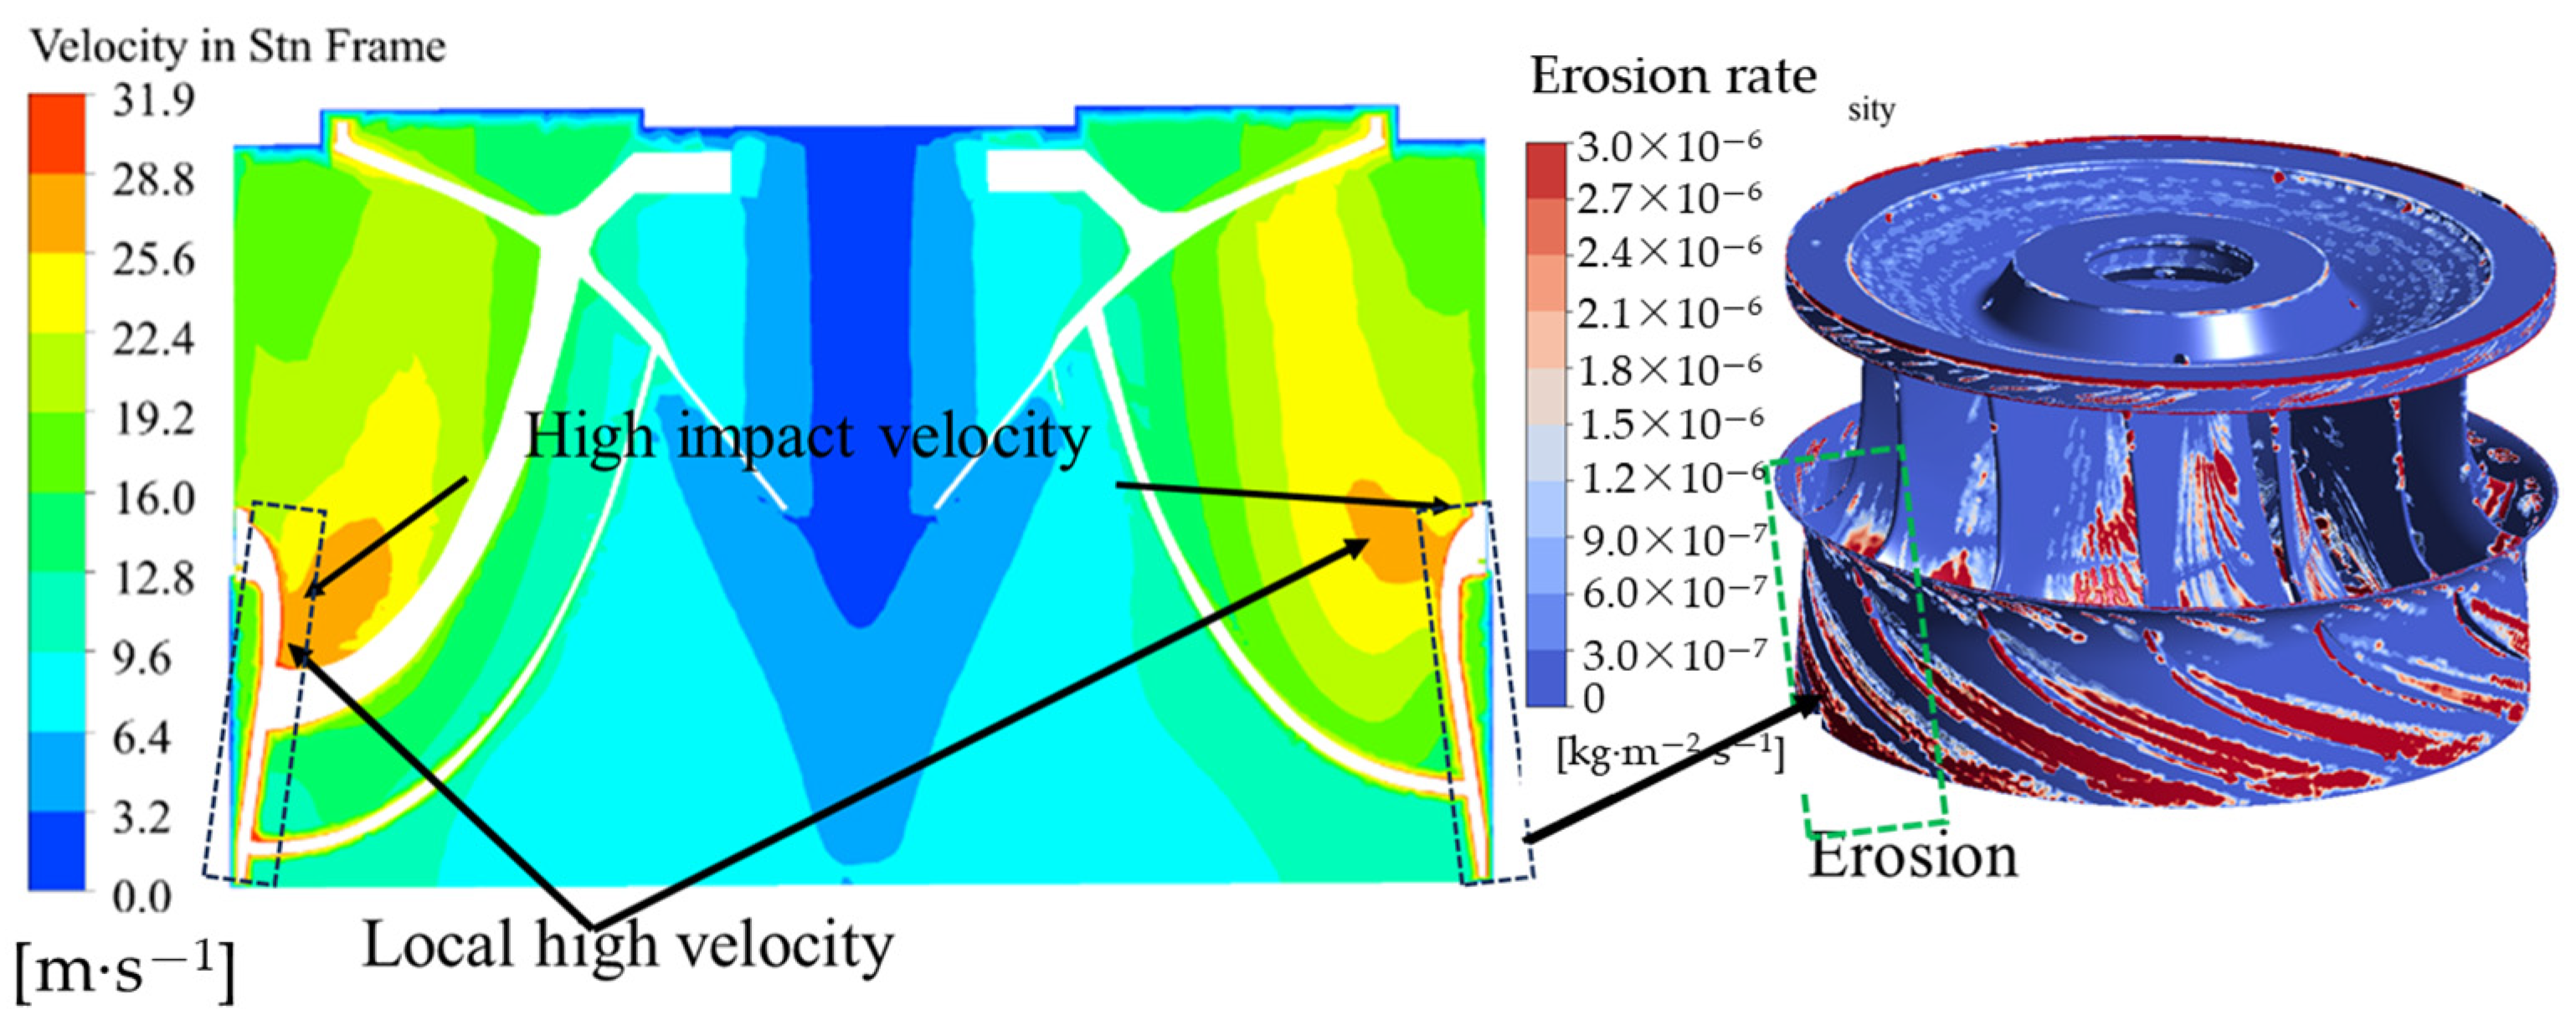
Figure 8 shows a longitudinal cross-section through the center of the runner. The velocity distribution along the longitudinal cross-section of the runner illustrates changes in its longitudinal velocity. From Figure 7, we can see that the speed at the lower ring wall of the runner is in a high-speed zone, which is also the area where wear is most severe. The flow within the runner is relatively smooth, though there are abnormal flow conditions in certain areas. Overall, the high-velocity zone of the unit is mainly concentrated in the guide vanes and runners, and the flow velocity inside the hydraulic turbine unit is different in each component. The differences in flow patterns among various components correspond to the erosion distribution of the unit at the same location, indicating that local flow patterns affect the unit’s erosion. This is consistent with the aforementioned erosion distribution pattern.
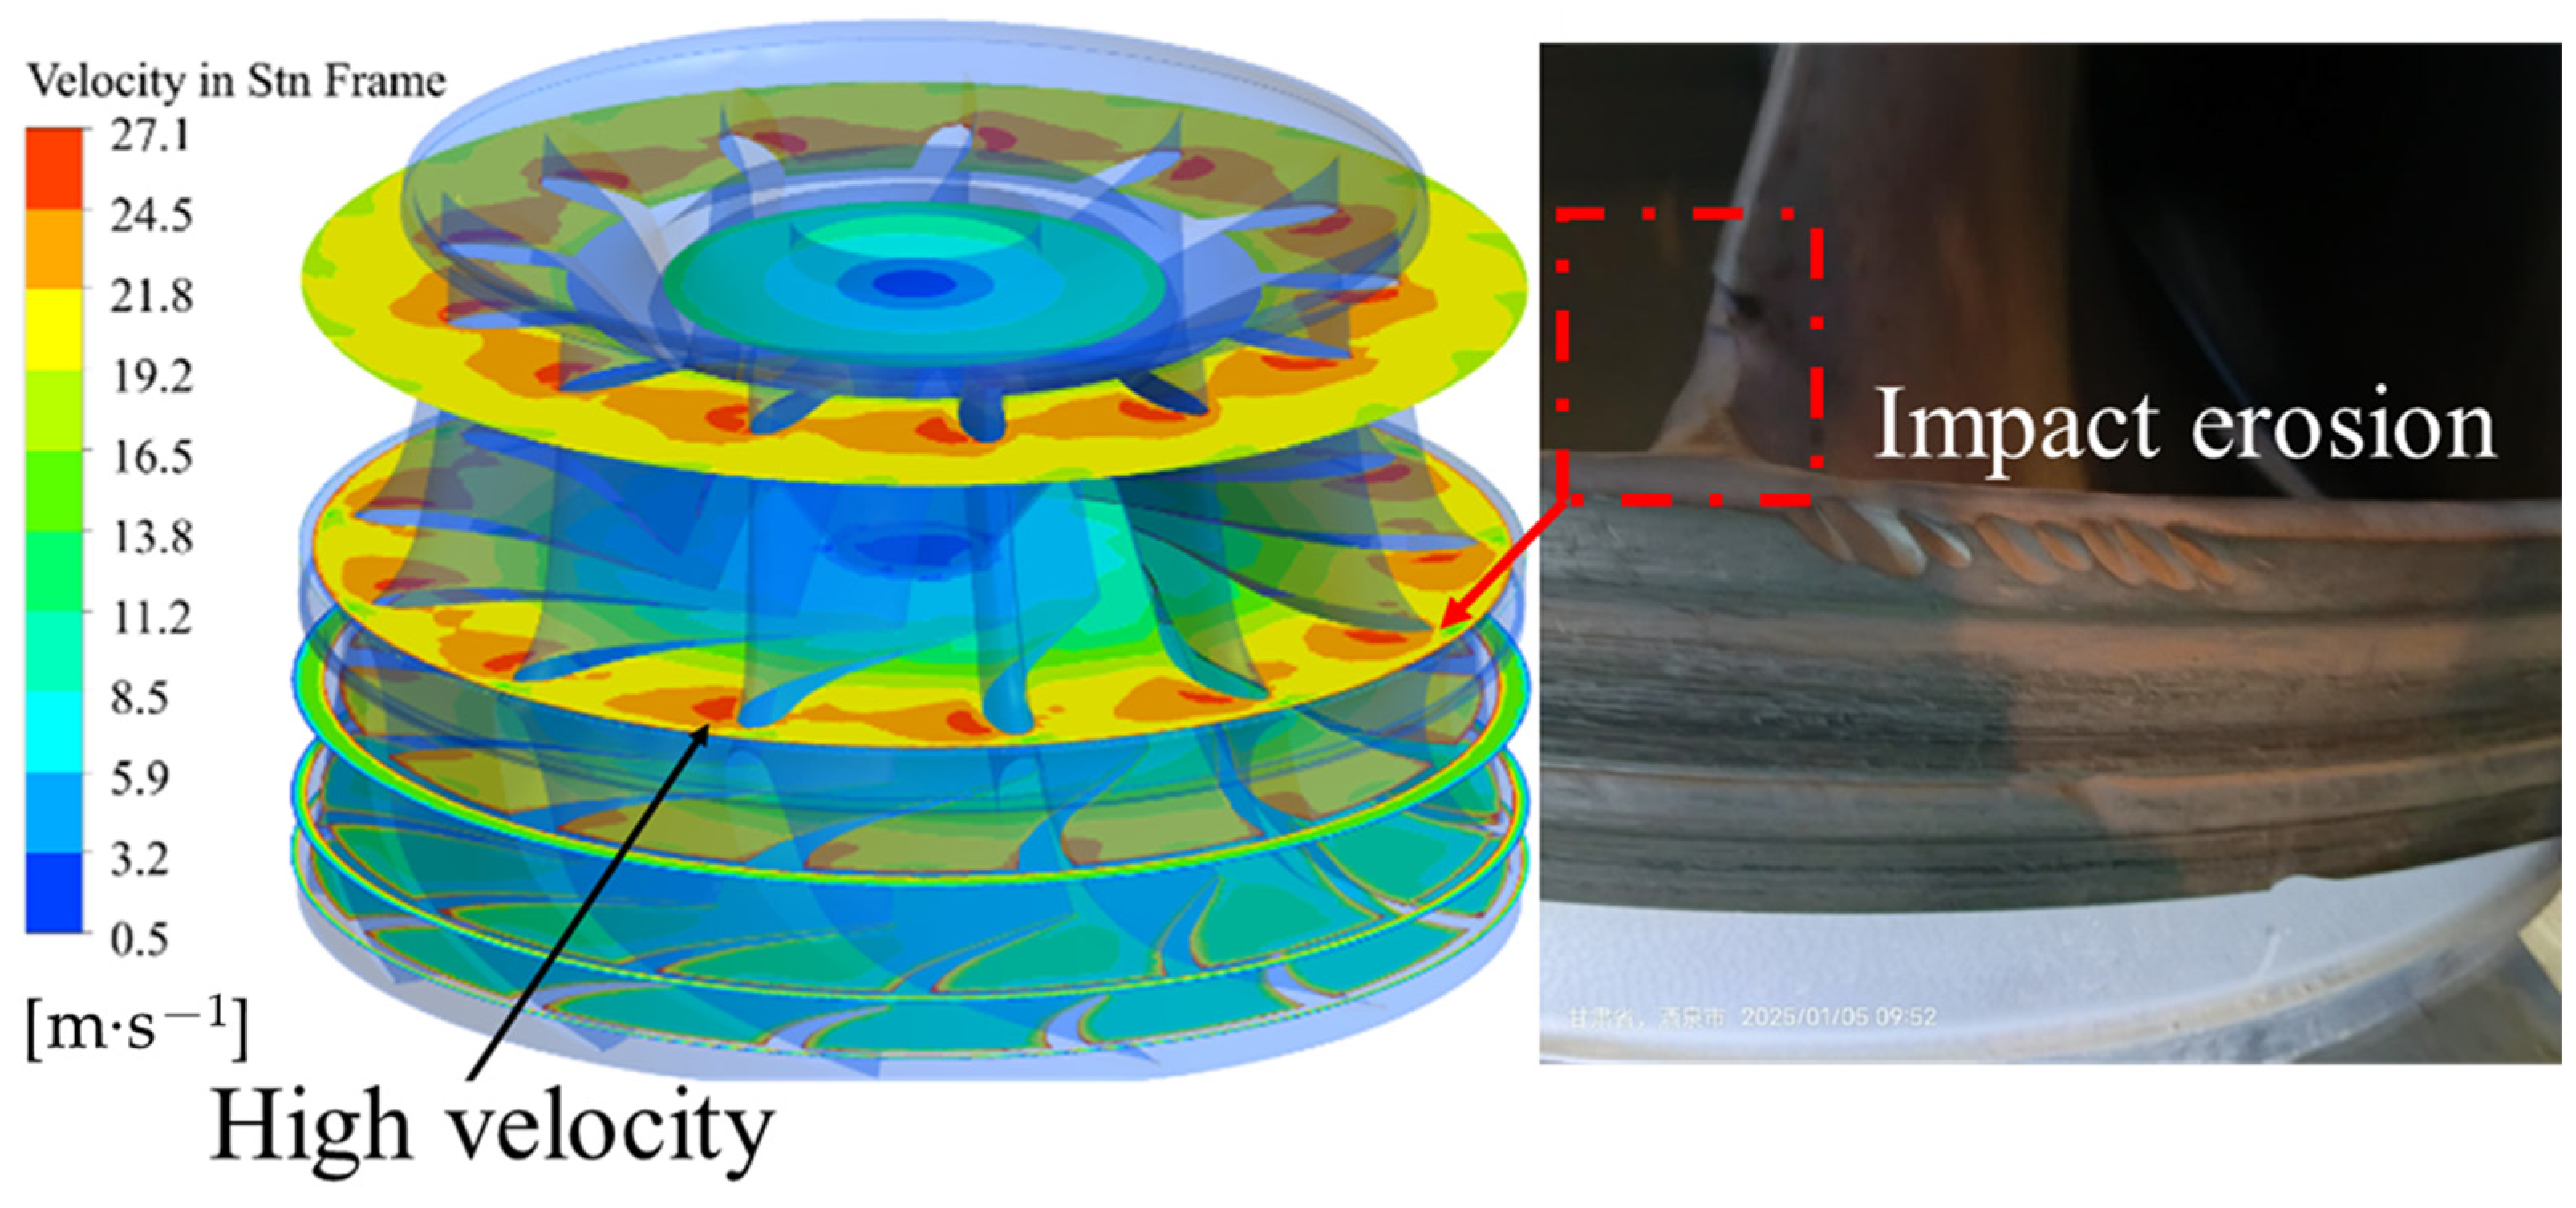
Figure 9 shows the velocity distribution at different planes of the runner and real erosion on site. The leading edge of the runner blades experiences higher sediment impact velocity near the lower ring, while the particle impact velocity increases near the crown at the blade head. The impact velocity on the front face of the blade is 36.3 m/s, indicating impact erosion in this area, which suggests that high-velocity particle impacts are the primary cause of the erosion.

3.2. Effect of Vortex on the Sediment Erosion in the Runner and Draft Tube

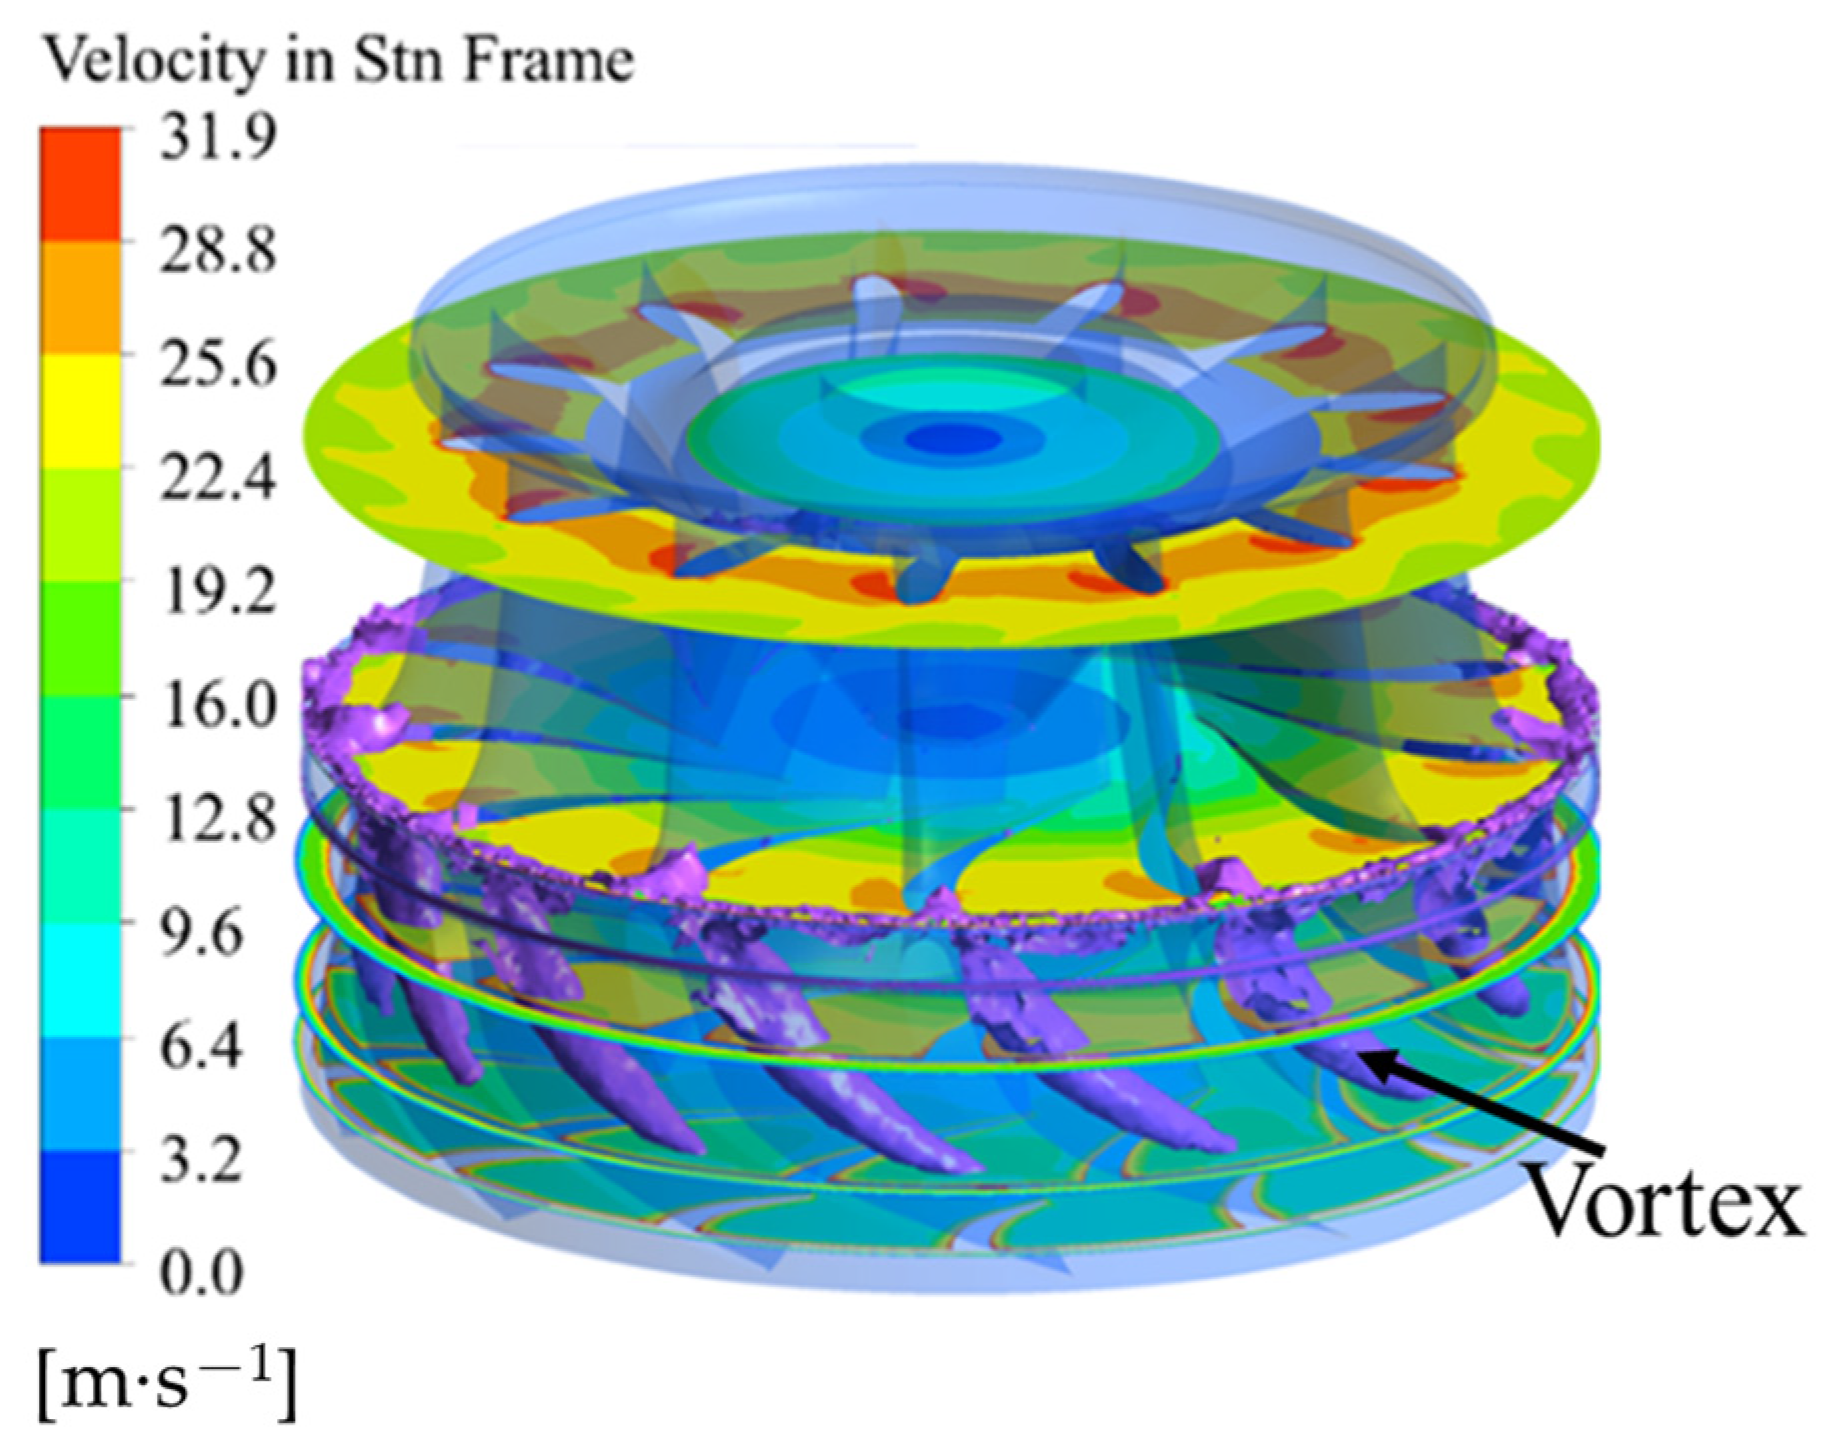
As analyzed earlier, the erosion of the runner, as the core of the hydraulic turbine, is the most severe. The runner itself rotates at high speed and will inevitably suffer from sediment erosion. In addition, the vortices inside the runner can alter the local motion of particles. Using the Q criterion, the vortices inside the runner are visualized. The Q-criterion threshold is set at 65,000 (s−2). There are obvious channel vortices on the outlet side of the lower ring of the runner, as shown in 
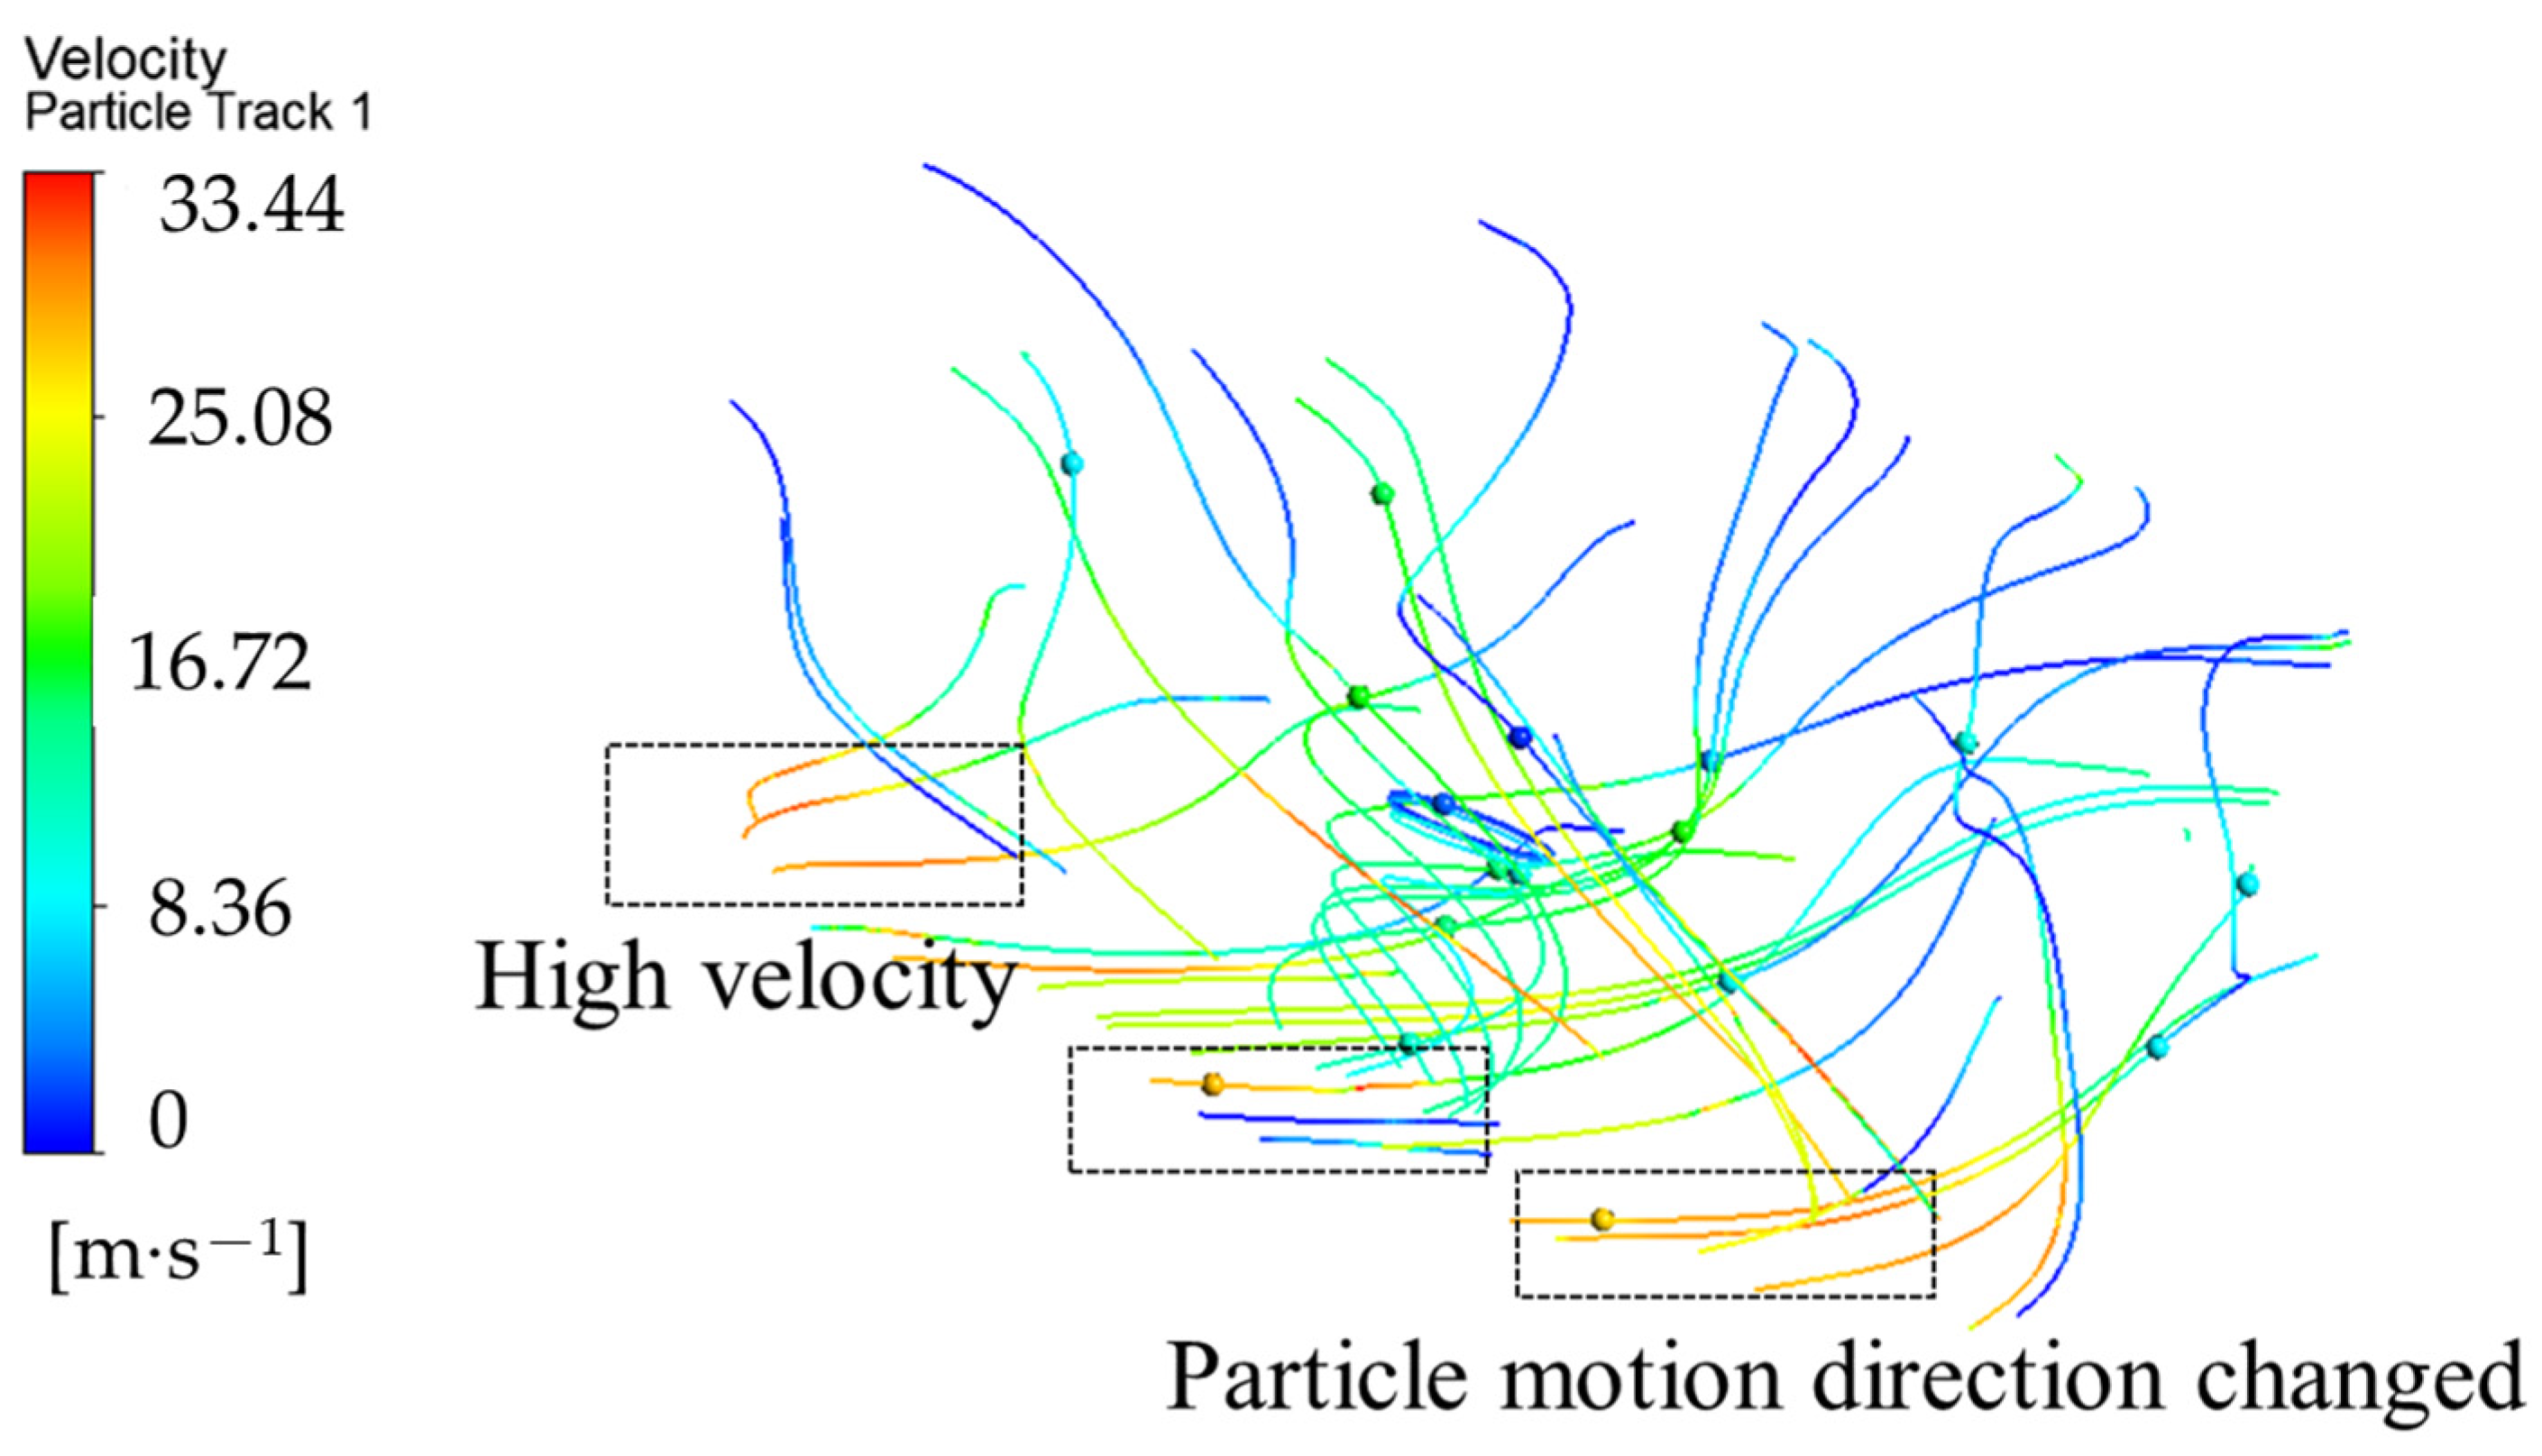
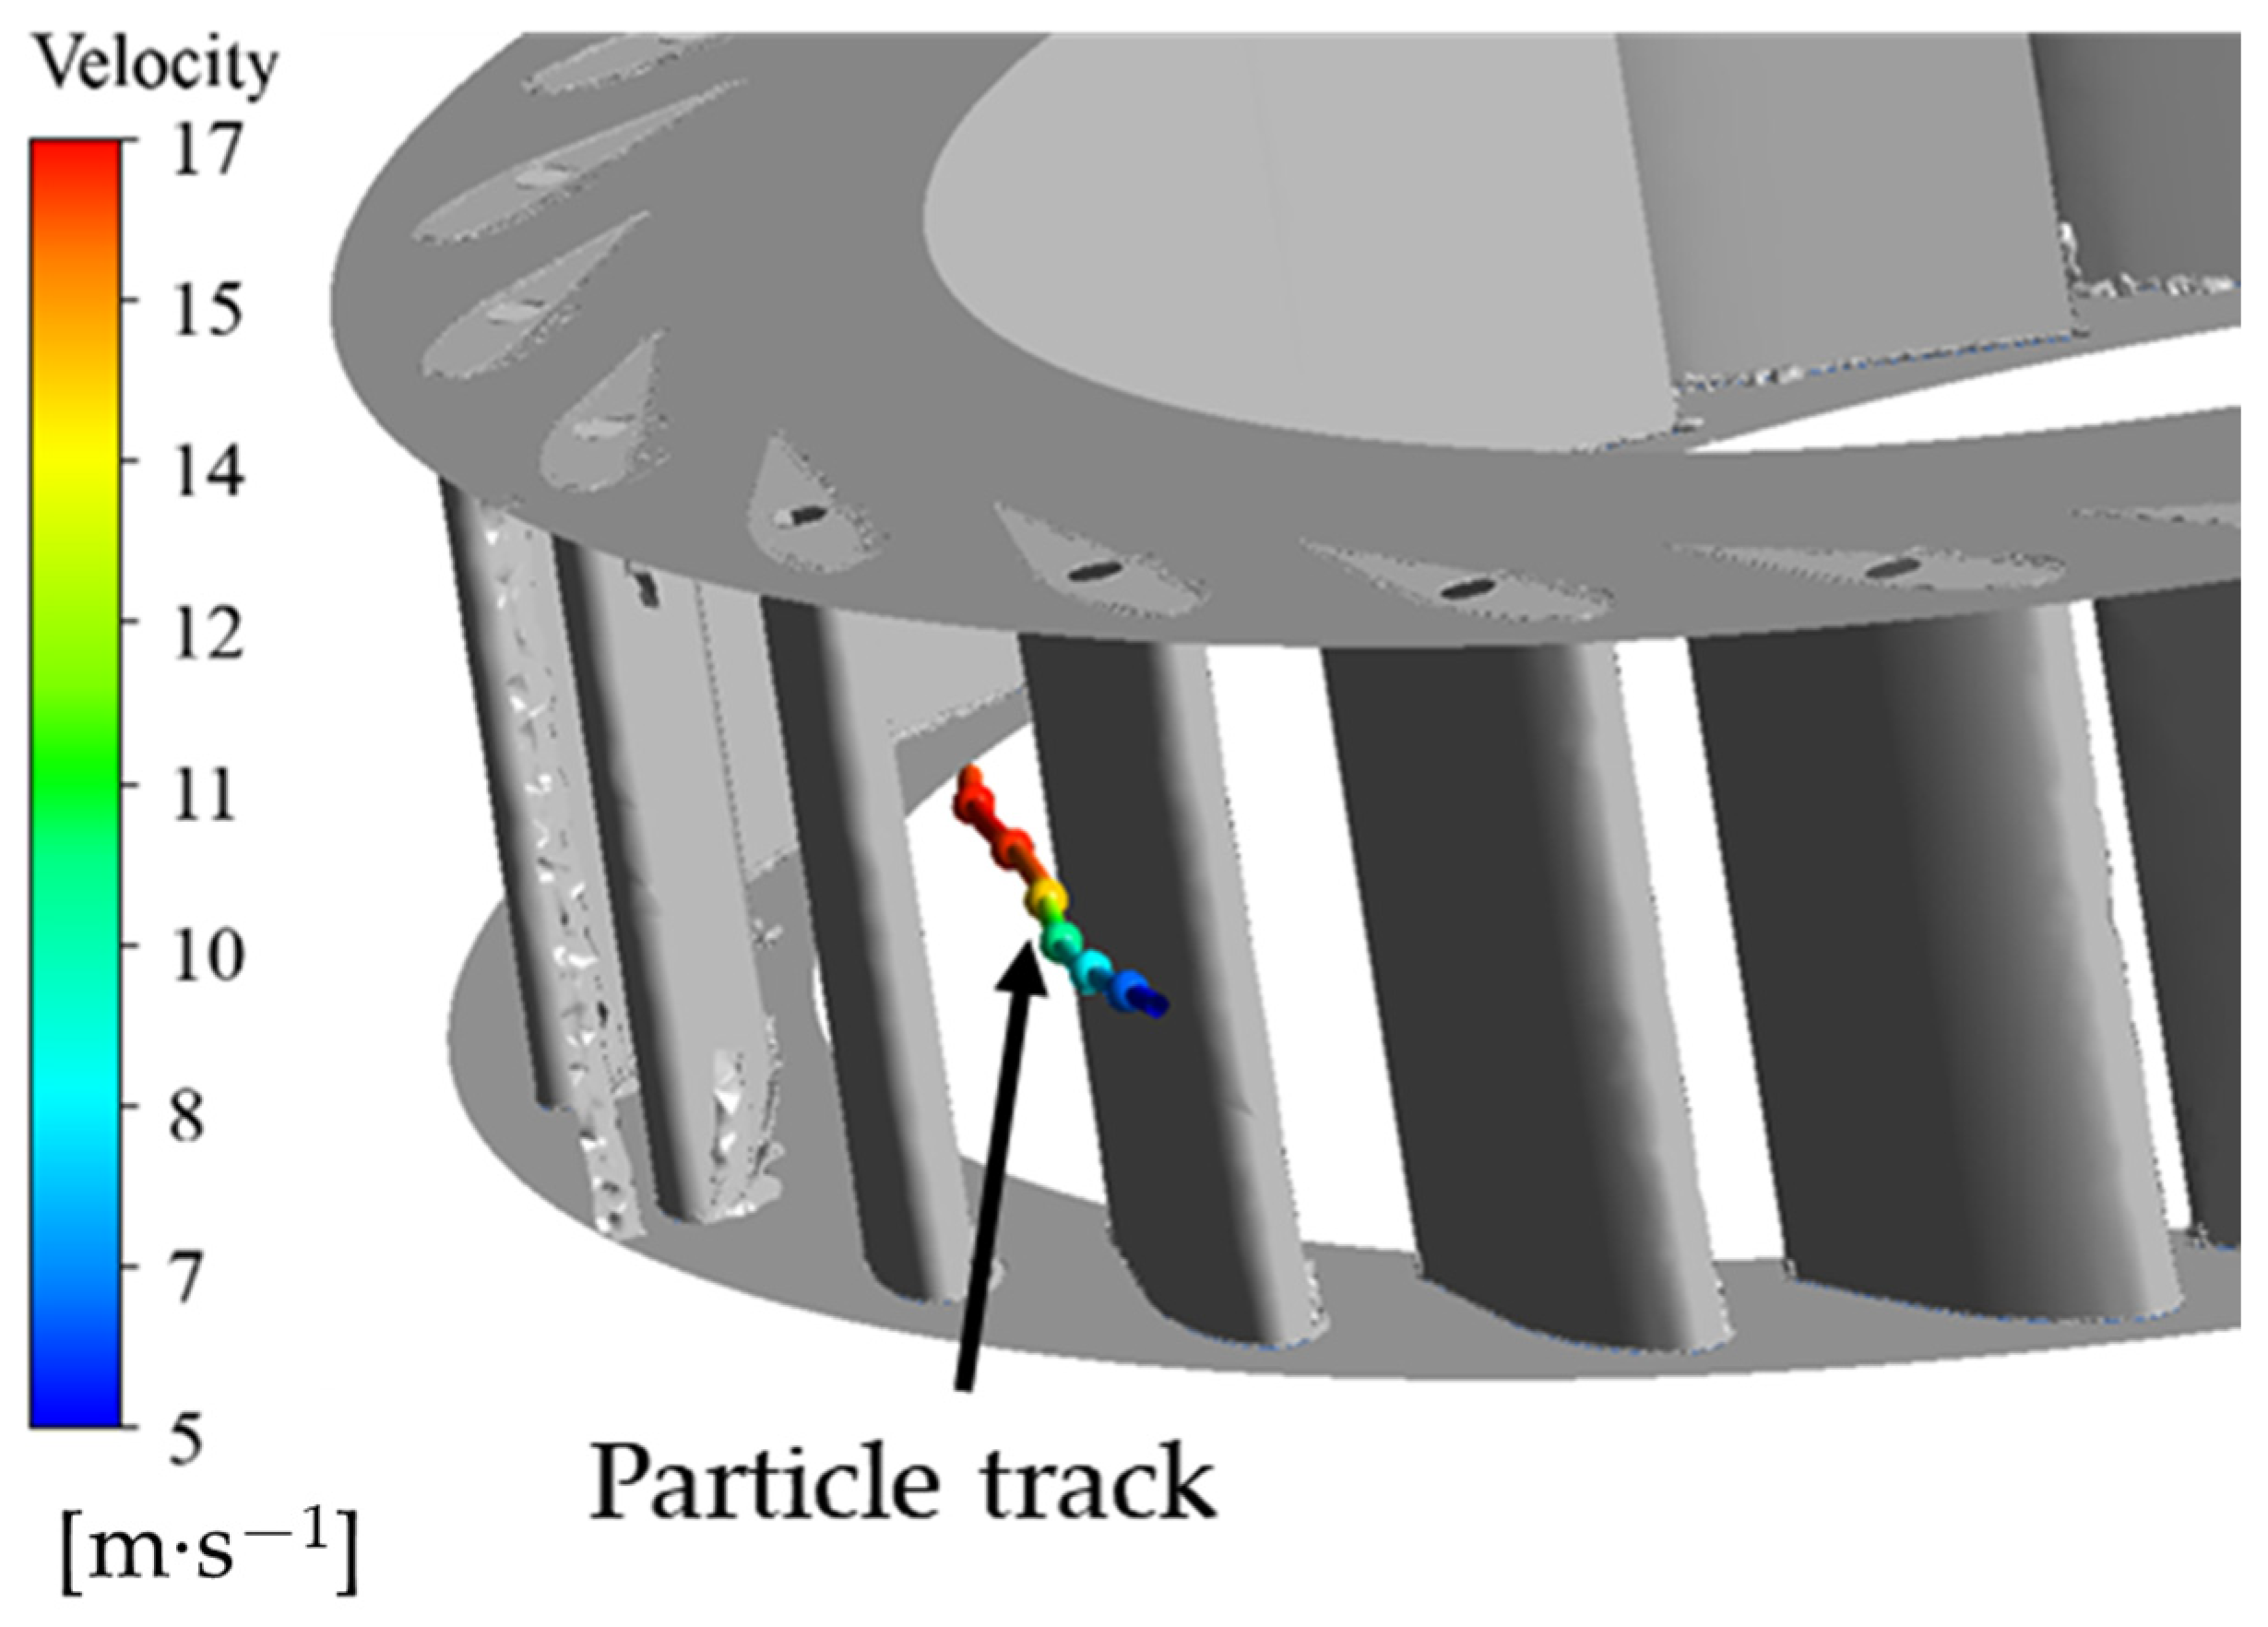
Figure 10. To analyze the influence of vortices on the particle motion trajectory inside the runner, the particle motion trajectory inside the runner is visualized, as shown in Figure 11. Figure 12 shows the distribution of erosion rate on the lower ring wall of the runner.
Figure 10 mainly shows the eddy current velocity at different cross-sections of the runner and the eddies formed at the lower ring outlet. Additionally, Figure 11 supplements Figure 10 by displaying the speed and trajectories of particles, thereby validating the conclusion that the velocity is higher at the outlet in Figure 10. Figure 12 illustrates the severity of sediment erosion in various areas of the runner and lower ring. It can be observed from the figure that sediment erosion is severe at the outlets of the runner and lower ring, which aligns with the higher eddy current and particle movement speed at these outlets shown in Figure 10 and Figure 11.
It can be seen that the particle impact velocity at the outlet of the lower ring is very high, with a maximum impact velocity of 33.4 m/s. Due to the influence of vortices, the motion trajectory of each particle will vary (as indicated in Figure 10). The formation of these vortices not only changes the velocity distribution of the flow field but also directly affects the trajectory of particle motion, thereby exacerbating the erosion of the blade surface (as indicated in Figure 11). The formation of eddies can cause drastic changes in local flow velocity, which may become unstable or experience backflow. Due to fluctuations in water flow direction and velocity, particle trajectories also become irregular, exacerbating local erosion.
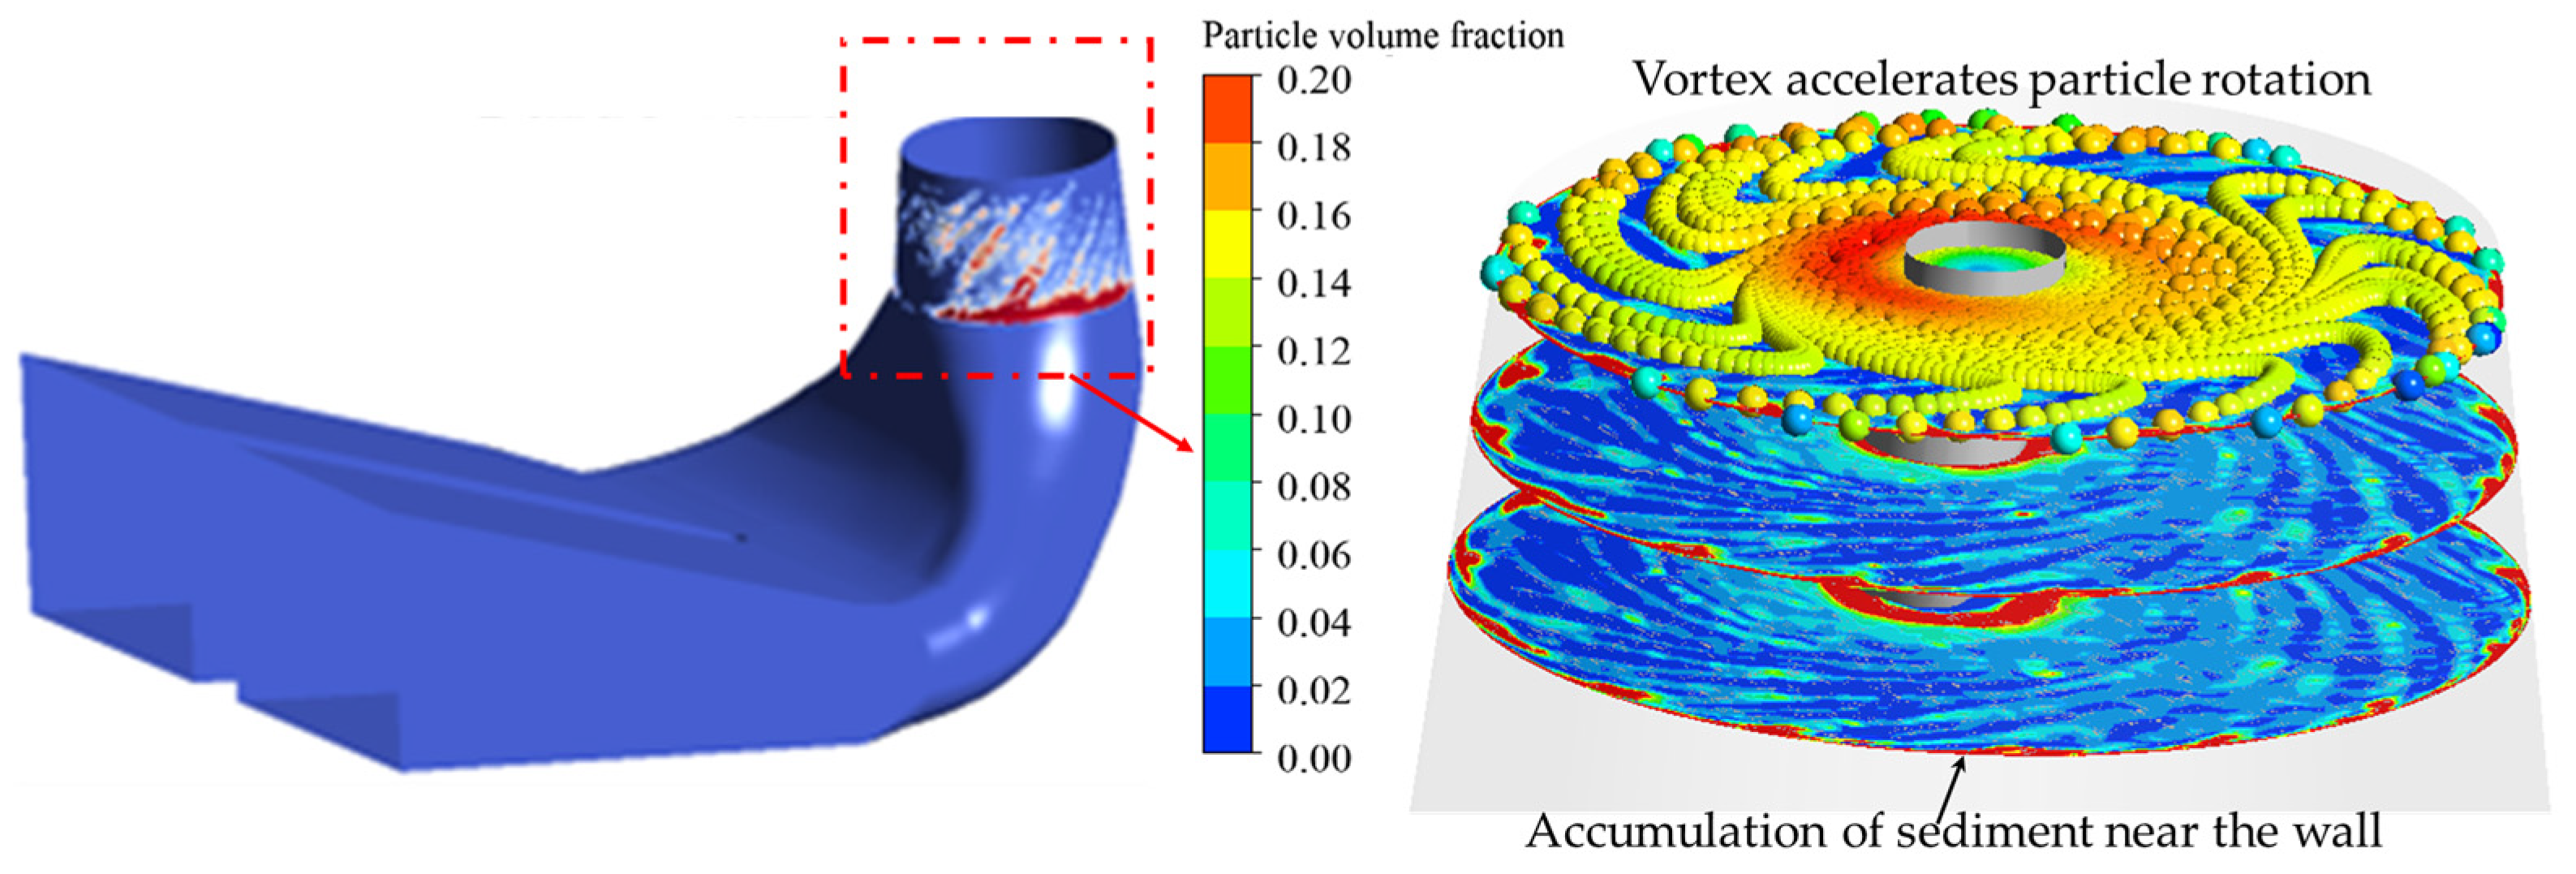
To analyze the influence of vortex in the draft tube on the erosion of the draft tube wall, three analysis sections were selected inside the draft tube. Figure 13 shows the distribution of sediment volume fraction on the three sections. The high sediment volume fraction area surrounds the vortex band and has a certain distance from the draft tube wall. The sediment volume fraction inside the vortex zone is relatively low, and high sediment volume fractions are all located outside the vortex zone. Influenced by the vortex zone, the sediment volume fraction along the flow direction becomes increasingly concentrated near the wall of the draft tube, resulting in increased erosion. From the trajectory of particle motion through the draft tube, it can be seen that the rotation of the vortex accelerates the rotation of the particles, increasing the friction erosion of the draft tube wall (see the marked position). Therefore, the tailwater vortex has a negative impact on the erosion of the draft tube wall.

3.3. Effect of the Vortexon the Sediment Erosion in Guide Vane Clearance

In the previous section, the sediment erosion law of the hydraulic turbine flow channel was comprehensively presented, and it was pointed out that the guide vanes and runners are components with severe sediment erosion. To ensure the movement of the guide vanes, there is a certain clearance between the guide vanes and the upper and lower end faces, which belongs to a special small channel in the hydraulic turbine flow channel. Due to the small particle size of the sediment particles studied in this article, they will enter the guide vane clearance with the flow of water, causing erosion. The flow velocity inside the clearance is high, the flow state is complex, and the damage situation is severe. The following analysis will examine the erosion of the guide vane surface and clearance, as well as the characteristics of particle movement.
Figure 14 shows the velocity distribution of seat ring end face and real erosion on site. In Figure 14, a one-way simulation was used, primarily considering the impact of particles on the turbine wall. The deposition particle density is 2300 kg/m3, with a particle size of 0.02 mm. Preliminary calculations in CFX require customization. The erosion on the outlet side of the seat ring is very severe, and the velocity distribution on the surface of the seat ring indicates that the high-speed flow at the guide vane outlet is the main cause of the erosion on the seat ring. Especially the jet flow in the clearance can cause very deep erosion dents along the flow direction of the guide vanes on the seat ring.
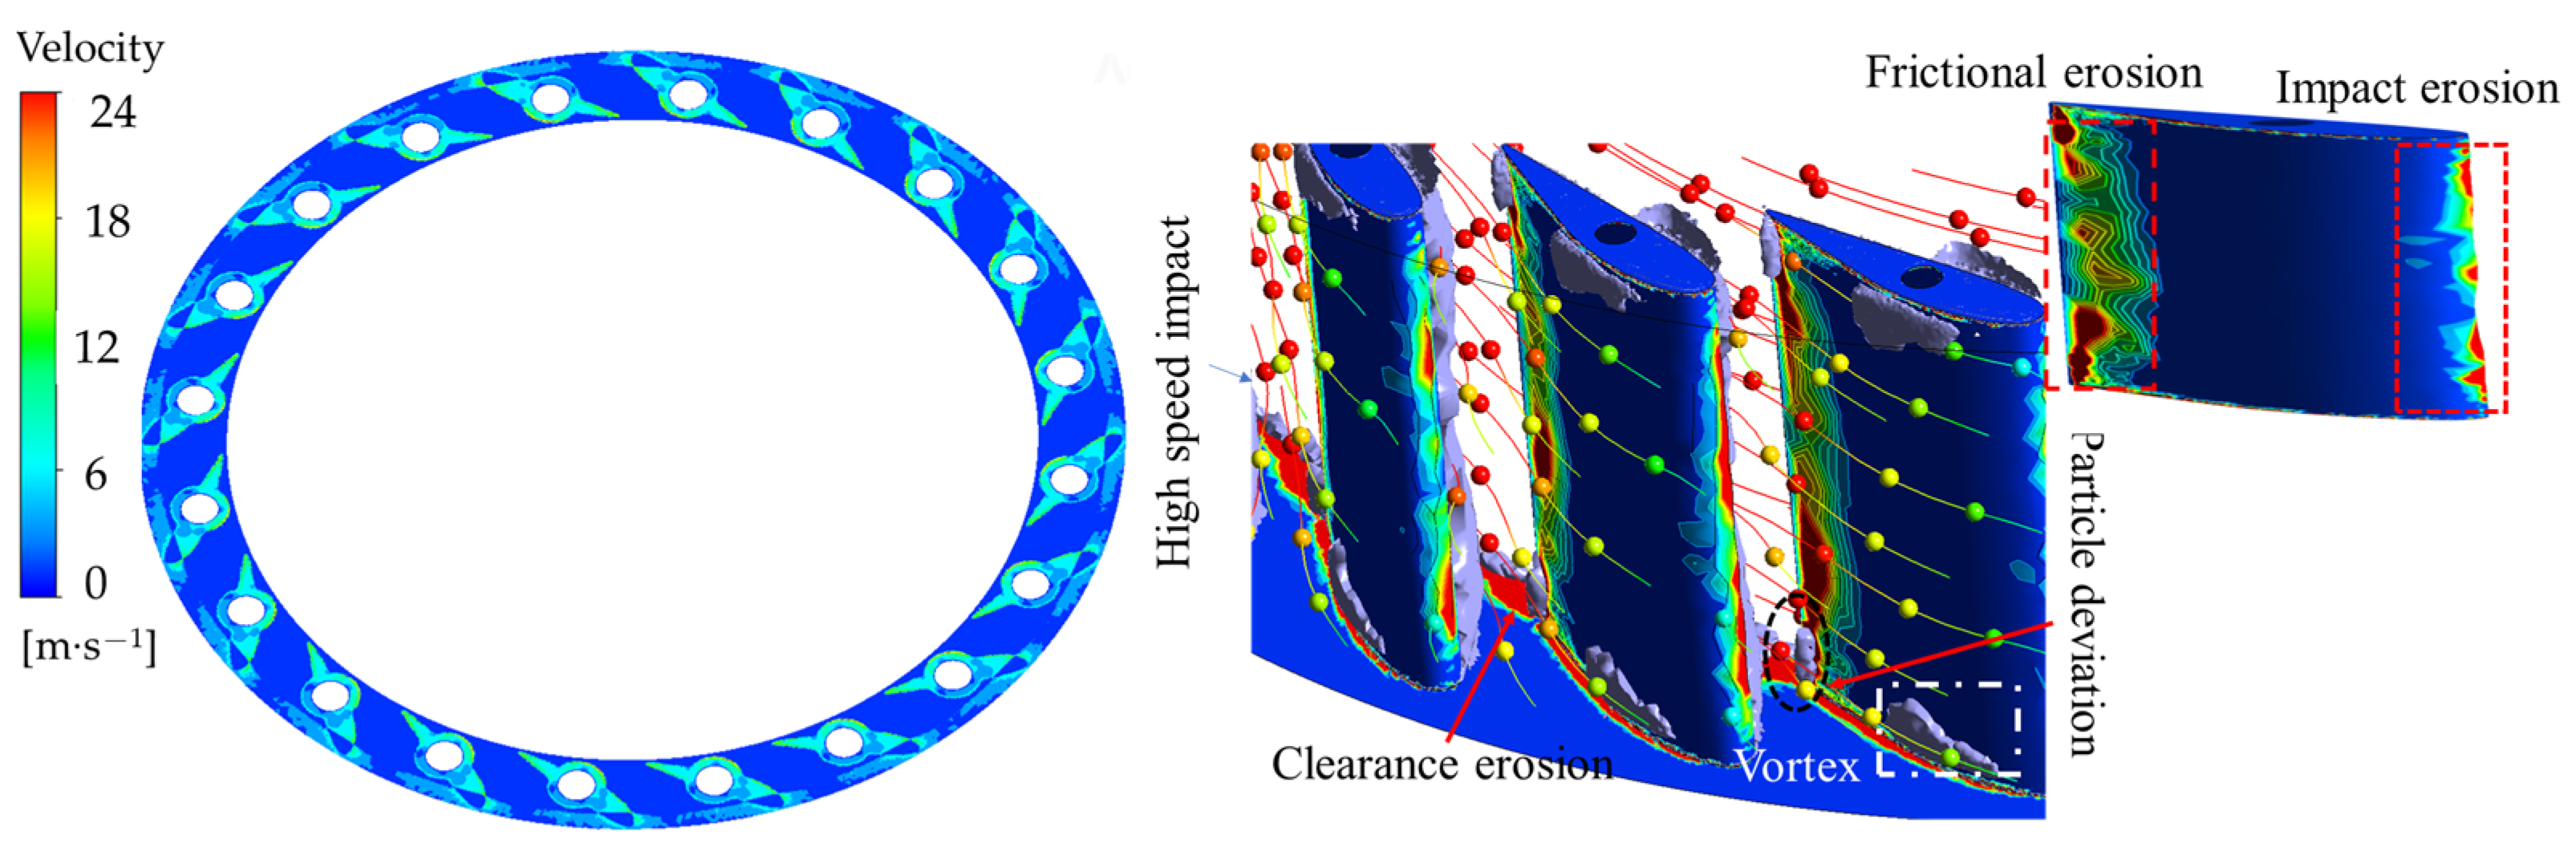
Figure 15 shows the trajectory of sediment particles and sediment erosion in the guide vane channel. The sediment particle size in the figure is enlarged by 120 from the actual size. The trajectory of sediment particles follows the water flow well, and the velocity of sediment particles increases after passing through the narrowest part of the guide vane. The velocity of sediment particles on the front of the guide vane is higher than that on the back of the guide vane. The erosion at the inlet of the guide vane is impact erosion, while the erosion at the outlet is frictional erosion. The vortex in the guide vane channel causes the particle trajectory to change and deviate from the outlet wall of the guide vane (as marked in Figure 15). In the clearance between the guide vanes, sediment particles enter the clearance at the back of the guide vanes and, at the entrance of the clearance, the lower sediment particles are sucked to flow around the boundary between the back of the guide vanes and the clearance. The sediment particles inside the clearance have a higher velocity on both sides of the shaft and, after passing through the guide vane clearance, they are affected by the vortex in the guide vane channel, and their direction changes and flows downstream with the unstable vortex. As the clearance further increases, this unstable vortex intensifies and the sediment trajectory becomes more chaotic. This indicates that the vortices in the guide vane channel have a significant impact on the erosion of the guide vane wall and clearance.
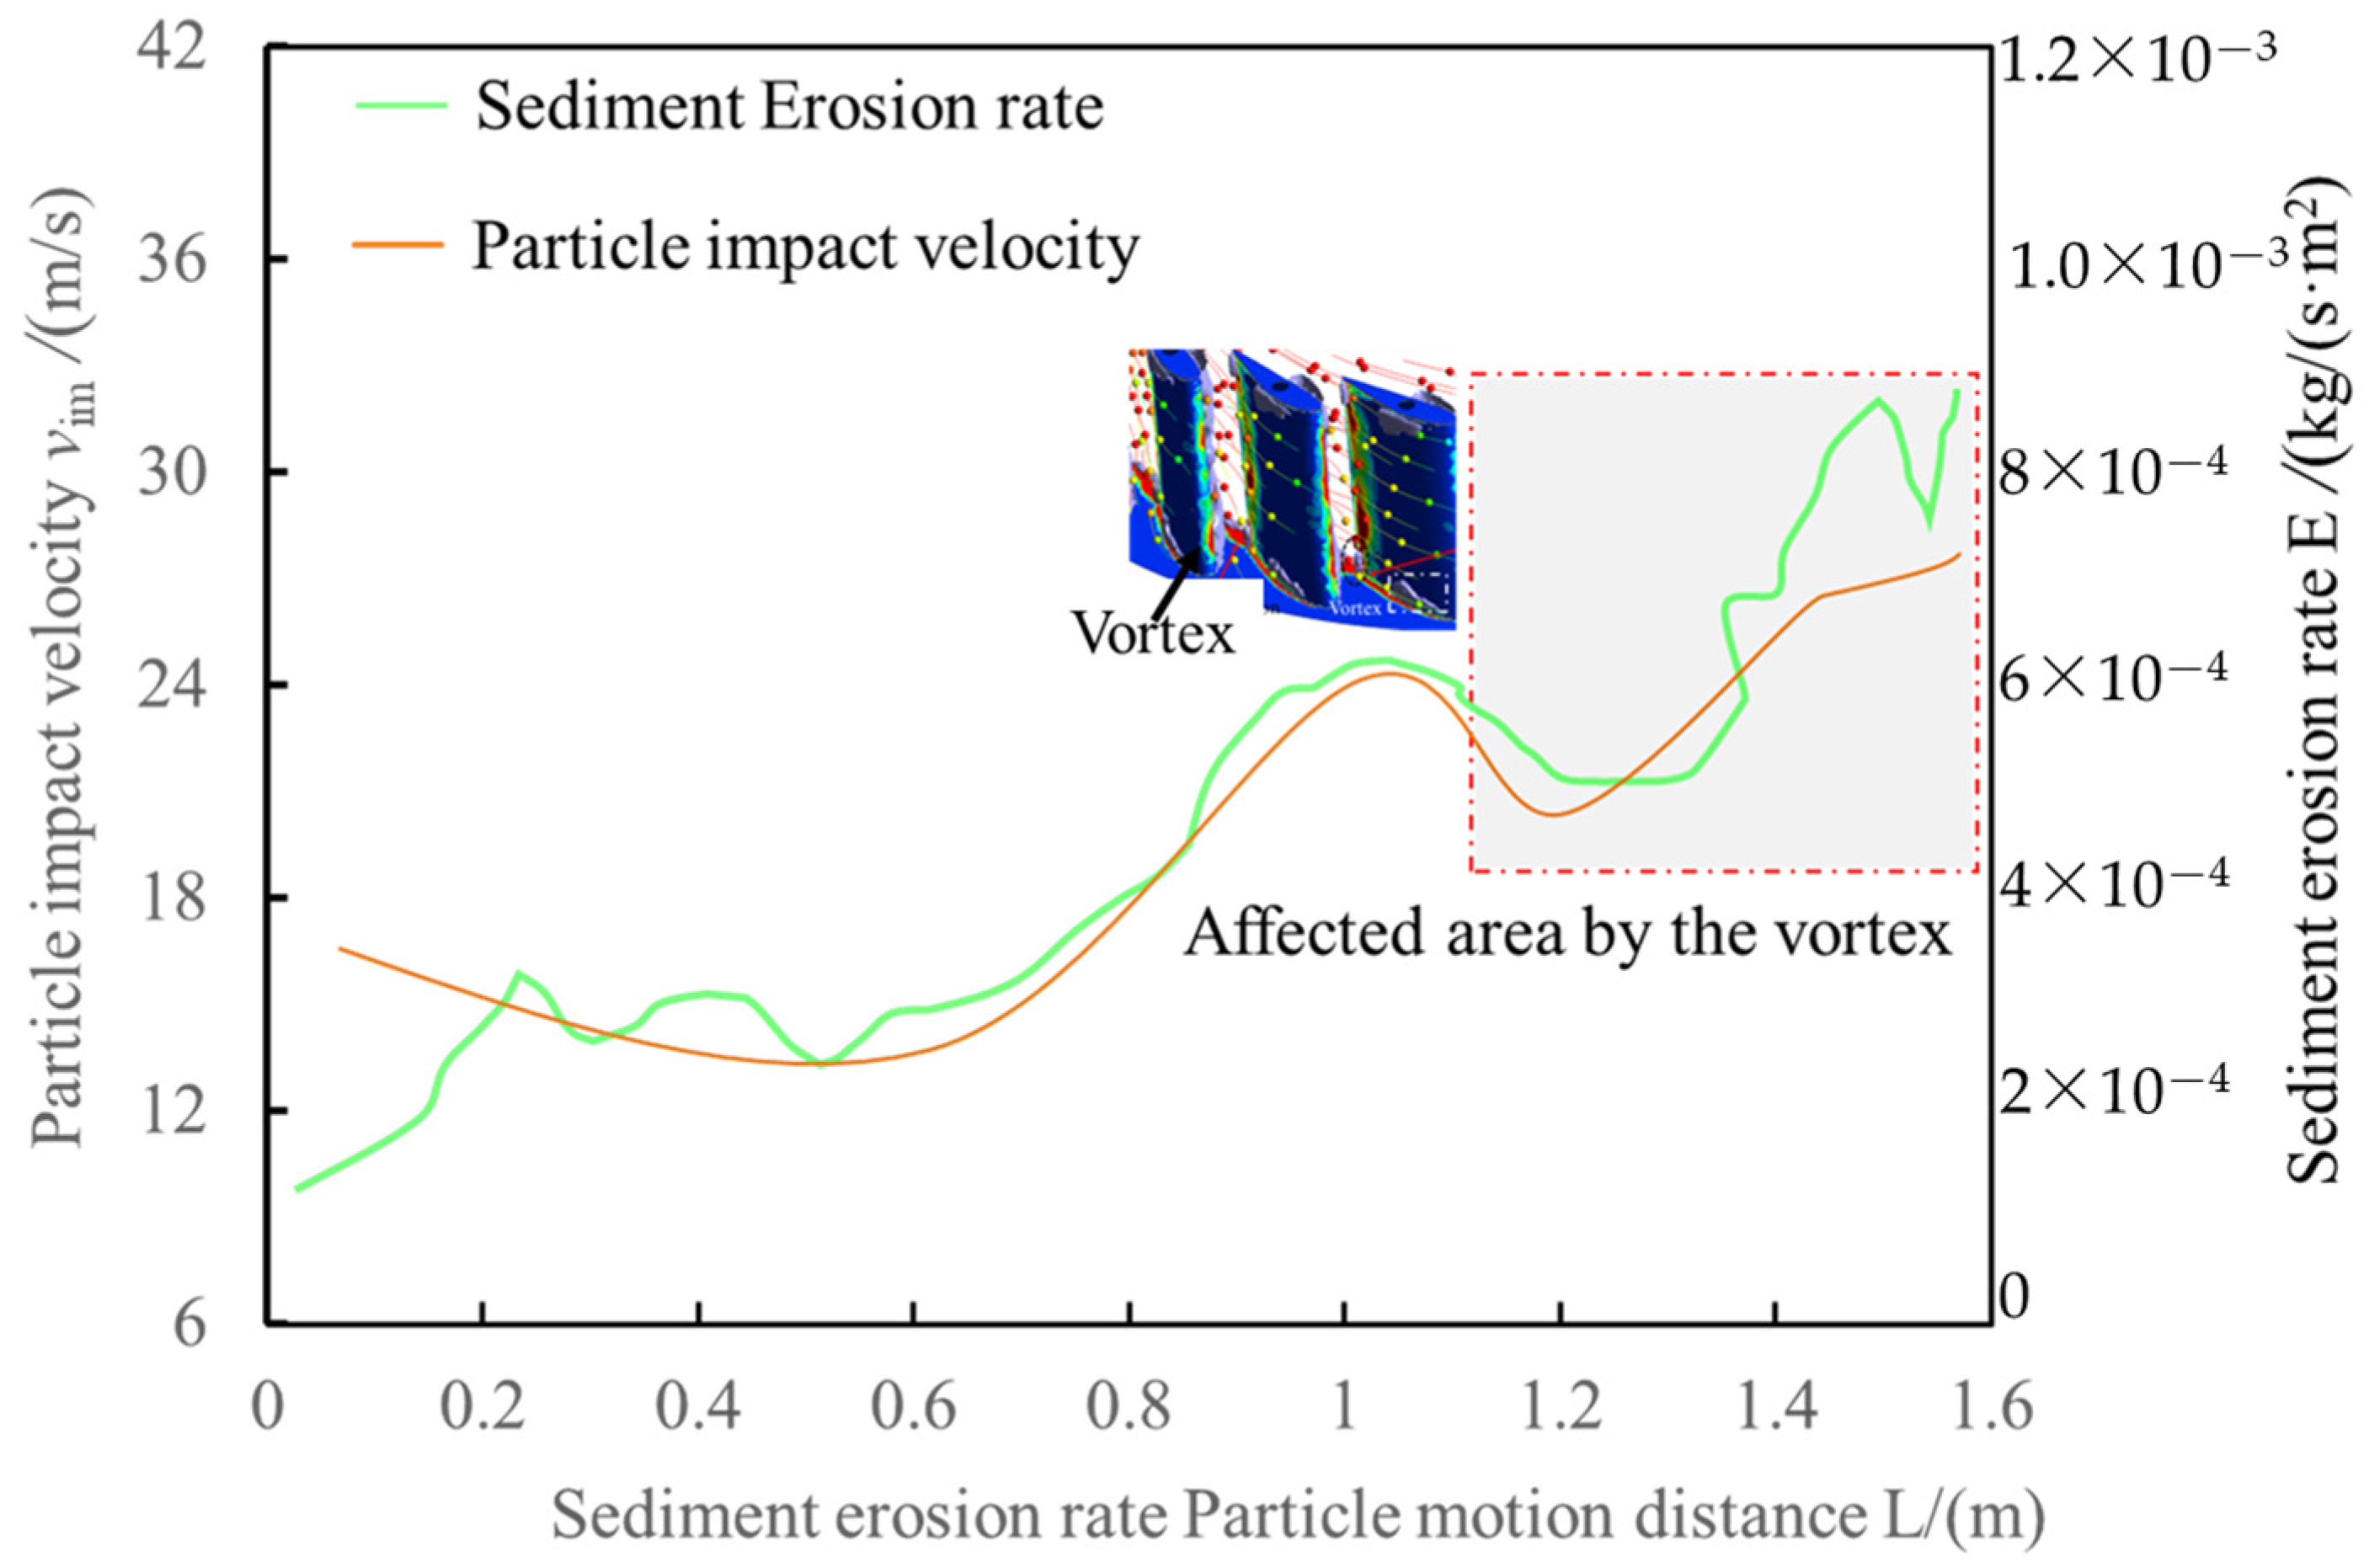
Figure 16 shows the analysis of particle trajectories at impact velocity. Figure 17 shows the particle impact velocity and sediment erosion rate along the particle motion trajectory in the guide vane. As shown in Figure 15, when particles enter the guide vane from its inlet, their impact velocity increases with its motion distance. The impact velocity fluctuates within the guide vane. As the particles approach the guide vane outlet, their velocity significantly increases and fluctuates. Particularly at the outlet, the velocity reaches its maximum. At the same time, the erosion rate of sediment is linearly related to the impact velocity. The higher the impact velocity, the greater the erosion rate; however, at the outlet, the erosion rate shows considerable fluctuations, mainly due to the influence of vortices.

3.4. Limitations and Specific Situations

Due to the long-term nature of sediment erosion, it is difficult to effectively obtain wear data through experimental testing for numerical simulation verification. Therefore, this paper has certain limitations in experimental verification. However, the research methods and models used in this paper have been validated for wear morphology in engineering. Therefore, the predicted wear pattern in this paper is relatively reasonable.

4. Conclusions

In this paper, numerical prediction of solid–liquid two-phase flow was conducted on the overall erosion and local vortex-induced erosion characteristics of a Francis hydraulic turbine, and the following conclusions were drawn:
  • The erosion of the unit is mainly concentrated at the runner blade, the cone section of the draft tube, the inlet and outlet of the guide vanes, and clearances at the upper and lower ring. In these specific areas of the components, erosion is extremely severe, particularly at the clearances and the inlet and outlet edges of the runner blades.
  • Local poor flow has a negative influence on the overall erosion. The differences in flow patterns among various components correspond to the erosion distribution of the unit at the same location, indicating that local flow patterns affect the unit’s erosion. When water flows into the blade channel, the uneven distribution of velocity can lead to greater impact force on the blades in areas with higher local flow velocity, thereby exacerbating erosion.
  • The local vortex structure inside the turbine runner plays an important role in the erosion process of the blade surface. The locations where these vortices occur correspond to the areas of erosion. Vortices can alter the velocity distribution of the flow field and the trajectory of particles, leading to frequent erosion in the high impact areas of the blade surface, especially at the outlet of the runner and guide vane clearance.

Author Contributions

Conceptualization, X.S.; methodology, X.S.; software, J.W. (Jinliang Wang); validation, J.W. (Jinliang Wang); formal analysis, J.W. (Jiabing Wang); investigation, J.W. (Jiabing Wang); resources, X.S.; data curation, X.S.; writing—original draft preparation, X.S.; writing—review and editing, J.W. (Jinliang Wang); supervision, Z.W.; funding acquisition, X.S. All authors have read and agreed to the published version of the manuscript.

Funding

This research was funded by the Project of the complex erosion characteristics and specific influencing factor mechanism (WJZ-ZB-2022-027), National Natural Science Foundation of China (Grant number 52306042).

Data Availability Statement

The data that support the findings of this study are available from the corresponding author upon reasonable request.

Conflicts of Interest

The author Jiabing Wang was employed by Safety Supervision Department, Power Station Management Bureau, Y.R.WanjiazhaiWater Multi-purpose Dam Project Co., Ltd. The remaining authors declare that the research was conducted in the absence of any commercial or financial relationships that could be construed as a potential conflict of interest.

References

  1. Chen, X.; Cui, Y.; Zheng, Y.; Zhang, Y. Fatigue crack propagation simulation of vertical centrifugal pump runner using the extended finite element method. Mech. Adv. Mater. Struct. 2023, 31, 4586–4600. [Google Scholar] [CrossRef]
  2. Shen, Z. Erosion Erosion on Runner of Double-Suction Centrifugal Pump due to Sediment Flow. J. Appl. Fluid Mech. 2020, 13, 1131–1142. [Google Scholar]
  3. Bandi, S.; Banka, J.; Kumar, A.; Rai, A.K. Effects of sediment properties on abrasive erosion of a centrifugal pump. Chem. Eng. Sci. 2023, 277, 118873. [Google Scholar] [CrossRef]
  4. El-Emam, M.A.; Zhou, L.; Yasser, E.; Bai, L.; Shi, W. Computational Methods of Erosion Wear in Centrifugal Pump: A State-of-the-Art Review. Arch. Comput. Methods Eng. 2022, 29, 3789–3814. [Google Scholar] [CrossRef]
  5. Fetrati, M.; Pak, A. Numerical simulation of sanding using a coupled hydro-mechanical sand erosion model. J. Rock Mech. Geotech. Eng. 2020, 12, 811–820. [Google Scholar] [CrossRef]
  6. Gautam, S.; Acharya, N.; Lama, R.; Chitrakar, S.; Neopane, H.P.; Zhu, B.; Dahlhaug, O.G. Numerical and experimental investigation of erosive wear in Francis runner blade optimized for sediment laden hydropower projects in Nepal. Sustain. Energy Technol. Assess. 2022, 51, 101954. [Google Scholar] [CrossRef]
  7. Gautam, S.; Neopane, H.P.; Acharya, N.; Chitrakar, S.; Thapa, B.S.; Zhu, B. Sediment erosion in low specific speed francis turbines: A case study on effects and causes. Wear 2020, 442–443, 203152. [Google Scholar] [CrossRef]
  8. Song, X.; Yao, R.; Shen, Y.; Bi, H.; Zhang, Y.; Du, L.; Wang, Z. Numerical Prediction of Erosion Based on the Solid-Liquid Two-Phase Flow in a Double-Suction Centrifugal Pump. J. Mar. Sci. Eng. 2021, 9, 836. [Google Scholar] [CrossRef]
  9. Pang, J.; Liu, H.; Liu, X.; Yang, H.; Peng, Y.; Zeng, Y.; Yu, Z. Study on sediment erosion of high head Francis turbine runner in Minjiang River basin. Renew. Energy 2022, 192, 849–858. [Google Scholar] [CrossRef]
  10. Aponte, R.; Teran, L.; Grande, J.; Coronado, J.; Ladino, J.; Larrahondo, F.; Rodríguez, S. Minimizing erosive wear through a CFD multi-objective optimization methodology for different operating points of a Francis turbine. Renew. Energy 2020, 145, 2217–2232. [Google Scholar] [CrossRef]
  11. Tiwari, G.; Kumar, J.; Prasad, V.; Patel, V.K. Derivation of cavitation characteristics of a 3MW prototype Francis turbine through numerical hydrodynamic analysis. Mater. Today Proc. 2020, 26, 1439–1448. [Google Scholar] [CrossRef]
  12. Wang, L.; Li, B.; Zhao, W. Dynamics and Wear Analysis of Hydraulic Turbines in Solid-liquid Two-phase Flow. Open Phys. 2019, 17, 790–796. [Google Scholar] [CrossRef]
  13. Noon, A.A.; Kim, M.H. Erosion wear on Francis turbine components due to sediment flow. Wear 2017, 378–379, 126–135. [Google Scholar] [CrossRef]
  14. Energy; New Energy Study Findings Have Been Reported by Researchers at National Institute of Technology (A Methodology for Assessment of Erosive SE on a Francis Turbine Runner). Energy Weekly News, 2017. Available online: https://www.sciencedirect.com/science/article/abs/pii/S0360544216315407 (accessed on 23 February 2025).
  15. Chhetry, B.; Rana, K. Effect of Sand Erosion on Turbine Components: A Case Study of Kali Gandaki “A” Hydroelectric Project (144 MW), Nepal. Hydro Nepal J. Water Energy Environ. 2015, 17, 24–33. [Google Scholar] [CrossRef]
  16. Koirala, R.; Thapa, B.; Neopane, H.P.; Zhu, B.; Chhetry, B. Sediment erosion in guide vanes of Francis turbine: A case study of Kaligandaki Hydropower Plant, Nepal. Wear 2016, 362–363, 53–60. [Google Scholar] [CrossRef]
  17. Xin, L.; Li, Q.; Li, Z.; Xie, G.; Wang, Q. Analysis of Runner Dynamics of Reversible Hydraulic Turbine by Alternating Fluid–Solid Action. Front. Energy Res. 2022, 10, 943339. [Google Scholar] [CrossRef]
  18. Han, W.; Kang, J.; Wang, J.; Peng, G.; Li, L.; Su, M. Erosion estimation of guide vane end clearance in hydraulic turbines with sediment water flow. Mod. Phys. Lett. B 2018, 32, 69–73. [Google Scholar] [CrossRef]
  19. Guangjie, P.; Zhengwei, W.; Yexiang, X.; Yongyao, L. Abrasion predictions for Francis turbines based on liquid–solid two-phase fluid simulations. Eng. Fail. Anal. 2013, 33, 327–335. [Google Scholar] [CrossRef]
  20. Mamazhonov, M.; Shakirov, B.; Matyakubov, B.; Makhmudov, A. Polymer materials used to reduce waterjet erosion of pump parts. J. Phys. Conf. Ser. 2022, 2176, 328–333. [Google Scholar] [CrossRef]
  21. Serrano, R.O.P.; Santos, L.P.; de Faria Viana, E.M.; Pinto, M.A.; Martinez, C.B. Case study: Effects of sediment concentration on the wear of fluvial water pump runners on Brazil’s Acre River. Wear 2018, 408–409, 131–137. [Google Scholar] [CrossRef]
  22. Pan, J.; Pan, Y.; Liu, Q.; Yang, S.; Tao, R.; Zhu, D.; Xiao, R. FED evaluation in a small double-suction reversible pump turbine considering sediment erosion. J. Energy Storage 2024, 76, 653–661. [Google Scholar] [CrossRef]
  23. Wang, X.; Lu, Y.; Zhu, R.; Fu, Q.; Yu, H.; Chen, Y. Study on bidirectional fluid-solid coupling characteristics of reactor coolant pump under steady-state condition. Nucl. Eng. Technol. 2019, 51, 1842–1852. [Google Scholar] [CrossRef]
  24. Cao, J.; Luo, Y.; Presas, A.; Mao, Z.; Wang, Z. Numerical analysis on the modal characteristics of a pumped storage unit runner in cavitating flow. J. Energy Storage 2022, 56, 286–295. [Google Scholar] [CrossRef]
  25. Cruzatty, C.; Jimenez, D.; Valencia, E.; Zambrano, I.; Mora, C.; Luo, X.; Cando, E. A Case Study: Sediment Erosion in Francis Turbines Operated at the San Francisco Hydropower Plant in Ecuador. Energies 2021, 15, 8. [Google Scholar] [CrossRef]
  26. Song, X.; Luo, Y.; Wang, Z. Mechanism of the influence of sand on the energy dissipation inside the hydraulic turbine under sediment erosion condition. Energy 2024, 294, 130794. [Google Scholar] [CrossRef]
Figure 1. Physical picture of turbine erosion on site.
Water 17 01234 g001
Figure 2. Numerical simulation geometric model.
Water 17 01234 g002
Figure 3. Grid model of the simulation model.
Water 17 01234 g003
Figure 4. Efficiency of turbine with different grid numbers.
Water 17 01234 g004
Figure 5. Distribution of erosion rates of different components in the unit.
Water 17 01234 g005
Figure 6. Total erosion rate and maximum particle impact velocity of different components.
Water 17 01234 g006
Figure 7. Three-dimensional flow field distribution of the entire flow channel of the unit.
Water 17 01234 g007
Figure 8. Longitudinal section distribution diagram of the runner center.
Water 17 01234 g008
Figure 9. Velocity distribution at different planes of the runner and real erosion on site.
Water 17 01234 g009
Figure 10. Vortex flow and erosion in the runner channel.
Water 17 01234 g010
Figure 11. Particle motion trajectory inside the runner.
Water 17 01234 g011
Figure 12. Vortex accelerated erosion zone at the lower ring of the runner.
Water 17 01234 g012
Figure 13. Vortex flow and erosion in the draft tube.
Water 17 01234 g013
Figure 14. Velocity distribution of seat ring end face and real erosion on site.
Water 17 01234 g014
Figure 15. Trajectory of particles and sediment erosion in the guide vane and seat ring.
Water 17 01234 g015
Figure 16. Analysis of particle trajectories at impact velocity.
Water 17 01234 g016
Figure 17. Particle impact velocity and sediment erosion rate along the particle motion trajectory in the guide vane.
Water 17 01234 g017
Table 1. Specific designing parameters of the unit.
ParametersUnitValue
Design headm66.15
Maximum head m80.0
Minimum head m50.0
Rated flow m3/s290.7
Rated head m68.0
Rated power MW183.7
Rotational speedr/min100
Diameter of the runner inlet m4.3
Number of runner blades(-)9
Number of guide vane blades(-)21
Number of stay vane blades(-)20
Disclaimer/Publisher’s Note: The statements, opinions and data contained in all publications are solely those of the individual author(s) and contributor(s) and not of MDPI and/or the editor(s). MDPI and/or the editor(s) disclaim responsibility for any injury to people or property resulting from any ideas, methods, instructions or products referred to in the content.

