Article

Resilience Assessment of Irrigation District Infrastructure: Indicators, Modeling, and Empirical Application

1
Construction Management Bureau of Zhaokou Yellow Diversion Irrigation District Phase II Project in Henan Province, Kaifeng 475004, China
2
School of Architecture and Built Environment, Deakin University, Geelong, VIC 3220, Australia
3
School of Management, Zhengzhou University, Zhengzhou 450001, China
*
Author to whom correspondence should be addressed.
Water 2025, 17(8), 1214; https://doi.org/10.3390/w17081214
Submission received: 17 March 2025 / Revised: 12 April 2025 / Accepted: 17 April 2025 / Published: 18 April 2025
(This article belongs to the Special Issue Sustainable Water Management in Agricultural Irrigation)

Abstract

:
In the context of intensifying climate and environmental changes, the high resilience of irrigation district infrastructure is of crucial importance for sustainable agriculture and water security. This paper proposes a resilience assessment indicator system for irrigation district infrastructure, comprising 23 indicators from the four dimensions of foresight capacity, absorption capacity, restoration capacity, and adaptive and learning capacity. This system is constructed by combining the research status quo at home and abroad with the change process of the resilience function. The model was constructed using the DEMATEL-ANP-Cloud method, and the Zhaokou Irrigation District in China was used as a case study to demonstrate the model’s application. The resilience analysis was conducted, and targeted strategies for enhancing resilience were proposed. The resilience assessment model constructed in this study provides a scientific basis for the resilience assessment of irrigation district infrastructure and a reference point for similar projects in terms of risk reduction and system resilience improvement. This is of great significance for guaranteeing sustainable agriculture and water security.

1. Introduction

Irrigation districts serve as the core unit of the agricultural productivity system, with their infrastructure (including irrigation canals, pump stations, water storage facilities, and supporting management systems) playing an irreplaceable, strategic role in ensuring food security and maintaining sustainable agricultural development. According to statistics from the Food and Agriculture Organization of the United Nations, 40% of global food production originates from irrigated agricultural areas that account for only 20% of arable land [1], highlighting the crucial support provided by irrigation infrastructure for agricultural productivity. However, climate change has led to a significant increase in the frequency and intensity of extreme weather events (e.g., droughts, floods) [2], which directly threatens the ability of irrigation districts to mobilize water resources. One analysis shows that climate change has reduced global agricultural total factor productivity by 21 percent since 1961 [3]. Concurrently, irrigation district infrastructures are confronting challenges related to aging on a global scale. In China, for example, about 40% of large irrigation districts and more than 50% of small and medium-sized irrigation districts suffer from incomplete facilities and functional degradation [4], leading to reduced irrigation water use efficiency and decreased water productivity. This compound risk poses a severe threat to the production stability of global irrigated farmland, subsequently impacting food security and sustainable socio-economic development. Therefore, it is crucial to conduct a scientific and effective assessment of the operational status of irrigation districts to enhance the stability and adaptability of their infrastructure.
Resilience theory provides an innovative perspective for addressing complex system risk issues. Since Holling [5] introduced the concept of ecological resilience, its scope has expanded to include multiple dimensions such as engineering resilience [6] and socio-ecological resilience [7]. In the field of water conservancy, the United Nations Sendai Framework for Disaster Risk Reduction [8] established basic principles for assessing the resilience of infrastructure. Recent research has focused on operationalizing resilience indicators. For example, Li et al. [9] constructed a Water Resource System Resilience (WRSR) assessment framework that considers factors such as water resources, socio-economics, and the ecological environment. Pahl et al. [10] conducted a comprehensive comparative analysis of governance and management systems for watershed water system resilience for the first time. It is noteworthy that the majority of extant studies concentrate on urban or watershed scales. However, there is some research on resilience analysis in irrigation studies, such as drought resilience in irrigated agriculture [11,12], sustainable irrigation performance [13], climate-adapted irrigation [14], and spatial and temporal characterization of the resilience of water resource systems in irrigation districts [15]. Nevertheless, specialized assessment frameworks for irrigation district resilience remain inadequate [16].
The development of resilience concepts offers a practical framework for preventing and mitigating the impacts of various shocks faced by current irrigation districts [17]. However, its application to irrigation infrastructure in irrigation districts still faces systematic obstacles. Specifically, current research on irrigation district resilience faces three primary challenges. Firstly, there are limitations in the assessment system. Previous studies assessing the resilience of irrigation infrastructure in irrigation districts have failed to clearly define the multidimensional connotations of resilience in the context of irrigation districts. They lack a comprehensive and systematic assessment framework, often employing relatively simple or one-sided indicator systems that focus only on certain aspects of resilience, such as the robustness of physical facilities and the efficiency of water resource management, while ignoring other equally important dimensions like foresight and absorptive capacity. Secondly, there are inadequacies in quantification methods. Existing research lacks an assessment model that effectively integrates multiple indicators and comprehensively considers the impacts of various factors, which may result in imprecise assessments and fail to accurately reflect the true level of resilience in irrigation infrastructure. Thirdly, there is a lack of case studies. Although some studies have attempted to assess the resilience of specific irrigation districts, these studies often lack in-depth and detailed case analyses, failing to fully reveal the issues and challenges related to the resilience of irrigation infrastructure and propose targeted and operable improvement measures.
In light of the aforementioned extant problems, the objective of this paper is to establish a framework for assessing the resilience of irrigation district infrastructure. To this end, a feasible assessment model is to be constructed by studying the key indicators affecting the resilience of irrigation district infrastructure. This will enable accurate assessment of the resilience level of the target irrigation districts and the identification of effective improvement measures. Firstly, an assessment system containing four primary indicators (foresight capacity, absorptive capacity, recovery capacity, and adaptive and learning capacity) and twenty-three secondary indicators is developed. Secondly, a resilience assessment model is constructed for resilience quantification based on the DEMATEL-ANP-Cloud modeling methodology. Lastly, a resilience analysis of a typical irrigation district in North China is carried out by applying the above model as a case study, and a targeted toughness enhancement strategy is proposed.
This study makes a significant contribution to the field of resilience assessment for irrigation infrastructure by introducing theoretical, methodological, and practical advances. From a theoretical standpoint, this study proposes a novel four-dimensional framework encompassing foresight capacity, absorptive capacity, recovery capacity, and adaptive and learning capacity. It also establishes a system of 23 quantifiable indicators, facilitating multilevel coupling of “hardware facility—management process—learning mechanism”. This framework provides a theoretical tool for analyzing the response mechanism of the system to the dual challenges of climate change and facility aging. The methodology employs a hybrid DEMATEL-ANP-Cloud modeling approach, which overcomes the limitations of static assessment by revealing non-linear causal relationships and establishing a replicable paradigm for complex infrastructure diagnosis. The operational value of the framework is demonstrated by identifying key resilience bottlenecks and validating optimization strategies through a case study of the Zhaokou Irrigation District. Moreover, by aligning with Sustainable Development Goals 2 and 13, this study provides a systematic framework for “assessing and optimizing decision-making” to enhance global agro-climatic adaptation.

2. Materials and Methods

The research framework of this paper is illustrated in Figure 1. Initially, following the clarification of the assessment dimensions, the assessment indicators of irrigation district infrastructure resilience are obtained based on a thorough literature review. Subsequently, taking into account the irrigation district infrastructure resilience situation, the characteristics of the constructed indicator system, and the features of various assessment methods, an irrigation district infrastructure resilience assessment model is developed. This model is based on the DEMATEL-ANP-Cloud modeling method. The validity of the proposed method is substantiated through its empirical assessment using a case study of the Zhaokou Irrigation District in northern China.

2.1. Development of Assessment Indicators for Resilience of Irrigation District Infrastructure

Given the multidimensional nature of the assessment of toughness, this paper proposes an objective method for evaluating the toughness of irrigation district infrastructure. The proposed method is based on existing research and combines the change process of irrigation district infrastructure toughness, clarifies the key measurement dimensions of toughness assessment, and constructs an applicable irrigation district infrastructure toughness assessment indicator system.
Ouyang et al. [18] defined infrastructure resilience as the combined ability of an infrastructure system to resist (prevent and withstand) any possible hazards, absorb the initial damage, and return to normal operations. In regard to the category of infrastructure, the resilience of irrigation district infrastructure signifies the dynamic process in which the irrigation district infrastructure system undergoes shock impacts and then gradual recovery after being exposed to various unpredictable natural hazards, man-made disturbances, or other emergencies [19]. The assessment of irrigation district infrastructure resilience can be decomposed into four dimensions: foresight capacity, absorptive capacity, recovery capacity, and adaptive and learning capacity (e.g., Figure 2).
Foresight capacity is defined as the ability to identify potential hazards and disruptions in advance and to minimize the probability of damage to irrigation infrastructure through preparation and planning based on scientific analysis and risk prediction tools. This is equivalent to pre-event capacity, which is defined as the ability to anticipate adverse conditions in order to take measures to protect infrastructure assets from damage and service disruption.
The second capacity, absorptive capacity, is defined as the ability of an irrigation district infrastructure system to withstand and ride out the effects of a disturbance or disaster by resisting disruption or interruption of service for a brief period. Absorptive capacity reflects the extent to which the irrigation district infrastructure system is able to absorb the effects of system disturbance and minimize the consequences with minimal effort.
The third component is recovery capacity, defined as the ability of an irrigation district infrastructure system to repair damage, restore service interruptions, and recover from losses caused by the impact of shock or disturbance. This includes service restoration and emergency restoration.
The fourth component, adaptive and learning capacity, signifies the capacity of an irrigation district infrastructure system to respond to disruptions and shocks by altering, adapting, and reorganizing the system. It further denotes the system’s ability to learn from past disruptions, representing an ex-post process that involves continuous improvement through innovation, policy refinement, and lessons learned. This capacity to learn and evolve enhances the system’s ability to respond to future challenges.
Based on an extensive collection and screening of the relevant literature, this paper extracts specific indicators related to the four assessment dimensions of foresight capacity (A), absorptive capacity (B), recovery capacity (C), and adaptive and learning capacity (D), and tentatively categorizes and arranges the extracted indicators to form an assessment indicator system for the resilience of irrigation district infrastructure, which is shown in Table 1.

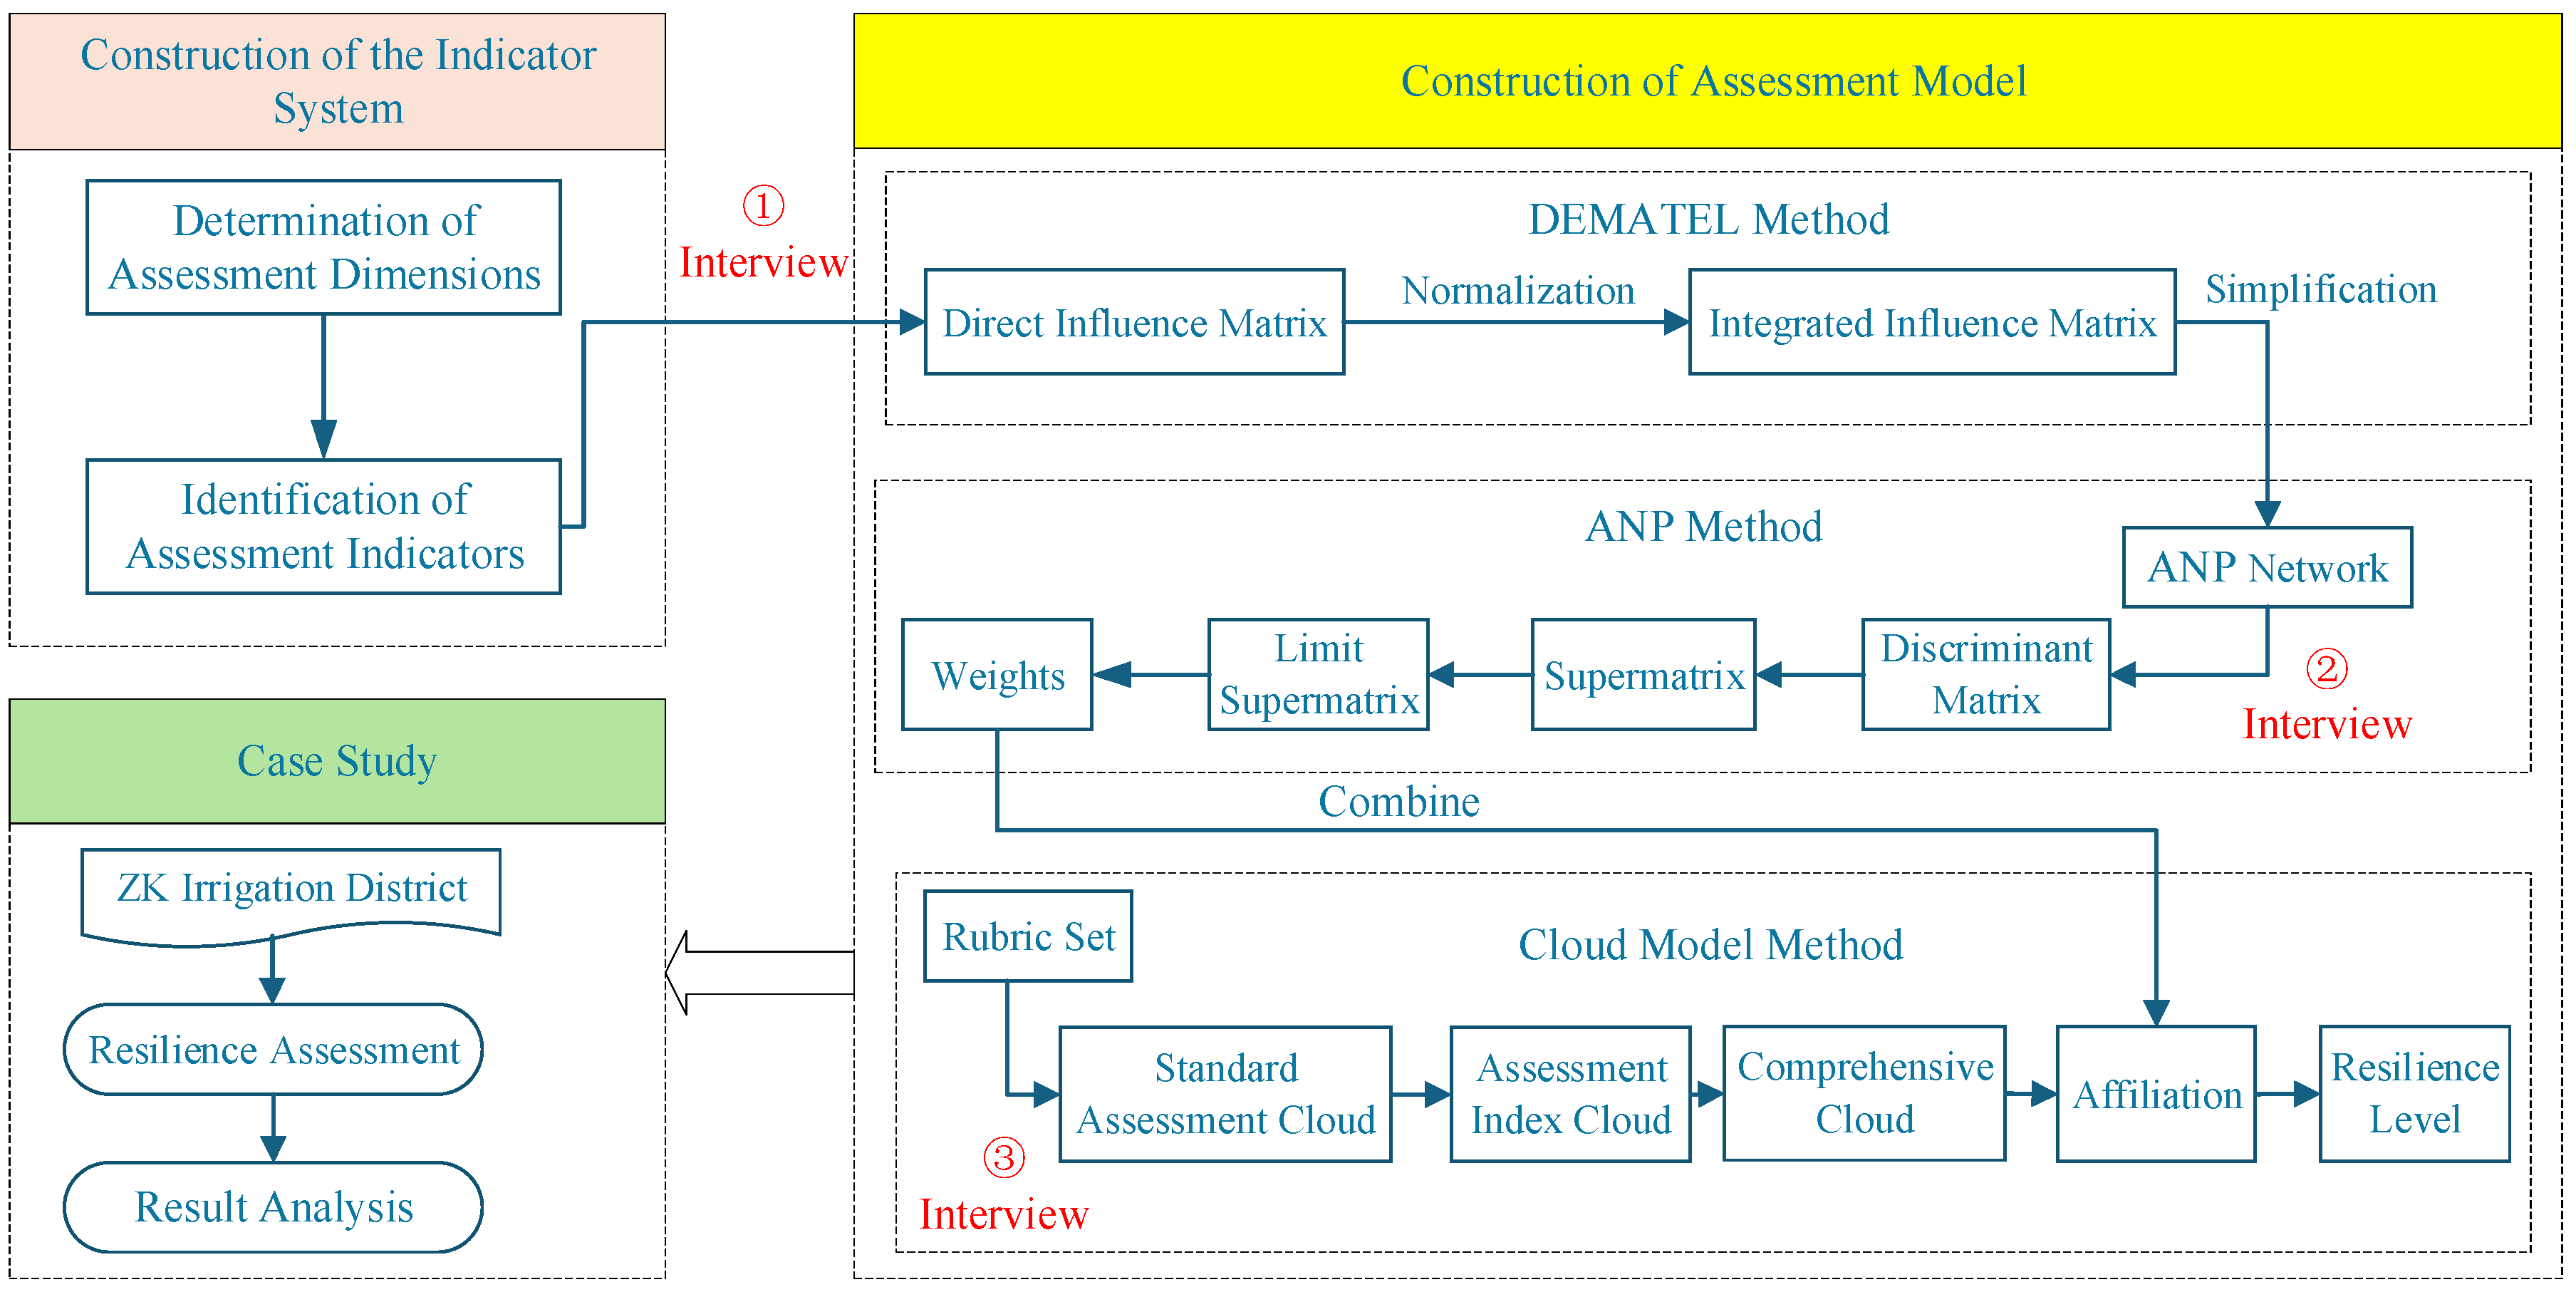
2.2. Modeling Resilience Assessment of Irrigation District Infrastructure

In this study, the integrated DEMATEL-ANP-Cloud modeling approach is selected for irrigation district infrastructure resilience assessment, mainly based on the following three considerations. Firstly, the assessment of irrigation district resilience entails the non-linear interaction of multidimensional indicators, which poses a significant challenge in analysis with the conventional single method. DEMATEL, through the calculation of degree of centrality and causality, is capable of identifying pivotal driving factors such as foreseeability and resilience, thereby elucidating the hierarchical relationship between the indicators. Additionally, the ANP facilitates the construction of a networked weighting system, which quantifies the dependency feedback between the indicators, thus circumventing the limitations inherent in the assumptions of independence in the AHP method. Secondly, the presence of data ambiguity and cognitive uncertainty in resilience assessment is addressed. The cloud model transforms qualitative evaluation into quantitative cloud droplets through the inverse cloud generator, thereby solving the problem of solidifying the affiliation function of traditional fuzzy evaluation. The integration of these three models enables a comprehensive analysis of the “causality identification—network weight allocation—fuzzy quantitative evaluation” chain, a process that is particularly well suited for the multi-level, non-linear, and uncertain resilience assessment needs of irrigation districts. This approach provides a scientific foundation for the precise enhancement of the disaster-resistant capacity of facilities.

2.2.1. DEMATEL Method

DEMATEL is a method that utilizes expert knowledge and experience to construct a direct influence matrix between indicators in a system. It then determines the mutual influence relationship and degree of influence between each indicator. This method is particularly well suited to complex systems. The calculation steps are as follows.
Step 1: Establishment of direct influence matrix. In order to reflect the differences between different assessment objects in a more detailed way, this study divides the degree of mutual influence between the indicators into nine levels. It also carries out the design of the questionnaire and then invites experts from the fields of water conservancy engineering. The elements are then compared two by two according to their degree of influence, and the factors are obtained as the direct influence matrix M after the comparison of the degree of influence. This process can be seen in Equation (1) shown below.
M = 0 X 12 X 1 n X 21 0 X 2 n X n 1 X n 2 0
In the above equation, n denotes the number of elements constituting the irrigation infrastructure resilience assessment system, while Xij signifies the extent to which element Xi exerts influence on element Xj. It is noteworthy that all diagonal values are set to 0 in the matrix, as the influence of any element on itself is deemed invalid.
Step 2: Normalization of direct influence matrix. The normalization coefficient λ is calculated using Equation (2), and then the matrix M is normalized by Equation (3) and noted as N.
λ = min 1 max 1 i n j = 1 n X i j , 1 max 1 j n i = 1 n X i j
N = λ M
Step 3: Calculate the integrated influence matrix. Limit processing is performed according to Equation (4) to calculate the integrated influence matrix T.
T = ( t i j ) n × n = lim t ( N + N 2 + + N T ) = N ( I N ) 1
In the above equation, tij denotes the degree of combined influence of risk indicator Xi on risk indicator Xj, and I is the unit matrix.
Step 4: Simplification of the comprehensive influence matrix. In this paper, the relationship between the indicators with a low influence degree in the resilience assessment indicator system of the irrigation district will be disregarded. Furthermore, the relatively unimportant influence relationships in the comprehensive influence matrix T in the DEMATEL stage will be filtered out by establishing a reasonable threshold θ, and subsequently we will obtain the simplified comprehensive influence matrix T′ as depicted in Equation (5). The value of θ can be determined by experts and can also be taken as the standard deviation of the matrix or the weighted average value.
T = 0 , & t i j < θ t i j , & t i j θ

2.2.2. ANP Method

The ANP has been demonstrated to be a superior methodology for resolving coupling issues among system components [35]. Within the ANP framework, the system’s composition is segmented into a control layer and a network layer. The primary function of the control layer is to direct the system toward the achievement of its stated objectives and to adhere to the established guidelines. This layer is guided by the objective elements. In contrast, the network layer is influenced by all the control layers, thereby facilitating interaction among elements and layers to create a complex network structure with circular feedback properties.
Step 1: Construction of network architecture diagram. Based on the comprehensive influence matrix T′ that has been obtained, the elements with greater influence are the control layer elements, and the elements with a greater degree of cause are the network layer factors, which in turn can establish the ANP network structure of the irrigation district infrastructure resilience assessment system.
Step 2: Construction of discriminant matrix. On the basis of the ANP network structure, experts are invited to compare the importance of the network layer elements to the control layer elements (objectives) through a questionnaire. The importance assessment indicators use nine levels of criteria from 1 (equally important) to 9 (extremely important), expressed as Vij. Subsequently, the arithmetic mean method is employed to integrate multiple comparison matrices of each expert into a pairwise discriminant matrix V (see Equation (6)).
V = v i j n × n = 1 v 12 v 1 n v 21 1 v 2 n v n 1 v n 2 1
where vij = 1/vji (i, j = 1, 2, 3, ……, n).
Step 3: Supermatrix computation. This process entails deriving the normalized eigenvector w j 1 ( i k ) , w j 2 ( i k ) , , w j l ( i k ) , , w j m ( i k ) T , which serves as the network layer sorting vector, and w j m ( i k ) = 1 . Subsequent repetitions of the aforementioned steps yield the following influence matrix, Wij:
W i j = w i 1 j 1 w i 1 j 2 w i 1 j n w i 2 j 1 w i 2 j 2 w i 2 j n w i n j 1 w i n j 2 w i n j n
where the column vector denotes the degree to which each element in Xi exerts influence over each element in Xj. In the absence of influence, Wij is equivalent to 0, thereby yielding the unweighted supermatrix W .
W = w 11 w 12 w 1 n w 21 w 22 w 2 n w n 1 w n 2 w n n
In the event that the unweighted supermatrix does not satisfy the normalization, it becomes imperative to normalize each column of the unweighted matrix and to assign a weighting to the degree of influence between the various indicator layers. Through this process, the weighting matrix G can be obtained.
G = g 11 g 12 g 1 n g 21 g 22 g 2 n g n 1 g n 2 g n n
The process of weighting the unweighted supermatrix W results in the weighted supermatrix W ¯ = G W = ( g i j w i j ) .
Step 4: Calculation of indicator weights. The weighted supermatrix is stabilized so that W ¯ is self-multiplied many times, and the product will converge when it is self-multiplied 4–6 times; if W = lim W t t exists, at this time the limit supermatrix can be obtained, and the elements of this matrix are the weights ω of each element.
Due to the large number of ANP calculations and the complexity of processing, the judgment matrices in the actual assessment are computed using the Super Decisions decision-making software (Version 3.2 for Windows) tool. Each importance judgment matrix is entered into the Super Decisions software, and the software performs a consistency test (CR < 0.1 for validity) on each importance judgment matrix as it is entered. After all of the matrices are entered, the software finds the marginal supermatrix and, according to the elements of each row of the marginal supermatrix, obtains the indicator weight ω of each element.

2.2.3. Cloud Model

The cloud model is a theoretical model that realizes the mutual transformation between qualitative concepts and quantitative values through a cloud generator. Its inputs are the numerical eigenvalues ( E x , E n , H e ) representing the qualitative concepts and the number of cloud drops Z, and its outputs are the exact position of z cloud drops in space and the certainty of the qualitative concepts represented by the cloud drops. Here, E x is the expected value, which determines the exact location of the cloud map. E n denotes the entropy, which describes the degree of ambiguity of the sample, i.e., the degree of discretization of the cloud droplets. H e denotes the hyperentropy, which is used to measure the uncertainty of the entropy and reflects the degree of condensation of the cloud droplets. The steps to evaluate the resilience of irrigation district infrastructure based on the cloud model are as follows.
Step 1: Determine the rubric set. Through the collection and analysis of related literature, based on the research of Maurya et al. [36], and combined with the resilience assessment indicators constructed in this paper and the actual situation of the irrigation district infrastructure resilience level with a linear scale, we achieve the construction of the rubric set V = (I, II, III, IV, V) and the use of the ten-point system for the indicator level, where no resilience is [0, 3), low resilience is [3, 5), medium resilience is [5, 7), higher resilience is [7, 8), and high resilience is [8, 10].
Step 2: Generate standard assessment cloud. The standard assessment cloud is mainly used for level assessment. There are bilateral constraints [ V min , V m a x ] on the value of each assessment level, where V m a x and V m i n represent the upper and lower limits of an indicator in the corresponding assessment level. The assessment intervals are generated by the upper and lower boundary equidistant spacing method, and then the assessment level standard cloud of each assessment indicator is generated by the normal cloud generator. The numerical eigenvalues of the standard cloud can be obtained according to the following Equation (7).
E x = ( V max + V min ) 2 E n = ( V max V min ) 2.3548 H e = k
In the above equation, k is the assumed value, which is set to 0.1 in this paper.
Step 3: Calculation of assessment indicator cloud parameters. The assessment level of each indicator is determined by inviting experienced experts to score according to the relevant assessment standards and characterization indicators. The scoring results of the experts are then integrated, with reference to Equation (8). The cloud digital eigenvalues of each assessment indicator of the resilience of the irrigation district infrastructure are then calculated with the help of the inverse cloud algorithm.
E x i = X ¯ = 1 n i = 1 n x i j E n i = π 2 1 n i = 1 n x i j E x i ,     j = 1 , 2 , m H e i = S 2 E n i 2
In the above equation, x i j denotes the rating assigned by the ith expert to the jth indicator, n signifies the total number of experts, and m represents the number of indicators.
Step 4: Calculation of comprehensive cloud parameters and generation of assessment cloud maps. Utilizing the assessment cloud and indicator weights, as outlined in Equation (9), the comprehensive calculation is obtained. This comprehensive cloud offers a graphical representation of the assessment outcomes, providing a clear depiction of the resilience of the irrigation district infrastructure. To generate the assessment cloud diagram, the number of cloud drops is set to 2000.
E x = E x 1 w 1 + E x 2 w 2 + + E x n w n w 1 + w 2 + + w n E n = E n 1 w 1 2 + E n 2 w 2 2 + + E n n w n 2 w 1 2 + w 2 2 + + w n 2 H e = H e 1 w 1 2 + H e 2 w 2 2 + + H e n w n 2 w 1 2 + w 2 2 + + w n 2
Step 5: Determination of the rank affiliation of each indicator. In the event that the assessment indicator is assigned the value of x 0 , the X condition cloud generator can be utilized to solve its affiliation degree r i j under the assessment of a certain level. The method involves conceptualizing the value of each indicator to be evaluated, x 0 , as a cloud droplet. Subsequently, a random number E n satisfying a normal distribution with E x as the expectation and H e as the standard deviation is to be generated. Then, x 0 and the degree of affiliation r ( x 0 ) of this normal cloud satisfy Equation (10).
r ( x 0 ) = e ( x 0 E x ) 2 2 ( E n ) 2
In order to enhance the precision of the process, the affiliation r ( x 0 ) among the generated N cloud droplets is calculated as the mean value according to Equation (11). This value is designated as the final affiliation X. Consequently, the initial affiliation matrix R can be formulated.
To enhance the precision, the mean value of the affiliation r ( x 0 ) in the generated Z cloud droplets is considered the ultimate affiliation r i j , as depicted in Equation (11). Consequently, the initial affiliation matrix R [ r i j ] can be formulated.
r i j = r ¯ ( x 0 )
Step 6: Calculation of resilience assessment level. Following the acquisition of the affiliation degree R of each indicator via the cloud model and subsequent utilization of the weight matrix ω that has been derived, the fuzzy transformation of the two can be constructed as a comprehensive affiliation matrix L = ( l 1 , l 2 , l 3 , l 4 , l 5 ) , as outlined in Equation (12).
l j = i = 1 n ω i r i j j = 1 , 2 , 3 , 4 , 5
In accordance with the principle of maximum affiliation, if l j denotes the maximum value, it can be deduced that the resilience assessment level of the irrigation district corresponds to the level indicated by l j , that is to say, the final resilience level of the irrigation district.

2.3. Empirical Case Study

2.3.1. Expert Survey Approach for Data Collection

To obtain data for the assessment of the resilience of irrigation district infrastructure, this study was conducted using the expert survey method. A total of 16 experts from directly related fields, including water conservancy engineering, agricultural management, and environmental protection, were invited to participate in the study. The basic information of these experts is shown in Table 2. The majority of these experts possess extensive experience in the field or hold senior positions, thereby ensuring a high level of expertise in the design, functionality, vulnerability, and environmental interactions of irrigation district facilities. Three rounds of expert interviews were conducted in this study, and the quantitative assessments of the experts on the degree of influence between indicators, the ANP discriminant matrix, and cloud model assessment indicators at all levels were successively collected by questionnaires. The basic information of the experts is shown in Table 2.

2.3.2. Study Area

This paper utilizes the Zhaokou (ZK) Irrigation District in northern China as a case study. It employs the irrigation district infrastructure resilience assessment model developed in a previous paper to conduct a comprehensive resilience assessment for selected case irrigation districts. The objective of this assessment is to evaluate the practical applicability of the assessment model. The ZK Irrigation District is situated on the southern bank of the Yellow River in Henan Province, central China, within the East Henan Plain area, encompassing key zones within the primary grain production region. The district covers an area of 6341 km2. As a critical component of agricultural irrigation and water resource management, the ZK Irrigation District boasts a sophisticated hydraulic engineering system, comprising large reservoirs, water conveyance channels, water transfer stations, and pumping stations. The objective of this study is to assess the current level of resilience of the ZK Irrigation District infrastructure and to identify key areas to enhance its resilience.

3. Empirical Application

3.1. Recognition of Influencing Relationships Among Assessment Indicators

The initial questionnaire survey, administered to a cohort of 16 experts, served as the foundation for this study. It sought to ascertain the quantitative ratings of the experts on the degree and direction of influence between indicators. To aggregate the ratings of each expert, the arithmetic mean method was employed, thereby calculating the value of the interactions between the primary indicators. The specific outcomes are delineated in Table 3.
From the assessment data outlined above, the direct influence matrix M, the maximum eigenvalue λ , and the direct matrix N of primary indicators of the resilience of the irrigation district infrastructure can be obtained according to Equations (1)–(3), respectively. Then, based on Equation (4), limit processing of N is carried out, and the comprehensive influence matrix T is calculated. In order to make the results more representative, the overall situation of the irrigation district is taken into consideration, and based on the opinions of experts, the method of combining statistical distribution is determined. The threshold value is determined to be 0.916, which means that relationships in T with a value less than 0.916 are to be excluded, and only those relationships with a degree of influence greater than 0.916 are to be considered. The final comprehensive influence matrix T is then obtained through threshold processing according to Equation (5).
T = 0.000 1.296 1.391 1.184 0.000 0.000 1.219 0.986 0.000 1.048 0.973 1.067 1.029 1.347 1.496 1.043
As demonstrated in the above combined influence matrix T , foresight capacity exerts a significant influence on the remaining three indicators, particularly in regard to absorptive capacity (1.296) and resilience (1.391). In addition, adaptive capacity and learning capacity also have an impact on foresight capacity. Conversely, the effect of absorptive capacity and resilience on anticipatory capacity is less substantial, to the extent that it can be considered negligible.
Furthermore, the comprehensive influence matrix of the secondary assessment indicators can be obtained using Equations (1)–(4) to lay the foundation for the subsequent stage of the analysis, which will not be repeated here.

3.2. Determination of Assessment Indicator Weights

The comprehensive influence matrix, derived by using the DEMATEL method in Section 3.1, is then used to construct the ANP network structure. The discriminant matrix is subsequently obtained through the second questionnaire survey of 16 experts, and the data from this survey are then employed to construct the discriminant matrix. These data are then imported into the Super Decisions software, an ANP analysis tool, to calculate the limiting supermatrix. This can then be collated to obtain the weights of indicators for the assessment of the resilience of the infrastructure of irrigation districts and the ranking of the results. The results are shown in Table 4 below.
As illustrated in Table 4 above, among the primary indicators of the resilience assessment system for irrigation infrastructure, absorptive capacity (weight 0.354) emerges as the predominant indicator, followed by recovery (weight 0.255) and foresight (weight 0.248). Adaptive and learning capacity (weight 0.144) exhibits a comparatively less significant role.
Among the secondary assessment indicators, B1 (structural stability of irrigation district facilities), B6 (maintenance and renewal of irrigation district facilities), A1 (risk identification and assessment capacity), C1 (speed of post-disaster reconstruction and recovery), B2 (redundancy of irrigation district systems), and B4 (emergency response mechanism), which are ranked in the top six indicators, have weights greater than 0.05, indicating that they are the most critical factors affecting irrigation district resilience. In irrigation district management, priority should be given to optimizing and adjusting these factors to better improve the resilience of irrigation district infrastructure.

3.3. Results of Resilience Assessment of Irrigation Infrastructure

3.3.1. Determination of Standard Assessment Cloud

The standard assessment cloud numerical eigenvalues can be obtained through Equation (7) based on the constructed assessment levels, as demonstrated in Table 5.

3.3.2. Determination of Comprehensive Cloud

In order to ascertain the cloud parameters of the assessment indicators, the 16 experts who had been identified in the preceding study were invited to score the constructed secondary indicators for a third time. Thereafter, the cloud numerical eigenvalues of each toughness assessment indicator were calculated according to Equation (8), as demonstrated in Table 6.

3.3.3. Determination of Resilience Assessment Results

Utilizing the cloud eigenvalues and weights of the primary indicators obtained in the preceding steps, the comprehensive cloud numerical features of the target layer can be calculated as 7.2116, 1.0022, and 0.2696 through the inverse cloud generator. In accordance with Equation (9), and with z set to 2000, the numerical characteristics of the comprehensive assessment cloud can be obtained through the utilization of MATLAB software (Version R2019a for Windows). Thereafter, the generation of the comprehensive assessment cloud map can be conducted, as illustrated in Figure 3. Among them, the horizontal coordinate denotes the value range of the assessment indicator, while the vertical coordinate indicates the relative affiliation degree. The black cloud droplets in Figure 3 constitute the standard cloud map, which is constructed on the basis of the evaluation set. The red cloud droplets represent the generated comprehensive assessment cloud map for the overall objective, which is characterized by the letter R.
As illustrated in Figure 3, the distribution of cloud droplets is primarily concentrated within the range of resilience level III–IV. The numerical characteristics of the comprehensive cloud are subjected to affiliation calculation with the standard cloud to further determine the comprehensive resilience level. The results of the affiliation calculation and the resilience level are shown in Table 7.
As indicated by the findings presented in Table 7, the infrastructure resilience of the irrigation district has been evaluated with a level of IV, categorizing it within the range of “higher resilience”. However, as illustrated in Figure 3, the irrigation district’s infrastructure resilience assessment level, while categorized as “higher resilience”, exhibits a deviation from the ideal state. This deviation places the district’s assessment grade in the lower end of the “higher resilience” interval, indicating a discrepancy between the observed state and the ideal state. This finding suggests that the infrastructure’s actual assessment grade remains in the lower end of the “higher resilience” interval, indicating a deviation from the ideal state. Specifically, this rating reflects that the district’s infrastructure exhibits a certain degree of resistance, adaptation, and recovery capacity in the face of natural disasters, climate change, or other external shocks. However, this capacity has not yet reached the optimal state. To further explore the underlying causes of this outcome, a comprehensive analysis of the primary and secondary indicators is recommended.
Using Equations (10)–(12), we can calculate the degree of affiliation of each level of indicators, and according to the principle of maximum affiliation, we can determine the irrigation district infrastructure resilience level; the results are shown in Table 8.
According to Table 8 above, it can be found that the primary indicators of the resilience assessment of irrigation district infrastructure have reached the “high resilience” level range (level IV) in terms of foresight capacity, absorptive capacity, and adaptive and learning capacity, which indicates that irrigation districts have strong capacity in risk early warning, disaster resistance, and post-disaster adjustment and self-improvement. However, the recovery capacity is only at the “medium resilience” level (level III), which is the weak link in the resilience system. This reflects the need to strengthen the ability of irrigation district infrastructure to quickly return to normal operation after a disaster, which may be limited by factors such as the speed of emergency response, the efficiency of resource deployment, or the degree of community participation. Therefore, future efforts should focus on improving recovery capacity by optimizing emergency management mechanisms, enhancing resource security, and promoting community resilience building to comprehensively improve the overall resilience of irrigation infrastructure and ensure that it can recover its functions more quickly and effectively in the face of various types of challenges.
By applying Equations (10) and (11), the membership degree of each secondary indicator can be calculated, and then according to Equation (12), the resilience level of each secondary indicator can be determined, as shown in Table 9.
According to Table 9 above, it can be seen that the secondary assessment indicators of irrigation district infrastructure resilience show uneven development, and this paper will then elaborate on the specific assessment results and problems under each dimension.
First of all, the resilience level of each indicator under the dimension of foresight capacity (A) is relatively high. In particular, A2 (data management and information sharing capacity) is in the “high resilience” toughness level, which is also the only indicator classed as “high resilience” among all indicators, which indicates that current irrigation district construction pays much attention to improving the informationization level. Although the remaining four indicators under dimension A are all in the high range, A5 (early warning and monitoring system) has a relatively low level of affiliation, which indicates that although the irrigation district’s information collection capacity is high, the district is still a little deficient in utilizing the collected data for decision-making and early warning.
Second, the resilience level of the indicators under the absorptive capacity dimension (B) is relatively low. While three indicators, B1, B5, and B6, are in the “higher resilience” range, B2 (irrigation district system redundancy), B3 (emergency resource reserves), and B4 (emergency response mechanisms) are only close to moderate resilience. This result suggests that the irrigation district lacks backup systems or critical alternative operations, and that the lack of backup facilities could result in a cessation of operations if the system fails. Inventories of critical materials, supplies, or financial resources needed to respond to emergencies may be inadequate, which could hinder the irrigation district’s ability to maintain operations during disruptions and delay recovery efforts. In addition, the irrigation district may lack management contingency plans, have slow response times or inadequate knowledge of potential risks, or have inadequate training of emergency response personnel.
The resilience level of the indicators under the recovery dimension (C) is generally low. It is found that C1 (speed of post-disaster reconstruction and recovery), C2 (social mobilization and public participation), C4 (resource redistribution and planning capacity), and C5 (financial security) are only close to medium resilience, which shows that there is room for improvement in the post-disaster recovery of this irrigation district, and that it is necessary to strengthen the management and coordination of various links to improve the overall recovery efficiency and capacity.
Finally, the resilience level of the indicators under the adaptive and learning capacity dimension (D) is relatively low. Table 9 shows that D2 (improving knowledge and awareness of irrigation districts), D3 (effective feedback mechanisms), and D5 (cooperation and partnerships) are closer to moderate resilience. The reasons for this result may be insufficient education of irrigation districts or stakeholders about potential risks, emergency procedures, or resilience improvement; a lack of appropriate communication channels; and failure to establish and maintain effective partnerships with other organizations or institutions. This finding suggests that irrigation districts have shortcomings in managing change and self-improvement and need to strengthen internal management and external partnerships to improve resilience.

4. Discussion

This study identifies the strengths and weaknesses of irrigation district infrastructure in the context of climate change through a multidimensional resilience assessment, and the results not only reflect the core framework of resilience theory but also provide a new perspective on adaptive management of agricultural water systems. This study combines the results of the above analysis to further explore the key findings in depth and propose targeted improvement pathways.

4.1. Key Findings

(1)
The “data–decision” gap in foresight capabilities. This study indicates that the district demonstrates proficiency in data management and information sharing (A2), aligning with the global trend of digital transformation in agriculture and water management. The dissemination of technologies such as the Internet of Things (IoT) and remote sensing has notably enhanced the irrigation district’s real-time monitoring capabilities. However, the deficiencies in the early warning and monitoring system (A5) highlight the issue of “sleeping data”. Despite the enhancement in data acquisition capacity, there remains a deficiency in the translation of data into actionable signals, largely attributable to algorithmic constraints. Existing early warning models predominantly rely on historical climate patterns, which hinders their capacity to capture the non-linear characteristics inherent in extreme events. A case in point is the 2021 Henan mega-rainstorm event, where the conventional model fell short in its inability to accommodate sudden climate change parameters. It is conceivable that analogous challenges may prevail in the irrigation area under scrutiny in this study.
(2)
The redundancy paradox of absorptive capacity and resource mismatch. The findings indicate that low scores on system redundancy (B2) and emergency resource reserves (B3) are indicative of a tendency to “prioritize efficiency” in the design of irrigation district infrastructure. Contemporary irrigation districts have a propensity to utilize centralized water distribution systems with the objective of reducing construction costs. However, this practice also serves to amplify the risk of a single point of failure. This conflict can be attributed to two interrelated aspects: economic rationality and resilience goals. The cost of maintaining redundant facilities (e.g., standby pumping stations) is often viewed as a waste of resources, and managers prefer a “just enough” strategy. However, the increased frequency of extreme events due to climate change has led to a significant increase in the long-term costs of this strategy. Second, there is a lack of dynamic adaptation of resource stockpiles, as emergency stockpiles are often set on the basis of historical disaster scales and fail to incorporate climate scenarios.
(3)
Social capital shortfalls for recovery capacity. Despite the high score of financial security (C5), the lack of social mobilization (C2) and resource mobilization (C4) reflects the limitations of the “government-led” restoration mechanism, which is mainly manifested in two aspects. Firstly, there is a community participation fault. Farmers and local communities are often regarded as passive recipients, rather than the main body of governance of recovery actions. Increasing community ownership of decision-making in post-disaster reconstruction can help speed up recovery. Secondly, the absence of effective interdepartmental coordination has contributed to delays in mobilizing resources. The current structure, wherein various departments such as water, agriculture, and civil affairs are responsible for specific tasks, has proven to be cumbersome. To address this, the establishment of a unified deliberative and coordinating body is recommended, operating within a legal framework that facilitates collaboration across sectors. Such a body would serve to dismantle the barriers that exist between different sectors, thereby enhancing the efficiency and effectiveness of post-disaster reconstruction efforts.
(4)
Institutional lock-in effects of adaptive capacity. The low resilience of the feedback mechanism (D3) and the cooperative network (D5) reveals the “path-dependent” nature of the irrigation management system. Firstly, there is the unidirectionality of knowledge transfer, as the existing training mostly adopts the top–down indoctrination mode, ignoring the value of local experience. The integration of local farmers’ traditional experiences with modern technologies should be promoted as much as possible to increase the adoption rate of adaptation strategies. Secondly, the instrumentalization of partnerships is evident. Existing external cooperation is predominantly confined to financial support during the project cycle and lacks long-term knowledge of sharing mechanisms, and the deep collaboration of continuous joint development of iterative adaptation programs has yet to manifest in this study’s irrigation area.

4.2. Theoretical Insights and Management Innovation Pathways

This study challenges the traditional paradigm centered on “engineering resilience” and supports the “sociological–ecological–technological” coupling view of resilience by revealing the imbalanced nature of the resilience of irrigation infrastructure in terms of the four-dimensional capacities of foresight, absorption, recovery, and adaptation. Accordingly, this study proposes the following four-dimensional management innovation framework.
(1)
Intelligent early warning iteration. An AI-driven climate–hydrology coupling model, in conjunction with CMIP6 climate prediction data, is developed that employs deep learning methods to enhance the prediction capability of extreme events. The construction of a digital twin of an irrigation district, incorporating an “extreme event stress test” function (e.g., simulating a 1-in-100-year flood scenario), facilitates the realization of profound synergies between artificial intelligence and the digital twin platform. This integration enables real-time simulation of pivotal components within the irrigation district infrastructure. The development of adaptive learning algorithms enables the real-time update of model parameters. This approach is crucial for reducing the delay in man-made decision-making and transitioning from “data slumber” to “decision triggering”.
(2)
Redundant and flexible design. The promotion of modular infrastructure, such as removable temporary channels, is crucial for facilitating the rapid dismantling and reconstruction of damaged segments. Furthermore, the implementation of intelligent scheduling of “single-point-of-failure local isolation” is essential to prevent the occurrence of total paralysis. Combined with distributed water storage systems, the deployment of a network of small underground reservoirs within the irrigation area replaces a single large-scale reservoir. This improves system robustness, balances efficiency and risk-resistant demand, and achieves a rebalance between efficiency and resilience. Furthermore, the prospect of integrating an intelligent early warning system, implementing a dynamic adaptation mechanism, updating the climate scenario prediction model on a quinquennial basis, and establishing a linkage to adjust the type of modularized components and the scale of water storage should be given due consideration. For instance, the installation of supplementary rainwater harvesting modules could be contemplated in the event of a 10% decrease in precipitation.
(3)
Community empowerment platform. In order to establish an effective community empowerment platform, it is necessary to construct a collaborative governance framework comprising an “institution–technology–culture” trinity. Firstly, local farmers’ representatives should be invited to establish the Resilience Committee of Irrigation District, and the farmers’ representatives should participate in the decision-making process regarding the allocation of funds for irrigation district construction. Secondly, the development of a resilience common governance APP embedded in the “resilience points” system is recommended. Farmers can use the APP to participate in the provision of disaster early warning push; for damaged facilities, photo repair information can be exchanged for agricultural incentives. Thirdly, the dissemination of knowledge regarding disaster prevention and mitigation can be facilitated through the utilization of a short-video platform. The development of an augmented reality (AR) operation and maintenance guidance system can be undertaken to enhance its popularity among elderly individuals and other vulnerable groups, thereby stimulating the community’s intrinsic dynamism.
(4)
Learning organization construction. The construction of a resilience knowledge mapping platform for irrigation districts, the integration of the irrigation district disaster response case library, the local experience database and the optimization strategy library, the utilization of the resilience co-governance APP platform to popularize disaster relief knowledge, the resolution of the path dependence problem of traditional irrigation district management, and the realization of a paradigm shift from “stress-based disaster relief” to “anticipatory adaptation” have been achieved. In order to address the digital divide that may exist in rural areas, it is necessary to develop a low-bandwidth version of the APP that supports dialectal voice interaction and lowers the threshold of use for users with digital barriers.
The establishment of a knowledge mapping platform for irrigation districts has been proposed, with the objective of integrating disaster response knowledge, on-site experience knowledge, and optimized strategy knowledge. In addition, the utilization of the resilience co-governance APP platform to popularize disaster relief knowledge has been suggested. This approach is expected to address the path dependency problem of traditional irrigation district management, thereby facilitating a paradigm shift from a “stress-based disaster relief” approach to “anticipatory adaptation”. This paradigm shift, from a “stress-based disaster relief” approach to one of “anticipatory adaptation” is both plausible and achievable.

5. Conclusions

The demand for construction and maintenance of irrigation district infrastructure remains significant, with ongoing advancements in water management technology and infrastructure resilience. However, the complexity and uncertainty of irrigation district infrastructure resilience necessitates a more comprehensive and precise identification of its influencing factors, which requires the development of scientifically sound and operational assessment methods. By synthesizing and examining the extant literature, the four dimensions of foresight capacity, absorption capacity, recovery capacity, and adaptation and learning capacity are identified as the four dimensions for the assessment of the resilience of irrigation district infrastructure. An irrigation district infrastructure resilience assessment indicator system covering 23 indicators was constructed, and an assessment model for the resilience of irrigation district infrastructure was chosen to be constructed based on the DEMATEL-ANP-Cloud model method.
The assessment indicators and assessment model constructed in this paper were then used to conduct a comprehensive assessment of the resilience of the ZK Irrigation District’s infrastructure in Henan Province, China. The assessment results of the first-level indicators demonstrate that the infrastructure system of ZK Irrigation District exhibits a medium level of resilience, while its foresight capacity, absorption capacity, and adaptation and learning capacity are at a high level of resilience. This finding is largely consistent with the actual situation. Further analyses through secondary indicators showed that the weakness of the early warning system in the case irrigation district led to the limitation of data in decision-making, and the efficiency priority tendency of the infrastructure design made the system redundant, with insufficient reserves of emergency resources, which increased the risk of a single point of failure. Meanwhile, inadequate social mobilization and resource dispatch in the recovery mechanism, as well as faulty community participation and ineffective cross-sectoral coordination, limited the speed of recovery. This paper proposed a series of enhancement strategies to address these challenges, including the strengthening of early warning systems, the optimization of infrastructure design to balance efficiency and resilience, the enhancement of social and resource mobilization capacity, and the promotion of bidirectional knowledge transfer and long-lasting partnership mechanisms.
This study is significant both theoretically and practically. Firstly, from a theoretical perspective, it presents a novel approach for evaluating the resilience of irrigation district infrastructure. This is achieved by developing a scientific and rational assessment indicator system and model, thereby enriching the theoretical framework in this field and establishing a substantial foundation for future research. Secondly, the empirical study of the ZK Irrigation District validates the assessment method and offers examples for other irrigation districts to emulate, while the proposed targeted enhancement strategies assist the district in overcoming practical challenges and enhancing its resilience.
This study proposes a reform framework for policymakers to systematically enhance the resilience of irrigation districts. First, the transformation of irrigation infrastructure planning from an “efficiency priority” to a “resilience orientation” is imperative. Full-cycle resilience management must be realized through the establishment of a resilience indicator assessment system, the revision of design norms and parameters, and the establishment of a special financial fund. Secondly, given the identified limitations of the current management mechanism, the establishment of a cross-sectoral collaborative governance platform is recommended, along with the formulation of incentive mechanisms for community participation and the resolution of the path dependence problem. Thirdly, emphasis should be placed on facilitating a two-way exchange of knowledge and innovation in the long-term cooperation mechanism. This will promote technological transformation and system optimization, thereby establishing a closed-loop policy of “assessment–decision-making–implementation–feedback”. This, in turn, will comprehensively enhance the disaster-resistant capacity of irrigation districts.
This study’s findings are subject to certain limitations that necessitate further investigation. Firstly, with regard to the assessment indicator system, subsequent research could take into account the characteristics of irrigation districts in diverse geographical and cultural contexts. This can be achieved by utilizing the indicator system developed in this study as a foundation and by engaging in interdisciplinary collaboration to draw upon knowledge and technology from related fields. This approach will enhance the applicability and precision of the indicator system. Secondly, given the potential of the cloud model to assess the resilience of irrigation district infrastructures demonstrated in this study, future studies should seek to validate and optimize the assessment model by collecting and analyzing data from a greater number of actual irrigation districts. Concurrently, efforts should be made to promote the development of unified assessment standards and criteria, providing a more scientific and systematic basis for the management and development of irrigation district infrastructure strategies.

Author Contributions

Conceptualization, S.W.; Methodology, C.L.; Investigation, L.Z.; Writing—original draft, K.W.; Supervision, J.L. All authors have read and agreed to the published version of the manuscript.

Funding

This research was funded by the water conservancy science and technology research project of Henan Province, Grant No. 202260.

Data Availability Statement

The original data in this study can be obtained from the corresponding author.

Acknowledgments

We thank the reviewers and editors for their suggestions on this work.

Conflicts of Interest

The authors declare no conflicts of interest.

References

  1. Food and Agriculture Organization of the United Nations. The State of Land and Water Resources in the World’s Food and Agriculture Sector: A System on the Brink of Collapse; Food and Agriculture Organization: Rome, Italy, 2021. [Google Scholar]
  2. Intergovernmental Panel on Climate Change. Climate Change 2014: Impacts, Adaptation, and Vulnerability. Contribution of Working Group II to the Fifth Assessment Report of the Intergovernmental Panel on Climate Change; Cambridge University Press: Cambridge, UK, 2014.
  3. Ortiz-Bobea, A.; Ault, T.R.; Carrillo, C.M.; Chambers, R.G.; Lobell, D.B. Anthropogenic climate change has slowed global agricultural productivity growth. Nat. Clim. Chang. 2021, 11, 306–312. [Google Scholar] [CrossRef]
  4. Gao, Z. China’s plans and action on implementation of icid vision 2030. Irrig. Drain. 2020, 69, 303–306. [Google Scholar] [CrossRef]
  5. Holling, C.S. Resilience and Stability of Ecological Systems. Annu. Rev. Ecol. Syst. 1973, 4, 1–23. [Google Scholar] [CrossRef]
  6. Bruneau, M.; Chang, S.E.; Eguchi, R.T.; Lee, G.C.; O’Rourke, T.D.; Reinhorn, A.M.; Shinozuka, M.; Tierney, K.; Wallace, W.A.; Von Winterfeldt, D. A framework to quantitatively assess and enhance the seismic resilience of communities. Earthq. Spectra 2003, 19, 733–752. [Google Scholar] [CrossRef]
  7. Folke, C.; Carpenter, S.R.; Walker, B.; Scheffer, M.; Chapin, T.; Rockström, J. Resilience thinking: Integrating resilience, adaptability and transformability. Ecol. Soc. 2010, 15, 20–28. [Google Scholar] [CrossRef]
  8. United Nations Office for Disaster Risk Reduction. Sendai Framework for Disaster Risk Reduction; UNDRR: Geneva, Switzerland, 2015. [Google Scholar]
  9. Li, J.; He, W.; Jiang, E.; Qu, B.; Yuan, L.; Degefu, D.M.; Ramsey, T.S. Spatio-Temporal Assessment of Water Resources System Resilience and Identification of Its Driving Factors in the Yellow River Basin. Water 2024, 16, 414. [Google Scholar] [CrossRef]
  10. Pahl-Wostl, C.; Lebel, L.; Knieper, C.; Nikitina, E. From applying panaceas to mastering complexity: Toward adaptive water governance in river basins. Environ. Sci. Policy 2012, 23, 24–34. [Google Scholar] [CrossRef]
  11. Lankford, B.; Pringle, C.; McCosh, J.; Shabalala, M.; Hess, T.; Knox, J.W. Irrigation area, efficiency and water storage mediate the drought resilience of irrigated agriculture in a semi-arid catchment. Sci. Total Environ. 2023, 859, 160263. [Google Scholar] [CrossRef]
  12. Wickramasinghe, R.; Nakamura, S. Evaluation of the drought resilience of indigenous irrigation water systems: A case study of dry zone Sri Lanka. Environ. Res. Commun. 2024, 6, 035003. [Google Scholar] [CrossRef]
  13. Borsato, E.; Rosa, L.; Marinello, F.; Tarolli, P.; D’Odorico, P. Weak and strong sustainability of irrigation: A framework for irrigation practices under limited water availability. Front. Sustain. Food Syst. 2020, 4, 17. [Google Scholar] [CrossRef]
  14. Talbi, A.; Karimi, P.; Waalewijn, P.; Onimus, F.; de Jong, I.J.; Zaveri, E.D.; Li, R. Climate-resilient irrigation: Essential changes to balance food production and water security on a livable planet. Irrig. Drain. 2024, 73, 1723–1730. [Google Scholar] [CrossRef]
  15. Liu, D.; Li, M.; Ji, Y.; Fu, Q.; Li, M.; Faiz, M.A.; Ali, S.; Li, T.; Khan, M.I. Spatial-temporal characteristics analysis of water resource system resilience in irrigation areas based on a support vector machine model optimized by the modified gray wolf algorithm. J. Hydrol. 2021, 597, 125758. [Google Scholar] [CrossRef]
  16. Esteves, R.; Calejo, M.J.; Rolim, J.; Teixeira, J.L.; Cameira, M.R. Framework for assessing collective irrigation systems resilience to climate change—The Maiorga case study. Agronomy 2023, 13, 661. [Google Scholar] [CrossRef]
  17. Schelfaut, K.; Pannemans, B.; van der Craats, I.; Krywkow, J.; Mysiak, J.; Cools, J. Bringing flood resilience into practice: The freeman project. Environ. Sci. Policy 2011, 14, 825–833. [Google Scholar] [CrossRef]
  18. Ouyang, M.; Dueñas-Osorio, L.; Min, X. A three-stage resilience analysis framework for urban infrastructure systems. Struct. Saf. 2012, 36, 23–31. [Google Scholar] [CrossRef]
  19. Jain, P.; Pasman, H.J.; Waldram, S.; Pistikopoulos, E.N.; Mannan, M.S. Process Resilience Analysis Framework (PRAF): A systems approach for improved risk and safety management. J. Loss Prev. Process. Ind. 2018, 53, 61–73. [Google Scholar] [CrossRef]
  20. Li, X.; Shi, X. Smallholders’ livelihood resilience in the Dryland Area of the Yellow River Basin in China from the perspective of the family life cycle: Based on geodetector and LMG metric model. Land 2022, 11, 1427. [Google Scholar] [CrossRef]
  21. Bottazzi, P.; Winkler, M.S.; Boillat, S.; Diagne, A.; Sika, M.M.C.; Kpangon, A.; Faye, S.; Speranza, C.I. Measuring subjective flood resilience in suburban Dakar: A before–after assessment of the “live with water” project. Sustainability 2018, 10, 2135. [Google Scholar] [CrossRef]
  22. de Grenade, R.; Rudow, J.; Hermoza, R.T.; Aguirre, M.E.A.; Scott, C.A.; Willems, B.; Schultz, J.L.; Varady, R.G. Anticipatory capacity in response to global change across an extreme elevation gradient in the Ica Basin, Peru. Reg. Environ. Chang. 2017, 17, 789–802. [Google Scholar] [CrossRef]
  23. Preble, J.F. Integrating the crisis management perspective into the strategic management process. J. Manag. Stud. 1997, 34, 769–791. [Google Scholar] [CrossRef]
  24. Kim, H.; Woosnam, K.M.; Marcouiller, D.W.; Kim, H. Seeking anticipatory adaptation: Adaptive capacity and resilience to flood risk. Environ. Hazards 2022, 21, 36–57. [Google Scholar] [CrossRef]
  25. Djalante, R.; Holley, C.; Thomalla, F. Adaptive governance and managing resilience to natural hazards. Int. J. Disaster Risk Sci. 2011, 2, 1–14. [Google Scholar] [CrossRef]
  26. Linnenluecke, M.K.; Griffiths, A.; Winn, M. Extreme weather events and the critical importance of anticipatory adaptation and organizational resilience in responding to impacts. Bus. Strat. Environ. 2012, 21, 17–32. [Google Scholar] [CrossRef]
  27. Costella, C.; Jaime, C.; Arrighi, J.; de Perez, E.C.; Suarez, P.; van Aalst, M. Scalable and sustainable: How to build anticipatory capacity into social protection systems. iDs Bull. 2017, 48, 31–46. [Google Scholar] [CrossRef]
  28. Baghersad, M.; Wilkinson, S.; Khatibi, H. Comprehensive indicator bank for resilience of water supply systems. Adv. Civ. Eng. 2021, 2021, 2360759. [Google Scholar] [CrossRef]
  29. Wang, J.; Liu, H. Snow removal resource location and allocation optimization for urban road network recovery: A resilience perspective. J. Ambient. Intell. Humaniz. Comput. 2019, 10, 395–408. [Google Scholar] [CrossRef]
  30. Wu, B.; Tan, Z.; Che, A.; Cui, L. A Novel Resilience Assessment Framework for Multi-component Critical Infrastructure. IEEE Trans. Eng. Manag. 2024, 71, 14011–14031. [Google Scholar] [CrossRef]
  31. McNally, A.; Magee, D.; Wolf, A.T. Hydropower and sustainability: Resilience and vulnerability in China’s powersheds. J. Environ. Manag. 2009, 90, S286–S293. [Google Scholar] [CrossRef]
  32. Chen, H.Y.; Das, A.; Ivanov, D. Building resilience and managing post-disruption supply chain recovery: Lessons from the information and communication technology industry. Int. J. Inf. Manag. 2019, 49, 330–342. [Google Scholar] [CrossRef]
  33. Ward, F.A. Enhancing climate resilience of irrigated agriculture: A review. J. Environ. Manag. 2022, 302, 114032. [Google Scholar] [CrossRef]
  34. Speranza, C.I.; Wiesmann, U.; Rist, S. An indicator framework for assessing livelihood resilience in the context of social–ecological dynamics. Glob. Environ. Chang. 2014, 28, 109–119. [Google Scholar] [CrossRef]
  35. Sarkis, M.J. Strategic analysis of logistics and supply chain management systems using the analytical network process. Transp. Res. Part E Logist. Transp. Rev. 1998, 34, 201–215. [Google Scholar] [CrossRef]
  36. Maurya, S.P.; Singh, P.K.; Ohri, A.; Singh, R. Identification of indicators for sustainable urban water development planning. Ecol. Indic. 2020, 108, 105691. [Google Scholar] [CrossRef]
Figure 1. Research framework.
Water 17 01214 g001
Figure 2. Process of change and assessment dimensions of irrigation district infrastructure resilience.
Water 17 01214 g002
Figure 3. Comprehensive assessment cloud map of infrastructure resilience in ZK irrigation area.
Water 17 01214 g003
Table 1. Resilience assessment indicators for irrigation area infrastructure.
LabelIndicatorsInterpretationSource
A1Risk identification and assessment capacityThe ability to identify, classify, and assess potential risk factors and to predict the likely impact of those risks on the organization or system.[20]
A2Data management and information sharing capacityData management capability is defined as the efficiency and effectiveness of the system in collecting, processing, and analyzing data. Information sharing capability emphasizes the ability to efficiently communicate and share information between the organization and external stakeholders.[21,22]
A3Capacity to develop and implement preventive measuresThe capacity to formulate and implement strategies or actions aimed at preventing or mitigating the adverse impacts of a given phenomenon, such as the development of disaster response plans that address a range of potential hazards, including flood control and drought response.[23,24]
A4Knowledge management and learning capacityThe capacity to continuously collect, analyze, and disseminate knowledge of emerging risks, technological advances, and best practices in infrastructure resilience, and to learn from past events and integrate these lessons into future planning and risk mitigation strategies.[25]
A5Early warning and monitoring systemsThe establishment of effective monitoring and alert mechanisms for timely warning and action before a crisis occurs, including the coverage of the monitoring system, the timeliness of the alerts, and the accuracy of the early warning information.[26,27]
B1Structural stability of irrigation facilitiesThe strength and durability of physical structures such as channels, sluices, dams, pipes, etc.[18]
B2Redundancy of irrigation systemsA standby system or component that takes over the function of the primary component in the event of a failure.[18,28]
B3Reserve for emergency resourcesStockpiling of emergency supplies, training of emergency personnel, etc.[29,30]
B4Mechanisms for emergency responseProcesses and procedures for quickly responding to and managing critical incidents, disasters, or emergencies when they occur, such as disaster recovery plans, rapid response capabilities, and emergency response training.[28]
B5Professional skills of irrigation managersThe level of expertise of the staff.[31]
B6Maintenance and upgrading of irrigation facilitiesThe maintenance of irrigation facilities, degree of deterioration, frequency of renewal, etc.[30]
C1Speed of post-disaster reconstruction and recoveryThe speed of post-disaster recovery, deployment of recovery resources, etc.[18]
C2Social mobilization and public participationThe level of participation of communities, farmers, and other stakeholders.[31]
C3Long-term recovery strategiesRecovery plan development and implementation, long-term recovery goal setting and implementation effectiveness, etc.[18]
C4Resource reallocation and scheduling capacityEfficiency and timeliness of resource deployment.[28]
C5Financial securityThe ability to access funds quickly and implement sustainable long-term financial planning, among other things.[18]
C6Communication channels and coordinationMechanisms for effective information flow and collaboration among stakeholders in irrigation management.[32]
D1Adaptation of the irrigation district operation planThe ability to modify and update operational procedures and management policies in response to changing conditions (e.g., changes in climate patterns, water availability, technological innovation, or socio-economic factors).[33]
D2Increasing knowledge and awarenessRaise awareness and understanding among community members of the importance of irrigation infrastructure, water resource management, and conservation through education, advocacy, and information dissemination.[34]
D3Effective feedback mechanismsImplement feedback mechanisms for continuous monitoring, assessment, and adjustment of operations and policies based on data and changing circumstances.[34]
D4Staff training and developmentImprove the skills and knowledge of irrigation district management and operations staff through education and professional development activities.[28]
D5Cooperation and partnershipsPartnerships with other organizations, research institutes, and agencies to leverage external expertise, resources, and innovations to improve the system’s adaptive and learning capacity.[28]
D6Technological upgrading and innovationAdoption of new technologies to improve the capacity of irrigation districts to adapt.[28]
Table 2. Demographic characteristics of respondents.
ProfileCategoryNumberProfileCategoryNumber
Age ≤35 4Education level Masters and above 4
36–45 9 Undergraduate 8
≥46 3Junior4
Work Experience ≤5 years 3Technical title Intermediate 5
5–10 years8 Associate 9
≥10 years5 Senior 2
Table 3. Influencing relationships among primary indicators for resilience assessment of irrigation district infrastructure.
IndicatorsABCD
A-7.1256.0635.313
B2.875-7.3134.438
C3.1884.563-6.688
D6.1256.6257.188-
Table 4. Indicator weights for resilience assessment of irrigation infrastructure.
Primary IndicatorsWeight of Primary IndicatorsSecondary IndicatorsIntra-Dimensional WeightsGlobal WeightsRank
A0.248A10.3060.0763
A20.1740.04311
A30.1640.04113
A40.1660.04112
A50.1890.0479
B0.354B10.2430.0861
B20.1950.0695
B30.0680.02420
B40.1410.0506
B50.1370.0488
B60.2150.0762
C0.255C10.2870.0734
C20.0950.02419
C30.1920.0497
C40.1490.03816
C50.1700.04310
C60.1060.02718
D0.144D10.2760.04014
D20.0830.01222
D30.0880.01321
D40.2520.03617
D50.0290.00423
D60.2720.03915
Table 5. Classification and eigenvalues of resilience assessment levels for irrigation infrastructure.
StatusLevelRating RangeCloud Numerical Eigenvalues
No resilienceI(0, 3)(1.5, 1.2740, 0.1)
Low resilienceII[3, 5)(4, 0.8493, 0.1)
Medium resilienceIII[5, 7)(6, 0.8493, 0.1)
Higher resilienceIV[7, 8)(7.5, 0.4247, 0.1)
High resilienceV[8, 10)(9, 0.8493, 0.1)
Table 6. Cloud numerical eigenvalues of resilience assessment indicators for irrigation infrastructure.
Primary IndicatorsCloud Numerical EigenvaluesWeightsSecondary IndicatorsCloud Numerical EigenvaluesWeights
ExEnHeExEnHe
A7.56901.01930.26840.2481A17.32001.14640.24690.0760
A28.27330.82880.17500.0433
A37.58671.02050.35670.0406
A47.60000.95250.29500.0412
A57.28000.89900.31720.0470
B7.37150.92120.31310.3535B17.50000.75200.33200.0858
B26.86001.28000.46000.0689
B36.70001.30340.15240.0242
B46.94001.04270.31240.0499
B57.94670.64730.13940.0485
B67.82000.86230.25560.0762
C6.64661.17440.21820.2546C16.51331.31900.18520.0730
C26.79331.16310.28890.0242
C37.16001.05610.06510.0490
C46.49331.01040.40920.0380
C55.78001.24330.29950.0433
C67.54670.66400.31910.0271
D7.20210.90120.17190.1438D17.23330.99710.04200.0397
D25.96671.03050.34710.0119
D35.91331.48170.34660.0126
D47.95330.68070.18310.0363
D56.69331.52960.28850.0042
D67.32000.91240.26040.0391
Table 7. Comprehensive resilience affiliation and assessment level of infrastructure in ZK Irrigation District.
Overall ObjectiveIIIIIIIVVLevel
R0.15960.15970.21730.28640.1770IV
Table 8. Affiliation and level of primary indicators for infrastructure resilience assessment in ZK irrigation area.
IndicatorsIIIIIIIVVLevel
A0.15600.15600.18430.31000.1937IV
B0.15660.15660.19910.30620.1815IV
C0.16920.17050.29580.19160.1728III
D0.15980.16000.21850.28480.1768IV
Table 9. Affiliation and level of secondary indicators for infrastructure resilience assessment in ZK irrigation area.
IndicatorsIIIIIIIVVLevel
A10.00000.00050.29890.91410.1414IV
A20.00000.00000.02780.19060.6935V
A30.00000.00010.17460.97940.2504IV
A40.00000.00010.16960.97270.2570IV
A50.00000.00060.32120.87440.1286IV
B10.00000.00020.21021.00000.2102IV
B20.00010.00340.59890.32130.0418III
B30.00020.00640.71200.16960.0256III
B40.00010.00250.54200.41920.0528III
B50.00000.00000.07230.57520.4634IV
B60.00000.00000.10070.75290.3809IV
C10.00040.01250.83310.06730.0138III
C20.00020.00450.64640.25050.0342III
C30.00010.00100.39350.72580.0957IV
C40.00050.01340.84480.06030.0128III
C50.00350.11120.96700.00030.0008III
C60.00000.00020.19050.99400.2313IV
D10.00000.00070.34840.82110.1149IV
D20.00210.06850.99920.00150.0017III
D30.00250.07910.99480.00090.0014III
D40.00000.00000.07100.56570.4680IV
D50.00020.00650.71660.16470.0250III
D60.00000.00050.29890.91410.1414IV
Disclaimer/Publisher’s Note: The statements, opinions and data contained in all publications are solely those of the individual author(s) and contributor(s) and not of MDPI and/or the editor(s). MDPI and/or the editor(s) disclaim responsibility for any injury to people or property resulting from any ideas, methods, instructions or products referred to in the content.

