Abstract
Promoting water conservation is crucial for building a modern ecological civilization. The water resource tax helps enforce water-saving policies and strict usage controls. The difference-in-differences (DID) method avoids endogeneity and omitted variable bias, making it ideal for policy evaluation. Using the 2017 pilot water tax expansion as a quasi-natural experiment, this study applies DID to assess the reform’s impact on total factor productivity (TFP) in water-intensive industries. The results indicate that the TFP of water-intensive enterprises in pilot regions increased by an average of 2.5% and that the reform has a positive and significant effect on TFP, with notable improvements in management efficiency and resource allocation. The findings further imply that the reform encourages better management practices, such as optimized water use and cost-effective resource allocation, rather than technological innovation as the main driver of improved productivity. This underscores tax reforms’ dual role in enhancing operational efficiency and environmental sustainability. The findings demonstrate water resource tax reforms’ potential to foster a more sustainable industrial sector, especially in water-stressed regions.
1. Introduction
With rapid economic development and population growth, water resource shortages have become a key bottleneck constraining the sustainable development of industries. On the one hand, relevant data show that the indirect industrial water footprint in 26 provinces in China exceeds 50% of their local water scarcity [1]. What is more, a significant yearly volume of 47.5 trillion gallons is needed for the cooling of fuel-based power plants in the United States, even though the use of renewable energy is increasing [2]. A report by the Food and Agriculture Organization (FAO) also shows that 20% of water usage is attributed to industrial water consumption. On the other hand, low water use efficiency has further exacerbated water resource tensions. Although China’s industrial water use efficiency increased from 0.41 to 0.65, overall water use efficiency in the central region remains low [3]. To promote water conservation and improvements in efficiency, the Chinese government has implemented a water resource fee. However, the current pricing system lacks standardized adjustment mechanisms and faces issues such as unreasonable fee standards, weak enforcement, and disorganized tax collection. This has led to a misalignment between economic development goals and water resource protection, with insufficient focus on the role of water fees in addressing these issues [4]. Against this backdrop, Hebei Province launched a water resource tax pilot reform in July 2016, expanding it to nine other provinces, including Beijing and Tianjin, in December 2017. The study of how policy reform promotes water conservation and efficiency improvement in industrial enterprises has become a pressing issue for both governments and the academic community.
Research on the impact of water resource tax reform in China can be categorized by levels. Macro-level studies focus on its effects on water consumption, efficiency, and fiscal revenue in pilot regions. Wang Lei et al. used the DSGE model to demonstrate that the water resource tax effectively saves water, improves resource utilization efficiency, and promotes optimized production structures [5]. Lan Mu et al. used the difference-in-differences (DID) method for research and found that water resource policies can effectively improve the efficiency of water resource utilization by optimizing the allocation of resources [6]. His study also shows that the policy can effectively curb water poverty by reducing groundwater extraction and optimizing the water utilization structure [7]. C. Xu et al. (2024) assessed the fiscal impact of the tax reform based on its water-saving effects. They found that the water resource tax reform not only optimized water extraction and use structures but also significantly increased tax revenue [8].
Meanwhile, using the WCGE model, some studies have concluded that water resource taxes and water pollution taxes synergistically promote water conservation and water pollution reduction [9]. In addition, some studies have pointed out that the pilot reform of the water resource tax has made a significant contribution to the green development of coastal cities [10].
Micro-level studies (Figure S1) focus on the reform’s impact on enterprises. In terms of corporate innovation, the research results of Zhu et al. indicate that water resource tax reform can positively impact the green technology innovation of enterprises in high-water-consumption industries and those with a strong sense of environmental responsibility [11]. Additionally, some studies suggest that these fees will also make enterprises more inclined to purchase energy-saving and environmentally friendly equipment, thus eliminating a backward production capacity. This, in turn, promotes the technological optimization and upgrading of enterprises and improves their TFP [12,13]. However, Li Jing et al. (2023) suggested that achieving water conservation and pollution reduction through technological innovation was difficult and slow, as source-control mechanisms had a limited impact on water savings and pollution reduction [14]. Furthermore, Liu, C.Y. (2023) found that the water resource tax reform significantly improves the environmental performance of water-intensive enterprises [15]. In addition, green innovation served as a crucial mediating mechanism [16].
Water resource reforms may indeed bring some negative impacts. Zhao Kongjia et al. [17] argue that under the impact of the water resource tax, transformation is more difficult for some highly water-consuming enterprises, leading to their further zombification. However, they also find that the water resource tax can become a tool that indirectly contributes to sustainable development goals [15].
While existing studies have examined the impact of a water resource tax on regional water use efficiency and fiscal revenue from a macro-level perspective, research at the micro-level remains relatively inadequate. In particular, most of the existing literature focuses on whether the water resource tax enhances firms’ total factor productivity (TFP) through technological innovation, with little exploration of other potential mechanisms, such as management optimization and improved resource allocation efficiency. Additionally, there is a lack of in-depth analysis of the heterogeneous impacts of water resource tax reform across different types of enterprises (such as state-owned and non-state-owned enterprises) and regions with varying tax rates.
Based on the above discussion, this study offers several innovations. First, in terms of research content, it addresses the limited focus on a water resource tax’s impact on corporate total factor productivity (TFP), specifically in the industrial sector. Previous studies have focused on improving overall water resource tax efficiency but lacked targeted strategies for industries. This research enhances policy precision by focusing on industrial water use. Second, from a research perspective, it explores the micro-level effects of water resource tax reform on TFP, using firm-level data for a deeper analysis. Third, it supplements existing research by exploring the mechanisms through which environmental policies, such as the water resource tax, affect corporate TFP. While much of the literature focuses on innovation compensation under the Porter hypothesis, this study also examines the role of management optimization and resource allocation efficiency. By identifying three key mechanisms from multiple dimensions—technological innovation, management optimization, and resource allocation efficiency—this research complements and deepens our understanding of how water resource tax reform impacts corporate TFP. Fourth, this study reveals the differentiated impacts of the reform on enterprises with different ownership types and across regions with varying tax rates, providing more targeted policy recommendations.
The remainder of this paper is structured as follows. Section 2 presents a relevant literature review. Section 3 details the methodology and data description. Section 4 presents the empirical results and Section 5 discusses them. Finally, Section 6 concludes this paper and offers policy suggestions.
2. Literature Review and Research Hypothesis
Porter’s hypothesis suggests that strict and flexible environmental regulation may lead to productivity gains [18]. However, the “suppression hypothesis” of neoclassical economics argues that environmental regulation will reduce TFP. The “compliance cost effect” of environmental tax increases the burden on enterprises. It has a crowding-out effect on R&D investment and technological innovation, resulting in a decline in the total factor productivity of enterprises [19]. In addition, there is also a nonlinear relationship between environmental regulation and firm productivity in the literature [20].
From the perspective of enterprise management, the mechanisms of the two policies are different when all firms simultaneously respond to water resources: the water resource fee affects output by reducing the market’s size. In contrast, the water resource tax reduces output by amplifying the weighted cost difference effects between companies. Hence, water resource taxes work better than fees for eliminating backward production capacity [20].
Meanwhile, the water resource tax reform replaces the flexible “fee” with a rigid “tax”, strengthening enforcement. This internalizes the tax into enterprise operating costs through the tax burden transmission mechanism [21]. The water resource tax reform adapts a volume-based taxation method based on the amount of exploitation of resources, which positions the water resource tax in the exploitation link and raises the threshold for tax burden transfer [11]. The cost composition of high-water-consumption enterprises determines that they are more dependent on the input of water resources in all production factors. Hence, the water resource tax reform increases the tax burden of high-water-consumption enterprises and increases the production cost. Such cost pressures can drive firms to adopt efficiency-improving measures to offset regulatory burdens [22]. Therefore, companies seeking profit maximization must choose to improve production efficiency to reduce production costs and ultimately alleviate or offset the cost pressures caused by government environmental regulations [18,23]. Additionally, well-designed environmental regulations, if internalized by firms as capital for ecosystem services, can incentivize technological advancement and the use of resource allocation programs to maximize net benefits from resource utilization, thereby enhancing TFP. Based on this, we propose the following hypothesis:
Hypothesis (H1):
The introduction of a water resource tax can effectively promote the improvement of the total factor productivity of high-water-consumption industrial enterprises.
This paper explores the impact mechanism of water resource tax reform on total factor productivity (TFP) based on the hypothesis that it has a positive effect. Green technology innovation is the main driving force for the sustainable development of China’s strategic emerging industries [24]. From the perspective of innovation compensation, the reform may not immediately boost TFP in high-water-consumption industries by increasing technological innovation. In the short term, the reform incurs tax compliance costs for enterprises, which can reduce the funds available for innovation. Additionally, technological innovation is risky and uncertain, which increases operational risks for businesses. Some studies suggest that the higher pollution emissions of resource-based industries, combined with China’s low environmental tax rates, dampen green technology innovation, as environmental externalities hinder progress [25]. However, taking a long-term view, the deepening of environmental regulations forces the industry to reduce the cost of pollution control by improving its technological innovation capacity, thus creating a “compensation effect” [26]. Based on this, this paper proposes the following hypothesis:
Hypothesis (H2):
“Water resource tax reform” will not improve the total factor productivity of enterprises through the compensation effect of technological innovation in the short term.
Some studies suggest management practices as a crucial factor in improving firms’ TFP and that better management practices lead to a higher level of company TFP [27].
It may be difficult for enterprises to achieve the goal of energy conservation and efficiency improvement in the short term through the compensation effect of technological innovation. In order to meet compliance requirements, companies often take contingency measures based on compliance motivation [28]. The empirical results also show that in recent years, management efficiency has gradually improved and become a new impetus for green TFP growth [29]. Based on this, this paper puts forward the following hypothesis:
Hypothesis (H3):
The reform of water resource taxation can enhance the total factor productivity of high-water-consumption industrial enterprises in the short term by improving their management practices.
From the perspective of resource allocation efficiency, water resource taxation reform can impact how resources and labor are allocated in the short term, thereby affecting total factor productivity (TFP). Some analyses of the impact mechanism showed that environmental regulation had a suppressive effect on resource misallocation, potentially generating a positive resource reallocation effect and enhancing a city’s TFP [30].
The literature suggests that environmental regulations improve capital and labor allocation at the provincial level in China, leading to positive resource reallocation effects that, in turn, enhance industrial TFP [31]. Other studies in the literature argue that environmental regulation distorts resource allocation by increasing production costs and causing some factors of production to flow to sectors or regions with more lenient regulatory policies [32]. However, there is also uncertainty about how the resource allocation of the relevant region will change, which mainly depends on the initial state of its resource allocation [31]. Based on this, we propose the following research hypotheses:
Hypothesis (H4a):
In the short term, “water resource tax reform” can enhance total factor productivity in water-intensive industries by improving resource allocation efficiency.
Hypothesis (H4b):
The “water tax reform” will not help water-intensive industrial enterprises to improve their total factor productivity by improving the efficiency of resource allocation in the short term.
3. Methodology
3.1. Model Construction
3.1.1. Model Choice
The primary methodologies for policy impact assessment include instrumental variables (IV), difference-in-differences (DID), propensity score matching (PSM), and generalized least squares (GLS).
In their 2023 study on water resource tax reform’s effect on water use efficiency, Li et al. [33] employed the synthetic control method (SCM) to determine weights and construct synthetic control groups for 10 pilot provinces. However, PSM exhibits significant limitations:
- (1)
- The method requires two strong assumptions: conditional independence and common support, collectively termed the “strong ignorability” assumption. Violations lead to biased estimates of ATE and ATT;
- (2)
- Matching can only be achieved for treatment units within the common support region;
- (3)
- The method demands large sample sizes.
Zhang et al.’s 2023 [34] evaluation of water resource tax reform used feasible generalized least squares (FGLS) with random effect (RE) and fixed effect (FE) panel data models, showing consistently positive and robust reform effects. However, this approach has limitations:
- (1)
- The strong assumption of homogeneous treatment effects prevents the verification of comparability through parallel trends testing (unlike DID) and the identification of heterogeneous effects.
- (2)
- Limited dynamic effect identification struggles to distinguish between policy anticipation and lagged effects.
Yu et al.’s 2023 [35] study on environmental tax effects employed two-stage least squares using lagged pollution fees as IVs. While straightforward, IV methods have two critical flaws:
- (1)
- Instrument selection challenges—valid instruments are difficult to identify in policy evaluation, with lagged dependent variables often violating exogeneity requirements.
- (2)
- This method requires the strong assumption that heterogeneous policy responses do not affect participation decisions to accurately identify ATT and ATE, often forcing researchers to ignore heterogeneity or assume behavioral consistency.
Compared with the methods mentioned above, the key advantages of using difference-in-differences (DID) for policy evaluation are the following, presented using numbered points:
- (1)
- Causal identification: unlike IV or GLS, DID establishes causality through observable pre–post trends without instrument selection.
- (2)
- Dynamic effect analysis: DID can estimate the timing and persistence of effects through event studies, while GLS struggles with dynamic specifications and PSM is static by design.
- (3)
- Robustness checks: DID controls for both time-invariant confounders (such as FEs) and common time trends (unlike IV or GLS, which may miss temporal patterns).
To clarify the mechanism of the impact of the water resources tax on the total factor productivity (TFP) of enterprises, this paper provides the flowchart below (Figure 1).
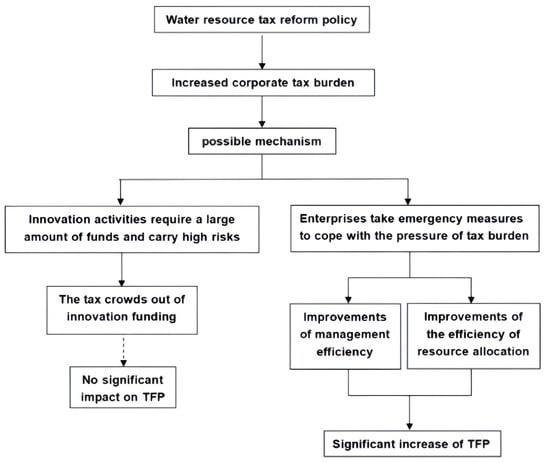
Figure 1.
Flowchart. Dashed arrow to illustrate that this mechanism does not significantly promote TFP.
3.1.2. Benchmark Regression Model Construction
This paper treats the implementation of the pilot water resource taxation reform on 1 December 2017 as a quasi-natural experiment. Using the difference-in-differences (DID) model, it examines the reform’s impact on total factor productivity (TFP) in high-water-consumption industrial enterprises, considering that short-term changes in an industry or region are difficult.
where TFPit is the explained variable of this paper, representing the total factor productivity of province i in the year t, and Timet is a time dummy variable with values of 0 and 1, indicating whether the policy reform occurred in that year, taking 0 as before the “water resource tax reform” and 1 as after the “water resource tax reform”. Treati is a group dummy variable indicating whether the province is a pilot province. The value is 1 when the enterprise is located in the pilot province of the water resource tax reform and 0 when the enterprise is located in a province outside of the pilot province of the water resource tax reform. Treati × Timet is the core explanatory variable of this paper, which represents the implementation of reform policies for water resource taxation in each province, where i and t represent the province and year, respectively. The coefficient αi is an interaction coefficient representing the effect of the water resource tax reform policy. Xit is a series of control variables that may affect the effectiveness of the evaluation of the reform policy of water resource taxation. Including size, Cash, LEV, ROA, Growth, Board, Top1, Manage (average age of management), etc., γt is the fixed effect of year, which captures all the characteristics of enterprises that change over time; αi is the fixed effect of region, which captures all the characteristics of regions that do not change over time; and εit is the random error term.
3.1.3. Impact Mechanism Model Construction
Innovation Compensation Effect Model
Porter’s hypothesis suggests that the water resource tax reform leads to tax compliance costs, which reduce the funds available for enterprises to invest in technological innovation. As a result, businesses face a trade-off between maintaining the status quo, paying the water resource tax, and investing in water-saving equipment or improving production technology to reduce water consumption. Consequently, enterprises may not immediately pursue technological innovation. To test the hypothesis that the reform does not enhance total factor productivity through innovation in the short term, this paper uses enterprise innovation activity (measured by “Patent”) as a mediating variable and constructs a mediating effect model, as shown in Equations (2) and (3):
Management Optimization Compensation Effect Model
In the short term, it may be difficult for enterprises to achieve the goal of energy conservation and efficiency improvement through the short-term technological innovation compensation effect. Therefore, Q. Zhou believes that in order to meet compliance requirements, enterprises will take emergency measures based on compliance motivation, such as improving management levels [36]. On the other hand, in the process of actively implementing technological innovation, the complexity and comprehensiveness of production activities will improve the organizational management ability of enterprises, thus promoting the improvement of productivity [37]. Therefore, to test the justifiability of high-water-consumption industrial enterprises in improving total factor productivity by enhancing management levels, this paper takes the enterprise management efficiency (denoted as “Manage”) as the mediating variable and constructs a mediating effect model, as shown in Equations (4) and (5):
Resource Allocation Efficiency Effect Model
Meanwhile, enterprises can improve the overall resource allocation efficiency by optimizing capital allocation and labor allocation, thereby enhancing total factor productivity. In terms of capital allocation, Li Zhisheng et al. believe that investment activities are the main form of enterprise capital allocation [37,38]. Referring to the research methods of Guo Borui (2023), this paper takes the capital expenditure level (denoted as “Invest”) as the mediating variable [39]. It builds a mediating effect model, as shown in Equations (6) and (7):
Among them, Investit, as an indicator representing the enterprise’s capital expenditure level, is calculated as Ln (cash paid for the acquisition and construction of fixed assets, intangible assets, and other long-term assets/total assets at the end of the period). L. Roait represents the lagged term of the return on total assets, reflecting the enterprise’s investment opportunities. In the model in Equation (6), special attention should be paid to the coefficients of the interaction term Treati × Timet and L. Roait. If the coefficient of Treati × Timet × L.Roait is significantly positive, it indicates that the water resource tax reform policy has effectively promoted the improvement of the total factor productivity of high-water-consumption industrial enterprises by stimulating the capital allocation effect. Conversely, if the coefficient is negative or not significant, it may mean that the water resource tax reform policy has had an adverse impact on the total factor productivity of industrial enterprises.
In terms of labor allocation, one article argues that when the marginal output of labor factors equals the marginal cost, the labor resource allocation efficiency reaches the highest level [40]. Therefore, this paper uses the “relative difference between the marginal output and marginal cost of enterprise labor” to measure the degree of resource misallocation at the enterprise level (MISAit) and construct Equation (8). Here, MPLit represents the marginal output of enterprise labor, and Bit represents the marginal cost of enterprise labor, which is equal to the sum of the average wages and welfare expenses paid by the enterprise to employees.
The larger the MISAit value, the lower the allocation efficiency of an enterprise’s labor factors. To obtain the labor resource allocation efficiency MISAit of enterprise i in year t, it is necessary first to calculate the marginal labor output MPLit of enterprise i in year t, based on the Cobb–Douglas function.
In Equation (9), Yit is the main business income of listed companies at the end of the year; L is the labor input, which is expressed by the number of employees of the enterprise every year; K is the capital input, which is described by the net value of the fixed assets of listed companies; and M is the intermediate input, which is represented by “cash paid for purchasing goods and receiving services” in the financial report of listed companies. The residual term after the regression of the model is the total factor productivity of listed companies [41], and ωit represents the total factor productivity of enterprise i in year t. In this paper, the LP method in the benchmark regression is first used to estimate the production function, and the labor estimation coefficient βL can be obtained. Then, by taking the partial derivative of the labor input L in Equation (9), the marginal labor output of the enterprise MPL = βL × (Y/L) can be obtained. Finally, the enterprise labor allocation efficiency MISAit is calculated.
This paper uses the labor factor allocation efficiency (denoted as “MISA”) as the mediating variable and constructs a mediating effect model, as shown in Equation (10):
3.2. Data Sources
In order to accurately identify the impact of water resource taxation reform on over-investment in high-water-consuming industrial enterprises, this study selected high-water-consumption industrial enterprises in all A-share listed companies, except those in Hong Kong, Macao, Taiwan, and Tibet, from 2012 to 2022 as research samples and preprocessed the data.
The data for this study come from the CSMAR database. Listed companies with total assets less than zero are excluded, along with ST and *ST listed companies. To reduce the impact of extreme values, all continuous variables are processed at the 1% and 99% quantiles. The seven water-intensive industries specified in the “13th Five-Year Plan for Ecological and Environmental Protection”—electricity, steel, textiles, papermaking, petroleum and petrochemicals, chemicals, and food fermentation—are categorized as high-water-consumption industries. After these adjustments, a total of 17,752 observations are obtained.
3.3. Variables
3.3.1. Explained Variable
This paper uses the total factor productivity (TFP) of enterprises as the explained variable. Both the conventional OP method and the LP method are applied to measure TFP. The LP method addresses simultaneity bias in the OLS method and alleviates endogenous issues by using the intermediate input as a proxy for productivity. It also solves the sample missing problem in the OP method, which arises from the absence of investment data in certain periods [42,43]. The LP method is selected for calculation in the benchmark regression, and the OP method is used in the robustness test.
3.3.2. Core Explanatory Variables
According to the above, high-water-consumption industrial enterprises in nine provinces, including Beijing, Tianjin, and Shanxi, are selected as the experimental group (Treat = 1), and high-water-consumption enterprises in 20 other provinces (excluding Hong Kong, Macao, Taiwan, and Tibet) are selected as the control group (Treat = 0). Timet is the dummy variable of time, taking 2017 as the dividing line when the pilot expansion policy of water resource taxation reform occurs. The years before 2017 are assigned to 0, and the years after 2017 are assigned to 1. The core explanatory variable in this paper is the product of Treati and Timet, that is, Treati × Timet.
3.3.3. Control Variables
The control variables in this study encompass Size (enterprise size), Cash (cash ratio), LEV (asset–liability ratio), Growth (growth rate of operating income), Board (board size), Top1 (shareholding ratio of the largest shareholder), Age (average age of management), and so on. Among these, the size of the enterprise is measured by the logarithm of the total assets of the enterprise; the cash ratio is the ratio of cash to the total assets of the enterprise; and the logarithm of the number of directors measures the size of the board of directors. Hence, these control variables are included to account for factors that may influence TFP independently of the reform. For the detailed explanation of the variables, please refer to Table 1.

Table 1.
Variables chart.
4. Results
4.1. Descriptive Statistics
Table 2 presents the descriptive statistics for the main variables. The mean value of TFP_Lp is 8.411. The average value of “dual” is 0.28, indicating that 28% of the sampled enterprises have the same chairman and general manager. The average board size is 8.426, reflecting the typical board size in the sample. Other control variables align with the existing literature and are not discussed further.
Table 2.
Descriptive statistics.
4.2. Correlation Analysis
Table 3 shows the results of the Pearson correlation test between the primary variables. The results show that, on the one hand, the correlation coefficient between total factor productivity (TFP) and the control variables is basically significant, indicating that the selection of control variables in this paper is representative. On the other hand, the mean value of the variance inflation factor of the least squares regression model is 1.13, and the correlation coefficients between the variables are less than 0.44, indicating that the model in this paper does not have serious multicollinearity problems.
Table 3.
Correlation analysis.
4.3. Parallel Trend Test
In order to verify whether the parallel trend hypothesis is valid, this paper constructs the following dynamic model by referring to the articles in the draft treaty:
In this paper, 2017, the year of policy implementation, is taken as the base period. As shown in Model (3), the interaction term in each year from 2013 to 2021 is selected as the explanatory variable for regression. Treatiθ × Timeiθ is a set of dummy variables, and the symbol θ represents the distance between the year of the company and the 2018 implementation of the environmental protection policy.
The implementation of the tax law is θ years apart. Figure 2 plots the estimated results of the interaction term coefficients at the 95% confidence interval. The results show that the regression coefficients of interaction items were not significant before 2017, indicating that before the pilot reform of water resource taxation, the total factor productivity of high-water-consumption industrial enterprises in the experimental group and the control group had a similar trend, which meets the parallel trend hypothesis. In contrast, after the implementation of the policy, the regression coefficients of the interaction term are significantly positive from 2018 to 2021. In addition, this coefficient shows an increasing trend over time. The slight decline in the coefficient in 2020 and 2021 may be due to the impact of the novel coronavirus epidemic. This indicates that the reform of the water resource tax has gradually increased the total factor productivity of high-water-consumption industrial enterprises in the pilot areas.
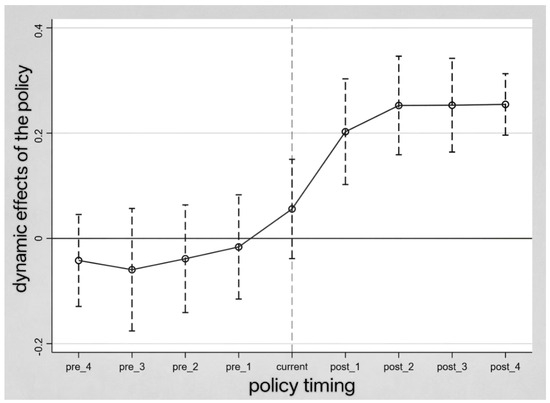
Figure 2.
Parallel trend test.
4.4. Benchmark Regression Analysis
The results of Table 4 show that after controlling for time and individual fixed effects, the regression coefficient of Treati × Timet is 0.025, indicating that after the implementation of the policy, the TFP of high-water-consumption industrial enterprises in pilot regions increased by 2.5 percentage points on average compared with those in non-pilot regions. This equates to a 0.21 (the result equals 8.41 × 2.5%) increase in the average TFP, which validates Hypothesis 1.
Table 4.
Benchmark regression.
The results of Table 4 also indicate that corporate board size, the average age of management, and the debt-to-asset ratio have positive impacts on TFP at levels of 2.6%, 1.1%, and 3.64%, respectively. Specifically, larger board sizes promote diversified perspectives in strategic decision-making, thereby significantly enhancing total factor productivity. Older management teams with accumulated industry experience facilitate TFP growth through mechanisms such as optimized resource allocation. Appropriate financial leverage pressures may force management to improve operational efficiency, thus boosting production efficiency. Finally, the cash ratio demonstrates a significant negative impact on TFP, as excessive cash reserves indicate inefficient capital allocation.
4.5. Robustness Test Analysis
To test the robustness of the results, the TFP measurement is replaced with the OP method. Specifically, the OP method incorporates investment data as an intermediary variable, effectively addressing endogeneity issues in production function estimation. By controlling the impact of investment on productivity, the OP method improves the accuracy of TFP measurement and reduces bias. After controlling for all fixed effects and variables, the regression result of Treati × Timet shown in Table 5 is 0.019, which is statistically significant. It shows that after the implementation of the policy, the TFP estimated using the OP method in pilot regions increased by 1.9 percentage points on average compared with those in non-pilot regions. This equates to a 0.16 (the result equals 8.41 × 1.9%) increase in average TFP. In addition, it confirms that the original results are robust and reliable.
Table 5.
Robustness test.
4.6. Impact Mechanism Analysis
4.6.1. Compensation Effect of Innovation
The water resource tax reform positively impacts total factor productivity by improving management and resource allocation efficiency rather than driving technological innovation. In the theoretical analysis, this paper hypothesizes that the shift from “water resource fee to tax” will not lead high-water-consumption enterprises to enhance TFP through increased innovation in the short term. To test this hypothesis (H2), this paper uses the natural logarithm of the number of patent applications plus one as a measure of enterprise innovation activities and conducts an empirical test.
Table 6 shows the regression results for technological innovation effects. In the first column, the coefficient of 5.17 is insignificant, and the results remain unchanged in columns two and three after adding time, regional fixed effects, and control variables. This indicates that the water resource tax reform does not significantly impact technological innovation in high-water-consumption industries, verifying Hypothesis H2.
Table 6.
Innovation compensation effect.
4.6.2. Compensation Effect of Management Optimization
This paper uses the sales expense rate (sales expense/operating income) as a proxy for management efficiency, taking its logarithm. A lower sales expense rate indicates better cost control and higher management levels. The estimation results are presented in Table 7. In column (1), without control variables and fixed effects, the regression coefficient is −0.213, which is significant at the 1% level. In column (2), after controlling for individual and time-fixed effects, the coefficient remains significant. In column (3), adding control variables, the regression coefficient is −0.045, which is significant at the 1% level, aligning with earlier results. The result shows that the water resources tax reform compels enterprises to re-examine their internal management processes, enhancing management efficiency through measures such as reducing unnecessary expenditures and optimizing supply chain management, thus improving overall production efficiency. These findings support Hypothesis H3.
Table 7.
Management optimization compensation effect.
4.6.3. Resource Allocation Efficiency
Table 8 presents regression results on capital allocation efficiency. In the first column, without control variables or fixed effects, the cross-multiplicative regression coefficient of Treati × Timet with L.Roait is 3.069, significant at the 1% level. In the second and third columns, after adding time, regional fixed effects, and control variables, the coefficients remain significant at the 1% level, with values of 3.348 and 3.020, respectively. Specifically, companies have reduced inefficient investments and allocated more funds to high-efficiency production stages. These findings indicate that the water resource tax reform has a significant positive impact on the capital allocation efficiency of industrial enterprises in the pilot area. The policy enhances total factor productivity in chemical enterprises by optimizing capital allocation, demonstrating the reform’s effectiveness in improving resource efficiency.
Table 8.
Capital resource allocation efficiency.
Column (2) of Table 9 shows the regression results of water resource taxation reform on labor resource mismatch in high-water-consumption industrial enterprises. The coefficient of Treati × Timet is significantly negative at the 5% level, indicating that the reform has significantly reduced labor resource mismatch and improved labor allocation efficiency in these enterprises. Specifically, by optimizing job positions and reducing redundant positions, labor resource mismatch can be decreased; therefore, it has improved productivity.
Table 9.
Labor resource allocation efficiency.
These results suggest that by enhancing both capital and labor allocation efficiency, the overall resource allocation efficiency of enterprises improves, leading to higher total factor productivity (TFP). This supports Hypothesis H4a, which posits that optimizing resource allocation efficiency is the mechanism through which water resource taxation reform improves TFP in high-water-consumption industries in pilot areas.
4.7. Heterogeneity Analysis
4.7.1. Heterogeneity Analysis of Enterprises with Different Property Rights
Table 10 presents the regression results on the impact of water tax reform on the total factor productivity of state-owned and non-state-owned high-water-consumption industrial enterprises. The results show that the DID coefficient for non-state-owned enterprises is significantly positive at the 1% level. Specifically, the reform led to an average increase of 8.7% in TFP for non-state-owned enterprises in pilot areas compared to non-pilot areas. However, the DID coefficient for state-owned enterprises is not significant, suggesting no notable improvement in TFP for state-owned enterprises in the experimental group compared to the control group. This indicates that they are less sensitive to tax pressures.
Table 10.
Heterogeneity of property rights.
4.7.2. Heterogeneity Analysis of Enterprises in Regions with Different Tax Rates
The varying water resource tax collection standards can create different tax burdens for enterprises, which in turn affect their total factor productivity. Assuming constant water consumption, a higher tax rate results in a heavier tax burden, while a lower tax rate implies a lighter burden. Enterprises may adopt different strategies based on their tax burden, leading to changes in total factor productivity. Following the existing literature, this paper divides the nine pilot areas into two groups—high-tax-rate areas and low-tax-rate areas—based on the average tax levy for surface water and groundwater, as presented in Table 11.
Table 11.
Tax rate variance.
Table 12 presents the group regression results for high-tax and low-tax areas. In high-tax-rate areas, the regression coefficients are 0.469 and 0.622, both significant at the 1% level. While the regression results in low-tax-rate areas are also significant at the 1% level, the coefficients are lower than those in high-tax areas. This indicates that high-water-consumption enterprises in high-tax-rate areas are more sensitive to the water resource tax reform policy compared to those in low-tax-rate areas.
Table 12.
Regional heterogeneity of tax rates.
5. Discussion
5.1. Impact of Water Resource Tax Reform on TFP in Enterprises
The implementation of the water resource tax effectively promotes total factor productivity (TFP) in high-water-consumption industrial enterprises by transforming flexible “fees” into rigid “taxes” and strengthening government oversight. This forces enterprises to internalize the water tax into operational costs. This conclusion aligns with the findings of Li Yonghai et al. (2024) [44] thereby validating Hypothesis H1. The volume-based taxation method, calculated based on resource extraction volumes, increases production costs and compels enterprises to enhance efficiency to offset tax pressures. In the short term, the reform does not boost TFP through technological innovation but rather through improved management and resource allocation efficiency. This contradicts the conclusions of Wei Jiao et al. (2024) [45]. Possible explanations include the following:
- (1)
- High-water-consumption enterprises face increased tax burdens during the initial policy phase, while innovation activities require substantial funding;
- (2)
- After the tax reform, innovation efforts may divert resources from short-term production and operations, negatively affecting immediate performance and dampening motivation for technological innovation in the short term. High-water-consumption enterprises face increased tax burdens, meaning that technological innovation, which requires significant funding and carries high risks, is not an immediate priority [15]. After the tax reform, innovation efforts may divert resources from short-term production and operations, negatively affecting immediate performance and dampening motivation for technological innovation in the short term [10]. Enterprises struggle to achieve energy-saving and efficiency goals through technological innovation in the short term. To comply with regulations, they often adopt compliance-driven emergency measures [36], such as improving management practices and the efficiency of capital allocation and reducing the level of labor resource mismatch to enhance TFP and address regulatory pressures. This conclusion is consistent with the findings of Tan Jiuming et al. (2022) [46], thereby confirming Hypotheses H3 and H4a.
Non-state-owned enterprises in pilot areas showed significant improvements in total factor productivity post-reform, while state-owned enterprises benefited from financial subsidies and easier access to bank financing. This reduced the adverse impact of the water resource tax reform, making state-owned enterprises less sensitive to cost pressures [47]. State-owned enterprises focus more on social and political goals than on profit maximization, which leads to a lack of motivation for improving resource allocation efficiency, technological innovation, and management [48]. This lack of motivation often results in a minimal response to regulatory changes, such as water resource tax reforms, leading to a weaker impact on their total factor productivity (TFP) [49].
Furthermore, this study finds that the impact of water resource tax reforms varies by region, with enterprises in high-tax-rate areas showing greater sensitivity to the reform. This is consistent with findings from previous studies that suggest that higher tax burdens push firms to adopt more water-saving technologies and improve operational efficiency to offset the additional costs [50,51]. Firms in low-tax regions, where the tax burden is less pronounced, show a weaker response in terms of improving water usage efficiency or enhancing TFP [52]. This regional disparity in response highlights the importance of tax rate intensity in driving firms’ behavior toward more sustainable and efficient practices.
The significant increase in the water tax has raised the consumption costs for high-water-consumption enterprises, particularly those in specialized industries. Facing higher tax pressures, these enterprises are compelled to implement water-saving measures to reduce their water usage [5,9]. In contrast, enterprises in low-tax areas experience less tax pressure, leading to a smaller impact on their business strategies and production efficiency. While they may still implement measures to improve TFP, the lower tax rate provides insufficient incentive for large-scale technological innovation optimization.
5.2. Policy Implications and Suggestions
Based on the above research, this paper proposes the following policy recommendations.
First, government supervision needs to be strengthened. The core objective of water resource taxation is to leverage the regulatory functions of the market and pricing mechanisms to incentivize and guide water users to voluntarily adjust their consumption behaviors. This approach aims to achieve water conservation and protection outcomes equivalent to or even surpassing those attained through direct government regulation [53].
The heterogeneity test results indicate that the water resource taxation reform has a significant positive impact on non-state-owned enterprises. This highlights the need for enhanced compliance oversight of state-owned enterprises. Reducing political intervention and improving environmental behavior incentives for state-owned enterprises can help overcome ownership differences, allowing them to leverage their advantages and achieve tax neutrality.
Second, cross-sectoral and cross-regional communication and cooperation should be improved. A unified water resource management mechanism should be established, clearly defining the responsibilities of various departments. The determination of water abstraction volumes relies on measurement facilities managed by the water resources department, which consequently remains engaged in water resource tax administration. This creates a collaborative framework between tax authorities and water resource departments, inevitably raising questions about the division of responsibility [54].
Third, the collection and management process must be improved. The water resource tax collection and management system should be streamlined to enhance efficiency. Tax rates should be adjusted according to regional water resource endowments to reduce the tax burden on enterprises. Strengthening coordination among departments will ensure the comprehensive implementation and success of water resource tax policies.
Fourth, different tax rates should be set according to local conditions. The imposition of higher differential tax rates on high-water-consumption industries is more effective in further promoting the use of unconventional water and reducing the use of conventional water to achieve water conservation targets [55].
Fifth, water resource taxes should be integrated with carbon taxes and pollution taxes to create a comprehensive environmental tax system. This system can encourage businesses to save water, cut emissions, and use resources better. It can also achieve multiple environmental goals through synergy. Studies show that carbon taxes not only reduce carbon emissions but also lower water footprints [56]. By cutting carbon emissions and water pollution, companies can also improve their health footprint, aligning with sustainable development. Overall, this integrated tax system can help save water, reduce carbon emissions, and enhance public health, boosting environmental, economic, and social benefits.
For enterprises, we suggest that they should promote green technology innovation. In terms of external pressure, green development is the realistic appeal of external stakeholders to enterprises [57]. Through green technological innovation, such as wastewater treatment and reuse technologies, enterprises can reduce wastewater discharge and maximize the value of wastewater, thereby improving the efficiency of water resource utilization. Furthermore, enterprises can not only realize the social benefits of energy conservation and emissions reductions but also produce more green-differentiated products than their competitors, so as to obtain an increased market share and cultivate unique green competitive advantages [58,59].
5.3. The Potential Limits and Future Perspectives of This Study
Although this study offers an in-depth analysis of the impact of water resource tax reform on the total factor productivity of high-water-consumption industrial enterprises, it has some limitations. Firstly, the sample focuses on high-water-consumption industrial enterprises listed on A-share markets between 2012 and 2022, excluding those in Hong Kong, Macao, Taiwan, and Tibet. While these listed companies provide valuable insights, they do not fully represent the broader group of non-listed high-water-consumption enterprises. Non-listed enterprises, differing in operation scale, management styles, and policy adaptability, may respond to water resource tax reform differently, meaning the results may not fully capture the impact on all high-water-consumption industries.
Secondly, this study uses the number of patent applications (plus one) as a proxy for innovation activities. However, patent counts may not accurately reflect a firm’s innovation capabilities, as other innovations, such as process improvements and business model innovations, which are not patentable, are also crucial. This limits this study’s ability to assess the full effect of innovation compensation. Additionally, using the sales expense ratio as a proxy for management efficiency might not comprehensively capture all aspects of management changes within enterprises. Future research could explore the long-term effects of the reform on technological innovation and TFP, using panel data over a longer time horizon. Additionally, surveys are a strong tool in social research [60,61]. Therefore, future research should incorporate survey data from non-listed enterprises, which could provide a more comprehensive understanding of the reform’s impact across different firm types.
6. Conclusions
This paper empirically examines the impact of the 2017 water resource tax reform on the total factor productivity (TFP) of high-water-consumption industrial enterprises using the difference-in-differences model. The results indicate that the water resource tax reform has significantly enhanced the TFP of these enterprises. However, the improvement is not driven by the innovation compensation effect but by increased resource allocation efficiency and improved management levels. Further analysis reveals that the reform’s positive effect on TFP is primarily observed in non-state-owned enterprises. Additionally, enterprises in high-tax areas are more responsive to the policy, showing greater motivation to improve TFP compared to those in low-tax areas. These findings remain robust after further testing. This study highlights that the water resource tax reform has successfully boosted the efficiency and productivity of high-water-consumption industrial enterprises, particularly in the private sector and in areas with higher tax rates.
Supplementary Materials
The following supporting information can be downloaded at: https://www.mdpi.com/article/10.3390/w17081208/s1.
Author Contributions
Conceptualization, X.S. and Y.W.; methodology, X.W.; software, X.W.; validation, H.W., X.W. and Y.W.; formal analysis, H.W.; investigation, X.W.; resources, Y.W.; data curation, X.W.; writing—original draft preparation, Y.W.; writing—review and editing, B.F.; visualization, X.S.; supervision, Y.W.; project administration, X.W.; funding acquisition, Y.W. All authors have read and agreed to the published version of the manuscript.
Funding
This research was funded by the following funds: (1) Anhui Provincial Key Research Project on Humanities and Social Sciences in 2023, “Research on the Mechanism of Digital Empowerment in the Comprehensive Improvement of Rural Living Environment in Anhui and the Optimization of Policies” (Project No.: 2023AH051571); (2) Interim research achievement from the Postdoctoral Research Station of Public Management at Nanjing Agricultural University (Postdoctoral ID: 349717); (3) Chuzhou University Research Start-up Project, “Research on the Patterns, Mechanisms, and Improvement Paths of Coordinated Development of Suburban Villages and Towns in Metropolitan Areas from a ‘Three-Dimensional’ Structural Perspective” (Project No.: 2023qd63); (4) 2024 Open Fund of Anhui Provincial Key Laboratory of Digital Technology and Rural Revitalization: “Research on the Development Paths and Support Systems of Rural Industries Driven by Digital Technology” (Project No.: ZSKF202408).
Data Availability Statement
The raw data supporting the conclusions of this article will be made available by the authors upon request.
Conflicts of Interest
The authors declare no conflicts of interest.
References
- Li, W.; Shuai, C.; Chen, X.; Huang, W.; Hou, W.; Sun, J.; Zhao, B. Decoding China’s industrial water use: Sectoral demand-driven impact and scarcity nexus. Stoch. Environ. Res. Risk Assess. 2024, 38, 4739–4760. [Google Scholar] [CrossRef]
- Licandeo, F.; Flores, F.; Feijoo, F. Assessing the impacts of economy-wide emissions policies in the water, energy, and land systems considering water scarcity scenarios. Appl. Energy 2023, 342, 121115. [Google Scholar] [CrossRef]
- Liu, H.; Liu, H.; Geng, L. Analysis of Industrial Water Use Efficiency Based on SFA–Tobit Panel Model in China. Sustainability 2024, 16, 8708. [Google Scholar] [CrossRef]
- Liu, H.; Ren, L.; Zhuo, H.; Fu, S. Water Footprint and Water Pinch Analysis in Ethanol Industrial Production for Water Management. Water 2019, 11, 518. [Google Scholar] [CrossRef]
- Wang, L.; Muniba, L.; Lakner, Z.; Popp, J. The Impact of Water Resources Tax Policy on Water Saving Behavior. Water 2023, 15, 916. [Google Scholar] [CrossRef]
- Mu, L.; Zhang, X.; Cheng, S.; Song, P. The effectiveness of a water resource tax policy in improving water-use efficiency: A quasi-natural experiment-based approach. Water Policy 2022, 24, 899–922. [Google Scholar] [CrossRef]
- Mu, L.; Mou, M.; Tang, H. Does the water resource ‘fee to tax’ policy alleviate water poverty? Evidence from a quasi-natural experiment. Water Supply 2022, 22, 8465–8482. [Google Scholar] [CrossRef]
- Xu, C.; Gao, Y.; Hua, W.; Feng, B. Does the Water Resource Tax Reform Bring Positive Effects to Green Innovation and Productivity in High Water-Consuming Enterprises? Water 2024, 16, 725. [Google Scholar] [CrossRef]
- Xin, C.; Guo, F.; Wang, A. Exploring the impacts of China’s water resource tax policies: A trade-off between economic development and ecological protection. Front. Environ. Sci. 2022, 10, 982085. [Google Scholar] [CrossRef]
- Qian, S. Ripples of change: Assessing the impact of water resource tax reform pilot on the green growth of China’s coastal cities. J. Sea Res. 2024, 198, 102479. [Google Scholar] [CrossRef]
- Zhu, H.; Zhang, A. The Impact of Water Resource Tax Reform on Green Technology Innovation: Evidence from Chinese A-Share Listed Enterprises. J. Knowl. Econ. 2024, 15, 17630–17648. [Google Scholar] [CrossRef]
- Huang, J.; Zhao, Z.; Yang, X.; Tian, Y. The impact of environmental fees to taxes on total factor productivity of manufacturing enterprises: Empirical evidence from China. Environ. Res. Commun. 2025, 7, 025006. [Google Scholar] [CrossRef]
- Kang, L.; Lv, J.; Zhang, H. Can the Water Resource Fee-to-Tax Reform Promote the ‘Three-Wheel Drive’ of Corporate Green Energy-Saving Innovations? Quasi-Natural Experimental Evidence from China. Energies 2024, 17, 2866. [Google Scholar] [CrossRef]
- Jing, L.; Zihao, W. Research on the Effects of Water Resource Tax Reform from the Dual Perspectives of Water Conservation and Emission Reduction: Evidence from Micro Industrial Enterprises. Rev. Ind. Econ. 2023, 6, 117–134. [Google Scholar] [CrossRef]
- Liu, C.Y. Can water resource tax reform improve the environmental performance of enterprises? evidence from China’s high water-consuming enterprises. Front. Environ. Sci. 2023, 11, 1155237. [Google Scholar] [CrossRef]
- Wang, Q.; Shimada, K.; Yuan, J. Water resource tax policy and micro environ-mental performance improvement in China’s water-intensive industries. Water Resour. Econ. 2025, 49, 100258. [Google Scholar] [CrossRef]
- Zhao, K.; Yao, P.; Liu, J. The Impact of Water Resource Tax on the Sustainable Development in Water-Intensive Industries: Evidence from Listed Companies. Sustainability 2024, 16, 912. [Google Scholar] [CrossRef]
- Porter, M.E.; Van Der Linde, C. Toward a New Conception of the Environment-Competitiveness Relationship. J. Econ. Perspect. 1995, 9, 97–118. [Google Scholar] [CrossRef]
- Wang, H.; Yang, G.; Ouyang, X.; Tand, Z.; Long, X.; Yue, Z. Horizontal ecological compensation mechanism and technological progress: Theory and empirical study of Xin’an River Ecological Compensation Gambling Agreement. J. Environ. Plan. Manag. 2023, 66, 501–523. [Google Scholar] [CrossRef]
- Chen, Z.R.; Yuan, Y.; Xiao, X. Analysis of the Fee-to-Tax Reform on Water Resources in China. Front. Energy Res. 2021, 9, 752592. [Google Scholar] [CrossRef]
- de Medeiros, J.F.; Vidor, G.; Ribeiro, J.L.D. Driving factors for the success of the green innovation market: A relationship system proposal. J. Bus. Ethics 2018, 147, 327–341. [Google Scholar] [CrossRef]
- Jin, W.; Zhang, H.Q.; Liu, S.S.; Zhang, H.B. Technological innovation, environmental regulation, and green total factor efficiency of industrial water resources. J. Clean. Prod. 2019, 211, 61–69. [Google Scholar] [CrossRef]
- Ambec, S.; Cohen, M.A.; Elgie, S.; Lanoie, P. The Porter Hypothesis at 20: Can Environmental Regulation Enhance Innovation and Competitiveness? Rev. Environ. Econ. Policy 2013, 7, 2–22. [Google Scholar] [CrossRef]
- Luo, Q.L.; Miao, C.L.; Sun, L.Y.; Meng, X.N.; Duan, M.M. Efficiency evaluation of green technology innovation of China’s strategic emerging industries: An empirical analysis based on Malmquist-data envelopment analysis index. J. Clean. Prod. 2019, 238, 117782. [Google Scholar] [CrossRef]
- Wang, Y.; Yu, L. Can the current environmental tax rate promote green technology innovation?—Evidence from China’s resource-based industries. J. Clean. Prod. 2021, 278, 123443. [Google Scholar] [CrossRef]
- Ouyang, X.; Li, Q.; Du, K. How does environmental regulation promote technological innovations in the industrial sector? Evidence from Chinese provincial panel data. Energy Policy 2020, 139, 111310. [Google Scholar] [CrossRef]
- Chang, J.; Kang, Y. Instrumental Variable Estimates of the Effect of Management Practices on Firm Performance in Korean Firms. J. Labor. Res. 2019, 40, 106–125. [Google Scholar] [CrossRef]
- Zhou, B.; Zhao, S. Industrial policy and corporate investment efficiency. J. Asian Econ. 2022, 78, 101406. [Google Scholar] [CrossRef]
- Zhu, X.; Chen, Y.; Feng, C. Green total factor productivity of China’s mining and quarrying industry: A global data envelopment analysis. Resour. Policy 2018, 57, 1–9. [Google Scholar] [CrossRef]
- Dong, X.; Guo, K.; Xue, G.; Yang, Y.; Xie, W.; Liu, C. Environmental Regulation, Resource Misallocation, and Total Factor Productivity: An Empirical Analysis Based on 284 Cities at the Prefecture-Level and Above in China. Int. J. Environ. Res. Public Health 2023, 20, 854. [Google Scholar] [CrossRef]
- Dong, X.; Yang, Y.; Zhao, X.; Feng, Y.; Liu, C. Environmental Regulation, Resource Misallocation and Industrial Total Factor Productivity: A Spatial Empirical Study Based on China’s Provincial Panel Data. Sustainability 2021, 13, 2390. [Google Scholar] [CrossRef]
- Choi, J.; Kim, I. Regional total factor productivity and local employment growth: Evidence from Korea. Asia-Pac. J. Reg. Sci. 2017, 1, 511–518. [Google Scholar] [CrossRef]
- Li, J.; Cao, Y. Does Water Resource Tax Reform Improve Water Resource Utilization Efficiency? A Study Based on DID and SCM Methods. Tax. Econ. Res. 2021, 26, 59–68. [Google Scholar] [CrossRef]
- Zhang, J. Evaluation of the Policy Effects of Expanding the Water Resource Tax Reform Pilot Program: A Perspective Based on Green Total Factor Productivity. Local Financ. Res. 2022, 10, 83–94. [Google Scholar]
- Yu, J.; Li, X. An Empirical Study on the Emission Reduction Effects of China’s Environmental Protection Tax. Tax. Econ. Res. 2018, 23, 76–82. [Google Scholar] [CrossRef]
- Zhou, Q.; Cui, X.; Ni, H.; Gong, L. The impact of environmental regulation policy on firms’ energy-saving behavior: A quasi-natural experiment based on China’s low-carbon pilot city policy. Resour. Policy 2022, 76, 102538. [Google Scholar] [CrossRef]
- Fan, M.; Yang, P.; Li, Q. Impact of environmental regulation on green total factor productivity: A new perspective of green technological innovation. Environ. Sci. Pollut. Res. Int. 2022, 29, 53785–53800. [Google Scholar] [CrossRef]
- Li, Z.; Mirko, C.; D’Agostino, M.T.; Jin, J. Comparative analysis of the influence of Chinese urban and rural family cultures on household financial asset allocation. Front. Psychol. 2023, 14, 1119258. [Google Scholar] [CrossRef]
- Guo, B.; Huang, X. Role of Digital Transformation on Carbon Performance: Evidence from Firm-Level Analysis in China. Sustainability 2023, 15, 13410. [Google Scholar] [CrossRef]
- Coviello, D.; Deserranno, E.; Persico, N. Minimum Wage and Individual Worker Productivity: Evidence from a Large US Retailer. J. Political Econ. 2022, 130, 2315–2360. [Google Scholar] [CrossRef]
- Liu, J.; Wang, G. Supply Chain Stability and Enterprises’ Total Factor Productivity: From the Perspective of Development Sustainability. Sustainability 2024, 16, 10265. [Google Scholar] [CrossRef]
- Olley, G.S.; Pakes, A. The Dynamics of Productivity in the Telecommunications Equipment Industry. Econometrica 1996, 64, 1263. [Google Scholar] [CrossRef]
- Levinsohn, J.; Petrin, A. Estimating Production Functions Using Inputs to Control for Unobservables. Rev. Econ. Stud. 2003, 70, 317–341. [Google Scholar] [CrossRef]
- Li, Y.; Jia, Z. Does the Imposition of Water Resource Tax Improve Enterprise Total Factor Productivity?—Evidence from A-Share Manufacturing Enterprises. J. Huaihua Univ. 2024, 43, 90–98. [Google Scholar] [CrossRef]
- Wei, J. Impact of the Water Resource Tax Reform Pilot Program on Total Factor Productivity of Chemical Enterprises. Master’s Thesis, Shanxi University of Finance and Economics, Taiyuan, China, 2024. [Google Scholar] [CrossRef]
- Tan, J. Can Water Resource Tax Reform Improve Enterprise Total Factor Productivity? Master’s Thesis, Central South University, Changsha, China, 2022. [Google Scholar]
- Allen, F.; Qian, J.; Qian, M. Law, finance, and economic growth in China. J. Financ. Econ. 2005, 77, 57–116. [Google Scholar] [CrossRef]
- Qin, Z.; Tu, C.; Han, W.; Jiang, Q. The impact of market-incentive environmental regulation policies on corporate environmental costs: Evidence from China’s carbon trading policy. PLoS ONE 2024, 19, e0297003. [Google Scholar] [CrossRef]
- Dinar, A. Challenges to Water Resource Management: The Role of Economic and Modeling Approaches. Water 2024, 16, 610. [Google Scholar] [CrossRef]
- Wang, J.; Zhang, S. Environmental protection tax, green innovation, and environmental, social, and governance performance. Financ. Res. Lett. 2024, 65, 105592. [Google Scholar] [CrossRef]
- Li, J.; Li, S. Environmental protection tax, corporate ESG performance, and green technological innovation. Front. Environ. Sci. 2022, 10, 982132. [Google Scholar] [CrossRef]
- Peng, C.; Zhao, L.; Liu, L.; Chen, J. The Influence of Environmental Protection Tax Law on Urban Land Green Use Efficiency in China: The Nonlinear Moderating Effect of Tax Rate Increase. Sustainability 2023, 15, 12431. [Google Scholar] [CrossRef]
- Bao, Z. Research on the Purpose of Water Resource Tax and Institutional Improvement. Tax. Res. 2020, 8, 43–48. [Google Scholar] [CrossRef]
- Tianbao, Q.; Bo, W. Comprehensively Implementing the Water Resource Tax: System Optimization and Legislative Improvement. China Tax. 2024, 11, 32–36. [Google Scholar] [CrossRef]
- Shan, S.; Ni, H.; Lin, X.; Chen, G. Evaluation of water saving and economy impact for tax reform policy using CGE model with integrated multiple types of water. Water 2023, 15, 2118. [Google Scholar] [CrossRef]
- Sun, Y.; Zhi, Y.; Zhao, Y. Indirect effects of carbon taxes on water conservation: A water footprint analysis for China. J. Environ. Manag. 2021, 279, 111747. [Google Scholar] [CrossRef]
- Wang, M.; Li, Y.; Wang, Z.; Li, J. The heterogeneous relationship between pollution charges and enterprise green technology innovation, based on the data of chinese industrial enterprises. Energies 2022, 15, 1663. [Google Scholar] [CrossRef]
- Sellitto, M.A.; Camfield, C.G.; Buzuku, S. Green innovation and competitive advantages in a furniture industrial cluster: A survey and structural model. Sustain. Prod. Consum. 2020, 23, 94–104. [Google Scholar] [CrossRef]
- Tu, Y.; Wu, W. How does green innovation improve enterprises’ competitive advantage? The role of organizational learning. Sustain. Prod. Consum. 2021, 26, 504–516. [Google Scholar] [CrossRef]
- Faye, B.; Du, G.; Li, Q.; Sané, T.; Mbaye, E.; Zhang, R. Understanding the characteristics of agricultural land transition in Thiès region, Senegal: An integrated analysis combining remote sensing and survey data. Front. Environ. Sci. 2023, 11, 1124637. [Google Scholar] [CrossRef]
- Zhou, J.; Yang, J.; Faye, B. Addressing the ‘Lying Flat’ Challenge in China: Incentive Mechanisms for New-Generation Employees through a Moderated Mediation Model. Behav. Sci. 2024, 14, 670. [Google Scholar] [CrossRef]
Disclaimer/Publisher’s Note: The statements, opinions and data contained in all publications are solely those of the individual author(s) and contributor(s) and not of MDPI and/or the editor(s). MDPI and/or the editor(s) disclaim responsibility for any injury to people or property resulting from any ideas, methods, instructions or products referred to in the content. |
© 2025 by the authors. Licensee MDPI, Basel, Switzerland. This article is an open access article distributed under the terms and conditions of the Creative Commons Attribution (CC BY) license (https://creativecommons.org/licenses/by/4.0/).