Article

Comprehensive Assessment of Water Resource Carrying Capacity Based on Improved Matter–Element Extension Modeling

by
Juqin Shen
1,
Yong Nie
2,
Xin Huang
1,* and
Meijing Ma
1
1
College of Agricultural Science and Engineering, Hohai University, Nanjing 211100, China
2
Business School, Hohai University, Nanjing 211100, China
*
Author to whom correspondence should be addressed.
Water 2025, 17(8), 1197; https://doi.org/10.3390/w17081197
Submission received: 3 March 2025 / Revised: 4 April 2025 / Accepted: 12 April 2025 / Published: 16 April 2025

Abstract

:
The evaluation of water resource carrying capacity (WRCC) is crucial for guiding regional water management. This study established a WRCC evaluation index system and standards for the middle and lower Yangtze River, covering four subsystems: water resources, and social, economic, and ecological dimensions. The study improved the matter–element extension model by introducing triangular fuzzy numbers. The enhanced model was then used to assess the WRCC of seven provinces in the middle and lower Yangtze (2015–2023). Furthermore, GIS was used to examine the spatiotemporal variations and driving factors of WRCC. The main conclusions are as follows: (1) from 2015 to 2023, the evaluated level of WRCC in the Yangtze River’s middle and lower reaches remained stable and improved overall. Among them, the WRCC of Shanghai rose most significantly, from level III to level I. Zhejiang’s WRCC remained stable at level II, while Hubei and Hunan remained stable at level III, but with a trend toward improvement. Jiangsu’s WRCC fluctuated significantly. (2) The evaluation values of the subsystems in each region show a certain level of volatility. The water resource subsystem remained relatively stable in most regions, the social subsystem showed some variability, and both the economic and ecological subsystems developed well, showing positive effects in economic development and ecological protection in various regions. (3) The water resource subsystem had the greatest influence on WRCC. Per capita water resources, the urbanization rate, the greening coverage rate in built-up areas, and per capita GDP have the most significant impact on the WRCC in the Yangtze River’s middle and lower reaches.

1. Introduction

Water is a critical strategic resource for the sustainable development of human society [1]. Currently, with the continuous growth of the global population and accelerated urbanization, issues such as water scarcity and environmental degradation are becoming increasingly severe [2]. According to the United Nations World Water Development Report 2023, two billion people already live in countries experiencing severe water scarcity, and this number may increase to five billion by 2050 [3]. In particular, despite possessing 36% of the world’s water resources, Asia supports 60% of the global population, with a water stress index 2.3 times higher than Europe’s. This has become a global challenge. Water resource carrying capacity (WRCC) refers to the ability of water resources in a specific region or watershed to support social and economic development to the greatest extent, based on the principles of sustainable development, the foreseeable levels of economic, technological, and social development, and the condition of maintaining a healthy ecosystem, which is achieved through optimized allocation [4,5]. When the WRCC exceeds a certain threshold, it severely restricts the sustainable development of the economy and society, directly impacting food and ecological security [6].
The Yangtze River Economic Belt is a crucial engine for China’s economic development, and its ecological protection and green development hold significant and far-reaching implications for the country’s sustainable development [7]. Spanning across three major regions of eastern, central, and western China, the Yangtze River Economic Belt accounts for over 40% of the national population and GDP. The total water resources in the Yangtze River Economic Belt are abundant, with an average annual water volume of approximately 995.9 billion cubic meters, which constitutes 36% of the national river runoff, ranking first among all major rivers in China [8]. However, the water resources in the Yangtze River Economic Belt are unevenly distributed. The upper reaches are relatively rich in water resources, while the middle and lower reaches face greater pressure due to their dense populations and frequent economic activities. Meanwhile, with continuous economic development and the gradual improvement in living standards, various ecological and environmental issues have emerged in the Yangtze River Economic Belt. The water environmental conditions along the river basin have become increasingly severe. Problems such as water scarcity with poor water quality, drinking water source security risks, deterioration in water quality, and damage to the water ecosystem have not been fundamentally resolved, severely limiting the sustainable development of the Yangtze River Economic Belt. As a region rich in freshwater resources, the utilization and protection of water resources in the Yangtze River Economic Belt are particularly important [9]. In 2024, the Ministry of Water Resources of China emphasized accelerating the implementation of a rigid water resource constraint system, strengthening the rigid constraints on WRCC, and promoting the development of a water resource monitoring system. Therefore, analyzing the WRCC of the Yangtze River Economic Belt and improving the efficiency of water resource utilization are of great theoretical and practical significance for enhancing ecological protection and promoting high-quality development in the region.
This study constructs an index system from the perspectives of water resources, society, the economy, and ecology. To address the issue of weights in the evaluation model, triangular fuzzy numbers (TrFNs) are introduced into the subjective weight model. This reduces the impact of unclear expert language boundaries. The model is then combined with the matter–element extension model to construct a WRCC evaluation model. As a result, the scientificity and accuracy of weight determination in the evaluation model are improved, making the final WRCC evaluation results more reliable and valuable for reference purposes.
This study makes three key contributions: First, we developed a WRCC evaluation index system and grading standards tailored to the middle and lower Yangtze River basin, enabling the accurate detection of hidden overloading risks. Second, TrFNs were incorporated into the Analytic Hierarchy Process (AHP) to address ambiguity in expert assessments and improve the precision of subjective weighting. Third, we built a comprehensive WRCC evaluation framework combining TrFNs, subjective–objective weighting methods, and the matter–element extension model (MEEM), which serves as a quantitative tool for cross-regional WRCC analysis. These results contribute to innovation in the WRCC evaluation methodology and provide practical insights for regional water management.

2. Literature Review

2.1. Connotations of Water Resource Carrying Capacity

Scholars have varying interpretations of the meaning of WRCC. There is limited research on WRCC abroad, where scholars often discuss concepts such as the “ratio of water supply to water demand” [10] and “water availability”. In 1993, Xu Youpeng et al. [11] conducted comprehensive evaluation studies using fuzzy comprehensive evaluation methods. In 2000, Li Lingyue and others [12] introduced the concepts of sustainable development and ecologically positive cycles, emphasizing the importance of the rational development and utilization of water resources. In 2001, Wang Shucheng repeatedly discussed WRCC, sparking a new wave of research. The concept of WRCC gradually improved and can now be summarized into three main views: the maximum supporting power of water resources, the maximum supported scale of water resources, and the maximum development capacity of water resources [13]. In 2016, the Ministry of Water Resources officially launched the construction of a national WRCC monitoring and early warning system. As the research deepened, the definition of WRCC gradually expanded. Wang Jianhua and others [14] pointed out that WRCC is a comprehensive indicator used to evaluate whether water resources, economic development, and the ecological environment are developing in a coordinated manner. Studying WRCC is highly important for achieving harmony between water and people.

2.2. Water Resource Carrying Capacity Evaluation Indicators

Building a scientifically reasonable WRCC indicator system is fundamental to accurately assessing WRCC. Researchers have developed diverse indicator systems from different perspectives. The evaluation indicators are generally divided into three categories: pressure indicators, state indicators, and response indicators [15]. Pressure indicators include the per capita irrigation water consumption, per capita daily domestic water consumption, and per capita COD emissions, among others. State indicators include per capita water resources, the water production coefficient, and the water supply–demand ratio. Response indicators include the water resource development and utilization rate, the urban sewage treatment rate, the water functional area compliance rate, and the industrial water reuse rate. The per capita irrigation water consumption reflects the pressure of agricultural production activities on water resources. With the advancement of agricultural modernization, the application of efficient irrigation techniques is crucial to reducing this indicator [16]. Per capita daily domestic water consumption reflects the degree of water resource consumption in daily life, which is influenced by factors such as lifestyle, the economic development level, and water supply conditions [17]. Per capita COD emissions reflect the pressure of chemical oxygen demand from human activities on the water resource environment. When selecting indicators, various factors such as population, resources, society, economy, and ecology are typically considered [16,18], which effectively reflect the harmonious coexistence of the components in WRCC research. Only when a balance and coordination are achieved in areas such as population, resources, society, economy, and ecology can the sustainable utilization of water resources and regional sustainable development be realized.

2.3. Water Resource Carrying Capacity Evaluation Methods

Commonly used WRCC evaluation methods, both domestically and internationally, mainly fall into two categories: indicator-based evaluation methods and system dynamics methods [19,20]. The indicator-based method quantifies the evaluation of WRCC by constructing a comprehensive indicator system, which includes fuzzy comprehensive evaluation [21], principal component analysis [22], set pair analysis [23], and the extension model of matter–element theory [24]. The fuzzy comprehensive evaluation method can effectively handle uncertainty in the evaluation process, but the determination of the weight of evaluation factors is often difficult and easily influenced by personal experience and subjective preferences. Wang Yumin et al. [25] used the fuzzy MEEM to evaluate the WRCC of four cities: Beijing, Tianjin, Shanghai, and Chongqing. Principal component analysis can combine numerous water resource, socio-economic, and ecological indicators into several principal components, making the evaluation more concise and clear. However, the interpretation of the principal components involves a certain degree of subjectivity. The set pair analysis method’s connection degree difference coefficient and the opposite coefficient do not effectively meet the requirements for multi-level evaluation. The extension model of matter–element theory, based on the theory of matter–element analysis, can effectively solve the incompatibility problem between indicators, and it has been widely used in water resource carrying capacity evaluations in recent years. However, traditional MEEMs still have room for improvement in terms of weight determination and correlation degree calculations. Common improvement methods include combining the AHP [26], the entropy weight method, and others. The AHP constructs a hierarchical structure model, using expert scoring and judgment matrices to determine the weight of each evaluation indicator [27]. These improvement methods have provided valuable experience and references for both theoretical research and practical applications in WRCC. The combination of AHP and the extension model of matter–element theory has significant advantages in WRCC evaluation, as it can effectively handle multi-factor comprehensive evaluation problems and provide relatively objective evaluation results. By combining it with the entropy weight method and other methods, the weight distribution can be further optimized, enhancing the scientific validity and reliability of the evaluation results.
Currently, in addition to common evaluation models, there are also other distinctive WRCC evaluation models. To address uncertainty in the evaluation process, researchers have proposed a WRCC evaluation method based on the multi-dimensional cloud model, referencing the one-dimensional cloud model theory [28]. Taking Beijing as an example, researchers compared and evaluated three evaluation models: five-element subtraction set pair potential, logistic, and TOPSIS. The results showed that the five-element subtraction set pair evaluation model had the highest accuracy in its results, which also reflected the indicator status to a certain extent; it was also more consistent with the WRCC in Beijing [29].

2.4. Literature Review and Critique

Although the existing research has achieved certain results, there are still some shortcomings:
First, there is a lack of unified standards for indicator system construction, with insufficient consideration of ecological and environmental indicators. The construction of the WRCC evaluation indicator system is a key foundation for water resource management. However, there are still issues such as the lack of unified standards and the neglect of ecological and environmental indicators. Scholars differ widely in terms of indicator selection, weight distribution, and evaluation criteria, leading to difficulties in making horizontal comparisons of evaluation results. Moreover, some studies fail to fully consider the importance of ecological and environmental indicators in the construction of indicator systems, which limits the ability of the evaluation results to comprehensively reflect the sustainability of the water resource system.
Second, model improvements need further optimization. Although improvements to the MEEM using the Analytic Hierarchy Process (AHP) and entropy weight method have certain advantages in evaluating WRCC, there are still some deficiencies. The entropy weight method itself can generate relatively objective weights, but, in practice, it often needs to be combined with more subjective methods like AHP to determine the weights. While this improvement method has enhanced the scientific validity of weight determination to some extent, it is difficult to eliminate the influence of subjective factors completely. Additionally, current improvement methods often focus on static analysis in WRCC evaluations and lack a consideration of dynamic changes. Over time, with socio-economic development, the WRCC also changes. Therefore, further improvements are needed to better adapt to the dynamic changes in WRCC.
Third, there has been insufficient in-depth study of the spatiotemporal dynamic changes in the WRCC of the Yangtze River Economic Belt. The existing research is mostly based on static cross-sectional data or short-term time-series analysis, which makes it difficult to reveal the long-term spatiotemporal evolution patterns of WRCC. Regarding the spatial dimension, detailed research on smaller scales, such as specific cities or sub-basins within a region, is rare. There is a lack of multi-scale nested analyses of “watershed-city cluster provinces”, making it difficult to reveal the interaction mechanisms of WRCC at different spatial scales.
Building on this analysis, this study first develops a WRCC evaluation index system across four dimensions: water resources, social, economic, and ecological. Then, we create a WRCC assessment framework integrating TrFNs, subjective–objective weighting methods, and the MEEM. Lastly, employing 2015–2023 data, a dynamic WRCC evaluation is performed for seven provinces in the middle-lower Yangtze region. The study reliably diagnoses regional water resources conditions and offers evidence-based support for water resource planning and management.

3. Data Sources and Model Construction

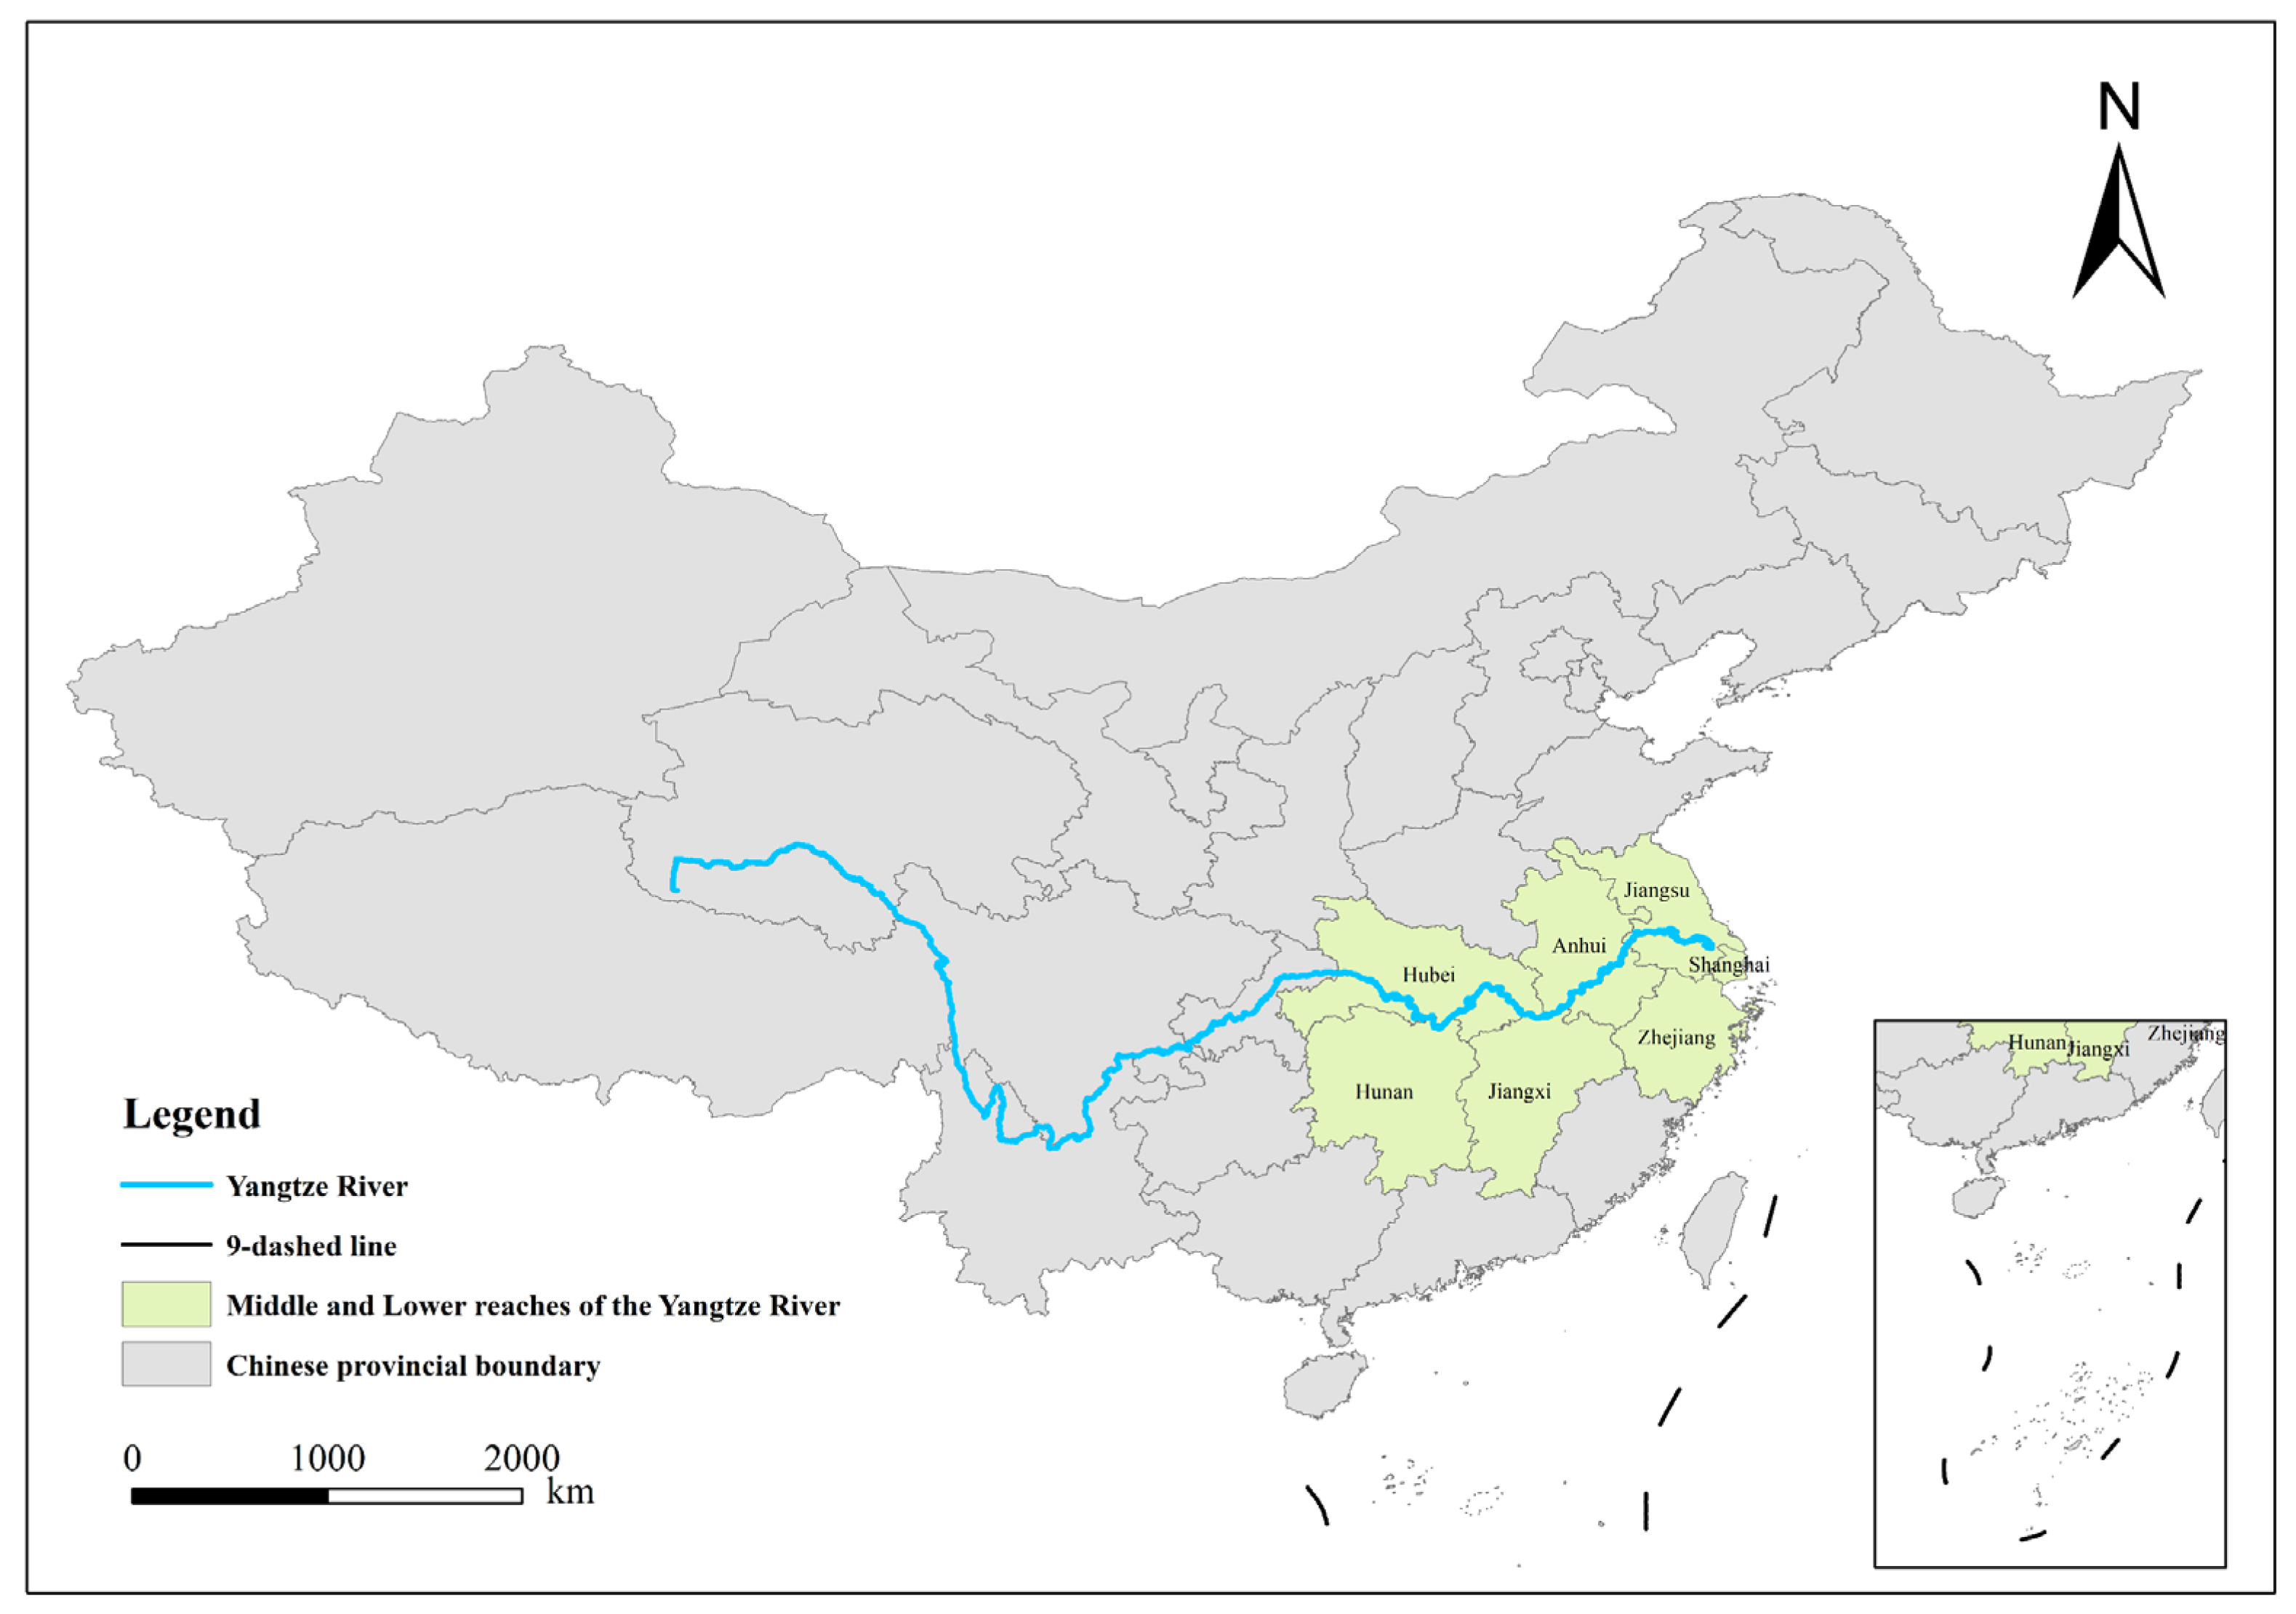
3.1. Overview of the Study Area

The Yangtze River, with a total length of 6363 km, is China’s largest river, the longest in Asia, and the third longest in the world. The middle and lower reaches of the Yangtze River encompass seven provincial-level administrative regions: Shanghai, Jiangsu, Zhejiang, Anhui, Jiangxi, Hubei, and Hunan (Figure 1). This area is one of China’s most economically vibrant and ecologically significant regions, characterized by complex human–environment interactions.
Climate and Geography. The middle and lower Yangtze regions experience a typical subtropical monsoon climate, with an annual average temperature of 15–18 °C. Precipitation exhibits significant spatiotemporal variability, following a “south—more, north—less; summer—more, winter—less” pattern. Annual precipitation ranges from 1000 to 1600 mm, with over 60% occurring from June to September. The terrain consists mainly of plains and hills (≈65%), with higher elevations in the west and lower in the east.
Economy and Society. The middle and lower Yangtze constitutes China’s core economic zone. In 2023, the region had a permanent population of 380 million (27.1% of the national total) and contributed 34.7% of China’s GDP, with an urbanization rate of 68.3%. However, internal development is uneven, showing distinct gradients: the Yangtze River Delta core (Shanghai, Jiangsu, and Zhejiang) has entered a post-industrial stage (tertiary sector > 55%), while the central provinces (Anhui, Jiangxi, Hubei, and Hunan) are undergoing accelerated industrialization (secondary sector 45–52%). Regional water-use efficiency varies significantly: Shanghai’s water consumption per CNY 10,000 GDP (9.8 m3) was only 20.3% of Hunan’s (48.3 m3) in 2023, reflecting close linkages between development stages and water-use patterns.
Hydrology. The region features an extensive river network and major freshwater lakes (e.g., Dongting Lake, Poyang Lake). However, climate change and human activities have recently caused marked hydrological changes, including increased extreme events (e.g., the 2020 basin-wide flood and the 2022 mega-drought) and intensified seasonal lake area fluctuations (e.g., Dongting Lake shrank by 60% in 2022). These changes pose severe challenges to regional water resource stability.
Thus, evaluating water resources carrying capacity (WRCC) across these seven provinces is crucial for coordinating water use with socioeconomic development. A scientific WRCC assessment can inform optimal water allocation and help to balance economic growth with ecological protection, providing critical support for high-quality development in the Yangtze River Economic Belt.

3.2. Data Sources

This study selects the period from 2015 to 2023 primarily because it encompasses China’s 13th Five-Year Plan (2016–2020) and 14th Five-Year Plan (2021–2025)—two critical planning phases that systematically capture the dynamic responses of water resource carrying capacity (WRCC) in the middle-lower Yangtze region to transformative water management policies (e.g., the intensified implementation of the strictest water resources management system and nationwide adoption of the River/Lake Chief System). Furthermore, since 2015, China’s water resources and environmental statistical systems have achieved significant standardization improvements, with enhanced continuity and comparability of provincial water resources bulletins and environmental monitoring data, providing a reliable foundation for indicator construction.
The relevant data were sourced from the following publications and reports: the China Statistical Yearbook (2015–2023), the China Water Resources Bulletin (2015–2023), the China Environmental Statistical Yearbook (2015–2023), the China Urban and Rural Construction Statistical Yearbook (2015–2023), and statistical yearbooks, water resources bulletins, and the National Economic and Social Development Statistical Bulletins from Hubei, Hunan, Jiangxi, Anhui, Jiangsu, Zhejiang, and Shanghai provinces and municipalities.

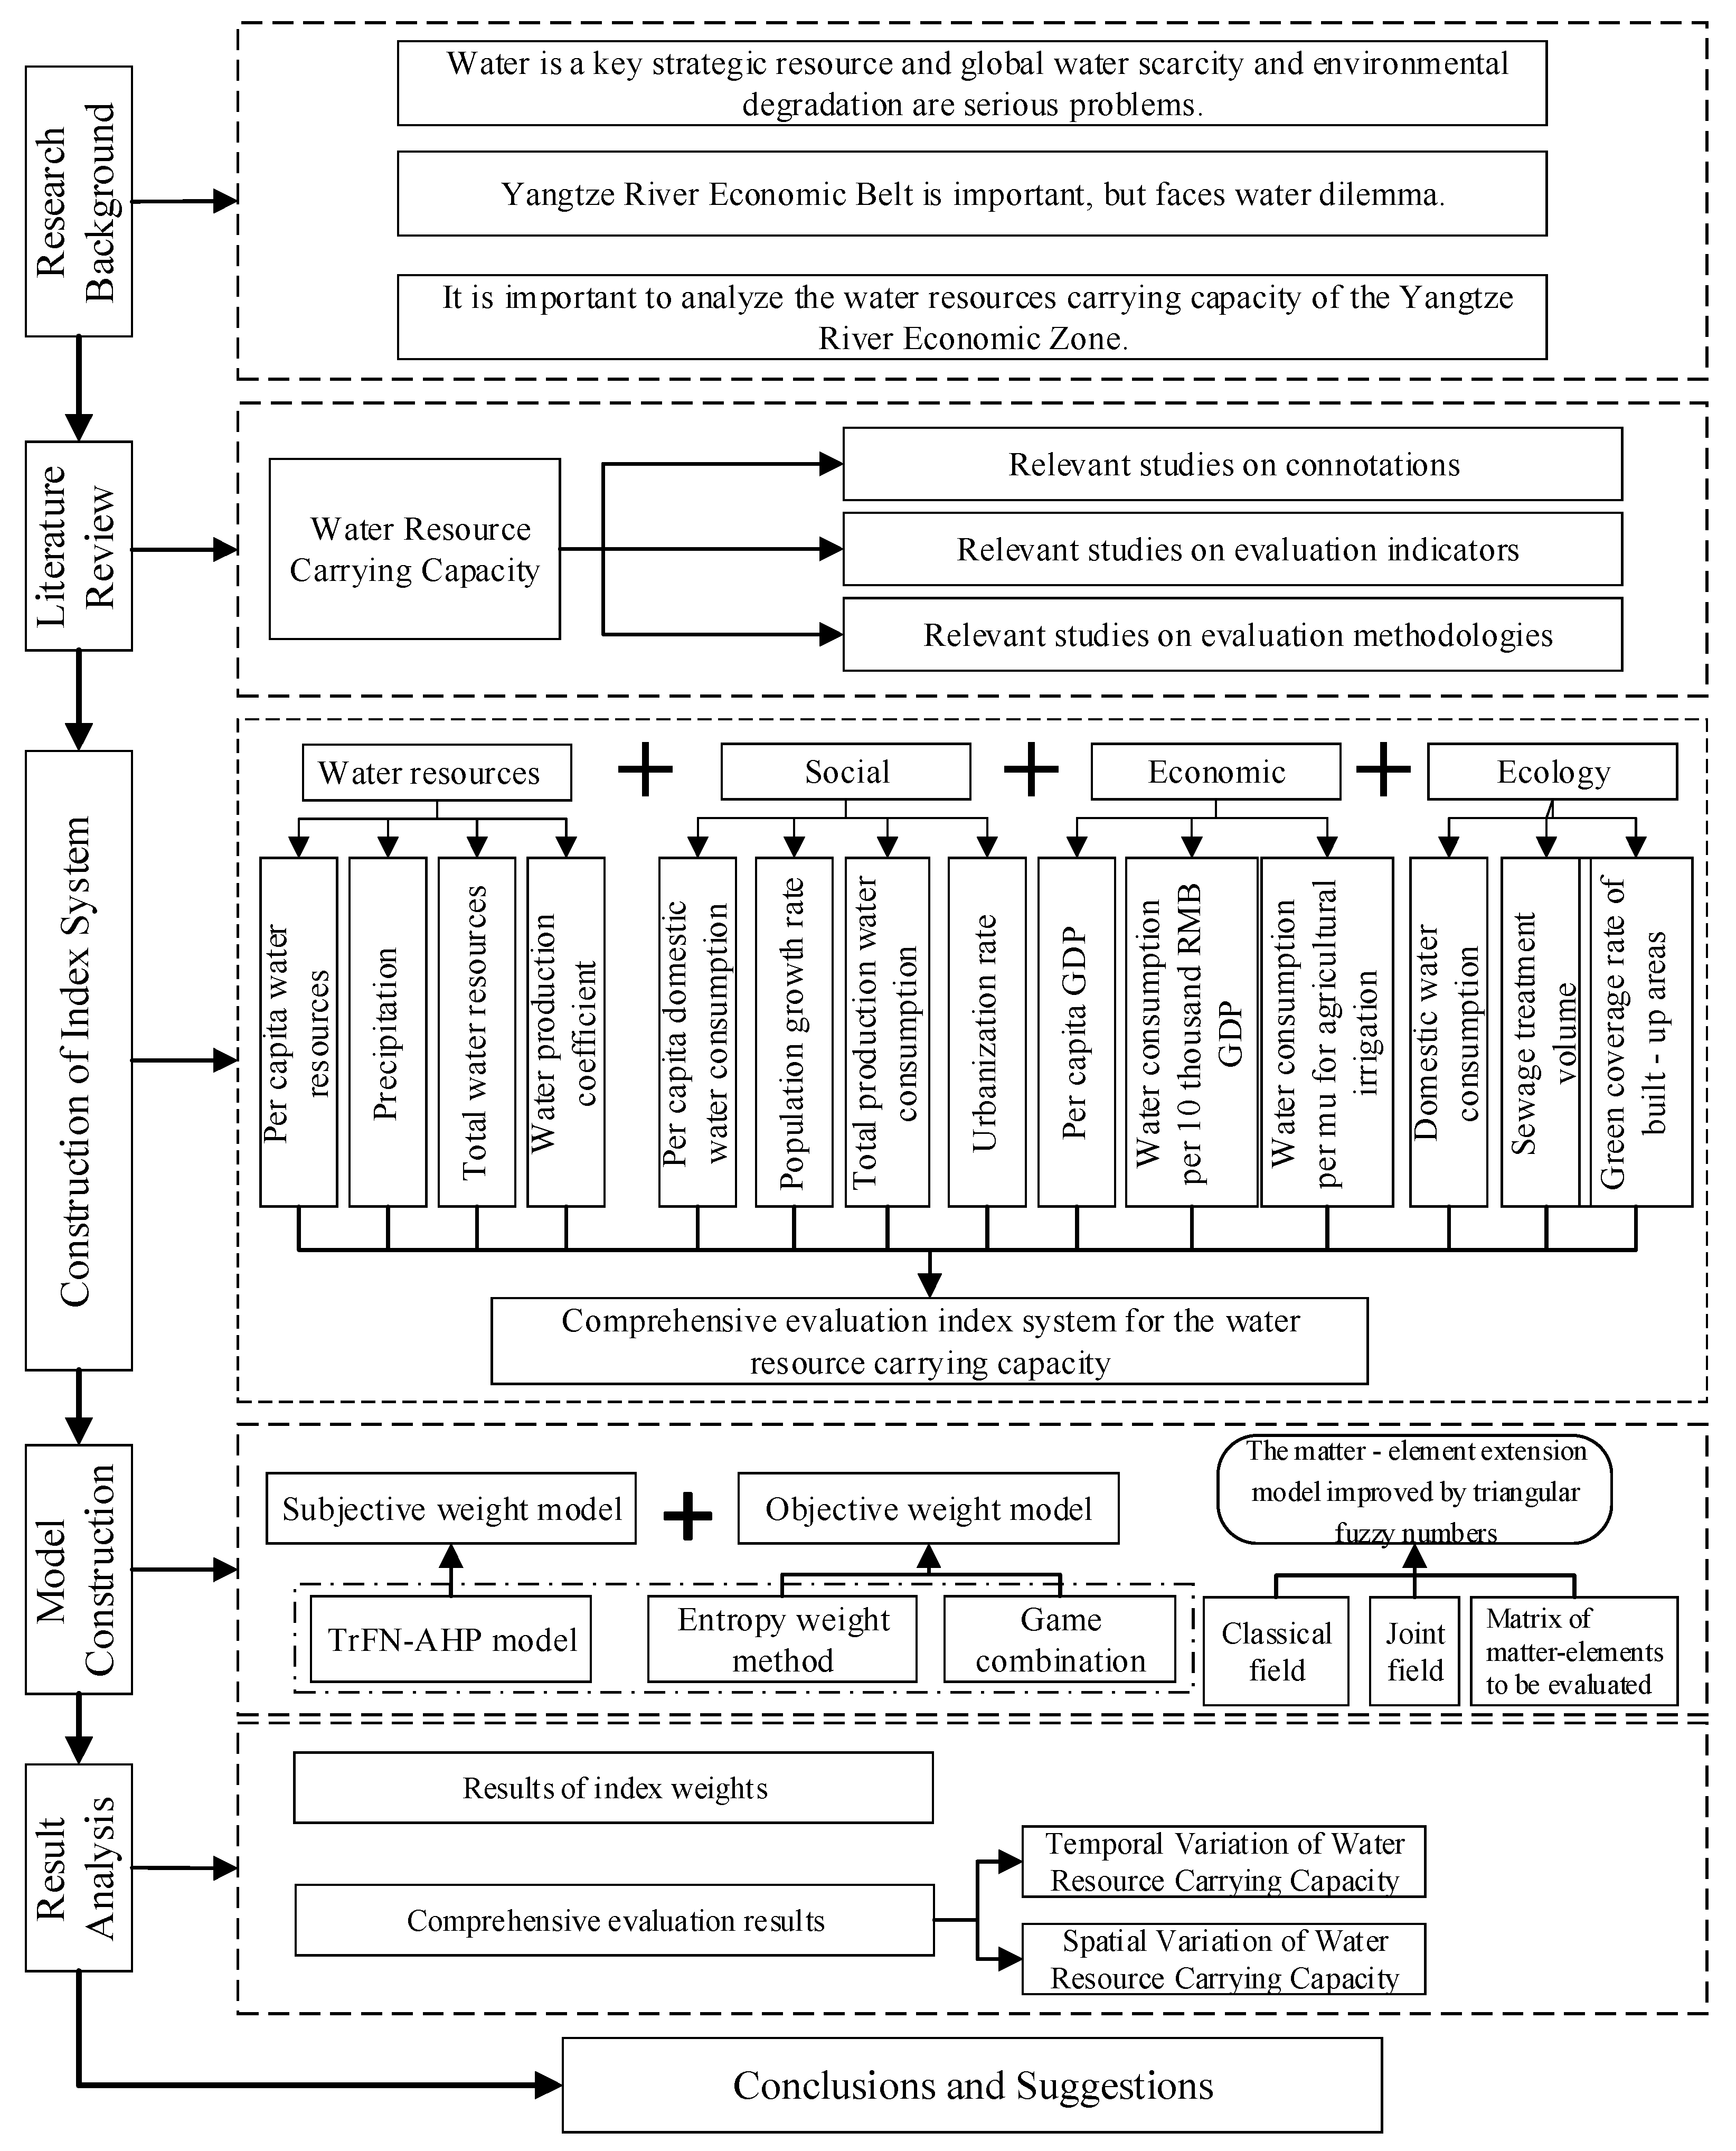
3.3. Research Framework

This study primarily focuses on the analysis of the “research background, literature review, indicator system construction, model construction, result analysis, and conclusions and recommendations”. First, it summarizes the shortcomings of the existing evaluation methods and models for WRCC. Second, multi-source data from 2015 to 2023 are collected to construct a multidimensional indicator system. The extension model of the MEEM is improved and applied. Third, the WRCC of the Yangtze River Economic Belt is evaluated, and its spatiotemporal changes are analyzed, while discussing the influencing factors. Finally, the research findings are summarized, and targeted recommendations are provided. The specific research process is shown in Figure 2.

3.4. Indicator System Construction

In WRCC research, constructing a scientific evaluation index system requires a systematic consideration of element integration and data availability [16,30]. Based on the regional characteristics of the provinces of the Yangtze River Economic Belt, this study establishes a four-level evaluation framework with 14 indicators across the dimensions of water resources, and social, economic, and ecological factors (see Table 1), covering the 2015–2023 period. This framework design follows three key rationales. First, WRCC fundamentally evaluates WRCC to support socio-economic development, which inherently reflects the integrated performance of water–society–economy–ecosystem subsystems. Thus, we selected these four subsystems as guideline-layer indicators, incorporating metrics including per capita water resources, water consumption per CNY 10,000 GDP, and per capita GDP to construct a comprehensive WRCC evaluation system that captures subsystem interactions. Notably, while water quality parameters (e.g., COD, BOD) may influence water availability, their impact remains marginal in regional-scale WRCC assessments—particularly in water-abundant basins such as the Yangtze. Consequently, our WRCC index system intentionally excludes direct water quality indicators.

3.5. Model Construction

The MEEM is a combination of matter–element analysis and extension theory, which has unique advantages in solving multi-level and multi-objective problems. However, as the complexity of the problems being solved increases, the traditional MEEM gradually reveals some limitations. First, when determining the weight of indicators in the traditional MEEM, scholars often use the AHP to determine the subjective weight of indicators. However, due to human subjectivity, the judgment of indicators often contains some fuzziness, and the traditional AHP method cannot adequately reflect this characteristic. Second, using either subjective or objective weights alone contradicts the nature of the problem itself. Subjective weights are limited by the expertise and personal judgment of the evaluators, while objective weights may fail to align with actual conditions during problem solving. Third, in the traditional MEEM, the correlation degree function is quantitatively calculated using mathematical methods based on evaluation standards and goals to determine the level of the evaluation object. However, the levels themselves contain fuzziness, and there is no absolute boundary between adjacent levels. Thus, the traditional MEEM may not be entirely applicable when addressing certain issues. Fourth, the traditional MEEM uses the maximum membership principle to determine the evaluation level, which causes information loss and may lead to significant differences in evaluation results.
Based on this, this study improves the model. First, TrFNs are introduced into the AHP method to form the TrFN-AHP model, which is used to determine the subjective weight of indicators. This method replaces the single-point value judgment of traditional AHP with intervals, describing the “fuzziness” in subjective judgments, making the results more representative. Second, the entropy weight method is used to determine the objective weight of the indicators, and the game-theory-based weighting approach is applied to determine the combined weight of the indicators. This method avoids the excessive dependence on personal opinions encountered in subjective weighting and ensures that the objective weights align with actual conditions. Finally, the closeness function replaces the correlation degree function in the traditional MEEM, solving the information loss problem caused by the maximum membership principle in the traditional model.

3.5.1. Indicator Weighting Model

Triangular Fuzzy Analytic Hierarchy Process (TrFN-AHP)

Traditional fuzzy AHP typically employs interval numbers to characterize fuzziness in judgment matrices, whereas the triangular fuzzy number-AHP (TrFN-AHP) utilizes a unique three-tier structure—“maximum boundary, most probable value, minimum boundary”—to represent cognitive uncertainty in expert judgments. Compared with conventional FAHP, this approach maintains the inherent fuzziness of original expert assessments while progressively refining uncertainty quantification, demonstrating distinct advantages for WRCC evaluation. The TrFN-AHP modeling procedure involves the following steps.
Suppose there are n evaluation factors in one layer of the evaluation criteria. The triangular fuzzy judgment matrix (TrFN-Judgment Matrix) is constructed based on expert assessments and denoted as A = ( a i j ) n × n . The evaluation method is shown in Table 2 [40], where a i j represents the relative importance of factor i compared to factor j . Unlike the traditional AHP method, the value a i j is here represented by a TrFN. The TrFN is expressed as a i j = [ l i j , m i j , u i j ] , where l i j , m i j , and u i j are the lower, middle, and upper values of the fuzzy number, respectively, as described below:
a j i = a i j 1 = [ 1 u i j , 1 m i j , 1 l i j ]
According to the expansion principle, the calculation methods for TrFN M 1 = [ l 1 , m 1 , u 1 ] and M 2 = [ l 2 , m 2 , u 2 ] are shown in Table 3.
Based on the TrFN-Judgment Matrix, the overall fuzzy degree of each indicator is calculated. The overall fuzzy degree of factor j is:
P j = j = 1 n a i j × ( i = 1 n j = 1 n a i j ) 1
where:
j = 1 n a i j = [ j = 1 n l i j , j = 1 n m i j , j = 1 n u i j ]
i = 1 n j = 1 n a i j = [ i = 1 n j = 1 n l i j , i = 1 n j = 1 n m i j , i = 1 n j = 1 n u i j ]
( i = 1 n j = 1 n a i j ) 1 = [ 1 i = 1 n j = 1 n u i j , 1 i = 1 n j = 1 n m i j , 1 i = 1 n j = 1 n l i j ]
We assume that the comprehensive fuzziness of two factors is denoted as P 1 = [ l 1 , m 1 , u 1 ] and P 2 = [ l 2 , m 2 , u 2 ] and define the possibility degree of P 1 P 2 as μ ( P 1 P 2 ) , which is calculated as follows:
μ ( P 1 P 2 ) = λ max { 1 max ( m 2 l 1 m 1 l 1 + m 2 l 2 , 0 ) , 0 } + ( 1 λ ) max { 1 max ( u 2 m 1 u 1 m 1 + u 2 m 2 , 0 ) , 0 }
where λ [ 0 , 1 ] is determined by the decision maker’s risk attitude. When λ > 0.5 , it indicates an aggressive decision-making attitude. When λ < 0.5 , it indicates a conservative decision-making attitude. When λ = 0.5 , it indicates a neutral attitude from the decision maker.
The possibility degree matrix is given as:
μ ( d ) = 1 μ ( P 1 P 2 ) μ ( P 1 P n ) μ ( P 2 P 1 ) 1 μ ( P 2 P n ) μ ( P n P 1 ) μ ( P n P 2 ) 1
The weight vector of the current level factors w 0 1 = ( μ ( d 1 ) , μ ( d 2 ) , , μ ( d n ) ) is calculated using Formula (7):
μ ( d i ) = μ ( P i P 1 , P i P 2 , , P i P n ) = min [ μ ( P i P k ) , k = 1 , 2 , , n , k i ]
The weight vector is then normalized to obtain the TrFN-AHP weight vector:
w j 1 = μ ( d j ) j = 1 n μ ( d j )

Entropy Weight Method

We then construct the original matrix G. For m data samples, we use the entropy weight method to calculate the weights of the n evaluation factors. First, we construct the original matrix G of the evaluation factors:
G = ( g i j ) m × n = g 11 g 12 g 1 n g 21 g 22 g 2 n g m 1 g m 2 g m n
Then, we construct the standardized matrix S. Since the evaluation system contains different indicators with varying scales, the degree of difference in the orientation of the indicators is large. Therefore, it is necessary to standardize the matrix G and normalize it to obtain the standardized matrix S, where:
s i j = g i j i = 1 m g i j
We then calculate the entropy value e j for the n evaluation indicators:
e j = 1 ln n i = 1 m ( s i j × ln s i j )
Then, we determine the entropy weight w 2 = ( w 1 2 , w 2 2 , , w n 2 ) for the n evaluation indicators, where:
w j 2 = 1 e j j = 1 n ( 1 e j )

Determination of Portfolio Weights

When constructing the possible weight vector set ω k j = ( ω k 1 , ω k 2 , ω k n ) T , n is the number of evaluation indicators in the evaluation system, and k is the number of methods used for weight calculation in this study. We let the linear combination weight coefficients be = ( 1 , 2 , , k ) , and then any linear combination of these vectors is:
ω = k = 1 K k ω k T k > 0 , ( k = 1 , 2 , , k )
We optimize the combination by seeking the balance point between different weights, aiming to minimize the deviation between ω and ω k . k is optimized in the above equation and the optimal weight in ω is calculated, with the objective function being:
min | | k = 1 K k ω k T ω k | | , ( k = 1 , 2 , K )
According to the matrix differential properties, the first-order derivative condition for the optimization of the above expression results in a system of linear equations:
ω k 1 × ω k 1 T ω k 1 × ω k 2 T ω k 1 × ω k n T ω k 2 × ω k 1 T ω k 2 × ω k 2 T ω k 2 × ω k n T ω k n × ω k 1 T ω k n × ω k 2 T ω k n × ω k n T [ 1 2 k ] = ω k 1 × ω k 1 T ω k 2 × ω k 1 T ω k n × ω k 1 T
The combination coefficients k are normalized to obtain:
k * = k k = 1 K k
Finally, we calculate the combined weights: ω * = k = 1 K k * ω k T , where ω k T is ( w 1 ) T and ( w 2 ) T , and the combined weight set is ω * = { ω j * } , ( j = 1 , 2 , , n ) .

3.5.2. Indicator Weighting Model

Let the name of the evaluated object be N , the object’s characteristics be C , and the characteristic values be V . The ordered triplet formed by these three elements is called a basic extension, denoted as R = ( N , C , V ) . The evaluation goal is defined as a basic extension R , with a rank N , and each evaluation indicator denoted as C , with the range of values for each indicator denoted as V .

Determining the Classical Domain

Let the project name be represented by N , the name of the project’s characteristic factor by C , and the specific parameters of the characteristic factor by V . The classical domain R j is represented as:
R θ = c 1 v θ 1 N θ c n v θ n = c 1 ( a θ 1 , b θ 1 ) N θ c n ( a θ n , b θ n )
where N θ is the θ -th evaluation grade; is the n -th characteristic; and v θ j = ( a θ n , b θ n ) is the interval for the evaluation factor c j of water resource asset management in the river basin. In this study, the evaluation grades are divided into five levels: I (Excellent), II (Good), III (Fair), IV (Poor), and V (Very Poor), which are represented by N 1 , N 2 , N 3 , N 4 , and N 5 , respectively.

Determining the Sectional Domain

The sectional domain extension specifically describes the range of values for the evaluated object and its characteristics, which can be expressed in a matrix form as:
R ρ = c 1 v ρ 1 N ρ c n v ρ n = c 1 ( a ρ 1 , b ρ 1 ) N ρ c n ( a ρ n , b ρ n )
where N k is the evaluation grade for the evaluation factor; c j is the characteristic for the WRCC; and v ρ j = ( a ρ j , b ρ j ) represents the entire possible value range for c j , that is, the sectional domain.

Determining the Extension Matrix of the Evaluated Object

R d = c 1 v d 1 N d c n v d n
where R d is the object to be evaluated, which, in this study, refers to the WRCC evaluation of m objects; v d j represents the actual data for each indicator.

Standardization

The classic domain standardization process is as follows:
R θ = N θ c j ( a θ j , b θ j ) = c 1 ( a θ 1 , b θ 1 ) N θ c n ( a θ n , b θ n ) = c 1 ( a θ 1 b ρ 1 , b θ 1 b ρ 1 ) N θ c n ( a θ n b ρ n , b θ n b ρ n )
The standardization of the extension matrix of the evaluated object is:
R d = N d c j v d j = c 1 v d 1 N d c n v d n = c 1 v d 1 b ρ 1 N d c n v d n b ρ n

Calculating the Distance Between the Levels and the Classic Domain

The distance between the standardized extension matrix of the evaluated object and the θ -th level of the classic domain is calculated as:
D θ ( v d i ) = v d j a θ j + b θ j 2 1 2 ( b θ j a θ j )

Calculating the Proximity Degree

The proximity degree between the extension matrix of the evaluated object R d and each state level T θ ( N d ) is calculated as:
T θ ( N d ) = 1 1 n ( n + 1 ) j = 1 n D θ ( v d j ) ω j *
where ω j * is the weight of evaluation indicator j , and n is the number of evaluation indicators.

Level Assessment

We then standardize the values of T θ ( N d ) . The standardization formula is:
T θ ( N d ) = T θ ( N d ) min T θ ( N d ) max T θ ( N d ) min T θ ( N d )
If T θ ( N d ) = max { T θ ( N d ) } , ( θ = 1 , 2 , 3 , 4 , 5 ) exists, the corresponding level is θ . The characteristic value θ * of the level variable for the evaluated object R d is calculated to determine its proximity to adjacent levels:
θ * = θ = 1 θ θ T θ ( N d ) θ = 1 θ T θ ( N d )

3.5.3. Determining the Classic Domain of WRCC Indicators

To better visualize the evaluation results, we classified water resource carrying capacity (WRCC) into distinct grades corresponding to different carrying capacity levels. For internationally or domestically standardized indicators (e.g., per capita water resources, per capita GDP, urbanization rate), we adopted established grading criteria to determine threshold values. For non-standardized indicators, threshold values were determined through expert consultation and the synthesis of existing research findings [32]. The complete WRCC grading criteria are presented in Table 4.

4. Results

4.1. Indicator Weight Results

According to the indicator weight model in Section 3.5.1, the indicator weight results are as follows.

4.1.1. Subjective Weight Results

According to the procedure for determining subjective weights in Section Triangular Fuzzy Analytic Hierarchy Process (TrFN-AHP), a questionnaire survey was conducted from October to November 2024. Experts were invited to assess the weight of the indicator system for water resource carrying capacity in the middle and lower reaches of the Yangtze River. The invited experts included managers from departments such as water conservancy and environmental ecology, university professors, and technical consultants, totaling 21 people. A total of 17 valid questionnaires were collected (after excluding those with missing information). The subjective weight results based on the TrFN-AHP model are shown in Figure 3.
As seen in the figure, there is a significant weight difference between indicators C1 to C14. Indicators C14, C1, and C2 have the highest weights, which are 0.1190, 0.1030, and 0.0896, respectively. This suggests that these three indicators are considered to have a greater impact on WRCC and should be given priority in water resource management. Indicator C10 has the smallest weight of 0.0382, indicating that, compared to the other indicators, it contributes less to the WRCC in the middle and lower reaches of the Yangtze River.

4.1.2. Objective Weight Results

The objective weights for WRCC in the middle and lower reaches of the Yangtze River were determined using the entropy weight method as described in Section Entropy Weight Method. The results are shown in Figure 4. In comparison, the subjective weight results are more evenly distributed, with smaller weight differences between indicators.
Among them, the weights of indicators C8 and C9 are significantly higher than the others, indicating that socio-economic factors, such as urbanization rate and per capita GDP, play a crucial role in WRCC assessment and are key factors influencing the WRCC. The weights of indicators C1, C3, C6, and C12 are relatively low but still above 0.07, suggesting that these indicators contribute somewhat less directly to the WRCC. However, they remain indispensable components in the overall evaluation. The remaining indicators have relatively low weights and exert minimal influence on WRCC.

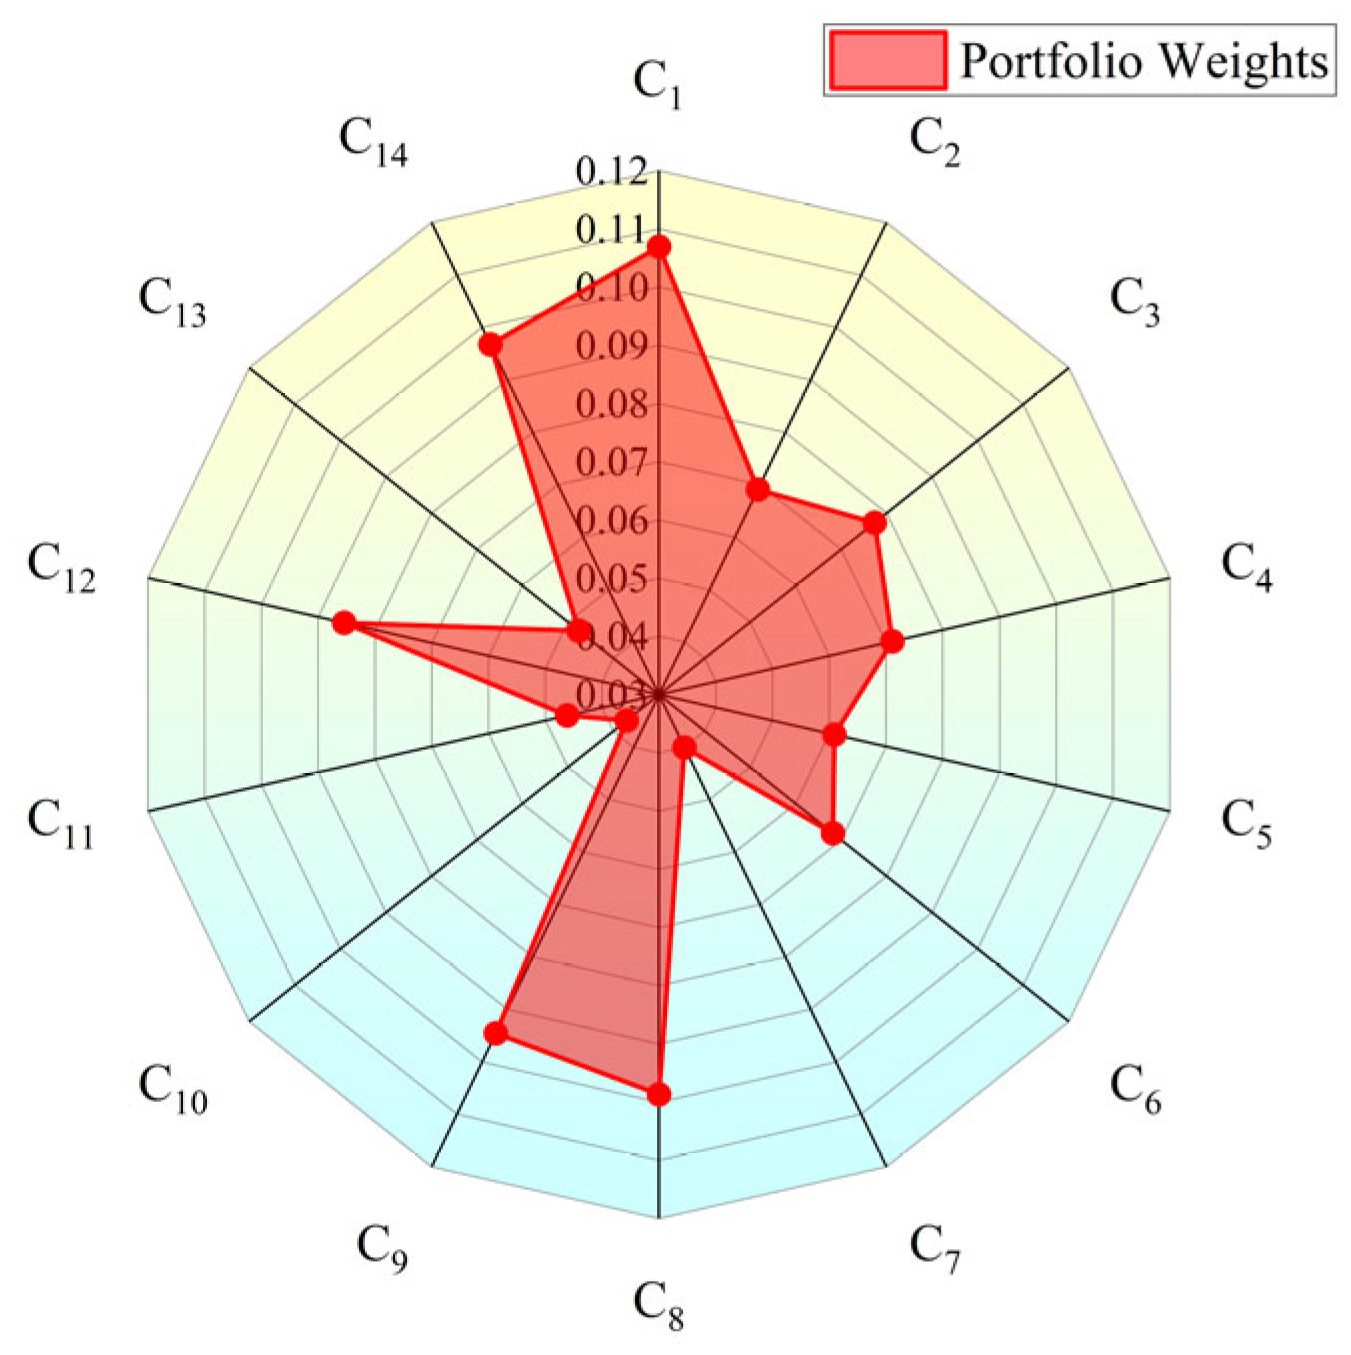
4.1.3. Portfolio Weight Results

Based on the subjective weights determined using the TrFN-AHP method and the objective weights determined using the entropy weight method, the final weight results for WRCC in the middle and lower reaches of the Yangtze River were calculated using the game-based combined weight model described in Section Determination of Portfolio Weights. The results are shown in Figure 5.
In the criterion layer, the weight of the water resource dimension is the highest (0.3245), followed by the social dimension (0.2679), the ecological dimension (0.2298), and the economic dimension (0.1779). This indicates that the influence of the water-resource-related, social, ecological, and economic dimensions on water resource carrying capacity decreases in that order.
Within the water resource dimension, the weight distribution is relatively even, with the highest weight for indicator C1 (0.1070) and the lowest weight for indicator C2 (0.0691). In the social dimension, the weight of C8 is the highest (0.0987), showing that this indicator has the greatest influence on WRCC and should be given particular attention.
In the economic and ecological dimensions, the weight variation is significant, with volatility rates for the maximum and minimum indicators of 60.74% and 50.76%, respectively.

4.2. Comprehensive Evaluation Results

4.2.1. Temporal Changes in WRCC

According to Figure 6, the changes in the WRCC levels of the middle and lower Yangtze River regions from 2015 to 2023 show an overall stable and improving trend. The optimal evaluation level has increased from level II to level I, indicating a significant improvement in WRCC during the study period, though there is still room for further enhancement.
Specifically, from 2015 to 2023, the WRCC levels of Hubei and Hunan remained stable at level III. Except for 2015, 2018, and 2019, when there was a downward trend towards a lower level, the remaining years showed improvement towards higher levels. This suggests that the WRCC of Hunan and Hubei has generally been stable and is steadily improving.
In Jiangxi, except for 2019 when level I declined, the remaining years showed an improvement towards level III, indicating that the level may have been elevated due to significant water conservancy projects and efficient water resource allocation in 2019, although these measures have not formed a long-term mechanism.
During the study period, Anhui’s WRCC remained at level III, with a positive trend in 2020 and 2022, while, in other years, there were shifts towards lower levels. This reflects the complex influence of various factors on Anhui’s WRCC and the relatively high water resource pressure in the region.
Jiangsu showed a complex pattern of level changes: level IV in 2015, 2017–2021, and 2023; level III in 2016; and level V in 2022. The development trend was positive in 2016, 2022, and 2023, but the other years showed a tendency towards lower levels. As a strong economic province, Jiangsu’s rapid economic development and continuous population inflow have resulted in a sharp increase in water resource demand, while industrial and agricultural pollution has severely impacted water quality. Affected by extreme weather, Jiangsu’s WRCC dropped to level V in 2022 but rebounded in 2023, indicating that measures such as emergency management and inter-regional water transfer have had some positive effect.
In Zhejiang, the WRCC remained at level II throughout the study period, with most years showing a trend towards a lower level. This indicates that, while the province has a generally high level of water resource management, the continuous economic development has led to increased water demand, which puts pressure on water resource use and management.
In contrast, thanks to the implementation of a series of water resource management policies, Shanghai’s WRCC level increased from level III to level I between 2015 and 2023, achieving a high level of WRCC, though its room for further improvement is limited.

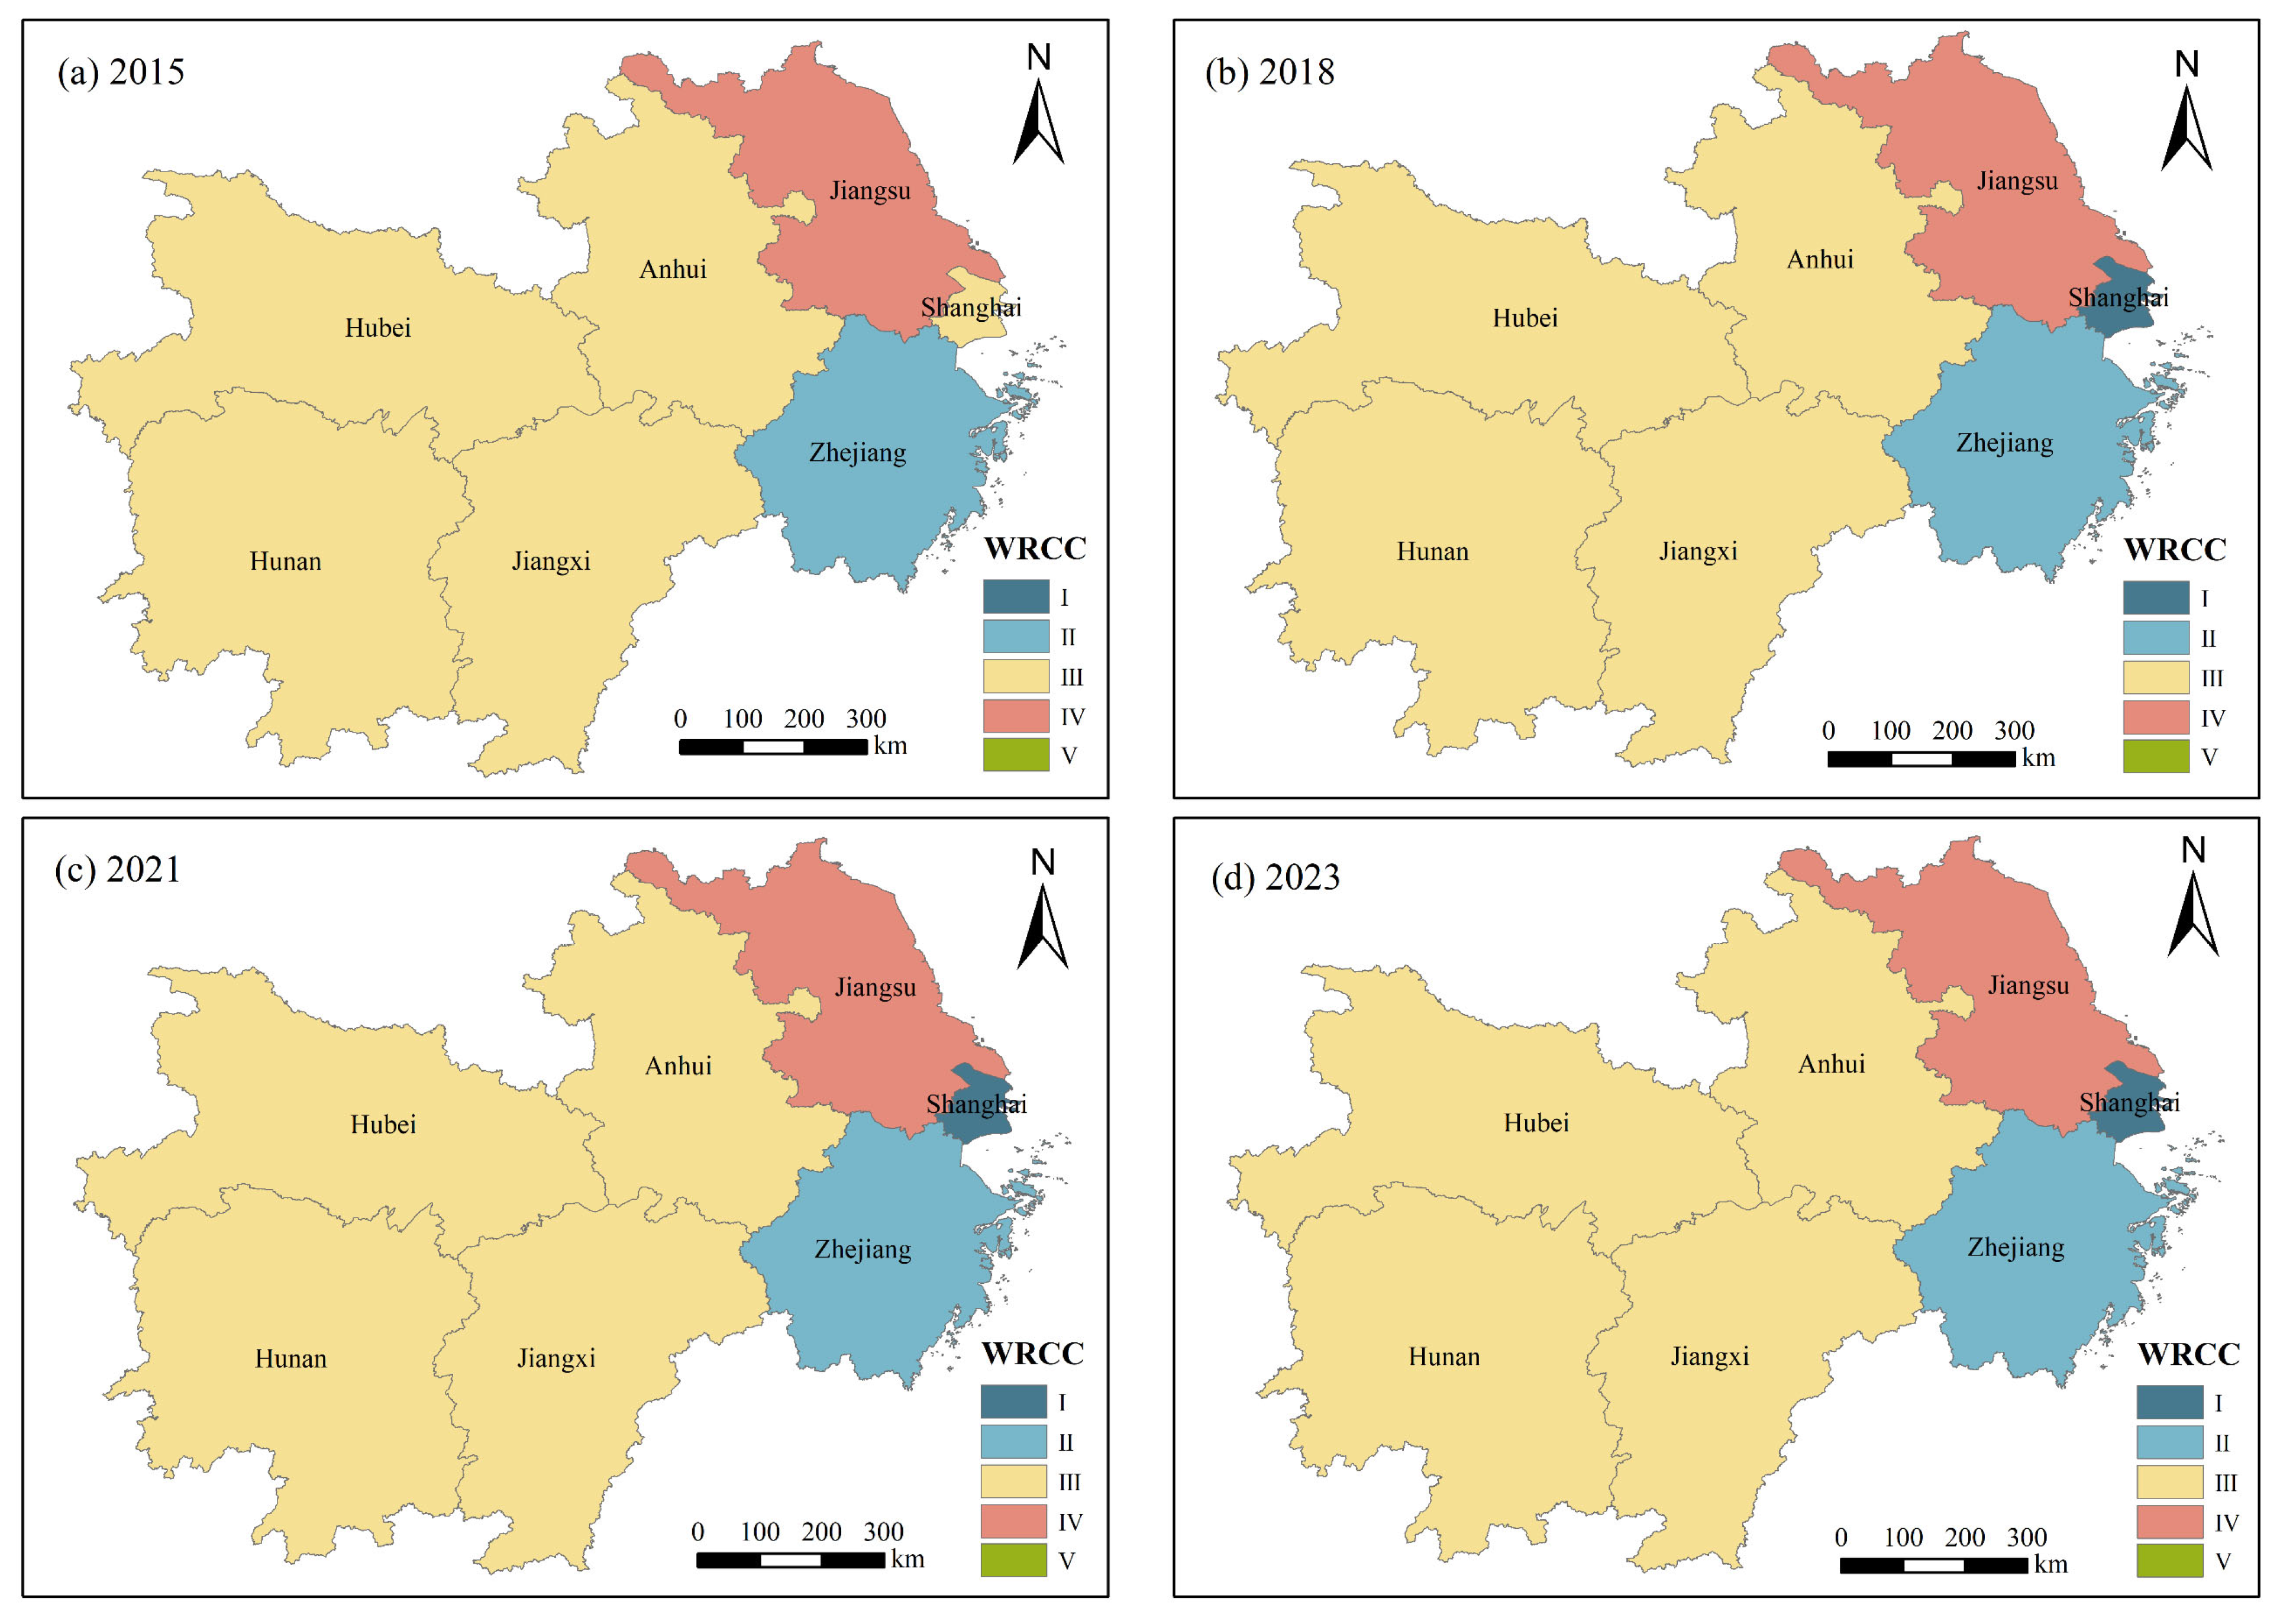
4.2.2. Spatial Changes in WRCC

As shown in Figure 6, from a spatial perspective, the WRCC evaluation levels of the seven provinces (municipalities) in the middle and lower reaches of the Yangtze River (2015–2023) initially showed differences. During this period, Shanghai rose to level I and maintained its leading position, Zhejiang remained at level II, while Hubei, Hunan, Jiangxi, and Anhui mostly stayed at level III. Jiangsu’s level fluctuated frequently. Specifically, in 2015, the differences in WRCC among the provinces (municipalities) were small. Except for Jiangsu and Zhejiang, which were rated IV and II, respectively, all other provinces (municipalities) were rated level III. The fluctuations in the lower reaches were significantly higher than in the middle reaches, reflecting the differences in the WRCC and development trends of each province in the starting year. Notably, according to the characteristic values, Jiangsu’s lower rating and its potential for improvement indicate that it has more room for growth. In contrast, Zhejiang, with its higher rating, showed a trend toward a lower level, signaling potential risks. From 2016 to 2023, Shanghai was upgraded to level I, and, although it tended to approach a lower rating in most years, it became a regional benchmark. However, further improvements became more challenging. Jiangsu’s fluctuating rating and unstable development trend pose challenges for regional water resource coordination. Hubei, Hunan, Jiangxi, and Anhui mostly maintained level III, showing a mix of positive and negative trends, resulting in a relatively stable medium-level distribution pattern in the region, though internal differences existed. Zhejiang remained at level II, with most years showing a trend toward a lower rating. The region has relatively good WRCC but faces pressure.

5. Discussion

5.1. Distribution of and Changes in Subsystems

The j∗ value results for each subsystem in the middle and lower reaches of the Yangtze River are shown in Figure 7. j∗ represents the evaluation level of each subsystem, with smaller values indicating higher evaluation levels. Overall, the j∗ values of the four subsystems in each region show some fluctuations. The water resource subsystem remained relatively stable in most areas, but some provinces, such as Hubei and Anhui, experienced fluctuations in certain years, reflecting the instability of water resource supply and demand. The social subsystem generally showed an upward trend, particularly in provinces such as Hubei, Hunan, and Jiangsu, indicating that the continuous increase in social demand has put certain pressure on the WRCC. The economic subsystem, on the other hand, showed a downward trend, especially in regions such as Zhejiang, Shanghai, and Hubei, reflecting that these regions have achieved some success in balancing economic development and water resource use. The ecological subsystem’s j* values generally decreased, particularly in regions including Jiangsu and Zhejiang, indicating positive effects from ecological protection and water resource restoration. However, fluctuations in certain years, such as in Hubei, suggest challenges in terms of ecological protection.
The j∗ value for the water resource subsystem in Hubei province showed fluctuating changes, starting at 2.6421 in 2015 and decreasing to 2.4538 by 2023, with an overall improving trend. Notably, in 2020, the j∗ value for the water resource subsystem significantly dropped, reflecting the achievements Hubei made in water resource management and allocation. However, between 2018 and 2019, the j∗ value for the water resource subsystem increased, which may have been related to climate changes or increased water resource usage during that period. The j∗ value for the social subsystem significantly increased from 2021 to 2023, particularly in 2022 and 2023, when it reached 3.4184 and 3.3472, respectively, indicating significant pressure from social development and public service demands. The j∗ value for the economic subsystem gradually declined from 3.5360 in 2015 to 2.3897 in 2023, showing that the relationship between economic development and WRCC has gradually improved. The j∗ value for the ecological subsystem rapidly decreased after 2021, reaching 2.1021 by 2023, indicating that Hubei has made positive progress in ecological protection and water resource restoration.
The j∗ value of the water resource subsystem in Hunan Province remained roughly between 2.0 and 2.5 from 2015 to 2023, showing a relatively stable overall trend. There was a slight decline in 2020 to 1.9637, followed by a slight recovery to 2.4630. The j∗ value of the social subsystem continuously increased in 2021 and 2022, reaching 3.0516 in 2023, indicating that the growth in social demand has put pressure on WRCC. The j∗ value of the economic subsystem showed a downward trend year by year, from 3.6796 in 2015 to 2.4710 in 2023. This is related to Hunan’s recent efforts to promote a green economy and improve resource utilization efficiency. The j∗ value of the ecological subsystem gradually decreased, particularly in 2021 and 2022, when it reached 3.3648 and 2.8981, respectively, indicating that Hunan has made certain achievements in ecological protection.
The j∗ value of the water resource subsystem in Jiangxi Province showed relatively stable fluctuations, from 1.9401 in 2015 to 2.0443 in 2023, reflecting a slight upward trend. The j∗ value of the social subsystem remained relatively stable throughout the study period but increased in 2022 to reach 2.8656. The j∗ value of the economic subsystem showed a downward trend, decreasing from 3.8072 in 2015 to 2.6219 in 2023. This indicates that the province has gradually achieved the efficient use of water resources while promoting economic development. The j∗ value of the ecological subsystem decreased each year from 4.2115 in 2015 to 4.2278 in 2023, showing a slight decline but remaining stable overall. This reflects how Jiangxi has implemented continuous measures in ecological protection.
The j∗ value of the water resource subsystem in Anhui Province exhibited fluctuating changes, decreasing from 3.1378 in 2015 to 3.7107 in 2023, showing an overall deteriorating trend. Notably, in 2019 and 2022, the j∗ value of the water resource subsystem experienced significant fluctuations. The j∗ value of the social subsystem increased in 2021 and 2022, particularly in 2022, when it reached 3.0277. This indicates that the growth in social demand has put pressure on the water resource carrying capacity. The j∗ value of the economic subsystem gradually decreased from 3.8876 in 2015 to 2.7933 in 2023. This reflects Anhui’s efforts to promote a green economy and improve the efficient use of water resources. The j∗ value of the ecological subsystem decreased from 4.0187 in 2015 to 3.8118 in 2023, showing a continuous improvement trend.
The j∗ value of the water resource subsystem in Jiangsu Province fluctuated minimally between 3.7 and 3.9 from 2015 to 2023, indicating that water resource utilization and management remained stable. Notably, in 2022 and 2023, the j∗ value of the water resource subsystem slightly increased, reaching 3.9651 and 3.8918, respectively. This reflects the possible impact of increased water resource demand or other external factors on the WRCC. The j∗ value of the social subsystem increased in 2021 and 2022, indicating that, with the development of the social economy and population growth, the demand for water resources gradually increased. In particular, in 2022, the j∗ value of the social subsystem reached 3.9042 and remained at a high level. This may be closely related to the increase in social activities and the acceleration of urbanization in the province. The j∗ value of the economic subsystem decreased year by year since 2015, particularly in 2022 and 2023, when it dropped to 1.9852 and 1.9884, respectively. This indicates that Jiangsu Province has gradually achieved coordination between economic development and the efficient use of water resources. The j∗ value of the ecological subsystem significantly decreased from 3.9243 in 2015 to 2.2968 in 2023, reflecting the significant achievements Jiangsu Province has made in strengthening ecological protection and water resource restoration.
The j∗ value of the water resource subsystem in Zhejiang Province remained relatively stable with minimal fluctuations between 2015 and 2023. It was 3.9116 in 2015 and decreased to 3.8935 in 2023, showing a small change, which indicates that the carrying capacity of water resources remained at a relatively stable level. However, from 2018 to 2022, the j∗ value of the water resource subsystem decreased, reflecting changes in the supply and demand for water resources. The j∗ value of the social subsystem increased slightly after 2020, especially in 2021 and 2022, when it reached 2.2664 and 2.2641, respectively. This suggests that the social demand for water resources increased year by year, putting pressure on the water resource carrying capacity. The j∗ value of the economic subsystem remained stable or slightly decreased year by year, dropping from 2.4696 in 2015 to 2.0664 in 2023, indicating Zhejiang Province’s effectiveness in promoting green economic development and improving resource utilization efficiency. The j∗ value of the ecological subsystem decreased year by year from 3.8358 in 2015 to 2.9386 in 2023, reflecting the province’s continuous efforts in ecological protection and restoration, especially with the strengthening of environmental protection policies and the implementation of ecological restoration projects in recent years.
From 2015 to 2023, Shanghai’s water resource subsystem exhibited minimal changes in its j* value. Specifically, it decreased slightly from 3.9116 to 3.8935 during this period. Overall, the subsystem maintained a relatively high and stable performance level. Notably, in 2022 and 2023, the subsystem’s j value showed a modest increase. This upward trend suggests a potential growth in water resource demand during these years. The social subsystem’s j* value demonstrated a consistent upward trend since 2015. After 2021, it stabilized within the range of 1.8 to 2.0. This trend strongly correlates with Shanghai’s rapid urbanization and continuous population growth. Regarding the economic subsystem, its j* value remained at a relatively low level throughout the study period. However, a slight upward trend emerged, particularly after 2020. While economic activities and industrial development continue to exert pressure on water resources, the implementation of effective management measures has successfully optimized the relationship between economic growth and water resource utilization. The ecological subsystem maintained remarkable stability from 2015 to 2023, with its j* value fluctuating minimally between 3.8 and 3.9. This stability reflects Shanghai’s consistent commitment to ecological protection through sustained investment and robust management practices in water resource conservation.

5.2. Analysis of Influencing Factors

Random Forest, a typical machine learning method, was first proposed by Breiman in 2001. It is an ensemble algorithm based on the Bagging (Bootstrap Aggregating) strategy, which aggregates a large number of tree-based weak estimators to form a strong learner. The results of all estimators are then averaged to generate the final prediction [41]. This algorithm has significant advantages in evaluating feature importance, which not only helps us to understand the impact of each feature on the response variable but also reduces feature dimensions and minimizes the “noise” caused by redundant variables [40]. Therefore, this section employs an interpretable random forest model to identify the influencing factors of WRCC in seven provinces/municipalities in the middle-lower Yangtze region. Using the permutation importance methodology, we randomly shuffled feature values to observe the decrease in model accuracy, repeating this process 100 times to ensure result stability. The final feature importance ranking showed high consistency (correlation coefficient: 0.89) with a Gini importance ranking. The model parameters were specified as follows:
① Number of trees (n_estimators): the optimal value of 500 was determined through a grid search, with 10-fold cross-validation ensuring model stability;
② Maximum depth (max_depth): this was set to none to allow for complete node expansion, with pre-experiments confirming its superiority over depth-limited alternatives;
③ Maximum features (max_features): the default sqrt (p) configuration was adopted (where p represents the total feature count);
④ Splitting criterion: “MSE” (mean squared error) was selected as the node splitting rule.
Notably, to prevent sample bias, importance calculations were based on Out-of-Bag (OOB) data. The specific formula is:
Importance j = 1 N t r e e t = 1 N t r e e ( E r r O O B t j E r r O O B t )
where E r r O O B t j represents the O O B error after the permutation of the j -th feature, and E r r O O B t denotes the O O B error of the t -th tree.
The influencing factors of water resource carrying capacity (WRCC) for the seven provinces/municipalities in the middle-lower Yangtze River region are presented in Table 5. From the perspective of the criterion layer, the relative importance of the water resource dimension is as high as 37.3977%, highlighting the crucial position of the condition of water resources themselves in determining the carrying capacity. The ecological dimension ranks second in terms of importance, accounting for 24.0588%, indicating that the ecological conditions have a significant impact on the resource carrying capacity. In comparison, the relative importance of the social and economic dimensions is relatively low but still exceeds 15%. Furthermore, the average importance of water resources, society, economy, and ecology is 9.3494%, 5.7069%, 5.2387%, and 8.0196%, respectively, which once again demonstrates that ecological factors are important influencing factors for the water resource carrying capacity.
From the perspective of individual characteristic variables, indicators such as the water resources per capita (C1), urbanization rate (C8), greening coverage of built-up areas (C14), and GDP per capita (C9) have relatively high importance and contribute more significantly to the water resource carrying capacity in the middle and lower reaches of the Yangtze River. In contrast, although existing studies have shown that variables such as per capita domestic water consumption (C5), total water consumption for production (C7), and water consumption per mu of irrigated agriculture (C11) have a certain impact on the water resources carrying capacity in the middle and lower reaches of the Yangtze River [42], the relative importance of these indicators is low, and their predictive performance for the response variable is not satisfactory.

5.3. Comparative Analysis with Existing Studies

In previous research, Wang (2023) evaluated the water resource carrying capacity (WRCC) of the Yangtze River Economic Belt using the entropy-weighted TOPSIS method [43], with results shown in Figure 8. Since a smaller j* value in our study indicates a higher WRCC level (with j* ranging within [0, 5]), we compared our results with prior findings using (5-j*) for consistency. This transformation ensures that higher values correspond to better WRCC performance.
As shown in Figure 8, our WRCC assessment generally aligns with previous findings. An earlier study also identified Shanghai, Zhejiang, and Jiangxi as having relatively high WRCC levels, while Jiangsu and Anhui exhibited lower WRCC—as is consistent with our results. However, the regional disparities in our study are more pronounced than those in previous research, possibly due to differences in the evaluation periods. Nevertheless, the overall consistency between our findings and those of existing studies supports the validity of our model and the reliability of the conclusions.

5.4. Study Limitations

This study investigated the spatiotemporal distribution of WRCC in seven provinces of the middle-lower Yangtze River region by establishing an evaluation index system and an improved MEEM. The abundant water resources in this region allow the proposed framework to demonstrate unique advantages. However, two key limitations should be noted.
First, when applied to water-scarce regions (e.g., arid areas with annual precipitation below 200 mm where external water transfers cannot meet basic socioeconomic demands), the rigid constraints of water availability may invalidate other socioeconomic indicators.
Second, the current model lacks the direct incorporation of water quality parameters. This limitation could reduce the assessment’s accuracy in severely polluted regions.
For future research, we propose: (1) developing differentiated evaluation systems for different climatic zones. (2) Incorporating dynamic water quality monitoring data. (3) Enhancing model generalizability. These improvements would strengthen the framework’s applicability across diverse regions.

6. Conclusions

The assessment and analysis of WRCC play a crucial role in guiding regional water resource planning and management strategies. Accordingly, this research initially developed a comprehensive evaluation index system for WRCC in the middle and lower Yangtze River regions. The system encompasses four key dimensions: water resources, social development, economic factors, and ecological considerations. To address the inherent ambiguity in subjective judgments during carbon emissions allocation, we enhanced the Analytic Hierarchy Process (AHP) model through the incorporation of triangular fuzzy numbers. This improvement enables the more accurate determination of subjective index weights for WRCC assessments. We then integrated these subjective weights with objective weights derived from the entropy weight method, resulting in a comprehensive set of combined weights for the WRCC evaluation indices. This integrated weighting approach was subsequently incorporated into the MEEM. The newly developed evaluation model was applied to assess WRCC across the middle and lower Yangtze River regions. Furthermore, we employed GIS technology to analyze spatiotemporal variation patterns in WRCC. Our discussion examines the distribution and dynamics of subsystem components, along with their influencing factors. The key findings are as follows:
(1)
From 2015 to 2023, the WRCC evaluation grades in seven provinces (municipalities) within the study area demonstrated consistent improvement. Shanghai exhibited the most significant enhancement, advancing from Grade III to Grade I. Zhejiang maintained stable Grade II performance, while Hubei and Hunan remained at Grade III but displayed positive developmental trends. Jiangsu’s WRCC showed notable fluctuations during this period.
(2)
Subsystem evaluation values across the region revealed distinct patterns. The water resource subsystem maintained relative stability in most areas, while the social subsystem displayed a gradual decline. Conversely, both the economic and ecological subsystems showed positive development, indicating the successful implementation of economic and environmental protection measures across the region.
(3)
Impact analysis identified the water resource subsystem as the most significant contributor to overall WRCC. At the indicator level, four key factors emerged as primary influencers: per capita water resources (C1), the urbanization rate (C8), the green coverage rate in built-up areas (C14), and per capita GDP (C9). These indicators collectively represent the most substantial determinants of WRCC in the middle and lower Yangtze River regions.

Author Contributions

J.S.: writing—original draft preparation, methodology, and writing—review and editing. Y.N.: conceptualization, writing—original draft preparation, and writing—review and editing. X.H.: writing—original draft preparation, and writing—review and editing. M.M.: writing—review and editing. All authors have read and agreed to the published version of the manuscript.

Funding

The authors acknowledge with gratitude the Water Conservancy Department of Jiangxi Province Science and Technology Program (NO. 202426ZDKT19), and the Open Research Fund Project of Jiangxi Water Conservancy Academy of Sciences (NO. 2023SKSH01). This study would not have been possible without their financial support.

Data Availability Statement

The data used to support the findings of this study are available from the corresponding author upon request.

Conflicts of Interest

The authors declare that they have no conflicts of interest.

References

  1. Peng, Q.L.; He, W.J.; Kong, Y.; Shen, J.Q.; Yuan, L.; Ramsey, T.S. Spatio-temporal analysis of water sustainability of cities in the Yangtze River Economic Belt based on the perspectives of quantity-quality-benefit. Ecol. Indic. 2024, 160, 17. [Google Scholar] [CrossRef]
  2. He, G.; Xia, Y.; Qin, Y.; Zhu, Y.; Wang, W. Evaluation of Water Resources Carrying Capacity of the Yangtze River Economic Belt and Timing and Spatial Dynamic Changes. Soil Water Conserv. Res. 2019, 26, 287–292+300. [Google Scholar] [CrossRef]
  3. Suvigya, K.; Lalita, S.; Gopinadhan, K. Membranes for desalination and dye separation: Are 2D materials better than polymers? A critical comparison. Sep. Purif. Technol. 2023, 325, 12. [Google Scholar] [CrossRef]
  4. Yang, Y.; Yan, J.; Wang, H.; Zhou, L.; Yang, R. Characteristics of spatial and temporal changes of water environment carrying capacity in the Yangtze River economic belt. South North Water Divers. Water Sci. Technol. 2022, 20, 714–723. [Google Scholar] [CrossRef]
  5. He, W.; Chen, S.; Qiu, L. Comprehensive Evaluation and Spatial and Temporal Evolution of Water Resource Carrying Capacity in the Three Gorges Ecological and Economic Corridor of the Yangtze River Area. Yangtze River Basin Resour. Environ. 2022, 31, 1208–1219. [Google Scholar]
  6. Yuan, L.; Liu, C.Y.; Wu, X.; He, W.J.; Kong, Y.; Degefu, D.M.; Ramsey, T.S. A Set Pair Analysis Method for Assessing and Forecasting Water Conflict Risk in Transboundary River Basins. Water Resour. Manag. 2024, 38, 775–791. [Google Scholar] [CrossRef]
  7. Chi, C.; Shen, J.; Gao, X.; Hu, P.; Yi, P. Horizontal ecological compensation standards based on ecosystem services flow. Ecol. Indic. 2024, 163, 112081. [Google Scholar] [CrossRef]
  8. Chi, C.; Shen, J.; Gao, X.; Li, Z.; Sun, F. Spatiotemporal changes of ecosystem services value and cross regional ecological compensation in the Yangtze River Basin. Environ. Dev. Sustain. 2024, 35, 1–35. [Google Scholar] [CrossRef]
  9. Wang, B.; Yang, H.; Zhu, Y. Study on Comprehensive Evaluation of Water Resources Carrying Capacity of Yangtze River Economic Belt. Resour. Ind. 2020, 22, 1–11. [Google Scholar] [CrossRef]
  10. Milano, M.; Ruelland, D.; Dezetter, A.; Fabre, J.; Ardoin-Bardin, S.; Servat, E. Modeling the current and future capacity of water resources to meet water demands in the Ebro basin. J. Hydrol. 2013, 500, 114–126. [Google Scholar] [CrossRef]
  11. Xu, Y. Study on Comprehensive Evaluation of Water Resources Carrying Capacity in Arid Zones—Taking the Hetian River Basin in Xinjiang as an Example. J. Nat. Resour. 1993, 3, 229–237. [Google Scholar]
  12. Li, L.; Gan, H. Pilot study on the relationship between the concept of rational allocation and carrying capacity of water resources and sustainable development. Prog. Water Sci. 2000, 3, 307–313. [Google Scholar] [CrossRef]
  13. Huang, X.; Zhou, Y. An overview of research methods on the carrying capacity of resources and the environment. China Environ. Manag. 2018, 10, 36–42+54. [Google Scholar] [CrossRef]
  14. Wang, J.; Jiang, D.; Xiao, W.; Chen, Y.; Hu, P. Exploring the Theoretical Basis of Water Resources Carrying Capacity: Definitional Connotation and Scientific Issues. J. Water Resour. 2017, 48, 1399–1409. [Google Scholar] [CrossRef]
  15. Liu, Y.L.; Luo, Y.Q.; Zhang, W.J.; Wu, Y.Y.; Wang, Q. The construction of urban water resources carrying capacity evaluation system based on PSR model. Environ. Pollut. Control 2016, 38, 100–104. [Google Scholar] [CrossRef]
  16. Ren, L.; Gao, J.; Song, S.; Li, Z.; Ni, J. Evaluation of Water Resources Carrying Capacity in Guiyang City. Water 2021, 13, 2155. [Google Scholar] [CrossRef]
  17. Zhai, Z.; Sang, X.; Li, H. Study on index system and judgment criterion of water resources carrying capacity. Shuili Xuebao J. Hydraul. Eng. 2017, 48, 1023–1029. [Google Scholar] [CrossRef]
  18. Li, F.; Niu, K. Evaluation of water resources carrying capacity in Changzhi City Based on Analytic Hierarchy Process. IOP Conf. Ser. Earth Environ. Sci. 2021, 692, 042077. [Google Scholar] [CrossRef]
  19. Xi-Yin, Z.; Kun, L.; Wei, M.; Soon-Thiam, K.; Jian, Z.; Mingna, W.; Junfeng, Y. Space–time approach to water environment carrying capacity calculation. J. Clean. Prod. 2017, 149, 302–312. [Google Scholar] [CrossRef]
  20. Dan, D.; Mingdong, S.; Xubo, L.; Juxiang, H.; Hua, Z.; Xiangqin, X.; Kun, L. Comprehensive assessment of the water environment carrying capacity based on the spatial system dynamics model, a case study of Yongding River Basin in North China. J. Clean. Prod. 2022, 344, 131137. [Google Scholar] [CrossRef]
  21. Zhang, Y.; Song, X.; Wang, X.; Jin, Z.; Chen, F. Multi-Level Fuzzy Comprehensive Evaluation for Water Resources Carrying Capacity in Xuzhou City, China. Sustainability 2023, 15, 11369. [Google Scholar] [CrossRef]
  22. Wu, F.; Zhuang, Z.; Liu, H.-L.; Shiau, Y.-C. Evaluation of Water Resources Carrying Capacity Using Principal Component Analysis: An Empirical Study in Huai’an, Jiangsu, China. Water 2021, 13, 2587. [Google Scholar] [CrossRef]
  23. Deng, L.; Yin, J.; Tian, J.; Li, Q.; Guo, S. Comprehensive Evaluation of Water Resources Carrying Capacity in the Han River Basin. Water 2021, 13, 249. [Google Scholar] [CrossRef]
  24. Wang, Q.; Li, S.; Li, R. Evaluating water resource sustainability in Beijing, China: Combining PSR model and matter-element extension method. J. Clean. Prod. 2019, 206, 171–179. [Google Scholar] [CrossRef]
  25. Wang, Y.; Ji, Z. Evaluation of Water Resource Carrying Capacity Based on Fuzzy Matter-element Model. IOP Conf. Ser. Earth Environ. Sci. 2021, 706, 012003. [Google Scholar] [CrossRef]
  26. Wu, Y.; Zhongyu, M.; Li, X.; Sun, L.; Sun, S.; Jia, R. Assessment of water resources carrying capacity based on fuzzy comprehensive evaluation—Case study of Jinan, China. Water Supply 2020, 21, 513–524. [Google Scholar] [CrossRef]
  27. Gül, S. Usage of Entropy-Based Objective Weighting in Neutrosophic Multiple Attribute Decision-Making. In Multiple Criteria Decision Making: Beyond the Information Age; Topcu, Y.I., Özaydın, Ö., Kabak, Ö., Önsel Ekici, Ş., Eds.; Springer International Publishing: Cham, Switzerland, 2021; pp. 343–367. [Google Scholar]
  28. Peng, T.; Jin, Z.; Xiao, L. Assessment on water resources carrying capacity in karst areas under a novel multi-dimensional cloud model—A case study. Arab. J. Geosci. 2023, 16, 267. [Google Scholar] [CrossRef]
  29. Li, Y.; Zhang, J.; Song, Y. Comprehensive comparison and assessment of three models evaluating water resource carrying capacity in Beijing, China. Ecol. Indic. 2022, 143, 109305. [Google Scholar] [CrossRef]
  30. Lv, P.; Liu, D.; Zhao, F.F. Comprehensive Evaluation of Water Resources Carrying Capacity in Jiansanjiang Branch Bureau. Adv. Mater. Res. 2011, 204–210, 834–837. [Google Scholar] [CrossRef]
  31. Lv, B.; Liu, C.; Li, T.; Meng, F.; Fu, Q.; Ji, Y.; Hou, R. Evaluation of the water resource carrying capacity in Heilongjiang, eastern China, based on the improved TOPSIS model. Ecol. Indic. 2023, 150, 110208. [Google Scholar] [CrossRef]
  32. Li, S.; Shen, J.; Sun, F. A study on the water resource assets management audit for outgoing officials considering asset elements. J. Clean. Prod. 2025, 494, 144931. [Google Scholar] [CrossRef]
  33. Li, S.; Shen, J.; Wu, Y.; Huang, X.; Sun, F. An integrated accounting system of the economic-social-ecological framework for assessing the value of intensive land use: A case study of the Taihu Lake governance project. Ecol. Indic. 2024, 158, 111506. [Google Scholar] [CrossRef]
  34. Wu, C.G.; Zhou, L.Y.; Jin, J.L.; Ning, S.W.; Zhang, Z.X.; Bai, L. Regional water resource carrying capacity evaluation based on multi-dimensional precondition cloud and risk matrix coupling model. Sci. Total Environ. 2020, 710, 136324. [Google Scholar] [CrossRef] [PubMed]
  35. Wang, G.; Xiao, C.L.; Qi, Z.W.; Meng, F.A.; Liang, X.J. Development tendency analysis for the water resource carrying capacity based on system dynamics model and the improved fuzzy comprehensive evaluation method in the Changchun city, China. Ecol. Indic. 2021, 122, 107232. [Google Scholar] [CrossRef]
  36. Meng, L.H.; Chen, Y.N.; Li, W.H.; Zhao, R.F. Fuzzy comprehensive evaluation model for water resources carrying capacity in Tarim River Basin, Xinjiang, China. Chin. Geogr. Sci. 2009, 19, 89–95. [Google Scholar] [CrossRef]
  37. Kong, Y.; He, W.; Gao, X.; Yuan, L.; Peng, Q.; Li, S.; Zhang, Z.; Degefu, D.M. Dynamic assessment and influencing factors analysis of water environmental carrying capacity in the Yangtze River Economic Belt, China. Ecol. Indic. 2022, 142, 109214. [Google Scholar] [CrossRef]
  38. Huang, X.; Shen, J.Q.; Sun, F.H.; Wang, L.Y.; Zhang, P.C.; Wan, Y. Study on the Spatial and Temporal Distribution of the High-Quality Development of Urbanization and Water Resource Coupling in the Yellow River Basin. Sustainability 2023, 15, 12270. [Google Scholar] [CrossRef]
  39. Huang, X.; Shen, J.; Li, S.; Chi, C.; Guo, P.; Hu, P. Sustainable flood control strategies under extreme rainfall: Allocation of flood drainage rights in the middle and lower reaches of the yellow river based on a new decision-making framework. J. Environ. Manag. 2024, 367, 122020. [Google Scholar] [CrossRef]
  40. Wang, B.; Xie, H.-L.; Ren, H.-Y.; Li, X.; Chen, L.; Wu, B.-C. Application of AHP, TOPSIS, and TFNs to plant selection for phytoremediation of petroleum-contaminated soils in shale gas and oil fields. J. Clean. Prod. 2019, 233, 13–22. [Google Scholar] [CrossRef]
  41. Breiman, L. Random forests. Mach. Learn. 2001, 45, 5–32. [Google Scholar] [CrossRef]
  42. Janitza, S.; Tutz, G.; Boulesteix, A.-L. Random forest for ordinal responses: Prediction and variable selection. Comput. Stat. Data Anal. 2016, 96, 57–73. [Google Scholar] [CrossRef]
  43. Wang, H. Comprehensive Evaluation of Water Resource Carrying Capacity of Yangtze River Economic Belt Based on Entropy Weight TOPSIS-Coupling Coordination Degree-Gray Correlation Degree. J. Wuhan Univ. Eng. Ed. 2023, 56, 532–541. [Google Scholar] [CrossRef]
Figure 1. Overview of the study area.
Water 17 01197 g001
Figure 2. Research framework.
Water 17 01197 g002
Figure 3. Subjective weight results.
Water 17 01197 g003
Figure 4. Objective weight results.
Water 17 01197 g004
Figure 5. Portfolio weight results.
Water 17 01197 g005
Figure 6. Spatial and temporal distribution of WRCC classes in the middle and lower reaches of the Yangtze River.
Water 17 01197 g006
Figure 7. Trends in subsystem j* values.
Water 17 01197 g007
Figure 8. Comparison with existing studies.
Water 17 01197 g008
Table 1. Indicator system for evaluating water resource carrying capacity.
Guideline LayerIndicator Layer [Unit] (Symbols)AttributesSources
Water resourcesWater resources per capita [m3] (C1)+[31]
Precipitation [108 m3] (C2)+[32]
Total water resources [108 m3] (C3)+[33]
Coefficient of water supply [/] (C4)+[34]
SocietyPer capita domestic water consumption [m3] (C5)[35]
Population growth rate [%] (C6)+[36]
Total water consumption for production [108 m3] (C7)[37]
Urbanization Rate [%] (C8)+[31]
EconomyGDP per capita [CHY] (C9)+[38]
Water consumption per 10,000 CHY of GDP [m3] (C10)[31]
Water consumption per mu of irrigated agriculture [m3] (C11)[34]
EcologyEcological water consumption [108 m3] (C12)+[34]
Daily sewage treatment capacity [108 m3] (C13)+[39]
Greening coverage of built-up area [%] (C14)+[39]
Note: “+” denotes positive indicators (where higher values represent better performance). “−” denotes negative indicators (where lower values are desirable).
Table 2. Evaluation scale and triangular fuzzy number.
Importance LevelAHP ScaleTrFN-AHP Scale
Equally important1(1, 1, 3)
Slightly more important3(1, 3, 5)
Important5(3, 5, 7)
Very important7(5, 7, 9)
Extremely important9(7, 9, 10)
Between2,4,6,8 ( m i j 1 ,   m i j ,   m i j + 1 )
Table 3. Triangular fuzzy number calculation method.
M 1 = [ l 1 , m 1 , u 1 ] , M 2 = [ l 2 , m 2 , u 2 ]
M 1 + M 2 = [ l 1 + l 2 , m 1 + m 2 , u 1 + u 2 ] M 1 M 2 = [ l 1 l 2 , m 1 m 2 , u 1 u 2 ]
M 1 × M 2 = [ l 1 × l 2 , m 1 × m 2 , u 1 × u 2 ] ( M 1 ) 1 n = [ ( l 1 ) 1 n , ( m 1 ) 1 n , ( u 1 ) 1 n ]
1 M 2 = [ 1 u 2 , 1 m 2 , 1 l 2 ] M 1 M 2 = [ l 1 u 2 , m 1 m 2 , u 1 l 2 ]
Table 4. Evaluation criteria for the water resource carrying capacity in the middle and lower reaches of the Yangtze River.
IndicatorsIIIIIIIVV
C1(4500,2500](2500,1700](1700,1000](1000,500](500,0]
C2(3500,1200](1200,800](800,600](600,400](400,0]
C3(3500,2800](2800,2100](2100,1400](1400,700](700,0]
C4(1,0.6](0.6,0.55](0.55,0.5](0.5,0.4](0.4,0]
C5(45,0](50,45](55,50](60,55](80,60]
C6(7,4](4.3](3,2](2,1](1,0]
C7(100.0](200,100](300,200](400,300](500,400]
C8(100,70](70,60](60,50](50,30](30,0]
C9(20000,145200](145200,91011.36](91011.36,29373.96](29373.96,7521.36](7514.1,0]
C10(60,0](70,60](80,60](100,80](150,100]
C11(550,500](500,450](450,380](380,300](300,0]
C12(30,24](24,18](18,12](12,6](6,0]
C13(55,45](45,35](35,25](25,15](15,0]
C14(100,40](40,35](35,31](31,29](29,0]
Table 5. Impact factor identification results.
Guideline LayerIndicatorImportance (%)Overall Ranking
Water resources (37.3977%) [9.3494%]C116.95421
C26.78217
C37.63606
C46.02548
Society (22.8275%) [5.7069%]C53.265412
C65.18439
C72.951313
C811.42652
Economy (15.716%) [5.2387%]C910.02514
C103.846211
C111.844714
Ecology (24.0588%) [8.0196%]C128.25465
C134.921810
C1410.88243
Note: the importance of the characteristics of the reporting category variables is reported in parentheses; to eliminate the effect of the number of indicators, the mean value of the importance of the indicators in the reporting category variables is reported in parentheses.
Disclaimer/Publisher’s Note: The statements, opinions and data contained in all publications are solely those of the individual author(s) and contributor(s) and not of MDPI and/or the editor(s). MDPI and/or the editor(s) disclaim responsibility for any injury to people or property resulting from any ideas, methods, instructions or products referred to in the content.

