Article

Comprehensive Study of Climate Change Impacts on Temperature and Precipitation in East and West of Mazandaran Province in North of Iran

1
Faculty of Civil Engineering, Semnan University, Semnan 3513119111, Iran
2
Department of Environment, Islamic Azad University, Qaemshahr Branch, Qaemshahr 4765161964, Iran
*
Author to whom correspondence should be addressed.
Water 2025, 17(8), 1181; https://doi.org/10.3390/w17081181
Submission received: 9 March 2025 / Revised: 5 April 2025 / Accepted: 8 April 2025 / Published: 15 April 2025
(This article belongs to the Section Water and Climate Change)

Abstract

:
The consequences of climate change in recent decades include global warming and variations in precipitation patterns. In this research, the impacts of climate change on temperature and precipitation in the east and west of Mazandaran Province, northern Iran, are examined via five GCMs (general circulation models) and two scenarios (SSP2-2.6 and SSP5-8.5) for the baseline period (2005–2023), near future period (2025–2050), and far future period (2051–2080) according to the IPCC (Intergovernmental Panel on Climate Change) Sixth Assessment Report. In the study area, four synoptic stations in the west of Mazandaran and seven stations in the east of Mazandaran are considered. The analyzed data are daily precipitation and minimum, maximum, and average temperatures. Downscaling was performed by using LARS-WG 8.0 (Long Ashton Research Station Weather Generator) software. The results revealed that the SSP5-8.5 (shared socioeconomic pathways) scenario showed better accuracy than the SSP2-2.6 scenario. In the west of Mazandaran, in the near future, the maximum temperature is projected to increase by 1.1 °C, while precipitation is projected to decrease by 26.3 mm, compared to the baseline period. In the east of Mazandaran, in the near future, the maximum temperature is projected to increase by 0.82 °C, while precipitation is expected to decrease by 7.1 mm, compared to the baseline period. In the west of Mazandaran, in the far future, the maximum temperature is projected to increase by 1.34 °C and precipitation is going to decrease by 55.7 mm, relative to the baseline period. In the east of Mazandaran, in the far future, the maximum temperature is projected to increase by 1.1 °C, while precipitation decreases by 31.3 mm, relative to the baseline period. The projected warming trends and precipitation reduction in both the east and west regions of Mazandaran Province are expected to have adverse environmental and socioeconomic implications.

1. Introduction

The recent industrialization of societies has led to increased fossil fuel usage, resulting in greenhouse gas emissions [1], increased global mean temperature, and changes in climatic parameters [2]. The Fourth Assessment Report of the Intergovernmental Panel on Climate Change (IPCC) predicts global mean temperature increases of approximately 3 °C by 2050 and 4.5 °C by 2100 [3]. Precipitation plays a crucial and influential role in Earth’s hydrological cycle and ecosystem [4]. With changes in precipitation amounts, snow and ice have decreased while sea levels have risen. Since the 1980s, high-precipitation regions in both hemispheres have moved closer to the poles. According to IPCC simulations, with temperature increases, precipitation will increase by 2100 in high latitudes, parts of tropical regions, and the Pacific Ocean, but decrease in some subtropical regions [5]. The increase in greenhouse gas emissions and intensification of climatic parameter changes can negatively impact various systems, including water resources, the environment, industry, health, and agriculture. Although reducing greenhouse gases could mitigate climate change intensity in the future periods, it should be noted that even if all greenhouse gas emissions were to stop immediately, climate change would continue until the late 21st century [6]. While temperature changes are one of the most apparent and measurable effects of climate change, this phenomenon has other impacts, including changes in atmospheric moisture, precipitation, and atmospheric currents. Generally, temperature increases lead to increased atmospheric moisture retention capacity [3,7].
Various studies have shown an increasing trend in air temperature in Iran over the past several decades, confirming the effects of climate change and global warming [8,9].
Over the past two decades, several research groups and international collaborative activities, including the IPCC, have presented datasets predicting future global climate conditions using global climate models [10,11]. These models are among the most common and appropriate methods for evaluating future climate change impacts [12,13]. The IPCC has so far presented six major assessments in three sections: scientific foundations, impacts and adaptation, and climate change mitigation. This international panel presented its First Assessment Report in 1990 and its Sixth Assessment Report in 2016 [14].
Maghsood et al. [15] have studied the effects of climate change on the Talar River discharge, in northern Iran, with the IPCC fifth report (CMIP5) using 20 models under two scenarios (RCP2.6 and RCP8.5). The results indicate that under both scenarios, temperature and precipitation will increase for the 2020–2040 period, and increased precipitation will result in higher river discharge and flood risk.
Zhu and Yang [16] conducted a comparative study of the IPCC Fifth Assessment Report and Sixth Assessment Report to assess the impact of climate change on precipitation and temperature in the Tibetan Plateau. For the period 1961–2014, their research used 23 models. The results showed that the CMIP6 models of the Sixth Assessment Report performed better in predicting temperature and precipitation in arid regions compared to the CMIP5 models, but less so in humid regions.
Doulabian et al. [17] assessed how climate change affects temperature and precipitation at six synoptic meteorological stations in Iran (Tabriz, Abadan, Babolsar, Iranshahr, Torbat-e Heydarieh, and Yazd). The results showed uncertainty in precipitation projections but indicated that temperature would increase at all selected stations in the future period.
Shafeeque and Luo [18] investigated the impact of climate change on glaciers in the upper Indus River basin in India. The results revealed simultaneous increases in precipitation and temperature, while glacier area and volume decreased.
Hasheminasab et al. [19] applied the Fifth Assessment Report (CMIP5) using data from 14 meteorological stations from 1964 to 2014 to analyze the impact of climate change on the Karun River basin (Iran). The results indicated that over the next 50 years, minimum and maximum temperatures in the region would increase and that precipitation would decrease in autumn and winter and increase in spring.
In the context of the Sixth Assessment Report of the IPCC, Goodarzi et al. [20] examined the impact of climate change on precipitation, minimum temperature, and maximum temperature at two synoptic stations in Gilan Province, northern Iran, for 2016–2100. The models used in this study were CanESM5, IPSL-CM6A-LR, and Miroc6, and the scenarios were SSP119, SSP434, and SSP585. Optimal results were shown by the CanESM5 model under the SSP585 scenario. Both stations would experience a mean maximum and minimum temperature increase of 4 °C. In addition, the precipitation amount would increase, and the number of rainy days would decrease.
Usta et al. [21] studied the effect of climate change on temperature variations in Iran for 97 synoptic stations under three future scenarios (SSP2-2.6, SSP2-4.5, and SSP5-8.5) in the baseline period (1990–2014). The results showed that the temperature increases in Iran for 2015–2050 and 2051–2100 for all three scenarios.
Mathbout et al. [22] examined how climate change shaped drought in Syria in 2023. The study employed 13 models and two IPCC Sixth Assessment Report scenarios (SSP2.6 and SSP8.5) as well as baseline period data from 1970 to 2000. It was shown that both scenarios led to temperature increases and precipitation decreases. Syria would also become subjected to more intense droughts with time.
Using the IPCC Sixth Assessment Report and its 37 associated models, precipitation and temperature changes across Iran were examined by Zabihi and Ahmadi [23]. The results further indicate that the ACCESS CM2, BCC CSM2 MR, and ACCESS ESM1 5 models performed more favorably than the other models for 1985–2014.
Using LARS-WG software, five models and two scenarios (SSP5-8.5, SSP2-4.5) from the IPCC Sixth Assessment Report (CMIP6), Abdulsahib et al. [24] examined the impact of climate change on precipitation and temperature in northern Iraq. Under the SSP5-8.5 scenario, temperature increases in all seasons and precipitation decreases in all seasons but autumn.
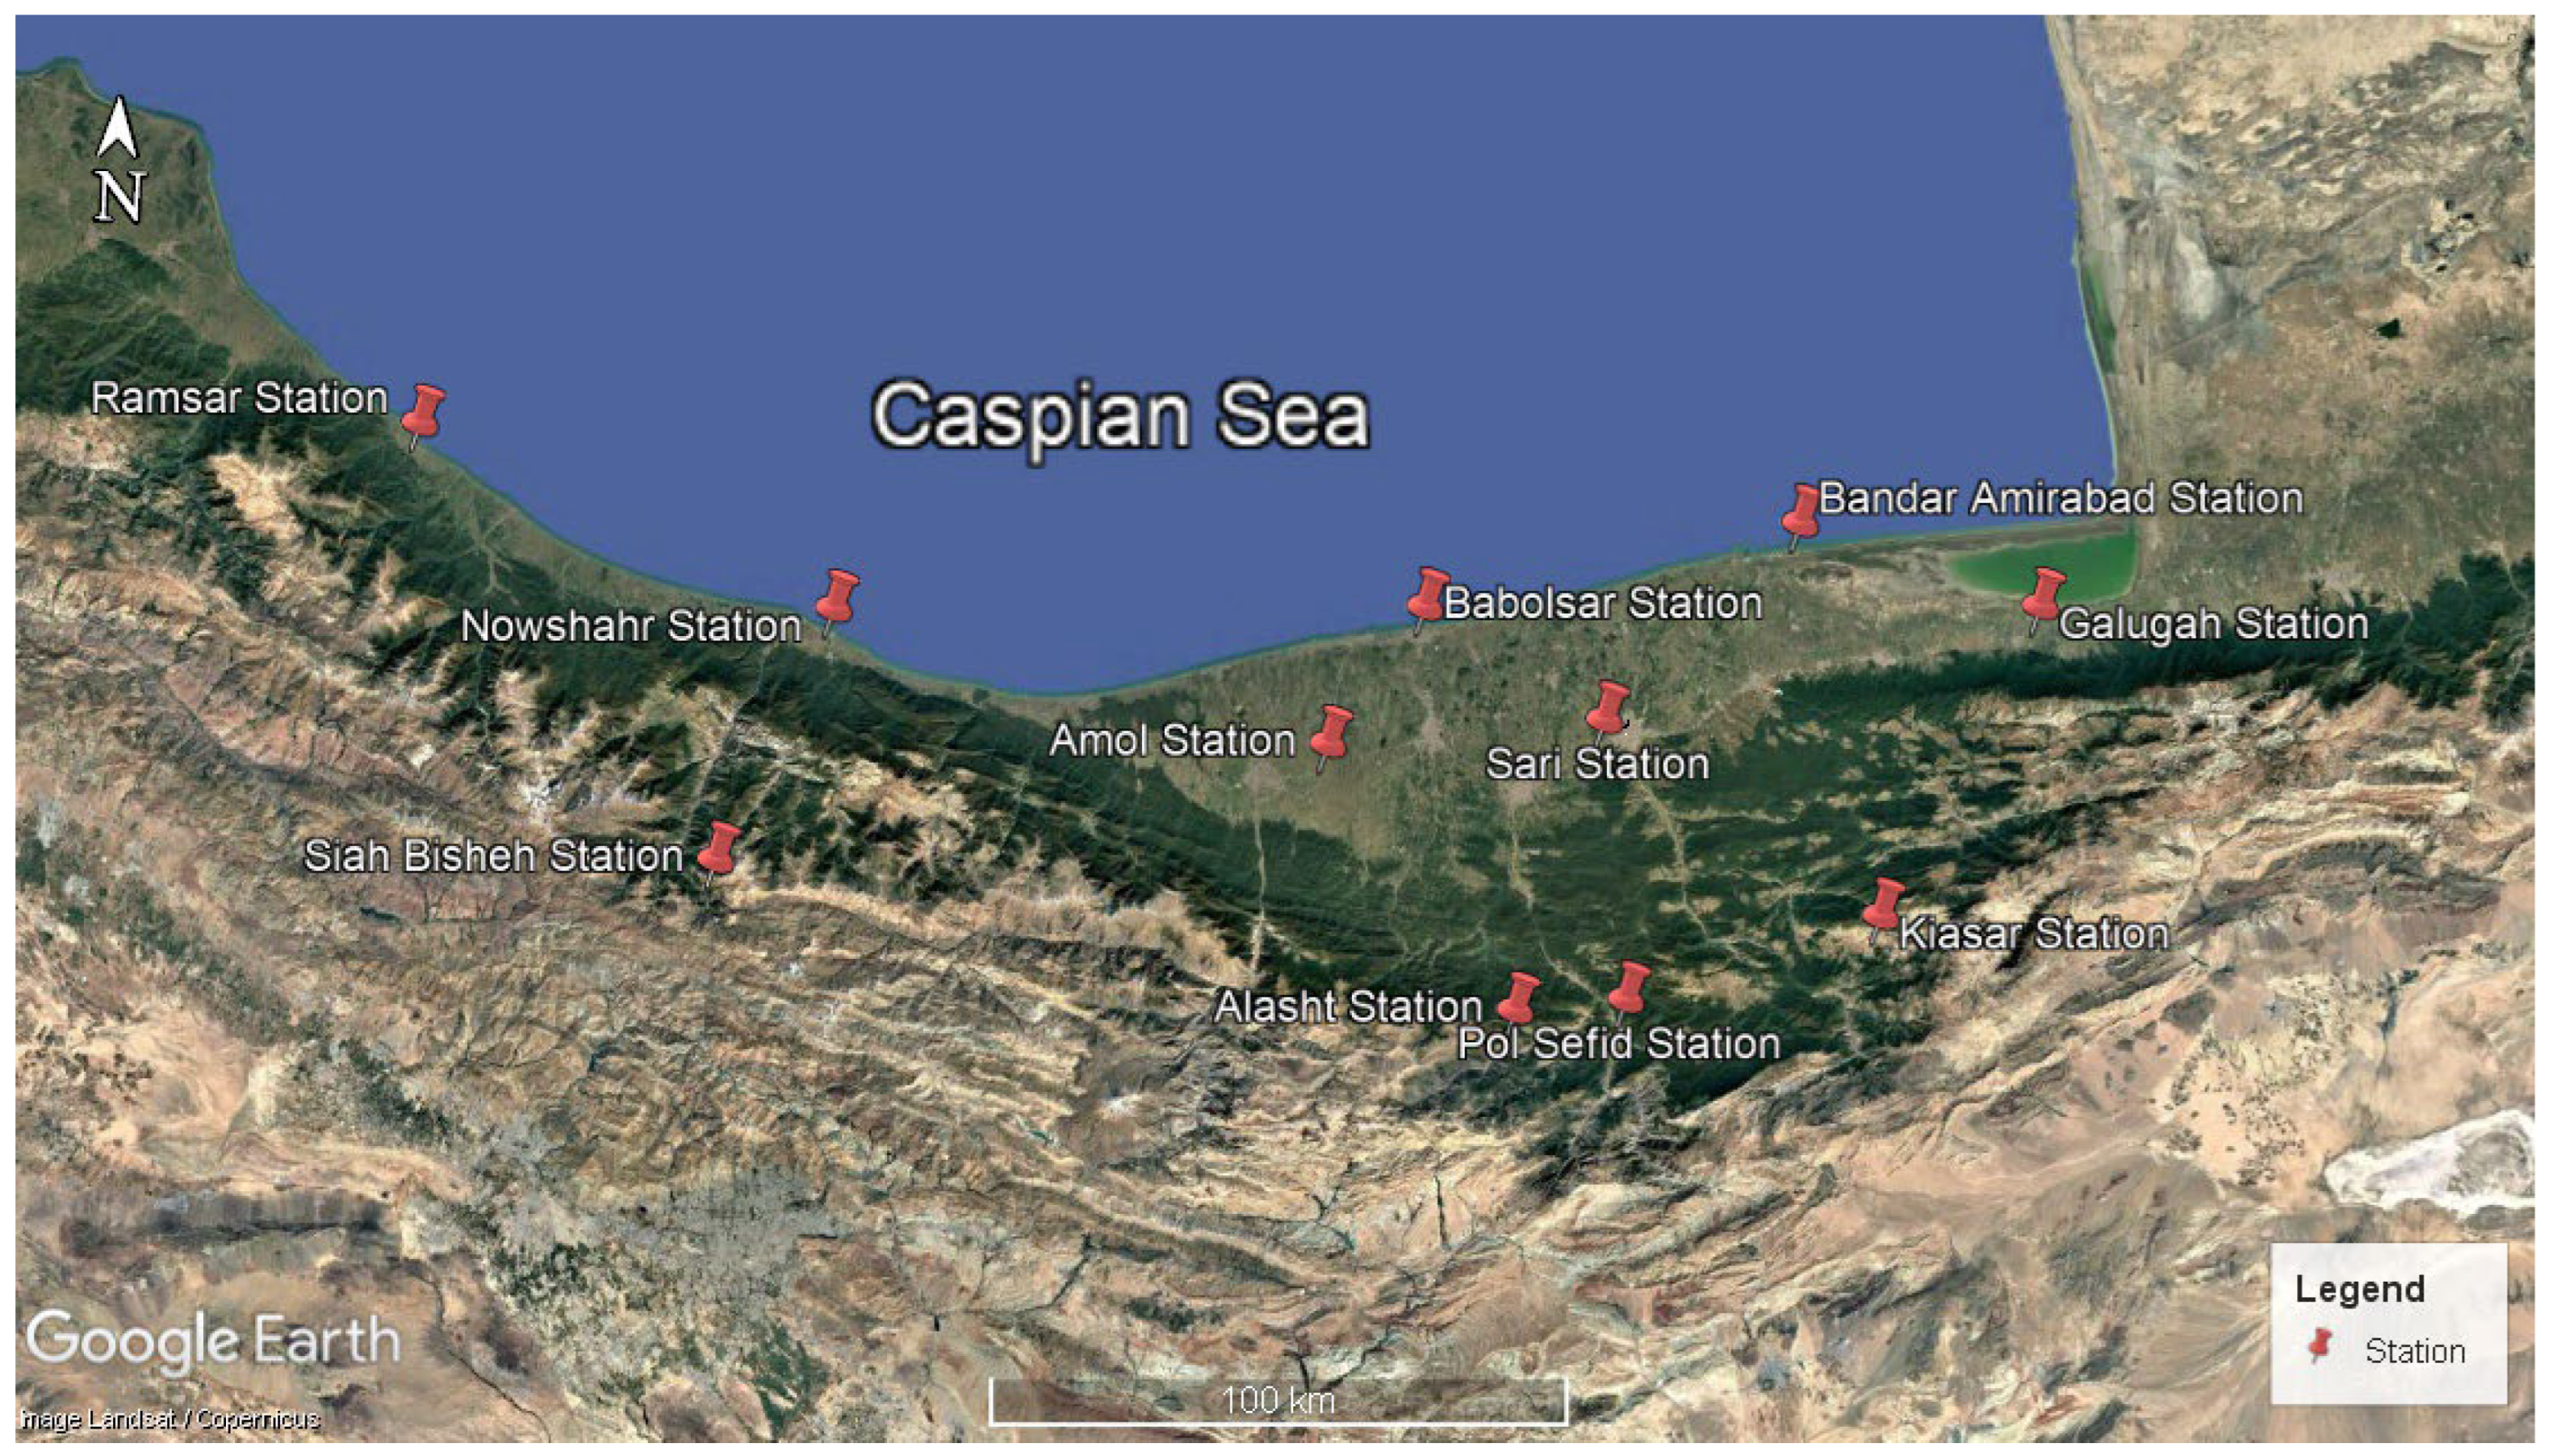
Mazandaran Province is located in the north of Iran. In the east of Mazandaran Province, the distance between the Caspian Sea and Alborz Mountain range is greater than in the west of this province. This characteristic has led to differences in climatic changes, necessitating special consideration for environmental, water resources, and agricultural planning.
Our goals in this study are to predict the impact of climate change in the near and far future on the meteorological parameters (temperature and precipitation) of 11 synoptic stations located in the east and west of Mazandaran Province. In other studies cited in the literature, only coastal stations have been considered. To make this study comprehensive, plain and mountain stations are also added. Also, from the five GCMs (general circulation models) and two scenarios (SSP2-2.6 and SSP5-8.5), the best model for temperature, the best model for precipitation, and the best scenario for each station are selected.

2. Materials and Methods

2.1. Study Area

The selected study area is Mazandaran Province in the north of Iran [25]. This region is located between the geographical coordinates of 50°21′ to 54°08′ east longitude and 35°46′ to 36°58′ north latitude. This region is approximately 23,756 km2, of which about 18,523 km2 consists of mountainous regions, and 5233 km2 comprises foothills and plains. The maximum elevation of this province is 5670 m above mean sea level, and the minimum elevation is −23 m below the sea level. This province is bound by the Caspian Sea to the north, the central part of the Alborz Mountain range to the south, the Sefidrud River watershed in the Gilan Province to the west, and the watersheds of Semnan Province and Golestan Province to the east. According to the National Statistics Center, the population of Mazandaran Province was approximately 3,415,000 in 2024. However, due to the presence of lush forests, high mountains, the Caspian Sea, natural lakes, and beautiful landscapes, millions of people from across Iran visit this province each year.

2.2. Characteristics of the Synoptic Stations

The potential changes in climatic parameters across Mazandaran Province in the future are evaluated using data from 11 synoptic meteorological stations. Observational data from the synoptic stations of Ramsar, Siah Bisheh, Nowshahr, and Amol in the west of the province and the synoptic stations of Babolsar, Alasht, Sari, Pol Sefid, Bandar Amirabad, Kiasar, and Galugah in the east of the province (Figure 1) are evaluated after considering the duration and completeness of their statistics. Data from the synoptic stations of Izadshahr and Rineh are discarded because of short observational statistical periods, and the Baladeh and Kojour stations are omitted because of data deficiencies.
As is seen in Figure 1, selection of western and eastern regions was made by considering the length of Mazandaran Province from its eastern to western borders. This line lies between Babolsar and Amol stations in the middle of this path. Four weather stations are located in the west and seven in the east of this imaginary line. Furthermore, the eastern and western regions are almost the same size. The differences between these two regions in terms of annual mean air temperature and precipitation (as examined in this research) have caused this east–west separation. The annual average precipitation and air humidity are lower, and air temperature is higher, in the eastern part of the province than in the western part. Table 1 presents the geographical characteristics and baseline statistical period length of the selected synoptic stations. This research uses daily data of maximum temperature, minimum temperature, average temperature, and precipitation. The common time period of all the stations, from 2005 to 2023, was used to compare the baseline climate statistics with predictions for the near future (2025–2050) and far future (2051–2080). Since simple mathematical averaging cannot show differences and variations in a vast region [26], the Thiessen polygon method was used to calculate the mean temperature (minimum, average, and maximum) and mean precipitation in the western and eastern regions of this province. Furthermore, due to the insufficient number of weather stations across the province, the use of averaging methods (using isothermal and isohyet curves) did not seem logical.

2.3. Hurst Coefficient

The Hurst coefficient [27] is one of the many procedures used to determine the adequacy of hydrological time series length for modeling. The Hurst coefficient is referred to as the “index of dependence” or “index of long-range dependence”. The Hurst coefficient is obtained from Equation (1):
K = L o g R σ L o g N 2
where N is number of data points in the time series, and σ is standard deviation of the series. In this equation, R equals the difference between positive and negative deviations from the time series mean, calculated cumulatively:
R = S + + S
where S+ is the largest positive deviation from the mean, and S is the least negative deviation from the mean. For the series, a Hurst coefficient of 0.5–1 means that a high value tends to be followed by another high value. A value in the range of 0–0.5 indicates a time series with long-term switching between high and low values in the adjacent pairs. The more the K coefficient exceeds 0.5, the greater the long-term memory in the time series, and there is no need for extension of the time series data [28].

2.4. Models and Scenarios

Recently, three-dimensional atmosphere–ocean general circulation models (AOGCMs) [29] have been the most efficient tools for generating climate change scenarios. The IPCC has so far presented six major assessment reports in three sections: Impacts and adaptation, scientific basis, and climate change mitigation. The first report of this international panel was the FAR (First Assessment Report) in 1990 and the supplementary report in 1992. AR5 (Fifth Assessment Report) was presented in 2014, and AR6 (Sixth Assessment Report) was presented in 2019.
The models from the IPCC Sixth Assessment Report (BCC-CSM2-MR, GFDL-CM4, MRI-ESM2-0, IPSL-CM6A-LR, and CNRM-CM6-1) are evaluated for their suitability for predicting monthly average changes in maximum temperature, minimum temperature, mean temperature, and precipitation for the synoptic stations in the west and east of Mazandaran Province. Zarrin and Dadashi-Roudbari [30] and Zarrin et al. [31] presented the BCC-CSM2-MR, GFDL-CM4, and MRI-ESM2-0 models for the southern Caspian Sea, while Ansari et al. [32] presented IPSL-CM6A-LR and CNRM-CM6-1 models for this region. In order to determine the best model for this research, one station from the east and one station from the west of the Mazandaran Province were chosen. Figure 1 shows that Sari synoptic station is approximately in the middle of the eastern region, and Nowshahr synoptic station is approximately in the middle of the province’s western region. Therefore, precipitation and temperature simulations at these two stations are studied using the above-mentioned proposed models.
The scenarios used in this research for predicting future changes in climatic parameters (precipitation and temperature) included the SSP2-2.6 and SSP5-8.5 scenarios from the IPCC Sixth Assessment Report. After selecting the model type, which was compatible with climate parameter changes in the Mazandaran Province, choosing the most compatible emission scenario between the SSP2-2.6 and SSP5-8.5 scenarios for climate changes at the province’s weather stations was necessary. These scenarios, which are optimistic and pessimistic climate change prediction scenarios, respectively, are evaluated for monthly average (Tavg), maximum (Tmax), and minimum (Tmin) temperatures and precipitation (P) data at the weather stations in the east and west of the province that had suitable observational statistical periods.

2.5. Downscaling

Predicting future climate changes on Earth is an appropriate task for general circulation models. The high spatial resolution of the output of these models [33] makes them unsuitable for regional-scale application where the output cannot be used to assess the hydrological and environmental impacts of climate change [34]. Downscaling is the most efficient tool to link the regional scale to the general circulation model (GCM) scale. Due to the mismatch between the global and regional scales, different methods are presented for downscaling. One of these tools for downscaling the output of global general circulation models is the LARS-WG model. This model is capable of producing a daily time series of temperature, precipitation, and solar radiation. A set of daily observational data from a particular station is used by the model to generate a set of parameters for meteorological variables with probabilistic distribution over meteorological variables and their correlations for a given period length [35]. In the present research, downscaling is performed by LARS-WG 8.0 software.

2.6. Error Evaluation Criteria

To evaluate the models, scenarios, and meteorological predictions, three statistical criteria (indices) are used: coefficient of determination (R2), mean absolute error ( M A E ), and root mean squared error ( R M S E ) (Equations (3)–(5)). The coefficient of determination value is zero to 1.0; the closer to 1.0, the better the correlation. The lower the M A E and R M S E values are, the better and more accurate and certain the model is.
R 2 = i = 1 n ( X O X O ¯ ) ( X P X P ) ¯ i = 1 n ( X O X O ¯ ) 2 i = 1 n ( X P X P ¯ ) 2
R M S E = i = 1 n ( X O X P ) 2 n
M A E = i = 1 n ( X O X P ) n
In Equations (3)–(5), X O and X p are observed and predicted values of precipitation, maximum temperature, minimum temperature, and average temperature; X O ¯ and X P ¯ are means of the observed and predicted values, respectively, and n represents the number of parameters. The above performance indices determine model accuracy in a quantitative sense.

3. Results

3.1. Results of the Hurst Coefficient

Table 2 presents the results of the Hurst coefficient for the different stations and parameters. Since the calculated Hurst coefficient for each time series used in this research is greater than 0.5, the results in this table suggest that the long-term memory of the statistical period length at these stations is suitable for modeling.

3.2. Climate Change Assessment Results

The results of selecting the superior model are presented in Table 3, Table 4, Table 5 and Table 6. According to the results presented in Table 3 and Table 5, the temperature variations at Nowshahr synoptic station align with the IPSL-CM6A-LR model, and the monthly precipitation variations align with the CNRM-CM6-1 model. In addition, the results in Table 4 and Table 6 indicate that temperature variations at Sari synoptic station, like the Nowshahr synoptic station, follow the IPSL-CM6A-LR model, and monthly precipitation variations align with the CNRM-CM6-1 model. Therefore, since the temperature variations in the west and east of Mazandaran Province are compatible with the IPSL-CM6A-LR climate model, and the monthly precipitation variations show greater correspondence with the CNRM-CM6-1 model, these models have been used to predict temperature and precipitation across the Mazandaran Province. The IPSL-CM6A-LR climatological model is much more improved compared to the previous version, although some systematic biases and shortcomings persist and a large number of historical and scenario simulations have been performed as part of CMIP6 [36]. CNRM-CM6-1 is the successor of the CNRM-CM5.1 climate model [37].
The results of evaluating the type of models compatible with temperature changes align with Yazdandoost et al. [38], and precipitation changes under climate change effects across Mazandaran Province correspond with Ansari et al. [32]. After selecting the superior model for the two selected stations (Nowshahr and Sari), the superior scenario is selected for all stations. The results of this work for the Nowshahr and Sari stations and the westernmost and easternmost stations are presented in Table 3, Table 4, Table 5 and Table 6. The underlined error evaluation indices in Table 3, Table 4, Table 5 and Table 6 correspond to the best model.
The results in Table 7, Table 8, Table 9 and Table 10 show that the SSP5-8.5 scenario has greater compatibility as compared to the SSP2-2.6 scenario at the synoptic stations located in the west and east of Mazandaran Province. Therefore, this emission scenario has been used to predict climatic parameter changes across Mazandaran Province for the near future (2025–2050) and far future (2051–2080) periods. Due to the numerous synoptic stations in Mazandaran Province, two stations from the east of the region (Sari and Babolsar stations) and two stations from the west of the region (Ramsar and Nowshahr stations) are taken to select the superior scenario. The underlined error evaluation indices in Table 7, Table 8, Table 9 and Table 10 correspond to the best scenario.

3.2.1. West of Mazandaran Province

The results of the annual and monthly mean temperature and precipitation in the west of Mazandaran Province for the baseline (2005–2023), near future (2025–2050), and far future (2051–2080) periods are presented in Table 11 and Figure 2, Figure 3 and Figure 4.
The results of Table 11 show that overall, for the years 2025–2080, temperature (maximum, average, minimum) would increase and precipitation would decrease. In the near future and far future, compared to the baseline period, maximum temperature will increase by 1.1 °C and 1.34 °C, respectively. The average temperature in the near and far future, as compared to the baseline period, will increase by 1.1 °C and 1.3 °C, respectively. In the near future and far future, the minimum temperature will be 1 °C and 1.15 °C higher than the baseline period, respectively. In the near and far future, precipitation will be less than the baseline period by 26.3 mm and 55.7 mm, respectively.
Figure 2, Figure 3 and Figure 4 show the trend of monthly temperature changes in which there is positive change in some months and negative change in others. In Figure 2, the highest increase in maximum temperature (3.03 °C) in the near future period in relation to the baseline period is for March, and the greatest decrease (0.45 °C) is for July. In particular, the maximum temperature (in March) shows that the largest increase (3.21 °C) in the far future period and the greatest decrease (0.16 °C) in the far future period will be in July.
In Figure 3, the highest increase in average temperature (2.89 °C) for the near future period, compared to the baseline period, occurs in March, while the greatest decrease (0.56 °C) occurs in August. The highest increase in average temperature (3.04 °C) for the far future period, compared to the baseline period, occurs in March, while the greatest decrease (0.31 °C) occurs in July.
In Figure 4, the highest increase in minimum temperature (2.66 °C) for the near future period, compared to the baseline period, occurs in March, while the greatest decrease (0.66 °C) occurs in July. The highest increase in minimum temperature (2.77 °C) for the far future period, compared to the baseline period, occurs in March, while the greatest decrease (0.45 °C) occurs in August.
Figure 5 shows that precipitation values in the west of Mazandaran Province will decrease in some months and increase in others during the future periods compared to the baseline period. For the near future, compared to the baseline period, the greatest increase in monthly precipitation (3.24 mm) occurs in February, while the greatest decrease (5.92 mm) occurs in October. For the far future, compared to the baseline period, the greatest increase in monthly precipitation (1.79 mm) occurs in February and April, while the greatest decrease (7.32 mm) occurs in October.
The variations in temperature and precipitation across different months in western Mazandaran Province are irregular due to the differences in elevation of the existing synoptic stations. The Nowshahr and Ramsar stations are located in coastal cities near the Caspian Sea, Amol station is in the plains, and Siah Bisheh station is in a mountainous region. In order to make more accurate predictions of temperature and precipitation changes in each coastal, plain, and mountainous region, more synoptic stations should be set in each region.

3.2.2. East of Mazandaran Province

To evaluate the changes in the climatic parameters of temperature and precipitation in the east of Mazandaran Province, observed data (2005–2023) from Galugah, Sari, Bandar Amirabad, Alasht, Pol Sefid, Babolsar, and Kiasar synoptic stations were used. The results of the temperature and precipitation analysis in this region for the baseline period and predictions for the near and far future periods are presented in Table 12 and Figure 6, Figure 7 and Figure 8.
The results presented in Table 12 indicate that overall, like the west of the Mazandaran Province, an increase in temperature (maximum, average, minimum) and decrease in precipitation are expected for 2025–2080. Maximum temperature in the near future and far future, compared to the baseline period, will increase by 0.82 °C and 1.1 °C, respectively. The average temperature will increase by 0.83 °C and 0.88 °C, respectively. The minimum temperature will increase by 0.77 °C and 0.71 °C, respectively. Precipitation is predicted to decrease by 7.1 mm and 31.3 mm in the near future and far future, respectively, compared to the baseline period.
Comparison of Table 11 and Table 12 shows that east of Mazandaran Province has been warmer than the west of Mazandaran Province during the baseline period, and this pattern is predicted to continue in both the near and far futures. However, monthly and annual precipitation levels have been higher in the west of Mazandaran Province than in the east, and this pattern will also continue in the future.
According to Figure 6, the maximum temperature increases in all months during both the far and near future periods, compared to the baseline period. For the near future, the greatest temperature increase (1.02 °C), compared to the baseline period, occurs in October, and for the far future (1.52 °C), it also occurs in October.
Figure 7 demonstrates that the average temperature increases in all months during the future periods compared to the baseline period. In the near future, the greatest temperature increase (1.49 °C), compared to the baseline period, occurs in February, while in the far future, the maximum increase (1.28 °C), compared to the baseline period, occurs in July.
According to Figure 8, in the near future period the greatest increase in minimum temperature (1.12 °C) occurs in January. In the far future period, the greatest increase in minimum temperature (1.14 °C) will occur in July.
The results in Figure 9 indicate that precipitation in the east of Mazandaran Province during the near future period shows an increasing trend, compared to the baseline period, in January, March, April, October, and December, while it shows a decreasing trend in other months. Compared to the baseline period, precipitation in the far future will show a decreasing trend, except in April. The greatest increase in monthly precipitation in the near future period (1.1 mm) will occur in April, and the greatest decrease (2.8 mm) in May. In addition, in the far future period, the greatest increase in monthly precipitation (0.16 mm) will occur in April, with the greatest decrease (7.2 mm) in November. One possible reason for precipitation anomalies across different months might be the various elevations of different synoptic stations in the east of Mazandaran (i.e., the Galugah and Sari stations are in the plains, the Bandar Amirabad and Babolsar stations are near the Caspian Sea, and the Kiasar, Pol Sefid, and Alasht stations are in mountainous regions).

3.2.3. Entire Mazandaran Province

Baseline period and future period statistics from all synoptic stations in the west and east of Mazandaran Province are utilized to evaluate and analyze precipitation changes across the entire Mazandaran Province. The results of this evaluation are presented in Table 13 and Figure 10.
The results in Table 13 indicate that, overall, a decrease in precipitation is expected across the Mazandaran Province for 2025–2080. Precipitation is predicted to decrease by 2.25% and 5.88% in the near future and far future, respectively, compared to the baseline period.
The results in Figure 10 show that precipitation across Mazandaran Province in the near future period, compared to the baseline period, will be higher in February, March, April, and December and lower in the remaining months. In the far future, precipitation across Mazandaran Province will be lower than the baseline period in all months. The greatest monthly increase in precipitation in the near future period (1.4 mm) will occur in February, with the greatest decrease (4.5 mm) in May. In the far future period, the greatest decrease in precipitation (7.4 mm) will occur in November.

4. Discussion

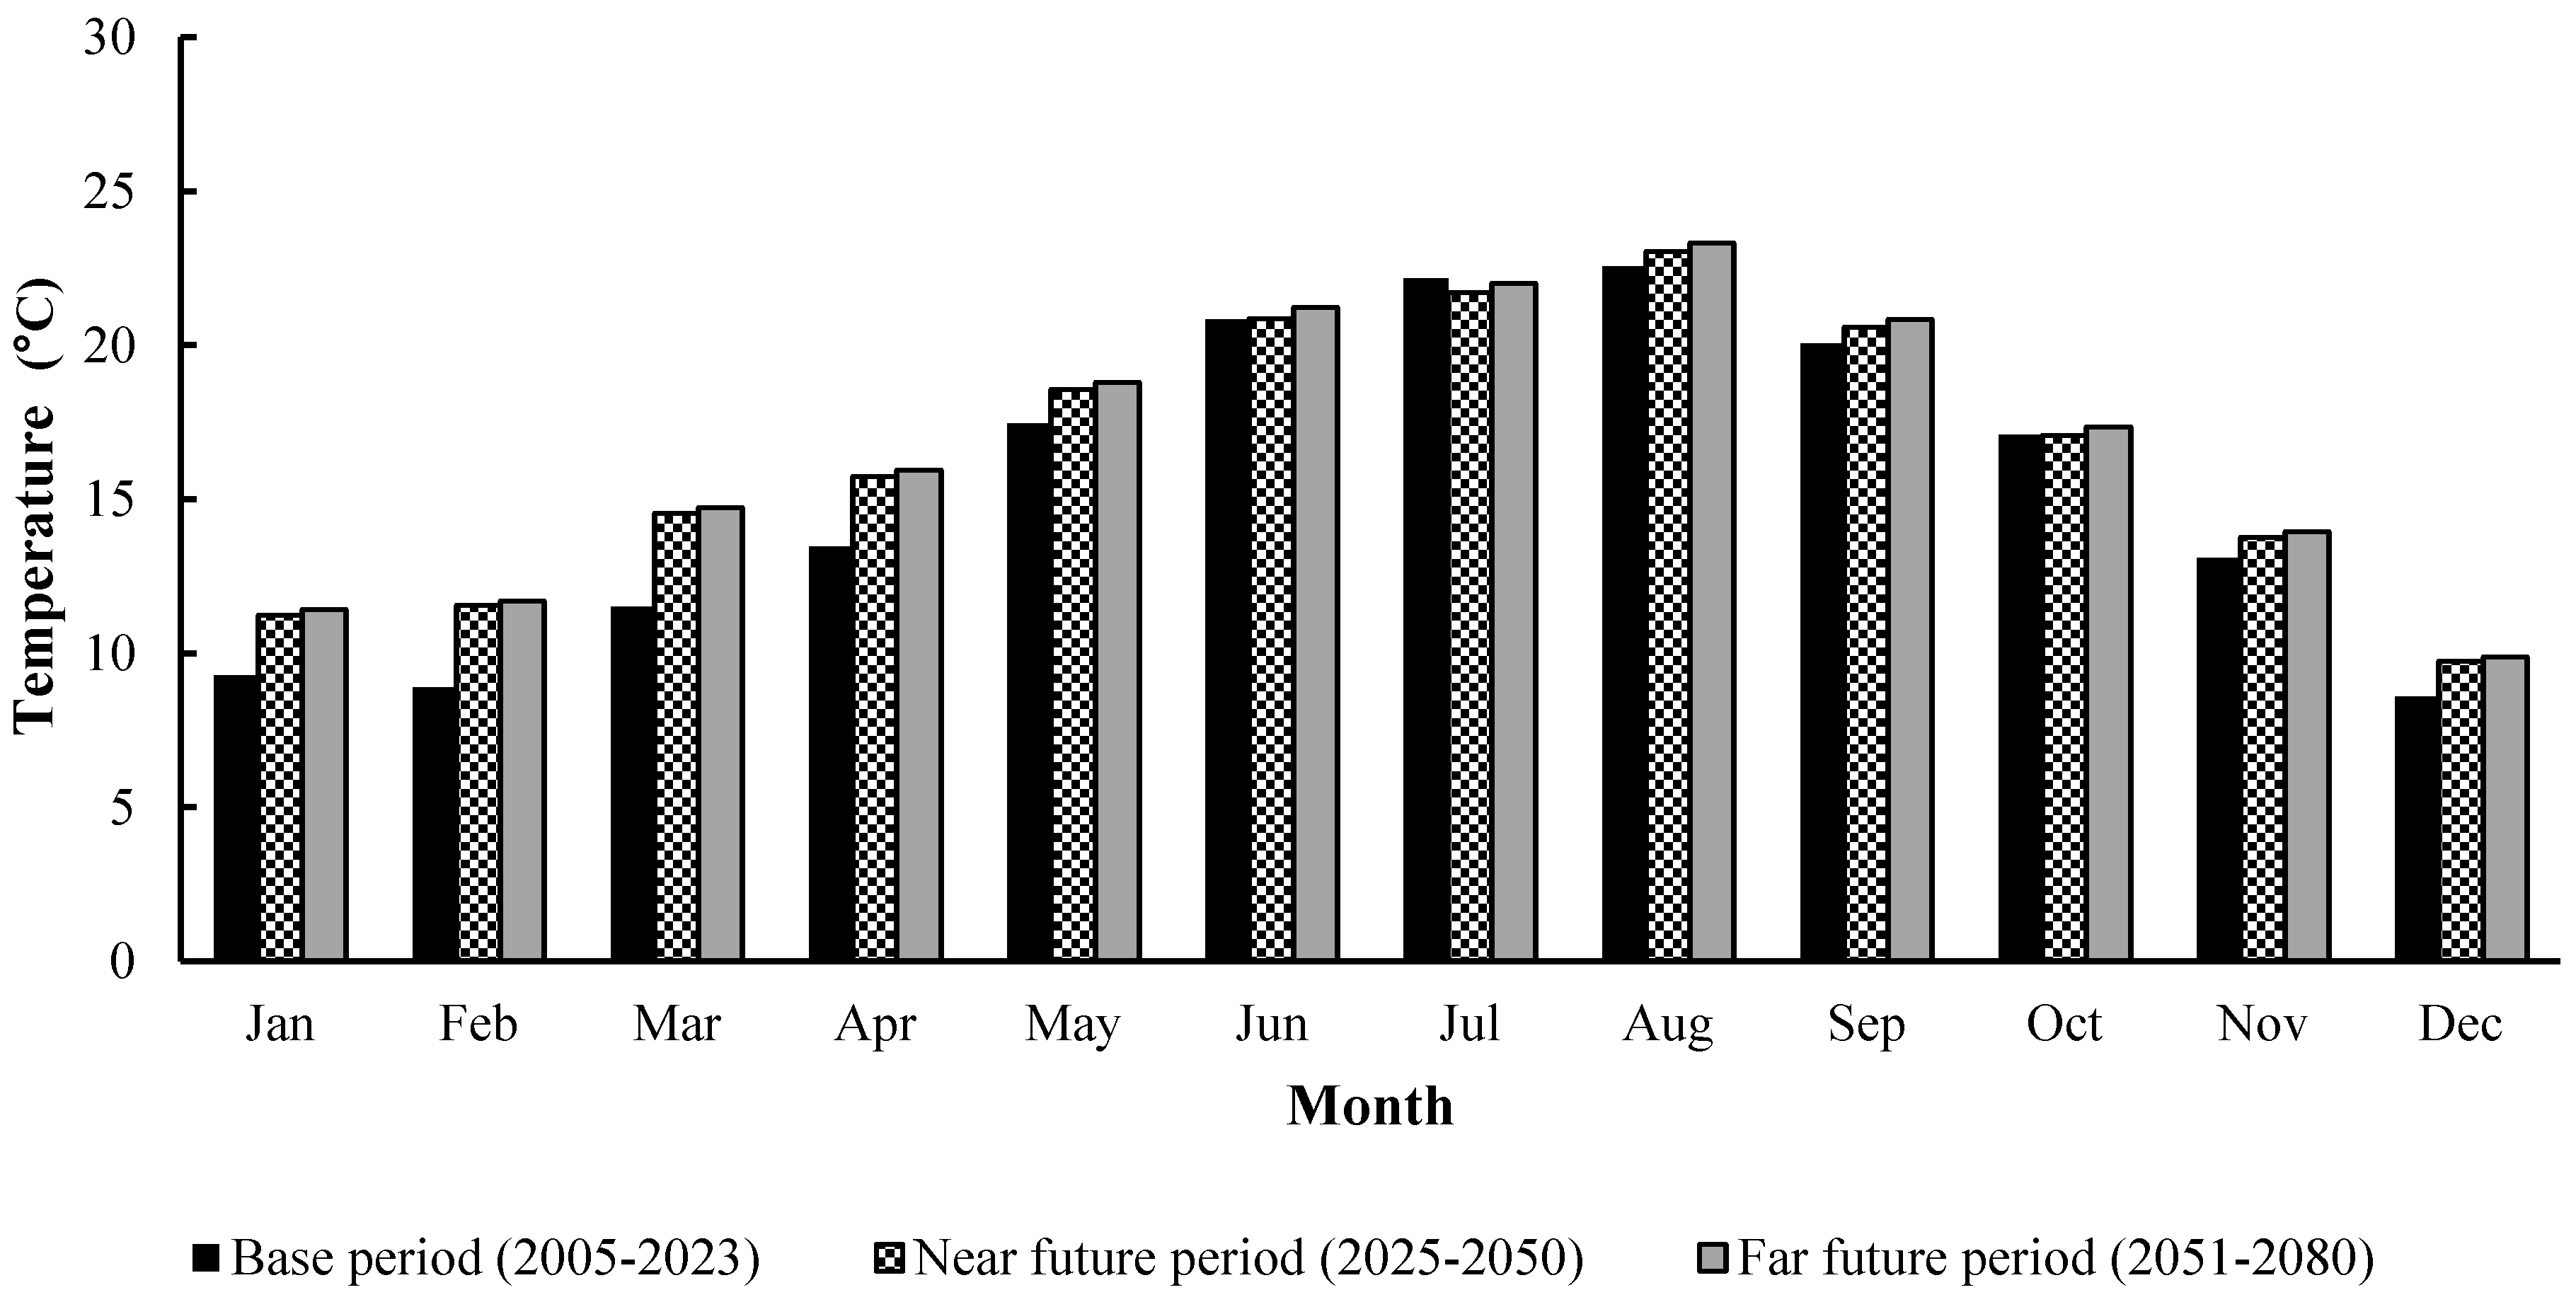
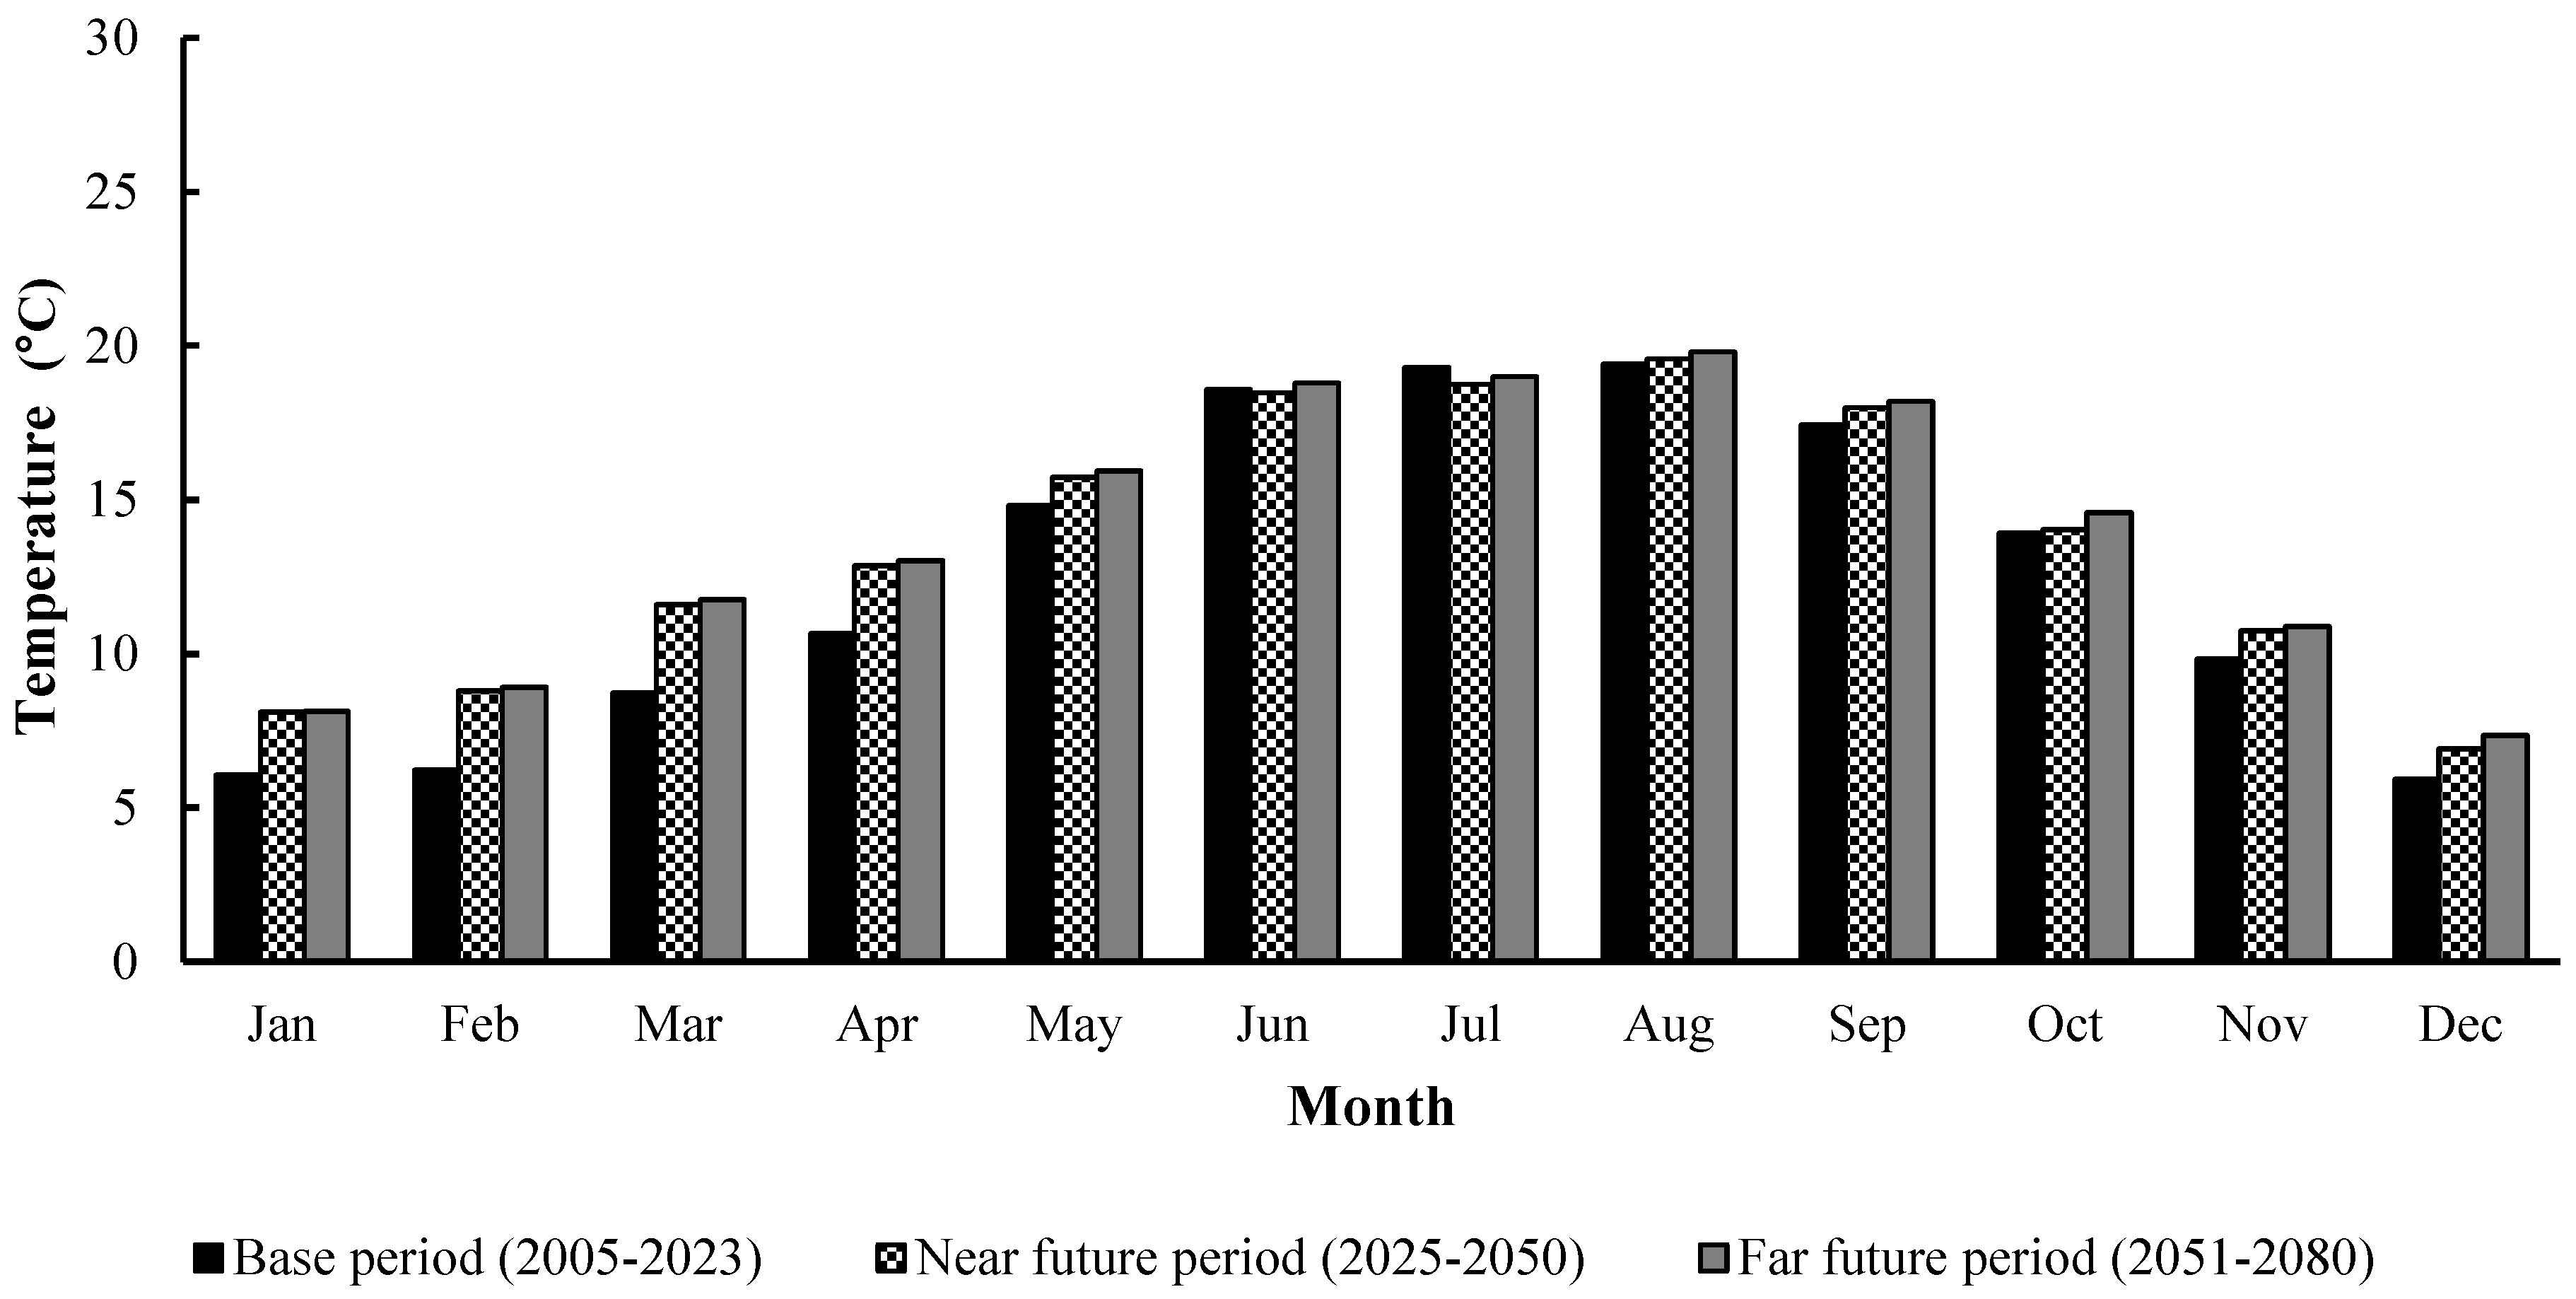
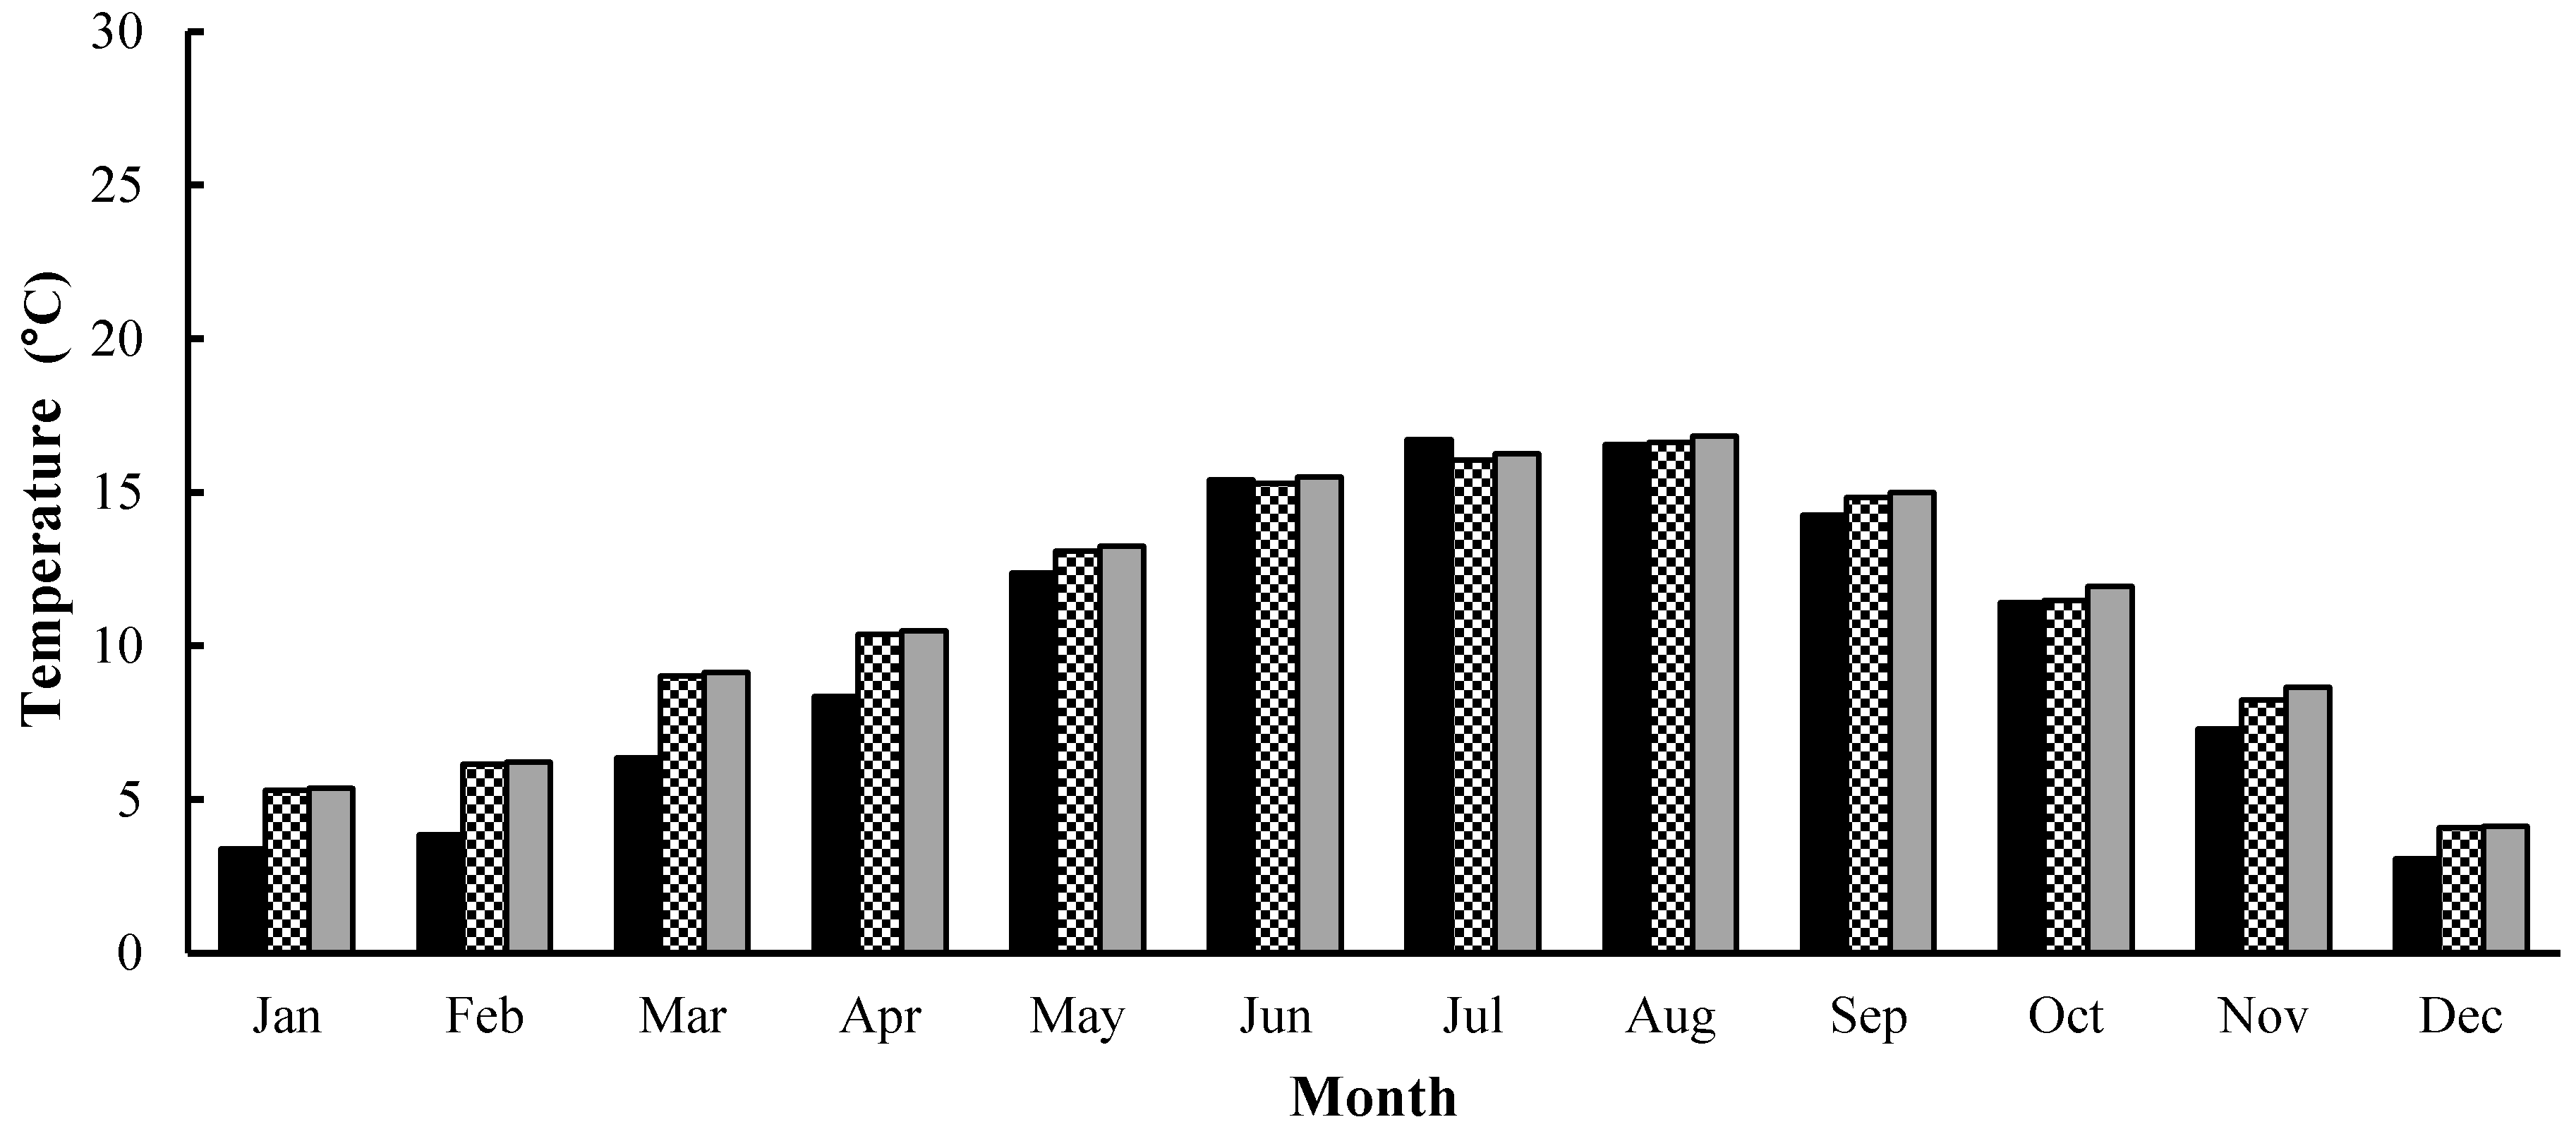
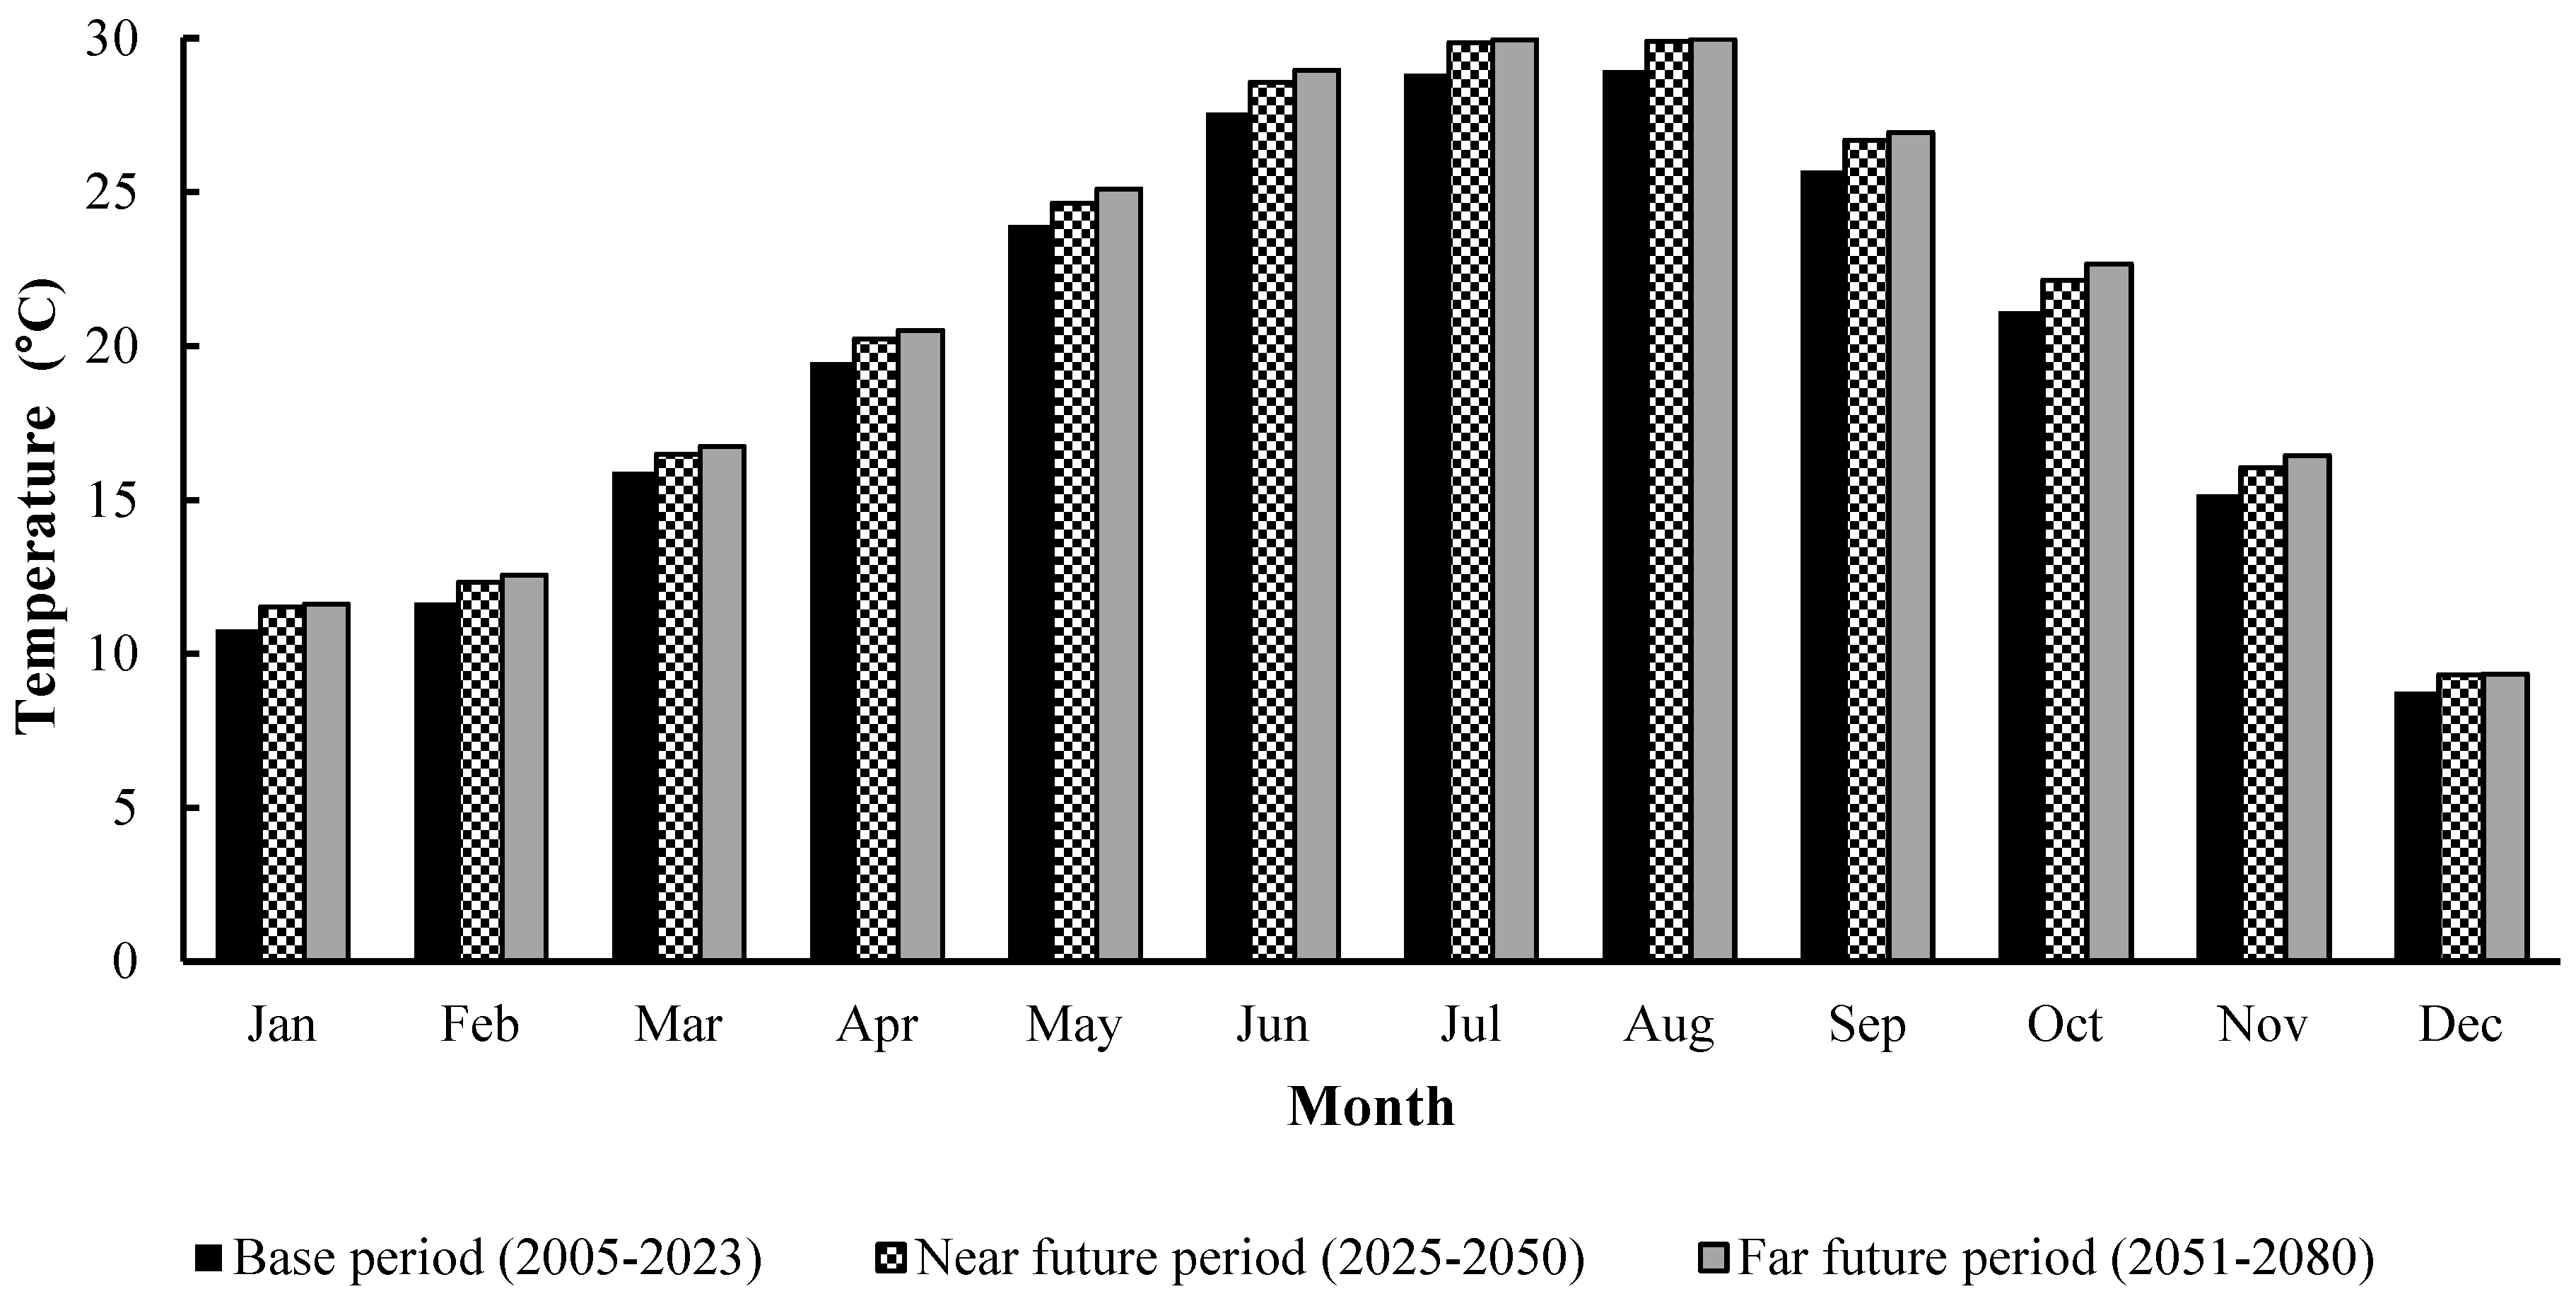
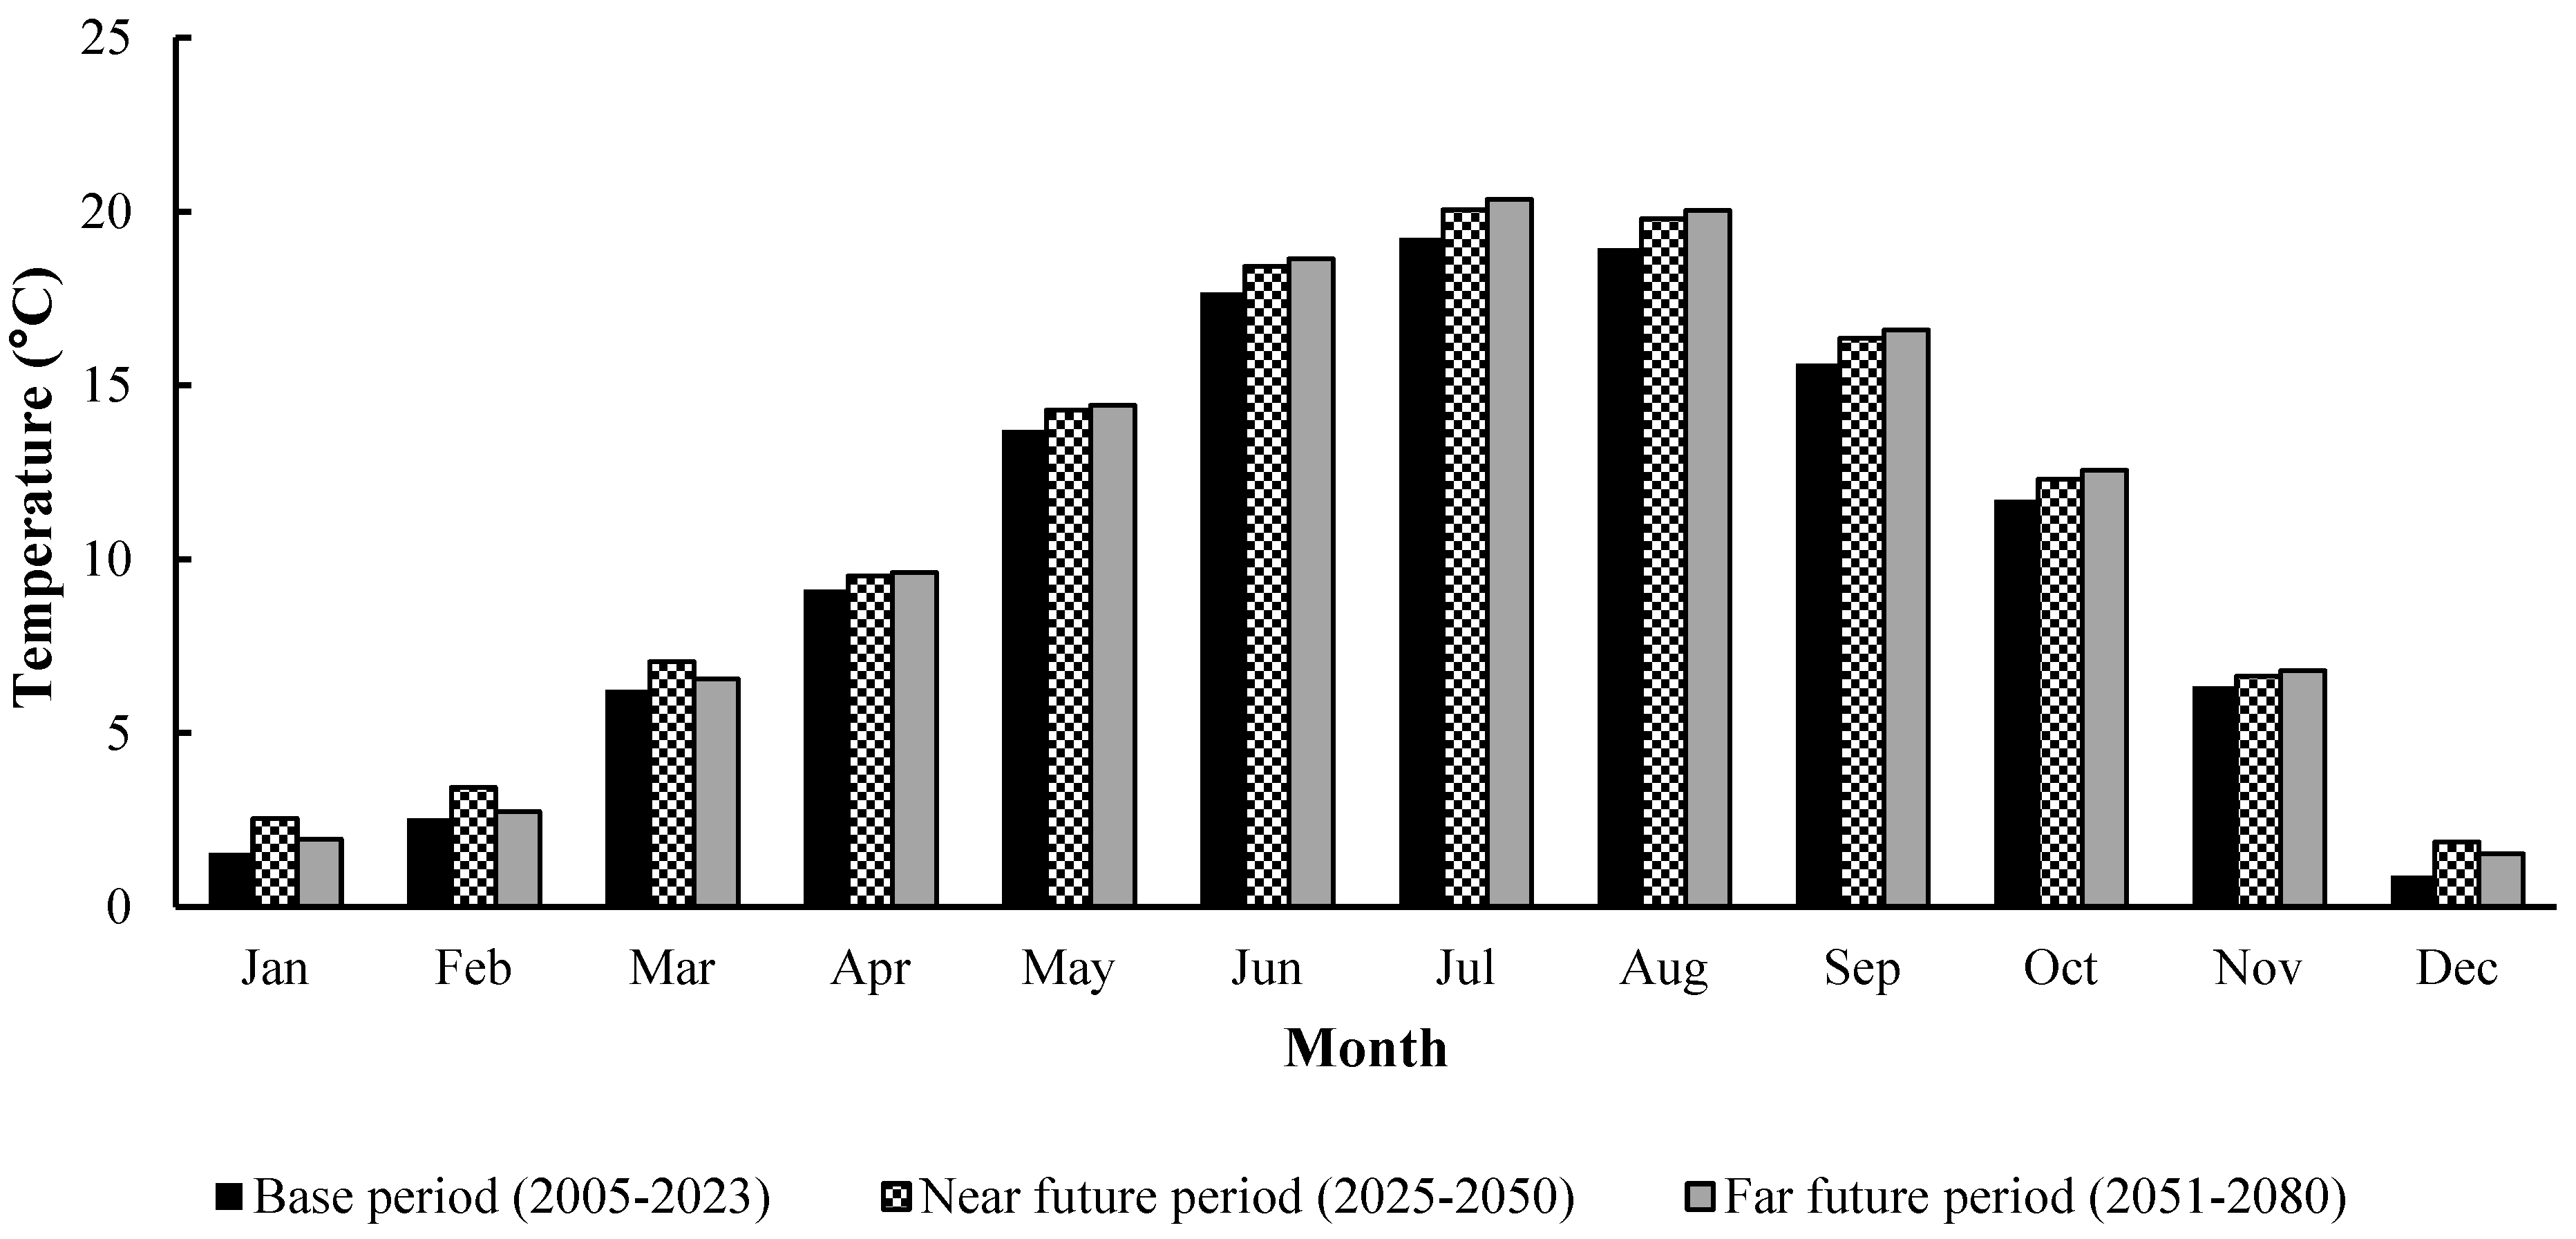
One of the most important findings of the near future air temperature between the two regions of Mazandaran Province is that the average temperature in the western part will be lower than that in the eastern part (13.68 °C vs. 16.09 °C). Also, in the far future, the average temperature in the west of Mazandaran will be lower than in the east of Mazandaran (13.9 °C vs. 16.19 °C). The short distance between the Caspian Sea and the mountains in the west causes the average temperature to be lower than in the east, while the eastern part of the province has extensive plains between the sea and the mountains.
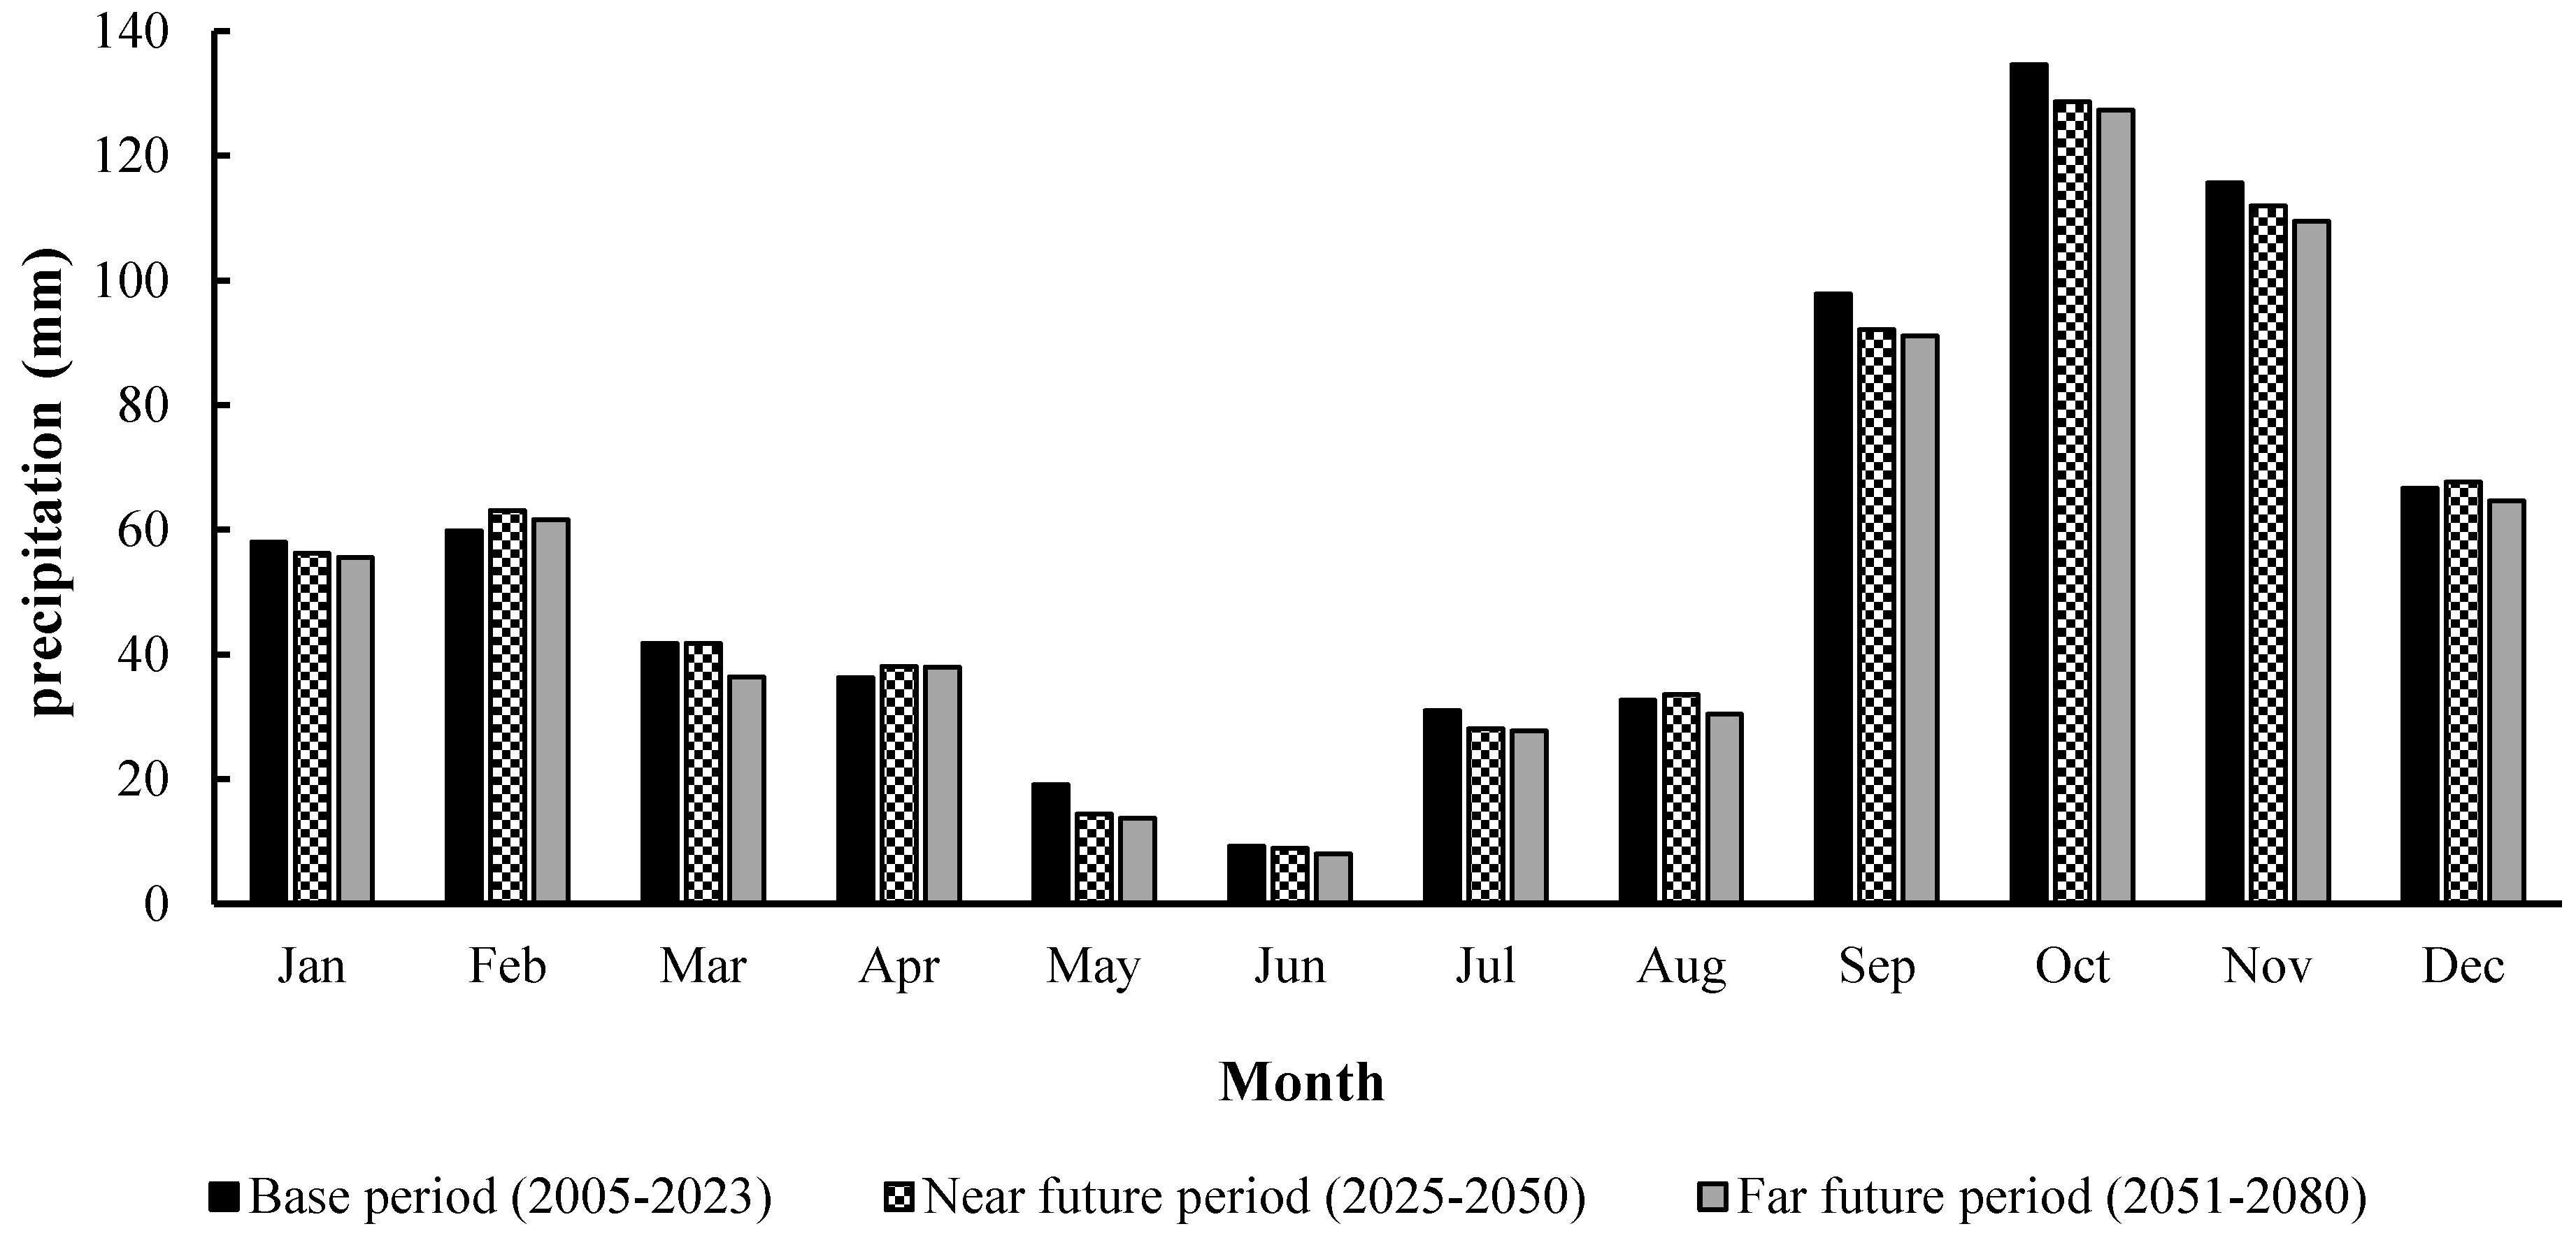
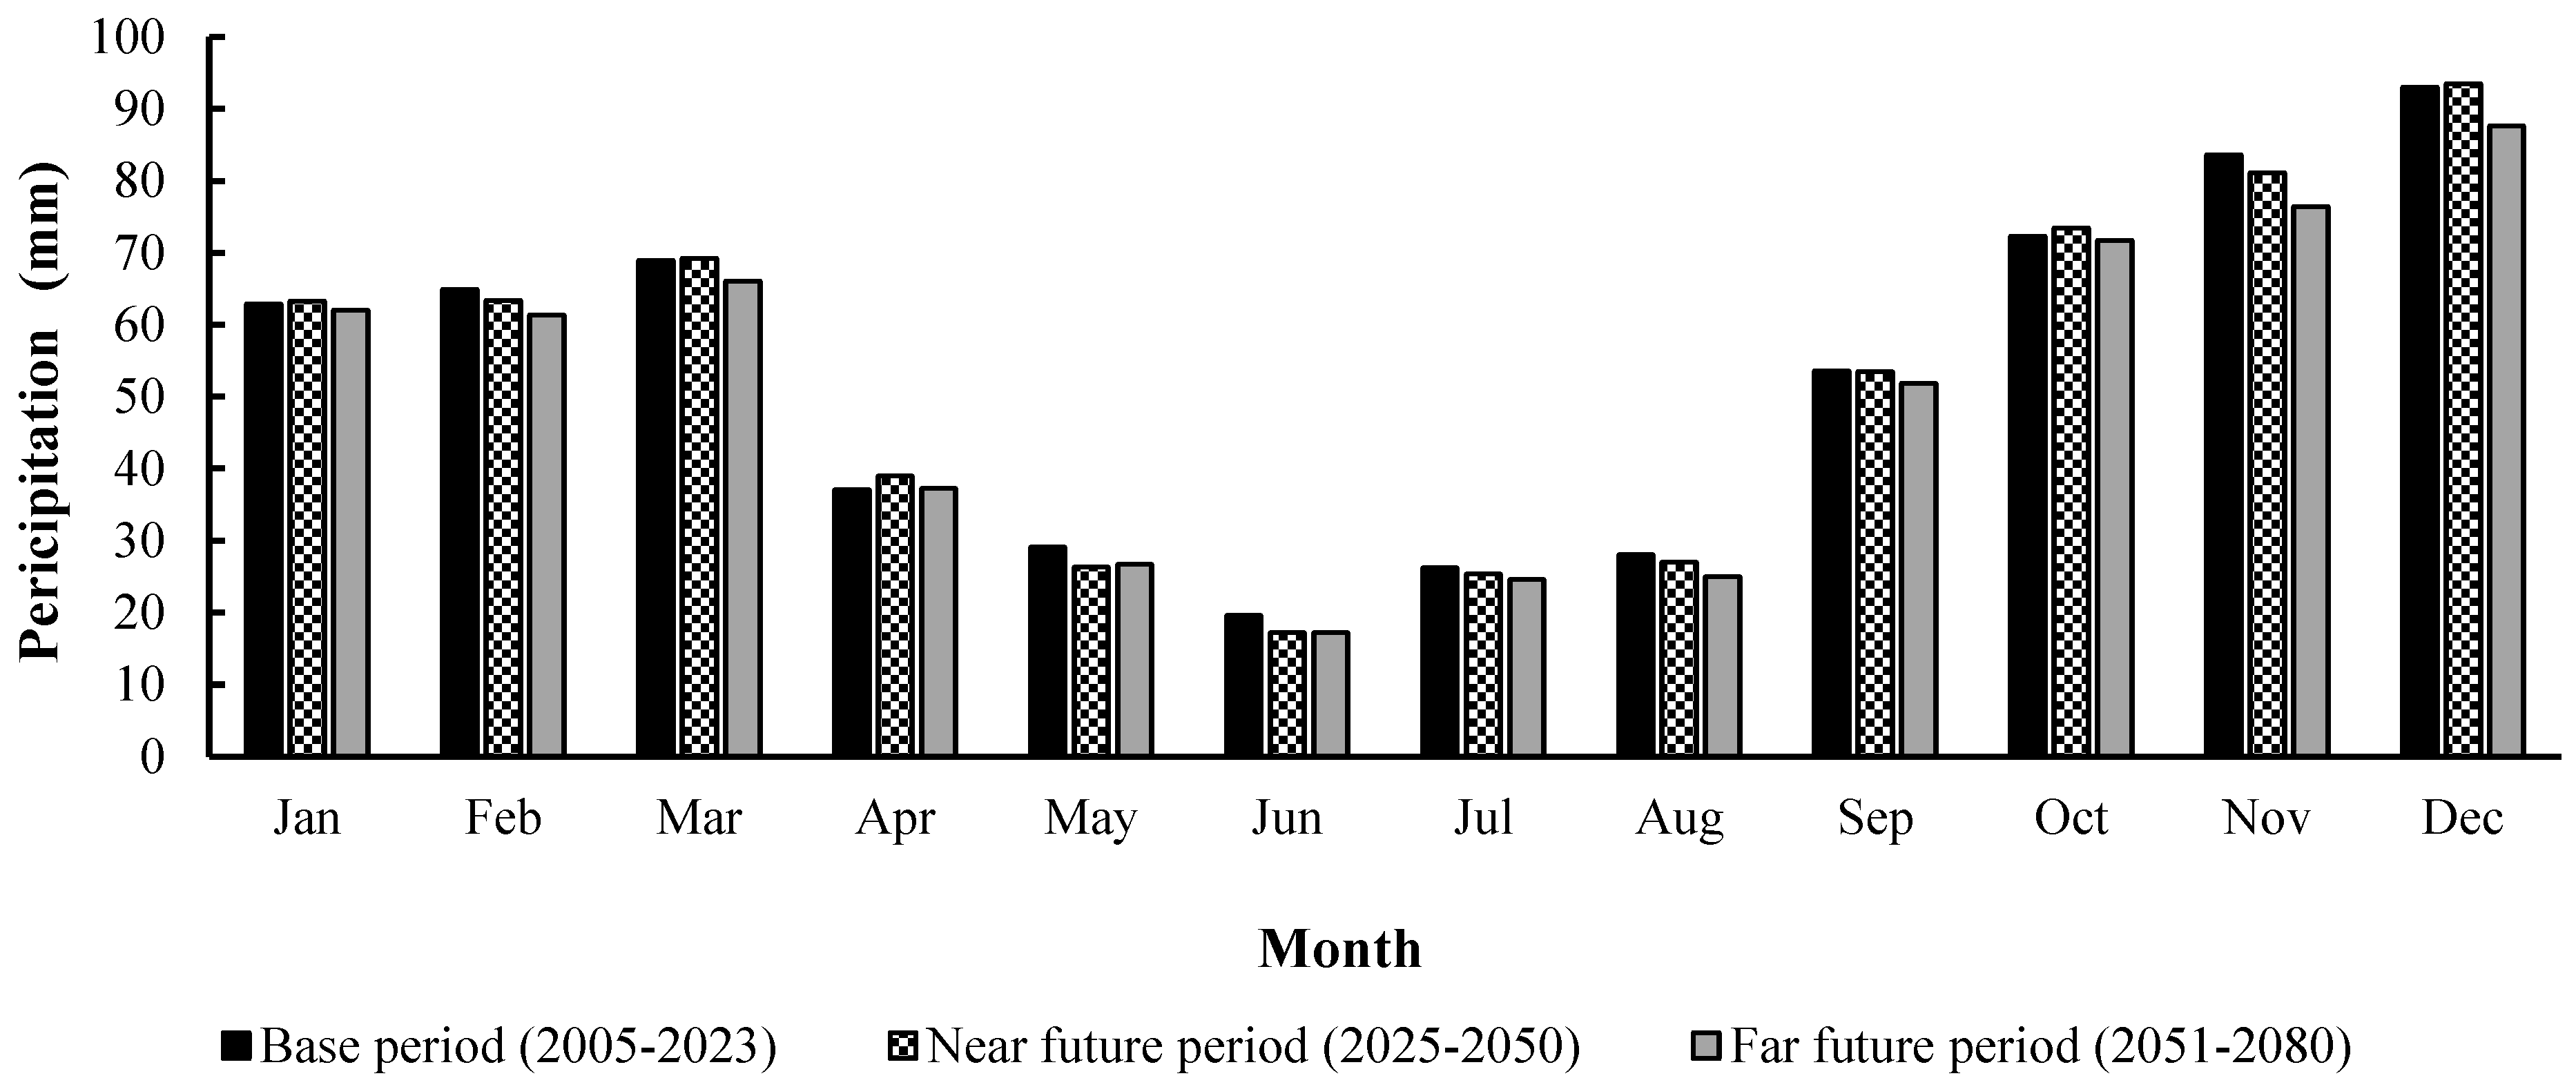
The above analyses suggest that precipitation will decrease more in the west of Mazandaran Province than in the eastern part and more in the near future than the far future. Monthly precipitation rates, however, are higher in the western part (compare Figure 5 and Figure 9), and therefore, the precipitation depth in the western part will be higher than in the eastern part. The eastern part will receive 186.2 mm less annual precipitation in the near future and 181 mm less in the far future than the west.
The comparison of Table 11 and Table 12 clearly demonstrates that decreased precipitation in the east of Mazandaran Province, particularly compared to the western region, could have significant implications for the hydrological, agricultural, economic, and social conditions of this area. Reduced precipitation affects surface and groundwater resources and could lead to fundamental changes in the economic and social structure of the region’s inhabitants. For example, the Nekarood River, located in the east of Mazandaran Province, near the Galugah synoptic station, is a vital water source for this region and will be affected by decreased precipitation and increased temperatures. Temperature increase directly leads to increased evaporation, and this river’s flow will significantly decrease alongside reduced precipitation. This situation could result in reduced water input to Gorgan Bay, which currently faces challenges such as water recession, sediment deposition, and problems for Bandar Torkaman in Golestan Province. In addition, increased dust particles in this bay could severely impact the lives of people in the eastern region and threaten their health.
In the case of continuous temperature increase and precipitation decrease, groundwater extraction will increase significantly. This process has already begun, and a 60–70 cm decline in water table levels in the east of Mazandaran Province could accelerate land subsidence. Moreover, increased temperature and Caspian Sea evaporation rates could create economic and maritime transportation problems for important ports such as Babolsar, Bandar Amirabad, and Nowshahr, particularly Amirabad Port, located in the east, which is affected more by these climatic changes.
Decreasing precipitation and increasing temperature affect the quantity and quality of agricultural products, especially rice crop, which is a water-intensive crop [39,40,41]. In addition, temperature increases in winter and autumn could lead to increased weed germination and pest outbreaks in orchards and agricultural lands. Given the dependence of many Mazandaran Province residents on agriculture, these challenges could lead to social and economic crises.
The combination of decreased precipitation and increased temperature could intensify soil moisture deficits [42]. The presence of Neka cement factory and the thermal power plant in this region could contribute to further warming and negative climate change impacts. Temperature increases cause people to use more cooling systems, leading to increased electricity consumption and thermal power plant operation, which also increases greenhouse gas emissions.
Climate changes and human activities have had profound effects on northern Iran’s ecosystems, causing reduced river flow and water input to the Caspian Sea. Environmental problems such as air pollution and land subsidence have increased in recent years [43]. Growing housing demand and rapid urbanization have led to the conversion of agricultural lands to urban and industrial settlements and forests being replaced by agricultural lands [44]. In view of this, there is a need for the adoption of necessary measures of water resources management and climate change adaptation to avoid the fate of these negative consequences.

5. Conclusions

This research aims to better understand the impact of climate change on temperature (maximum, average, and minimum) and precipitation on the east and west of Mazandaran Province, Iran, for the near future (2025–2050) and far future (2051–2080). The study utilizes five GCMs and two scenarios (SSP2-2.6 and SSP5-8.5) from the IPCC Sixth Assessment Report. The IPSL-CM6A-LR model is selected for temperature, and the CNRM-CM6-1 model is chosen for precipitation as the preferred models for Sari and Nowshahr synoptic stations. The overall results of this research are as follows.
In the west of Mazandaran Province, monthly temperature (maximum, average, and minimum) and precipitation variations in both the near and far future, as compared to the baseline period, did not follow a specific pattern. These irregular changes in the western region are attributed to the spatial distribution of synoptic stations relative to the elevation above the Caspian Sea level. Overall, the temperature trend in both the near and far future indicates an increase compared to the baseline period. But the overall trend for precipitation is decreasing.
Monthly temperature predictions for the eastern region in the near and far future also indicate an increasing trend. Here, temperature fluctuations are greater than in the western region. This increase is primarily due to the vast plains between the Alborz Mountain range and the Caspian Sea.
Precipitation changes for the near and far future compared to the baseline period in the eastern region are inconsistent, although the overall trend is decreasing. However, the western region receives more precipitation than the eastern region.
Considering the results of this research along with findings by Chen et al. [45] and Koriche et al. [46] regarding increased evaporation from the Caspian Sea, declining water levels, the receding of the southern Caspian Sea water level, and reduced inflow into the Caspian Sea [47], it appears that climate change will have negative consequences for ports, ecotourism, and land use in Mazandaran Province. Water resources managers in this province must develop comprehensive short-term and long-term plans to optimize surface and groundwater resource utilization.
Furthermore, it is essential to utilize other GCMs and climate change scenarios from the sixth IPCC report as well as additional synoptic stations in Gilan Province and Golestan Province, which are located to the west and east of Mazandaran Province, respectively, to provide a more accurate assessment of climate change in the study area.
Additionally, a more thorough investigation is needed regarding the impact of climate change on meteorological and hydrological droughts and reduced river flows in Mazandaran Province.
Given that some of the stations investigated in this research have statistics of less than 30 years of recorded data, it is recommended to carry out this research again when the data record is at least 30 years old.
Considering the negative effects of climate change in the future in the east and west of Mazandaran Province, it is suggested that collecting surface water, changing the cultivation pattern from water-intensive crops to crops with low water consumption, preventing forest destruction, using clean energy such as solar energy and wind turbines (to reduce electricity production through thermal power plants) should be on the agenda of policymakers in this province.

Author Contributions

Conceptualization, M.V.; Methodology, S.-F.M., S.F. and M.O.H.; Software, M.V.; Validation, S.-F.M., S.F. and M.O.H.; Formal analysis, M.V.; Investigation, M.V.; Data curation, M.V.; Writing—original draft, M.V.; Writing—review & editing, S.-F.M.; Visualization, S.-F.M. and S.F.; Supervision, S.-F.M., S.F. and M.O.H.; Project administration, S.-F.M. All authors have read and agreed to the published version of the manuscript.

Funding

This research received no external funding.

Data Availability Statement

The original contributions presented in this study are included in the article. Further inquiries can be directed to the corresponding author.

Conflicts of Interest

The authors declare no conflict of interest.

References

  1. Xing, W.; Wang, W.; Shao, Q.; Ding, Y. Estimating Net Irrigation Requirements of Winter Wheat across Central-Eastern China under Present and Future Climate Scenarios. J. Irrig. Drain. Eng. 2018, 144, 05018005. [Google Scholar] [CrossRef]
  2. Khoramabadi, F.; Fard Moradinia, S. The prediction of precipitation changes in the Aji-Chay watershed using CMIP6 models and the wavelet neural network. J. Water Clim. Change 2024, 15, 2141–2161. [Google Scholar] [CrossRef]
  3. IPCC. Climate Change 2007—Intergovernmental Panel on Climate Change; Cambridge University Press: Cambridge, UK, 2007. [Google Scholar] [CrossRef]
  4. Asif, M.; Anjum, M.N.; Azam, M.; Hussain, F.; Afzal, A.; Kim, B.S.; Maeng, S.J.; Kim, D.; Iqbal, W. Climate-Driven Changes in the Projected Annual and Seasonal Precipitation over the Northern Highlands of Pakistan. Water 2024, 16, 3461. [Google Scholar] [CrossRef]
  5. IPCC. Climate Change 2021—The Physical Science Basis, Intergovernmental Panel on Climate Change; Cambridge University Press: Cambridge, UK, 2021. [Google Scholar] [CrossRef]
  6. Solomon, S.; Qin, D.; Manning, M.; Chen, Z.; Marquis, M.; Averyt, K.B.; Tignor, M.; Miller, H. Summary for Policymarkers. In Climate Change, Climate Change: The Physical Science Basis, Contribution of Working Group I to the Fourth Assessment Report of the Intergovernmental Panel on Climate Change; Cambridge University Press: Cambridge, UK, 2007. [Google Scholar]
  7. Ingol-Blanco, E.; McKinney, D.C. Hydrologic model for the rio conchos basin: Calibration and validation. Tech. Rep. Univ. Texas Austin Cent. Res. J. Hydrol. Eng. 2013, 18, 340–351. [Google Scholar]
  8. Mansouri Daneshvar, M.R.; Ebrahimi, M.; Nejadsoleymani, H. An overview of climate change in Iran: Facts and statistics. Environ. Syst. Res. 2019, 8, 7. [Google Scholar] [CrossRef]
  9. Sharafi, S.; Mir Karim, N. Investigating trend changes of annual mean temperature and precipitation in Iran. Arab. J. Geosci. 2020, 13, 759. [Google Scholar] [CrossRef]
  10. IPCC. Climate Change 2013—The Physical Science Basis; Cambridge University Press: Cambridge, UK, 2014. [Google Scholar] [CrossRef]
  11. Lee, J.-Y.; Wang, B. Future change of global monsoon in the CMIP5. Clim. Dyn. 2014, 42, 101–119. [Google Scholar] [CrossRef]
  12. Yang, Y.; Bai, L.; Wang, B.; Wu, J.; Fu, S. Reliability of the global climate models during 1961–1999 in arid and semiarid regions of China. Sci. Total Environ. 2019, 667, 271–286. [Google Scholar] [CrossRef]
  13. Warnatzsch, E.A.; Reay, D.S. Temperature and precipitation change in Malawi: Evaluation of CORDEX-Africa climate simulations for climate change impact assessments and adaptation planning. Sci. Total Environ. 2019, 654, 378–392. [Google Scholar] [CrossRef]
  14. Tebaldi, C.; Debeire, K.; Eyring, V.; Fischer, E.; Fyfe, J.; Friedlingstein, P.; Knutti, R.; Lowe, J.; O’Neill, B.; Sanderson, B.; et al. Climate model projections from the Scenario Model Intercomparison Project (ScenarioMIP) of CMIP6. Earth Syst. Dyn. 2021, 12, 253–293. [Google Scholar] [CrossRef]
  15. Maghsood, F.F.; Moradi, H.; Massah Bavani, A.R.; Panahi, M.; Berndtsson, R.; Hashemi, H. Climate Change Impact on Flood Frequency and Source Area in Northern Iran under CMIP5 Scenarios. Water 2019, 11, 273. [Google Scholar] [CrossRef]
  16. Zhu, Y.-Y.; Yang, S. Evaluation of CMIP6 for historical temperature and precipitation over the Tibetan Plateau and its comparison with CMIP5. Adv. Clim. Change Res. 2020, 11, 239–251. [Google Scholar] [CrossRef]
  17. Doulabian, S.; Golian, S.; Toosi, A.S.; Murphy, C. Evaluating the effects of climate change on precipitation and temperature for Iran using RCP scenarios. J. Water Clim. Change 2021, 12, 166–184. [Google Scholar] [CrossRef]
  18. Shafeeque, M.; Luo, Y. A multi-perspective approach for selecting CMIP6 scenarios to project climate change impacts on glacio-hydrology with a case study in Upper Indus river basin. J. Hydrol. 2021, 599, 126466. [Google Scholar] [CrossRef]
  19. Hasheminasab, S.; Rahimi, D.; Zakerinejad, R.; Kropáček, J. Assessment of climate change impact on surface water: A case study—Karoun River Basin, Iran. Arab. J. Geosci. 2022, 15, 904. [Google Scholar] [CrossRef]
  20. Goodarzi, M.R.; Abedi, M.J.; Heydari Pour, M. Climate change and trend analysis of precipitation and temperature: A case study of Gilan, Iran. Curr. Dir. Water Scarcity Res. 2022, 7, 561–587. [Google Scholar] [CrossRef]
  21. Usta, D.F.B.; Teymouri, M.; Chatterjee, U.; Koley, B. Temperature projections over Iran during the twenty-first century using CMIP5 models. Model. Earth Syst. Environ. 2022, 8, 749–760. [Google Scholar] [CrossRef]
  22. Mathbout, S.; Martin-Vide, J.; Bustins, J.A.L. Drought characteristics projections based on CMIP6 climate change scenarios in Syria. J. Hydrol. Reg. Stud. 2023, 50, 101581. [Google Scholar] [CrossRef]
  23. Zabihi, O.; Ahmadi, A. Multi-criteria evaluation of CMIP6 precipitation and temperature simulations over Iran. J. Hydrol. Reg. Stud. 2024, 52, 101707. [Google Scholar] [CrossRef]
  24. Abdulsahib, S.M.; Zubaidi, S.L.; Almamalachy, Y.; Dulaimi, A. Temperature and Precipitation Change Assessment in the North of Iraq Using LARS-WG and CMIP6 Models. Water 2024, 16, 2869. [Google Scholar] [CrossRef]
  25. Goli, I.; Kriaučiūnienė, Z.; Zhang, R.; Bijani, M.; Kabir Koohi, P.; Rostamkalaei, S.A.; Lopez-Carr, D.; Azadi, H. Contributions of climate smart agriculture toward climate change adaptation and food security: The case of Mazandaran Province, Iran. Trends Food Sci. Technol. 2024, 152, 104653. [Google Scholar] [CrossRef]
  26. Legass, A.M.; Alamirew, T.; Gebrehiwot, S.G.; Haro-Monteagudo, D.; Berhanu, D. Spatiotemporal climate change projection and trend analysis using selected downscaled CMIP6 models for water action over awash River Basin, Ethiopia. Environ. Challenges 2025, 18, 101059. [Google Scholar] [CrossRef]
  27. Hurst, H.E. Long-Term Storage Capacity of Reservoirs. Trans. Am. Soc. Civ. Eng. 1951, 116, 770–799. [Google Scholar] [CrossRef]
  28. Hurst, H.E. Methods of Using Long-Term Storage in Reservoirs. Proc. Inst. Civ. Eng. 1956, 5, 519–543. [Google Scholar] [CrossRef]
  29. Miao, C.; Duan, Q.; Sun, Q.; Li, J. Evaluation and application of Bayesian multi-model estimation in temperature simulations. Prog. Phys. Geogr. Earth Environ. 2013, 37, 727–744. [Google Scholar] [CrossRef]
  30. Zarrin, A.; Dadashi-Roudbari, A. Projection of future extreme precipitation in Iran based on CMIP6 multi-model ensemble. Theor. Appl. Climatol. 2021, 144, 643–660. [Google Scholar] [CrossRef]
  31. Zarrin, A.; Dadashi-rodbari, A.; Salehabadi, N. Projected temperature anomalies and trends in different climate zones in Iran based on CMIP6. Iran. J. Geophys. 2021, 15, 35–54, (In persian with english abstract). [Google Scholar] [CrossRef]
  32. Ansari, S.; Dehban, H.; Zareian, M.; Farokhnia, A. Investigation of temperature and precipitation changes in the Iran’s basins in the next 20 years based on the output of CMIP6 model. Iran. Water Res. J. 2022, 16, 11–24, (with english abstract). [Google Scholar] [CrossRef]
  33. Gebremeskel, S.; Liu, Y.B.; de Smedt, F.; Hoffmann, L.; Pfister, L. Analysing the effect of climate changes on streamflow using statistically downscaled GCM scenarios. Int. J. River Basin Manag. 2004, 2, 271–280. [Google Scholar] [CrossRef]
  34. Hay, L.E.; Wilby, R.L.; Leavesley, G.H. A Comparison of Delta Change and Downscaled GCM Scenarios for Three Mountainous Basins in the United States. JAWRA J. Am. Water Resour. Assoc. 2000, 36, 387–397. [Google Scholar] [CrossRef]
  35. Wilks, D.S.; Wilby, R.L. The weather generation game: A review of stochastic weather models. Prog. Phys. Geogr. Earth Environ. 1999, 23, 329–357. [Google Scholar] [CrossRef]
  36. Boucher, O.; Servonnat, J.; Albright, A.L.; Aumont, O.; Balkanski, Y.; Bastrikov, V.; Bekki, S.; Bonnet, R.; Bony, S.; Bopp, L.; et al. Presentation and Evaluation of the IPSL-CM6A-LR Climate Model. J. Adv. Model. Earth Syst. 2020, 12, e2019MS002010. [Google Scholar] [CrossRef]
  37. Voldoire, A.; Saint-Martin, D.; Sénési, S.; Decharme, B.; Alias, A.; Chevallier, M.; Colin, J.; Guérémy, J.-F.; Michou, M.; Moine, M.-P.; et al. Evaluation of CMIP6 DECK Experiments With CNRM-CM6-1. J. Adv. Model. Earth Syst. 2019, 11, 2177–2213. [Google Scholar] [CrossRef]
  38. Yazdandoost, F.; Moradian, S.; Izadi, A.; Aghakouchak, A. Evaluation of CMIP6 precipitation simulations across different climatic zones: Uncertainty and model intercomparison. Atmos. Res. 2021, 250, 105369. [Google Scholar] [CrossRef]
  39. Luo, Q. Temperature thresholds and crop production: A review. Clim. Change 2011, 109, 583–598. [Google Scholar] [CrossRef]
  40. Misra, A.K. Climate change and challenges of water and food security. Int. J. Sustain. Built Environ. 2014, 3, 153–165. [Google Scholar] [CrossRef]
  41. Zhao, J.; Guo, J.; Mu, J. Exploring the relationships between climatic variables and climate-induced yield of spring maize in Northeast China. Agric. Ecosyst. Environ. 2015, 207, 79–90. [Google Scholar] [CrossRef]
  42. Bapuji Rao, B.; Santhibhushan Chowdary, P.; Sandeep, V.M.; Rao, V.U.M.; Venkateswarlu, B. Rising minimum temperature trends over India in recent decades: Implications for agricultural production. Glob. Planet. Change 2014, 117, 1–8. [Google Scholar] [CrossRef]
  43. Sharifi, A.; Khodaei, B.; Ahrari, A.; Hashemi, H.; Torabi Haghighi, A. Can river flow prevent land subsidence in urban areas? Sci. Total Environ. 2024, 917, 170557. [Google Scholar] [CrossRef]
  44. Modabberi, A.; Noori, R.; Madani, K.; Ehsani, A.H.; Danandeh Mehr, A.; Hooshyaripor, F.; Kløve, B. Caspian Sea is eutrophying: The alarming message of satellite data. Environ. Res. Lett. 2020, 15, 124047. [Google Scholar] [CrossRef]
  45. Chen, J.L.; Pekker, T.; Wilson, C.R.; Tapley, B.D.; Kostianoy, A.G.; Cretaux, J.-F.; Safarov, E.S. Long-term Caspian Sea level change. Geophys. Res. Lett. 2017, 44, 6993–7001. [Google Scholar] [CrossRef]
  46. Koriche, S.A.; Singarayer, J.S.; Cloke, H.L. The fate of the Caspian Sea under projected climate change and water extraction during the 21st century. Environ. Res. Lett. 2021, 16, 094024. [Google Scholar] [CrossRef]
  47. Sharifi, A.; Baubekova, A.; Patro, E.R.; Klöve, B.; Torabi Haghighi, A. The combined effects of anthropogenic and climate change on river flow alterations in the Southern Caspian Sea Iran. Heliyon 2024, 10, e31960. [Google Scholar] [CrossRef] [PubMed]
Figure 1. Location of the selected synoptic stations in Mazandaran Province (Google Earthpro).
Water 17 01181 g002
Figure 2. Monthly maximum temperature variations in the future periods compared to the baseline period in the west of Mazandaran Province.
Water 17 01181 g003
Figure 3. Monthly average temperature variations in the future periods compared to the baseline period in the west of Mazandaran Province.
Water 17 01181 g004
Figure 4. Monthly minimum temperature variations in the future periods compared to the baseline period in the west of Mazandaran Province.
Water 17 01181 g005
Figure 5. Monthly precipitation variations in the baseline and future periods in the west of Mazandaran Province.
Water 17 01181 g006
Figure 6. Monthly maximum temperature variations in the future periods compared to the baseline period in east of Mazandaran Province.
Water 17 01181 g007
Figure 7. Comparison of monthly average temperature variations in future periods and baseline periods in the east of Mazandaran Province.
Water 17 01181 g008
Figure 8. Comparison of monthly minimum temperature variations in the future periods and baseline period in the east of Mazandaran Province.
Water 17 01181 g009
Figure 9. Monthly precipitation variations in baseline and future periods in the east of Mazandaran Province.
Water 17 01181 g010
Figure 10. Comparison of monthly mean precipitation variations for baseline and future periods in Mazandaran Province.
Water 17 01181 g011
Table 1. Characteristics of the studied synoptic stations in Mazandaran Province.
Station NameLocationAvailable Statistical PeriodGeographic CoordinatesElevation Above Mean Sea Level (m)
LongitudeLatitude
RamsarWest1980–202350.67 E36.9 N20
Siah BishehWest1999–202351.3 E36.25 N1855.4
NowshahrWest1980–202351.5 E36.65 N20.9
AmolWest2000–202352.47 E36.48 N29
BabolsarEast1980–202352.64 E36.7 N21
AlashtEast2003–202352.85 E36.08 N1900
SariEast1999–202353.00 E36.54 N22.7
Pol SefidEast2003–202353.06 E36.10 N610
Bandar AmirabadEast2005–202353.36 E36.85 N22
KiasarEast2002–202353.55 E36.25 N1294
GalugahEast2005–202353.84 E36.74 N10
Table 2. Values of Hurst coefficient for time series of climatic parameters at synoptic stations used in this research.
StationDaily
Precipitation (mm)
Daily Minimum Temperature (°C)Daily Average Temperature (°C)Daily Maximum Temperature (°C)
Ramsar0.6670.6410.7110.703
Siah Bisheh0.8110.6180.7250.717
Nowshahr0.7350.6470.7050.667
Amol0.830.70.670.71
Babolsar0.7080.6180.7250.717
Alasht0.7350.6470.7190.667
Sari0.6510.6740.7350.667
Pol Sefid0.5660.7120.6920.705
Bandar Amirabad0.6670.6410.7340.703
Kiasar0.7020.6180.7250.717
Galugah0.7930.6410.6670.704
Table 3. Evaluation of mean monthly temperature at Nowshahr synoptic station with IPCC Sixth Assessment Report climate models (1980–2014).
ParameterMRI-ESM2-0GFDL-CM4IPSL-CM6A-LRBCC-CSM2-MR
MAERMSER2MAERMSER2MAERMSER2MAERMSER2
Tmax (°C)0.351.410.620.822.080.580.251.010.730.371.590.61
Tavg (°C)0.271.040.690.522.130.600.251.060.700.281.080.68
Tmin (°C)0.601.070.631.012.320.470.531.020.680.691.110.54
Note: Tmax = Maximum temperature, Tavg = Average temperature, and Tmin = Minimum temperature.
Table 4. Evaluation of monthly precipitation at Nowshahr synoptic station with IPCC Sixth Assessment Report climate models (1980–2014).
ParameterMRI-ESM2-0GFDL-CM4IPSL-CM6A-LRBCC-CSM2-MR
MAERMSER2MAERMSER2MAERMSER2MAERMSER2
P (mm)1.4911.150.651.3910.080.670.746.930.751.129.310.68
Note: P = Precipitation.
Table 5. Evaluation of mean monthly temperature at Sari synoptic station with IPCC Sixth Assessment Report climate models (1999–2014).
ParameterMRI-ESM2-0GFDL-CM4IPSL-CM6A-LRBCC-CSM2-MR
MAERMSER2MAERMSER2MAERMSER2MAERMSER2
Tmax (°C)0.621.570.690.972.380.590.521.430.720.761.740.70
Tavg (°C)0.681.210.660.721.290.650.621.150.750.841.970.62
Tmin (°C)0.871.450.590.921.650.570.761.020.630.931.680.57
Note: Tmax = Maximum temperature, Tavg = Average temperature, and Tmin = Minimum temperature.
Table 6. Evaluation of monthly precipitation at Sari synoptic station with IPCC Sixth Assessment Report climate models (1999–2014).
ParameterMRI-ESM2-0GFDL-CM4IPSL-CM6A-LRBCC-CSM2-MR
MAERMSER2MAERMSER2MAERMSER2MAERMSER2
P (mm)2.286.490.611.625.000.691.184.030.731.294.280.72
Note: P = Precipitation.
Table 7. Evaluation of monthly climate parameters of the Nowshahr synoptic station with two scenarios of the IPCC Sixth Assessment Report (1980–2014).
ParameterSSP5-8.5SSP2-2.6
MAERMSER2MAERMSER2
Tmax (°C)0.371.250.690.421.380.52
Tmin (°C)0.381.230.690.41.290.62
Tavg (°C)0.411.210.670.481.240.63
P (mm)0.857.420.760.999.390.74
Table 8. Evaluation of monthly climate parameters of the Ramsar synoptic station with two scenarios of the IPCC Sixth Assessment Report (1980–2014).
ParameterSSP5-8.5SSP2-2.6
MAERMSER2MAERMSER2
Tmax (°C)0.671.250.70.931.390.68
Tmin (°C)0.271.750.70.892.450.55
Tavg (°C)0.551.150.690.821.450.65
P (mm)0.314.770.733.4911.960.6
Table 9. Evaluation of monthly climate parameters of the Sari synoptic station with two scenarios of the IPCC Sixth Assessment Report (1999–2014).
ParameterSSP5-8.5SSP2-2.6
MAERMSER2MAERMSER2
Tmax (°C)0.681.610.690.711.660.69
Tmin (°C)0.571.350.720.621.470.66
Tavg (°C)0.943.520.552.495.820.52
P (mm)1.023.260.761.144.910.74
Table 10. Evaluation of monthly climate parameters of the Babolsar synoptic station with two scenarios of the IPCC Sixth Assessment Report (1980–2014).
ParameterSSP5-8.5SSP22.6
MAERMSER2MAERMSER2
Tmax (°C)0.421.310.670.531.350.58
Tmin (°C)0.381.190.680.391.210.65
Tavg (°C)0.491.030.740.561.060.69
P (mm)0.715.680.711.2610.750.63
Table 11. Annual mean temperature (T) and precipitation (P) in the west of Mazandaran Province during the baseline and future periods.
Statistical PeriodTmax (°C)Tmin (°C)TavgP
(°C)(mm)
Baseline Period (2005–2023)15.429.9212.57844.7
Near future (2025–2050)16.5310.8813.63818.4
Far future (2051–2080)16.7611.0713.86789
Table 12. Annual mean temperature (T) and precipitation (P) in the east of Mazandaran Province during the baseline and future periods.
Statistical PeriodTmax (°C)Tavg (°C)Tmin (°C)P
(mm)
Baseline period (2005–2023)19.8315.3410.69639.3
Near future (2025–2050)20.6516.1711.46632.2
Far future (2051–2080)20.9416.2211.40608
Table 13. Annual mean precipitation across the entire Mazandaran Province during the baseline and future periods.
Statistical PeriodP (mm)
Baseline period (2005–2023)743.7
Near future (2025–2050)727
Far future (2051–2080)700
Disclaimer/Publisher’s Note: The statements, opinions and data contained in all publications are solely those of the individual author(s) and contributor(s) and not of MDPI and/or the editor(s). MDPI and/or the editor(s) disclaim responsibility for any injury to people or property resulting from any ideas, methods, instructions or products referred to in the content.

