Article

The Patterns of Dissolved N2O Concentrations Are Driven by Nutrient Stoichiometry Related to Land Use Types in the Yiluo River Basin, China

1
College of Life Sciences, Henan Normal University, Xinxiang 453007, China
2
School of Fishery, Zhejiang Ocean University, Zhoushan 316000, China
*
Author to whom correspondence should be addressed.
Water 2025, 17(8), 1167; https://doi.org/10.3390/w17081167
Submission received: 1 March 2025 / Revised: 8 April 2025 / Accepted: 11 April 2025 / Published: 14 April 2025

Abstract

:
The concentrations of dissolved N2O in river systems at the basin scale exhibit significant spatial and temporal variability, particularly under diverse landscape conditions. This study focused on a temperate basin—the Yiluo River (YLR) basin in China—to investigate the variations in dissolved N2O concentrations and the indirect emission factors (EF5r) between the dry and wet seasons. The differences among tributaries were analyzed to assess the impact of land use types. The findings revealed that N2O concentrations and saturation levels were lower during the wet season in both the main streams and tributaries. In the dry season, the N2O concentrations were strongly correlated with NH4+-N, NO3-N, and oxidation–reduction potential (ORP) (R2 = 0.743, p < 0.001), while in the wet season, the N2O concentrations were correlated with dissolved phosphorus (DP), water temperature (Tw), NH4+-N, and DOC (R2 = 0.640, p < 0.001). Impervious land was identified as the primary source of nitrogen in both seasons, rather than cropland. Natural land, particularly shrubland, demonstrated a notable mitigating effect on N2O accumulation and played a significant role in reducing NO3-N levels. The YLR basin exhibited lower EF5r values (0.005–0.052%) compared to the default value recommended by the IPCC, with a significant decrease observed during the wet season (p < 0.001). Data analysis indicated that nutrient dynamics, particularly NO3-N, the ratio of dissolved organic carbon to NO3-N (DOC/NO3-N), and the ratio of NO3-N to DP (NO3-N/DP), were significantly correlated with EF5r. These results underscore the need to re-evaluate regional N2O emission potentials and provide new insights into mitigating N2O emissions through strategic land use management.

1. Introduction

Nitrous oxide (N2O) is a highly significant greenhouse gas, which is characterized by a global warming potential over 300 times that of carbon dioxide and an atmospheric lifetime exceeding 100 years [1]. Meanwhile, its substantial contribution to the depletion of the stratospheric ozone layer is widely recognized [2]. The accumulation and depletion processes of N2O at the air–water interface of rivers and the adjacent areas have attracted significant attention [3,4]. Rivers act both as conduits transporting materials between the terrestrial landscapes and oceans and as places for the consumption of the terrigenous matter [5,6]. Previous studies have documented oversaturation of N2O in rivers exhibiting rapid outgassing [4,7,8], implying that rivers are a considerable N2O source to the atmosphere. Recent studies have revealed that streams and rivers account for approximately 10% of global anthropogenic N2O emissions (6.7 Tg N·y−1), which is about six times higher than the EPA estimates [9,10]. Global analysis indicates that dissolved nitrogen loading in most rivers has decreased significantly due to surface water regulation [11]. Consequently, N2O generation may be triggered as an intermediate product during dissolved nitrogen removal in aquatic conditions that are favorable for key microbial processes, such as denitrification, nitrification, and/or nitrifier-denitrification [12,13].
Previous studies also highlighted the significant contribution of small tributaries to the nutrient budget of larger rivers [14], suggesting a strong connection between the main streams and small tributaries in nitrogen cycling and potentially indicating a crucial relationship with N2O emissions as well. The diversity of nutrient and organic matter in the water column differs with stream orders [15,16], further affecting the biological activity in the main streams and riparian zones [17,18,19]. However, some research argued that land use, rather than stream order, primarily determines the contributions of streams to N2O concentrations [20]. Tributary inputs play a critical role in evaluating the nitrogen budget in large drainage basins, characteristics of the sub-catchment, such as landscape types, and vegetation, and climate factors influencing the nutrition load into rivers must be considered [21,22].
Human activities, as the dominant force in the bio-nitrogen input to aquatic ecosystems, exert a significant influence on and have emerged to be the primary drivers of N2O emissions in rivers and streams [23]. Since the 21st century, anthropogenic nitrogen inputs have driven a two- to four-fold increase in nitrous oxide (N2O) emissions across global river networks [24,25]. Most anthropogenic N2O emissions in rivers are directly or indirectly associated with agricultural practices. For example, fertilizer application promotes N2O production in both soil and river systems, and nutrient surplus, combined with hypoxic conditions, further amplifies N2O emissions [20,26]. Furthermore, urban wastewater discharges introduce substantial nitrogen loads into rivers, resulting in increased N2O saturation and emissions that correlate with urbanization intensity and pace, occasionally surpassing emissions from agriculturally dominated regions [23,27]. Meanwhile, natural landscapes may act as inhibitor of N2O accumulation, as forests and shrublands play a crucial role in nitrate removal during the non-point pollution process [28]. The aforementioned land use types exhibit distinct spatial extents and varying magnitudes of impact on N2O emissions from water bodies, which is mediated through various pathways and complex mechanisms.
The Yiluo River, located on the southeastern margin of the Loess Plateau, originates from mountainous areas and flows through diverse terrains to floodplains, before converging with the Yellow River. Its drainage basin exhibits complex topography accompanied by diverse land use types. This study analyzed the dissolved N2O concentrations in the surface water across the river and its tributaries and examined the importance of multiple influencing factors. The objectives were as follows: (1) to quantify temporal and spatial variations in dissolved N2O concentrations throughout the Yiluo River basin; (2) to identify the key drivers of dissolved N2O concentration dynamics within the basin; and (3) to evaluate the impacts of human activities on N2O yield at the basin scale, enhancing the understanding of riverine N2O generation mechanisms.

2. Materials and Methods

2.1. Site Description and Sampling Design

This research was conducted in the Yiluo River basin, a twin rivers system (33°33′–34°57′ N, 109°43′–113°03′ E) draining a watershed of 1.89 × 10⁴ km2. The basin experiences a semi-humid climate, with an annual air temperature of 12.73 °C and precipitation of 645.87 mm [29]. It comprises two subbasins, the Luo River (410 km) and the Yi River (264.8 km), which converge at the Heishiguan hydrological station before merging into the Yiluo River (37 km). A total of 14 sampling points were established along the main stream of the Luo River (LR), 10 along the main stream of the Yi River (YR), and 2 on the Yiluo River (YLR). Additionally, 21 tributaries adjacent to the Luo River (LT) were sampled near the outlets, along with 9 tributaries along the Yi River (YT) (Figure 1). All the selected tributaries have drainage areas exceeding 100 km2.

2.2. Sample Collection and Analysis

Field investigations of the dissolved N2O concentration distributions were conducted from 4–10 May and 13–19 October 2017, representing the dry (spring) and wet (autumn) seasons, respectively. Surface water samples (~0.5 m) were collected from central stream channels. Water sampling for dissolved gas analysis was performed using a modification of the protocol of Upstill-Goddard et al. [30]. The samples were stored in 65-mL screw-top vials and kept in darkness. Dissolved N2O concentrations were analyzed using a combination of the equilibrium technique and multichannel gas chromatography (GC) [31]. A headspace was created by injecting 15 mL ultra-pure N2 into the vial. The vials were shaken for 30 min at 25 °C and then allowed to equilibrate. Approximately 2 mL of gas was extracted from the headspace, and the N2O concentration of the gas sample was analyzed using an Agilent 7890A GC system (Agilent Technologies, Santa Clara, CA, USA) equipped with an electron capture detector (ECD) maintained at 300 °C. Dissolved concentrations of N2O in the samples were calculated using the following equation [32]:
CL = CG (βRT/22.4 + VG/VL)
where CL (µmol·L−1) and CG (µmol·L−1) are the concentrations of N2O in the water sample and in the headspace after equilibration, respectively, β (L·L−1·atm−1) is the Bunsen solubility, R (L·atm·mol−1·K−1) is the gas constant, T (K) is the absolute temperature of the air, 22.4 (µmol·L−1) is the molar volume of the gas, VG (L) is the volume of the headspace, and VL (L) is the volume of the water sample left in the bottle [33,34].
Approximately 30 mL of gas samples near the water surface were collected at each sampling site, and N2O concentrations were analyzed using GC for N2O saturation calculation. Saturations of dissolved N2O (R) were calculated as below [34]:
R = CL/Ceq
where Ceq is the concentration of N2O dissolved in surface water at equilibrium with the atmosphere. It is calculated by multiplying the N2O concentration near the river water surface by the Bunsen solubility.
Triplicate 500 mL water samples were collected at each sampling site for analysis of dissolved nitrate nitrogen (NO3-N) and ammonium nitrogen (NH4+-N), dissolved inorganic/organic carbon (DIC and DOC), and dissolved phosphorous (DP). These samples were filtered (Whatman 0.45 μm GF/F) and stored in acid-washed plastic bottles, then kept at 4 °C in a portable cooler before transportation to the lab. A multi-parameter analyzer (LH-3BA, Lianhua Co. Ltd., Beijing, China) was used to measure NO3-N, NH4+-N, and DP. A total organic carbon analyzer (vario TOC, Elementar Analysensysteme GmbH, Langenselbold, Germany) was used for DIC and DOC determination.
Concentrations of dissolved oxygen (DO), pH, and oxidation–reduction potential (ORP) were measured during sampling period by setting probes of the multi-parameter meter (Model Multi HQ 40d, Hach, Loveland, CO, USA) into the surface water. Air and water temperatures (Ta and Tw) were recorded at the same time.
There are many ways to estimate N2O emission coefficients in rivers [24], and in this study, the river’s potential N2O emissions were calculated using the following equation:
EF 5 r = N 2 O N N O 3 N
EF5r is the emission factor, while N2O-N and NO3-N refer to concentrations of different nitrogen forms measured in the river (mg/L). This equation has been widely used to calculate indirect N2O emission factors [35,36].

2.3. Land Use Type Determination

Based on the ASTER GDEM 30M resolution digital elevation dataset from the Geospatial Data Cloud platform, the hydrological analysis tools in ArcGIS 10.8.1 software were used to extract the sub-basin areas of the study region. Finally, in conjunction with the China Land Cover Dataset (CLCD), the calculate geometry tool was employed to determine the area sizes of different land use types within each sub-basin.

2.4. Statistical Analysis

All the values of the monitored parameters are reported as the means. The data were statistically analyzed using SPSS (v.19.0), with an accepted significance level of p < 0.05. One-way analysis of variance (ANOVA) followed by a Tukey’s test, was used to detect the differences in water quality and temperatures among sampling points. A paired T test was used for the pairwise comparison between the dry and wet seasons. Kruscal–Wallis test and Wilcoxon signed-rank tests were used for analysis of N2O concentration distributions, as N2O concentrations did not follow a normal distribution. Spearman’s correlation analysis was used to identify the correlations between the gas concentrations and environmental factors. All the figures were made using Origin 2021 v9.8 (OriginLab, Co., Ltd., Northampton, MA, USA).

3. Results

3.1. N2O Concentrations in the YLR Basin

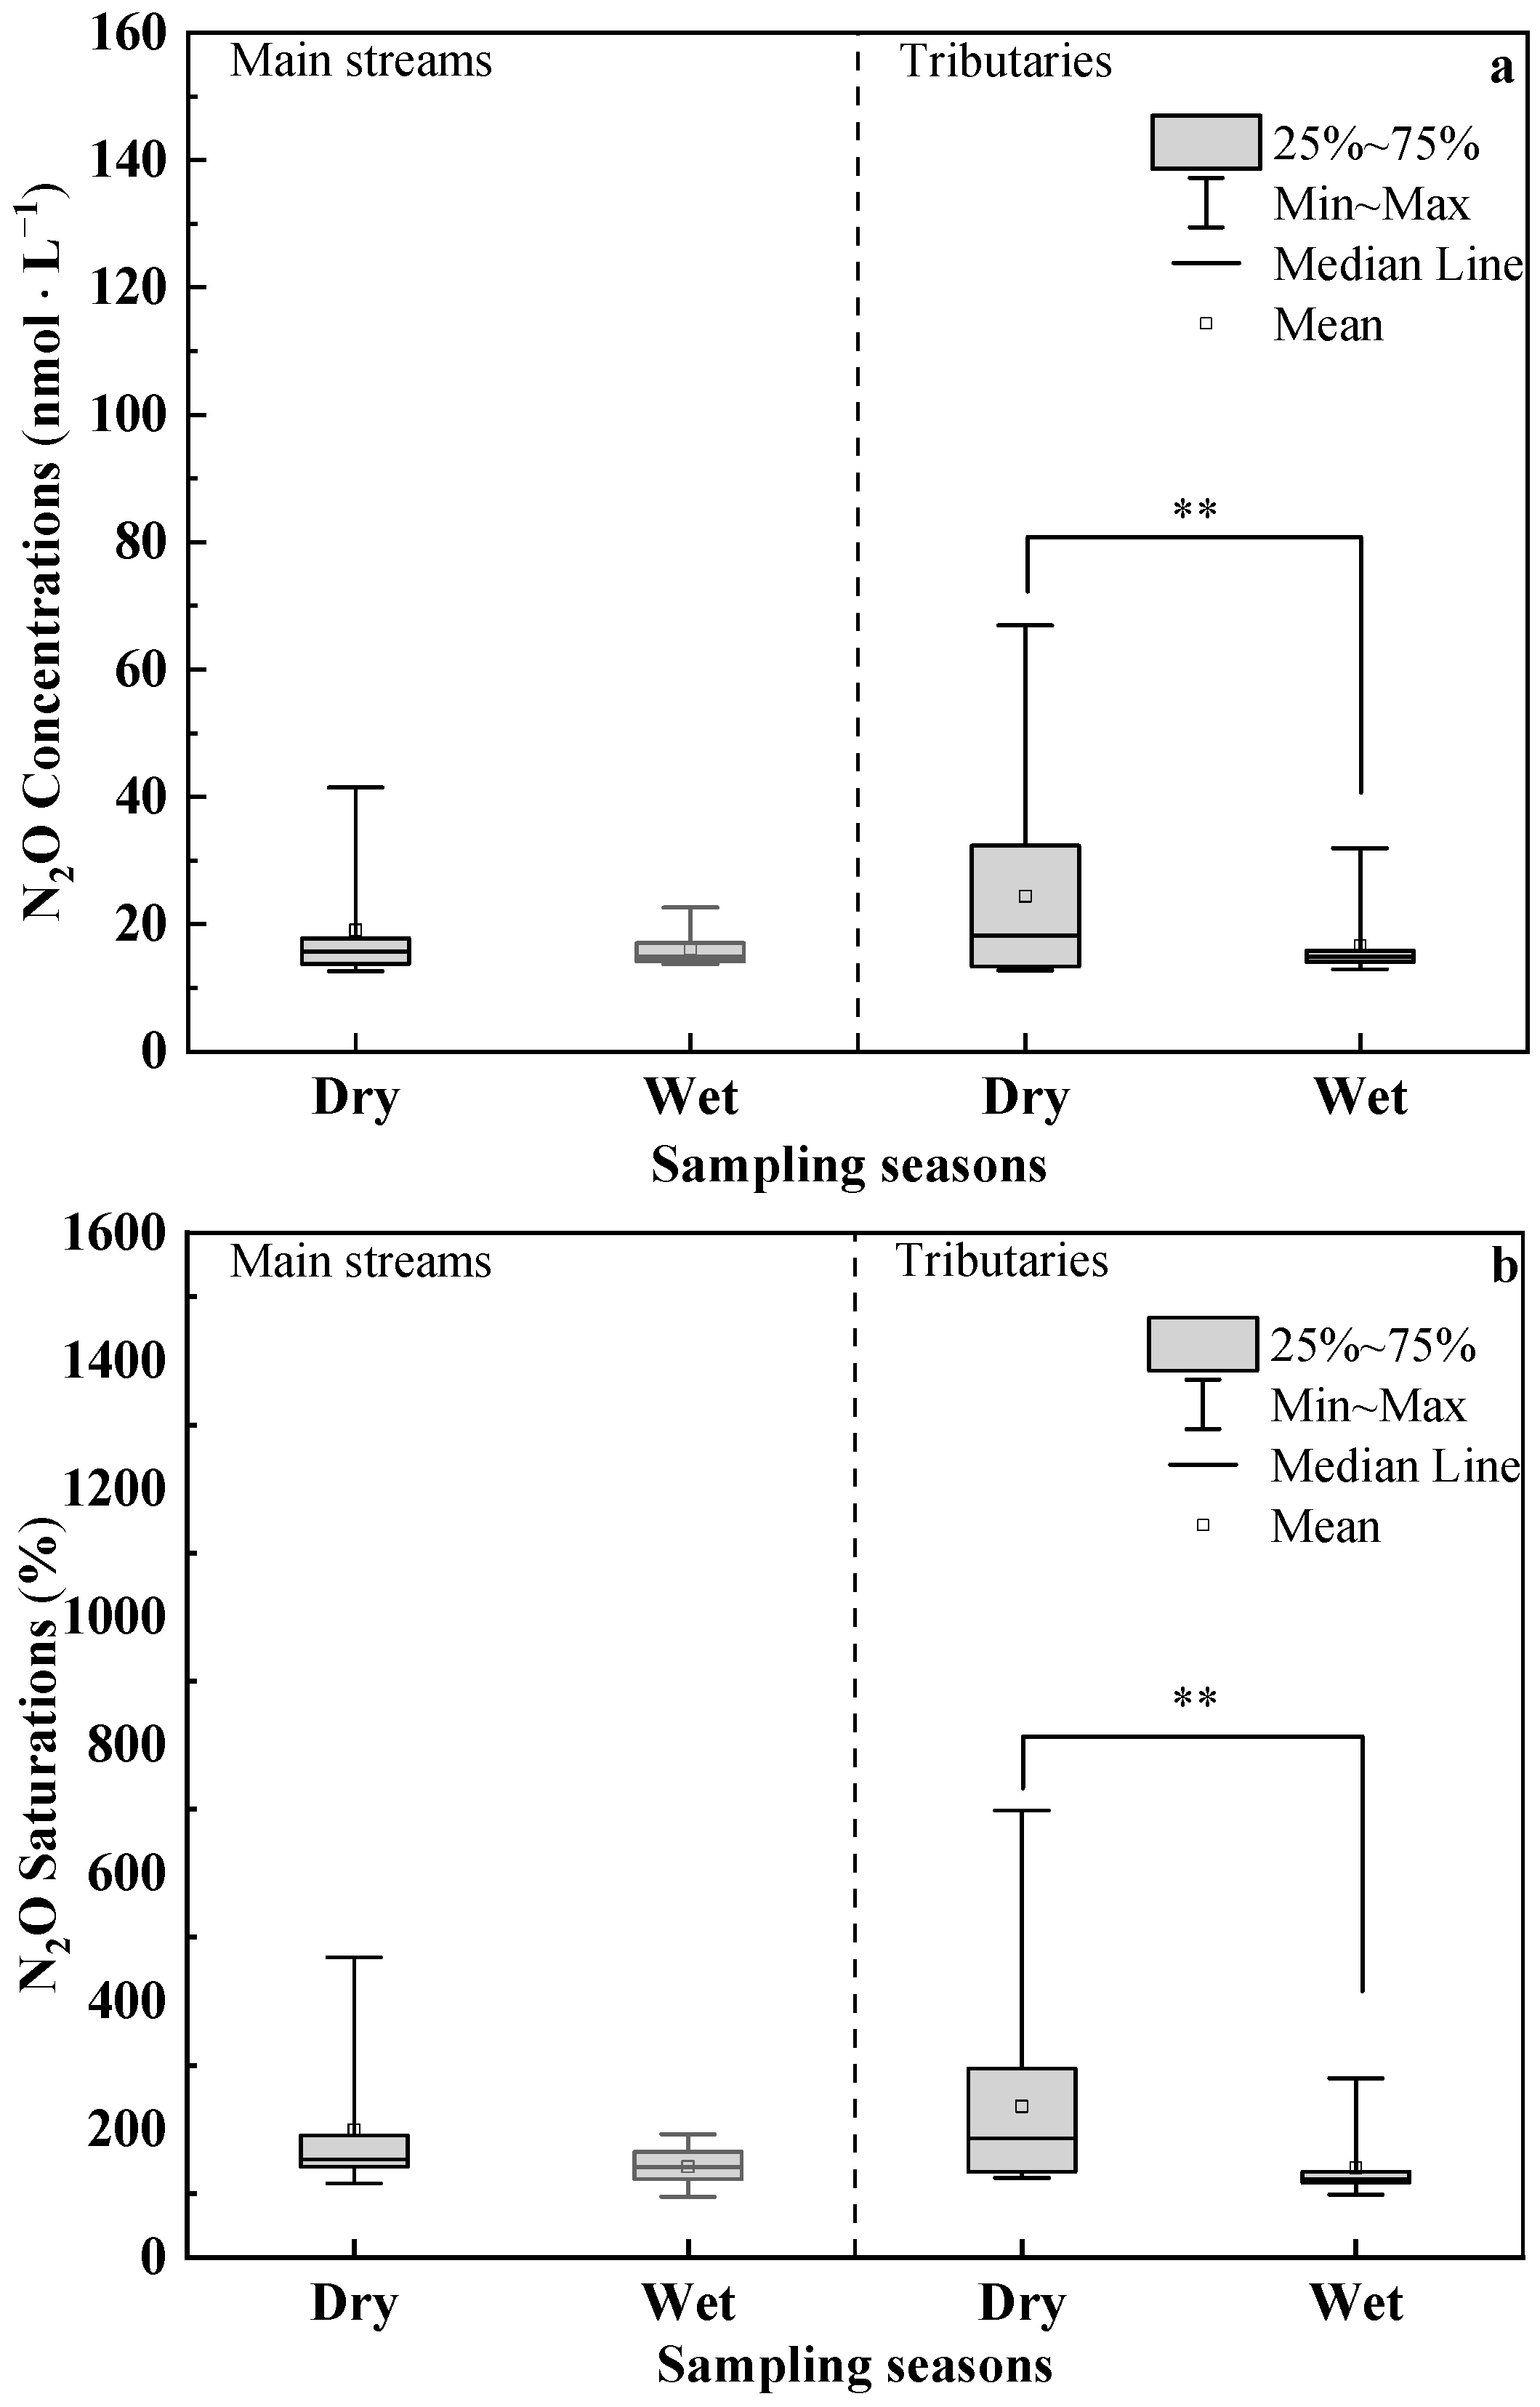
The average value of dissolved N2O concentration in the main streams in the YLR basin was 19.06 ± 8.74 nmol·L−1 in the dry season and 16.09 ± 2.67 nmol·L−1 in the wet season (Figure 2a). The highest values in the basin along the main streams were observed near the confluence of the two rivers. The difference in N2O concentration between seasons was not significant (p = 0.092). Average N2O saturation was 199.51 ± 106.66% in the dry season and 142.63 ± 25.29% in the wet season, with a significant difference between seasons found by the Wilcoxon test (p = 0.003) (Figure 2a).
The tributaries (LT and YT) of the twin rivers had approximate distributions of dissolved N2O concentrations and saturations in both seasons. Dissolved N2O concentrations of all the tributaries averaged 24.43 ± 14.58 nmol·L−1 in the dry season, and 16.65 ± 5.01 nmol·L−1 in the wet season, with a significant difference detected between seasons (p = 0.008). Similarly, saturations of N2O in all the tributaries decreased in wet season, with an average value of 140.68 ± 47.96% that was significantly lower than that of the dry season (average 236.20 ± 141.79%) (p < 0.001). Comparison of the N2O concentrations and saturations between the tributaries and the main streams were carried out, but no significant difference was found.

3.2. Changes in Hydrographic Factors and the Effects on N2O Concentrations

3.2.1. Changes in Water Physiochemical Conditions and the Effects on N2O Concentrations

Air and water temperatures in the YLR basin decreased slightly from the downstream to upstream in both sampling seasons, with significantly lower values in the wet season than in the dry season. In the main streams, including LR, YR, and YLR, significantly decreased ORP values were detected in the wet season compared with the dry season (p < 0.001) (Table 1). Dissolved carbon contents showed opposite variations between seasons, as the wet season showed significantly lower DIC contents (p = 0.004) but higher DOC contents (p = 0.068). Similarly, dissolved nutrition in the main streams had different seasonal dynamics, as NH4+-N contents (p = 0.056) and DP contents (p = 0.004) decreased in the wet season, but NO3-N contents increased (p = 0.015).
Seasonal dynamics of all the factors in the tributaries are same as those in the main streams (Table 1), and nearly all the differences between seasons are significant, except those of DO, DOC, and DP. Temperatures of the main streams and the tributaries did not differ much during the sampling periods. Compared to the main streams, the tributaries had lower physical property values but higher carbon and nutrition contents in both the dry and wet seasons. However, only NO3-N content in the wet season had significantly different values between the main streams and the tributaries (p = 0.008).
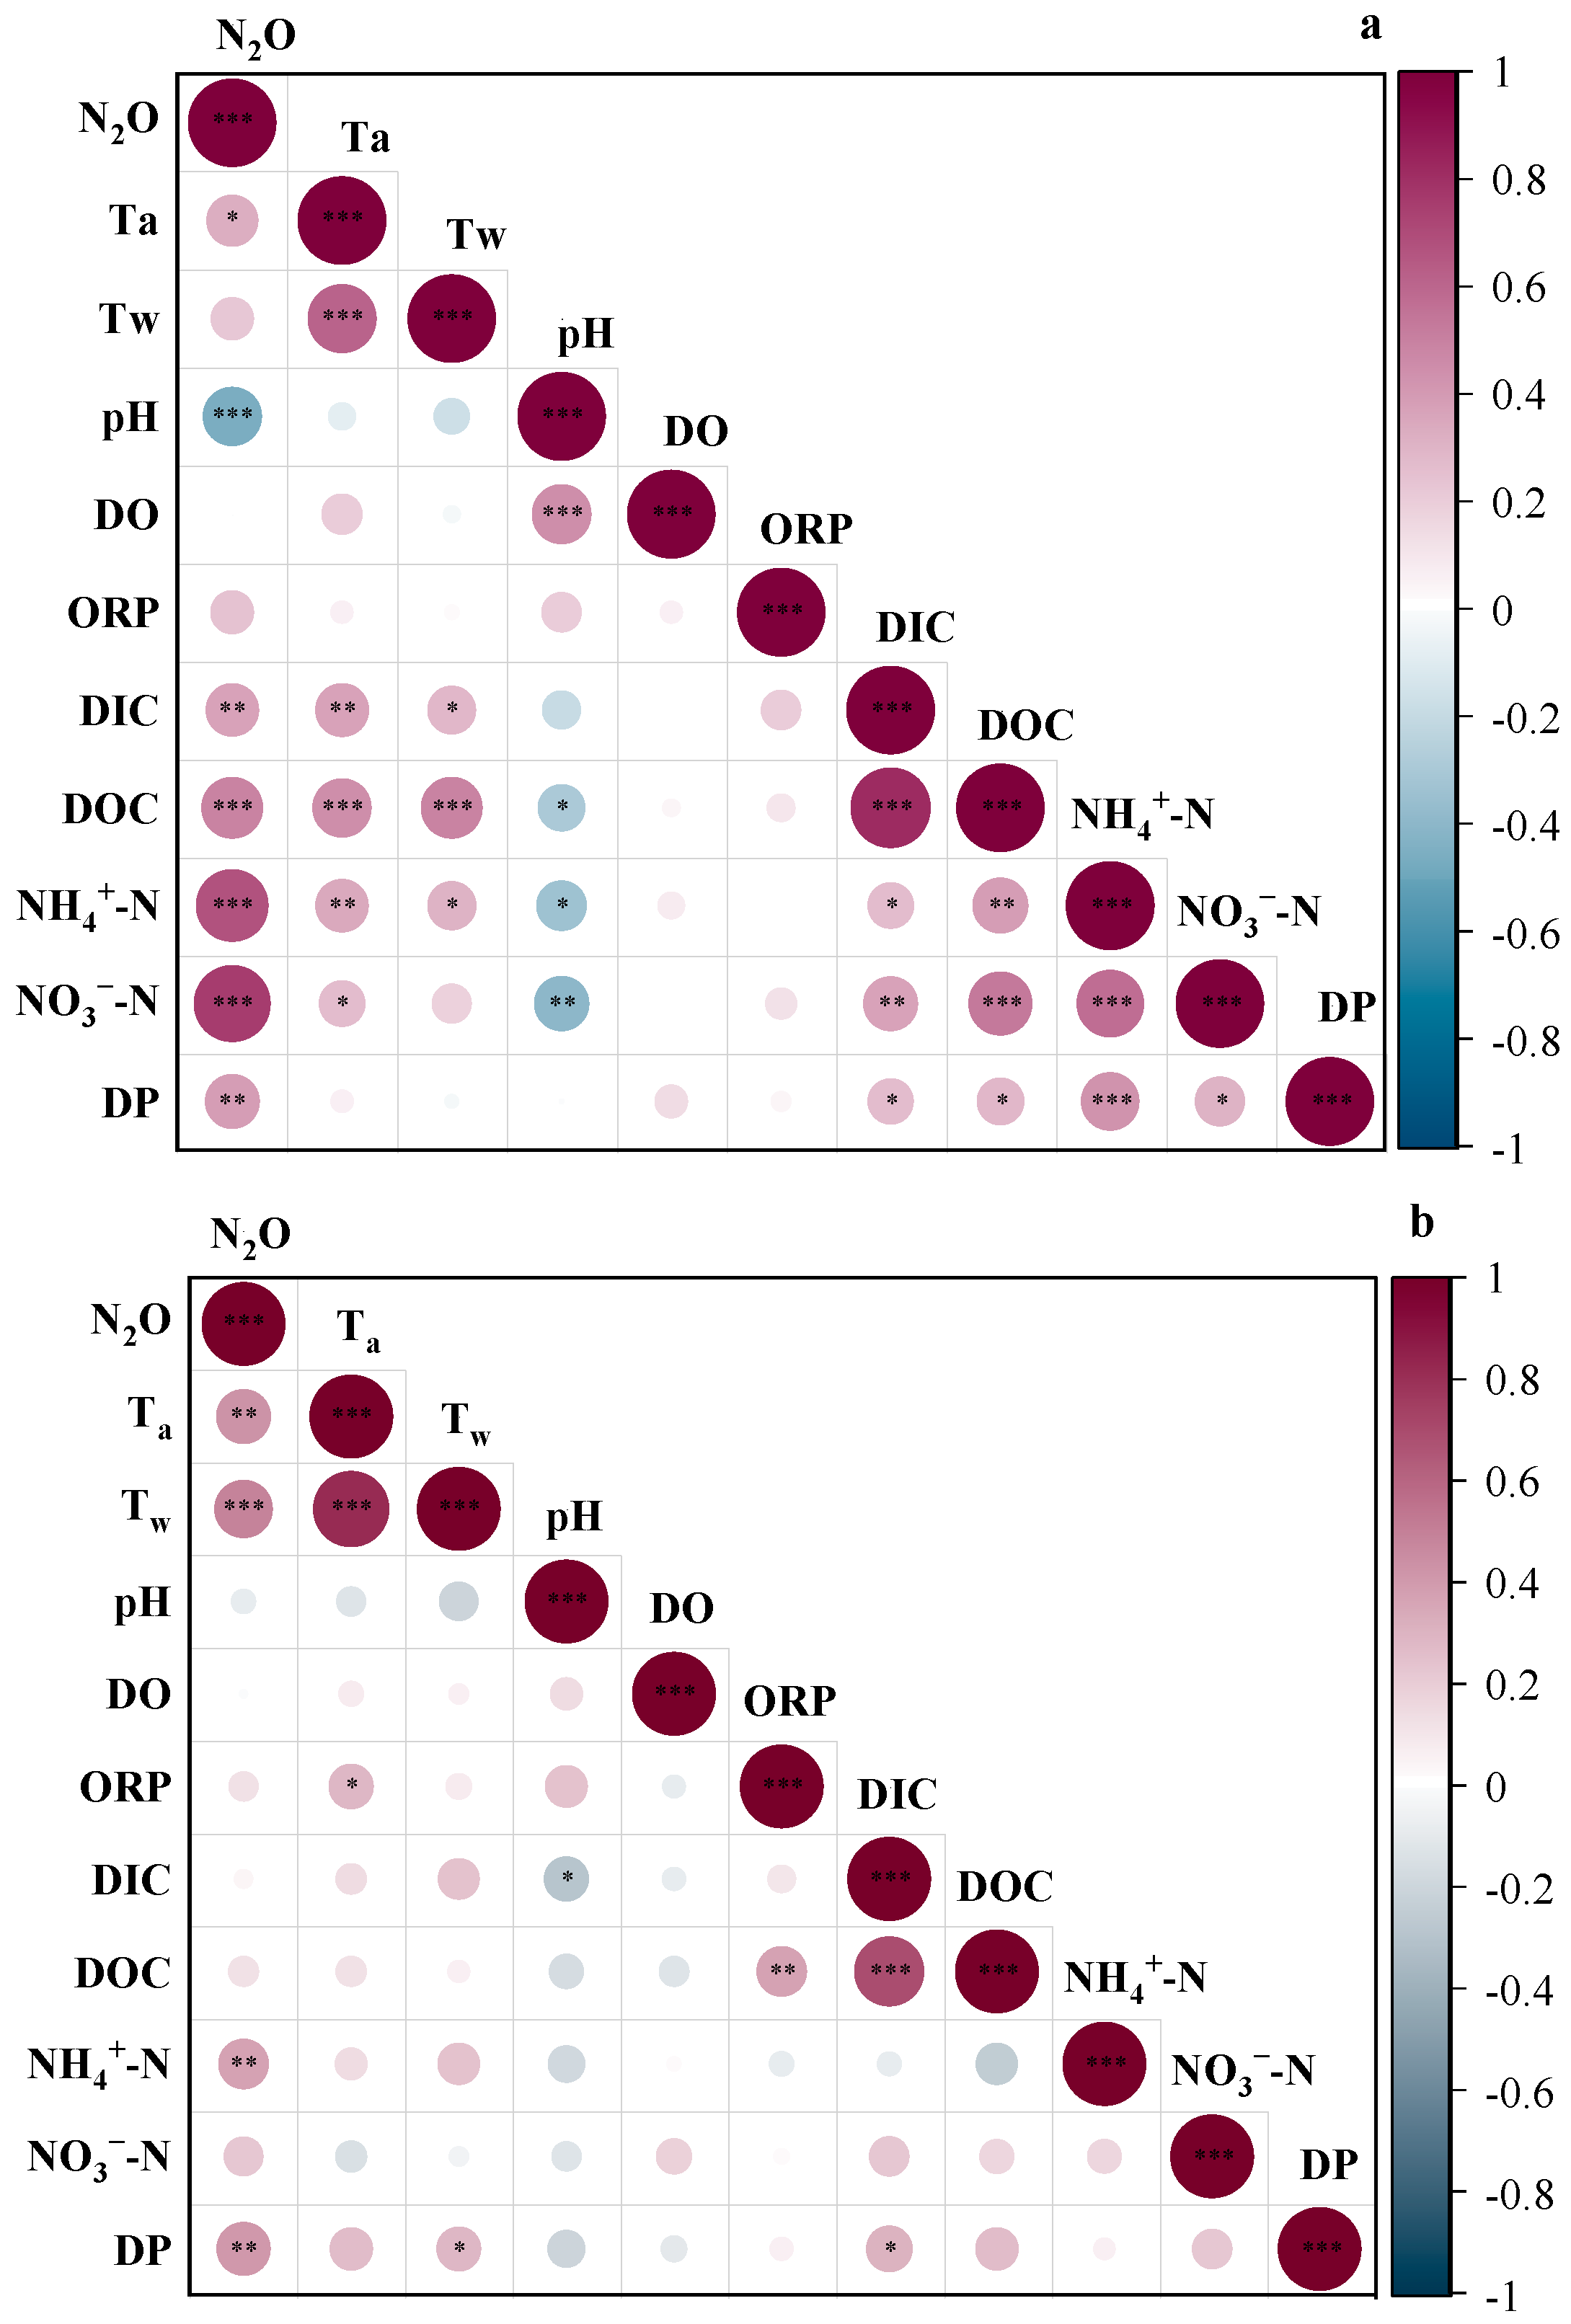
In the dry season, N2O concentrations in the main streams and all the tributaries were significantly positively related to Ta, carbon, and nutrition contents, while being negatively related to pH (Figure 3a). Significant positive correlations were found among dissolved carbon and nutrition in the dry season. Dissolved carbon and nitrogen increased with temperature, but decreased as pH elevated. In the wet season, the significant influencing factors on N2O were Tw, Ta, NH4+-N, and DP (Figure 3b). The promotion effects of carbon and nitrogen weakened, and no correlation was found between pH and N2O. Furthermore, multiple regressions demonstrated that N2O was correlated with NH4+-N, NO3-N, and ORP in the dry season (R2 = 0.743, p < 0.001), while it was correlated with DP, Tw, NH4+-N, and DOC in the wet season (R2 = 0.640, p < 0.001) (Table 2).

3.2.2. The Effects of Land Cover Types on the Environmental Characteristics of the Tributaries

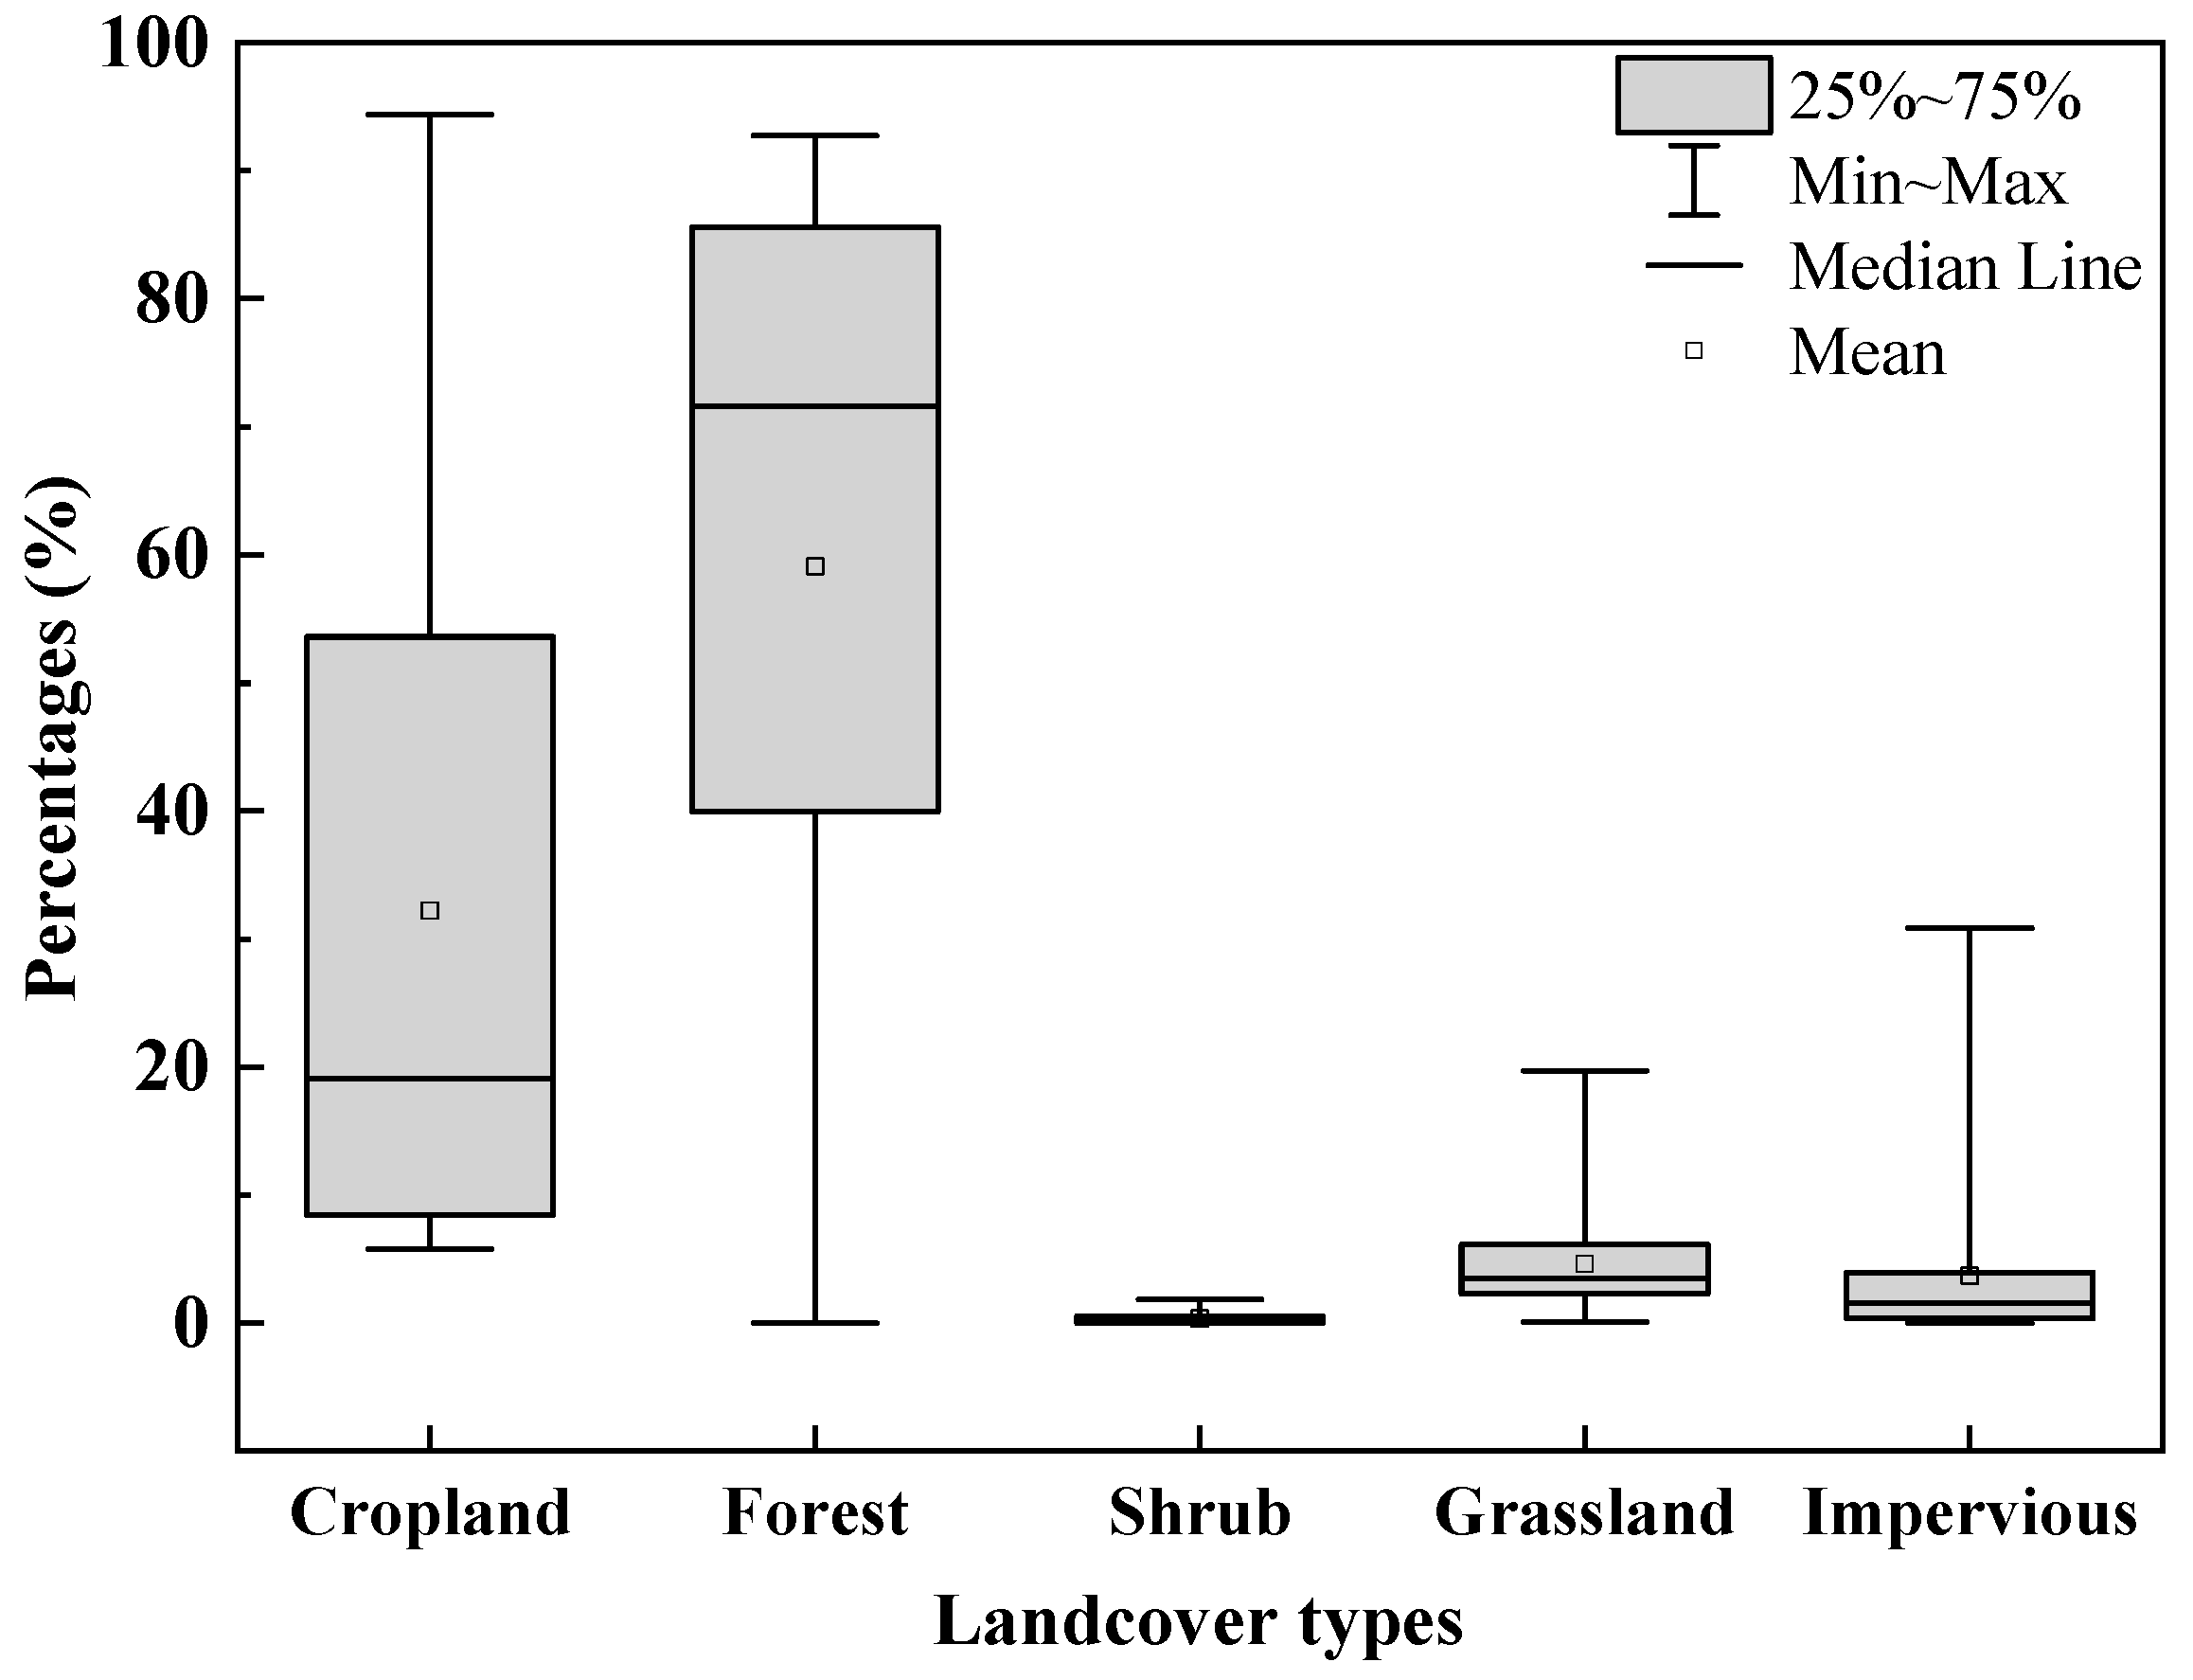
The LUCC analysis of the tributaries showed that the study area was highly naturally vegetated (Figure 4). Among all the 30 sampled tributaries, 21 exhibited forest coverage exceeding 50%, 14 had forest coverage above 75%, and 8 tributaries had cropland coverage surpassing 50%. Shrubs had a coverage of 0–1.83%, while grasslands ranged from 0.07% to 19.69%. Impervious land (representing urbanized areas) had a coverage range of 0 to 30.83%.
Among the five land use types, cropland and impervious land were positively correlated with Ta/Tw, whereas natural lands demonstrated negative correlations with temperatures, with enhanced effects observed during the rainy season (Table 3). Water physical characteristics were impacted by land use types differently. In the dry season, shrub and grassland positively correlated with pH, while in the wet season forest showed positive associations with pH and ORP. In contrast, anthropogenic land uses inversely affected water parameters, with significantly negative effects found between impervious land and pH and between cropland and DO. Natural vegetation, particularly the shrub land, inhibited carbon and nutrition accumulation, while cropland and impervious surfaces enhanced these parameters, though such effects attenuated during the wet season. All of the five land use types significantly affect N2O concentration in tributaries. The cropland and impervious land were significantly positively correlated with N2O concentrations (Table 3), while forest, shrub, and grassland showed significantly negative correlations. The correlation is stronger in the dry season compared to the wet season, and the mitigating effect of grassland on N2O concentration became non-significant during the wet season.

3.3. Calculated EF5r in the YLR Basin During Different Sampling Seasons

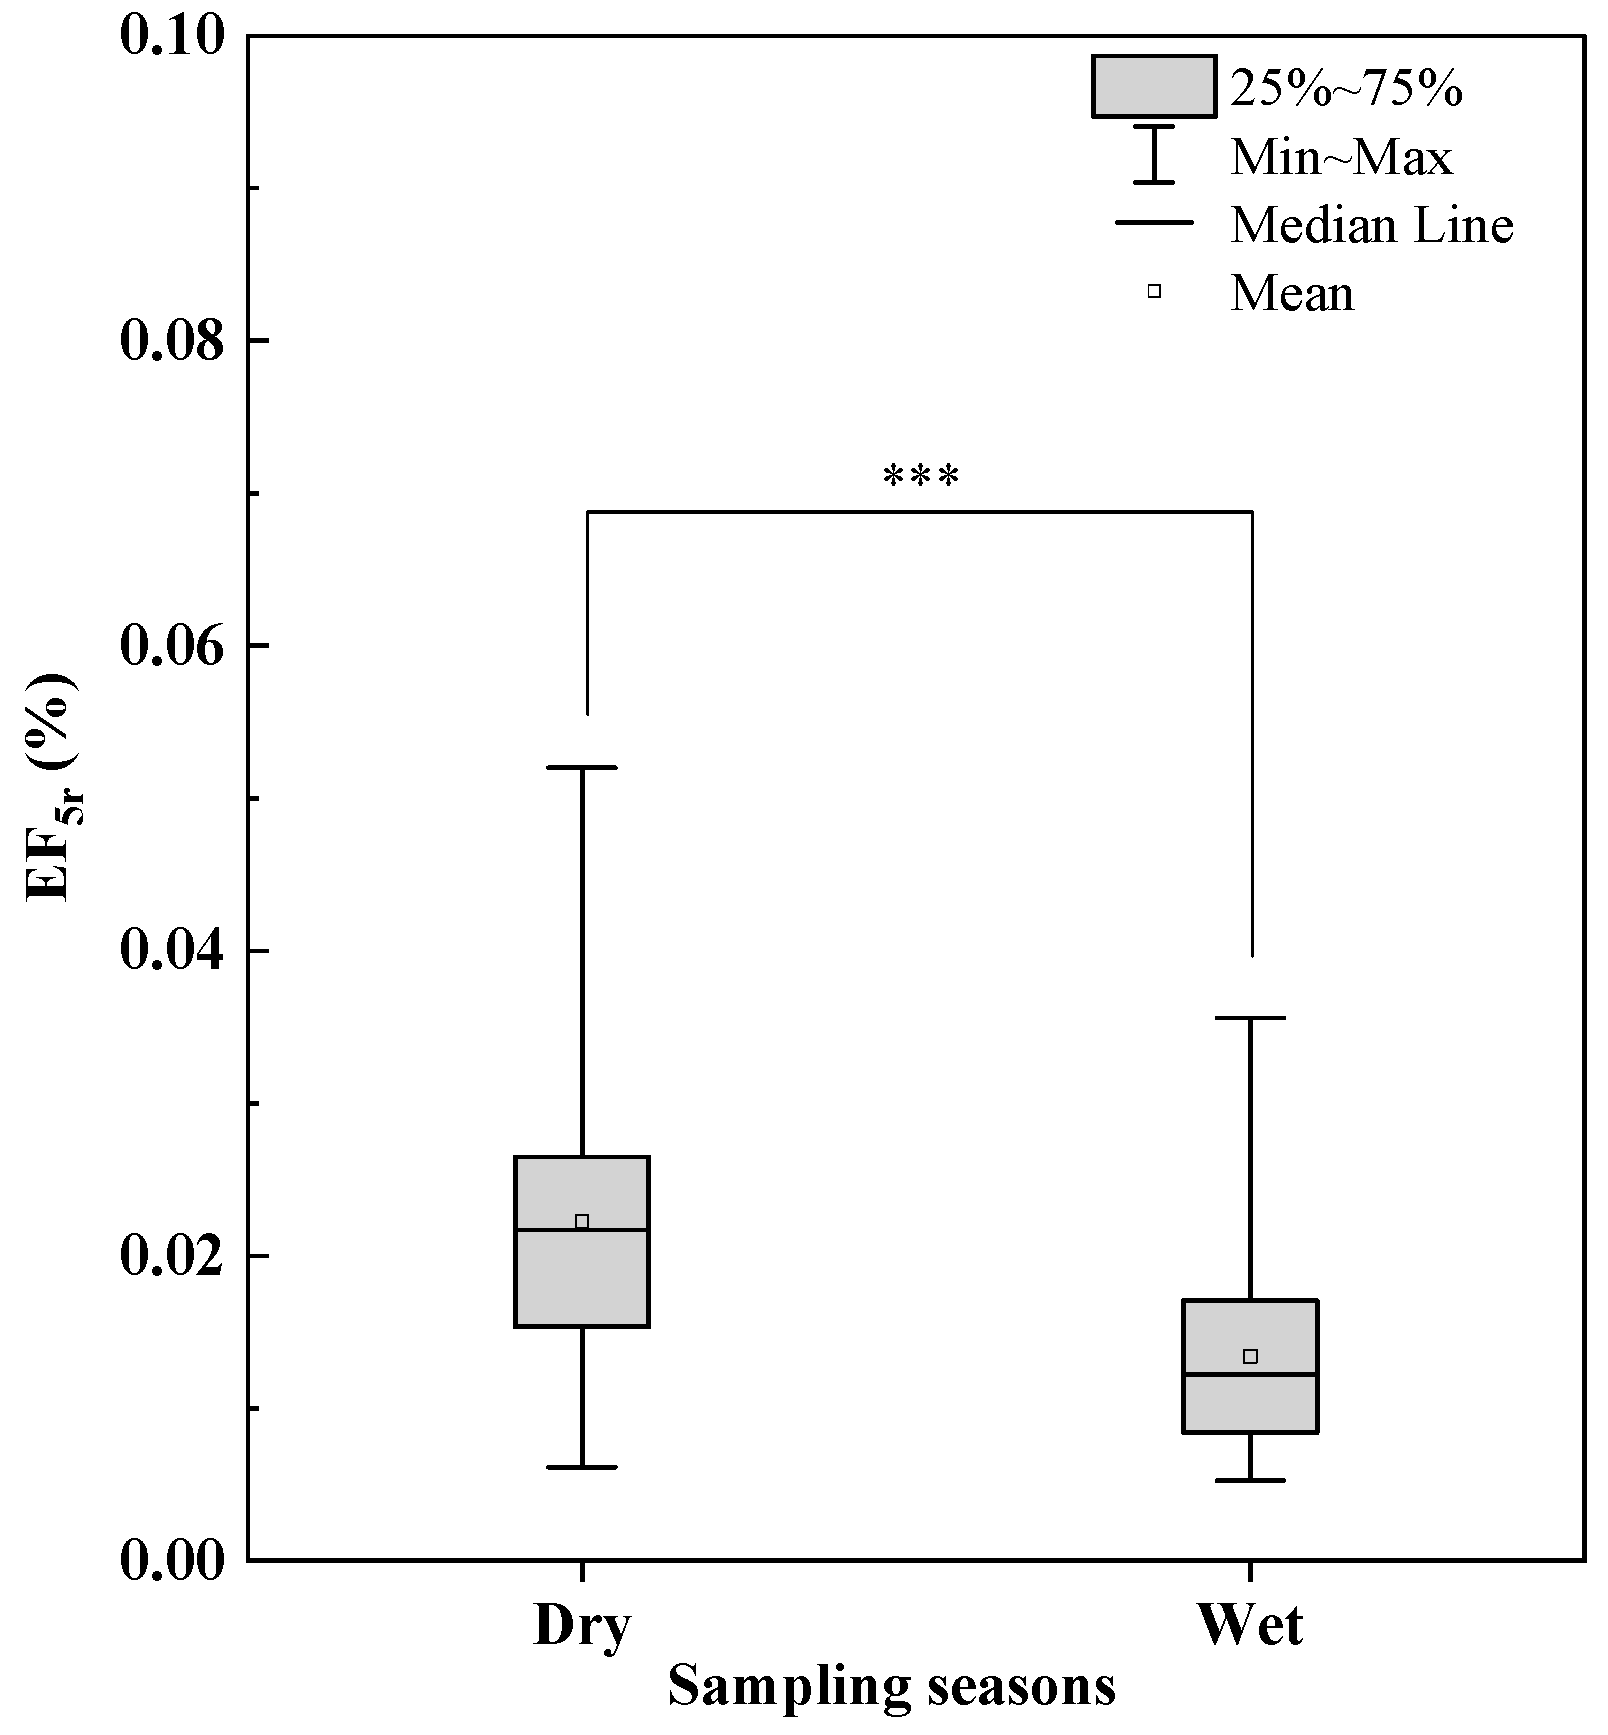
Sampling time had significant impacts on the indirect N2O emission factors, as EF5r values in the wet season were lower compared to the dry season. In the dry season, EF5r (%) changed from 0.0061 to 0.0520 on the whole basin scale, with an exception of 0.312, which was excluded when conducting the data analysis. While in the wet season, EF5r (%) changed from 0.0053 to 0.0356, the difference between seasons was significant (p < 0.001) (Figure 5). The same significant decrease was founded with LR and LT, but not with YR and YT.

4. Discussion

4.1. The Driving Factors of the N2O Concentrations in the YLR Basin

The dissolved N2O in the rivers are regulated by endogenous production, runoff inputs, and groundwater exchange processes, mediated by interactions with the confluence zones [37,38,39]. The YLR basin, which is predominantly composed of forest and cropland, exhibited N2O concentrations that are comparable to prior investigations [24,40,41], yet remained distinctly lower than those heavily polluted urban rivers [23,42]. Notably, the N2O concentrations of the YLR were about one order of magnitude lower than groundwater concentrations reported in Loess Plateau studies [38], where anoxic conditions and agricultural nitrogen leaching promote N2O accumulation. The Yiluo River basin has proved to be highly groundwater dependent, and nearly half the runoff is generated from groundwater [43], the riverine N2O concentrations are likely controlled by groundwater inputs. In addition, lower N2O concentrations and substrate contents were found in the main stream compared to the tributaries, on the basin scale (Table 1), suggesting a dilution effect caused by the confluence, which has been demonstrated by previous study [44]. As streams serve as important areas for terrestrial matter consumption [6], a smaller amount of substrate will flow out of the sub-basin and accumulate in main streams, leading to confluence-driven dilution effects. However, shorter residence in the wet season may decrease this consumption and diminish the dilution efficiency.
Nitrate and ammonium are important substrates for N2O production pathways, including nitrification, denitrification, and nitrifier denitrification, and are considered the primary reactants governing N2O cycling [45]. However, the constraints for N2O generations in the YLR basin differed in seasons. In the dry season, both NH4+-N and NO3-N were significant predictors for N2O, but in the wet season only NH4+-N remained predictive for N2O, along with DP, Tw, and DOC, indicating hydrologically suppressed denitrification. Numerous studies emphasized nitrification-dominated N2O production in oxygenated systems [8,46], while this research approved that coupled nitrification–denitrification chains under DOC-sufficient conditions would be facilitated under a low discharge condition. Elevated discharge in the wet season resulted in lower NH4+-N and decreased the potential denitrification rate (PDR), which is inferred from higher NO3-N and DOC vs. lower N2O concentrations. Some research suggested that NH4+-N is a powerful predictor for potential denitrification rate (PDR) [47]. The decline in PDR may be caused by constraints of phosphorous (P) and Tw, as previous research suggested that P serves as a critical predictor for N2O emissions in urban rivers [23] and regulates nitrogen-cycling microbial communities in aquatic systems [48]. Suppressing effects of low P have been found in denitrification and denitrifiers’ genes abundance [49,50]. Therefore, it can be inferred that the constraint of P and low temperature on N2O productions overwhelmed the priming effect of elevated NO3-N concentrations.
Land use types are important indirect influencing factors for greenhouse gas distributions and fluxes in rivers [51,52,53]. The investigations in the tributaries showed a close relationship between the spatial dynamics of N2O and land use types. This may be triggered by two mechanisms: (1) land cover-induced alterations in hydrochemical parameters (e.g., dissolved oxygen, pH) and (2) differential N2O loading from distinct drainage sources. Intensive fertilizer application and wastewater discharge from croplands and impervious lands are notable nutrition sources, consistently elevating riverine N2O concentrations in adjacent reaches [20,42]. These anthropogenic landscapes simultaneously enhance dissolved organic matter [54], which is an important substrate for the denitrification process [45]. The same correlations were found in this research (Table 3). Stepwise multiple regression showed impervious area was the only predictive factor for NH4+-N in the dry season, similar with the viewpoints of Wang et al. [55], which demonstrated that increased residential land and anthropogenic activities lead to high nitrogen loading in water bodies of the YLR basin. Contrastingly, natural vegetation exhibited a nitrogen mitigation capacity, with shrub area behaving as predictor for NO3-N in the dry season. This finding is quite interesting, as previous research approved the nutrient buffering effect of natural lands [56], but the efficiency of different land types are rarely discussed. A recent study demonstrated the high NO3-N removal efficiency of shrub land under DOC-abundant conditions and pointed out that shrub area can also reduce DOC discharge, thus suppress hyporheic zone denitrification [28]. In the YLR basin, cropland was significantly correlated with forest (r = −0.467, p = 0.009) and shrub land (r = −0.424, p = 0.019), suggesting that the cropland increased at the expense of forest and shrub land. This would create ecotonal interfaces where shrub-adjacent cropland can provide substrate (DOC) for denitrification in the shrub area, which ultimately reduces NO3-N transport.
The same negative effect of shrub land on N2O and nutrition content was detected in the wet season, which reconfirmed the mitigation effect on reginal N2O emissions. Nitrogen (NH4+-N and NO3-N) contents showed correlations with impervious land but not with cropland, suggesting that sewage discharge played a more important role than agricultural pollution in nitrogen accumulation within streams under rainy conditions. This finding is contradictive to some research in the same area [55]. This discrepancy may stem from inconsistencies in sampling periods. Due to the interannual precipitation variation in the YLR basin, the rainy season in 2017 appeared in autumn rather than summer. Consequently, less nutrition would be released from agricultural soils given the end of the growing season. Furthermore, cropland’s contributions to N2O remained relatively stable between seasons, unlike other land use types whose influence on dissolved N2O diminished during the wet season. This implies that the N2O generation process in agricultural soils may be promoted by high precipitation, leading to increased N2O export via cropland discharge even if NO3-N release is not dominant. The significant negative correlation between cropland and DO (Table 3) supports this interpretation, as N2O is typically generated under reducing conditions [45]. Additionally, since Tw has been identified as a predictor for N2O concentrations in the wet season, the warming effect of intensive human activity could further explain the positive impacts of impervious and agricultural lands on N2O levels.

4.2. The Driving Factors of the EF5r Values in the YLR Basin

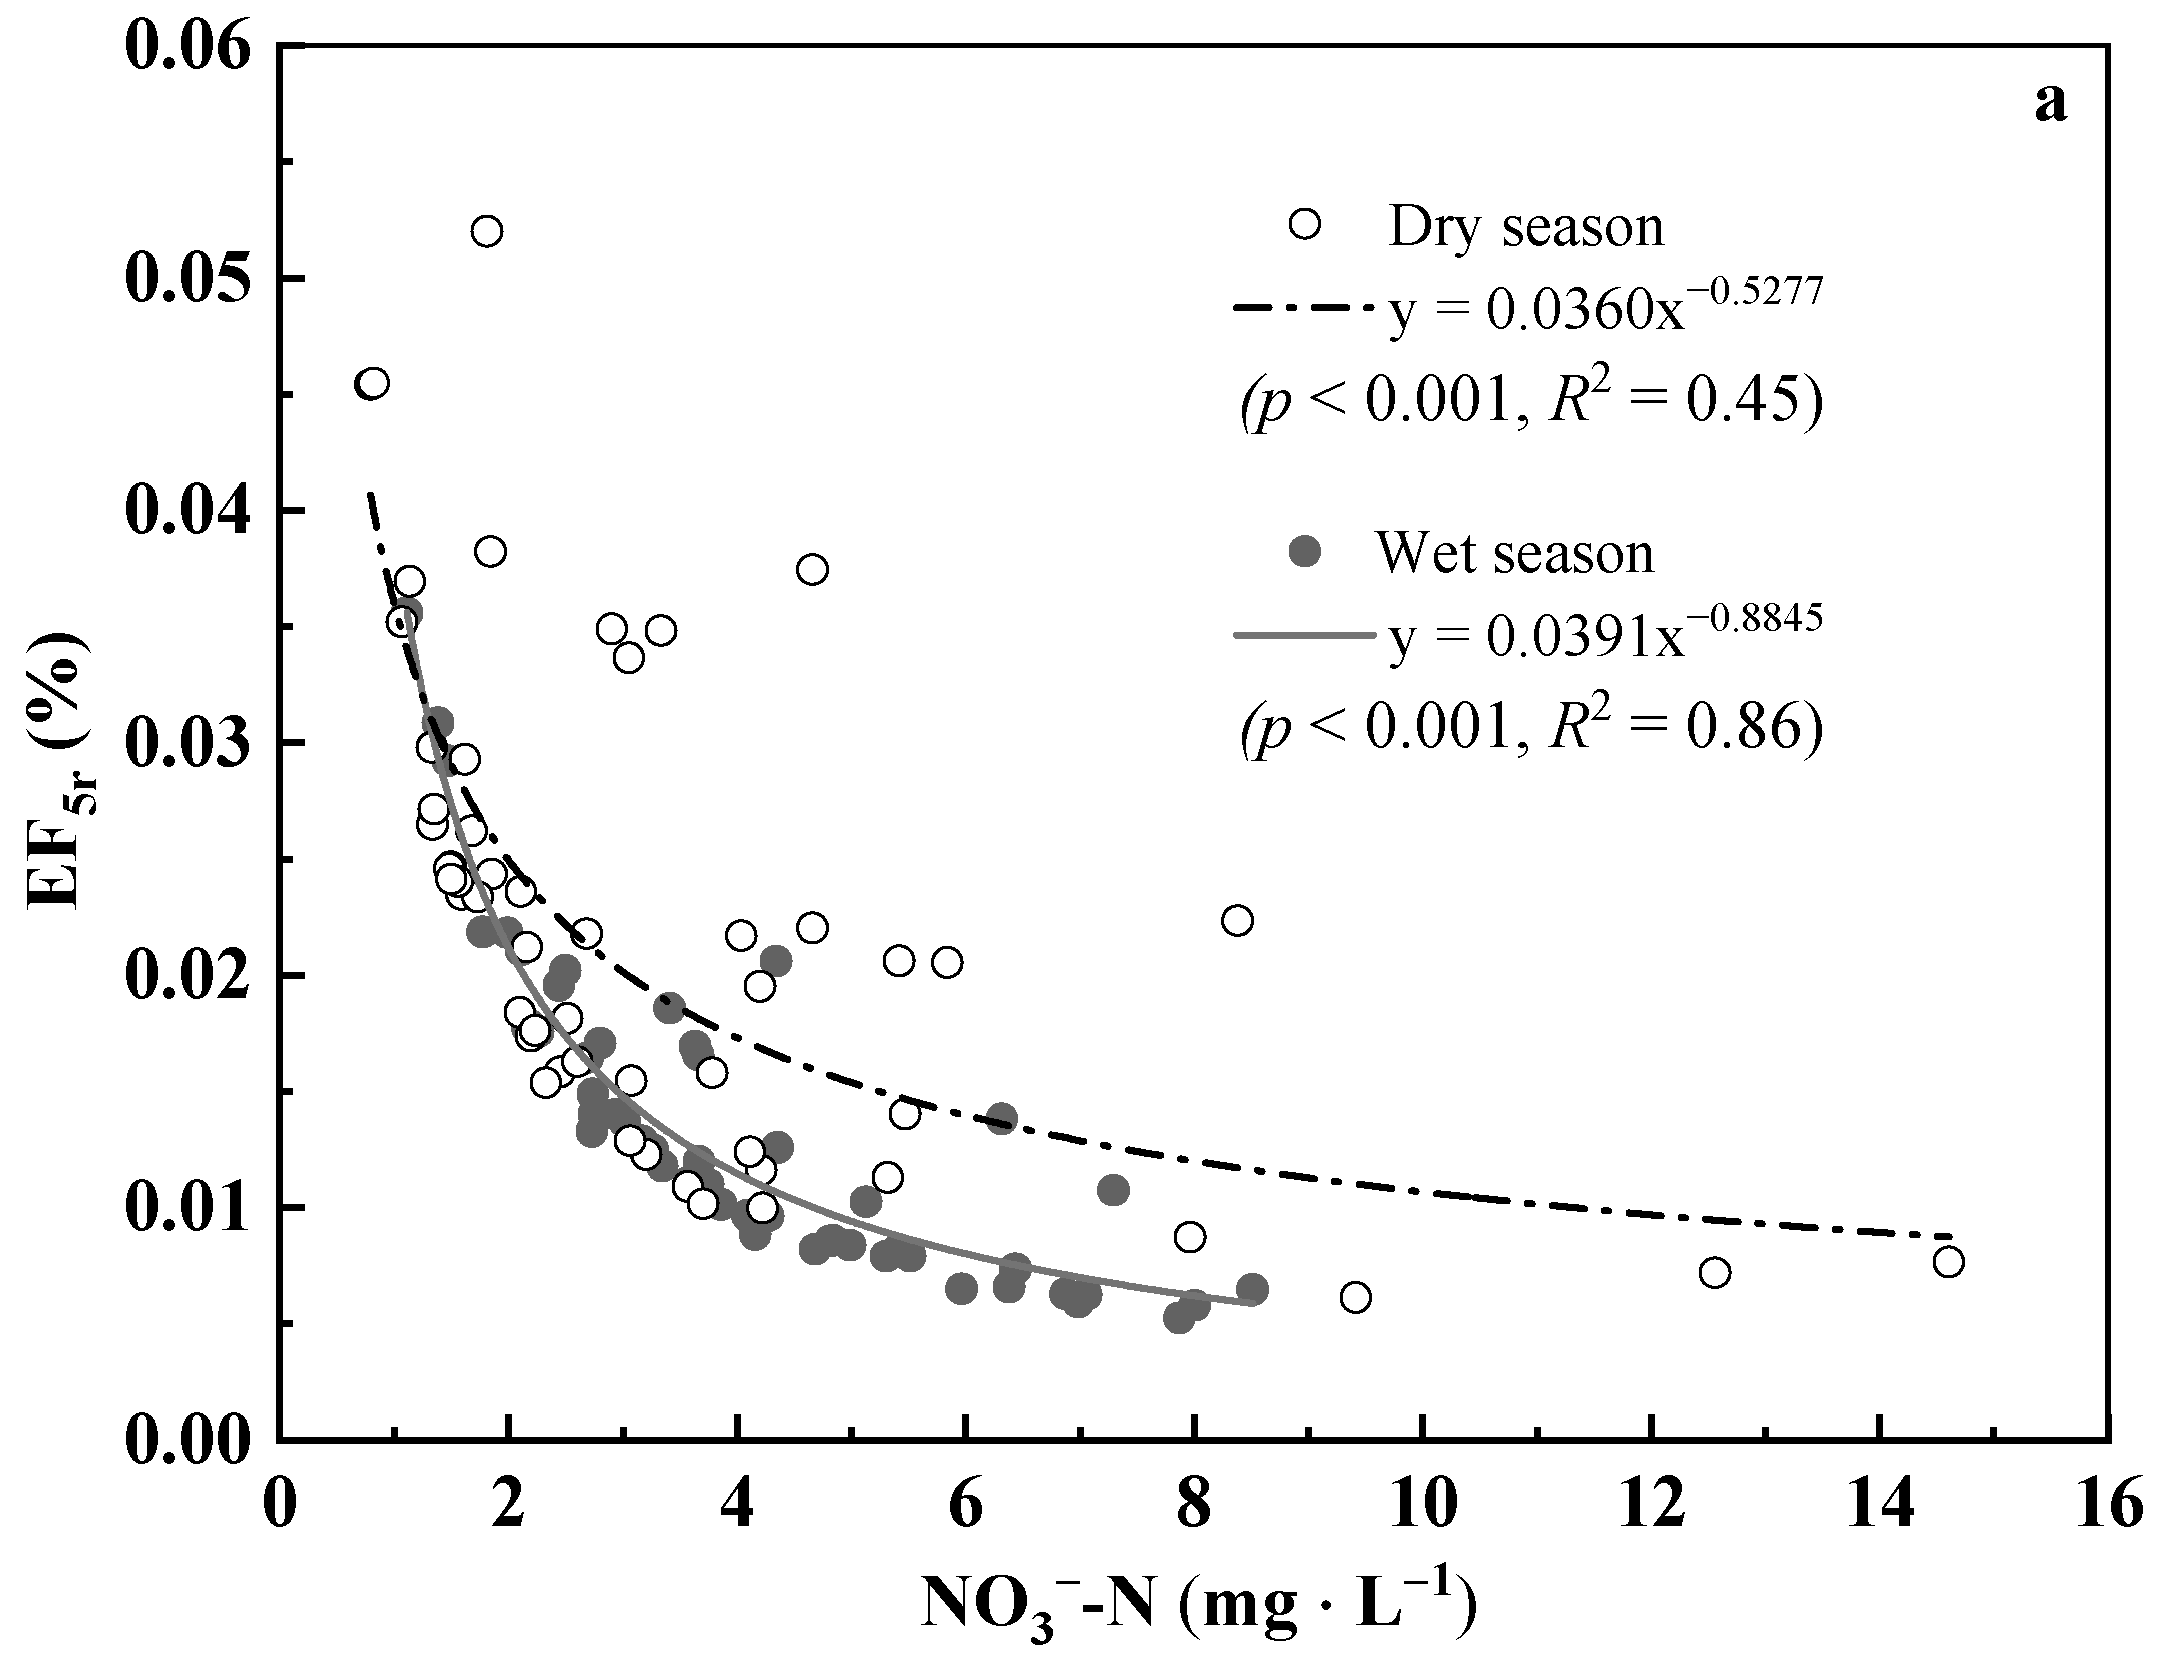
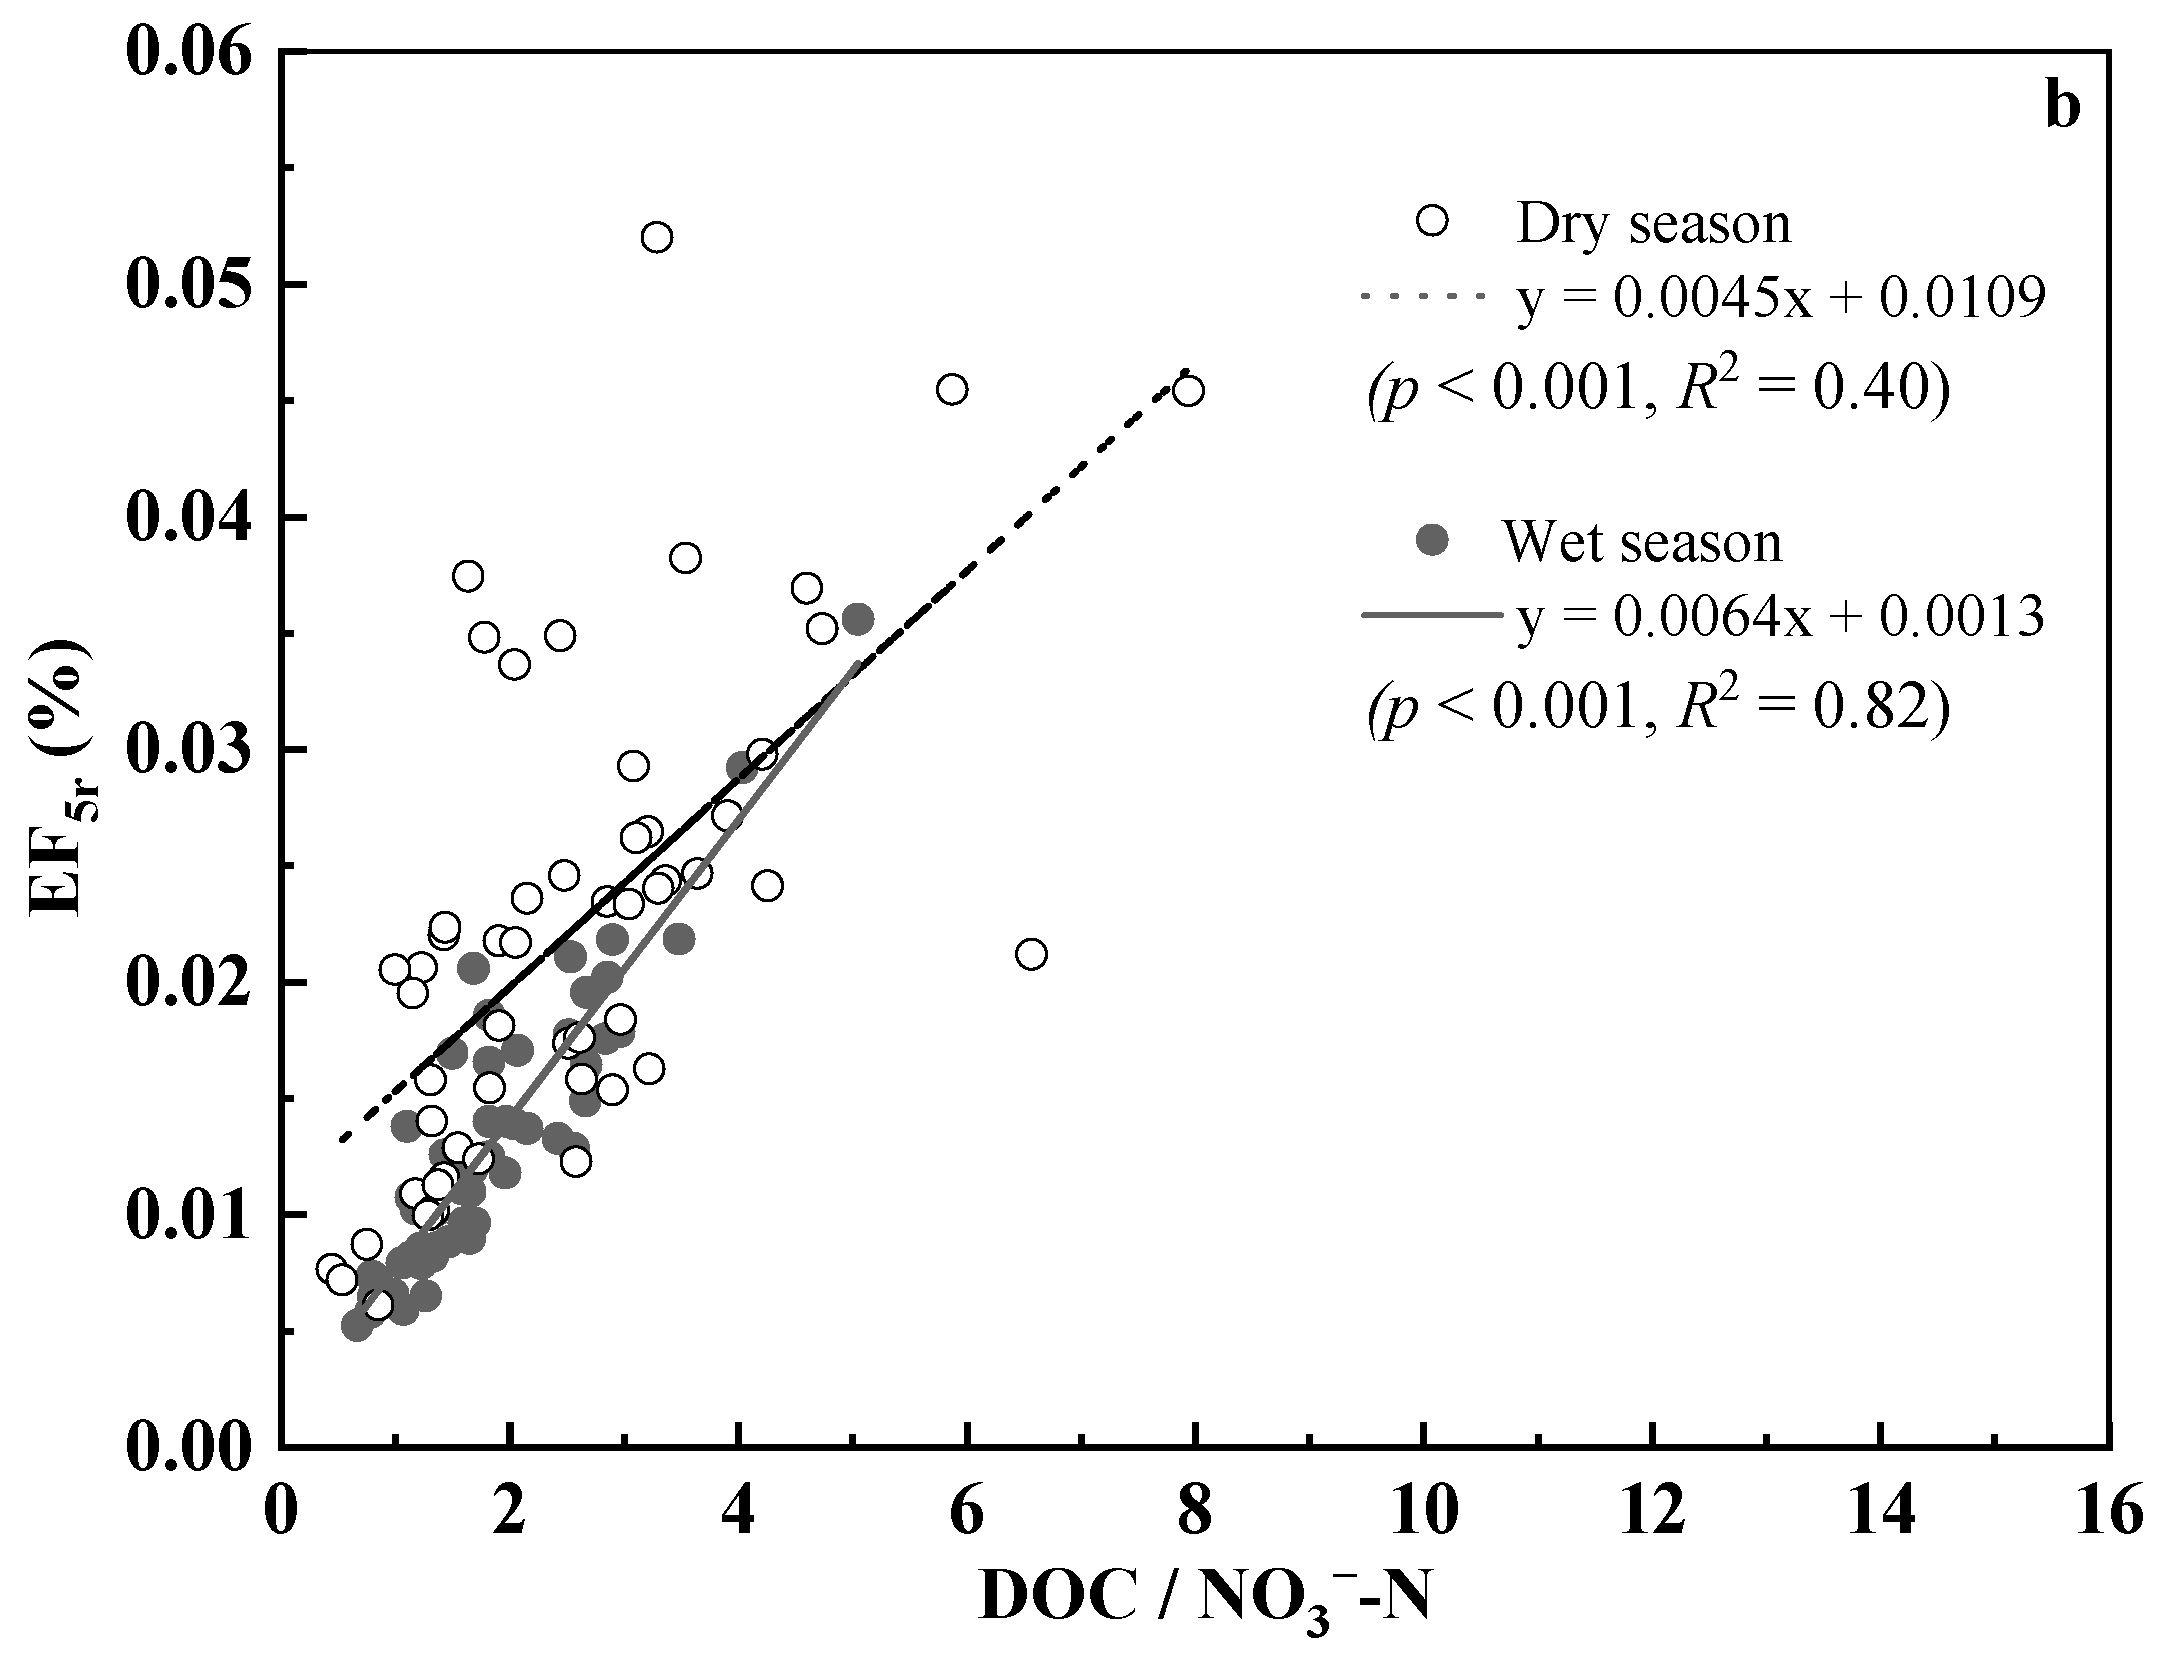
EF5r is widely used to evaluate riverine N2O emission potential. Numerous studies have revealed discrepancies between field-measured values and the IPCC default value (0.26) [36,57] and suggested potential overestimations in current river N2O emissions. This study confirmed low emission potentials in temperate river network, with EF5r values ranging from 0.005% to 0.056% across the two sampling periods (mean: 0.018 ± 0.001%). This result is comparable to some previous studies [35,36], but lower than that reported by Song et al. [28]. The EF5r in the YLR is lower than the emission factor of groundwater (EF5g) calculated in same region (0.025%) [38], but the gap between EF5r and EF5g is narrower than that suggested by the IPCC (0.26% & 0.60%) [57], indicating strong groundwater control over N2O emission in this basin. Seasonally, streams in the basin exhibited significantly lower EF5r during the wet season compared to the dry season. Global analyses carried by previous studies found that EF5r is negatively related to NO3-N but positively related with DOC/NO3-N [58,59]. This research had consistent results with previous viewpoints, as the same relationships were found in both seasons (Figure 6). The reduced N2O yield under elevated NO3-N concentration may be attributed to low denitrification efficiency caused by progressive biological saturation [59]. Hydrological controls further modulate this process: shorter hydraulic residence times in fast-flowing wet-season streams limit complete denitrification [60], potentially explaining seasonal EF5r variations.
Carbon-nitrogen stoichiometry crucially regulates microbial dynamics. As DOC and NO3-N serve as electron donors and acceptors during denitrification, the ratio of DOC and NO3-N determines NO3-N assimilation patterns in aquatic systems [61]. DOC limitation inhibits denitrification, favoring NO3-N accumulation, whereas elevated C/N will promote denitrification, accompanied with N immobilization [62]. Additionally, aerobic conditions suppress complete denitrification [46,62], increasing the N2O/N2 product ratio. In the YLR basin, higher DO, coupled with elevated C/N, may enhance N2O production efficiency, potentially increasing EF5r values despite overall lower wet-season emissions.
Although consistent correlations between EF5r and water physiochemical characteristics were observed across both the dry and wet seasons, a significantly lower EF5r was detected under comparable NO3-N concentrations or DOC/NO3-N ratios. As previously discussed, P deficit and low temperature may partially explain the suppressed denitrification efficiency; however, no statistically significant relationship was identified between DP and EF5r (r = 0.163, p = 0.094). The N/P stoichiometric ratios emerged as a potential predictor for the N2O production capacity in nutrition limited river systems, with significant negative correlations found between NO3-N/DP and EF5r in both seasons (dry season: r = −0.297, p = 0.031; wet season: r = −0.385, p = 0.004). Previous studies have highlighted a synergistic effect of N and P on aquatic nitrogen cycling, particularly in shaping the denitrifier community composition [63]. While simultaneous N and P inputs enhance denitrification rates in sandy sediments compared to singular nutrition additions [64], emerging evidence suggests that the reduction of N2O is P mediated [65]. Denitrification gene abundance is closely related with N/P. Elevated N/P driven by anthropogenic inputs will accelerate the terminal step denitrifying functional genes (N2O → N2) [47]. In the YLR basin, wet-season P depletion, accompanied with NO3-N enrichment, exacerbates P limitation. This imbalance favors compete denitrification (NO3-N → N2) over partial reduction to N2O, thereby reducing the N2O yield.

5. Conclusions

This study reveals the complex interplay of environmental and anthropogenic factors governing dissolved N2O dynamics in the Yiluo River basin. In the dry season. dissolved N2O was significantly correlated with NH4+-N and NO3-N concentrations, illustrating enhanced in situ production via nitrification and denitrification driven under reduced runoff. In the wet season, despite higher NO3-N and DOC inputs from non-point pollution, N2O concentrations decreased, with phosphorus (P) limitation and water temperature (Tw) emerging as dominant controls. Suppression by low P denitrification efficiency outweighed the priming effect of NO3-N. Impervious land specifically predicted NH4+-N in both seasons, reflecting sewage-driven nitrogen loading on the basin scale. Natural land, particularly shrub areas, correlated negatively with NO3-N transport, underscoring its role in buffering nutrient enrichment and then mitigating N2O emissions. Cropland expansion at the expense of forests and shrubs highlights trade-offs between agricultural activity and natural N2O mitigation capacity. The YLR basin exhibited low EF5r values (0.005–0.052%), significantly below IPCC defaults (0.26%), aligning with temperate river networks. Variation of nutrition stoichiometry emerged to be the driven force of the seasonal dynamic of EF5r, which was lower during the rainy season compared to the dry season. This research reconfirmed the significance of NO3-N and DOC/NO3-N ratios in predicting EF5r in basin scale and further pointed out that higher NO3-N/DP will result in lower EF5r in aquatic conditions. These results demonstrate that spatiotemporal variations in nutrient stoichiometry (C:N:P), modulated by land-use transitions and hydrological dynamics, must be explicitly integrated into N2O emission models to improve the precision of global greenhouse gas accounting frameworks
This research has demonstrated that shrubland ecosystems serve as an effective natural barrier against nitrogen and DOC leaching in temperate river basins. The preservation of existing shrublands, coupled with strategic establishment of riparian shrub buffers, could significantly mitigate N2O production and emissions from aquatic systems. Given the anticipated expansion of urban and agricultural landscapes, implementing sustainable land management policies that prioritize vegetative buffer zones should be a critical component of regional strategies to control riverine greenhouse gas emissions. This ecosystem-based approach not only addresses nitrogen cycle regulation but also enhances watershed resilience against anthropogenic nutrient loading.

Supplementary Materials

The following supporting information can be downloaded at: https://www.mdpi.com/article/10.3390/w17081167/s1, Table S1: Dissolved N2O concentrations and water physiochemical factors of all the samplings sites in the Yiluo River basin in the dry season; Table S2: Dissolved N2O concentrations and water physiochemical factors of all the samplings sites in the Yiluo River basin in the wet season.

Author Contributions

Conceptualization, C.H.; methodology, H.Z. (Hongli Zhang), C.H., B.J. and Y.L.; software, R.Z. and H.Z. (Honglei Zhu); investigation, H.Z. (Hongli Zhang), H.L., Y.J. and C.H.; writing—original draft preparation, H.Z. (Hongli Zhang); writing—review and editing, C.H., B.J., Y.C., S.L. and H.Z. (Honglei Zhu); visualization, C.H.; supervision, W.G.; and funding acquisition, C.H. and B.J. All authors have read and agreed to the published version of the manuscript.

Funding

The field research in the YRL basin and the geographical analysis were funded by the National Natural Science Foundation of China, grant numbers U21A20192, 32202935, 41601534, and the Natural Science Foundation of Henan, grant number 252300420289.

Data Availability Statement

The original contributions presented in this study are included in the article/Supplementary Materials. Data related to this study are available from the authors upon reasonable request.

Acknowledgments

The authors would like to thank the students (Dan Meng, Jinge Bian, Fanfan Jiang, Lin Yang, Xuelin Wang, Xin Zhang, and Gaoguang Li) from Henan Normal University for their efforts in the field trips and sample analysis.

Conflicts of Interest

The authors declare no conflicts of interest.

References

  1. Quoc, B.N.; Cavanaugh, S.K.; Hunt, K.A.; Bryson, S.J.; Winkler, M.K.H. Impact of aerobic granular sludge sizes and dissolved oxygen concentration on greenhouse gas N2O emission. Water Res. 2024, 255, 121479. [Google Scholar] [CrossRef]
  2. Thompson, R.L.; Lassaletta, L.; Patra, P.K.; Wilson, C.; Wells, K.C.; Gressent, A.; Koffi, E.N.; Chipperfield, M.P.; Winiwarter, W.; Davidson, E.A.; et al. Acceleration of global N2O emissions seen from two decades of atmospheric inversion. Nat. Clim. Change 2019, 9, 993–998. [Google Scholar] [CrossRef]
  3. Beaulieu, J.J.; Christopher, T.N.; Young, J.L. Controls on nitrous oxide production and consumption in reservoirs of the Ohio River Basin. J. Geophys. Res. Biogeosci. 2015, 120, 1995–2010. [Google Scholar] [CrossRef]
  4. Turner, P.A.; Griffis, T.J.; Lee, X.; Baker, J.M.; Venterea, R.T.; Wood, J.D. Indirect nitrous oxide emissions from streams within the US Corn Belt scale with stream order. Proc. Natl. Acad. Sci. USA 2015, 112, 9839–9843. [Google Scholar] [CrossRef]
  5. Campeau, A.; del Giorgio, P.A. Patterns in CH4 and CO2 concentrations across boreal rivers: Major drivers and implications for fluvial greenhouse emissions under climate change scenarios. Glob. Change Biol. 2014, 20, 1075–1088. [Google Scholar] [CrossRef]
  6. Battin, T.J.; Lauerwald, R.; Bernhardt, E.S.; Bertuzzo, E.; Gener, L.G.; Hall, R.O.; Hotchkiss, E.R.; Maavara, T.; Pavelsky, T.M.; Ran, L.; et al. River ecosystem metabolism and carbon biogeochemistry in a changing world. Nature 2023, 613, 449–459. [Google Scholar] [CrossRef] [PubMed]
  7. Harrison, J.A.; Matson, P.A.; Fendorf, S.E. Effects of a diel oxygen cycle on nitrogen transformations and greenhouse gas emissions in a eutrophied subtropical stream. Aquat. Sci. 2005, 67, 308–315. [Google Scholar] [CrossRef]
  8. Wang, J.; Chen, N.; Yan, W.; Wang, B.; Yang, L. Effect of dissolver oxygen and nitrogen on emission of N2O from rivers in china. Atmos. Environ. 2015, 103, 347–356. [Google Scholar] [CrossRef]
  9. Beaulieua, J.J.; Tank, J.L.; Hamilton, S.K.; Wollheim, W.M.; Hall, R.O., Jr.; Mulholland, P.J.; Peterson, B.J.; Ashkenas, L.R.; Cooper, L.W.; Dahm, C.N.; et al. Nitrous oxide emission from denitrification in stream and river network. Proc. Natl. Acad. Sci. USA 2011, 108, 214–219. [Google Scholar] [CrossRef]
  10. Anderson, B.; Bartlett, K.; Frolking, S.; Hayhoe, K.; Jenkins, J.; Salas, W. Methane and Nitrous Oxide Emissions from Natural Sources; US EPA, EPA 430-R-10-001; Office of Atmospheric Programs: Washington, DC, USA, 2010.
  11. Liu, S.; Hu, K.; Xie, Z.; Wang, Y.; You, Y. Redistribution of dissolved inorganic nitrogen loading and transport in global rivers via surface water regulation. Sci. Total Environ. 2025, 963, 178546. [Google Scholar] [CrossRef]
  12. Baulch, H.M.; Schiff, S.L.; Maranger, R.; Dillon, P.J. Nitrogen enrichment and the emission of nitrous oxide from streams. Glob. Biogeochem. Cycles 2011, 25, GB4013. [Google Scholar] [CrossRef]
  13. Megonigal, J.P.; Hines, M.E.; Visscher, P.T. Anaerobic metabolism: Linkages totrace gases and aerobic processes. In Treatise on Geochemistry; Elsevier: Amsterdam, The Netherlands, 2004; pp. 273–359. [Google Scholar]
  14. Sen, I.S.; Boral, S.; Ranjan, S.; Tandon, S.K. Small but important: The role of small floodplain tributaries to river nutrient budgets. ACS Earth Space Chem. 2018, 2, 64–71. [Google Scholar] [CrossRef]
  15. Chow, M.; Huang, J.C.; Shiah, F.K. Phosphorus dynamics along river continuum during typhoon storm events. Water 2017, 9, 537. [Google Scholar] [CrossRef]
  16. Mosher, J.J.; Kaplan, L.A.; Podgorski, D.C.; McKenna, A.M.; Marshall, A.G. Longitudinal shifts in dissolved organic matter chemogeography and chemodiversity within headwater streams: A river continuum reprise. Biogeochemistry 2015, 124, 371–385. [Google Scholar] [CrossRef]
  17. Lemley, D.A.; Taljaard, S.; Adams, J.B.; Strydom, N. Nutrient characterisation of river inflow into the estuaries of the Gouritz Water Management Area, South Africa. Water SA 2014, 40, 687–697. [Google Scholar] [CrossRef]
  18. Wang, Y.; Wang, Z.-L. Shifts of sediment microbial community structure along a salinized and degraded river continuum. J. Coast. Res. 2018, 342, 443–450. [Google Scholar] [CrossRef]
  19. Billen, G.; Garnier, J.; Némery, J.; Sebilo, M.; Sferratore, A.; Barles, S.; Benoit, P.; Benoît, M. A long-term view of nutrient transfers through the Seine river continuum. Sci. Total Environ. 2007, 375, 80–97. [Google Scholar] [CrossRef]
  20. Mwanake, R.M.; Gettel, G.M.; Aho, K.S.; Namwaya, D.W.; Masese, F.O.; Butterbach-Bahl, K.; Raymond, P.A. Land ue, not stream order, controls N2O concentration and Flux in the Upper Mara River Basin, Kenya. J. Geophys. Res.-Biogeosci. 2019, 124, 3491–3506. [Google Scholar] [CrossRef]
  21. Bussi, G.; Janes, V.; Whitehead, P.G.; Dadson, S.J.; Holman, I.P. Dynamic response of land use and river nutrient concentration to long-term climatic changes. Sci. Total Environ. 2017, 590–591, 818–831. [Google Scholar] [CrossRef]
  22. Castillo, M.M. Land use and topography as predictors of nutrient levels in a tropical catchment. Limnologica 2010, 40, 322–329. [Google Scholar] [CrossRef]
  23. He, Y.; Wang, X.; Chen, H.; Yuan, X.; Wu, N.; Zhang, Y.; Yue, J.; Zhang, Q.; Diao, Y.; Zhou, L. Effect of watershed urbanization on N2O emissions from the Chongqing metropolitan river network, China. Atmos. Environ. 2017, 171, 70–81. [Google Scholar] [CrossRef]
  24. Maavara, T.; Lauerwald, R.; Laruelle, G.G.; Akbarzadeh, Z.; Bouskill, N.J.; Van Cappellen, P.; Regnier, P. Nitrous oxide emissions from inland waters: Are IPCC estimates too high? Glob. Change Biol. 2018, 25, 473–488. [Google Scholar] [CrossRef] [PubMed]
  25. Yao, Y.; Tian, H.; Shi, H.; Pan, S.; Xu, R.; Pan, N.; Canadell, J.G. Increased global nitrous oxide emissions from streams and rivers in the Anthropocene. Nat. Clim. Change 2019, 10, 138–142. [Google Scholar] [CrossRef]
  26. Davidson, E.A. The contribution of manure and fertilizer nitrogen to atmospheric nitrous oxide since 1860. Nat. Geosci. 2009, 2, 659–662. [Google Scholar] [CrossRef]
  27. Yu, Z.; Deng, H.; Wang, D.; Ye, M.; Tan, Y.; Li, Y.; Chen, Z.; Xu, S. Nitrous oxide emissions in the Shanghai river network implications for the effects of urban sewage and IPCC methodology. Glob. Change Biol. 2013, 19, 2999–3010. [Google Scholar] [CrossRef]
  28. Song, K.; Senbati, Y.; Li, L.; Zhao, X.; Xue, Y.; Deng, M. Distinctive microbial processes and controlling factors related to indirect N2O emission from agricultural and urban rivers in Taihu watershed. Environ. Sci. Technol. 2022, 56, 4642–4654. [Google Scholar] [CrossRef]
  29. Liu, X.; Dai, X.; Zhong, Y.; Li, J.; Wang, P. Analysis of changes in the relationship between precipitation and streamflow in the Yiluo River, China. Theor. Appl. Climatol. 2013, 114, 183–191. [Google Scholar] [CrossRef]
  30. Upstill-Goddard, R.C.; Salter, M.E.; Mann, P.J.; Barnes, J.; Poulsen, J.; Dinga, B.; Fiske, G.J.; Holmes, R.M. The riverine source of CH4 and N2O from the Republic of Congo, western Congo Basin. Biogeosciemces 2017, 14, 2267–2281. [Google Scholar] [CrossRef]
  31. Mengis, M.; Gächter, R.; Wehrli, B. Sources and sinks of nitrous oxide (N2O) in deep lakes. Biogeochemistry 1997, 38, 281–301. [Google Scholar] [CrossRef]
  32. Guo, Y.; Song, C.; Wang, L.; Tan, W.; Wang, X.; Cui, Q.; Wan, Z. Concentrations, sources, and export of dissolved CH4 and CO2 in rivers of the permafrost wetlands, northeast China. Ecol. Eng. 2016, 90, 491–497. [Google Scholar] [CrossRef]
  33. Wiesenburg, D.A.; Guinasso, N.L. Equilibrium solubilities of methane, carbon monoxide, and hydrogen in water and sea water. J. Chem. Eng. Data 1979, 24, 356–360. [Google Scholar] [CrossRef]
  34. Weiss, R.F.; Price, B.A. Nitrous oxide solubility in water and seawater. Mar. Chem. 1980, 8, 347–359. [Google Scholar] [CrossRef]
  35. Hama-Aziz, Z.Q.; Hiscock, K.M.; Cooper, R.J. Indirect nitrous oxide emission factors for agricultural field drains and headwater streams. Environ. Sci. Technol. 2016, 51, 301–307. [Google Scholar] [CrossRef] [PubMed]
  36. Qin, X.; Li, Y.; Goldberg, S.; Wan, Y.; Fan, M.; Liao, Y.; Wang, B.; Gao, Q.; Li, Y.-E. Assessment of indirect N2O emission factors from agricultural river networks based on long-term study at high temporal resolution. Environ. Sci. Technol. 2019, 53, 10781–10791. [Google Scholar] [CrossRef]
  37. de Angelis, M.A.; Gordon, L.I. Upwelling and river runoff as sources of dissolved nitrous oxide to the Alsea estuary, Oregon. Estuar. Coast. Shelf Sci. 1985, 20, 375–386. [Google Scholar] [CrossRef]
  38. Huo, P.; Liu, Y.; Xu, C.; Zhang, X.; Jia, H.; Gao, P. Characteristics of dissolved N2O and indirect N2O emission factor in the groundwater of high nitrate leaching areas in northwest China. Sci. Total Environ. 2023, 868, 161641. [Google Scholar] [CrossRef]
  39. Hu, M.; Li, B.; Wu, K.; Zhang, Y.; Wu, H.; Zhou, J.; Chen, D. Modeling riverine N2O Sources, fates, and emission factors in a typical river network of eastern China. Environ. Sci. Technol. 2021, 55, 13356–13365. [Google Scholar] [CrossRef]
  40. Vilain, G.; Garnier, J.; Passy, P.; Silvestre, M.; Billen, G. Budget of N2O emissions at the watershed scale: Role of land cover and topography (the Orgeval basin, France). Biogeosciences 2012, 9, 1085–1097. [Google Scholar] [CrossRef]
  41. Wilcock, R.J.; Sorrell, B.K. Emissions of greenhouse gases CH4 and N2O from low-gradient streams in agriculturally developed catchments. Water Air Soil Pollut. 2008, 188, 155–170. [Google Scholar] [CrossRef]
  42. Nguyen, A.T.; Némery, J.; Gratiot, N.; Dao, T.-S.; Le, T.T.M.; Baduel, C.; Garnier, J. Does eutrophication enhance greenhouse gas emissions in urbanized tropical estuaries? Environ. Pollut. 2022, 303, 119105. [Google Scholar] [CrossRef]
  43. Mao, B.; Wang, X.; Jia, S.; Liu, Z. Multi-methods to investigate the baseflow: Insight from watershed scale spatiotemporal variety perspective. Ecol. Indic. 2024, 158, 111573. [Google Scholar] [CrossRef]
  44. Shi, G.; Peng, C.; Wang, M.; Shi, S.; Yang, Y.; Chu, J.; Zhang, J.; Lin, G.; Shen, Y.; Zhu, Q. The spatial and temporal distribution of dissolved organic carbon exported from three Chinese rivers to the China Sea. PLoS ONE 2016, 11, e0165039. [Google Scholar] [CrossRef]
  45. Quick, A.M.; Reeder, W.J.; Farrell, T.B.; Tonina, D.; Feris, K.P.; Benner, S.G. Nitrous oxide from streams and rivers: A review of primary biogeochemical pathways and environmental variables. Earth-Sci. Rev. 2019, 191, 224–262. [Google Scholar] [CrossRef]
  46. Wang, S.; Li, S.; Ji, M.; Li, J.; Huang, J.; Dang, Z.; Jiang, Z.; Zhang, S.; Zhu, X.; Ji, G. Long-neglected contribution of nitrification to N2O emissions in the Yellow River. Environ. Pollut. 2024, 351, 124099. [Google Scholar] [CrossRef] [PubMed]
  47. Zhang, M.; Daraz, U.; Sun, Q.; Chen, P.; Wei, X. Denitrifier abundance and community composition linked to denitrification potential in river sediments. Environ. Sci. Pollut. Res. 2021, 28, 51928–51939. [Google Scholar] [CrossRef]
  48. Zhang, Y.; Song, C.; Zhou, Z.; Cao, X.; Zhou, Y. Coupling between nitrification and denitrification as well as its effect on phosphorus release in sediments of Chinese shallow lakes. Water 2019, 11, 1809. [Google Scholar] [CrossRef]
  49. Mehnaz, K.R.; Dijkstra, F.A. Denitrification and associated N2O emissions are limited by phosphorus availability in a grassland soil. Geoderma 2016, 284, 34–41. [Google Scholar] [CrossRef]
  50. O’Neill, R.M.; Duff, A.M.; Brennan, F.P.; Gebremichael, A.W.; Girkin, N.T.; Lanigan, G.J.; Krol, D.J.; Wall, D.P.; Renou-Wilson, F.; Müller, C.; et al. Linking long-term soil phosphorus management to microbial communities involved in nitrogen reactions. Biol. Fertil. Soils 2022, 58, 389–402. [Google Scholar] [CrossRef]
  51. Borges, A.V.; Darchambeau, F.; Lambert, T.; Bouillon, S.; Morana, C.; Brouyère, S.; Hakoun, V.; Jurado, A.; Tseng, H.C.; Descy, J.P.; et al. Effects of agricultural land use on fluvial carbon dioxide, methane and nitrous oxide concentrations in a large European river, the Meuse (Belgium). Sci. Total Environ. 2018, 610–611, 342–355. [Google Scholar] [CrossRef]
  52. Patel, L.; Singh, R.; Thottathil, S.D. Land use drivers of riverine methane dynamics in a tropical river basin, India. Water Res. 2023, 228, 119380. [Google Scholar] [CrossRef]
  53. Que, Z.; Wang, X.; Liu, T.; Wu, S.; He, Y.; Zhou, T.; Yu, L.; Qing, Z.; Chen, H.; Yuan, X. Watershed land use change indirectly dominated the spatial variations of CH4 and N2O emissions from two small suburban rivers. J. Hydrol. 2023, 619, 129357. [Google Scholar] [CrossRef]
  54. Shao, T.; Wang, T. Effects of land use on the characteristics and composition of fluvial chromophoric dissolved organic matter (CDOM) in the Yiluo River watershed, China. Ecol. Indic. 2020, 114, 106332. [Google Scholar] [CrossRef]
  55. Wang, X.; Xu, Y.J.; Liu, Z.; Jia, S.; Mao, B. Spatiotemporal changes of nitrate retention at the interface between surface water and groundwater: Insight from watershed scale in an elevated nitrate region. Hydrol. Process. 2023, 37, e14856. [Google Scholar] [CrossRef]
  56. Fasching, C.; Wilson, H.F.; D’Amario, S.C.; Xenopoulos, M.A. Natural land cover in agricultural catchments alters flood effects on DOM composition and decreases nutrient levels in streams. Ecosystems 2019, 22, 1530–1545. [Google Scholar] [CrossRef]
  57. Hergoualc’h, K.; Akiyama, H.; Bernoux, M.; Chirinda, N.; del Prado, A.; Kasimir, A.; MacDonald, J.D.; Ogle, S.M.; Regina, K.; van der Weerden, T.J. N2O emissions from managed soils, and CO2 emissions from lime and urea application. In 2019 Refinement to the 2006 IPCC Guidelines for National Greenhouse Gas Inventories; Technical Reports; Intergovernmental Panel on Climate Change (IPCC); IPCC: Geneva, Switzerland, 2019. [Google Scholar]
  58. Wang, J.; Wang, G.; Zhang, S.; Xin, Y.; Jiang, C.; Liu, S.; He, X.; McDowell, W.H.; Xia, X. Indirect nitrous oxide emission factors of fluvial networks can be predicted by dissolved organic carbon and nitrate from local to global scales. Glob. Change Biol. 2022, 28, 7270–7285. [Google Scholar] [CrossRef] [PubMed]
  59. Hu, M.; Chen, D.; Dahlgren, R.A. Modeling nitrous oxide emission from rivers: A global assessment. Glob. Change Biol. 2016, 22, 3566–3582. [Google Scholar] [CrossRef]
  60. Quick, A.M.; Reeder, W.J.; Farrell, T.B.; Tonina, D.; Feris, K.P.; Benner, S.G. Controls on nitrous oxide emissions from the hyporheic zones of streams. Environ. Sci. Technol. 2016, 50, 11491–11500. [Google Scholar] [CrossRef]
  61. Taylor, P.G.; Townsend, A.R. Stoichiometric control of organic carbon–nitrate relationships from soils to the sea. Nature 2010, 464, 1178–1181. [Google Scholar] [CrossRef]
  62. Yang, X.; Wang, S.; Zhou, L. Effect of carbon source, C/N ratio, nitrate and dissolved oxygen concentration on nitrite and ammonium production from denitrification process by Pseudomonas stutzeri D6. Bioresour. Technol. 2012, 104, 65–72. [Google Scholar] [CrossRef]
  63. Yi, N.; Gao, Y.; Zhang, Z.; Wang, Y.; Liu, X.; Zhang, L.; Yan, S. Response of spatial patterns of denitrifying bacteria communities to water properties in the stream inlets at Dianchi Lake, China. Int. J. Genom. 2015, 2015, 572121. [Google Scholar] [CrossRef]
  64. Zhang, L.; Yao, X.; Tang, C.; Xu, H.; Jiang, X.; Zhang, Y. Influence of long-term inundation and nutrient addition on denitrification in sandy wetland sediments from Poyang Lake, a large shallow subtropical lake in China. Environ. Pollut. 2016, 219, 440–449. [Google Scholar] [CrossRef] [PubMed]
  65. Zhang, S.B.; Yang, M.J.; Xia, X.H.; Gu, Q.Y.; Gao, Q.; Wang, J.F.; Liu, S.D.; Li, X.K.; Li, Y.J.; Mcdowell, W.H.; et al. Ecological differentiation among nitrous oxide reducers enhances temperature effects on riverine N2O emissions. Glob. Change Biol. 2025, 31, e70096. [Google Scholar] [CrossRef] [PubMed]
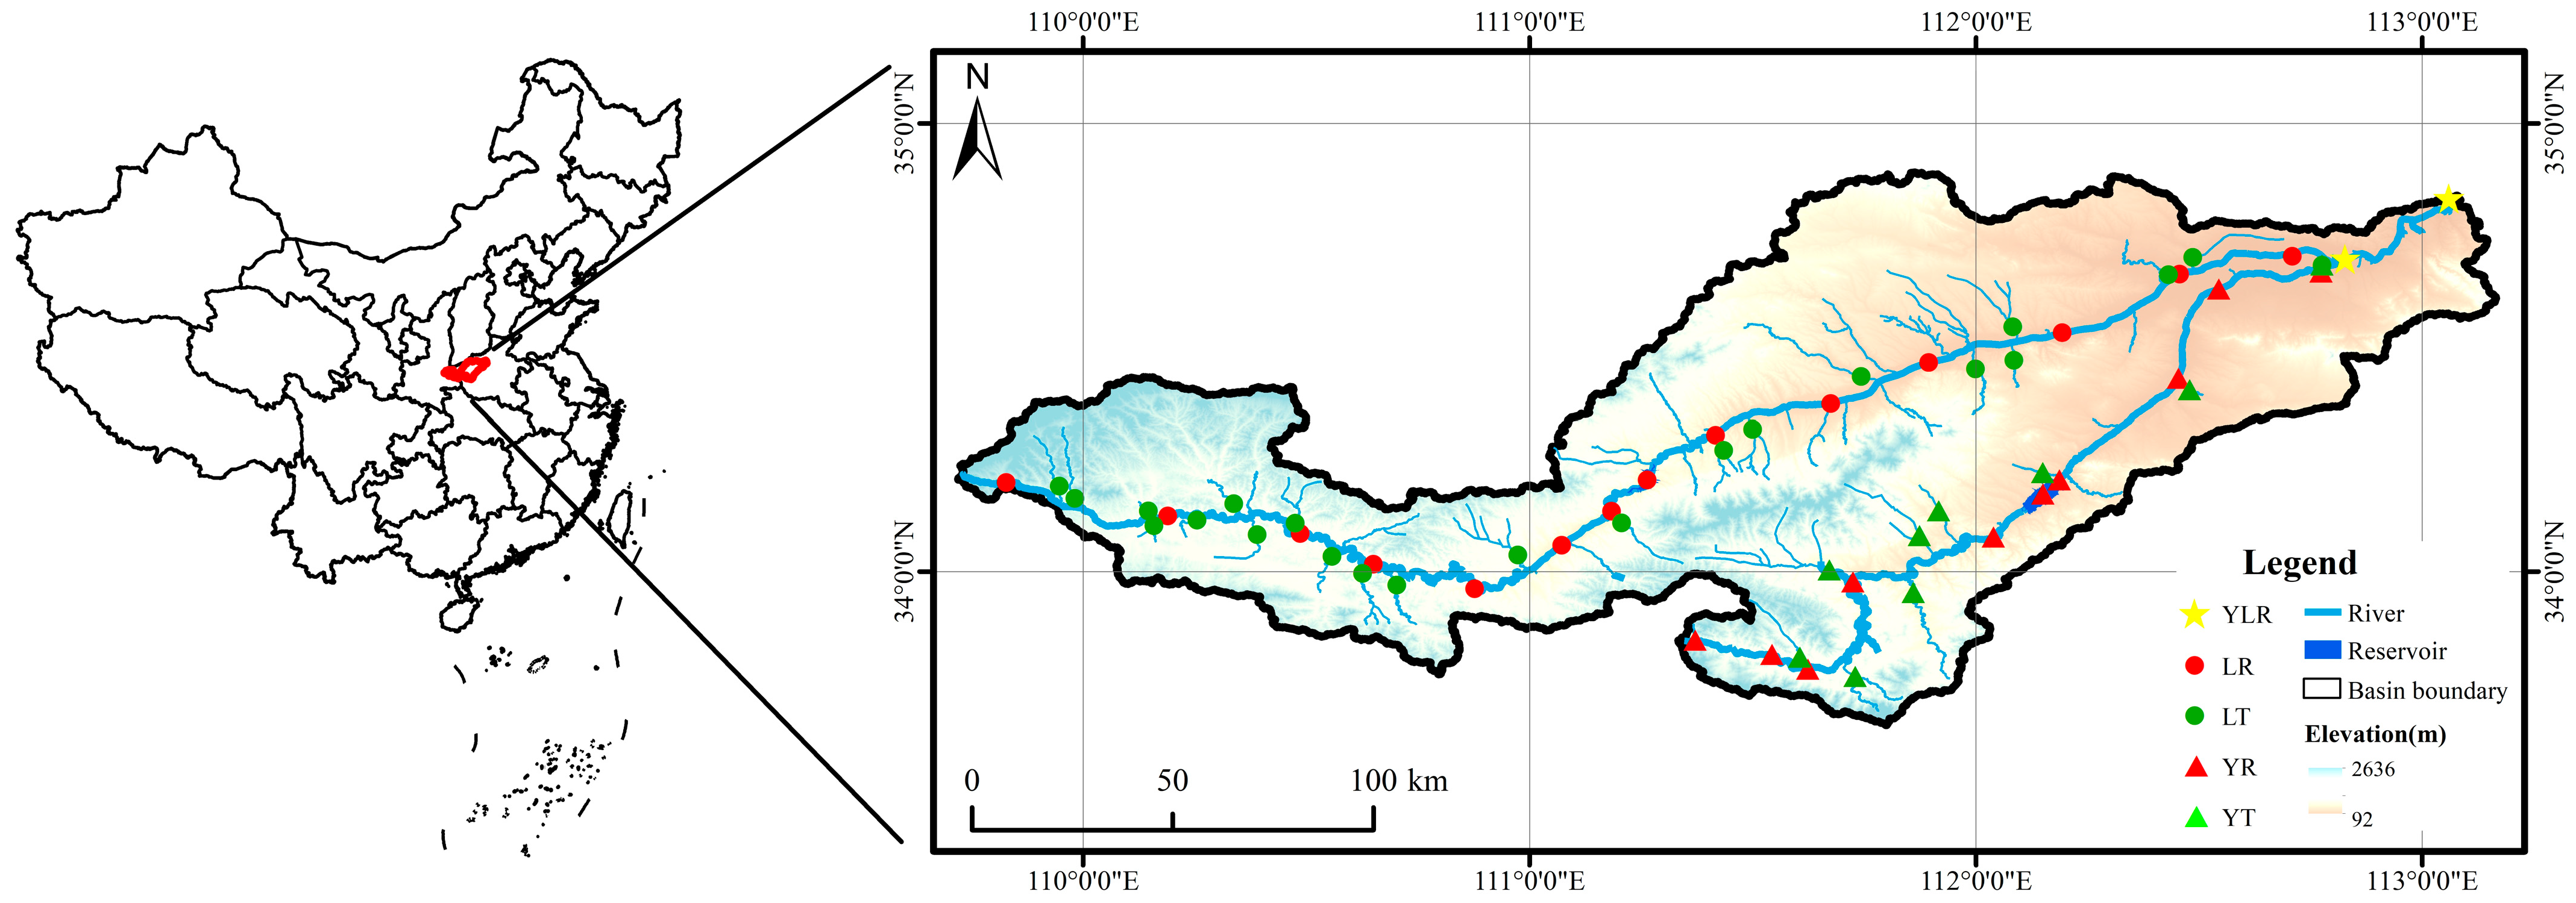
Figure 1. Distribution of the sampling points (YLR means the section after the Luo River and Yi River converge, LR means the Luo River, LT means the tributaries of the Luo River, YR means the Yi River, and YT means the tributaries of the Yi River).
Water 17 01167 g001
Figure 2. N2O concentrations and saturations in the main streams of the YLR basin. (a): N2O concentrations; (b) N2O saturations; ** means significantly different at p < 0.01 according to Wilcoxon signed-rank tests.
Water 17 01167 g002
Figure 3. The associations of the water physicochemical factors with the N2O concentrations across all the samples. (a) the dry season; (b) the wet season; *: p < 0.05, **: p < 0.01, and ***: p < 0.001.
Water 17 01167 g003
Figure 4. The distributions of the different land use types in the subbasins of the tributaries.
Water 17 01167 g004
Figure 5. The comparison of the EF5r values between the two sampling seasons on the basin scale (*** means the values of the two seasons have a significant difference at p < 0.001).
Water 17 01167 g005
Figure 6. The relationships between EF5r and NO3−N or DOC/NO3−N in the sampling seasons. (a) the relationships between EF5r and NO3−N in different seasons; (b) the relationships between EF5r and DOC/NO3−N in different seasons.
Water 17 01167 g006aWater 17 01167 g006b
Table 1. Water quality and environmental factors during the sampling periods and the difference between seasons.
Sampling
Seasons
Ta
(°C)
Tw
(°C)
pHDO
(mg∙L−1)
ORPDIC
(mg∙L−1)
DOC
(mg∙L−1)
NH4+-N
(mg∙L−1)
NO3-N
(mg∙L−1)
DP
(mg∙L−1)
Main streamsDry22.65
(1.06)
18.79
(0.81)
7.99
(0.34)
8.48
(0.11)
186.17
(4.16)
10.96
(0.89)
5.79
(0.21)
0.58
(0.14)
2.70
(0.23)
0.07
(0.01)
Wet14.63
(0.85)
14.78
(0.52)
8.32
(0.18)
8.47
(0.40)
137.23
(5.57)
8.85
(0.40)
6.20
(0.11)
0.30
(0.06)
3.50
(0.23)
0.04
(0.01)
****** ***** ***
TributariesDry21.71
(0.90)
17.43
(0.58)
7.92
(0.38)
8.36
(0.27)
183.85
(3.69)
14.08
(1.38)
6.58
(0.41)
1.27
(0.46)
4.15
(0.68)
0.28
(0.14)
Wet 13.53
(0.68)
14.65
(0.42)
8.10
(0.50)
7.96
(0.54)
122.11
(14.74)
10.93
(0.92)
6.89
(0.41)
0.30
(0.07)
4.87
(0.38)
0.09
(0.04)
******** ***** *
Notes: Numbers in brackets are standard errors of the mean. *, **, and *** represent a significant difference between seasons at p < 0.05, p < 0.01, and p < 0.001, respectively.
Table 2. Results of multiple stepwise regressions for N2O concentrations in different seasons.
Sampling SeasonStepFactors EnteredFpAdjusted R2
Dry1pH28.71<0.0010.340
2pH, NO3-N23.54<0.0010.460
3pH, NO3-N, ORP18.04<0.0010.491
Wet1DP47.01<0.0010.490
2DP, Tw30.09<0.0010.538
3DP, Tw, NH4+-N26.05<0.0010.600
4DP, Tw, NH4+-N, DOC23.26<0.0010.640
Table 3. Spearman analysis results between the different landcover areas and monitored characteristics of the 30 tributaries.
Land UseTaTwpHDOORPDICDOCNH4+-NNO3-NDPN2O
Dry seasonCropland0.523 **0.380 *---0.374 *0.467 *0.532 **--0.438 *
Forest−0.435 *------−0.409 *−0.434 *-−0.595 **
Shrub--0.652 **---−0.484 **−0.579 **−0.676 **-−0.854 **
Grassland--0.420 *-----−0.399 *-−0.475 **
Impervious0.411 *----0.554 **0.572 **0.499 **0.550 **-0.620 **
Total area-0.379 *---------
Wet seasonCropland0.394 *0.534 **-−0.416 *------0.435 *
Forest-−0.461 *0.473 **-0.383 *-----−0.508 **
Shrub−0.584 **−0.557 **-----−0.385 *−0.417 *−0.389 *−0.526 **
Grassland-----------
Impervious0.505 **0.707 **−0.594 **----0.373 *0.372 *-0.527 **
Total area-----0.370 *0.414 *----
Notes: **: p < 0.01, *: p < 0.05, -: p > 0.05.
Disclaimer/Publisher’s Note: The statements, opinions and data contained in all publications are solely those of the individual author(s) and contributor(s) and not of MDPI and/or the editor(s). MDPI and/or the editor(s) disclaim responsibility for any injury to people or property resulting from any ideas, methods, instructions or products referred to in the content.