Article

Spatial–Temporal Distribution Characteristics of the Water Footprint and Water-Saving Potential of Fruit Trees in Tarim River Basin

1
School of Agriculture, Shihezi University, No. 221 Beisi Road, Shihezi 832003, China
2
National and Local Joint Engineering Research Center of Information Management and Application Technology for Modern Agricultural Production (XPCC), Shihezi 832003, China
3
Mosuowan Meteorological Station, Shihezi 830002, China
*
Author to whom correspondence should be addressed.
Water 2025, 17(8), 1158; https://doi.org/10.3390/w17081158
Submission received: 10 February 2025 / Revised: 2 April 2025 / Accepted: 9 April 2025 / Published: 13 April 2025
(This article belongs to the Special Issue Water Footprint and Energy Sustainability)

Abstract

:
It is of great significance to optimize water resource management and promote sustainable development in the Tarim River Basin (TRB) by using the water footprint (WF) evaluation method to evaluate the water shortage of fruit trees in the TRB and analyse its water-saving potential. This study aimed to elucidate the WF spatial–temporal distribution characteristics of fruit trees in the water-limited TRB from 2000 to 2020 and evaluate their water-saving potential capability. The WF was calculated using a combination of irrigation technology simulation and water usage assessments for four different fruit trees (apple, pear, date, and walnut). The results indicate that the green WF (WFgreen) initially increased and then decreased, reaching its lowest value of only 175.09 m3/t in 2020, and decreased by 22.71% from 2000 to 2020. WFblue decreased by 47.13% over the same period. In 2020, the WFblue of date and walnut accounted for a higher percentage of WFblue. WFblue significantly exceeded WFgreen, indicating their high water consumption and the limited adoption of water-saving technologies in the study area. Due to the increase in fruit tree planting area and fertilization, WFgrey exhibited an overall upward trend. Meanwhile, the total WF (WFtotal) indicated a general downward trend, though the walnut tree had the highest WFtotal at 2.21 × 10⁵ m3/t, indicating the popularization of water-saving technology. The results show that, taking 2020 as the baseline, the WFblue of the four fruit trees in the TRB was 2.64 × 10⁵ m3/t (accounting for 89.1%), total WFblue decreased by 0.73 × 10⁵ m3/t (a decrease of 48.38%) after drip irrigation, and the water-saving potential in the five prefectures of the TRB was in the range of 38.55–56.18%. Therefore, the promotion of drip irrigation technology plays a key role in alleviating the water pressure of fruit trees and promoting the sustainable utilization of water resources in the TRB.

1. Introduction

The Tarim River Basin (TRB) is one of the significant fruit-tree-growing areas in China. It has a severe shortage of water resources, with only 0.38–0.52 water use efficiency [1,2]. In recent decades, the cultivated area of the TRB reached approximately 2.03 × 10⁶ ha, with over 50% (1.04 × 10⁶ ha) of this area growing fruit trees using flood irrigation, leading to an increasing imbalance between agricultural water demand and water supply in the region, and a severe water shortage issue [3]. Therefore, understanding the spatial–temporal characteristics of fruit trees’ water use in the TRB is crucial for optimizing the rational adjustment of planting structure and alleviating the water resource shortage.
Fruit trees are highly dependent on the sustainable utilization and management of water resources. Trees receive water from various sources, such as rainfall, groundwater, and irrigation [4]. Current trends in climate change, including rising temperatures and changes in rainfall patterns, have increased human demand for water resources, and the rapid depletion of groundwater resources has further exacerbated the pressure on water supply [5]. In extremely arid regions, at least 90% of orchards rely on irrigation for survival [6]. Relevant studies have found that trees consume more water than short vegetation [7], especially trees bearing fruit with higher economic value, such as apples, pears, peaches, and grapes, which are mainly distributed in semi-arid and arid hills, mountains, beaches, and saline-alkali areas. These areas have complex terrain, a lack of water resources, and high irrigation costs. Meanwhile, fruit trees with significant ecological and economic benefits need a suitable water environment and a perfect management system [8]. Most fruit trees still use the traditional flood irrigation method, which has low water use efficiency. Flood irrigation often provides more water than the actual demand of crops, especially in sandy soil, which can cause a large amount of underground leakage, which not only wastes water resources but also leads to the loss of nutrients. In addition, long-term use of flood irrigation in arid areas can cause soil hardening and secondary salinization, thus reducing crop yield and soil [9,10]. Additionally, quantifying the water consumption of trees is highly important to reduce water consumption and alleviate water stress [4].
Water footprint (WF) is a key tool to quantify water consumption from the life cycle perspective. It can improve water resource management, aid the determination of strategies to reduce total water consumption, and reduce the impact of product-related water shortages, and it is composed of the blue WF (WFblue), green WF (WFgreen), and grey WF (WFgrey) [11,12]. Surface water and groundwater are the main sources of WFblue. WFgreen refers to the water absorbed and stored in the root zone after precipitation falls on plants. WFgrey refers to the amount of freshwater required to treat pollutant to reach the standard level [13]. Estimating water use for fruit trees has primarily been achieved through the Penman–Monteith method under different climatic conditions, which may underestimate the actual level of WFblue [14], and few studies have focused on regional-scale irrigation water use, especially basin-scale irrigation water demand [15]. In addition, most studies focus on coastal areas with relatively humid natural climates, while few studies are conducted in the inland areas characterized by drought and water shortages [16]. We obtained the real irrigation plan of farmers and calculated the WF through field research to solve this problem. Studies have indicated that WFblue accounts for approximately 50% of the total WF (WFtotal) in citrus production in arid areas [17], and irrigation consumes approximately 62% of the available surface water [18]. The above research reveals that the spatial–temporal characteristics of the water resource utilization of fruit trees based on the WF have the potential to be evaluated, and actions need to be taken to improve the efficiency of water resource utilization.
Fruit trees have a relatively high water demand, and drip irrigation has been indicated to significantly reduce crop water consumption (CWA), improve water use efficiency, and significantly reduce blue water consumption [13]. Moreover, some studies have demonstrated that even if the irrigation demand and its efficiency remain unchanged, there would be a shortage of water resources [19]. Currently, the utilization efficiency of water resources in the TRB is low. Reducing the water resources consumed per unit area is an effective way to improve the utilization efficiency of agricultural water resources [20]. As a result, combining the WF method and drip irrigation technology can improve the utilization efficiency of irrigation water and reduce WFblue based on the current irrigation methods.
Quantifying the irrigation water demand of fruit trees and improving water use efficiency are the key factors to alleviate the high water demand of fruit trees in arid areas. Previous studies on the water footprint have double limitations: first, the research objects are mostly concentrated in humid climate areas, and water footprint evaluation methods based on the Penman–Monteith formula may lead to an underestimation of the actual level of the blue water footprint; second, there are few studies on inland arid areas, and few studies have analysed the development trend of the irrigation water consumption of fruit trees and the water-saving potentials of fruit trees for the future [14,18,21]. Therefore, in order to fill this gap, this study obtained the actual water consumption of fruit trees through field research for subsequent research. In this study, four types of fruit trees, apple, pear, date, and walnut, in five prefectures of the TRB were taken as research objects. Based on the spatial and temporal evolution characteristics of the water footprint from 2000 to 2020, we constructed a water footprint assessment model integrating meteorological data and irrigation demand, analysed the dynamics of the application of drip irrigation technology for fruit trees in the basin in the past 20 years, and quantitatively evaluated the water-saving potentials of the four types of fruit trees under the scenario of full-drip irrigation. The results of this study will play a key role in alleviating the water pressure of fruit trees in the TRB and promoting the sustainable use of water resources.

2. Materials and Methods
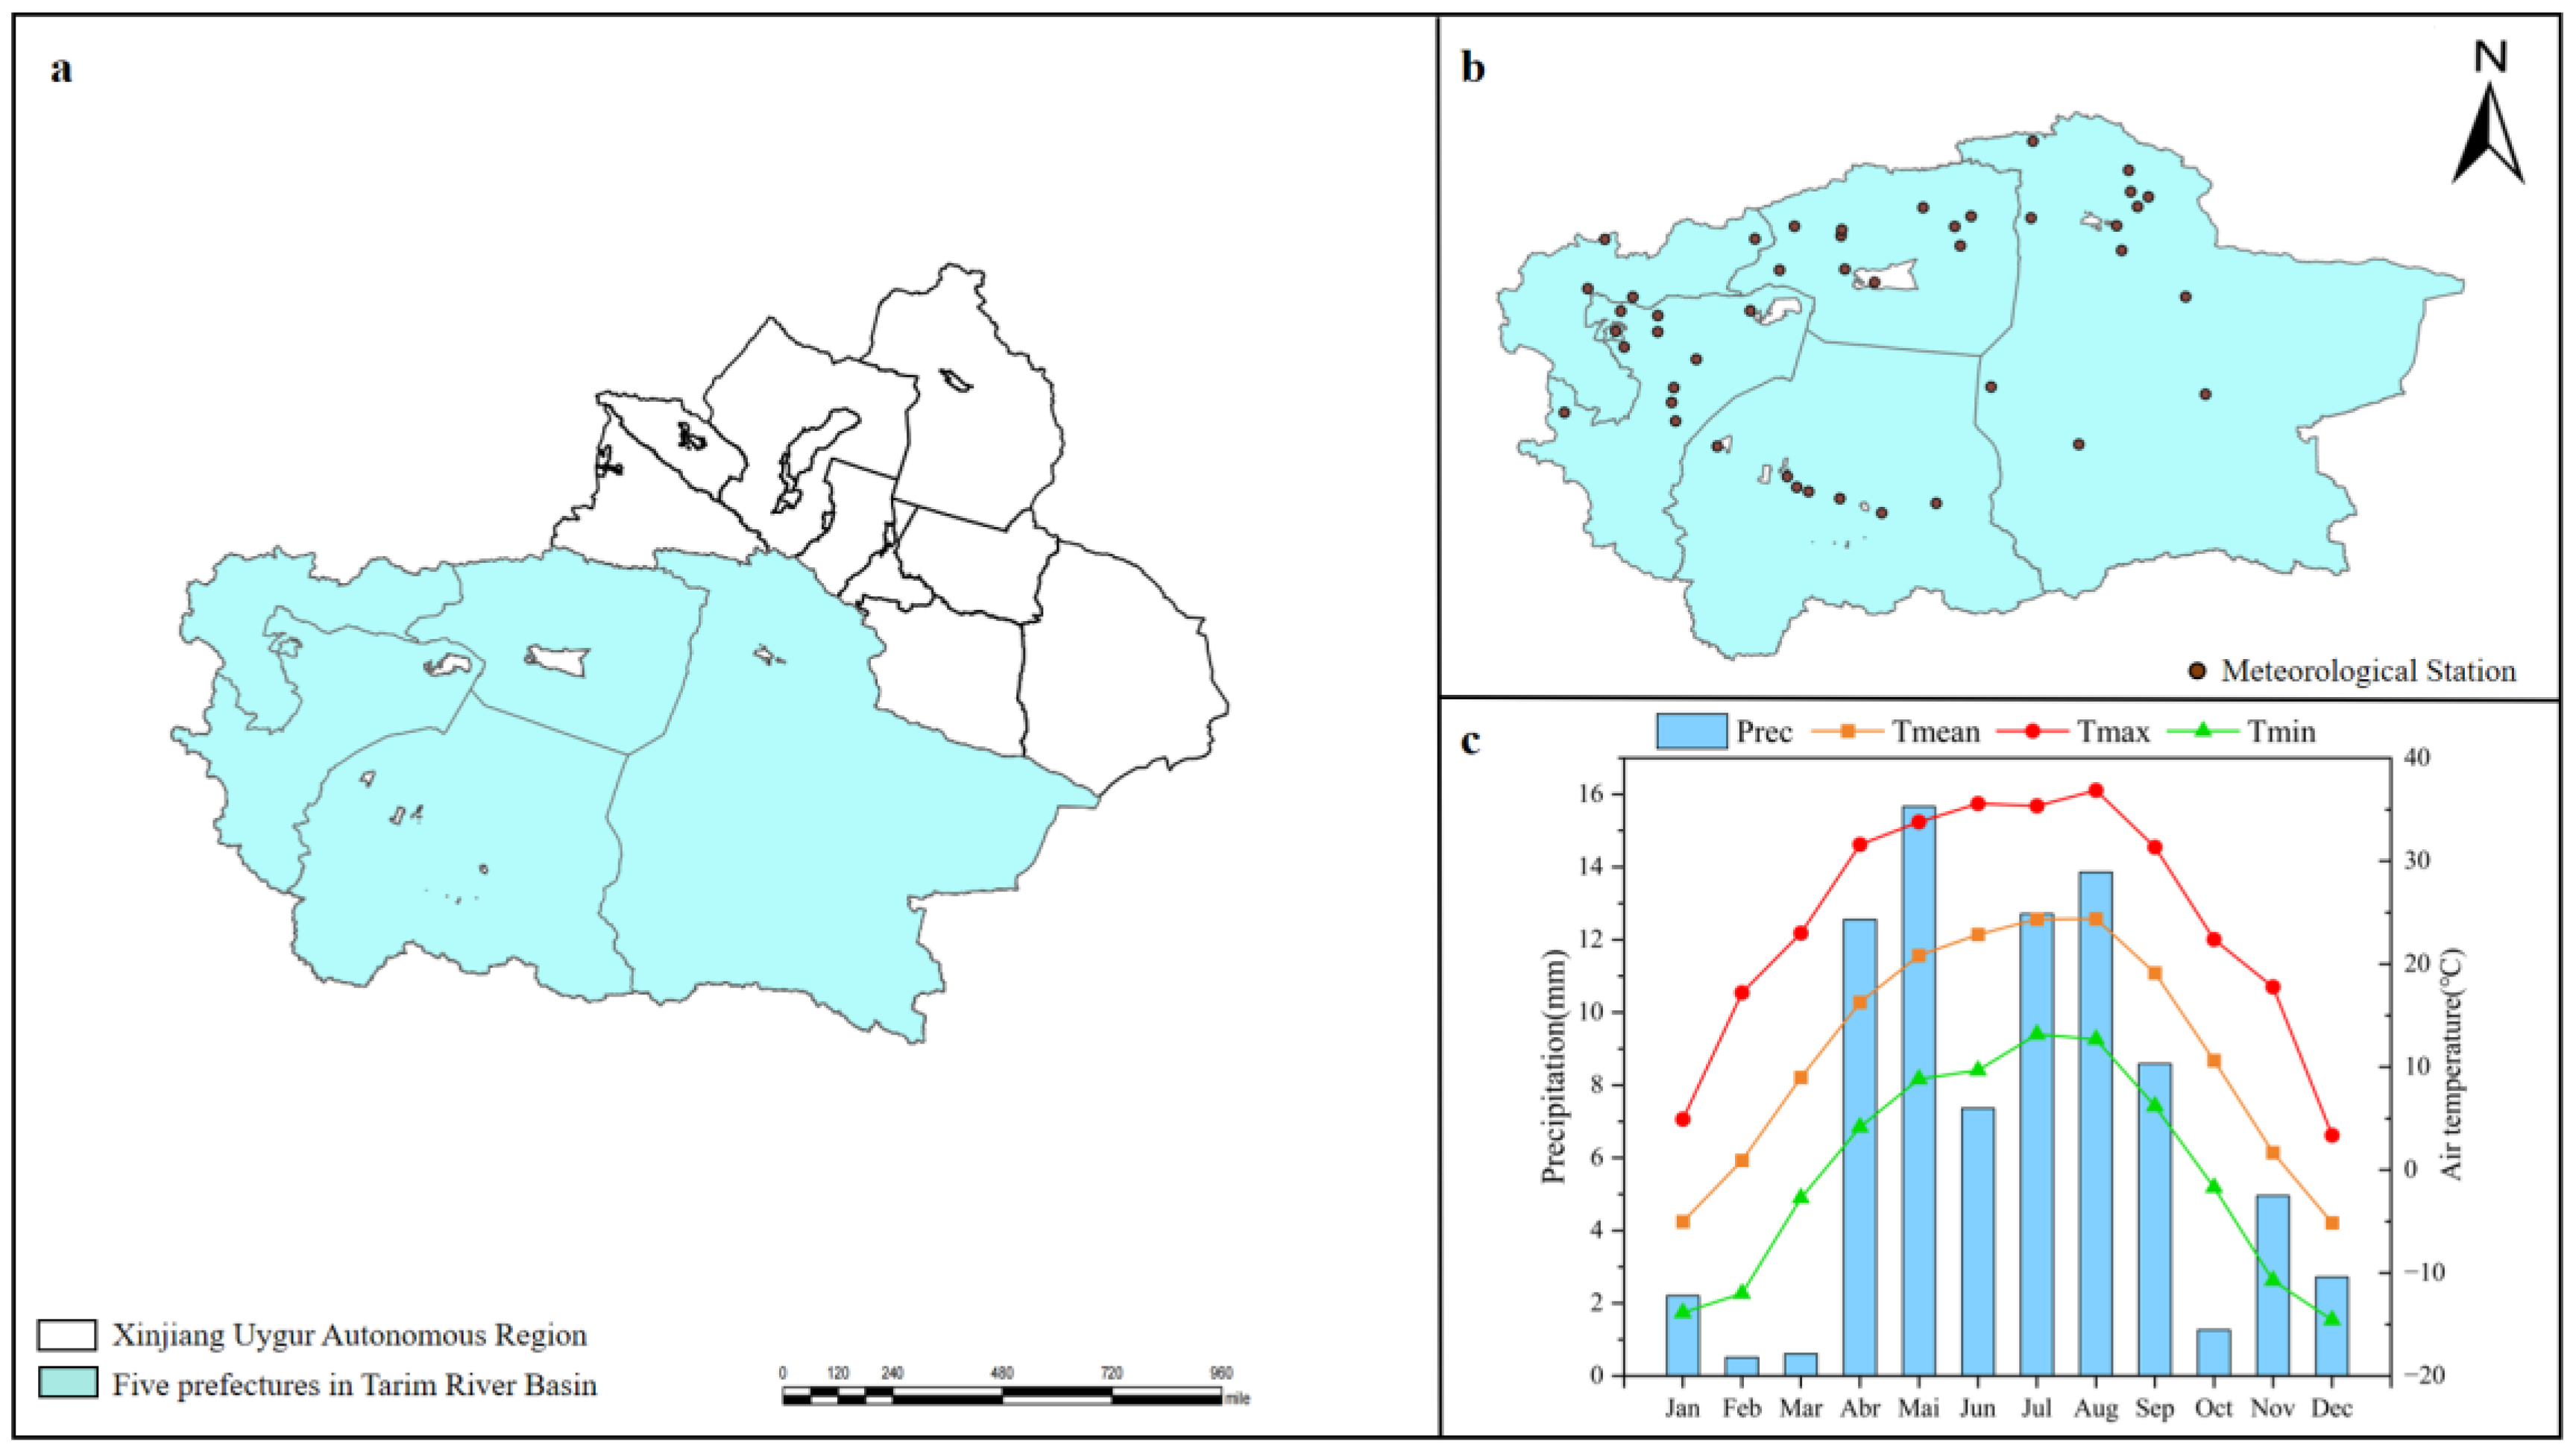
2.1. Study Area

The TRB is located in the southern part of the Xinjiang Uygur Autonomous Region, China (73°10′ E–94°05′ E, 34°55′ N–43°08′ N) (Figure 1a). It is bordered by the Tianshan Mountains to the north, the Kunlun Mountains to the south, and the Pamir Mountains to the west. The basin is located in an inland arid area characterized by extremely low rainfall and high evaporation rates, covering an area of approximately 1,020,000 km2. The annual rainfall is less than 50 mm (Figure 1c), while the potential evaporation exceeds 2000 mm [22]. The regional water resources are extremely scarce, accounting for approximately 37.96 × 10⁸ m3 [23]. The basin covers approximately 64% of the land area and multiple administrative divisions of the Xinjiang Uygur Autonomous Region, including five autonomous prefectures (Bayingolin Mongolian Autonomous Prefecture (Ba Prefecture), Kizilsu Kyrgyz Autonomous Prefecture (Kizilsu Prefecture), Kashgar Prefecture, Aksu Prefecture, and Hotan Prefecture; Figure 1b) and 42 county-level administrative units.

2.2. Study Data

2.2.1. Agricultural Production Data

Data on planting area and total yield for apple, pear, date, and walnut in the five prefectures of the TRB (2000–2020) were obtained from the Xinjiang Statistical Yearbook, the China Economic and Social Data Platform (https://data.cnki.net/, accessed on 1 August 2024), and the Agriculture and Rural Affairs Bureau of each prefecture.

2.2.2. Water Resource Data

Water resource data, including the total water resources, agricultural water use, actual irrigated area, and irrigation demand for farmland (2000–2020), were obtained from the following sources: Xinjiang Water Resources Bulletin, Water Resources Department of the Xinjiang Uygur Autonomous Region (http://slt.xinjiang.gov.cn/ accessed on 1 August 2024), National Tibetan Plateau/Third Pole Environment Data Center (http://data.tpdc.ac.cn accessed on 1 August 2024), and the Water Resources Bureau of each of the five prefectures in the TRB.
In this study, structured interviews and questionnaires were used to collect data on fruit tree irrigation demand. Data questionnaires were distributed to the Agricultural and Rural Bureau and the Water Conservancy Bureau and other departments of the five counties and cities in the Tarim River Basin, and 3–4 sample points were selected in each county and city for the field survey. The collected data questionnaires and field survey data were summarized and integrated.

2.2.3. Basic Geographic Information and Data

Maps of TRB administrative divisions and basic geographic information (river elevation) were obtained from the Geospatial Data Cloud platform (https://www.gscloud.cn/ accessed on 1 August 2024).

2.2.4. Meteorological Data

Meteorological data were gathered from 44 weather stations within the five prefectures in the TRB. The dataset includes daily maximum temperature, minimum temperature, average temperature, atmospheric pressure, wind speed, sunshine duration, and rainfall, which were obtained from the China Meteorological Data Service Centre (http://data.cma.cn accessed on 1 August 2024) and the Shihezi Meteorological Bureau. After data collection and organization, decimal point errors were corrected in the datasets. Missing data points were interpolated using average values or weighted moving averages.

2.2.5. Data Processing

Microsoft Excel 2016 and CROPWAT 8.0 were used for data processing, Origin 2024 was used for chart drawing, and ArcGIS Pro was used for spatial image drawing.

2.3. Calculation Methods

WF Calculation

The WF calculation for crops and trees follows the methodology outlined in the Water Footprint Assessment Manual [24]. The WFtotal during the tree’s growth is the sum of WFgreen, WFblue, and WFgrey [25]. Based on the statistical yearbook of the Xinjiang Uygur Autonomous Region and the yearbook of Xinjiang Production and Construction Corps, this study focused on four major fruit trees in the TRB to calculate their WF in the five prefectures.
W F t o t a l = W F g r e e n + W F b l u e + W F g r e y
The green component in the WF of growing a tree (WFgreen, m3/ton) is calculated as the green component in crop water use (CWUgreen, m3/ha) divided by the crop yield (Y, ton/ha). The blue component (WFblue, m3/ton) is calculated similarly:
W F g r e e n = C W U g r e e n Y
W F b l u e = C W A b l u e Y
CWAblue represents the actual water consumption and the irrigation demand, not the theoretical evaporation [13]. The green components in crop water use (CWUgreen, m3/ha) are calculated according to the accumulation of daily evapotranspiration (ET, mm/day) over the complete growing period:
C W U g r e e n = 10 × d = 1 l g p E T g r e e n
E T g r e e n = min E T c , P e
ETgreen (mm) represents green water evapotranspiration. Factor 10 is meant to convert water depths in millimeters into water volumes per land surface in m3/ha. The summation is carried out from the day of planting (day 1) to the day of harvest (length of growing period (lgp) in days). Evapotranspiration (ETc; mm/year) represents tree evapotranspiration. Pe (mm/year) represents effective rainfall (Peff).
E T c = k c × E T 0
E T 0 = 0.408 Δ R n G + r 900 T + 273 u 2 ( e s e a ) Δ + r ( 1 + 0.34 u 2 )
P e P × 4.17 0.2 P 4.17                               P 8.3   m m / d 4.17 + 0.1 × P                                       P 8.3   m m / d      
in which ET0 (mm) represents reference evapotranspiration, and kc is the standardized crop coefficient recommended by the FAO. Rn (MJ/(M*d)) represents the daily net radiation at the crop surface, G (MJ/(m2*d)) represents the daily soil heat flux, T represents the daily average temperature (°C), u2 represents the daily average wind speed measured at the height of 2 m (m/s), es represents the daily saturated vapor pressure (kPa), ea represents the daily actual vapor pressure (kPa), Δ represents the slope of the saturated vapor pressure curve with air temperature (kPa/°C), r represents the psychrometric constant (kPa/°C), and P represents the daily rainfall (mm).
The grey component in the WF of growing a tree (WFgrey, m3/ton) is calculated as the rate of chemical application to the field per hectare (AR, kg/ha) times the leaching–run-off fraction (α) divided by the maximum acceptable concentration (Cmax, kg/m3) minus the natural concentration for the pollutant considered (Cnat, kg/m3) and then divided by the crop yield (Y, ton/ha). This study only considered the application rate of nitrogen fertilizer.
W F g r e y = ( α × A R ) / ( C m a x C n a t ) Y
The water-saving potential is calculated according to the difference between the current and minimum water consumption (Formula (10)).
W i j = m n A i j × ( C W A i j c C W A i j d )
where i and j mean the tree and the region, respectively. m and n mean the starting and ending year, respectively. c means actual irrigation demand, and d means drip irrigation demand.

3. Results

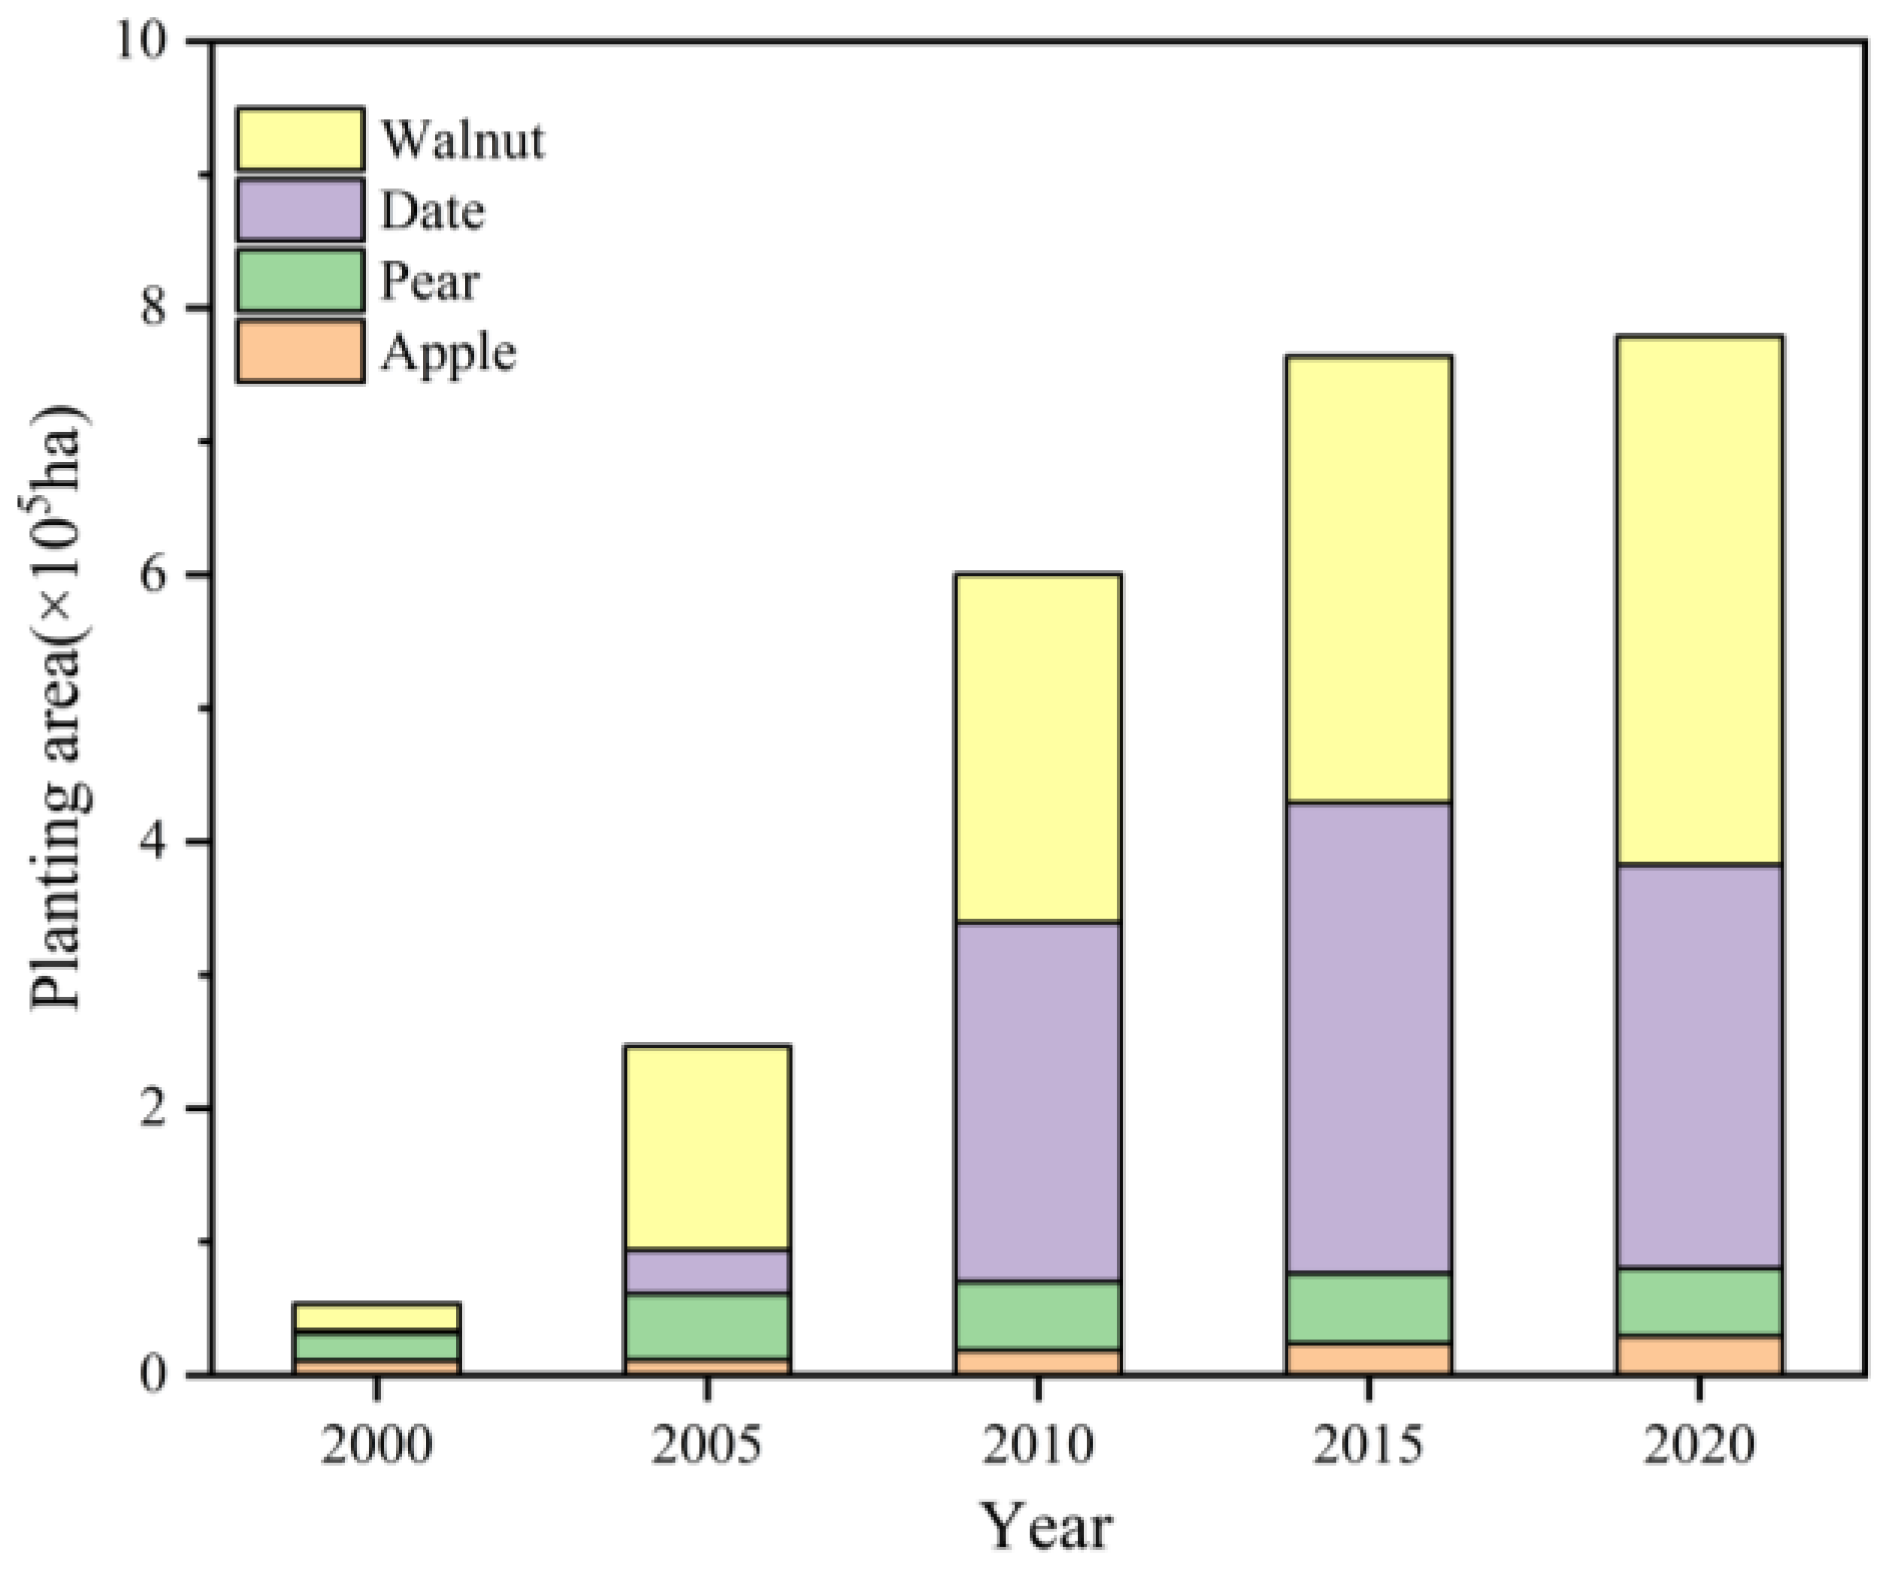
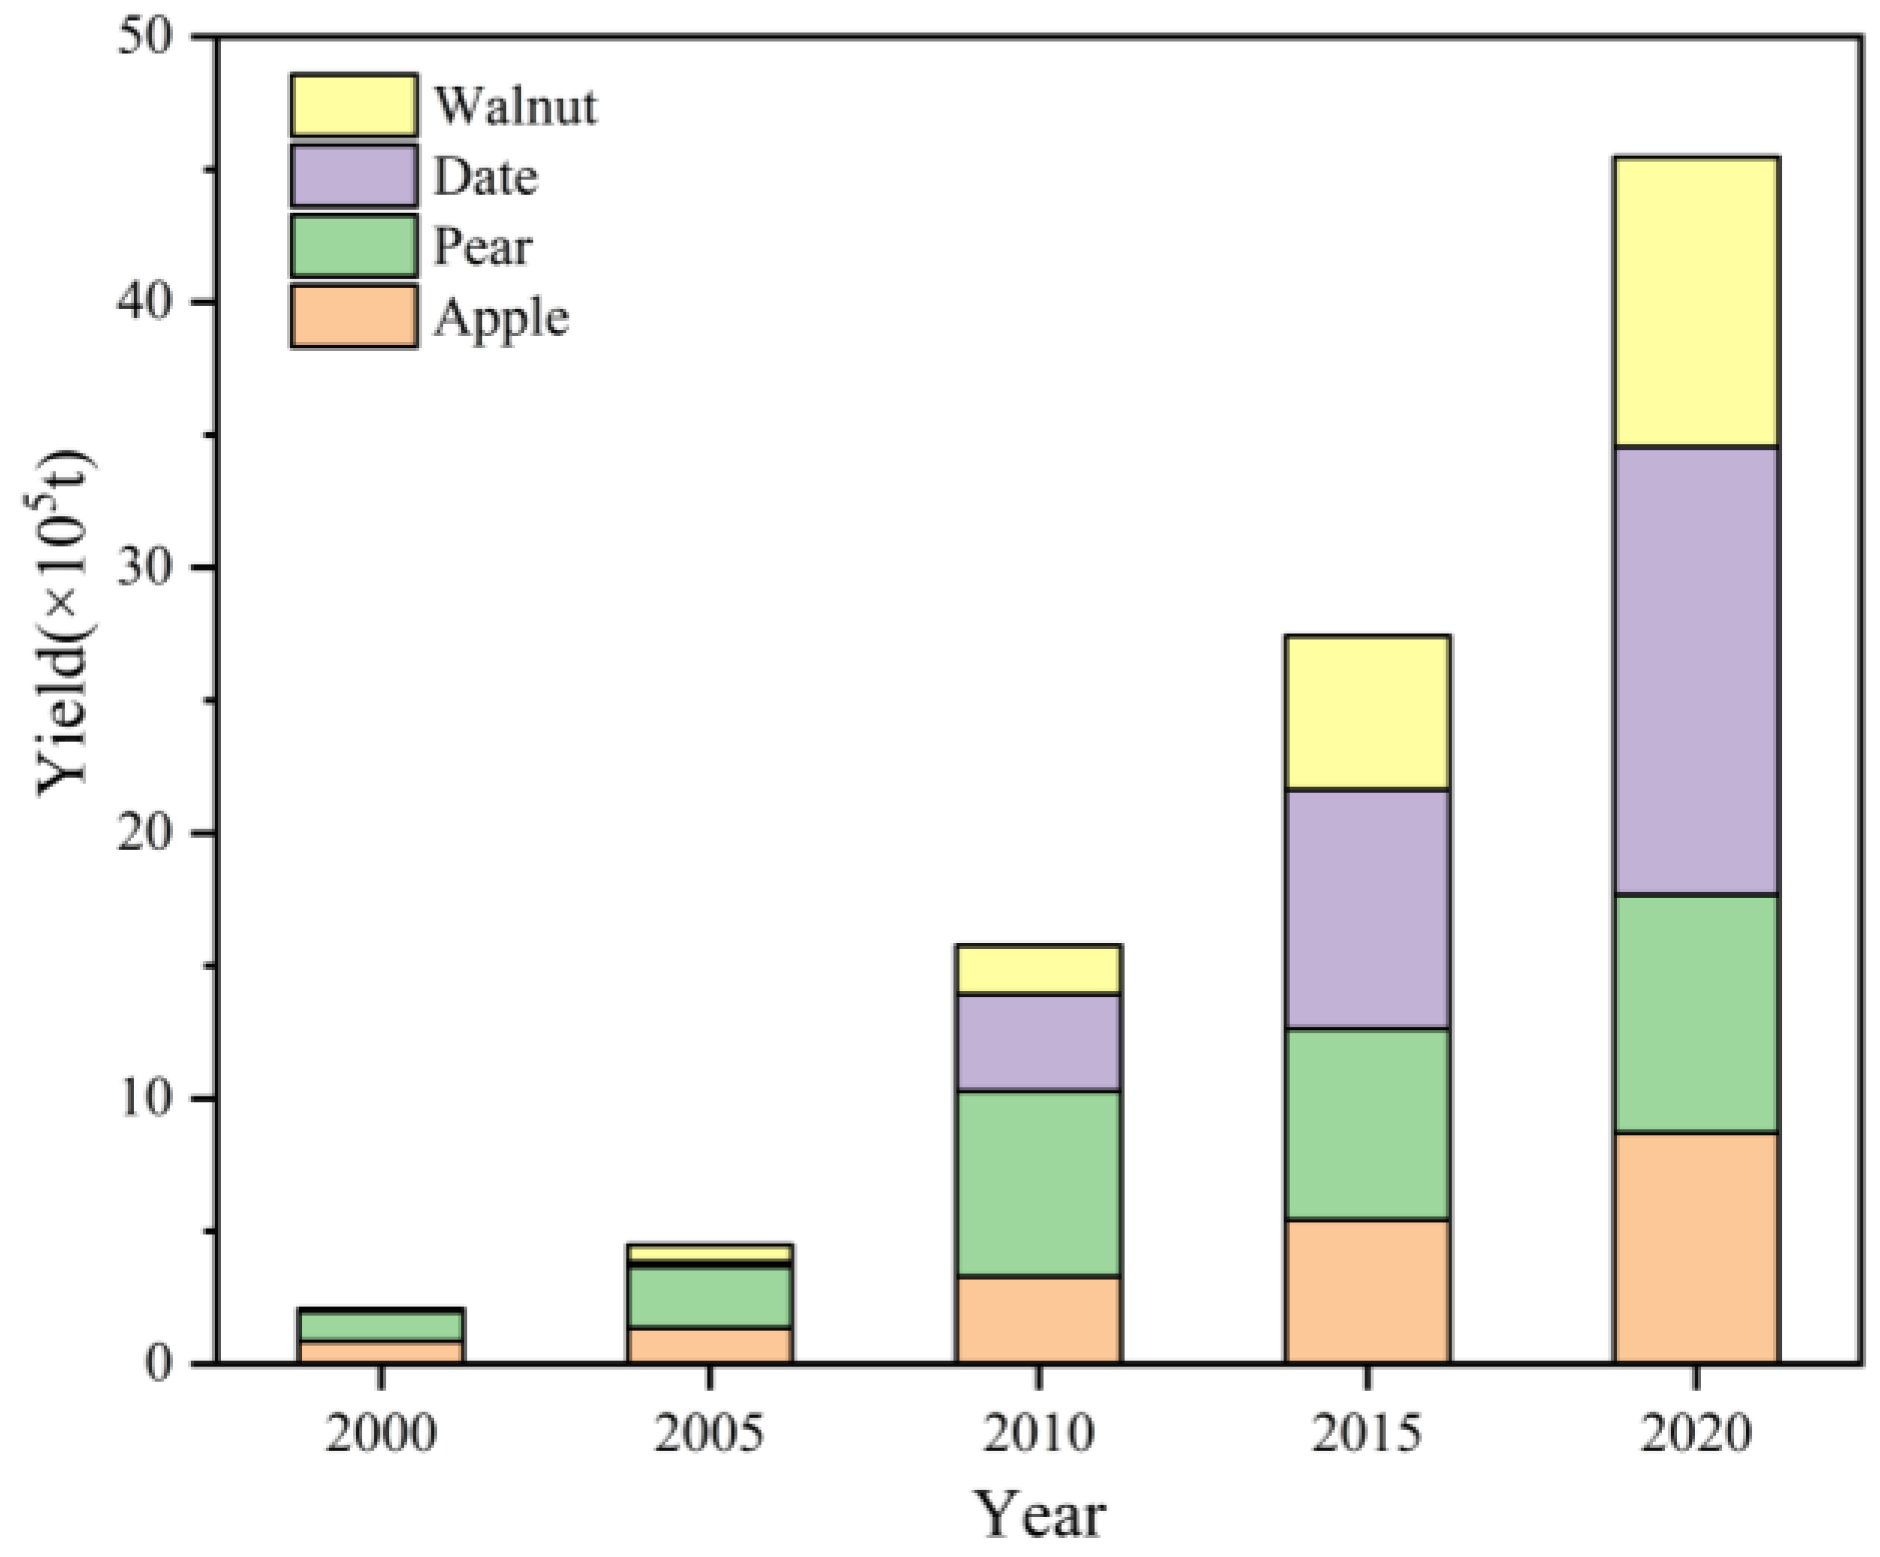
3.1. Analysis of Planting Area and Yield of Main Fruit Trees in Five Prefectures of TRB

The planting area and yield changes of the main fruit trees in the study area from 2000 to 2020 are shown in Figure 2 and Figure 3. In terms of planting area, the overall trend increased year by year. Date and walnut had the most significant growth. As of 2020, the planting area increased by 3.01 × 10⁵ ha compared with 2000. The planting area of walnut increased by 3.76 × 10⁵ ha, while that of apple and pear increased by 0.18 × 10⁵ and 0.30 × 10⁵ ha, respectively. It is worth noting that the peak planting area for apples (0.30 × 10⁵ ha) and walnuts (3.96 × 10⁵ ha) appeared in 2020, while that of pears (0.51 × 10⁵ ha) and dates (3.03 × 10⁵ ha) showed a slight decreasing trend after reaching historical highs in 2015.
In terms of yield, the four types of fruit trees maintained a significant growth trend. The yield of the four fruit trees increased year by year, and the increase was obvious. In order of high to low, for date, pear, walnut, and apple, the growth rates were 8.98 × 10⁵ t, 6.07 × 10⁵ t, 5.73 × 10⁵ t, and 4.57 × 10⁵ t, respectively. The data show that although the apple planting area had the smallest increase, its yield still achieved considerable growth, reflecting the improvement of yield per unit area.

3.2. Temporal and Spatial Evolution of WF

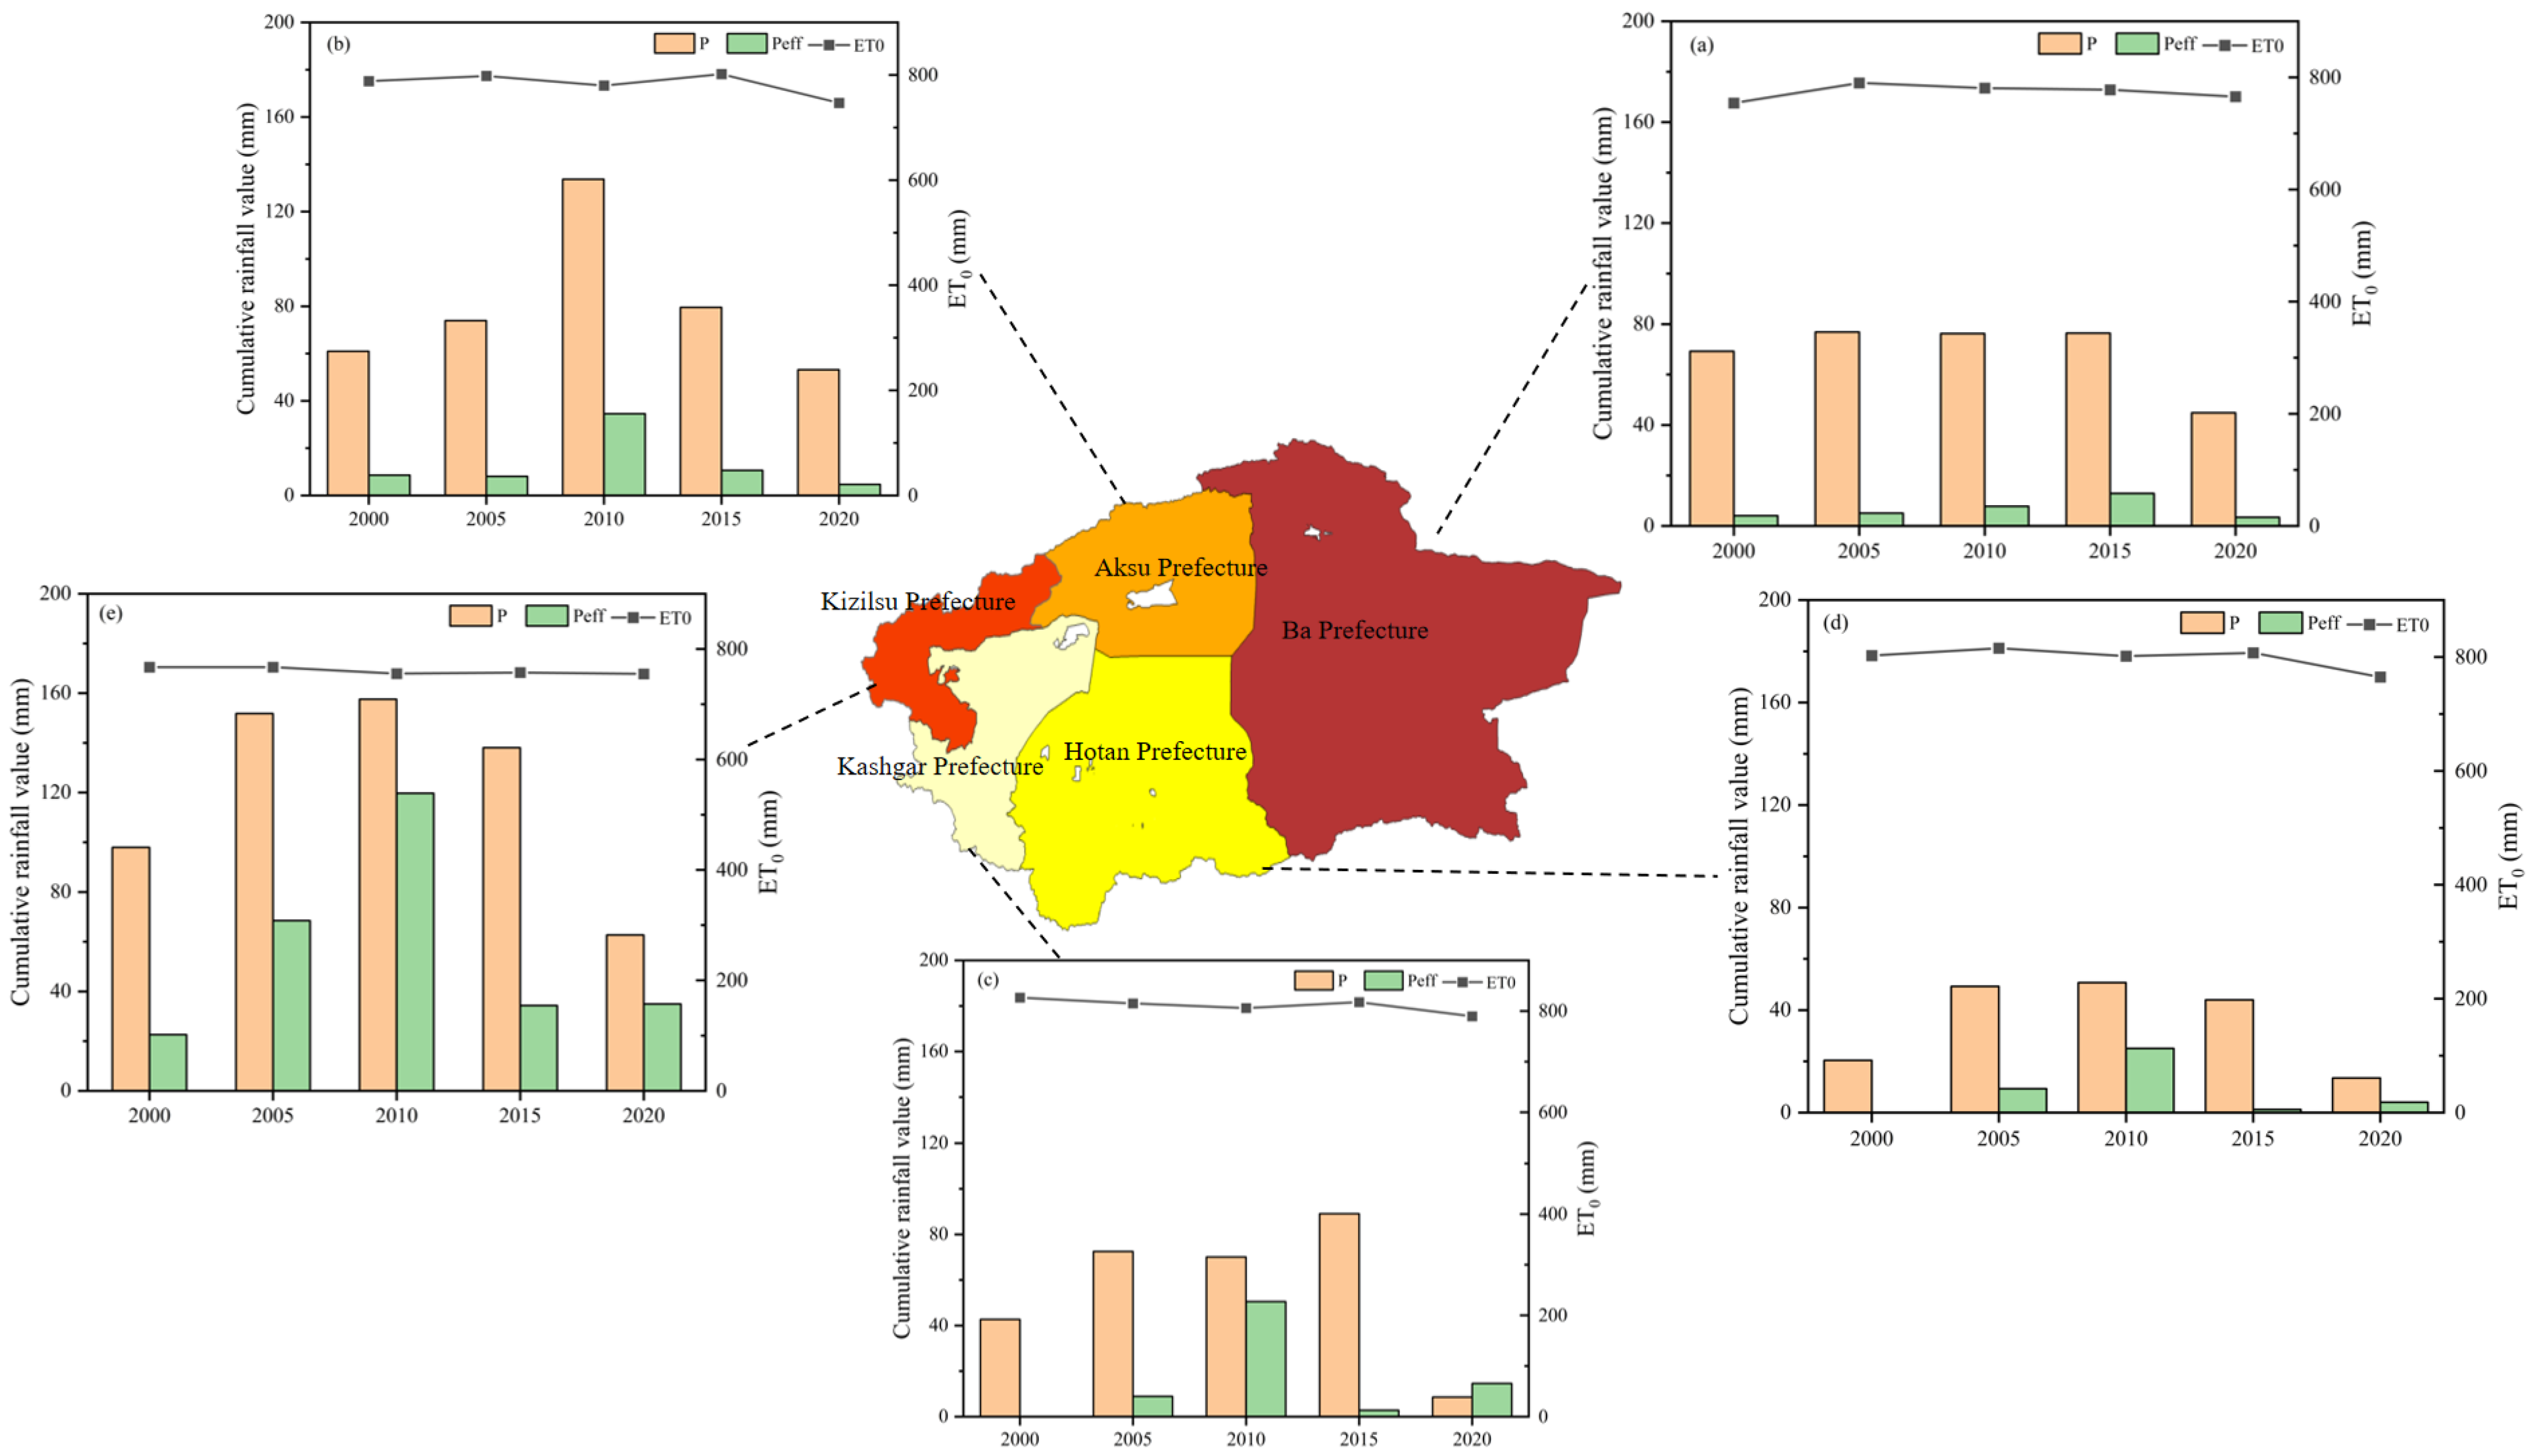
3.2.1. Change in Meteorological Parameters

The average values of rainfall (P), Peff, and reference evapotranspiration (ET0) during growing seasons from 2000 to 2020 are depicted in Figure 4. From 2000 to 2020, the rainfall in the five prefectures of the TRB generally indicated a downward trend, while Peff indicated an upward trend. Both reached the highest value in 2010, and rainfall was significantly higher than Peff, indicating that only a small portion of rainfall is absorbed by crops and used for growth. The rainfall in the Ba, Aksu, Kizilsu, Kashgar, and Hotan prefectures decreased by 35.25%, 12.83%, 35.96%, 79.92%, and 33.77%, respectively. In 2020, the Peff in the five prefectures was lower, at only 61.78 mm. There was a changing trend in that the Peff in the Ba and Aksu prefectures indicated a downward trend, decreasing by 15.33% and 45.80%, respectively, and the Kizilsu, Kashgar, and Hotan prefectures indicated an increasing trend in Peff, which increased by 54.59%, 100%, and 100%, respectively. In the five prefectures of the TRB, except Ba Prefecture, ET0 demonstrated a downward trend. The ET0 of the Aksu, Hotan, Kashgar, and Kizilsu prefectures decreased by 5.25%, 4.68%, 4.46%, and 1.57%, respectively. The ET0 in Aksu Prefecture decreased significantly, primarily due to the significant reduction in Peff in Aksu Prefecture. Considering the five prefectures in 2020 as an example, ET0 remained substantially higher than Peff, being approximately 62 times higher, indicating that the demand for water by crops in the five prefectures during growing seasons far exceeded the amount that natural precipitation could have provided. Table 1 indicates the changes in the ETc of fruit trees from March 2000 to October 2020. Except for apple trees, the ETc of all fruit trees generally indicated a downward trend, which may indicate improved water resource utilization efficiency. The average values of apple, pear, date, and walnut, from high to low, were 3653.70, 3645.56, 3558.80, and 3547.07 mm, respectively. Due to the limited rainfall in the study area, Peff was significantly lower than ETc; accordingly, irrigation was needed to meet the water demand of fruit trees.

3.2.2. Interannual Variation in WF

During the growth and development of fruit trees, the CWA of the five prefectures in the TRB was more significant than the Peff. Since the Peff of the five prefectures in the TRB was negligible during the growth period (Figure 4), irrigation could supplement the lack of green water in arid areas. The temporal evolution of the WF of the four fruit trees in the five prefectures of the TRB from 2000 to 2020 is depicted in Figure 5. Initially, WFgreen was analysed, and the WFgreen of the four fruit trees demonstrated first an increasing, and then decreasing, trend, reaching the lowest value in 2020 at only 175.09 mm, because the Peff of the five prefectures in the TRB reached the lowest value in 2020. The annual mean WFgreen of the four fruit trees followed the order, from large to small: walnut (229.60 m3/t), date (99.44 m3/t), apple (37.50 m3/t), and pear (21.84 m3/t). Second, WFblue was analysed, and WFblue indicated a downward trend annually, being 5.04 × 10⁵ m3/t and 2.64 × 10⁵ m3/t in 2000 and 2020, respectively, with a decrease of 47.13%, and the reduction in the WFblue was primarily attributed to the application of water-saving technologies. The annual average WFblue of the four fruit trees followed the order, from large to small: walnut (2.0 × 10⁵ m3/t), date (1.20 × 10⁵ m3/t), apple (0.14 × 10⁵ m3/t), and pear (0.20 × 10⁵ m3/t). Considering 2020 as an example, the WFblue of the four fruit trees in 2020 was 2.64 × 10⁵ m3/t, of which date accounted for 56.71%, walnut accounted for 31.08%, pear accounted for 7.89%, and apple accounted for 4.31%. Furthermore, the analysis of WFgrey indicated that WFgrey generally increased from 2000 to 2020, which may be due to the increase in fruit tree planting area and fertilizer application. The average WFgrey of the four fruit trees followed the order, from large to small: walnut (0.21 × 10⁵ m3/t), date (0.13 × 10⁵ m3/t), pear (0.016 × 10⁵ m3/t), and apple (0.01 × 10⁵ m3/t). Further, WFgrey revealed an increasing trend, except for walnut. Compared with 2000, date, pear, and apple increased by 114.09%, 73.40%, and 26.22%, respectively, while walnut decreased by 41.15%. Finally, WFtotal was analysed, and WFtotal revealed a decreasing trend, which may be due to the popularization of water-saving technologies. The WFtotal of the four fruit trees followed the order, from high to low: walnut (2.21 × 10⁵ m3/t), date (1.33 × 10⁵ m3/t), pear (0.22 × 10⁵ m3/t), and apple (0.15 × 10⁵ m3/t). The WFtotal of apple and walnut decreased by 30.69% and 74.62%, respectively, while that of pear and date increased by 12.39% and 34.08%, respectively. Using 2020 as an example, WFblue, WFgreen, and WFgrey accounted for 88.64%, 0.06%, and 11.29% of WFtotal, respectively. WFblue was much higher than WFgreen, mainly due to the large water demand in the study area and the smaller area in which to apply water-saving technology. In the future, it will be necessary to reduce WFblue to lower the water consumption of fruit trees in the TRB.

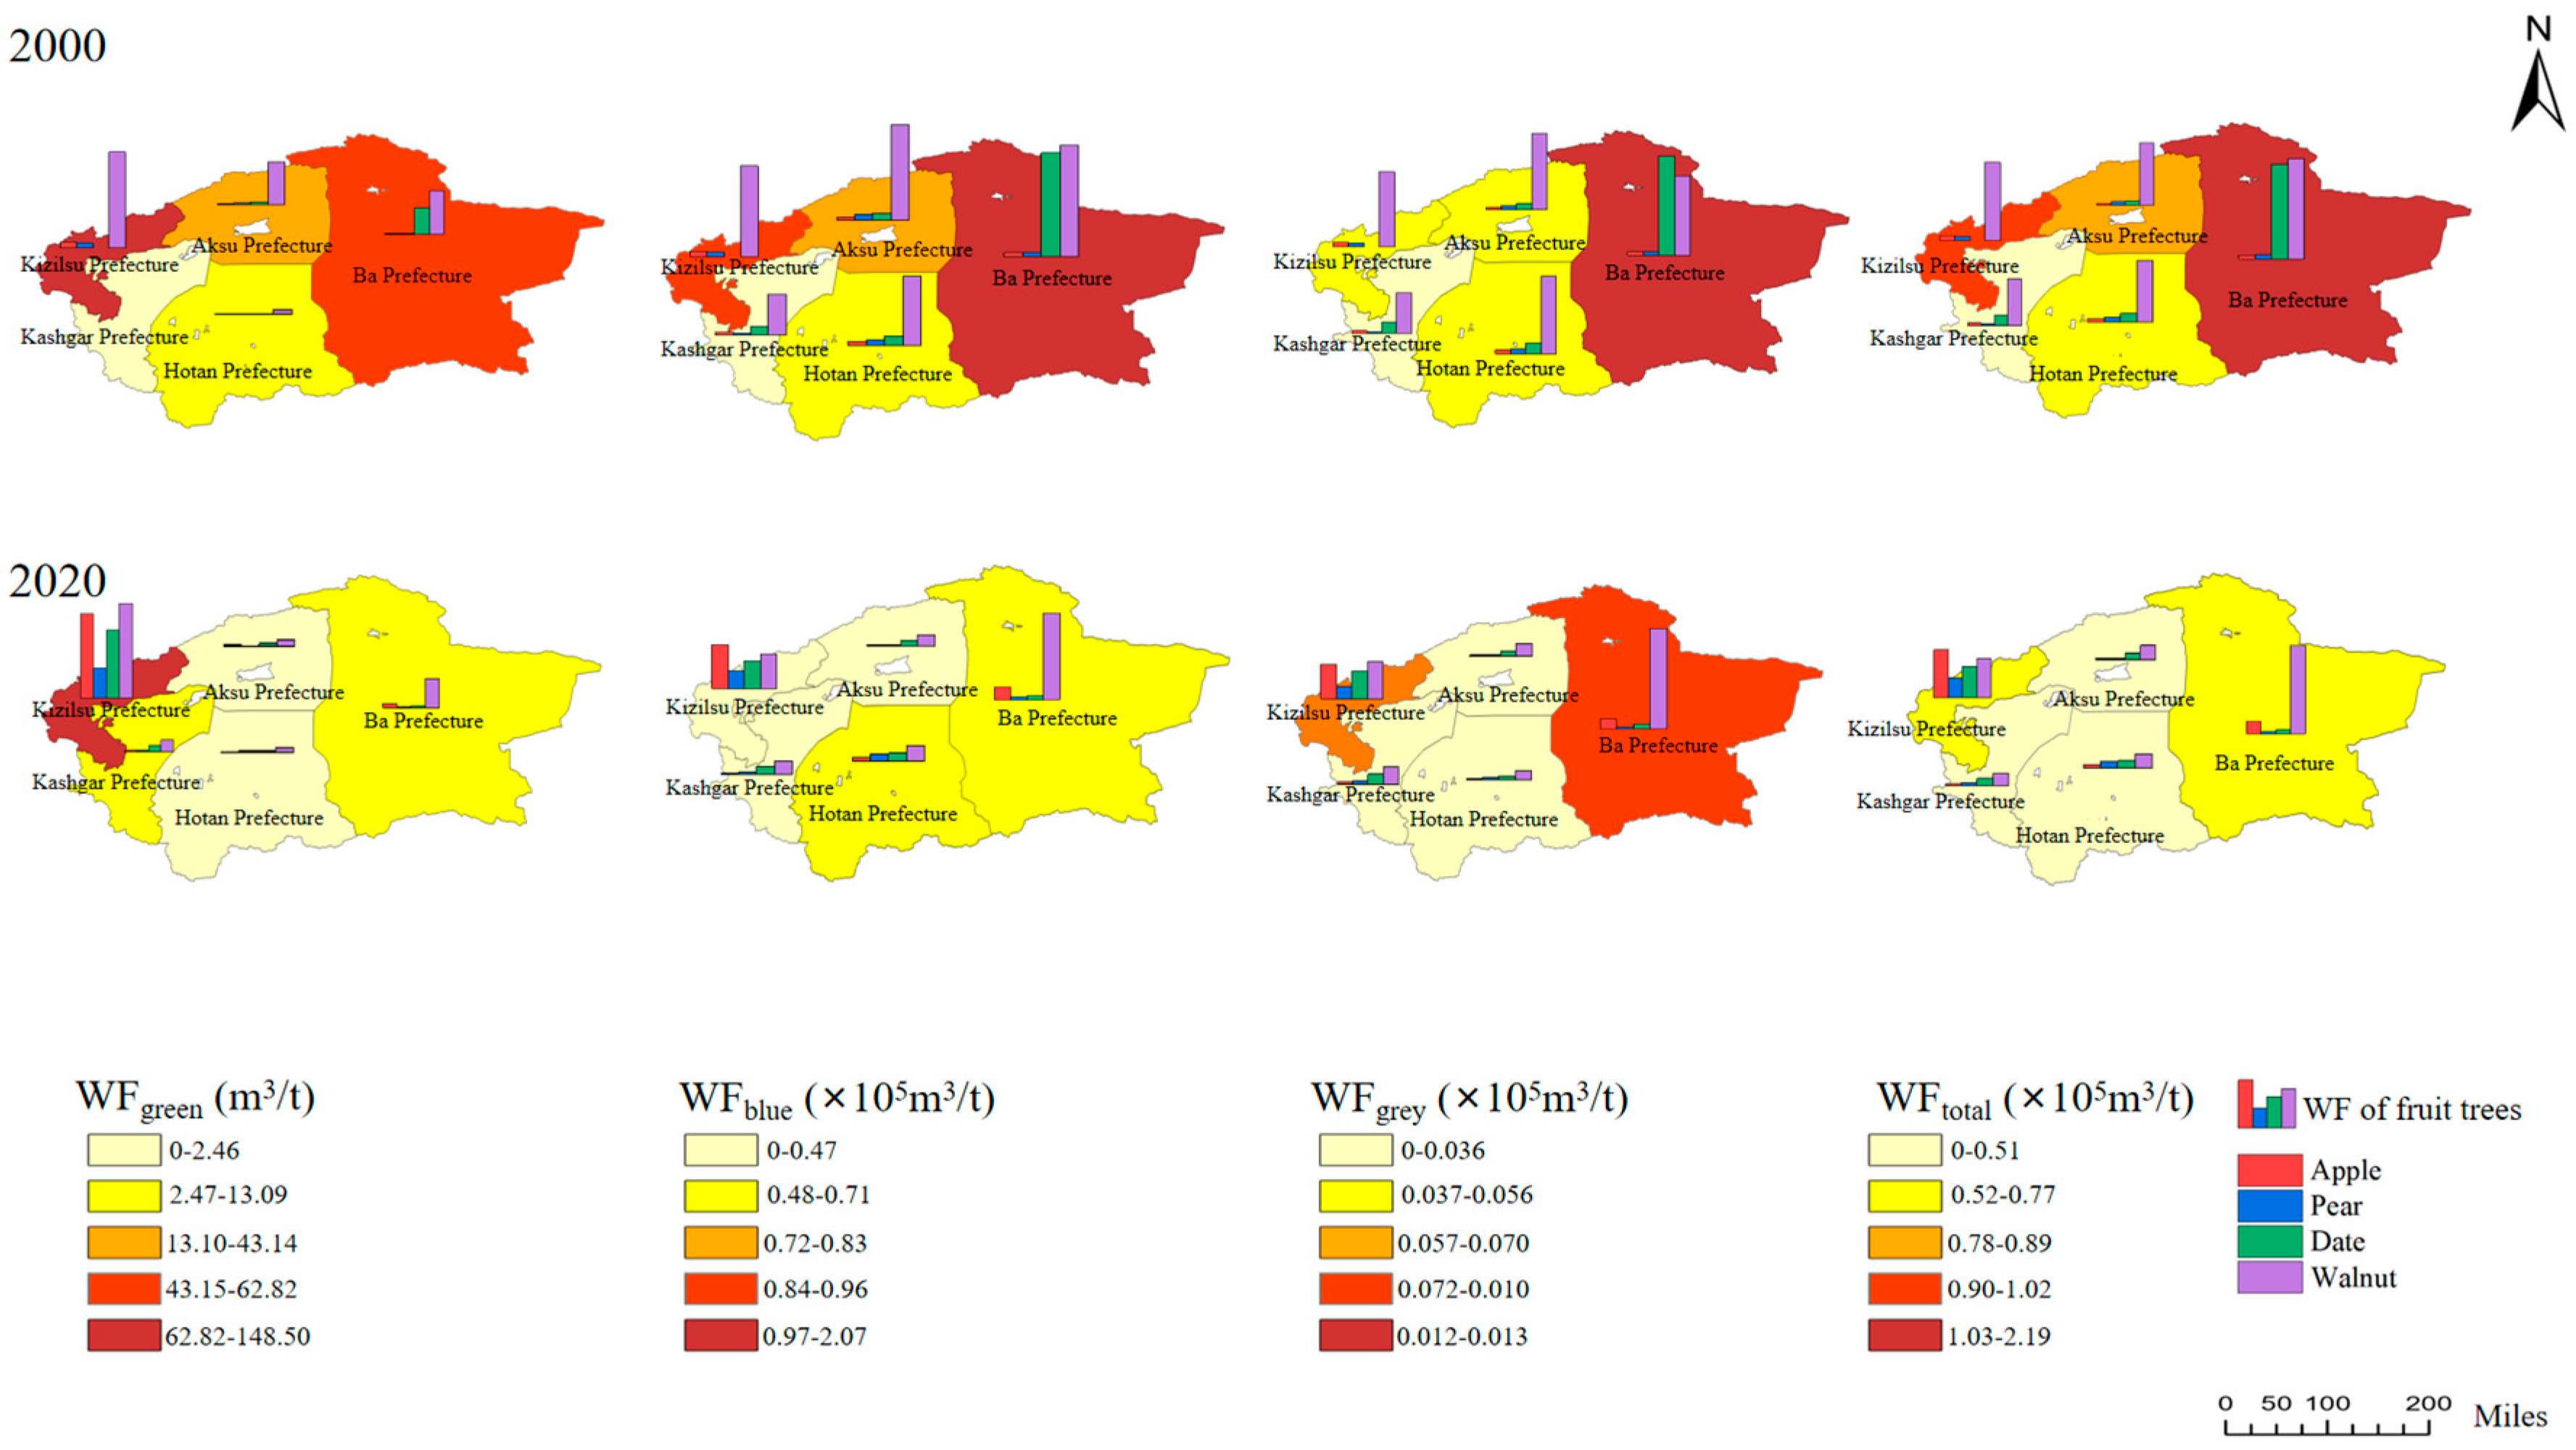
3.2.3. Spatial Evolution of WF

The spatial distribution of the water footprints of the four fruit trees in the five prefectures of the TRB is shown in Figure 6. Firstly, the WFgreen of the Ba, Aksu, and Hotan prefectures in the TRB revealed a downward trend, decreasing by 49.73, 40.68, and 1.26 m3/t, respectively, compared with 2000, while the WFgreen of the Kizilsu and Kashi prefectures indicated an increasing trend, increasing by 31.64 and 9.30 m3/t, respectively. The WFgreen of apple, pear, and date in Kizilsu Prefecture demonstrated a significant increasing trend, increasing by 39.47, 11.11, and 36.37 m3/t, respectively, while the WFgreen of walnut indicated a significant decreasing trend. Second, the WFblue of the five prefectures in the TRB indicated a downward trend. The reductions were as follows, from high to low: Ba Prefecture (1.43 × 10⁵ m3/t), Aksu Prefecture (0.76 × 10⁵ m3/t), Hotan Prefecture (0.60 × 10⁵ m3/t), Kashgar Prefecture (0.38 × 10⁵ m3/t), and Kizilsu Prefecture (0.37 × 10⁵ m3/t). This may be due to the higher water-saving score of Ba Prefecture compared with other prefectures. The WFblue of apple, pear, and date in Kizilsu Prefecture indicated a significant increase compared with other prefectures; compared with 2000, it increased by 0.16 × 10⁵ m3/t, 0.039 × 10⁵ m3/t, and 0.13 × 10⁵ m3/t, respectively. The WFblue of apples in Hotan Prefecture, pears in Aksu Prefecture, dates in Ba Prefecture, and walnuts in Kizilsu Prefecture demonstrated a significant downward trend compared with other prefectures in 2000, with rates of decline of 67.85%, 87.59%, 97.52%, and 80.86%, respectively. Moreover, except for Kizilsu Prefecture, the WFgrey of all prefectures revealed a downward trend, with the highest reduction being in Hotan Prefecture at 0.047 × 10⁵ m3/t, and the WFgrey of Kizilsu Prefecture increased by 0.016 × 10⁵ m3/t. Apple, pear, and red date in Kizilsu Prefecture and apple and walnut in Ba Prefecture indicated an increasing trend, while fruit trees in other prefectures indicated a downward trend. Finally, from 2000 to 2020, the decreases in WFtotal in the Bazhou, Aksu, Hotan, Kashgar, and Kizilsu prefectures were 1.46 × 10⁵ m3/t, 0.80 × 10⁵ m3/t, 0.65 × 10⁵ m3/t, 0.40 × 10⁵ m3/t, and 0.35 × 10⁵ m3/t, respectively. Apple and pear in the Aksu Prefecture, date in Ba Prefecture, and walnut in Kizilsu Prefecture revealed a significant downward trend, with decreases of 75.72%, 86.94%, 97.30%, and 79.28%, respectively, while apple, pear, and date in Kizilsu Prefecture and apple in Ba Prefecture demonstrated an increasing trend. In summary, from 2000 to 2020, WFgreen, WFblue, and WFgrey had a decreasing trend in the five prefectures of the TRB, except for WFgrey in Kizilsu Prefecture, which indicated an increasing trend. Using 2020 as an example, the WFtotal of apples, pears, and dates in Kizilsu Prefecture was more significant, and the WFtotal of walnuts in Ba Prefecture was higher.

3.3. Analysis of Water-Saving Potential Under Complete Drip Irrigation Technology

Currently, the development of drip irrigation technology in the five prefectures of the TRB is slow, but the use of drip irrigation technology can effectively save water. Using 2020 as an example, WFblue accounted for a relatively large proportion of the fruit production process in the five prefectures of the TRB, accounting for 90.5%, 91.5%, 88%, and 86.4% in apple, pear, red date, and walnut, respectively (Figure 7). Consequently, reducing WFblue in the five prefectures of the TRB is a crucial way to decrease the water consumption of fruit trees. The changes in the WFblue of fruit trees in the five prefectures of the TRB under the complete application of drip irrigation technology are depicted in Table 2. Compared with 2020, the total WFblue of the four types of fruit trees in the five prefectures of the TRB decreased by 0.73 × 10⁵ m3/t, which is a decrease of 48.38%. The reductions in apples, pears, dates, and walnuts were 0.19 × 10⁵ m3/t, 0.079 × 10⁵ m3/t, 0.096 × 10⁵ m3/t, and 0.36 × 10⁵ m3/t, respectively, and the decreases were 61.49%, 57.23%, 41.35%, and 43.89%, respectively. The four fruit trees’ WFblue in the Ba, Aksu, Kexu, Kashgar, and Hotan prefectures of the TRB had potential water use reductions of 0.25 × 10⁵ m3/t, 0.038 × 10⁵ m3/t, 0.33 × 10⁵ m3/t, 0.048 × 10⁵ m3/t, and 0.061 × 10⁵ m3/t, respectively, under complete drip irrigation, and the water-saving potentials were 38.55%, 53.10%, 55.98%, 54.57%, and 56.18%, respectively.

4. Discussion

4.1. Spatial and Temporal Evolution of the WF

The study of WF in the TRB can help us evaluate the sustainable utilization of water resources [26]. First, WFgreen was analysed. The rainfall of the five prefectures in the TRB was significantly higher than the Peff, indicating that sufficient Peff was not obtained during the growth and development period [13]. Due to the limited rainfall in the study area, Peff was significantly lower than ETc (Figure 4), and the limited green water increased the pressure on water resources [27]. The WFgreen of the four fruit trees indicated a trend of increasing first and then decreasing, reaching the lowest value in 2020, at only 175.09 mm (Figure 5). Therefore, it was necessary to supply blue water to supplement the insufficient supply of green water in arid areas, which is consistent with the current study [13]. Second, WFblue was analysed. To obtain accurate WF estimation, accurate local data were needed. This accounting process involved estimating the actual water consumption on site [25]. In this study, the actual water consumption data were collected using field surveys, and WFblue was calculated accordingly. WFblue is affected by the development and application of water-saving irrigation technology [28]. In this study, from 2000 to 2020, with the continuous application of drip irrigation technology, WFblue generally revealed a downward trend (Figure 5). However, the value of WFblue remained high, which indicated that the application of fruit tree water-saving technology is relatively low, and a large amount of irrigation water was used.
Furthermore, WFgrey was analysed. The multi-year average values of WFgrey were as follows for the four fruit trees: walnut (0.21 × 10⁵ m3/t), red date (0.13 × 10⁵ m3/t), pear (0.015 × 10⁵ m3/t), and apple (0.01 × 10⁵ m3/t; Figure 5). The WFgrey of walnut was higher, which may be related to the lower yield per unit area of walnut [29]. Conversely, given the continuous expansion of the planting area of forest and fruit crops (Figure 2) and the increase in fertilizer application intensity in agricultural production, WFgrey indicated a significant upward trend [30]. This phenomenon is consistent with the WFgrey growth pattern of all fruit trees except walnuts in this study. Specifically, compared with the base year 2000, the WFgrey of date, pear, and apple increased by 114.09%, 73.40%, and 26.22%, respectively, which was consistent with the above trend.
Finally, WFtotal was analysed. The highest annual average value of the WFtotal of the four fruit trees was found for walnut (2.21 × 10⁵ m3/t), which is consistent with the research results of Hossain et al. [13]. WFblue accounts for the main contribution to WFtotal [31]. Using 2020 as an example, WFblue accounted for approximately 91.3%, 91.5%, 89.3%, and 86.4% of the WFs of apples, pears, red dates, and walnuts, respectively (Figure 7), while WFgreen accounted for about 0.18% of WFtotal. The region had low WFgreen and high WFblue, indicating that green water resources are scarce, the sustainability of rainwater was lower than irrigation water, and there is strong dependence on irrigation [32], which may lead to the over-exploitation of surface water and groundwater [33]. In the future, WFblue needs to be reduced to decrease the utilization of forest and fruit water resources in the TRB.

4.2. Application of Drip Irrigation Technology to Reduce the WFblue of Forests and Fruit Trees in TRB

Approximately 57% of the global WFblue has been confirmed to be inconsistent with environmental flow requirements [34]. Faced with this reality, if the water quota is not adjusted, farmers will face two choices: either reduce the planting area to maintain the yield per unit area or accept the decline in the yield per unit area in the existing planting area. No matter which option they chose, it will lead to a decrease in income in the region. Farmers should upgrade their management skills and irrigation systems to address this challenge. Studies have indicated that drip irrigation technology can effectively reduce CWA [35]. The research in this study also revealed that after the surface drip irrigation technology was employed, compared with 2020, the total WFblue of the four fruit trees in the five prefectures of the TRB decreased by 0.7 × 10⁵ m3/t, representing a decrease of 48.38%. The reductions in apple, pear, date, and walnut were 0.19 × 10⁵ m3/t, 0.079 × 10⁵ m3/t, 0.096 × 10⁵ m3/t, and 0.36 × 10⁵ m3/t, respectively. The water-saving potentials of four fruit trees in terms of WFblue in the Bazhou, Aksu, Kizilsu, Kashgar, and Hotan prefectures of the TRB under complete drip irrigation were 38.55%, 53.10%, 55.98%, 54.57%, and 56.18%, respectively (Table 2). Improving water use efficiency, especially through drip irrigation or other innovative methods, will become an important strategy for crop water-saving in the future. WFblue indicates the unsustainable use of water resources, and the adoption of drip irrigation technology is an effective way to avoid unsustainable water use [36].

4.3. Suggestion

From this study, we observed that the WFblue of the four major fruit trees accounted for approximately 89.1% of WFtotal in the five prefectures of the TRB, indicating that the consumption of WFblue is huge and the study area is largely dependent on irrigation water. As a current trend in agricultural development and efficient irrigation solutions, drip irrigation technology was used to emphasize the necessity of saving water more effectively in arid areas. However, this study also has some limitations that need to be addressed. When calculating WFgrey, we only considered nitrogen pollution and did not consider the potential impact of pesticides and other fertilizers. The calculation of WFblue was based only on the irrigation quota and flood irrigation and drip irrigation areas, without considering the corresponding data under other agricultural irrigation technologies. In future research, it will be necessary to systematically collect the precise irrigation demand data of each fruit tree under different water-saving technologies, so as to calculate the WF of fruit tree production more accurately; at the same time, it will be necessary to evaluate the potential of the deficit irrigation strategy as a feasible alternative or supplementary scheme of drip irrigation technology in order to optimize the efficiency of agricultural water resource allocation in arid areas.

5. Conclusions

From March to October, the water consumption of the fruit trees in the five prefectures of the TRB exceeded Peff, and irrigation became the primary way to supplement the lack of green water. From 2000 to 2020, the WF analysis of four fruit trees revealed that WFgreen increased first and then decreased, reaching the lowest value in 2020. WFblue decreased annually, mainly due to the application of drip irrigation technology. The overall increase in WFgrey is related to the increase in planting area and fertilization. In 2020, WFblue dominated, and after the full implementation of drip irrigation, the WFtotal of the four fruit trees decreased by 0.73 × 10⁵ m3/t, a decrease of 48.38%. The water-saving potential of drip irrigation technology in various states ranged from 38.55% to 56.18%, among which the Kizilsu and Hotan prefectures had the largest water-saving potential.

Author Contributions

X.Z.: Conceptualization, Resources, Validation. B.C.: Investigation, Validation, Visualization. Z.H.: Validation, Investigation, Visualization. M.L.: Writing—review and editing, Visualization, Validation. F.M.: Supervision, Resources, Project administration, Funding acquisition. Y.L.: Writing—review and editing, Supervision, Project administration, Funding acquisition. X.L.: Writing—original draft, Validation, Methodology, Investigation, Formal analysis, Data curation. Y.C.: conceptualization, Validation, Investigation. All authors have read and agreed to the published version of the manuscript.

Funding

This work was supported by the Third Xinjiang Scientific Expedition Program (Grant No. 2021xjkk0200).

Data Availability Statement

The data that were used are confidential.

Acknowledgments

We thank the Shihezi Meteorological Bureau for providing meteorological data.

Conflicts of Interest

The authors declare that they have no known competing financial interests or personal relationships that could have appeared to influence the work reported in this paper.

References

  1. Fang, G.; Chen, Y.; Li, Z. Variation in agricultural water demand and its attributions in the arid Tarim River Basin. J. Agric. Sci. 2018, 156, 301–311. [Google Scholar] [CrossRef]
  2. Wang, F.; Chen, Y.; Li, Z.; Fang, G.; Li, Y.; Xia, Z. Assessment of the irrigation water requirement and water supply risk in the Tarim River Basin, Northwest China. Sustainability 2019, 11, 4941. [Google Scholar] [CrossRef]
  3. Wang, F.; Wu, Z.-p.; Wang, Y.; Jiao, W.; Chen, Y.-n. Dynamic monitoring of desertification in the Tarim Basin based on RS and GIS techniques. Chin. J. Ecol. 2017, 36, 1029. [Google Scholar]
  4. Raluy, R.G.; Quinteiro, P.; Dias, A.C. Water footprint of forest and orchard trees: A review. Water 2022, 14, 2709. [Google Scholar] [CrossRef]
  5. Quinteiro, P.; Ridoutt, B.G.; Arroja, L.; Dias, A.C. Identification of methodological challenges remaining in the assessment of a water scarcity footprint: A review. Int. J. Life Cycle Assess. 2018, 23, 164–180. [Google Scholar] [CrossRef]
  6. Taylor, N.J.; Gush, M.B. The Water Use of Selected Fruit Tree Orchards (Volume 1): Review of Available Knowledge. Water Research Commission Report 14. 2014. Available online: https://www.wrc.org.za/wp-content/uploads/mdocs/1770-1-141.pdf (accessed on 1 August 2024).
  7. Nisbet, T.R.; Andreucci, M.-B.; De Vreese, R.; Högbom, L.; Kay, S.; Kelly-Quinn, M.; Leonardi, A.; Lyubenova, M.I.; Pol, P.O.; Quinteiro, P. Forest Green Infrastructure to Protect Water Quality: A Step-by-Step Guide for Payment Schemes, Green Infrastructure and Climate Change Adaptation: Function, Implementation and Governance; Springer Nature Singapore: Singapore, 2022; pp. 105–131. [Google Scholar]
  8. Bazrafshan, O.; Etedali, H.R.; Moshizi, Z.G.N. Water Footprint of Fruits in Arid and Semi-Arid Regions, Environmental Footprints of Crops; Springer: Berlin/Heidelberg, Germany, 2022; pp. 1–26. [Google Scholar]
  9. Li, F.; Yuan, C.; Lao, D.; Yao, B.; Hu, X.; You, Y.; Wang, L.; Sun, S.; Liang, X. Drip irrigation with organic fertilizer application improved soil quality and fruit yield. Agron. J. 2020, 112, 608–623. [Google Scholar] [CrossRef]
  10. Li, Z.; Zong, R.; Wang, T.; Wang, Z.; Zhang, J. Adapting root distribution and improving water use efficiency via drip irrigation in a jujube (Zizyphus jujube Mill.) orchard after long-term flood irrigation. Agriculture 2021, 11, 1184. [Google Scholar] [CrossRef]
  11. Pfister, S.; Koehler, A.; Hellweg, S. Assessing the environmental impacts of freshwater consumption in LCA. Environ. Sci. Technol. 2009, 43, 4098–4104. [Google Scholar] [CrossRef]
  12. Zhuo, L.; Mekonnen, M.M.; Hoekstra, A.Y. The effect of inter-annual variability of consumption, production, trade and climate on crop-related green and blue water footprints and inter-regional virtual water trade: A study for China (1978–2008). Water Res. 2016, 94, 73–85. [Google Scholar] [CrossRef]
  13. Hossain, I.; Imteaz, M.A.; Khastagir, A. Water footprint: Applying the water footprint assessment method to Australian agriculture. J. Sci. Food Agric. 2021, 101, 4090–4098. [Google Scholar] [CrossRef]
  14. Gush, M.; Dzikiti, S.; van Der Laan, M.; Steyn, M.; Manamathela, S.; Pienaar, H. Field quantification of the water footprint of an apple orchard, and extrapolation to watershed scale within a winter rainfall Mediterranean climate zone. Agric. For. Meteorol. 2019, 271, 135–147. [Google Scholar] [CrossRef]
  15. Shen, Y.; Li, S.; Chen, Y.; Qi, Y.; Zhang, S. Estimation of regional irrigation water requirement and water supply risk in the arid region of Northwestern China 1989–2010. Agric. Water Manag. 2013, 128, 55–64. [Google Scholar] [CrossRef]
  16. Yu, J.; Long, A.; Deng, X.; He, X.; Zhang, P.; Wang, J.; Hai, Y. Incorporating the red jujube water footprint and economic water productivity into sustainable integrated management policy. J. Environ. Manag. 2020, 269, 110828. [Google Scholar] [CrossRef]
  17. Aldaya, M.M.; Garrido, A.; Llamas, R. Water footprint and virtual water trade: The birth and growth of a new research field in Spain. Water 2020, 12, 2641. [Google Scholar] [CrossRef]
  18. Imbernón-Mulero, A.; Martínez-Alvarez, V.; Ben Abdallah, S.; Gallego-Elvira, B.; Maestre-Valero, J.F. A Comparative Water Footprint Analysis of Conventional versus Organic Citrus Production: A Case Study in Spain. Agriculture 2024, 14, 1029. [Google Scholar] [CrossRef]
  19. Kahramanoğlu, İ.; Usanmaz, S.; Alas, T. Water footprint and irrigation use efficiency of important crops in Northern Cyprus from an environmental, economic and dietary perspective. Saudi J. Biol. Sci. 2020, 27, 134–141. [Google Scholar] [CrossRef] [PubMed]
  20. Lu, Q.; Liu, F.; Li, Y.; Wang, D. Study on the relationship between water resources utilization and economic growth in tarim river basin from the perspective of water footprint. Water 2022, 14, 1655. [Google Scholar] [CrossRef]
  21. Zamani, A.; Rostamian, R.; Norouzi, G. Comparative assessment of environmental impacts and water scarcity footprint of horticultural crops in Iran. Environ. Res. 2024, 257, 119082. [Google Scholar] [CrossRef]
  22. Rouzi, A.; Halik, Ü.; Thevs, N.; Welp, M.; Aishan, T. Water Efficient Alternative Crops for Sustainable Agriculture along the Tarim Basin: A Comparison of the Economic Potentials of Apocynum pictum, Chinese Red Date and Cotton in Xinjiang, China. Sustainability 2017, 10, 35. [Google Scholar] [CrossRef]
  23. Feng, M.; Chen, Y.; Li, Z.; Duan, W.; Zhu, Z.; Liu, Y.; Zhou, Y. Optimisation model for sustainable agricultural development based on water-energy-food nexus and CO2 emissions: A case study in Tarim river basin. Energy Convers. Manag. 2024, 303, 118174. [Google Scholar] [CrossRef]
  24. Hoekstra, A.; Chapagain, A.K.; Aldaya, M.M.; Mekonen, M.M. The Water Footprint Assessment Manual: Setting the Global Standard; Routledge: London, UK, 2012. [Google Scholar]
  25. González Perea, R.; García Morillo, J.; Rodríguez Díaz, J.A.; Barrios, P.M.; Poyato, E.C. Water Footprint Accounting for Improving Irrigation Management in Olive Trees. In Water Scarcity and Sustainable Agriculture in Semiarid Environment; Academic Press: Cambridge, MA, USA, 2018; pp. 61–72. [Google Scholar]
  26. Esetlili, M.T.; Serbeş, Z.A.; Çolak Esetlili, B.; Kurucu, Y.; Delibacak, S. Determination of Water Footprint for the Cotton and Maize Production in the Küçük Menderes Basin. Water 2022, 14, 3427. [Google Scholar] [CrossRef]
  27. Wang, D.; Hubacek, K.; Shan, Y.; Gerbens-Leenes, W.; Liu, J. A Review of Water Stress and Water Footprint Accounting. Water 2021, 13, 201. [Google Scholar] [CrossRef]
  28. Mekonnen, M.M.; Hoekstra, A.Y. Sustainability of the blue water footprint of crops. Adv. Water Resour. 2020, 143, 103679. [Google Scholar] [CrossRef]
  29. Bazrafshan, O.; Zamani, H.; Ramezani Etedali, H.; Dehghanpir, S. Assessment of citrus water footprint components and impact of climatic and non-climatic factors on them. Sci. Hortic. 2019, 250, 344–351. [Google Scholar] [CrossRef]
  30. Song, M.; He, W.; An, M.; Fang, X.; Wang, B.; Ramsey, T.S. Toward better agricultural grey water footprint allocation under economy-resource factors constraint. Ecol. Indic. 2023, 154, 110806. [Google Scholar] [CrossRef]
  31. Machin Ferrero, L.M.; Araujo, P.Z.; Valdeon, D.H.; Nishihara Hun, A.L.; Mele, F.D. Water footprint of lemon production in Argentina. Sci Total Env. 2022, 816, 151614. [Google Scholar] [CrossRef]
  32. Cao, X.; Bao, Y.; Li, Y.; Li, J.; Wu, M. Unravelling the effects of crop blue, green and grey virtual water flows on regional agricultural water footprint and scarcity. Agric. Water Manag. 2023, 278, 108165. [Google Scholar] [CrossRef]
  33. Harris, F.; Moss, C.; Joy, E.J.M.; Quinn, R.; Scheelbeek, P.F.D.; Dangour, A.D.; Green, R. The Water Footprint of Diets: A Global Systematic Review and Meta-analysis. Adv. Nutr. 2020, 11, 375–386. [Google Scholar] [CrossRef]
  34. Mekonnen, M.M.; Gerbens-Leenes, W. The Water Footprint of Global Food Production. Water 2020, 12, 2696. [Google Scholar] [CrossRef]
  35. Rockström, J.; Lannerstad, M.; Falkenmark, M. Assessing the water challenge of a new green revolution in developing countries. Proc. Natl. Acad. Sci. USA 2007, 104, 6253–6260. [Google Scholar] [CrossRef]
  36. Mekonnen, M.; Pahlow, M.; Aldaya, M.; Zarate, E.; Hoekstra, A. Sustainability, Efficiency and Equitability of Water Consumption and Pollution in Latin America and the Caribbean. Sustainability 2015, 7, 2086–2112. [Google Scholar] [CrossRef]
Figure 1. (a) The geographical location of the five prefectures in the TRB in Xinjiang Uygur Autonomous Region. (b) The location distribution of the five prefectures in the TRB. (c) Variation diagram of monthly rainfall and temperature in the five prefectures of the TRB in 2020.
Water 17 01158 g001
Figure 2. Changes in planting area of fruit trees.
Water 17 01158 g002
Figure 3. Fruit tree yield changes.
Water 17 01158 g003
Figure 4. Figure (ae) shows the changes of precipitation and evapotranspiration from March to October in the five prefectures of TRB.
Water 17 01158 g004
Figure 5. Interannual variation in water footprint of fruit trees. Notes: The water footprints of four fruit trees in five prefectures of the TRB are marked in the figure: (a) is the green water footprint, (b) is the blue water footprint, (c) is the grey water footprint, and (d) is the total water footprint.
Water 17 01158 g005
Figure 6. Spatial–temporal evolution of water footprint of fruit trees in TRB.
Water 17 01158 g006
Figure 7. Fruit trees’ water footprint in the TRB in 2020.
Water 17 01158 g007
Table 1. Evapotranspiration of fruit trees in TRB from 2000 to 2020 (mm/year).
YearApplePearDateWalnut
20003577.553654.913567.833565.92
20053628.243710.433622.023597.38
20103574.513636.543549.583525.26
20153818.943683.553596.083595.12
20203669.253542.343458.473451.71
Table 2. WFblue of fruit trees in five prefectures of TRB under complete drip irrigation (×105m3/t).
ApplePearDateWalnutTotal
2020Ba prefecture0.0780.0160.0240.5190.636
Aksu prefecture0.0050.0050.0210.0400.072
Kizilsu prefecture0.2110.0850.1330.1650.595
Kashgar prefecture0.0060.0100.0280.0460.089
Hotan prefecture0.0110.0220.0260.0500.109
Total0.3120.1390.2320.8201.502
Applying
complete
drip
irrigation
technology
in 2020
Ba prefecture0.0290.0060.0150.3410.391
Aksu prefecture0.0020.0030.0120.0170.034
Kizilsu prefecture0.0820.0380.0780.0640.262
Kashgar prefecture0.0020.0040.0160.0180.040
Hotan prefecture0.0040.0090.0140.0200.048
Total0.1200.0590.1360.4600.775
Disclaimer/Publisher’s Note: The statements, opinions and data contained in all publications are solely those of the individual author(s) and contributor(s) and not of MDPI and/or the editor(s). MDPI and/or the editor(s) disclaim responsibility for any injury to people or property resulting from any ideas, methods, instructions or products referred to in the content.

