Abstract
To investigate the effects of intermittent pH regulation on volatile fatty acid (VFA) production during kitchen waste fermentation and its impact on nitrogen removal efficiency in the anaerobic/anoxic/oxic (A2O) process, five experimental groups were set up (pH = 3, 5, 7, 9, and control). The study examined the promotion of soluble chemical oxygen demand (SCOD) and VFA release under different pH conditions and their contribution to total nitrogen (TN) release. Additionally, methanol was used as a control carbon source to explore the enhancement of denitrification efficiency when kitchen waste fermentation broth was used as a carbon source in the A2O process. The results indicated that neutral and alkaline conditions could enhance the release of SCOD and the conversion of VFAs, with a more pronounced effect under alkaline conditions. The maximum concentrations of SCOD and VFAs reached 36,412 and 5947 mg/L, respectively. Furthermore, TN release was most significant under alkaline conditions, being 2.39 times that of the control group. When kitchen waste fermentation broth was used as a carbon source, Proteobacteria and Bacteroidota were significantly enriched. Additionally, the relative abundance of key functional genes (napA, norB, and nosZ) involved in nitrogen cycling and key enzymes ([EC: 1.7.1.15], [EC: 1.7.2.1], and [EC: 1.7.2.5]) were enhanced, which strengthened the denitrification performance.
1. Introduction
Kitchen waste is a typical organic solid waste, which will threaten environmental safety and human health if not handled properly [1]. Due to its high content of organic matter such as protein, cellulose, and polysaccharides [2], many studies have focused on the resource utilization of kitchen waste through anaerobic fermentation (AF) technology in recent years. AF can not only effectively degrade organic matter but also produce a large number of renewable resources such as volatile fatty acids (VFAs) [3]. VFAs can be used to produce biochemical chemicals, biopolymers, and biofuels [4,5] and can be utilized as an efficient and economical alternative carbon source for biological nitrogen (N) removal technologies [6]. However, the AF process of kitchen waste is often affected by the external environment, where pH is a crucial factor. Liu et al. [7] investigated the effect of pH change on VFA production from kitchen waste AF by setting seven groups of experiments. The results showed that pH = 8 was considered to be the most suitable condition for VFA production, and the VFA production reached 8814 mg COD/L, 1.5 times that of the control group. It can be seen that the pH value needs to be precisely controlled in practical applications to ensure the maximum efficiency and resource utilization of kitchen waste AF.
At present, the anaerobic/anoxic/oxic (A2O) process is the mainstream process used for biological N removal in municipal wastewater treatment plants, but it faces the problem of a low carbon/nitrogen (C/N) ratio of influent water quality [8]. Meanwhile, to achieve a relatively high nitrogen removal performance, various wastewaters with a C/N ratio of 3–5 are relatively optimal. In this regard, sodium acetate and methanol are mostly used as additional carbon sources [9], which improves the N removal efficiency of the A2O process but increases the operating cost and secondary pollution risk of sewage treatment plants. If the VFAs generated by kitchen waste AF are used as an additional carbon source in the sewage treatment plant, this can realize the resource utilization of organic waste, reduce the dependence on traditional carbon sources, reduce the environmental load, and promote the sewage treatment industry to the direction of low-carbon and environmental protection. Previous studies have focused on the use of various methods to maximize the yield of VFAs, but there are few reports on the use of VFAs as an additional carbon source for biological N removal in A2O process.
The functional microbial community in the A2O process is very important for the performance of biological N removal. However, the metabolic activity and community structure of microbial communities would change with different types of external carbon sources, which would affect the efficiency of N removal. Li et al. [7] used sludge fermentation solution as the carbon source of A2O process to investigate its influence on bacterial community succession. The results showed that the sludge fermentation solution may be selective to denitrifying bacteria Comamonas sp. and influence the microbial community. However, there are few reports on the effect of VFAs as an additional carbon source on the microbial mechanism of the A2O process, and there are no studies to compare the differences between VFAs and traditional carbon sources on the microbial mechanism. Therefore, it is of great significance to explore the effects of VFAs on microbial communities in the A2O process for improving N removal efficiency.
Therefore, this study investigated the effect of intermittent pH regulation on the production of VFAs from kitchen waste AF. First, the variation of soluble chemical oxygen demand (SCOD) and VFAs under different pH conditions were analyzed. Secondly, the release characteristics of total nitrogen (TN) during kitchen waste AF and the change of C/N ratio in fermentation solution were studied. Finally, the fermentation liquid of kitchen waste was used as a carbon supplement source for A2O process, and its effect on the N removal performance of the A2O process was compared with methanol. This study is expected to increase the yield of VFAs in food waste fermentation, and the derived VFAs can be used as a cost-effective carbon source to improve the denitrification performance of the A2O process, laying a theoretical foundation for subsequent practical research.
2. Materials and Methods
2.1. Sources of Kitchen Waste
The kitchen waste was collected from a university canteen in Nanjing and transported to the laboratory at a low temperature of 4 °C. The grease and salt on the surface of the kitchen waste were cleaned by using deionized water. Then the kitchen waste was crushed by utilizing the wall-breaking machine before using. The relevant characteristics of kitchen waste are shown in Table 1.

Table 1.
Characteristics of kitchen waste.
2.2. Characteristics of Inoculated Sludge and Sewage
The inoculated sludge of A2O process was collected from the secondary sedimentation tank of a sewage treatment plant in Nanjing. The collected sludge was settled, and the supernatant was discarded, transported to the laboratory at a low temperature of 4 °C, and stored at 4 °C for later use. The influent water was artificial sewage. Sodium acetate (CH3COONa), potassium dihydrogen phosphate (KH2PO4), ammonium chloride (NH4Cl), and other chemicals were used to prepare synthetic sewage. For every 50 L of synthetic sewage, 1 L of municipal sewage was added to replenish trace elements. The concentration of pollutants in synthetic sewage was as follows: The concentration of chemical oxygen demand (COD), NH4+-N, TN, and total phosphorus (TP) was controlled at 170–200, 40–45, 45–50, and 4.0–5.0 mg/L. Additionally, the C/N ratio was controlled at 3–4 mg/L, which was a typical low C/N ratio sewage.
2.3. A2O Device and Technological Parameters
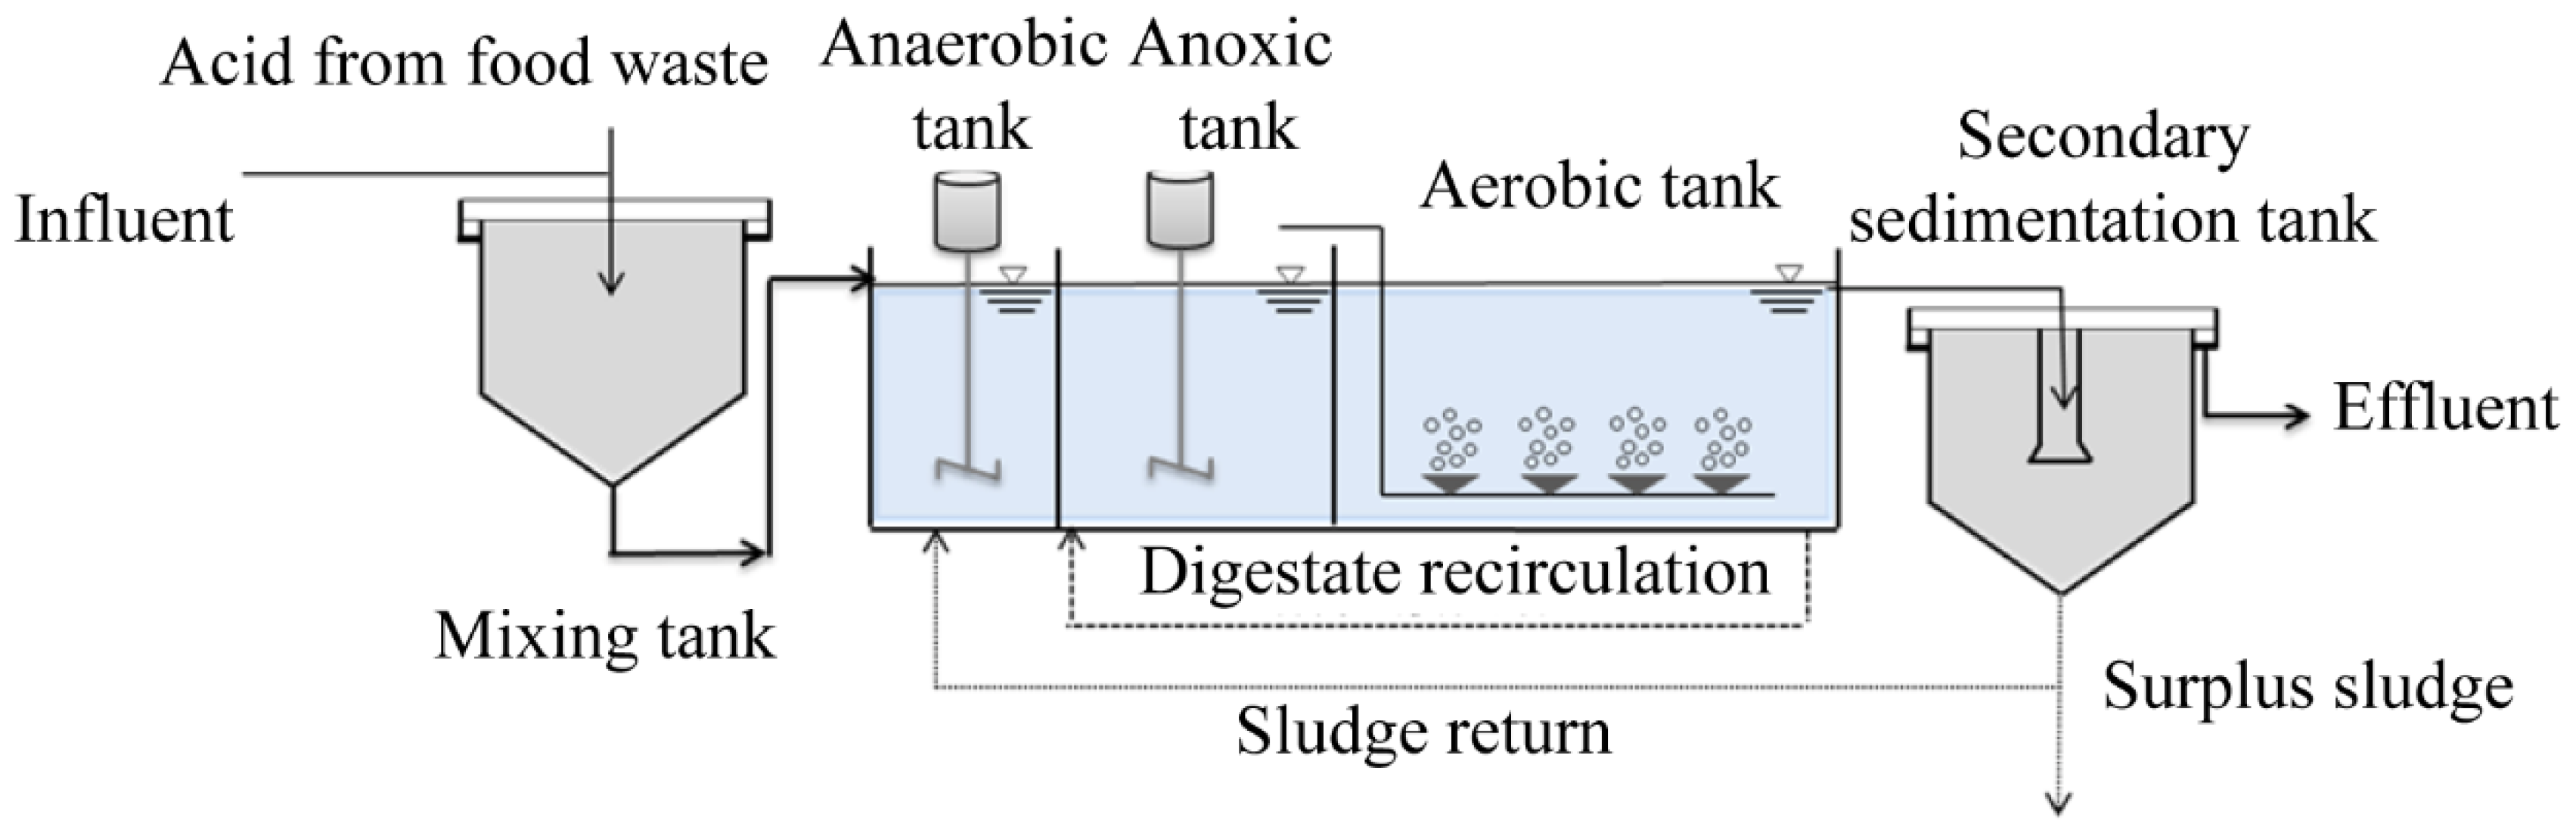
The A2O process experimental device is demonstrated in Figure 1. The A2O process adopted in this experiment consisted of two parts: the A2O reaction tank and secondary sedimentation tank. The A2O reaction tank was made of plexiglass with a size of L × C × H = 100 cm × 50 cm × 60 cm and an effective volume of 250 L. The effective volume of the three functional units of the A2O process was as follows: 37.5 L for the anaerobic tank, 87.5 L for the anoxic tank, and 125 L for the aerobic tank. The secondary sedimentation tank was made of a stainless-steel vertical sedimentation tank with an effective volume of 16.5 L.

Figure 1.
A2O process experimental device.
Anaerobic and anoxic tanks were equipped with stirrers to ensure the mixing of mud and water. The aerobic pool was aerated by blast aeration to meet the dissolved oxygen required for the nitrification reaction. Sludge reflux and mixed liquid reflux were set up from the secondary sedimentation tank to the anaerobic tank, and from the aerobic tank to the anoxic tank.
A reasonable C/N ratio was controlled by mixing the kitchen waste fermentation liquid with the configured synthetic sewage to verify the strengthening effect of the kitchen waste fermentation liquid on N removal. The operation conditions of A2O process were as follows: Hydraulic retention time (HRT) was 10 h, sludge mixture concentration (MLSS) was 3000–3500 mg/L, mixture reflux ratio and sludge reflux ratio were 200% and 80%, respectively, and dissolved oxygen (DO) in the controlled aerobic zone was 3–5 mg/L. The sludge was discharged every 24 h to control the sludge age at 16 days.
2.4. Experimental Operation
Five experimental groups were set up in this study. A total of 220 mL of crushed kitchen waste was evenly weighed into 250 mL screw bottle, and the pH of kitchen waste was adjusted to 3, 5, 7, and 9 by using 2 mol/L HCl and NaOH, while the pH adjustment was not performed in the control group. After each sampling, the reactors were manually adjusted to target pH values using a digital pH meter (HQ11D, HACH, Loveland, CO, USA), followed by 10 min shaking to ensure homogeneity. The screw bottles were sealed and placed in a shaker in a 35 °C incubator and cultured for 10 days with 80 r/min vibration. During this period, the pH of the experimental group was adjusted to the corresponding value every 24 h, and the supernatant was collected to determine the changes of pH, ORP, SCOD, TN, VFAs, and other parameters.
In order to verify the feasibility of kitchen waste fermentation liquid as a carbon source, three experimental groups were set up in this study, namely: kitchen waste fermentation liquid as a carbon source experimental group, low C/N influent water as a control group, and methanol as a supplementary carbon source control group. After the A2O process started and stabilized, the kitchen waste fermentation liquid was added to the raw water as a supplementary carbon source, and the influent COD concentration and C/N were adjusted to 300–350 mg/L and 6–7. Methanol was used as the carbon source, and the COD concentration of influent water was adjusted to be consistent with that of the experimental group. The control experiment was carried out to analyze the difference between the N removal efficiency of kitchen waste fermentation liquid as a carbon source and that of methanol as a carbon source. The concentrations of COD, NH4+-N, and TN in influent and effluent water were monitored every 24 h, and the differences among the three groups were analyzed by means of average values.
2.5. Methods of Chemical and Microbiological Analysis
SCOD, NH4+-N, and TN were measured by standard methods [10]. Digital pH/ORP meter (HQ11D, HACH, USA) was for pH and ORP measurement. The yield and composition of VFAs were determined by gas chromatography (Agilent, 7890A, Agilent Technologies, Santa Clara, CA, USA) and DB-FATWAX UI column (30 m × 0.25 mm × 0.25 μm). To improve the reliability of the experiment and eliminate errors, the measurements were repeated three times.
All samples were collected, and DNA was extracted from the experimental samples by utilizing the Power Soil DNA Kit (Mobio, Carlsbad, CA, USA). Polymerase chain reaction (PCR) amplification was performed with 338F (50-ACCTACGGCAGGCA-30) and 806R (50-GGACTACCAGGCTCTA-30), which were regarded as PCR primers. The biological samples were sent to the Illumina MiSeq (Shanghai, China) detection platform after being analyzed and amplified.
The function of 16S rRNA was predicted by the Kyoto Encyclopedia of Genes and Genomes (KEGG) database. The operational taxonomic unit (OTU) abundance table was standardized and 16S marker genes were removed by PICRUSt. The KEGG Orthology (KO) functional information was used to label the pathways after KO information was clustered and calculated. PICRUSt software (v2.6.1) was utilized for capturing annotation information and abundance (levels 1–3).
3. Results and Discussion
3.1. Effect of pH on Acidification and Hydrolysis During Kitchen Waste AF Progress
3.1.1. SCOD
The effect of intermittent pH adjustment on SCOD during the kitchen waste AF process was shown in Figure 2A. The SCOD content in each AF reactor first increased and then decreased. The SCOD dissolved at pH = 7 and pH = 9 was significantly higher than that at pH = 3 and pH = 5, and the SCOD dissolved at pH = 7 was slightly higher than that at pH = 9.
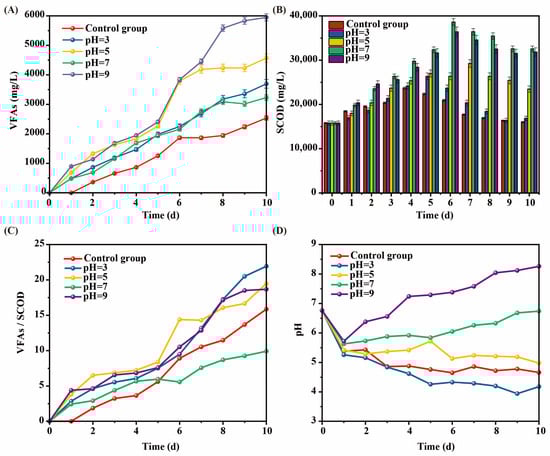
Figure 2.
Effect of intermittent pH regulation on (A) SCOD, (B) VFAs, (C) VFAs/SCOD ratio, and (D) pH variation during kitchen waste fermentation. (Error bars represent standard deviation).
When pH adjustment was performed during kitchen waste AF progress, the amount of SCOD dissolved changed significantly, and the SCOD value in the alkaline environment was significantly higher than that in the acidic environment, which was consistent with [11]. Different from that study, the optimal SCOD dissolution in this study appeared at pH = 7, which was significantly higher than pH = 3 and pH = 5, and slightly higher than pH = 9. However, Lin and Li [11] found that the SCOD dissolution at pH = 9 was higher than that at pH = 7. The reason for the difference may be related to the mode of pH regulation.
3.1.2. VFAs
The effect of intermittent pH adjustment on VFA concentration during the kitchen waste AF process is shown in Figure 2B. The VFA content in each AF reactor of kitchen waste showed a trend of continuous increase. The VFA production of all experimental groups was higher than that of control group, and the concentration of VFAs of the experimental group with pH = 9 was significantly higher than that of other groups, reaching a maximum value of 5947 mg/L on the 10th day, about 2.66 times that of the control group. These results indicated that both acidic and alkaline regulation could promote the production of VFAs, and that the alkaline environment was more conducive to the production of VFAs.
The reasons why the alkaline environment was more conducive to VFA production may be as follows. First, the alkaline environment was conducive to the growth and reproduction of acid-producing bacteria [12]. Second, the regulatory changes of dominant bacteria under alkaline conditions promoted the hydrolysis and acidification of organic matter [13]. Except for at pH = 7, the VFA concentration was positively correlated with the dissolution rate of SCOD. The more SCOD dissolved, the more VFA was converted. The reason for the high SCOD but low VFA content at pH = 7 in kitchen waste AF may be that the dominant growth environment of methanogens was pH neutral or near neutral [14], so that methanogens consumed a large amount of VFAs.
3.1.3. VFAs/SCOD Ratio
The effect of intermittent pH adjustment on VFAs/SCOD ratio during the kitchen waste AF process was demonstrated in Figure 2C. The VFAs/SCOD ratio in each AF reactor of kitchen waste increased continuously. The VFAs/SCOD ratio at pH = 9 was relatively high, indicating that this condition was conducive to VFA transformation, while the VFAs/SCOD ratio at pH = 7 was much smaller than that of other groups in the later stage.
The high yield of VFAs (Figure 2A) and the VFAs/SCOD ratio were at a high value when pH = 9, indicating that this condition was the optimal AF environment in this study. The degree of cell hydrolysis under alkaline conditions (pH = 9) was significantly higher than that under neutral conditions (pH = 7), indicating that the alkaline environment promoted the cell wall rupture, accelerated the release of organic matter, and, thus, improved the production efficiency of VFAs, resulting in a sustained high VFAs/SCOD ratio. In a neutral pH of 7, methanogens were more active [14], converting VFAs to CH4 and reducing the VFAs/SCOD ratio.
3.1.4. The Variation in pH
The pH variation in the AF process of kitchen waste is shown in Figure 2D. The pH in each AF reactor decreased rapidly on the 1st day. However, different from other experimental groups, the pH of the experimental groups with pH = 7 and pH = 9 showed a continuous rise from 2nd day, and the rise of pH at pH = 9 was significantly greater than that at pH = 7. The pH of the remaining three groups (pH = 3, pH = 5, and the control group) generally showed a slow downward trend.
The above phenomenon indicated that the changes in pH gradually tended to be stable and close to the adjusted target pH in the later stage of the AF. Combined with the changes in SCOD and pH, it could be seen that the dissolution of SCOD was related to pH, and alkaline and neutral conditions were more conducive to the increase in SCOD content. The pH during kitchen waste AF progress decreased rapidly at the beginning stage, and the amount of SCOD dissolved in this stage was less, which may be due to the domestication of microorganisms at the beginning stage, which inhibited their adaptation to the environment. With the continuous enhancement of acidic conditions, more acid and alkali resistant bacteria formed, and the pH change tended to be stable [15].
3.2. Effect of pH on the TN During Kitchen Waste AF Progress
3.2.1. TN
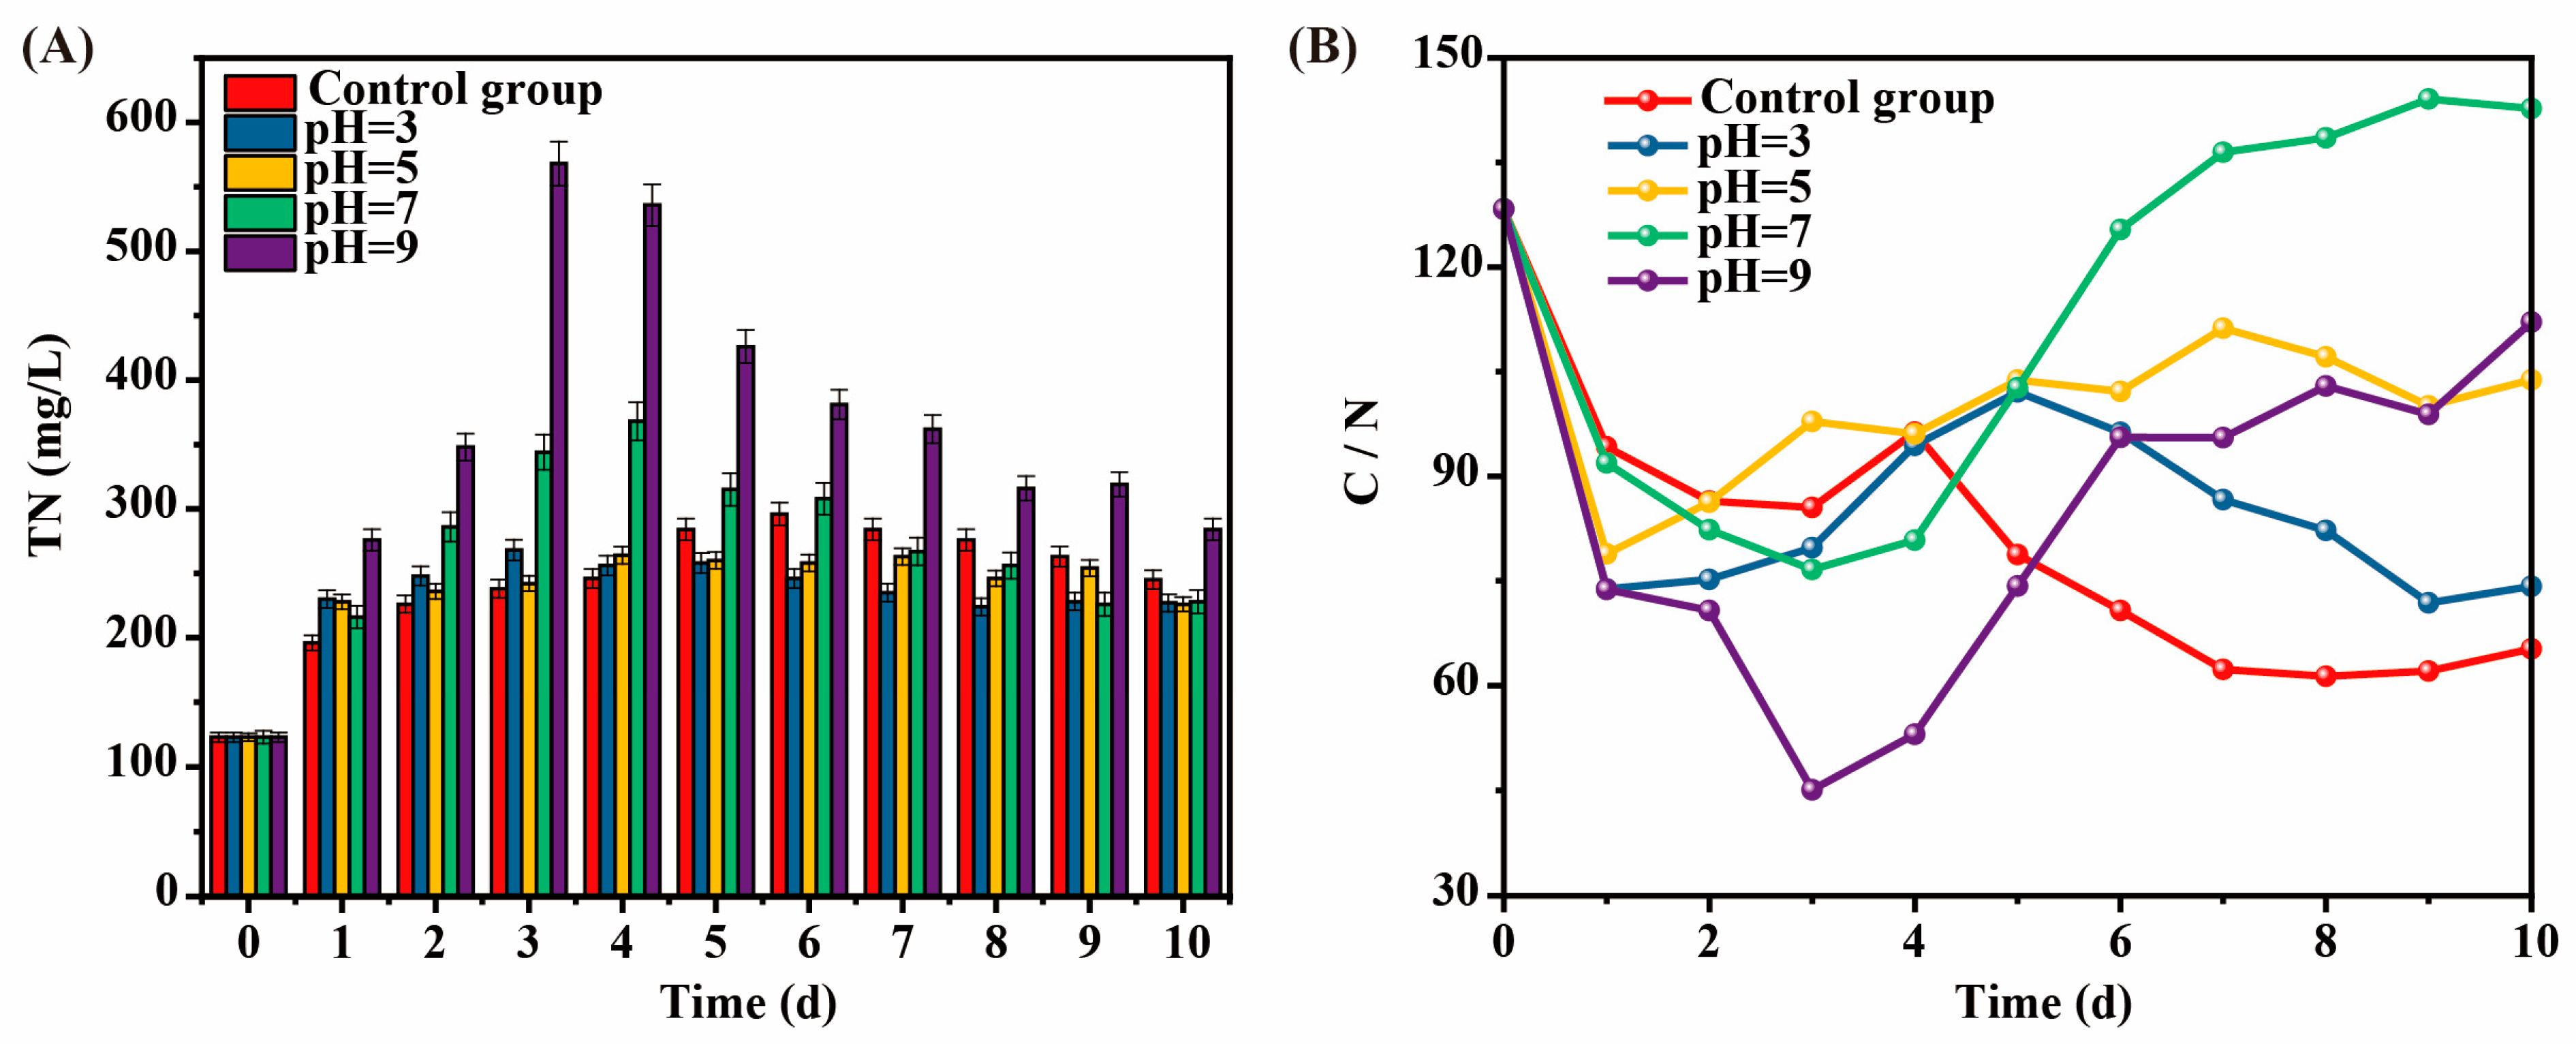
The effect of intermittent pH adjustment on TN during the kitchen waste AF process was shown in Figure 3A. TN was produced by the hydrolysis of macromolecular organic matter during the AF of kitchen waste to produce VFAs, mainly in the form of NH4+-N and NH3 [16]. The TN concentrations in all experimental groups increased first and then decreased. Among them, the TN increased rapidly and reached a peak in the 3rd to 4th day. Subsequently, TN gradually degraded and became stable on the 8th day with the deepening of AF. This may be because as the AF reaction proceeded, and the microorganisms that could utilized in the kitchen waste themselves grew and multiplied, thus consuming part of the NH4+-N. Meanwhile, the peak TN concentration in the alkaline AF group (pH = 9) was significantly higher than that in the acidic AF group (pH = 5 and pH = 3), indicating that the alkaline environment was more conducive to TN accumulation. In addition, under the neutral condition of pH = 7, the TN concentration changed between the acidic and alkaline conditions, showing that the neutral environment had a balanced effect on TN accumulation and degradation.

Figure 3.
The effect of intermittent pH regulation on TN (A) and C/N ratio (B) during kitchen waste AF progress.
3.2.2. C/N Ratio
In the early stage of AF of kitchen waste, the TN concentration kept increasing, resulting in a decrease in the C/N ratio, which would affect the growth and reproduction of acid-producing bacteria [17]. Meanwhile, the C/N ratio would affect the carbon source quality in the subsequent biological N removal process. Therefore, the C/N ratio changed during kitchen waste AF progress after the pH adjustment was studied (Figure 3B). The C/N ratio in each AF reactor of kitchen waste first decreased and then increased. The C/N ratio of pH = 7 was the highest, while the pH = 9 group with the highest VFAs production did not show a significant advantage in the C/N ratio due to excessive TN release. The C/N ratio of pH = 3, pH = 5, and the control group was ranked as follows: the control group < pH = 3 < pH = 5. The C/N ratio was basically consistent with the rule of SCOD dissolution value, and the SCOD dissolution value increased with the increase in the C/N ratio. Overall, although the VFA yield at pH = 7 was lower than that at pH = 9, its C/N ratio was nearly 150, which was more suitable as a carbon source for subsequent N removal.
3.3. Enhanced Effect of VFAs Produced from Kitchen Waste AF on N Removal by A2O Process
Table 2 shows the N removal effect of kitchen waste fermentation liquid as a carbon source to enhance A2O process. The addition of carbon source improved the denitrification effect, and the effluent TN concentration decreased from 19.35 mg/L to 12.16 mg/L when methanol was used as a carbon source and to 13.64 mg/L when kitchen waste fermentation liquid was utilized as a carbon source. The effluent was stable with good effect and did not harm the environment. Therefore, it was feasible to use kitchen waste fermentation liquid as a denitrification carbon source, which could achieve the same denitrification enhancement effect as the traditional supplementary carbon source.
Table 2.
N removal by A2O enhanced process with VFAs produced from kitchen waste AF. (Data presented as mean ± standard deviation).
The addition of organic matter had an impact on nitrification [18], and the removal efficiency of NH4+-N decreased from 96.65% to 95.77% (when methanol was used as the carbon source) and 93.68% (when kitchen waste fermentation liquid was utilized as the carbon source). When kitchen waste fermentation liquid was used as the carbon source, the conversion rate of macromolecular organic matter in the reaction process was lower than that when methanol was utilized as the carbon source, thus making the inhibition of nitrification more serious. However, when the kitchen waste fermentation liquid was used as the carbon source, it did not cause the effluent COD concentration of the process to exceed the standard. Although the effluent concentration was higher than that when the low C/N ratio influent water and methanol were used as a carbon source, it still met the emission requirements.
3.4. Microbial Community Changes
3.4.1. Microbial Diversity Analysis
Table 3 shows the richness and diversity of microbial communities under different carbon sources. The Shannon and Simpson indices are effective indicators of microbial diversity [19]. Compared to methanol as a carbon source, when fermentation broth was used as the carbon source, the Shannon and Simpson indices of the microbial community increased from 4.995 and 0.048 to 5.109 and 0.040, respectively, indicating an enhancement in microbial diversity. However, the ACE and Chao indices decreased in comparison.
Table 3.
Richness and diversity of microbial communities.
Venn diagrams are useful for evaluating the similarity and differences within microbial communities [20]. As shown in Figure 4A, the control group and experimental group shared 1145 OTUs. Compared to the control group, when fermentation broth was used as the carbon source, the number of unique OTUs decreased. These differences in unique OTUs highlight the variations in microbial communities across different groups [21].
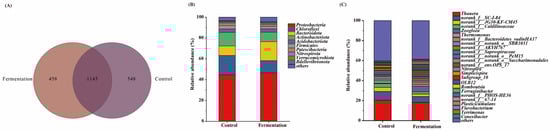
Figure 4.
Venn diagram (A) and relative abundances at phylum (B) and at genera (C) level of all samples.
3.4.2. Microbial Composition
Figure 4B illustrates the relative abundance of microbial communities at the phylum level in systems using methanol and fermentation broth as carbon sources. From the Figure 4B, Proteobacteria, Chloroflexi, Bacteroidota, and Actinobacteriota are the dominant phyla across all experimental groups. Proteobacteria possesses a broad metabolic capacity and plays a crucial role in denitrification [22], closely correlating with the denitrification performance of the system. The relative abundance of Proteobacteria was 44.71% in the methanol system and 46.60% in the fermentation system, with the increase in its abundance indicating the excellent denitrification performance of the fermentation broth as a carbon source. Chloroflexi has been shown to be a dominant phylum in granular sludge formation and plays a significant role in nitrogen removal from wastewater [23]. Its relative abundance was 18.59% in the methanol system and 11.67% in the fermentation system, suggesting that the Chloroflexi-related microbiome is more easily enriched in the methanol-based system. However, Chloroflexi still maintained a relatively high abundance in the fermentation system, further confirming the effective denitrification performance in this system. Bacteroidota plays an important role in nitrogen cycling [24], and its relative abundance in the fermentation system was higher than in the methanol system, possibly because these microbial communities better utilize the fermentation broth for denitrification. The relative abundance of Actinobacteriota was similar in both the fermentation and methanol systems, indicating that Actinobacteriota also contributes to nitrogen removal in the fermentation broth metabolism [25]. Additionally, Firmicutes, an important denitrifying group in anaerobic environments [26], remained dominant in the denitrification system using fermentation broth as a carbon source, further supporting its role in denitrification under fermentation conditions.
Figure 4C illustrates the relative abundance of microbial genera in systems using fermentation broth and methanol as carbon sources. Thauera, Norank_f__SC-I-84, and G30-KF-CM45 were the dominant genera in all experimental groups. Thauera exhibited the highest relative abundance in both the methanol and fermentation broth systems, at 20.34% and 18.22%, respectively. Thauera is a facultative autotroph that can grow on a variety of organic substrates, and its growth is promoted by organic matter. It is also a denitrifying genus that reduces NO3−-N to NO2−-N, playing a key role in the denitrification process [27]. This explains why the microorganisms in the fermentation broth system can also better utilize fermentation broth as a carbon source, providing both energy and electron donors to promote denitrification. The genus Norank_f__SC-I-84, associated with organic matter degradation, had a higher relative abundance in the methanol system (8.78%), reflecting the ease with which methanol, as a small-molecule carbon source, is degraded by microorganisms [28]. However, its abundance in the fermentation broth system remained at 5.87%, indicating that fermentation broth also possesses degradable characteristics as a carbon source. JG30-KF-CM45, a genus within Chloroflexi closely related to denitrification [29], showed similar abundance in both carbon source systems, indicating that the denitrification performance of the fermentation broth system is comparable to that of the methanol system. The relative abundance of the denitrifying genus norank_f__Caldilineaceae [30] and Thermomonas, involved in the nitrogen cycle [29], followed a similar pattern, further demonstrating the excellent denitrification performance of the fermentation broth system. Furthermore, the relative abundance of the heterotrophic denitrifier Zoogloea was 5.17% higher in the fermentation broth system compared to the methanol system, providing strong evidence that microorganisms can utilize fermentation broth as a carbon source for denitrification [31].
3.5. Effects of Carbon Sources on Functional Metabolism
3.5.1. Functional Prediction Analysis
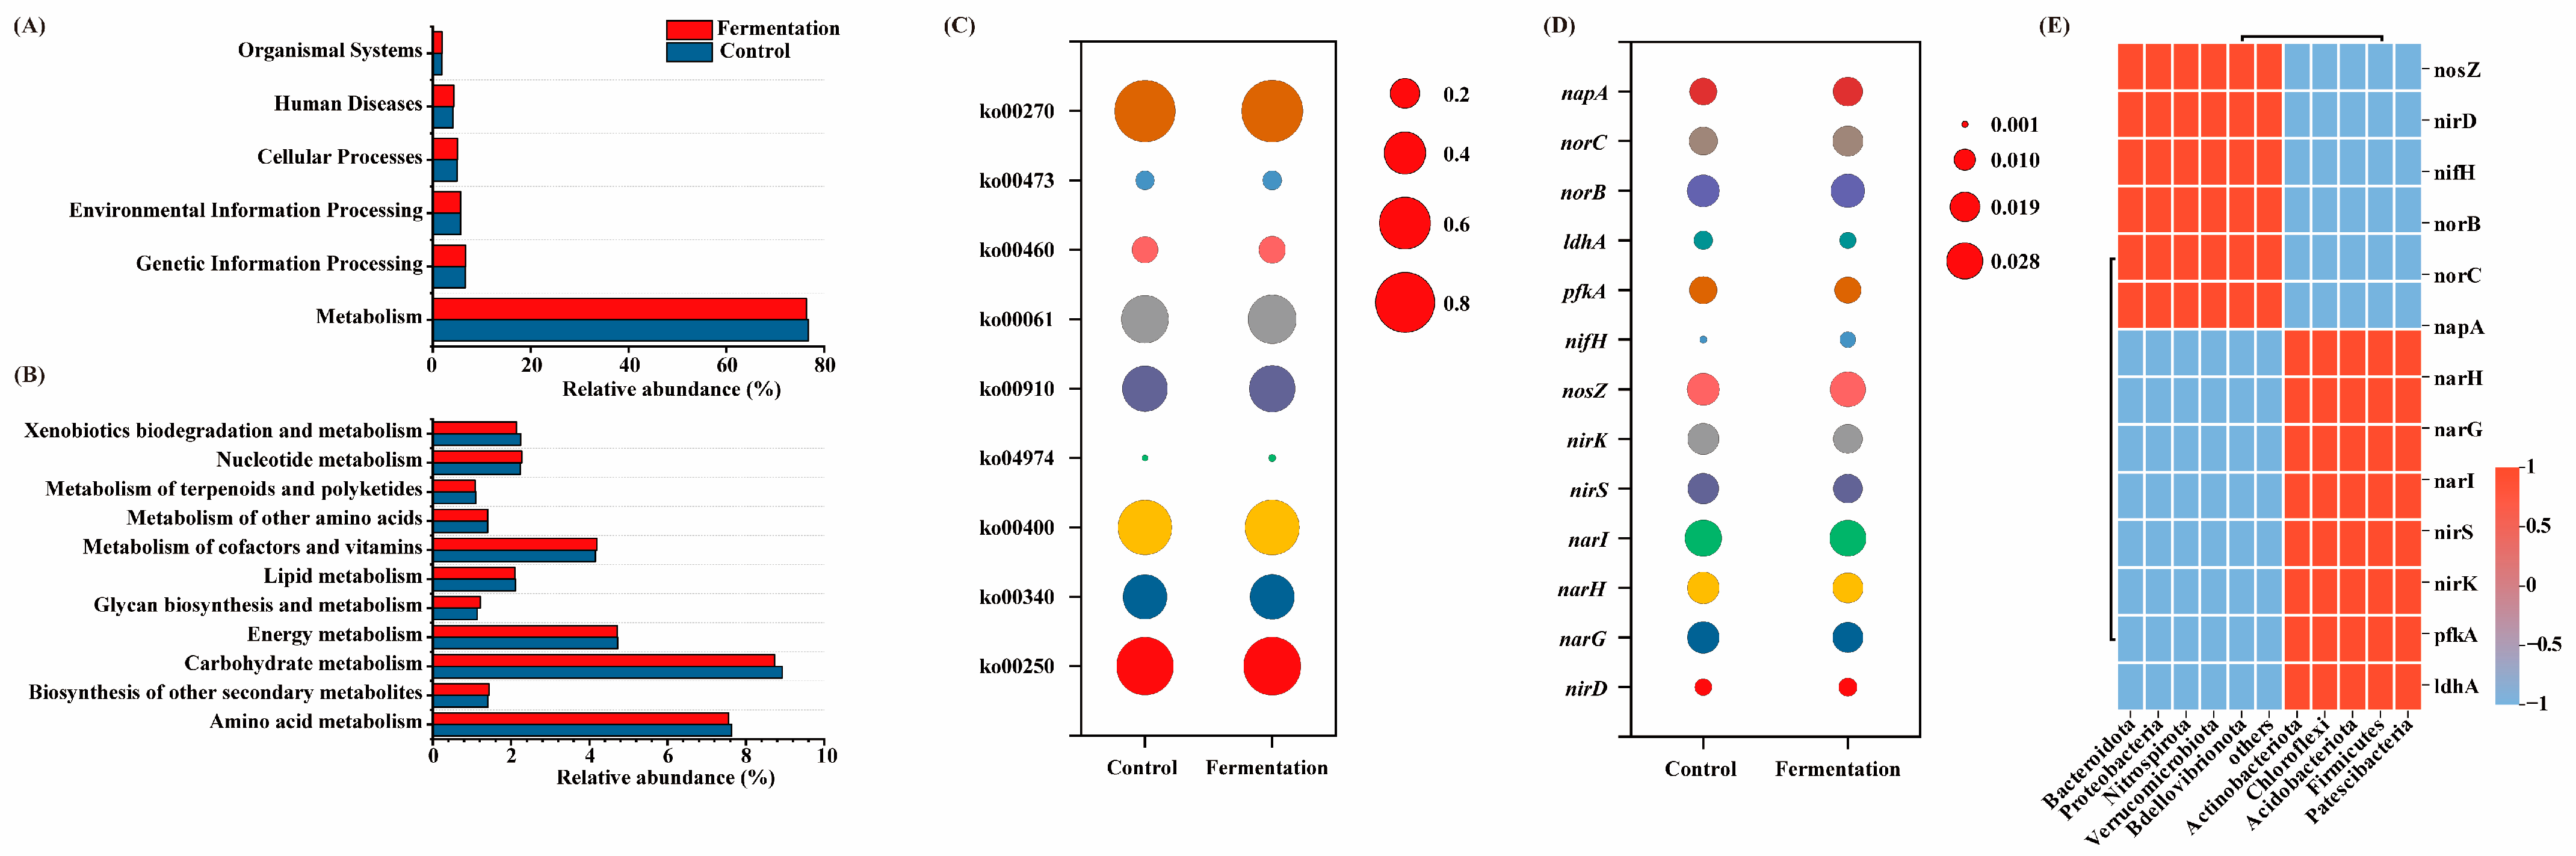
Figure 5A–C display the functional prediction analysis of microbial communities when methanol and fermentation broth were used as carbon sources. At the Level 1 KEGG pathway, there were minimal differences in abundance (Figure 5A). Among these pathways, metabolism was the predominant functional category, accounting for over 76% in all cases. A further analysis of various metabolic pathways was conducted at Level 2. Figure 5B shows the abundance of 14 core metabolic pathways at Level 2. Amino acid metabolism and carbohydrate metabolism were the main metabolic pathways. Compared to methanol as a carbon source, when fermentation broth was used, the relative abundance of amino acid metabolism and carbohydrate metabolism decreased slightly from 7.64% and 8.93% to 7.56% and 8.73%, respectively. Both amino acid metabolism and carbohydrate metabolism play critical roles in the generation of VFAs [32]. Although the performance was slightly lower when fermentation broth was used as the carbon source compared to methanol, the difference was minimal, and the relative abundances remained sufficiently high to meet the necessary requirements. Additionally, when fermentation broth was used as the carbon source, the relative abundance of metabolism of other amino acids showed an increase.
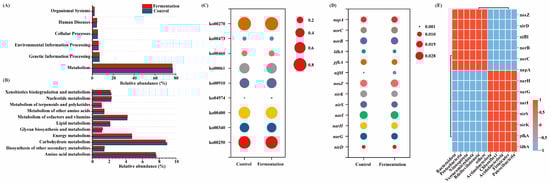
Figure 5.
The KEGG pathways abundances of samples at level 1 (A), Level 2 (B), and Level 3 (C); functional genes related to denitrification (D); correlation between microbial communities and functional gene enrichment (E).
Figure 5C shows the abundance of the Level 3 pathways for amino acid and carbohydrate metabolism. Compared to methanol as a carbon source, when fermentation broth was used, nitrogen metabolism (Ko00910) increased from 0.44% to 0.47%. This suggests that the fermentation broth system enhances nitrogen metabolism, thereby improving the denitrification performance of the A2O process. Additionally, protein digestion and absorption (Ko04974) and fatty acid biosynthesis (Ko00061) also showed increased abundance, indicating that fermentation broth promotes the utilization of proteins and lipids by microorganisms, which are subsequently involved in the N cycle. Specifically, when fermentation broth was used as a carbon source, proteins were broken down into amino acids, which further participate in the nitrogen cycle. During this process, pathways such as alanine, aspartate, and glutamate metabolism (Ko00250), histidine metabolism (Ko00340), cyanoamino acid metabolism (Ko00460), D-alanine metabolism (Ko00470), and cysteine and methionine metabolism (Ko00270) were enhanced. The results suggest that, when fermentation broth is used as a carbon source, amino acid metabolism becomes the primary metabolic pathway, supporting the denitrification process.
3.5.2. Functional Gene Analysis
Nitrogen metabolism is a series of reactions driven by enzymes encoded by functional genes. Figure 5D shows the relative abundance of functional genes involved in the denitrification process. The denitrification genes primarily include narG, narH, and napA (which reduce NO3− to NO2−), nirS and nirK (which reduce NO2− to N2O), norB and norC (which reduce N2O to NO), and nosZ (which reduces N2O to N2) [33,34]. Overall, the relative abundance of these functional genes was similar when methanol and fermentation broth were used as carbon sources. Specifically, compared to the methanol system, the fermentation broth system showed an increase in the abundance of related functional genes such as napA, norB, and nosZ. Notably, the enrichment of nosZ confirmed the key role of Thauera in the denitrification process within the system [35]. In addition, the abundance of nirD and napA, which act as auxiliary regulatory factors in the denitrification process, was also enhanced.
Figure 5E shows the correlation analysis between microbial communities and the enrichment of functional genes. Key microorganisms, including Bacteroidota, Proteobacteria, Nitrospirota, Verrucomicrobiota, and Bdellovibrionota, exhibited significant positive correlations with key functional genes involved in the denitrification process, such as nosZ, nirD, nifH, norB, norC, and napA. Compared to the methanol system, the enrichment of functional microbes like Bacteroidota and Proteobacteria in the fermentation system led to an increased abundance of key denitrification genes, thus facilitating the denitrification process.
3.6. Key Enzyme Analysis
3.6.1. N Cycle
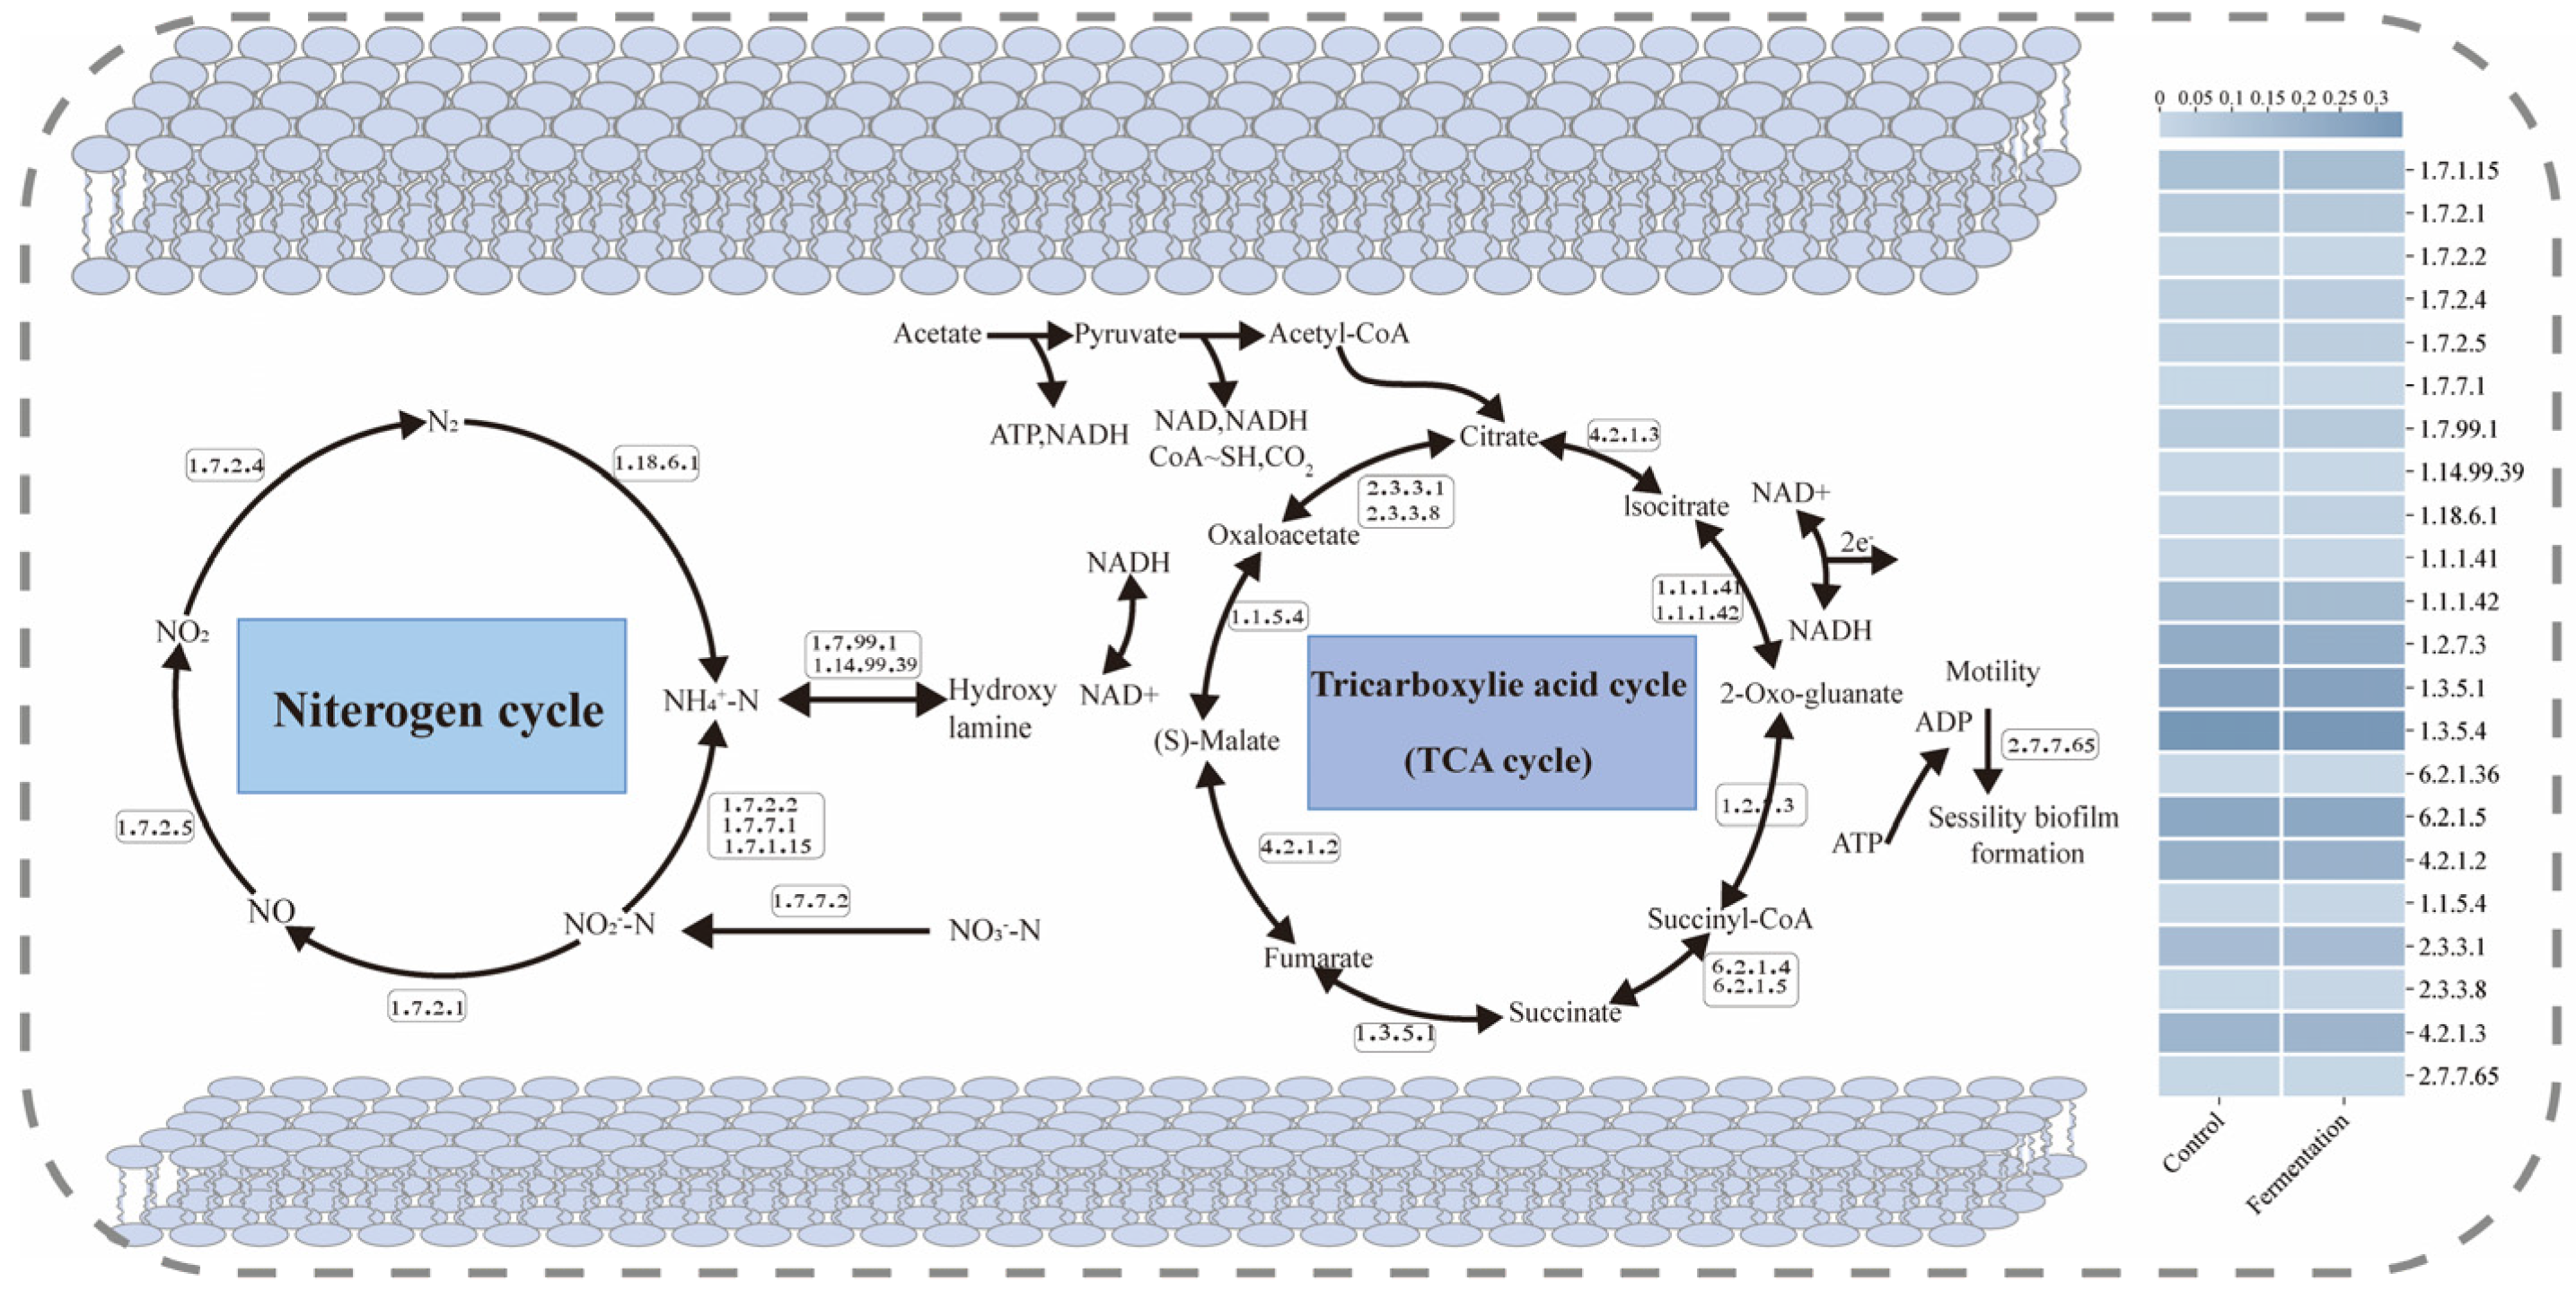
Figure 6 illustrates the schematic diagrams of the N cycle and the tricarboxylic acid (TCA) cycle under different carbon source conditions. In the N cycle, NO2−-N is reduced to NO by reductases [EC: 1.7.1.15] and [EC: 1.7.2.1], which is then further degraded to N2O by nitric oxide reductase (cytochrome c) [EC: 1.7.2.5] and eventually converted into N2 [36]. In the fermentation broth system, the activities of [EC: 1.7.1.15], [EC: 1.7.2.1], and [EC: 1.7.2.5] were enhanced, accelerating the denitrification rate. Moreover, key enzymes involved in the denitrification process, [EC: 1.7.2.2] and [EC: 1.7.2.3], were also significantly elevated in the fermentation broth system.
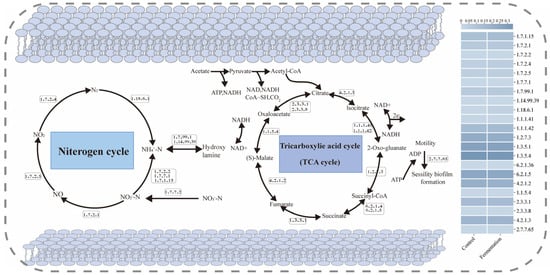
Figure 6.
Schematic diagram of the N metabolism and TCA cycle pathways with enzyme abundance.
3.6.2. TCA Cycle
In the N cycle, the TCA cycle supported microbial growth and metabolic activities by providing energy and metabolic intermediates, which indirectly influence nitrogen transformation processes [37]. Within the TCA cycle, isocitrate dehydrogenase (NADP+) [EC: 1.1.1.42] catalyzes the conversion of isocitrate to α-ketoglutarate (α-KG), releasing CO2 and generating NADPH [38]. During the denitrification process, NADPH may be used to produce reduced cofactors, providing the necessary electrons for electron transfer in the denitrification process [39]. Additionally, succinate-CoA ligase (ADP-forming) [EC: 6.2.1.5] and ATP citrate synthase [EC: 2.3.3.8] generate extra ATP and metabolic intermediates, thereby indirectly supporting denitrification activity [40]. The activities of these enzymes were also enhanced in the fermentation broth system.
4. Conclusions
Neutral and alkaline conditions can enhance the release of SCOD and the conversion of VFAs during kitchen waste AF, with a more pronounced effect under alkaline conditions. The release of TN was also most significant under alkaline conditions, while the experimental group with a pH of 7 exhibited the highest C/N ratio. A comprehensive analysis indicated that pH 9 is the optimal pH for intermittent regulation. Furthermore, when compared to methanol as a carbon source, the fermentation broth as a carbon source resulted in a higher enrichment of Proteobacteria and Bacteroidota. Additionally, the relative abundance of key functional genes and enzymes involved in denitrification was also enhanced. Therefore, using kitchen waste fermentation broth as a carbon source for denitrification in the A2O process is feasible and can achieve a denitrification enhancement effect equivalent to that of traditional supplemental carbon sources. This study was limited to lab-scale batch experiments, and long-term continuous operation and economic feasibility analysis under real-world conditions are needed. Scaling up this process requires the optimization of pH regulation in continuous reactors and integration with existing sludge management systems. Pilot-scale trials are recommended to validate long-term stability under dynamic wastewater conditions.
Author Contributions
S.X.: Data curation, Investigation, Methodology, Writing—original draft. W.W.: Investigation, Data curation, Writing—review and editing. X.H.: Conceptualization, Funding acquisition, Writing—review and editing. C.L.: Funding acquisition, Writing—review and editing. All authors have read and agreed to the published version of the manuscript.
Funding
This work was supported by a project grant from the Major Basic Research Project of the Natural Science Foundation of the Jiangsu Higher Education Institutions [grant number 24KJA610005]; and the National College Students Innovation and Entrepreneurship Training Program [grant number 202410300031Z].
Data Availability Statement
The original contributions presented in this study are included in the article. Further inquiries can be directed to the corresponding author.
Conflicts of Interest
The authors declare that they have no known competing financial interests or personal relationships that could have appeared to influence the work reported in this paper.
References
- Meng, Q.; Liu, H.; Zhang, H.; Xu, S.; Lichtfouse, E.; Yun, Y. Anaerobic digestion and recycling of kitchen waste: A review. Environ. Chem. Lett. 2022, 20, 1745–1762. [Google Scholar] [CrossRef]
- Feng, L.; Yuan, F.; Liu, F.; Wang, T.; Chen, Y. Research progress on lactic acid production from food waste by fermentation. J. Tongji. Uni. (Nat. Sci.) 2021, 49, 1688–1700. [Google Scholar]
- Luo, J.; Huang, W.; Zhang, Q.; Guo, W.; Wu, Y.; Feng, Q.; Fang, F.; Cao, J.; Su, Y. Effects of different hypochlorite types on the waste activated sludge fermentation from the perspectives of volatile fatty acids production, microbial community and activity, and characteristics of fermented sludge. Bioresour. Technol. 2020, 307, 123227. [Google Scholar] [CrossRef] [PubMed]
- Mineo, A.; Di Leto, Y.; Cosenza, A.; Capri, F.C.; Gallo, G.; Alduina, R.; Ni, B.J.; Mannina, G. Enhancing volatile fatty acid production from sewage sludge in batch fermentation tests. Chemosphere 2024, 349, 140859. [Google Scholar] [CrossRef]
- Singh, R.; Palar, S.; Kowalczewski, A.; Swope, C.; Parameswaran, P.; Sun, N. Adsorptive recovery of volatile fatty acids from wastewater fermentation broth. J. Environ. Chem. Eng. 2023, 11, 110507. [Google Scholar] [CrossRef]
- Li, X.; Yu, Z.; Ge, X.; Zhang, W.; Fang, Y.; Liu, W.; Wang, A. Volatile fatty acids bio-production using extracellular polymeric substances disengaged from sludge for carbon source recycling. Bioresour. Technol. 2023, 386, 129565. [Google Scholar] [CrossRef] [PubMed]
- Liu, Y.; Yuan, Y.; Li, X.; Kang, X.; Du, M. Succession of bacterial community in anaerobic–anoxic–aerobic (A2O) bioreactor using sludge fermentation liquid as carbon source. Desalination Water Treat. 2015, 54, 1061–1069. [Google Scholar] [CrossRef]
- Wu, C.Y.; Peng, Y.Z.; Wan, C.L.; Wang, S.Y. Performance and microbial population variation in a plug-flow A2O process treating domestic wastewater with low C/N ratio. J. Chem. Technol. Biotechnol. 2011, 86, 461–467. [Google Scholar] [CrossRef]
- Lu, H.; Gu, L.; Guo, Z.; Fan, P.; Liu, M.; Cui, L.; Yu, L.; Peng, Z. The effect of carbon source produced by modified corncob fermentation on denitrification. J. Water Process Eng. 2024, 60, 105235. [Google Scholar] [CrossRef]
- APHA. Standard Methods for the Examination of Water and Wastewater, 21st ed.; American Public Health Association: Washington, DC, USA, 2000. [Google Scholar]
- Lin, L.; Li, X.Y. Effects of pH adjustment on the hydrolysis of Al-enhanced primary sedimentation sludge for volatile fatty acid production. Chem. Eng. J. 2018, 346, 50–56. [Google Scholar] [CrossRef]
- Li, Y.F.; Ren, N.Q.; Chen, Y.; Zheng, G.X. Ecological mechanism of fermentative hydrogen production by bacteria. Int. J. Hydrogen Energy 2007, 32, 755–760. [Google Scholar] [CrossRef]
- Shi, C.; Ma, J.; Wu, H.; Luo, J.; Liu, Y.; Li, K.; Zhou, Y.; Wang, K. Evaluation of pH regulation in carbohydrate-type municipal waste anaerobic co-fermentation: Roles of pH at acidic, neutral and alkaline conditions. Sci. Total Environ. 2022, 853, 158327. [Google Scholar] [CrossRef] [PubMed]
- Qiu, S.; Zhang, X.; Xia, W.; Li, Z.; Wang, L.; Chen, Z.; Ge, S. Effect of extreme pH conditions on methanogenesis: Methanogen metabolism and community structure. Sci. Total Environ. 2023, 877, 162702. [Google Scholar] [CrossRef] [PubMed]
- Guan, N.; Liu, L. Microbial response to acid stress: Mechanisms and applications. Appl. Microbiol. Biotechnol. 2020, 104, 51–65. [Google Scholar] [CrossRef]
- Xia, Q.; Liu, F.; Sun, S.; Huang, W.; Zhao, Z.; Yang, F.; Lei, Z.; Huang, W.; Yi, X. Coupling iron sludge addition and intermittent aeration for achieving simultaneous methanogenesis, feammox, and denitrification in a single reactor treating fish sludge. Environ. Sci. Technol. 2023, 57, 15065–15075. [Google Scholar] [CrossRef]
- Huang, X.; Dong, W.; Wang, H.; Feng, Y.; Sun, F.; Zhou, T. Sludge alkaline fermentation enhanced anaerobic-multistage anaerobic/oxic (A-MAO) process to treat low C/N municipal wastewater: Nutrients removal and microbial metabolic characteristics. Bioresour. Technol. 2020, 302, 122583. [Google Scholar] [CrossRef]
- Æsøy, A.; Ødegaard, H.; Bentzen, G. The effect of sulphide and organic matter on the nitrification activity in a biofilm process. Water Sci. Technol. 1998, 37, 115–122. [Google Scholar] [CrossRef]
- Cao, W.; Fang, S.; Wu, Q.; Wu, Y.; Feng, L.; Xie, Z.; Feng, Q.; Fang, F.; Xu, Z.; Luo, J.; et al. Choline chloride pretreatment on volatile fatty acids promotion from sludge anaerobic fermentation: In-situ deep eutectic solvents-like formation for EPS disintegration and associated microbial functional profiles upregulation. Chem. Eng. J. 2023, 467, 143556. [Google Scholar] [CrossRef]
- Awasthi, M.K.; Zhang, Z.; Wang, Q.; Shen, F.; Li, R.; Li, D.S.; Ren, X.; Wang, M.; Chen, H.; Zhao, J. New insight with the effects of biochar amendment on bacterial diversity as indicators of biomarkers support the thermophilic phase during sewage sludge composting. Bioresour. Technol. 2017, 238, 589–601. [Google Scholar] [CrossRef]
- Pang, H.; Jiao, Q.; An, L.; Yang, T.; He, J.; Xie, B.; Yan, Z.; Lu, J. New insight into selective Na+ stress on acidogenic fermentation of waste activated sludge from microbial perspective: Hydrolase secretion, fermentative bacteria screening, and metabolism modification. Chem. Eng. J. 2022, 442, 136098. [Google Scholar] [CrossRef]
- Han, F.; Zhang, M.; Shang, H.; Liu, Z.; Zhou, W. Microbial community succession, species interactions and metabolic pathways of sulfur-based autotrophic denitrification system in organic-limited nitrate wastewater. Bioresour. Technol. 2020, 315, 123826. [Google Scholar] [CrossRef]
- Li, X.R.; Du, B.; Fu, H.X.; Wang, R.F.; Shi, J.H.; Wang, Y.; Jetten, M.S.; Quan, Z.X. The bacterial diversity in an anaerobic ammonium-oxidizing (anammox) reactor community. Syst. Appl. Microbiol. 2009, 32, 278–289. [Google Scholar] [CrossRef] [PubMed]
- Hong, P.; Pang, Y.; Xu, J.; Wang, Q.; Lin, H.; Ruan, Y.; Shu, Y.; Zhang, K.; Leung, K.M. Transformation fate of bisphenol A in aerobic denitrifying cultures and its coercive mechanism on the nitrogen transformation pathway. Environ. Res. 2025, 268, 120816. [Google Scholar] [CrossRef]
- Ajibade, F.O.; Yin, W.X.; Guadie, A.; Ajibade, T.F.; Liu, Y.; Kumwimba, M.N.; Liu, W.Z.; Han, J.L.; Wang, H.C.; Wang, A.J. Impact of biochar amendment on antibiotic removal and ARGs accumulation in constructed wetlands for low C/N wastewater treatment. Chem. Eng. J. 2023, 459, 141541. [Google Scholar] [CrossRef]
- Luo, J.; Liang, H.; Yan, L.; Ma, J.; Yang, Y.; Li, G. Microbial community structures in a closed raw water distribution system biofilm as revealed by 454-pyrosequencing analysis and the effect of microbial biofilm communities on raw water quality. Bioresour. Technol. 2013, 148, 189–195. [Google Scholar] [CrossRef] [PubMed]
- Yun, H.; Liang, B.; Kong, D.; Wang, A. Improving biocathode community multifunctionality by polarity inversion for simultaneous bioelectroreduction processes in domestic wastewater. Chemosphere 2018, 194, 553–561. [Google Scholar] [CrossRef]
- Wang, Q.; Liang, Y.; Tang, J.; Pu, Z.; Chen, Y.; Huang, L. Biological mechanisms affecting the release of greenhouse gases from microbial fuel cell-constructed wetland by simultaneously altering structure and electron shuttles. J. Clean. Prod. 2024, 466, 142919. [Google Scholar] [CrossRef]
- Luo, Y.; Yi, K.; Zhang, X.; Li, B.; Cao, R.; Pang, Y.; Li, M.; Hou, C.; Lv, J.; Li, X.; et al. Simultaneous partial nitrification, denitrification, and phosphorus removal in sequencing batch reactors via controlled reduced aeration and short-term sludge retention time decrease. J. Environ. Manag. 2023, 344, 118598. [Google Scholar] [CrossRef]
- He, Q.; Zhang, Q.; Su, J.; Li, M.; Lin, B.; Wu, N.; Shen, H.; Chen, J. Unraveling the mechanisms and responses of aniline-degrading biosystem to salinity stress in high temperature condition: Pollutants removal performance and microbial community. Chemosphere 2024, 362, 142688. [Google Scholar] [CrossRef]
- Zhang, P.; Xu, L.; Su, J.; Zhao, B.; Liu, Y.; Li, X. Ferrous-driven efficient removal of nitrate and various heavy metals by Zoogloea sp. ZP7 under oligotrophic conditions: Kinetics and heavy metal stress responses. J. Water Process Eng. 2024, 67, 106148. [Google Scholar] [CrossRef]
- Zhou, G.; Huang, X.; Zhang, S.; Xiang, Z.; Wei, J.; Ma, S.; Teng, X.; Zheng, Z. Volatile fatty acids (VFAs) production from sludge and chicken manure anaerobic co-fermentation: Effects of mixing ratio and microbial mechanisms. J. Environ. Chem. Eng. 2024, 12, 114014. [Google Scholar] [CrossRef]
- Kim, D.D.; Park, D.; Yoon, H.; Yun, T.; Song, M.J.; Yoon, S. Quantification of nosZ genes and transcripts in activated sludge microbiomes with novel group-specific qPCR methods validated with metagenomic analyses. Water Res. 2020, 185, 116261. [Google Scholar] [CrossRef] [PubMed]
- Liu, S.; Chen, Y.; Xiao, L. Metagenomic insights into mixotrophic denitrification facilitated nitrogen removal in a full-scale A2/O wastewater treatment plant. PLoS ONE 2021, 16, e0250283. [Google Scholar] [CrossRef] [PubMed]
- Li, X.; Li, X.; Li, C.; Li, N.; Zou, P.; Gao, X.; Cao, Q. Nitrogen removal performances and metabolic mechanisms of denitrification systems using different volatile fatty acids as external carbon sources. Chem. Eng. J. 2023, 474, 145998. [Google Scholar] [CrossRef]
- Wei, J.; Huang, X.; Wang, H.; Wang, F.; Liu, X.; Yan, Y.; Qu, Y. Insight into biofilm formation of wastewater treatment processes: Nitrogen removal performance and biological mechanisms. Sci. Total Environ. 2023, 903, 166550. [Google Scholar] [CrossRef]
- Liu, S.; Wang, C.; Hou, J.; Wang, P.; Miao, L. Effects of Ag NPs on denitrification in suspended sediments via inhibiting microbial electron behaviors. Water Res. 2020, 171, 115436. [Google Scholar] [CrossRef]
- Shimizu, K. Bacterial Cellular Metabolic Systems: Metabolic Regulation of a Cell System with 13C-Metabolic Flux Analysis; Elsevier: Amsterdam, The Netherlands, 2013. [Google Scholar]
- Li, T.; Li, W.; Chai, X.; Dai, X.; Wu, B. PHA stimulated denitrification through regulation of preferential cofactor provision and intracellular carbon metabolism at different dissolved oxygen levels by Pseudomonas stutzeri. Chemosphere 2022, 309, 136641. [Google Scholar] [CrossRef]
- Petushkova, E.; Khasimov, M.; Mayorova, E.; Delegan, Y.; Frantsuzova, E.; Bogun, A.; Galkina, E.; Tsygankov, A. The Complete Genome of a Novel Typical Species Thiocapsa bogorovii and Analysis of Its Central Metabolic Pathways. Microorganisms 2024, 12, 391. [Google Scholar] [CrossRef]


Disclaimer/Publisher’s Note: The statements, opinions and data contained in all publications are solely those of the individual author(s) and contributor(s) and not of MDPI and/or the editor(s). MDPI and/or the editor(s) disclaim responsibility for any injury to people or property resulting from any ideas, methods, instructions or products referred to in the content. |
© 2025 by the authors. Licensee MDPI, Basel, Switzerland. This article is an open access article distributed under the terms and conditions of the Creative Commons Attribution (CC BY) license (https://creativecommons.org/licenses/by/4.0/).