Article

Regional Heterogeneity in Urban Water Consumption in Saudi Arabia

Department of Agribusiness and Consumer Sciences, College of Agricultural and Food Sciences, King Faisal University, Al-Ahsa 31982, Saudi Arabia
*
Author to whom correspondence should be addressed.
Water 2025, 17(8), 1156; https://doi.org/10.3390/w17081156
Submission received: 18 February 2025 / Revised: 23 March 2025 / Accepted: 11 April 2025 / Published: 13 April 2025
(This article belongs to the Special Issue Urban Water Resources: Sustainable Management and Policy Needs)

Abstract

:
Saudi Arabia faces rising urban water demand, yet significant regional disparities in daily per capita consumption persist despite uniform national pricing and policies. This study aims to identify the drivers of these disparities across the kingdom’s 13 administrative regions. We analyzed data on water consumption, climate, socio-demographics, property characteristics, environmental awareness, and institutional factors using descriptive statistics and correlations. Results indicate notable consumption variations, with Riyadh and the Eastern Region exhibiting the highest levels, while Asir, Jazan, and Najran exhibit the lowest. Appliance ownership—particularly washing machines (r = 0.75) and Western-style toilets (r = 0.77)—along with access to public water services (r = 0.73), and higher incomes (r = 0.58), positively correlated with increased usage, whereas, younger populations (r = −0.76), reliance on water tanks (r = −0.71), and attitude towards water scarcity (r = −0.69) were associated with lower consumption. Conservation practices showed mixed effects on water use. Overall, regional disparities are primarily driven by property characteristics, environmental awareness, and socioeconomic factors rather than climatic influences. This suggests a need for regionally tailored water policies that complement national standards. Addressing these variations will enable policymakers to design targeted water management strategies that balance consumption needs with water availability.

1. Introduction

Urban water consumption in Saudi Arabia has increased rapidly over the past several decades, largely due to population increase and fast economic growth [1]. Total urban water consumption in Saudi Arabia increased from 200 million m3 in 1970 to 3511 million m3 in 2022 [2,3]. To meet this demand, urban areas in Saudi Arabia relied mainly on desalinated water (68% of the total) and groundwater (30%) [2]. More than 80% of this demand comes from four administrative regions: Riyadh, Makkah, Eastern Region, and Medina. Despite uniform national water pricing and policies across all 13 administrative regions, stark regional disparities in per capita water use persist. For instance, daily per capita urban water consumption varied from 143.2 L in Najran to 352.7 L in Riyadh in 2022 [2]. These variations raise critical questions about the underlying drivers of water use and the effectiveness of national strategies in addressing regional differences, particularly in a country characterized by arid conditions and limited freshwater resources.
Historically, Saudi Arabia has relied on substantial government subsidies to ensure water affordability, but in 2016, the Saudi government reduced water subsidies/incentives in an effort to enhance water efficiency and increase government revenues and also introduced several programs to mitigate the effects of the domestic water tariff increase [4]. The National Water Efficiency and Conservation Center (MAEE) deployed a series of initiatives aimed at rationalization and enhancement of water consumption in all sectors of Saudi Arabia, including the residential sector, through multiple channels, such as the creation of an efficiency program with the coordination and cooperation of different government agencies and awareness campaigns. In order to achieve the aims and targets of these reforms at the best level, Saudi Arabian policymakers may need to better comprehend the regional drivers of urban water consumption.
Urban water consumption is determined by a variety of factors, including economic, demographic, and climatic influences, among others [5]. Assessments of the drivers of urban water consumption at the national level might not be representative of the different regions with their different characteristics. Previous studies have focused attention on estimating national or city-level water demand models in Saudi Arabia [1,6,7]. For instance, Abu Rizaiza [6] analyzed water use in Western cities using 1985 data, while Almutaz et al. [7] projected Riyadh’s desalinated water needs, leaving regional disparities largely unexplored.
This study addresses this gap by leveraging the novelty of a systematic investigation into regional heterogeneity in urban water consumption patterns across all 13 administrative regions of Saudi Arabia. Unlike prior research focused mainly on national or city-level models, our study employs detailed regional-level data from 2010 to 2022, allowing for a more precise assessment of inter-regional differences. Additionally, we incorporate a comprehensive set of variables—spanning socio-demographics, household infrastructure, appliance ownership, water sources, institutional factors, and environmental attitudes—that have rarely been analyzed together in the Saudi context. By highlighting how these factors interact to shape consumption patterns, our findings provide valuable insights for designing region-specific water conservation policies beyond a one-size-fits-all approach. Furthermore, it leverages recent data from diverse sources to offer an up-to-date perspective that reflects the impacts of recent policy reforms and socioeconomic shifts. The remainder of this paper is structured as follows: we first review relevant literature on urban water consumption determinants, then describe our data and methods, present and discuss our findings, and finally, offer conclusions and policy recommendations.

2. Literature Review

The literature on the determinants of urban (i.e., residential) water consumption is large and extensive. Early works on water demand estimation can be traced back to the 1950s [8]. Most studies in the literature focus on measuring the price elasticity of water demand. A number of studies have reviewed and analyzed the existing literature, such as Dias and Ghisi [9], Cominola et al. [10], Corbella and Pujol [11], Sebri [12], and Tanverakul and Lee [13]. Studies in the United States and Europe usually employ household-level data; however, in developing countries, such data are not available, and aggregate data are used instead [14]. Since the analysis employed in this paper relies on regional data, we limit our review to studies that compare different levels of water consumption across multiple regions (i.e., used aggregate data for urban water consumption).
The term “region” has different meanings across academic disciplines [15]. Regions can be within the country or cross the country’s borders. Within countries’ regions can also be defined at different levels such as first or principal level (i.e., subnational levels, such as states, provinces, or regions) or can be at smaller governance levels (second- and third-level divisions that include counties, municipalities, cities, villages, etc.).
At the sub-national level, Baigorri et al. [16] examined the disparities in the regional consumption of household water (liter per inhabitant per day) in Spain. The authors employed convergence analysis and examined the drivers of the convergence in residential water consumption between regions. Using data from 2000 to 2018 for 17 regions, they found that there is no single pattern of behavior across the Spanish regions and that there exist three convergence groups, confirming the regional disparities in water consumption. They also found that household income, birth rate, and spending on environmental protection drive the convergence in each group. Similarly, Acuña et al. [17] analyzed the convergence of residential water consumption across Chilean localities using econometric methods and data from 348 localities between 2010 and 2015. Their findings suggest that water consumption in Chilean regions is converging, primarily influenced by economic factors and climate variability. The study highlights that higher income, temperature, household size, and the number of bathrooms drive increased water consumption, while higher water prices, increased rainfall, and a greater number of youngsters per household reduce it.
Romano et al. [18] estimated the determinants of residential water demand (liters per capita per day) for chief towns of every Italian province for the period 2007–2009. They examined multiple factors and found that income and population have a positive and statistically significant impact on residential water consumption, whereas water tariffs, altitude, and precipitation have negative and statistically significant impacts. Similarly, Polycarpou and Zachariadis [19] estimated the residential water demand in three urban districts in Cyprus using quarterly data for the period 2000–2009. They found that higher water tariffs and service disruptions are negatively associated with lower residential water consumption. On the other hand, income, temperature, and rainfall had positive effects on residential water consumption. Other authors have also examined the determinants of total water consumption, including urban water use, such as Anang et al. [20] in Malaysia and Long et al. [21] in China.
At a smaller governance level (i.e., local level), Worland et al. [22] studied the relationship between municipal water use and 18 covariates in 2500 counties and 83 cities in the United States. They found that the impacts of those covariates are not uniform across the country. Specifically, they found that counties in the Northeast and Northwest climate regions are more sensitive to social variables, whereas counties in the Southwest and East North Central climate regions are more sensitive to environmental variables. For the city model, they found that arid cities with a high cost of living and relatively low water bills sell more water per customer.
City or village-level studies are also widely available. In Saudi Arabia, an older study by Abu Rizaiza [6] examined the residential water usage in four major cities in the western part of the country (Jeddah, Makkah, Madina, and Taif). Using primary data from 563 questionnaires in 1985, he examined the relationship between socioeconomic and climatological factors on residential water use. It was found that income, temperature, and price of water (for those who rely on water tankers as a source of water) were the most important factors affecting residential water use. At the village level, Keshavarzi et al. [23] examined the rural domestic water consumption behavior in 33 villages in Iran. They categorized water customers into low, medium, and high consumers. They found that water consumption was significantly correlated with household size, age of household head, garden size, greenhouse size, and garden watering times per month with tap water. Finally, Ismail et al. [24] compared residential water end-use patterns in 39 major cities in developed and developing countries. They found that there exist six different major trends in household water consumption patterns with main water activities: cooking, bathing, washing machines, faucets, and toilet use. They also identified the drivers for those patterns to be socioeconomic characteristics, physical, spatial, climatic conditions, and political restrictions.
In summary, many studies examined the heterogeneity or disparity of urban water consumption across different spatial units. However, to our knowledge, no study has examined this issue in Saudi Arabia at the regional level. Thus, our objective in this paper is to analyze this issue by examining different factors including factors not included in previous studies such as environmental awareness and institutional factors. This is particularly relevant to Saudi Arabia, where an arid climate, heavy dependence on energy-intensive desalination, and rapid urbanization amplify the urgency of understanding regional differences to ensure sustainable water management.

3. Dataset and Methods

3.1. Study Area

Saudi Arabia is located in the southwestern part of Asia and is the largest country in the Arabian Peninsula, covering an estimated area of 2.15 million km2. It is bordered by the Red Sea to the west and by Jordan, Iraq, and Kuwait to the north. To the east, it shares borders with Qatar, the United Arab Emirates, and the Arabian Gulf, while to the south, it borders Oman and Yemen. The total population was estimated to be about 32.2 million in 2022, with 42% of the population being non-Saudis [25].
Saudi Arabia is characterized by a desert climate, with the exception of the southwestern part, which has a semi-arid climate. There are no permanent rivers or lakes, and the average annual rainfall is below 150 mm in most parts of the country [26]. Despite limited freshwater resources, the total withdrawal per capita in 2021 was 723 m3, exceeding 40% of the world average [27]. Overall, Saudi Arabia is one of the driest countries in the world, marked by high water consumption.
Saudi Arabia is divided into thirteen administrative regions, each with distinct characteristics. These regions are further divided into governorates, which encompass various cities, centers, and villages. Table 1 presents the names of the administrative regions along with key information, including capital cities, the number of governorates, area, population, and population density.
The Riyadh region is considered the heartland of Saudi Arabia. It is the most populous region in the country, accounting for 26.7% of the country’s total population. Other significant regions include Makkah and Madinah, known for their religious significance, and together, they account for 31.5% of the population. The Eastern Region, known for having most of the oil and gas fields in the country, covers 31.3% of the total area and hosts about 15.9% of the population. In terms of population density, Jazan has the highest population density at 108.1 people per km2, contrasting sharply with the lower densities in regions like the Northern Borders and Hail.

3.2. Data and Statistical Analysis

To examine the drivers of regional heterogeneity in urban water consumption, we collected data for the 13 Saudi administrative regions from a variety of sources. For total urban water consumption, we use data provided by the Saudi Central Bank (SAMA), which cover the period 2010–2022 [28]. Urban water consumption includes freshwater use in residential, commercial, and public facilities (e.g., governmental buildings, hospitals, and schools). According to MEWA [29], residential water consumption is responsible for more than 80% of the total urban water consumption. Therefore, we limit our analysis to factors related to residential water consumption. We calculate daily per capita urban water consumption (in liters) using regional population estimates also available in the SAMA database.
For urban water consumption drivers, most variables of interest are not collected regularly in Saudi Arabia. As a result, many variables are only available for specific years, limiting our options in terms of the analysis we can employ in this paper. Despite this limitation, our analysis examines a comprehensive set of factors that potentially influence regional water consumption patterns. These include climatic and geographic variables (temperature, precipitation, elevation), socio-demographic characteristics (income, education, age structure), property-related factors (water sources, appliances, housing type), indicators of environmental awareness (knowledge, concerns, attitudes toward conservation), and institutional factors (access to desalinated water). Table 2 provides descriptions and sources for the variables used in the analysis.
For data analysis, we used descriptive statistics, along with measures of central tendency and variability, to assess regional variations in urban water consumption across the country. Additionally, graphical and correlation analyses were applied to explore the relationships between urban water consumption and various regional characteristics in Saudi Arabia.

4. Results

4.1. Urban Water Consumption

Table 3 presents a descriptive analysis of urban water consumption across the administrative regions in Saudi Arabia. At the national level, daily per capita urban water consumption increased from 272 L in 2010 to 299 L in 2022, representing a total increase of nearly 10%. The average daily per capita urban water consumption over the study period was 288 L, ranking Saudi Arabian residents as one of the highest users of urban water in the world.
At the regional level, water consumption varied significantly between regions. In terms of average values, we observe that residents in Riyadh and the Eastern Region consume more than 300 L/person/day, whereas residents in other regions, such as Asir, Jazan, and Najran, consume less than 120 L/person/day. The annual average growth rate of per capita daily urban water consumption also reflects considerable variability across regions. Between 2010 and 2022, the Jazan region demonstrated the highest growth rate at 16.5%, followed by Baha (14.6%), and Najran (8.5%). In contrast, the Jouf region was the only region to show a decline in urban water consumption, with an average annual growth rate of −2.5%. Finally, the last column in Table 3 illustrates the average share of total urban water consumption across the 13 regions in Saudi Arabia. Riyadh accounted for the largest share (31.4%), followed by Makkah (23.9%) and the Eastern Region (20.5%) due to their high populations. In contrast, smaller regions such as Najran (0.8%), Northern Borders (0.9%), and Baha (0.9%) had lower total urban water consumption.
Since there exist some similarities in terms of the level of urban water consumption between some regions, we group regions based on their average daily per capita urban water consumption into three groups using percentile-based categories: low water consumption regions (below 33 percentiles or 191 L/person/day); medium water consumption regions (34–66 percentiles or 192–249 L/person/day); and high water consumption regions (above 66 percentiles or above 250 L/person/day). Figure 1 shows the regions based on their water consumption categories. The existence of spatial autocorrelation is apparent (i.e., regions close to each other have similar average water consumption values), where regions in the southern part of the country have low urban water consumption, whereas regions in the northern part of the country have medium urban water consumption.

4.2. Climatic and Geographic Factors

Climatic and geographic factors also influence water consumption. Scatter plots for average urban water consumption and related climatic and geographic factors are presented in Figure 2. Panel (a) shows the relationship between urban water consumption and the annual mean maximum temperature for each region. As expected, there is a positive relationship between urban water consumption and temperature. The annual maximum temperature between regions varied slightly between regions, where the lowest was in the Tabuk region (29.8 °C) and the highest was in the Eastern Region (35.3 °C). Since temperature is not uniform temporally (throughout the year) and spatially (different regions have different climates, especially in the southwestern regions, it is not surprising that the correlation between urban water consumption and temperature is not strong.
Panels (b) and (c) show the inverse relationship between urban water consumption and annual precipitation and elevation across the regions. Precipitation levels varied significantly across the regions, with the Qaseem region receiving the highest amount at 177.5 mm, while the Eastern Region had the lowest at 60.8 mm. In addition, regions with higher elevations, such as Asir and Baha, tended to show lower urban water consumption rates, which may be related to the lower access to public water service in such regions.
Overall, the results suggest that climatic and geographic factors can affect urban water consumption. However, the relationship between them is not that strong, suggesting the existence of other factors at play.

4.3. Socio-Demographic Factors

Socio-demographic factors can also play an important role in determining the level of regional urban water consumption. Examples of such factors include income, education, and population age structure. Figure 3 illustrates the relationship between average urban water consumption and those factors. As expected, there is a positive relationship between household income and urban water consumption, indicating that residents with higher incomes will consume more water. Similarly, there exists a positive relationship between education and urban water consumption. Finally, we found a negative relationship between the young population and urban water consumption and no relationship between the elderly population and water consumption.

4.4. Property Characteristics

Water sources and equipment or appliances used in the household could affect the rate of water consumption. In this section, we examine the impact of such factors. Starting with the water source used by the residents in each region, Table 4 shows the water source (public service, water tanks, or private wells) used by households in each region. Residents in regions with high access to public water service, such as Riyadh and the Eastern Region, consume more water, where the daily per capita urban water consumption is above 300 L/person/day. In contrast, residents in regions that rely heavily on water tanks (i.e., water delivered to their homes by tankers), in general, consume less water. This is apparent in regions such as Asir and Najran, where more than 50% of the households use water tanks as the main water source. Private wells are rarely used except in the Jouf region, where more than 10% of the households rely on them. This might be the result of this region being one of the most important agricultural regions in Saudi Arabia.
Homeownership can also impact the rate of water consumption because many renters have their water bill included in the rent. As a proxy, we examine the relationship between the percentage of households that are living in apartments and urban water consumption in each region. Figure 4 illustrates this relationship. Residents in regions with a high percentage of households living in apartments have a high water consumption rate compared to regions with a lower percentage of households living in apartments.
We also examine the impact of household equipment or appliances that may affect the water consumption rate. Table 5 shows the availability of such equipment or appliances and some behavioral variables by region. The results suggest that among those variables, only two show a strong positive relationship with water consumption: the availability of washing machines and western toilets. Regions with a high availability of washing machines (more than 60% of households) exhibit a high rate of urban water consumption. Similarly, regions with a high percentage of western toilets also consume more water. Finally, we see that using more conservation equipment does not lead to lower water consumption. For example, the Baha and Qaseem regions have a higher percentage of households (40.9% and 38.8%, respectively) that use conservation equipment. However, daily per capita urban water consumption is more than 300 L, which is considered very high consumption.
Finally, we examine the relationship between some behavioral factors and urban water consumption. The last three columns in Table 5 show the percentage of households with gardens, automatic irrigation systems for their gardens, and households that use public water supply as a source of drinking water. Generally, regions with more households having gardens and automatic irrigation systems have high water consumption. Examples include Riyadh, Eastern Region, and Qaseem regions. Similarly, households in regions that use public water supply for drinking water usually have high urban water usage (e.g., Bahah, Madinah, and Qaseem).

4.5. Environmental Awareness

Awareness of local environmental issues is an important determinant of water consumption. Table 6 illustrates the relationship between daily per capita urban water consumption and various environmental indicators across the administrative regions. In terms of environmental concern, most regions have a low percentage of residents expressing environmental concern (only about 10% in most regions). No clear relationship exists between water consumption and residents expressing environmental concerns.
On the other hand, the data on environmental interest among residents across the regions reveal significant patterns in urban water consumption. Regions with more residents expressing environmental interest, that is, more than 60%, in general, have lower urban water consumption. Examples include Asir, Jouf, and Najran. Similarly, there exists an inverse relationship between urban water consumption and the high percentage of residents who think water scarcity is the most important environmental issue.

4.6. Institutional Factors

The relationship between average daily urban water consumption and the availability of desalinated water in various regions of Saudi Arabia highlights the crucial role desalination plays in addressing water scarcity and ensuring public water service reliability. Figure 5 illustrates this relationship, showing that regions with a higher proportion of desalinated water tend to have increased urban water consumption. For example, in Riyadh and the Eastern Region, where urban water consumption is significantly high at 353 and 352 L, respectively, desalinated water constitutes approximately 56.82% and 71.56% of total urban water supplies. This substantial proportion indicates that access to desalinated water not only supports elevated consumption levels but also serves as a vital component in meeting the demands of rapidly growing urban populations. In contrast, regions such as Hail, the Northern Borders, and Najran lack desalinated water in their supply mix, which correlates with lower urban water consumption and highlights potential vulnerabilities in water management. Furthermore, in Makkah and Madinah, desalinated water comprises almost the entirety of the water supply. This reliance may be attributed to their religious significance and importance to the tourism sector, making the reliability of water service of utmost importance.

4.7. Correlation Analysis

To summarize our results, Figure 6 presents the Pearson correlation coefficients between the different factors and average daily urban water consumption. Several factors exhibit strong negative correlations with water consumption, suggesting that their prevalence is associated with lower water usage. For instance, the young population has a correlation coefficient equal to −0.76, indicating that regions with a higher proportion of younger residents tend to consume less water. Similarly, water tanks (−0.71) and water scarcity (−0.69) also show strong negative correlations. This implies that regions that rely on water tanks or have more residents who think water scarcity is the most important environmental issue may adopt more conservative water practices, thereby reducing overall consumption. The negative correlation with environmental interest (−0.54) suggests that higher levels of environmental awareness could lead to more sustainable water usage behaviors.
On the other hand, several variables show a positive correlation with water consumption, indicating that their presence tends to be associated with higher water usage. Washing machines (0.75) and western toilets (0.77) are significant contributors to increased water consumption, reflecting the impact of household appliances on overall water demand. Similarly, the correlation with public service (0.73) suggests that regions with better access to public water services tend to consume more water, likely due to increased availability. Other important variables also show a positive correlation with urban water consumption, including household income (0.58) and education (0.45), which indicate that regions with wealthier and more educated residents consume more water.

5. Discussion

This study investigated the factors contributing to regional heterogeneity in urban water consumption across the 13 administrative regions of Saudi Arabia between 2010 and 2022. Our findings reveal significant disparities in per capita water use, with daily per capita consumption varying from as low as 107 L in Najran to as high as 368 L in the Eastern Region. These findings align with previous studies such as Baigorri et al. [16] and Acuña et al. [17], who also found substantial regional variations in residential water consumption in Spain and Chile, respectively, and Romano et al. [18], who emphasized local factors in shaping water use patterns in Italy. The study highlights varying degrees of influence from climatic, socio-demographic, environmental awareness, and property characteristics, mirroring the key determinants found in global studies such as Grafton et al. [5].
The persistent high water consumption in Riyadh and the Eastern Region, despite uniform national pricing and policies, emphasizes the importance of local factors. These regions, characterized by higher incomes, greater access to public water services, and a prevalence of household appliances associated with increased water use (e.g., washing machines, western toilets), demonstrate the interplay of affluence and convenience in driving consumption patterns. Conversely, lower consumption rates in regions such as Asir, Jazan, and Najran, despite experiencing rapid growth in recent years, suggest that reliance on water tanks as a primary source, coupled with a higher proportion of younger residents and greater awareness of water scarcity, may promote more conservative water use behaviors.
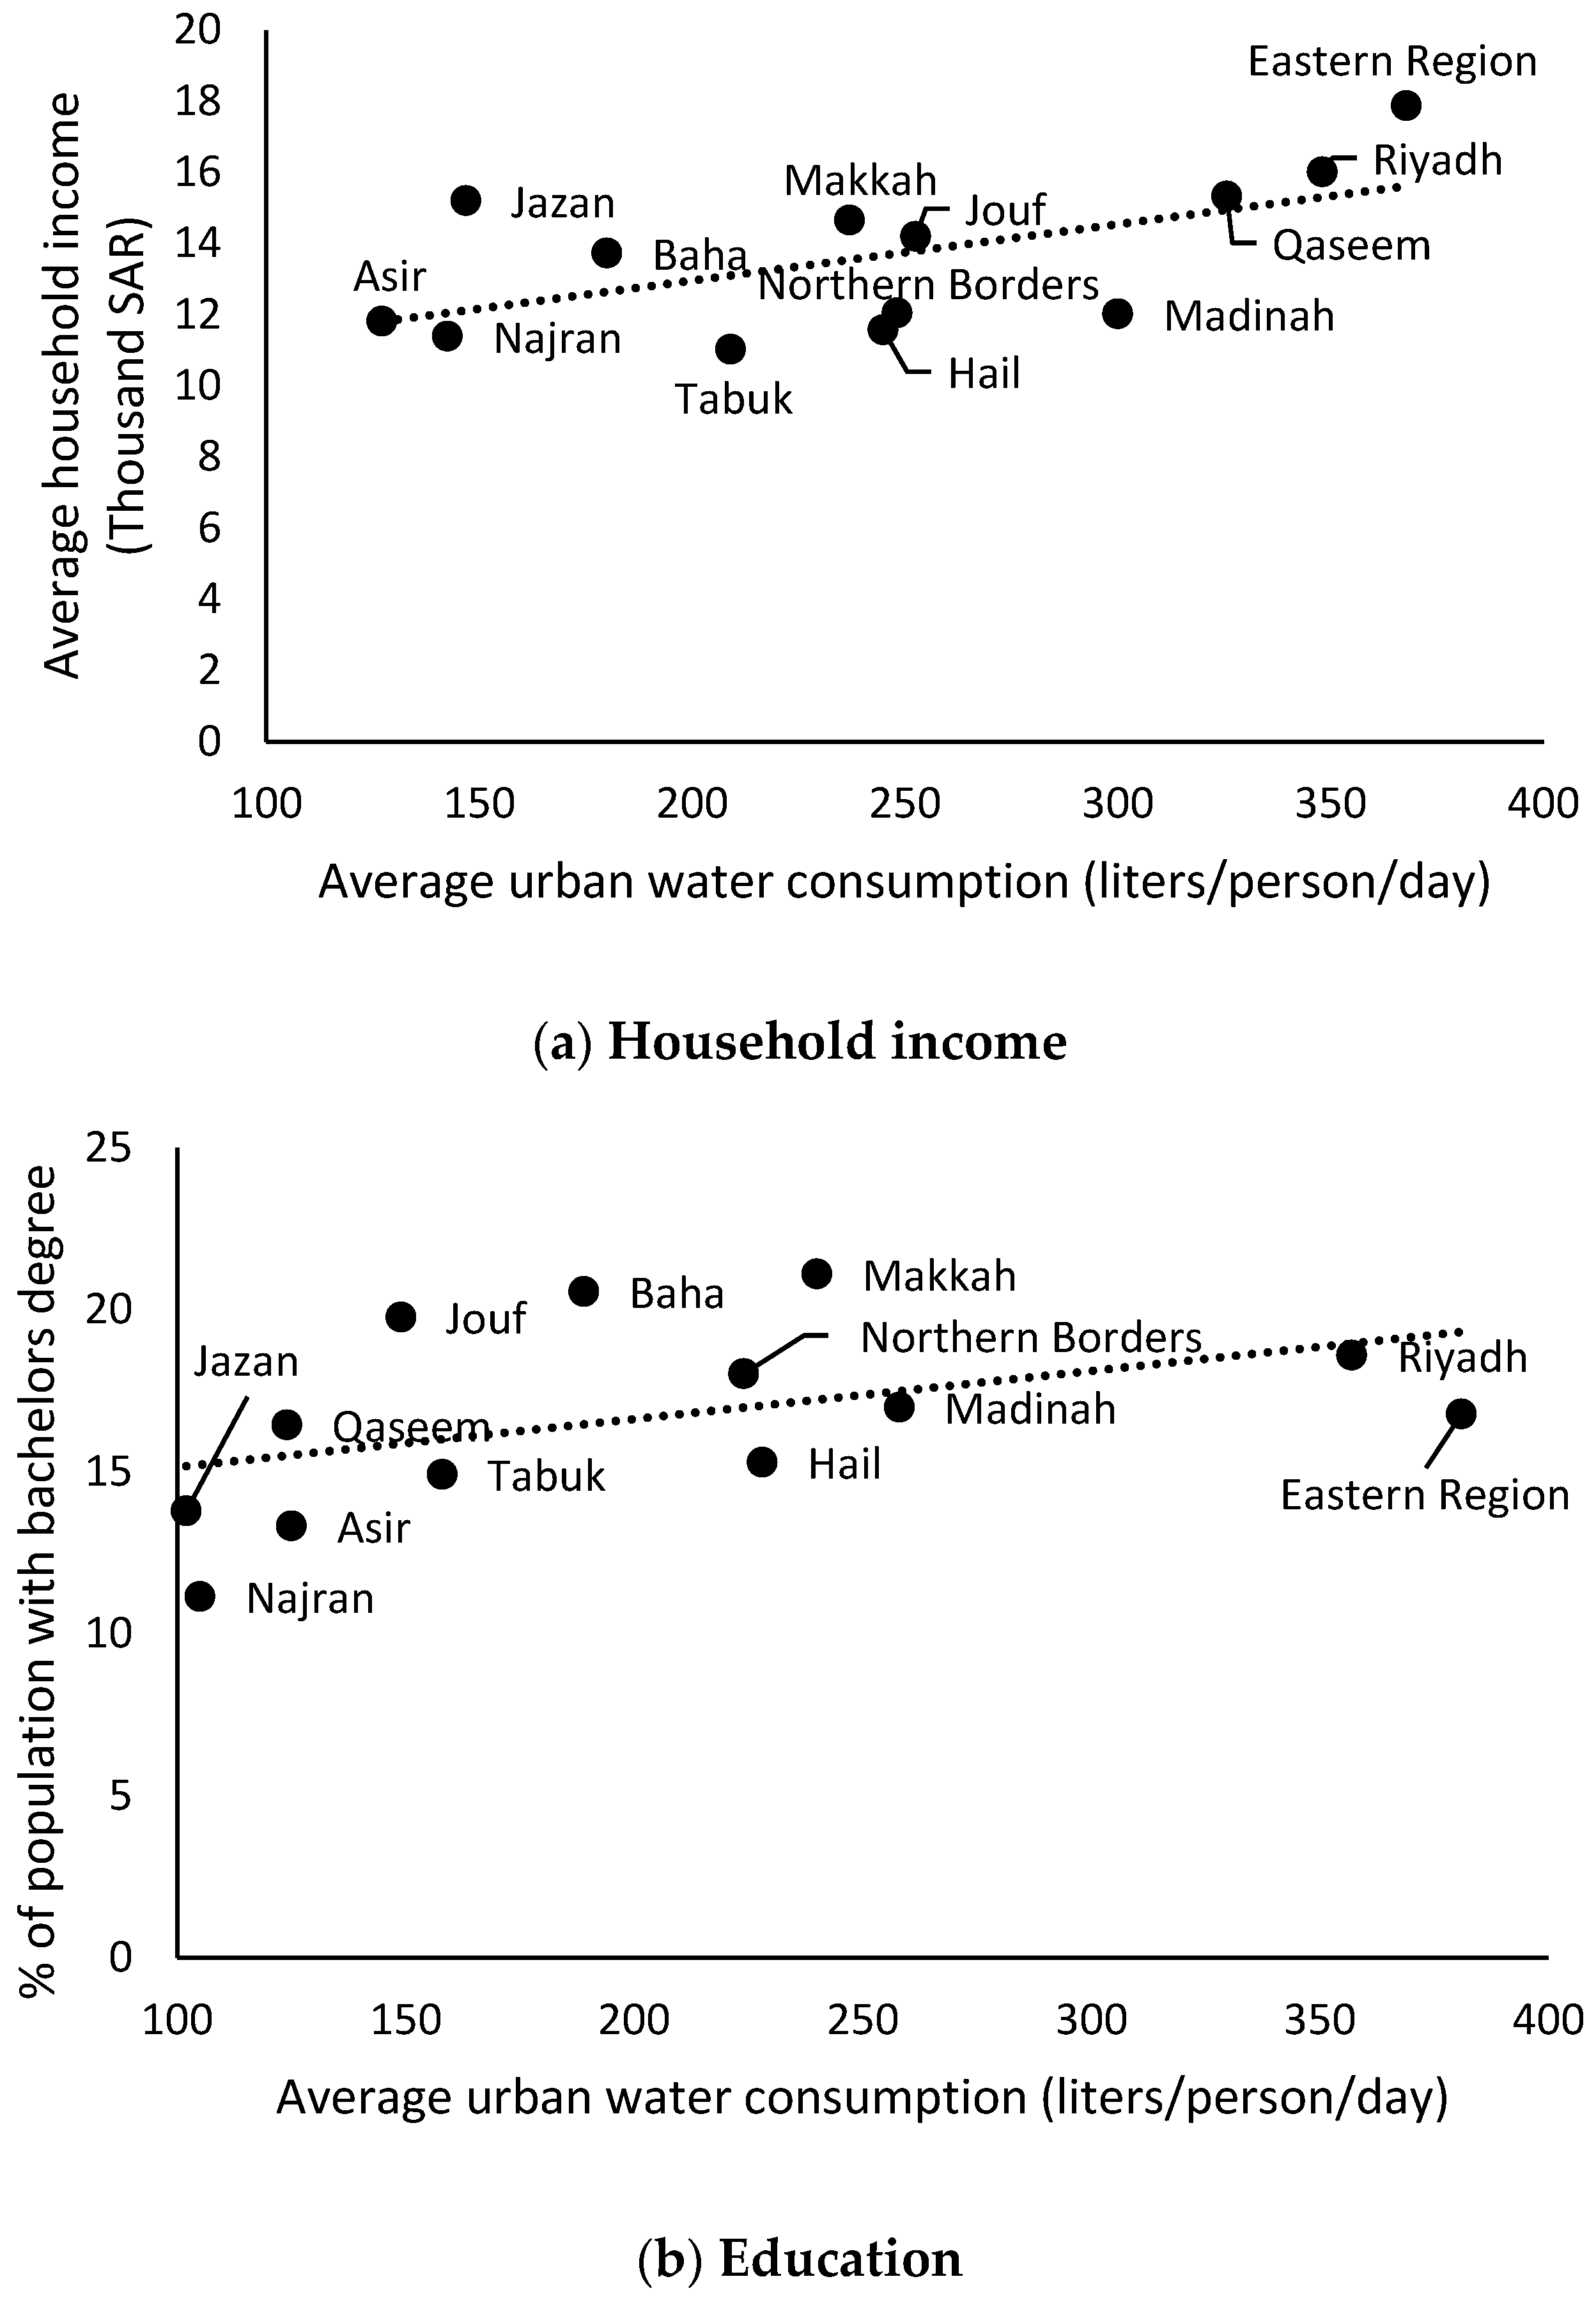
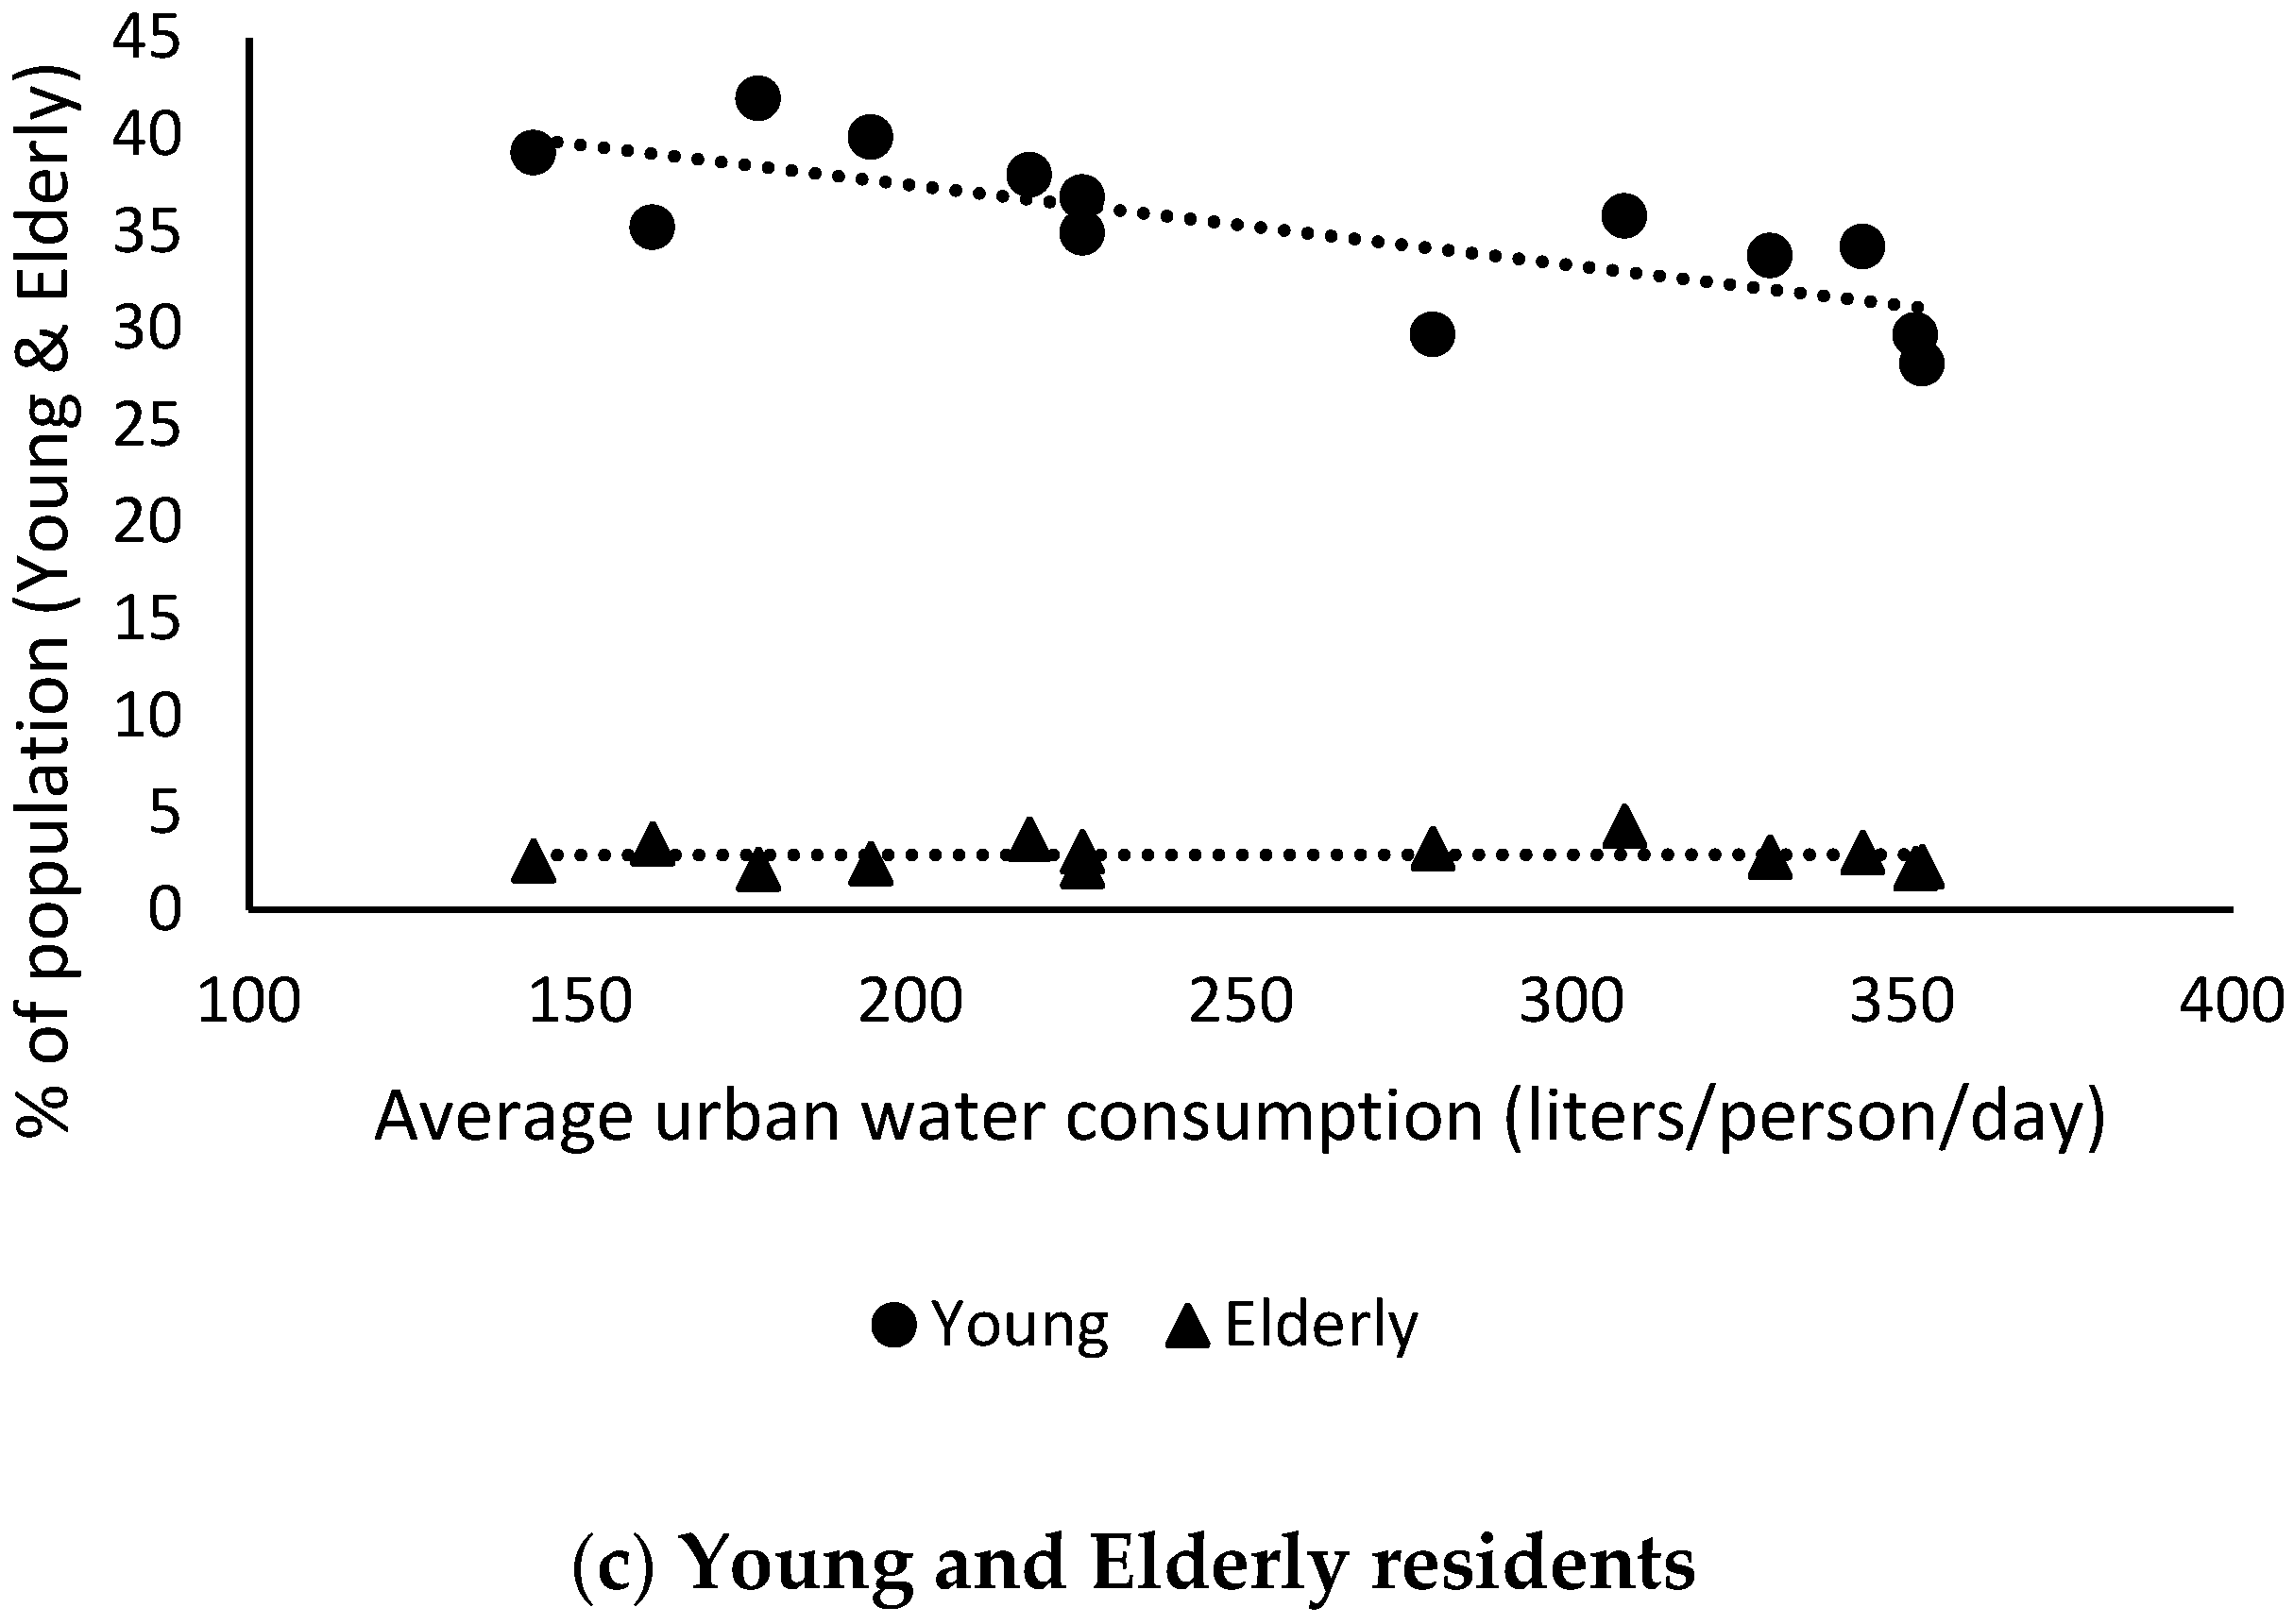
Socioeconomic factors emerge as important determinants of regional water consumption patterns. The positive correlations with household income and education suggest that more affluent and educated regions tend to consume more water, consistent with Romano et al. [18], Polycarpou and Zachariadis [19], Long et al. [21], and Grafton et al. [5], where higher socioeconomic status often correlates with increased resource use. This presents a particular challenge for Saudi Arabia’s water conservation efforts, as the country continues to experience economic growth and rising education levels. The relationship between the age structure of the population and urban water consumption varies across studies. Some research, such as Nauges and Thomas [30], indicates a positive correlation between younger populations and higher water consumption, suggesting that young individuals may use water less efficiently (e.g., more frequent baths and laundry). Conversely, studies by Bennett et al. [31] and Beal et al. [32] identify a negative correlation, arguing that younger people tend to spend less time at home, leading to lower overall water usage. This evidence highlights that the correlation between age and water consumption may be influenced by factors such as household size and lifestyle.
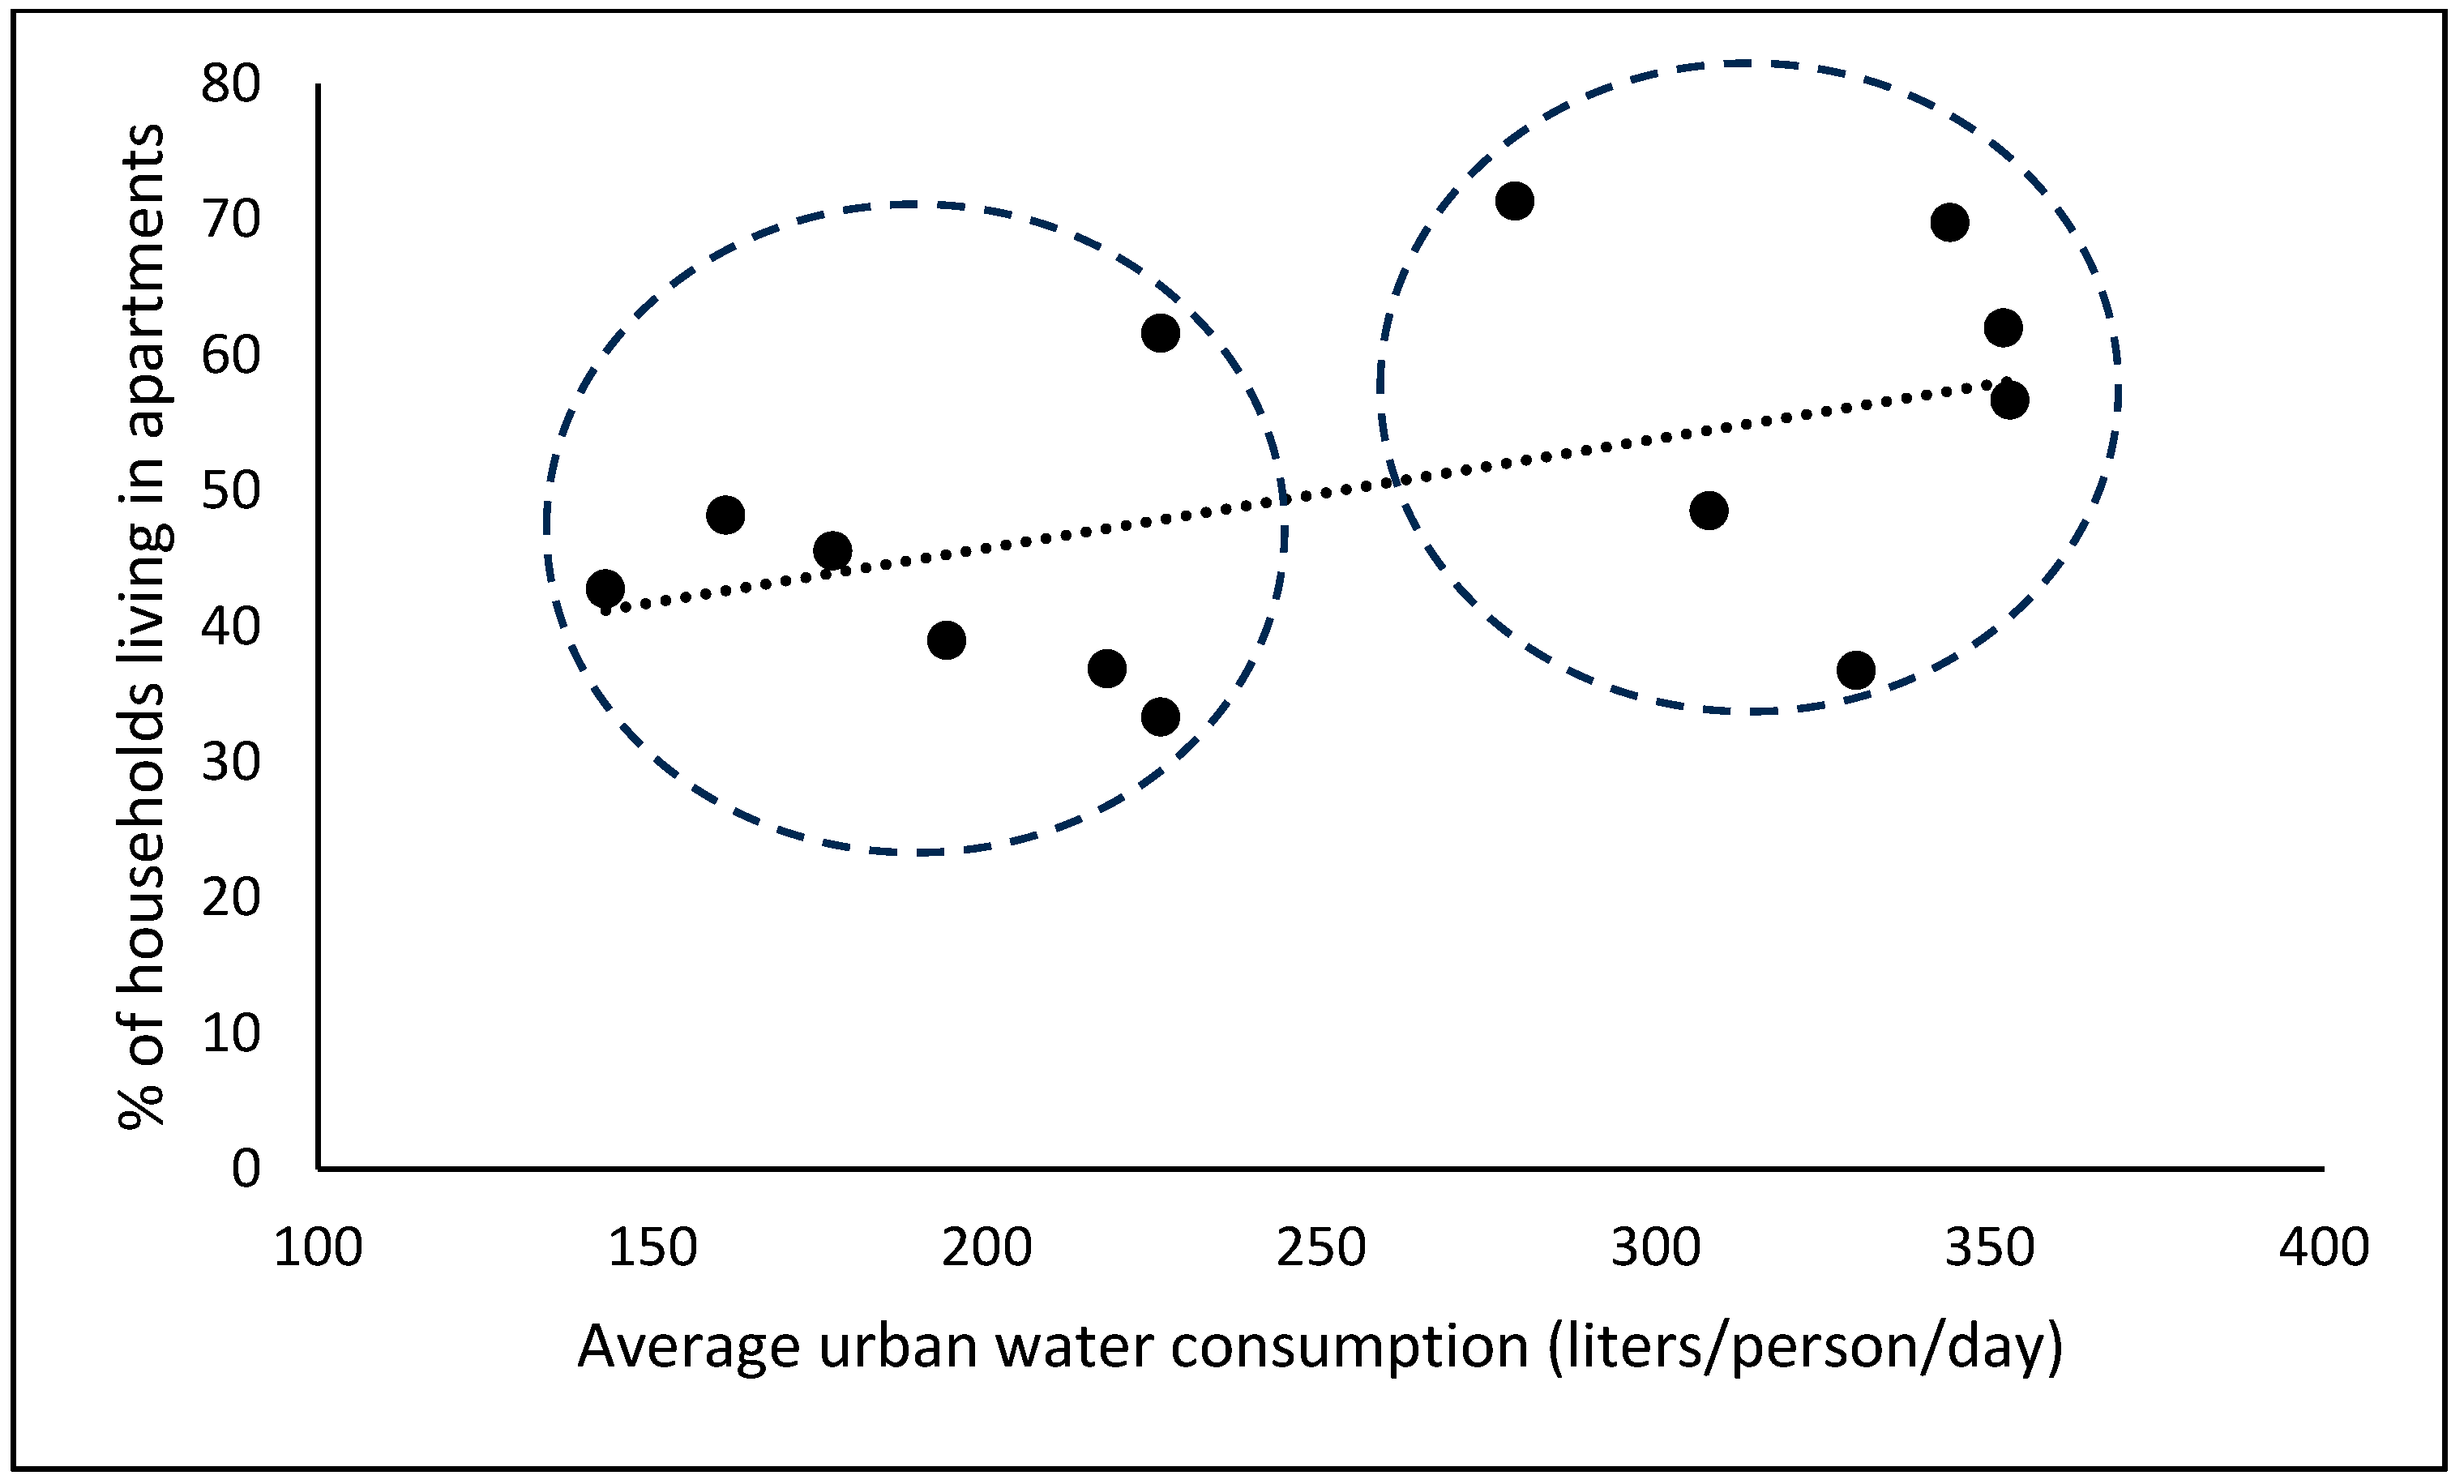
Property-related factors, such as the prevalence of apartments, also contribute significantly. Higher apartment residency rates in urban centers like Riyadh and the Eastern Region correspond to elevated water consumption, potentially due to water costs being embedded in rental agreements, leading to reduced individual cost sensitivity (i.e., the marginal cost of water is equal to zero). The reliance on water tanks in regions with limited public water access appears to curb consumption, echoing observations in other arid areas [22]. This is primarily due to limited storage capacity and higher perceived costs. Households that depend on water tanks must carefully manage their usage, as refilling the tanks often requires additional effort and expenses. Unlike a continuous public water supply, which allows unrestricted access, tank users tend to ration water more efficiently to avoid frequent refills. The strong positive correlation between public water service access and consumption suggests that infrastructure availability significantly influences usage patterns. This finding is particularly relevant for policymakers as it indicates that improving water infrastructure access should be accompanied by appropriate conservation measures. The relationship between water source and consumption also aligns with Abu Rizaiza’s [6] findings in western Saudi Arabian cities, though our study provides a more comprehensive national perspective. Moreover, the presence of certain household appliances, particularly washing machines and western toilets, shows strong positive correlations with water consumption. This resonates with Keshavarzi et al. [23] findings regarding the impact of household characteristics on water use. As Saudi Arabia continues to modernize, the proliferation of such appliances may further increase water demand unless offset by efficiency improvements. The influence of climatic and geographic factors, while present, appears less pronounced than socioeconomic and property-related variables. While higher temperatures correlate with increased water use, the modest range of temperature variation across regions and the prevalence of indoor climate control systems likely attenuate this effect. The inverse relationships between precipitation, elevation, and water consumption may be indirect, reflecting regional differences in water availability and access to public water infrastructure. Regions with higher elevations or lower rainfall may experience more limited access to public water, incentivizing more frugal consumption. These findings contrast with studies like Polycarpou and Zachariadis [19] and Acuña et al. [17] who found strong climate effects and emphasized climate as a primary driver. This suggests that in Saudi Arabia, property and socioeconomic factors may play a more dominant role in determining regional water consumption patterns than climate variations. However, climate change could intensify water scarcity and alter future consumption trends in the coming decades. Rising temperatures may increase evaporation rates, further depleting groundwater reserves already strained by limited precipitation, while changing rainfall patterns could reduce recharge in regions like Asir, heightening reliance on energy-intensive desalination. These shifts may elevate water demand, particularly in urbanizing, high-consumption areas, underscoring the need for adaptive, region-specific policies. Environmental awareness shows a complex relationship with consumption patterns. While environmental interest shows a negative correlation with water use, the relationship between environmental concern and consumption is less clear. This suggests that general environmental awareness may not be sufficient to reduce water consumption without a specific focus on water conservation behaviors, similar to findings by Ismail et al. [24]. While a significant proportion of residents recognize water scarcity as an important issue, this awareness does not consistently translate into lower consumption, and the presence of water conservation equipment does not necessarily translate into reduced use. This may be due to the “rebound effect,” where increased efficiency from water-saving appliances is offset by increased consumption in other areas (e.g., increased garden watering) or a lack of perceived economic incentive due to subsidized water pricing. This contradiction has been noted in other contexts, such as Sebri’s [12] work on conservation adoption in North Africa, where behavioral patterns often undermine the intended efficiency of conservation measures.
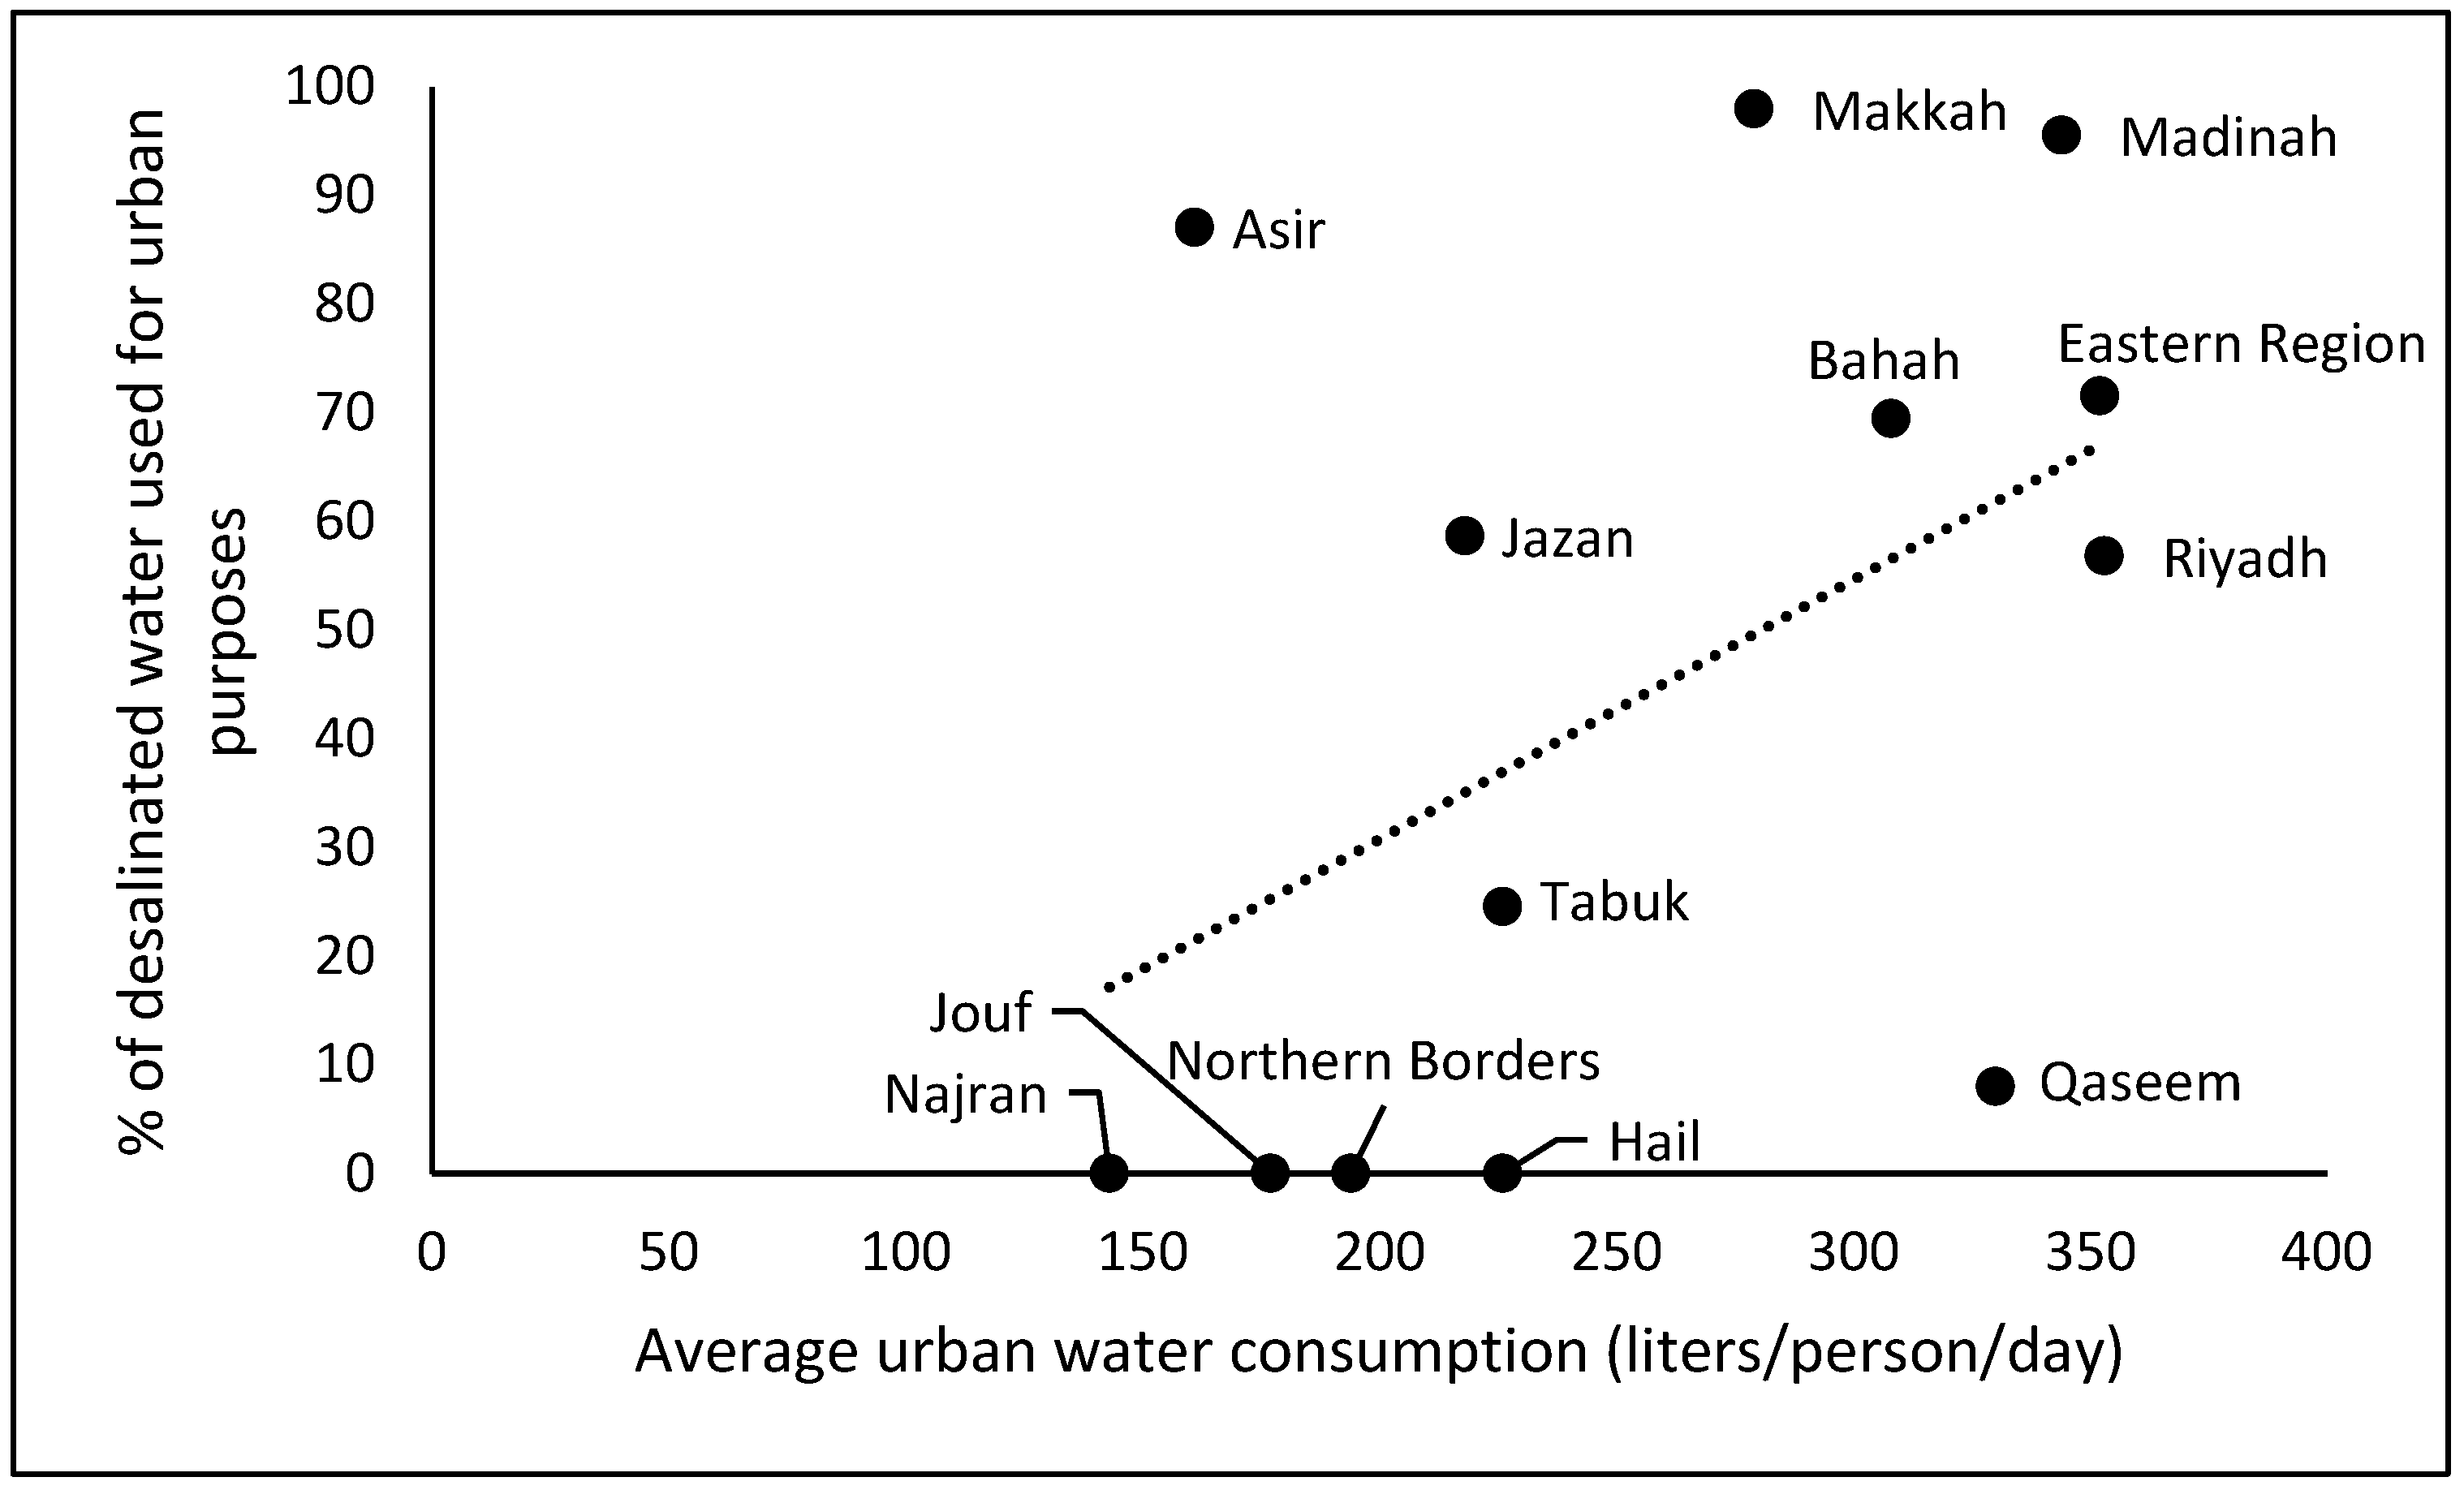
Water supply in Saudi Arabia is heavily reliant on desalination and groundwater extraction, both of which are institutionally managed at the national level. The reliance on desalination varies across regions, influencing local water consumption patterns. Regions with greater access to desalinated water, such as the Eastern Region, tend to exhibit higher per capita consumption. The expansion of desalination infrastructure and the adoption of water reuse technologies could significantly reshape future water consumption trends. Urbanization also contributes to increased water demand through commercial and industrial activities, greater residential density, and evolving lifestyle patterns. Comparing city sizes, urbanized regions like Riyadh exhibit significantly higher per capita use than smaller, less urbanized areas like Najran, suggesting urbanization levels amplify regional differences through greater public water access and socioeconomic demands, though further city-level data are needed to confirm this trend. As Saudi Arabia continues to experience rapid urban growth, particularly in major metropolitan areas, the strain on water resources is expected to intensify. Policymakers must consider how ongoing urban expansion may further widen regional disparities in water use and develop adaptive strategies that promote efficiency in high-demand areas while ensuring equitable access in smaller cities and rural regions.
In addition to analyses of water demand, recent advancements in optimization techniques have been explored to improve urban water allocation. For instance, Zhang et al. [33] proposed a graph theory-based approach to optimize water quantity allocation in multi-source urban water supply systems. Given the significant disparities in urban water consumption across Saudi Arabia, integrating such optimization models could provide a data-driven framework for balancing supply and demand, particularly in high-consumption regions like Riyadh and the Eastern Region.
Limitations of this study include reliance on aggregate regional data, which obscures household-level variations in water use and limits the ability to control individual preferences and behaviors. Furthermore, data constraints restricted the analysis of several potentially important variables to a single year. This limits our ability to observe trends and changes between the variables and urban water consumption over time. Additionally, this constraint prevents us from utilizing more advanced statistical techniques, such as regression analysis, to thoroughly explore the relationships due to the lack of longitudinal data. Future research should prioritize the collection of more granular, longitudinal data to enable more rigorous econometric analysis and to examine the dynamics of water consumption patterns over time. Developing more sophisticated models that integrate spatial econometrics to account for interconnected regional water systems and incorporate household-level data could further enhance these insights. Also, research into the effectiveness of different conservation measures across regions with varying characteristics could help optimize policy interventions. Finally, future studies should assess how income inequality affects water affordability and access within each region. By bridging the gap between research and practice, we can promote more sustainable and equitable water management practices in Saudi Arabia and other arid regions facing similar challenges.
Overall, this study contributes to the literature by offering a comprehensive regional analysis of water consumption drivers in Saudi Arabia, an area previously unexplored at this scale. It provides novel insights into the regional heterogeneity of urban water consumption across Saudi Arabia. First, the substantial variation in per capita water consumption across regions, despite uniform national pricing policies, indicates that local context plays a crucial role in determining water use patterns. Second, the primacy of property and socioeconomic factors over climatic conditions suggests that future water demand will be largely shaped by development patterns and lifestyle changes rather than environmental conditions, necessitating proactive planning and adaptive strategies. Third, the inverse relationship between young population demographics and water consumption presents an opportunity for long-term water conservation through targeted education and awareness programs. Fourth, the weak relationship between environmental awareness and actual consumption indicates a gap between environmental knowledge and behavior that needs to be addressed through more effective conservation programs.

6. Conclusions

This study analyzes the regional heterogeneity in urban water consumption across Saudi Arabia, emphasizing the influence of various factors, including socioeconomic conditions, property characteristics, climatic conditions, environmental awareness, and institutional framework, in shaping water use patterns. The findings demonstrate that higher income levels, appliance ownership, and access to public water services drive increased consumption, while reliance on water tanks and heightened environmental awareness contribute to reduced usage. The study also reveals that while conservation technologies are adopted, their impact on reducing consumption remains uncertain, necessitating a more integrated approach to water efficiency policies that address both technological adoption and behavioral change.
The observed regional disparities in water consumption call for tailored, location-specific interventions that address local needs and contexts. Policies should focus on incentivizing conservation behaviors and promoting water-efficient technologies, particularly in high-consumption regions. Efforts to promote environmental awareness and water conservation should move beyond simply raising awareness and towards fostering behavioral changes. This may involve targeted education campaigns, community-based water management programs, and incentives for adopting more sustainable water use practices.

Author Contributions

Conceptualization, F.A. and R.T.; methodology, F.A.; software, F.A. and R.T.; validation, R.T.; formal analysis, F.A.; data curation, F.A.; writing—original draft preparation, F.A. and R.T.; writing—review and editing, F.A. and R.T.; visualization, F.A. All authors have read and agreed to the published version of the manuscript.

Funding

This research was funded by the Deanship of Scientific Research, Vice Presidency for Graduate Studies and Scientific Research, King Faisal University. Grant Number KFU250689.

Data Availability Statement

Data used in this research are publicly available.

Conflicts of Interest

The authors declare no conflicts of interest.

Abbreviations

The following abbreviations are used in this manuscript:
SAMASaudi Central Bank
WBWorld Bank
GeoNamesThe GeoNames geographical database
MEWAMinistry of Environment, Water and Agriculture
GASTATGeneral Authority for Statistics
UWCUrban Water Consumption

References

  1. Alderiny, M.M.; Al Duwais, A.A.M.; Alaagib, S.B. A Study of Water Consumption in Residential Sector in Saudi Arabia. Arab. J. Geosci. 2021, 14, 2134. [Google Scholar] [CrossRef]
  2. Ministry of Environment Water and Agriculture. Statistical Yearly Book 2022; Ministry of Environment Water and Agriculture: Riyadh, Saudi Arabia, 2022. [Google Scholar]
  3. Ouda, O.K.M. Water Demand versus Supply in Saudi Arabia: Current and Future Challenges. Int. J. Water Resour. Dev. 2014, 30, 335–344. [Google Scholar] [CrossRef]
  4. McIlwaine, S.J.; Ouda, O.K.M. Drivers and Challenges to Water Tariff Reform in Saudi Arabia. Int. J. Water Resour. Dev. 2020, 36, 1014–1030. [Google Scholar] [CrossRef]
  5. Grafton, R.Q.; Ward, M.B.; To, H.; Kompas, T. Determinants of Residential Water Consumption: Evidence and Analysis from a 10-country Household Survey. Water Resour. Res. 2011, 47, 2010WR009685. [Google Scholar] [CrossRef]
  6. Abu Rizaiza, O.S. Residential Water Usage: A Case Study of the Major Cities of the Western Region of Saudi Arabia. Water Resour. Res. 1991, 27, 667–671. [Google Scholar] [CrossRef]
  7. Almutaz, I.; Ali, E.; Khalid, Y.; Ajbar, A.H. A Long-Term Forecast of Water Demand for a Desalinated Dependent City: Case of Riyadh City in Saudi Arabia. Desalin. Water Treat. 2013, 51, 5934–5941. [Google Scholar] [CrossRef]
  8. Dalmas, L.; Reynaud, A. Residential Water Demand in the Slovak Republic. In Econometrics Informing Natural Resources Management; Koundouri, P., Ed.; Edward Elgar Publishing: Cheltenham, UK, 2005; ISBN 978-1-84542-465-7. [Google Scholar]
  9. Dias, T.F.; Ghisi, E. Urban Water Consumption: A Systematic Literature Review. Water 2024, 16, 838. [Google Scholar] [CrossRef]
  10. Cominola, A.; Preiss, L.; Thyer, M.; Maier, H.R.; Prevos, P.; Stewart, R.A.; Castelletti, A. The Determinants of Household Water Consumption: A Review and Assessment Framework for Research and Practice. npj Clean Water 2023, 6, 11. [Google Scholar] [CrossRef]
  11. Corbella, H.M.; Pujol, D.S. What Lies behind Domestic Water Use? A Review Essay on the Drivers of Domestic Water Consumption. Bol. Asoc. Geógr. Esp. 2009, 50, 297–314. [Google Scholar]
  12. Sebri, M. A Meta-Analysis of Residential Water Demand Studies. Environ. Dev. Sustain. 2014, 16, 499–520. [Google Scholar] [CrossRef]
  13. Tanverakul, S.A.; Lee, J. Decadal Review of Residential Water Demand Analysis from a Practical Perspective. Water Pract. Technol. 2016, 11, 433–447. [Google Scholar] [CrossRef]
  14. Fercovic, J.; Foster, W.; Melo, O. Economic Development and Residential Water Consumption in Chile. Environ. Dev. Econ. 2019, 24, 23–46. [Google Scholar] [CrossRef]
  15. Van Langenhove, L. What Is a Region? Towards a Statehood Theory of Regions. Contemp. Politics 2013, 19, 474–490. [Google Scholar] [CrossRef]
  16. Baigorri, B.; Montañés, A.; Simón-Fernández, M.B. Household Water Consumption in Spain: Disparities between Region. Water 2022, 14, 1121. [Google Scholar] [CrossRef]
  17. Acuña, G.I.; Echeverría, C.; Godoy, A.; Vásquez, F. The Role of Climate Variability in Convergence of Residential Water Consumption across Chilean Localities. Environ. Econ. Policy Stud. 2020, 22, 89–108. [Google Scholar] [CrossRef]
  18. Romano, G.; Salvati, N.; Guerrini, A. Estimating the Determinants of Residential Water Demand in Italy. Water 2014, 6, 2929–2945. [Google Scholar] [CrossRef]
  19. Polycarpou, A.; Zachariadis, T. An Econometric Analysis of Residential Water Demand in Cyprus. Water Resour. Manag. 2013, 27, 309–317. [Google Scholar] [CrossRef]
  20. Anang, Z.; Padli, J.; Abdul Rashid, N.K.; Alipiah, R.M.; Musa, H. Factors Affecting Water Demand: Macro Evidence in Malaysia. J. Exp. Med. 2019, 53, 17–25. [Google Scholar] [CrossRef]
  21. Long, H.; Lin, B.; Ou, Y.; Chen, Q. Spatio-Temporal Analysis of Driving Factors of Water Resources Consumption in China. Sci. Total Environ. 2019, 690, 1321–1330. [Google Scholar] [CrossRef]
  22. Worland, S.C.; Steinschneider, S.; Hornberger, G.M. Drivers of Variability in Public-Supply Water Use Across the Contiguous United States. Water Resour. Res. 2018, 54, 1868–1889. [Google Scholar] [CrossRef]
  23. Keshavarzi, A.R.; Sharifzadeh, M.; Kamgar Haghighi, A.A.; Amin, S.; Keshtkar, S.; Bamdad, A. Rural Domestic Water Consumption Behavior: A Case Study in Ramjerd Area, Fars Province, I.R. Iran. Water Res. 2006, 40, 1173–1178. [Google Scholar] [CrossRef] [PubMed]
  24. Ismail, A.; Shalaby, A.; Khedr, A.A. Residential Water Consumption Patterns: A Theoretical Review. Environ. Res. Eng. Manag. 2024, 80, 8–31. [Google Scholar] [CrossRef]
  25. General Authority for Statistics Saudi Census. 2022. Available online: https://portal.saudicensus.sa/portal/public/1/15?type=TABLE (accessed on 24 August 2024).
  26. World Bank Climate Change Knowledge Portal. Available online: https://climateknowledgeportal.worldbank.org/country/saudi-arabia/climate-data-historical (accessed on 23 December 2024).
  27. Food and Agriculture Organization AQUASTAT Core Database. Available online: https://www.fao.org/aquastat/en/databases/maindatabase/ (accessed on 23 December 2024).
  28. SAMA Saudi Central Bank Portal for Open Data. Available online: https://www.sama.gov.sa/en-us/economicreports/pages/database.aspx (accessed on 16 December 2024).
  29. Ministry of Environment Water and Agriculture. Statistical Yearly Book 2019; Ministry of Environment Water and Agriculture: Riyadh, Saudi Arabia, 2019. [Google Scholar]
  30. Nauges, C.; Thomas, A. Privately Operated Water Utilities, Municipal Price Negotiation, and Estimation of Residential Water Demand: The Case of France. Land Econ. 2000, 76, 68–85. [Google Scholar] [CrossRef]
  31. Bennett, C.; Stewart, R.A.; Beal, C.D. ANN-Based Residential Water End-Use Demand Forecasting Model. Expert Syst. Appl. 2013, 40, 1014–1023. [Google Scholar] [CrossRef]
  32. Beal, C.; Stewart, R.; Huang, T.-T.; Rey, E. SEQ Residential End Use Study. Water 2011, 38, 80–84. [Google Scholar]
  33. Zhang, J.; Zhang, X.; Li, H.; Fan, Y.; Meng, Z.; Liu, D.; Pan, S. Optimization of Water Quantity Allocation in Multi-Source Urban Water Supply Systems Using Graph Theory. Water 2025, 17, 61. [Google Scholar] [CrossRef]
Figure 1. Urban water consumption categories.
Water 17 01156 g001
Figure 2. Scatter plots for urban water consumption and related climatic and geographic factors.
Water 17 01156 g002
Figure 3. Scatter plots for urban water consumption and related socio-demographic factors.
Water 17 01156 g003aWater 17 01156 g003b
Figure 4. Scatter plot for percentage of households living in apartments and urban water consumption, 2022.
Water 17 01156 g004
Figure 5. Scatter plot for urban water consumption and availability of desalinated water, 2022.
Water 17 01156 g005
Figure 6. Correlation coefficients between the different factors and average daily urban water consumption (liters/person/day).
Water 17 01156 g006
Table 1. Administrative regions in Saudi Arabia: key information.
Administrative RegionCapital CityGovernoratesArea in km2 (% of Total)Population in 2022 (% of Total)Population Density
1RiyadhRiyadh2218.8%26.7%22.6
2MakkahMakkah167.1%24.9%58.6
3MadinahMadinah87.1%6.6%14.3
4QaseemBuraydah122.7%4.2%18.3
5Eastern RegionDammam1231.3%15.9%9.5
6AsirAbha173.6%6.3%25.3
7TabukTabuk66.8%2.8%6.5
8HailHail84.8%2.3%6.2
9Northern BordersArar35.2%1.2%3.6
10JazanJazan160.5%4.4%108.1
11NajranNajran67.0%1.8%4.6
12BahaBaha90.5%1.1%28.3
13JoufSakaka34.7%1.9%7
Saudi ArabiaRiyadh1382,149,690 32,175,224 15.0
Table 2. Variables descriptions, sources, and availability.
CategoryVariableDescriptionSource and Availability
Urban water consumption Water (total)Total urban water consumption by region (thousand m3)SAMA, 2010–2022
Water (daily)Daily per capita urban water consumption (liter/person/day)Calculated, 2010–2022
Climatic and geographicMax temp.Mean maximum temperature (°C)WB, 2010–2022
PrecipitationAverage annual precipitation (mm)WB, 2010–2022
ElevationAverage elevation (AMSL)GeoNames
Socio-demographic HH incomeAverage Saudi household monthly income (Saudi Riyal)GASTAT, 2018
EducationPercentage of Saudi residents (10 years and over) with bachelor’s degreeGASTAT, 2017
YoungPercentage of population less than or equal to 19 years oldGASTAT, 2022
ElderlyPercentage of population greater than or equal to 65 years oldGASTAT, 2022
Property characteristic Public servicePercentage of households that use public water service as a water sourceGASTAT, 2019
Water tankPercentage of households that use water tanks as a water sourceGASTAT, 2019
WellPercentage of households that use wells as a water sourceGASTAT, 2019
ApartmentPercentage of households living in apartments GASTAT, 2022
ConservationPercentage of households that use water conservation equipmentGASTAT, 2022
Booster pumpPercentage of households that use a water booster pumpGASTAT, 2022
Washing machinePercentage of households that have an automatic washing machine GASTAT, 2022
DishwasherPercentage of households that have a dishwasherGASTAT, 2022
Western toiletPercentage of households that have western toiletsGASTAT, 2022
Public supplyPercentage of households that use public water supply as the main source of drinking waterGASTAT, 2022
GardenPercentage of households that have a garden GASTAT, 2022
Auto irrigationPercentage of households that have automatic irrigation systemsGASTAT, 2022
Environmental awareness Env. concernPercentage of residents who are very worried about the environment and environmental issuesGASTAT, 2022
Env. knowledgePercentage of residents who have a good knowledge of environmental issuesGASTAT, 2022
Env. interestPercentage of residents who are very interested in the environmentGASTAT, 2022
Water scarcityPercentage of residents who rated drinking water scarcity as the most important environmental issueGASTAT, 2022
Institutional factorsDesalinationPercentage of total desalinated water used in the region for urban purposesMEWA, 2022
Note(s): SAMA: Saudi Central Bank; WB: World Bank; GeoNames: the GeoNames geographical database; MEWA: Ministry of Environment, Water and Agriculture; GASTAT: General Authority for Statistics.
Table 3. Descriptive analysis of urban water consumption, 2010–2022.
Administrative RegionDaily per Capita UWC *, 2010Daily per Capita UWC, 2022Average Daily per UWC, 2010–2022Minimum Value UWC, 2010–2022Maximum Value UWC, 2010–2022Annual Average per Capita Daily UWC Growth Rates 2010–2022Average Share of UWC (% of Total UWC), 2010–2022
1Riyadh2923533292853651.6%31.4%
2Makkah2142792452142892.2%23.9%
3Madinah2323442622193443.3%6.7%
4Qaseem2633302661243771.9%4.5%
5Eastern Region3443523683423810.2%20.5%
6Asir83161117831635.7%2.9%
7Tabuk1992262161582991.1%2.4%
8Hail1362261941052654.3%1.6%
9Northern Borders1431941941362902.6%0.9%
10Jazan352181133122516.5%2.2%
11Najran54143107451598.5%0.8%
12Baha603081856032814.6%0.9%
13Jouf239177229149268−2.5%1.4%
Saudi Arabia2722992882653180.8%100%
Note(s): * UWC: urban water consumption.
Table 4. Water source used by households (% of total), 2019.
Administrative RegionDaily per Capita Urban Water Consumption Public Water ServiceWater TankPrivate Wells
1Riyadh35392.86.70.6
2Makkah23372.725.51.8
3Madinah24280.216.92.9
4Qaseem24484.713.32.0
5Eastern Region378L92.54.23.3
6Asir12726.967.85.4
7Tabuk22080.416.92.7
8Hail22464.034.61.4
9Northern Borders18185.314.20.6
10Jazan8167.226.55.6
11Najran11636.855.77.5
12Bahah25476.816.96.3
13Jouf24280.57.911.6
Table 5. Household equipment and water consumption (% of total), 2022.
Administrative RegionDaily per Capita Urban Water Consumption Conservation EquipmentBooster PumpWashing MachineDishwasherWestern ToiletGardenAutomatic IrrigationUse Public Supplies for Drinking
1Riyadh35336.531.570.025.261.37.740.130.7
2Makkah27933.623.461.718.467.33.326.726.9
3Madinah34431.923.860.921.151.94.641.136.3
4Qaseem33038.827.163.921.237.26.442.835.6
5Eastern Region35232.339.571.119.063.17.241.827.6
6Asir16138.223.150.924.039.97.029.018.0
7Tabuk22627.525.655.017.340.04.619.429.1
8Hail22637.222.558.017.834.29.233.037.3
9Northern Borders19431.229.354.915.330.66.528.823.3
10Jazan21826.524.535.89.232.56.017.324.6
11Najran14332.524.148.415.521.86.540.325.6
12Bahah30840.924.054.125.049.310.723.537.6
13Jouf17733.127.948.510.430.47.432.330.4
Table 6. Environmental awareness and urban water consumption, 2022.
Administrative RegionDaily per Capita Urban Water Consumption Environmental ConcernEnvironmental KnowledgeEnvironmental InterestWater Scarcity
1Riyadh35311.424.356.311.7
2Makkah27910.323.755.513.9
3Madinah34410.424.457.011.9
4Qaseem3308.123.257.512.1
5Eastern Region35210.624.856.111.1
6Asir16110.527.762.118.9
7Tabuk22610.327.360.212.2
8Hail2269.228.963.416.1
9Northern Borders1947.227.655.814.7
10Jazan2189.623.860.416.5
11Najran14311.325.761.016.2
12Bahah3089.929.463.518.1
13Jouf17711.228.763.216.7
Disclaimer/Publisher’s Note: The statements, opinions and data contained in all publications are solely those of the individual author(s) and contributor(s) and not of MDPI and/or the editor(s). MDPI and/or the editor(s) disclaim responsibility for any injury to people or property resulting from any ideas, methods, instructions or products referred to in the content.

