Article

A Cloud Toolkit for the Assessment of Invasive Species in Pressurized Irrigation Networks

Department of Soil and Water, EEAD-CSIC, Avda. Montañana 1005, 50059 Zaragoza, Spain
*
Author to whom correspondence should be addressed.
Water 2025, 17(8), 1145; https://doi.org/10.3390/w17081145
Submission received: 10 February 2025 / Revised: 8 April 2025 / Accepted: 11 April 2025 / Published: 11 April 2025

Abstract

:
The colonization of pressurized irrigation networks by zebra mussels (Dreissena polymorpha) poses a serious risk to water delivery, reducing pipeline capacity and potentially causing complete blockages. Despite the critical need for early detection and effective management, existing methods often rely on costly, time-consuming field inspections or indirect indicators with limited accuracy. To address this gap, we present SIMZEBRA, a cloud-based toolkit that assesses invasions using hydraulic monitoring and simulation. The tool employs the Normalized Pressure Method, comparing real-time pressure data from transducers with EPANET simulations of a mussel-free network. An optimization process adjusts friction coefficients in network segments until simulated and measured pressures align, enabling the generation of infestation maps over user-defined time periods. Compared to conventional approaches, SIMZEBRA enhances detection accuracy, reduces the reliance on physical inspections, and provides a scalable, automated solution for continuous monitoring. The tool also integrates experimental data to establish relationships between mussel density, pipeline diameter, and roughness. In the presented case study, roughness increases of up to 10 mm were detected in affected pipes, while local head losses at hydrants ranged between 9 and 11 m, depending on flow conditions. Developed in R with CPU parallelization, the toolkit operates remotely on a cloud server, ensuring fast, efficient, and cost-effective detection and management of zebra mussel infestations. This approach improves early warning capabilities and supports proactive invasive species management in pressurized irrigation networks.

1. Introduction

The zebra mussel, scientifically known as Dreissena polymorpha, is an invasive freshwater mollusk species that has caused serious issues in aquatic systems worldwide, including pressurized collective irrigation networks [1,2,3,4]. Native to Eastern Europe, this small mollusk has found its way to other regions through human activities such as ship and water equipment transportation. Zebra mussels are known for their prolific reproduction, adaptability, and ability to adhere to surfaces, including pipelines and irrigation equipment. Additionally, these mussels filter large amounts of phytoplankton, disrupting aquatic ecosystems and negatively affecting native aquatic fauna [5]. Zebra mussel poses a significant threat to irrigation networks by clogging pipes, thus hindering irrigation water delivery [3]. These blockages not only affect agricultural irrigation, but also untreated industrial and municipal water supply systems. Economically, these invasive species can lead to costly maintenance and repair of pipelines, as well as reduced efficiency in water delivery due to blockages and increased friction within the system. Environmentally, zebra mussels can alter local ecosystems by outcompeting native species, disrupting food chains, and impacting water quality. The spread of these mussels can thus have long-lasting effects on both the infrastructure and ecological balance of an affected region.
This invasive species has become a significant issue in Spain’s aquatic ecosystems and infrastructure [6,7,8,9]. The zebra mussel was first detected in Spain in the Ebro River in 2001. The species has rapidly spread to various water bodies across the country, including rivers, lakes, and reservoirs. In addition, the invasion of zebra mussels in pressurized irrigation networks is a significant challenge in various regions of Europe and North America, where the species has caused considerable economic and environmental damage. In North America, particularly in the Great Lakes region and western U.S. states, management efforts have focused on chemical control, mechanical removal, and biological control [10,11,12]. Similarly, in European countries, mitigation strategies also include the use of specialized antifouling coatings on infrastructure to prevent mussel attachment [13].
The environmental conditions within irrigation reservoirs are favorable for the reproduction and growth of zebra mussels [2]. Once these reservoirs are colonized, they become a constant source of mussel larvae that can spread downstream into other water bodies and irrigation systems. As reported by [2], canals have been and are the main dispersion vector of zebra mussels inside a river basin. Ref. [3] also highlighted the role of reservoir–canal connections in the Riegos del Alto Aragón (RAA) irrigated area as the key dispersion vector of the species throughout its Water Users Associations (WUAs). The most intense infestation of zebra mussels in irrigation pipes tends to occur during their early juvenile stage, when planktonic veligers are present [14]. Veligers initially move freely in the water, but as they age, typically from 18 to 90 days, they attach themselves to solid surfaces, resulting in biofouling, pipe blockages, and a decrease in water transportation efficiency. The colonization of pipelines is a gradual process that leads to an increase in their roughness and ultimately to a decrease in their effective diameter. Without proper control measures, this infestation progressively reduces the conveyance capacity of the irrigation network. This complex situation has brought zebra mussel colonization together with the cost of electricity for pumping as the two key problems of modern large-scale pressurized irrigation infrastructure in many areas of Spain [3].
Zebra mussel detection and control methods can be proactive (preventive or during the first stages of mussel development) or reactive (for well-established mussels). The choice of control measures depends on the vulnerability of the system, the mode of operation, the size of the mussel population, the operational preferences, and the economic considerations [15]. Efforts to control and mitigate zebra mussel infestations and spread in Spain have included the implementation of preventive measures such as regular inspections of water infrastructure and reactive measures such as reservoir desiccation [16,17], mechanical cleaning, and chemical control [18]. However, the challenges posed by this invasive species continue to be a concern for water resource managers and farmers.
From a hydraulic point of view, the effect of pipeline colonization by zebra mussels can be seen as a reduction in cross-sectional area and an increase in friction with the internal walls. The fluid suffers a loss of energy and, therefore, a reduction in pressure. As a consequence, zebra mussel invasion in collective pressurized irrigation networks can be assessed by measuring pressure at a given point and comparing it to the results of hydraulic simulations. Pressure monitoring offers several key benefits:
  • Timeliness: Pressure data are collected in real-time, enabling the detection of changes in the network that may indicate mussel colonization. This is in contrast to visual inspections, which are typically limited by the availability of personnel and can be time-consuming. Furthermore, visual inspections are very limited in underground pipelines.
  • Continuous spatial coverage: Unlike visual inspections that are limited to specific areas or require significant manpower to cover large networks, pressure sensors provide continuous, automated monitoring across the entire network. This ensures that even remote sections of the irrigation system are monitored without interruption.
  • Potential for automation: The pressure monitoring system can be fully automated, allowing for continuous, real-time detection of infestations without the need for manual intervention. This automation significantly reduces the operational costs and time required for inspections compared to manual methods.
We believe that these advantages make pressure monitoring an effective and scalable solution for the early detection of zebra mussel infestations, particularly in large, complex irrigation networks where other methods may be less feasible or even impossible.
A tool is proposed in this paper based on previous research developing and applying the Normalized Pressure Method (NPM). Ref. [3] presented the principles of this method, along with a preliminary implementation in irrigation networks. The NPM is based on manual or sensor pressure measurements and EPANET hydraulic simulations [19]. EPANET 2.0 is a widely used software tool developed by the U.S. Environmental Protection Agency (EPA) for modeling the hydraulic and water quality behavior of pressurized water distribution systems. It considers a variety of hydraulic components such as pipes, pumps, valves, and storage tanks. EPANET is particularly useful for simulating the steady-state and dynamic behavior of water distribution networks, making it an ideal platform for comparing and validating real-time pressure data in studies like ours. Normalized Pressure was defined as the difference between the simulated and measured pressure at a point in steady state conditions. This difference could be related to an upstream increase in roughness due to the presence of zebra mussels. An extension of this work was presented by [4], applying the NPM to a collective network with available data for hydrant operation time and water demand. These data were obtained from the database of the telemetry and remote-control system (TM/RC) of a WUA and from measured pressure data at several network points.
Traditional detection methods may only detect infestations at an advanced stage, when colonies are already well established, leading to delayed mitigation actions. In contrast, the NPM allows for early detection by identifying anomalies in hydraulic conditions that indicate the presence of zebra mussel colonies. The aim of the present research is to progress in the automatic detection and location of zebra mussel colonies in irrigation networks by means of hydraulic simulation techniques. The innovations proposed in this work include enhancing the computational efficiency of the simulation tool through massive parallelization techniques, integrating the calculation routines with a web-based graphical user interface, and enabling the generation of network infestation maps spanning multiple weeks or even an entire irrigation season. Furthermore, a significant effort has been devoted to develop a comprehensive, self-contained cloud toolkit with the following characteristics:
  • Remotely acquiring and monitoring water flow data from the TM/RC system of a collective pressurized irrigation network;
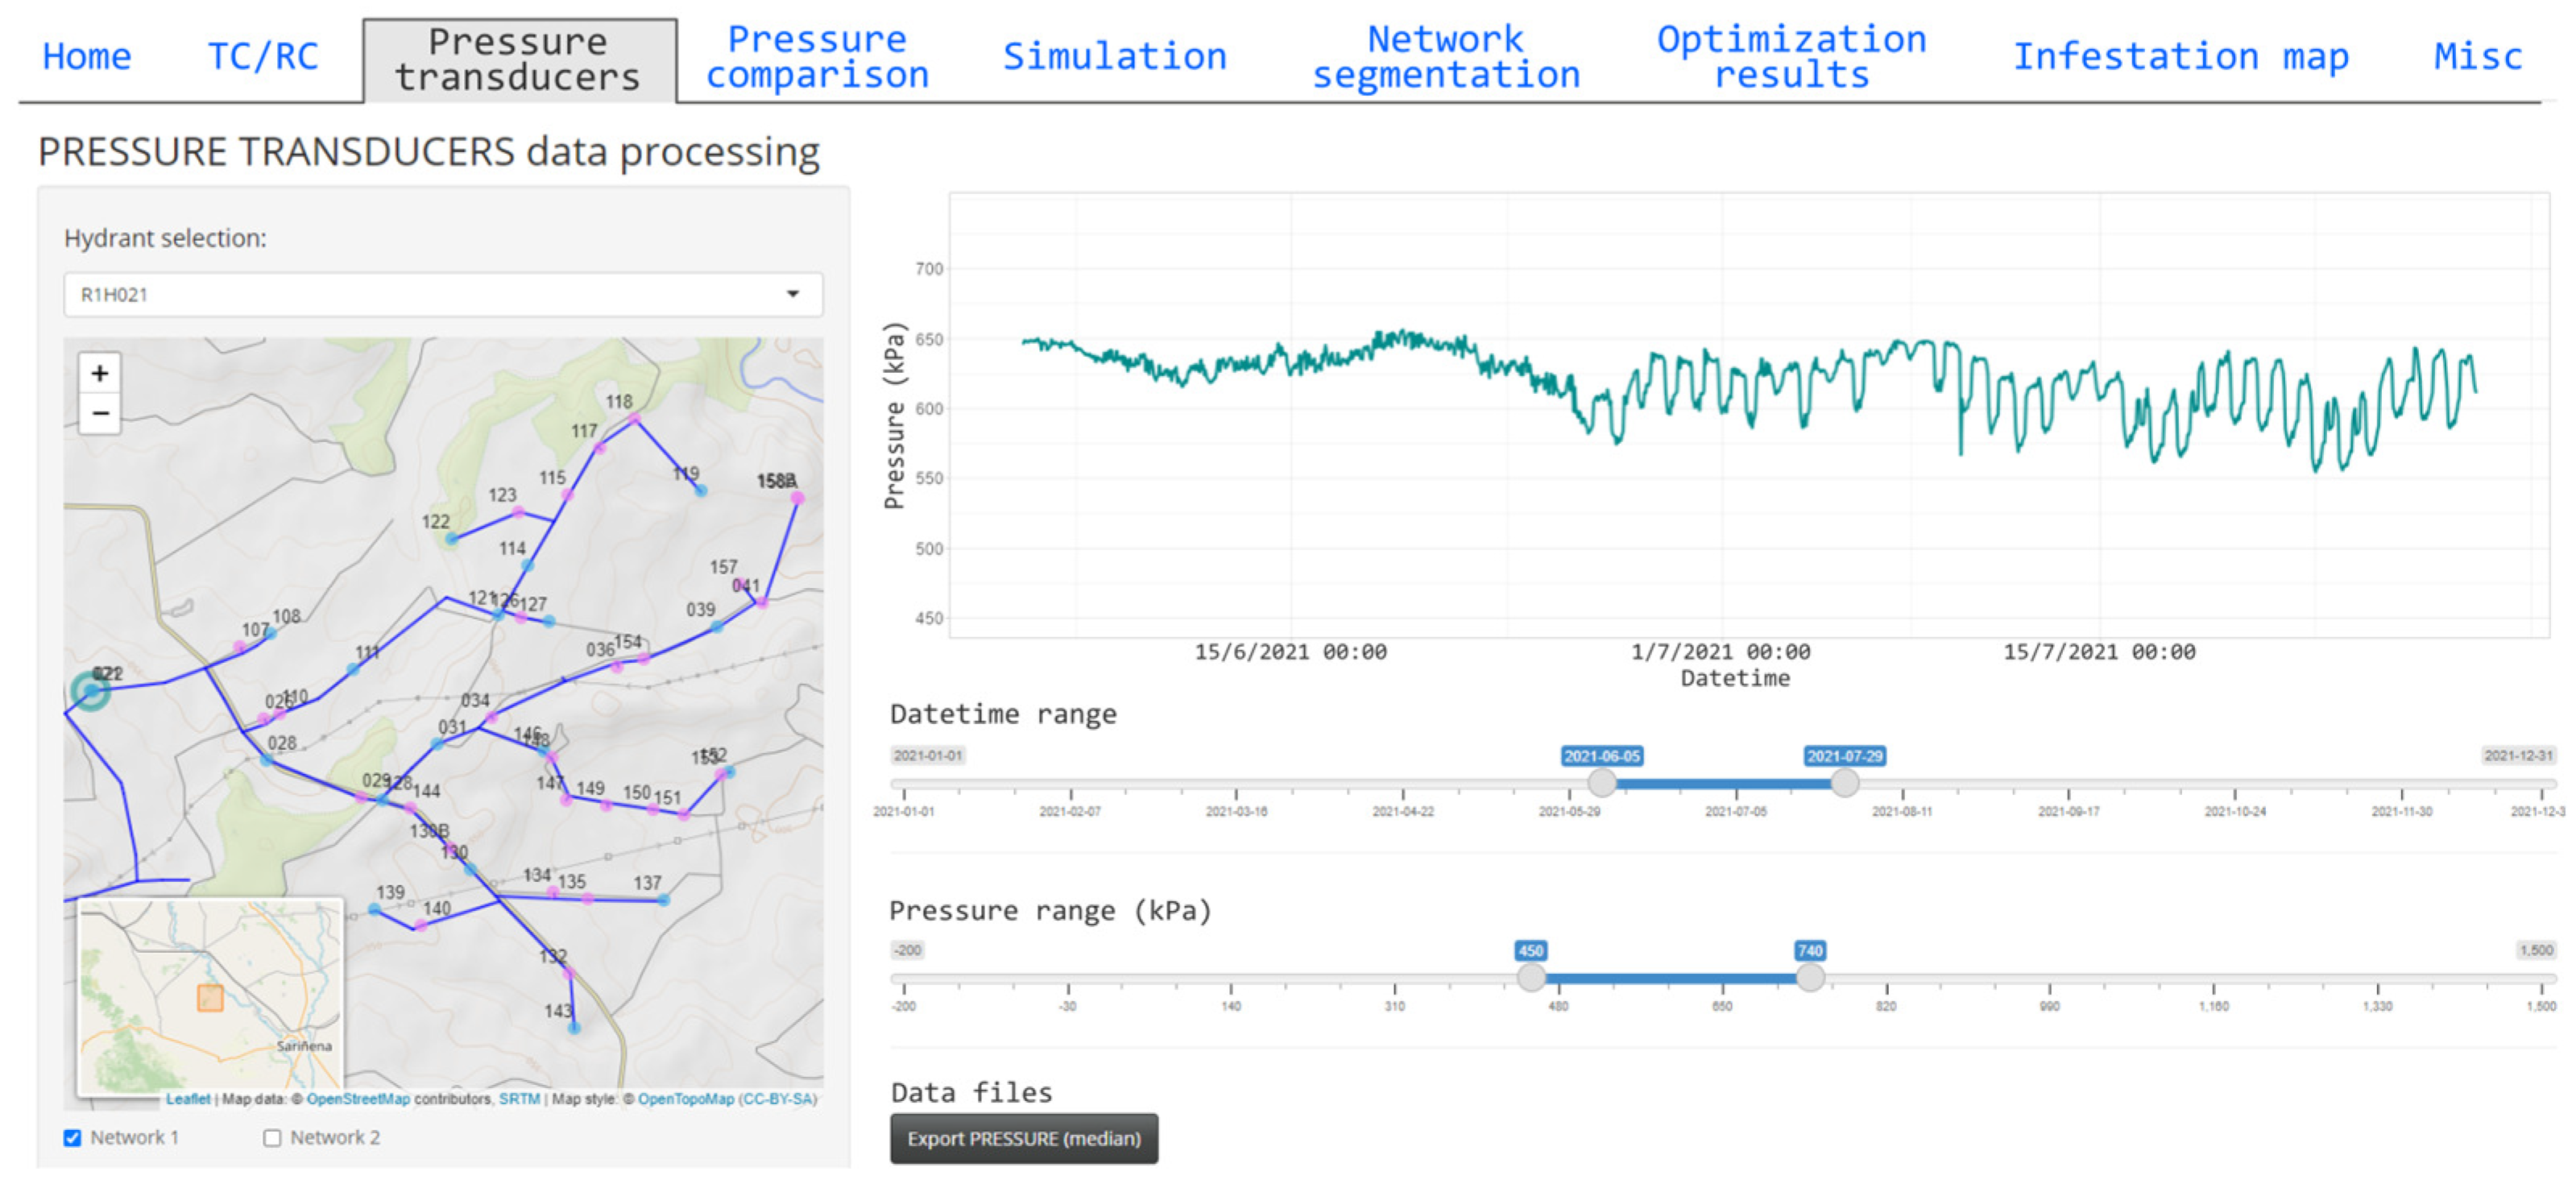
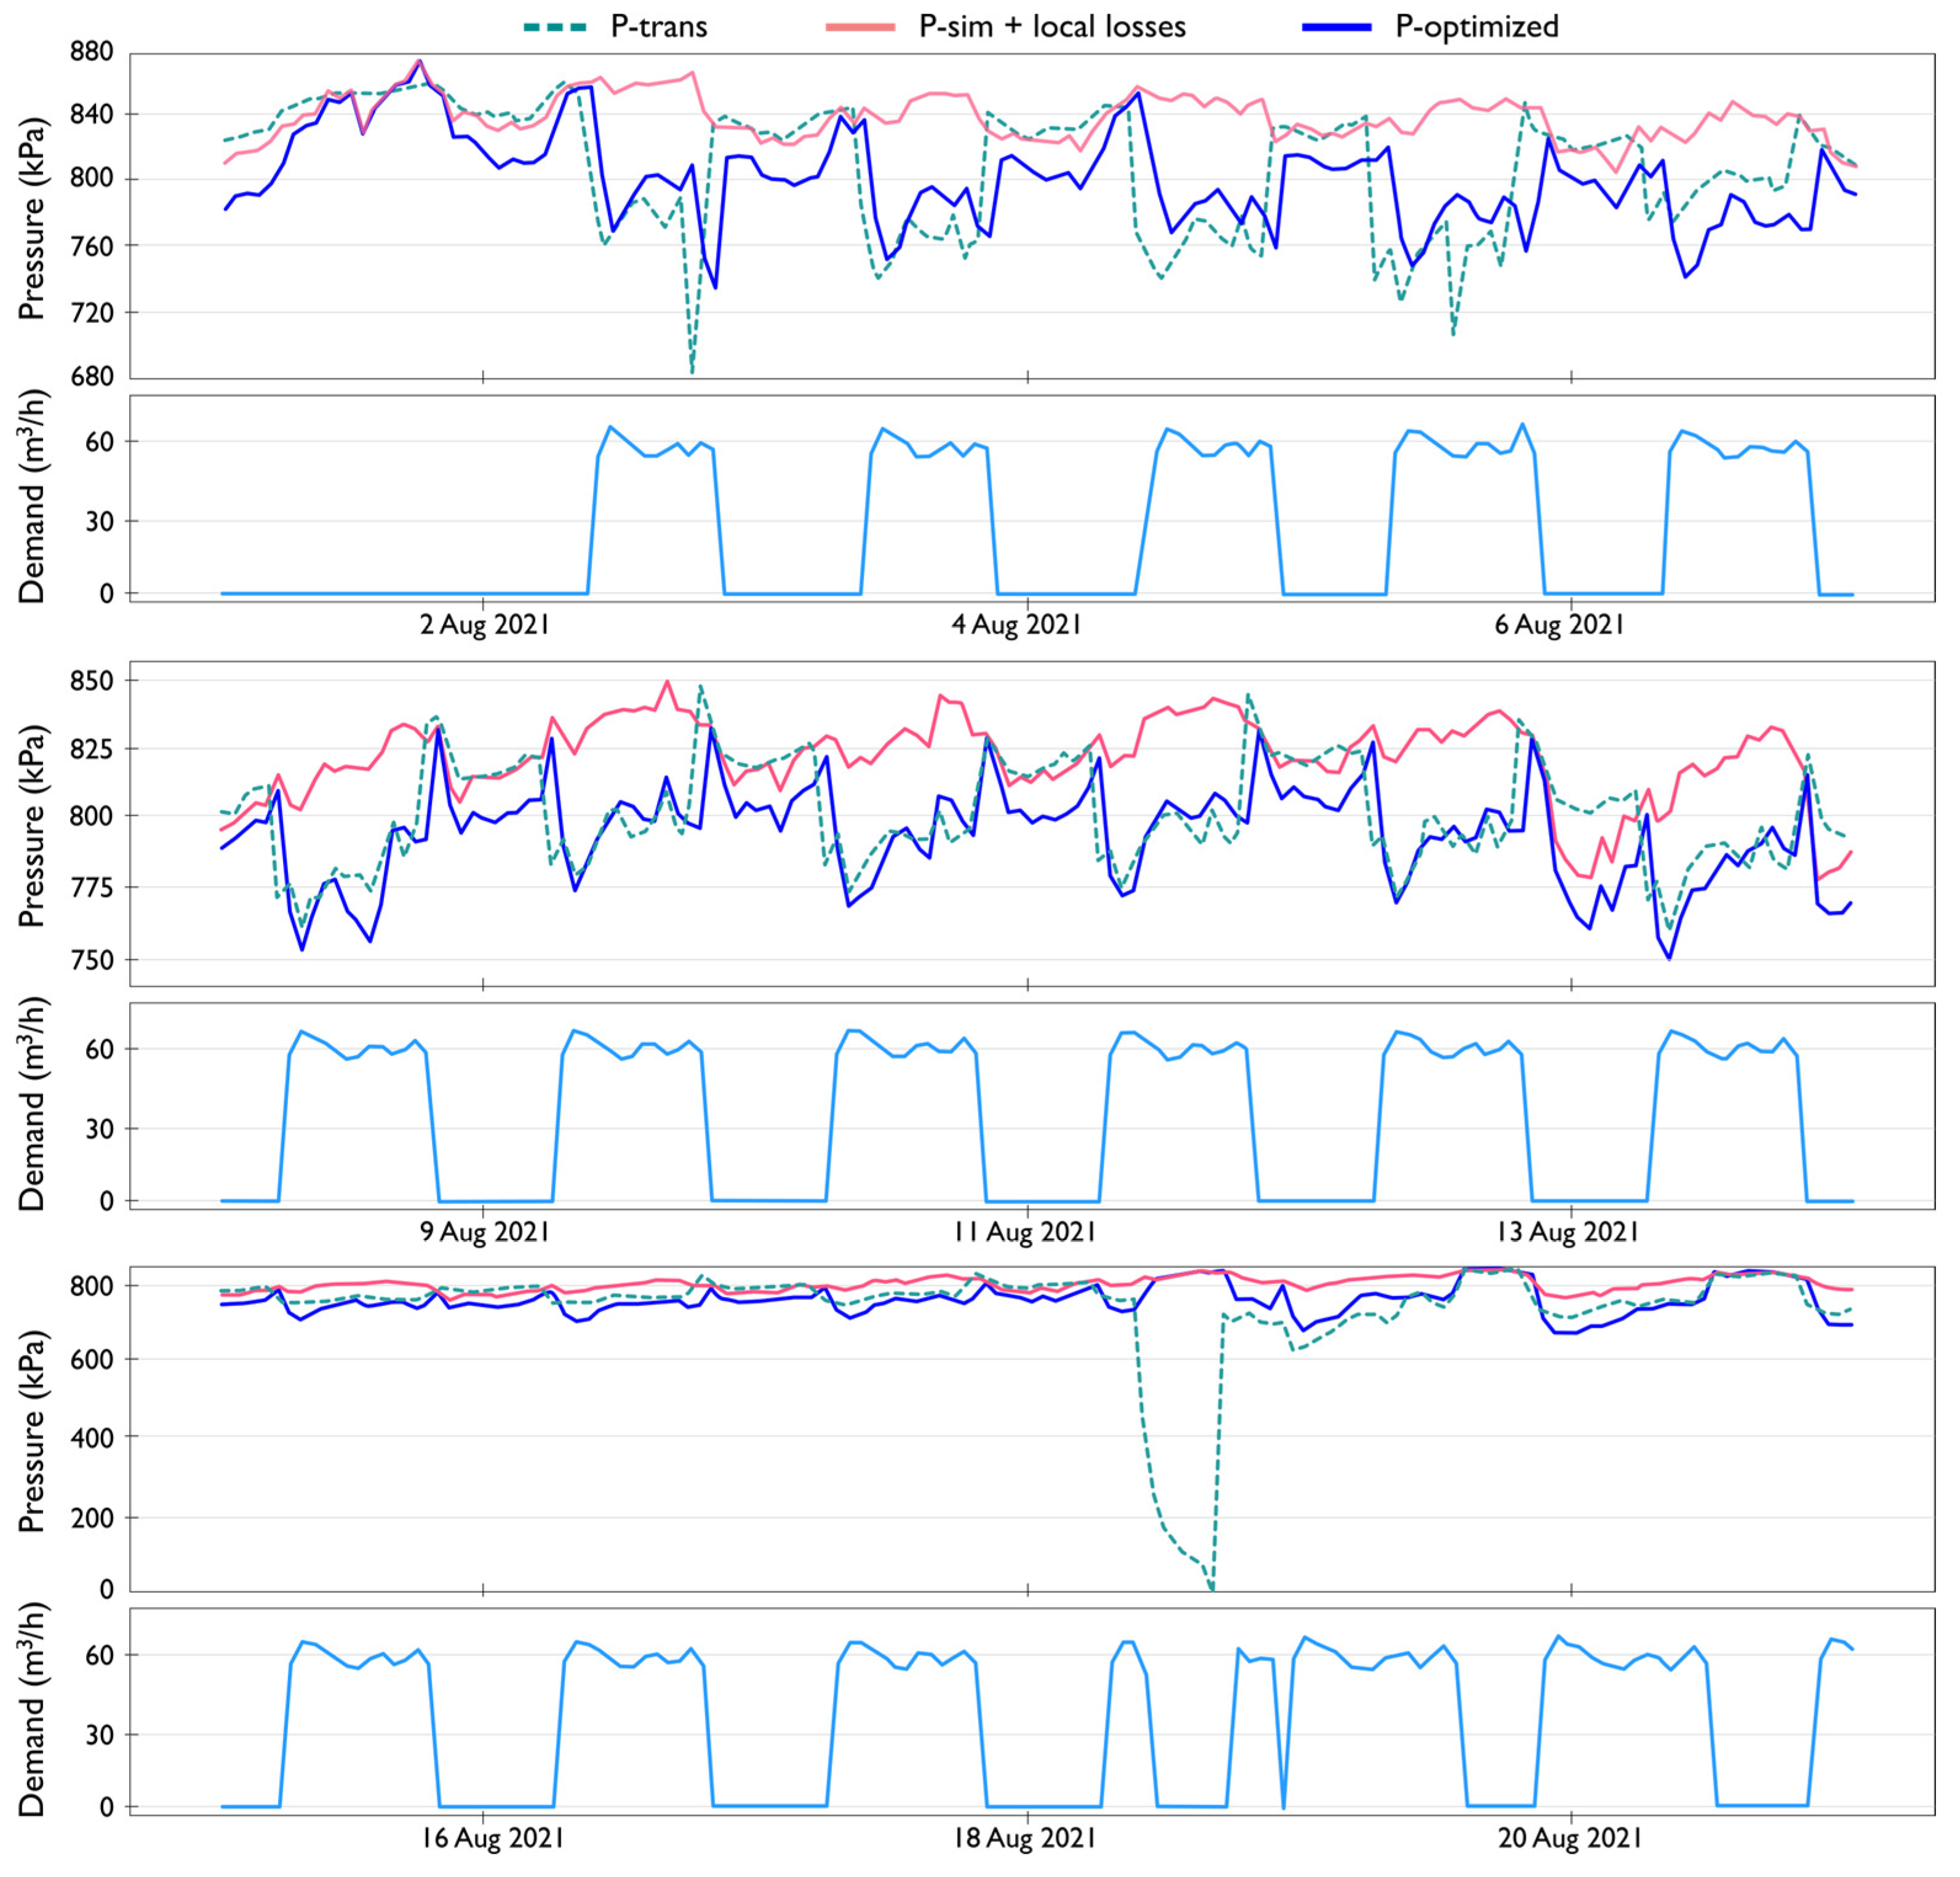
  • Remotely acquiring and monitoring pressure data from a network of pressure transducers;
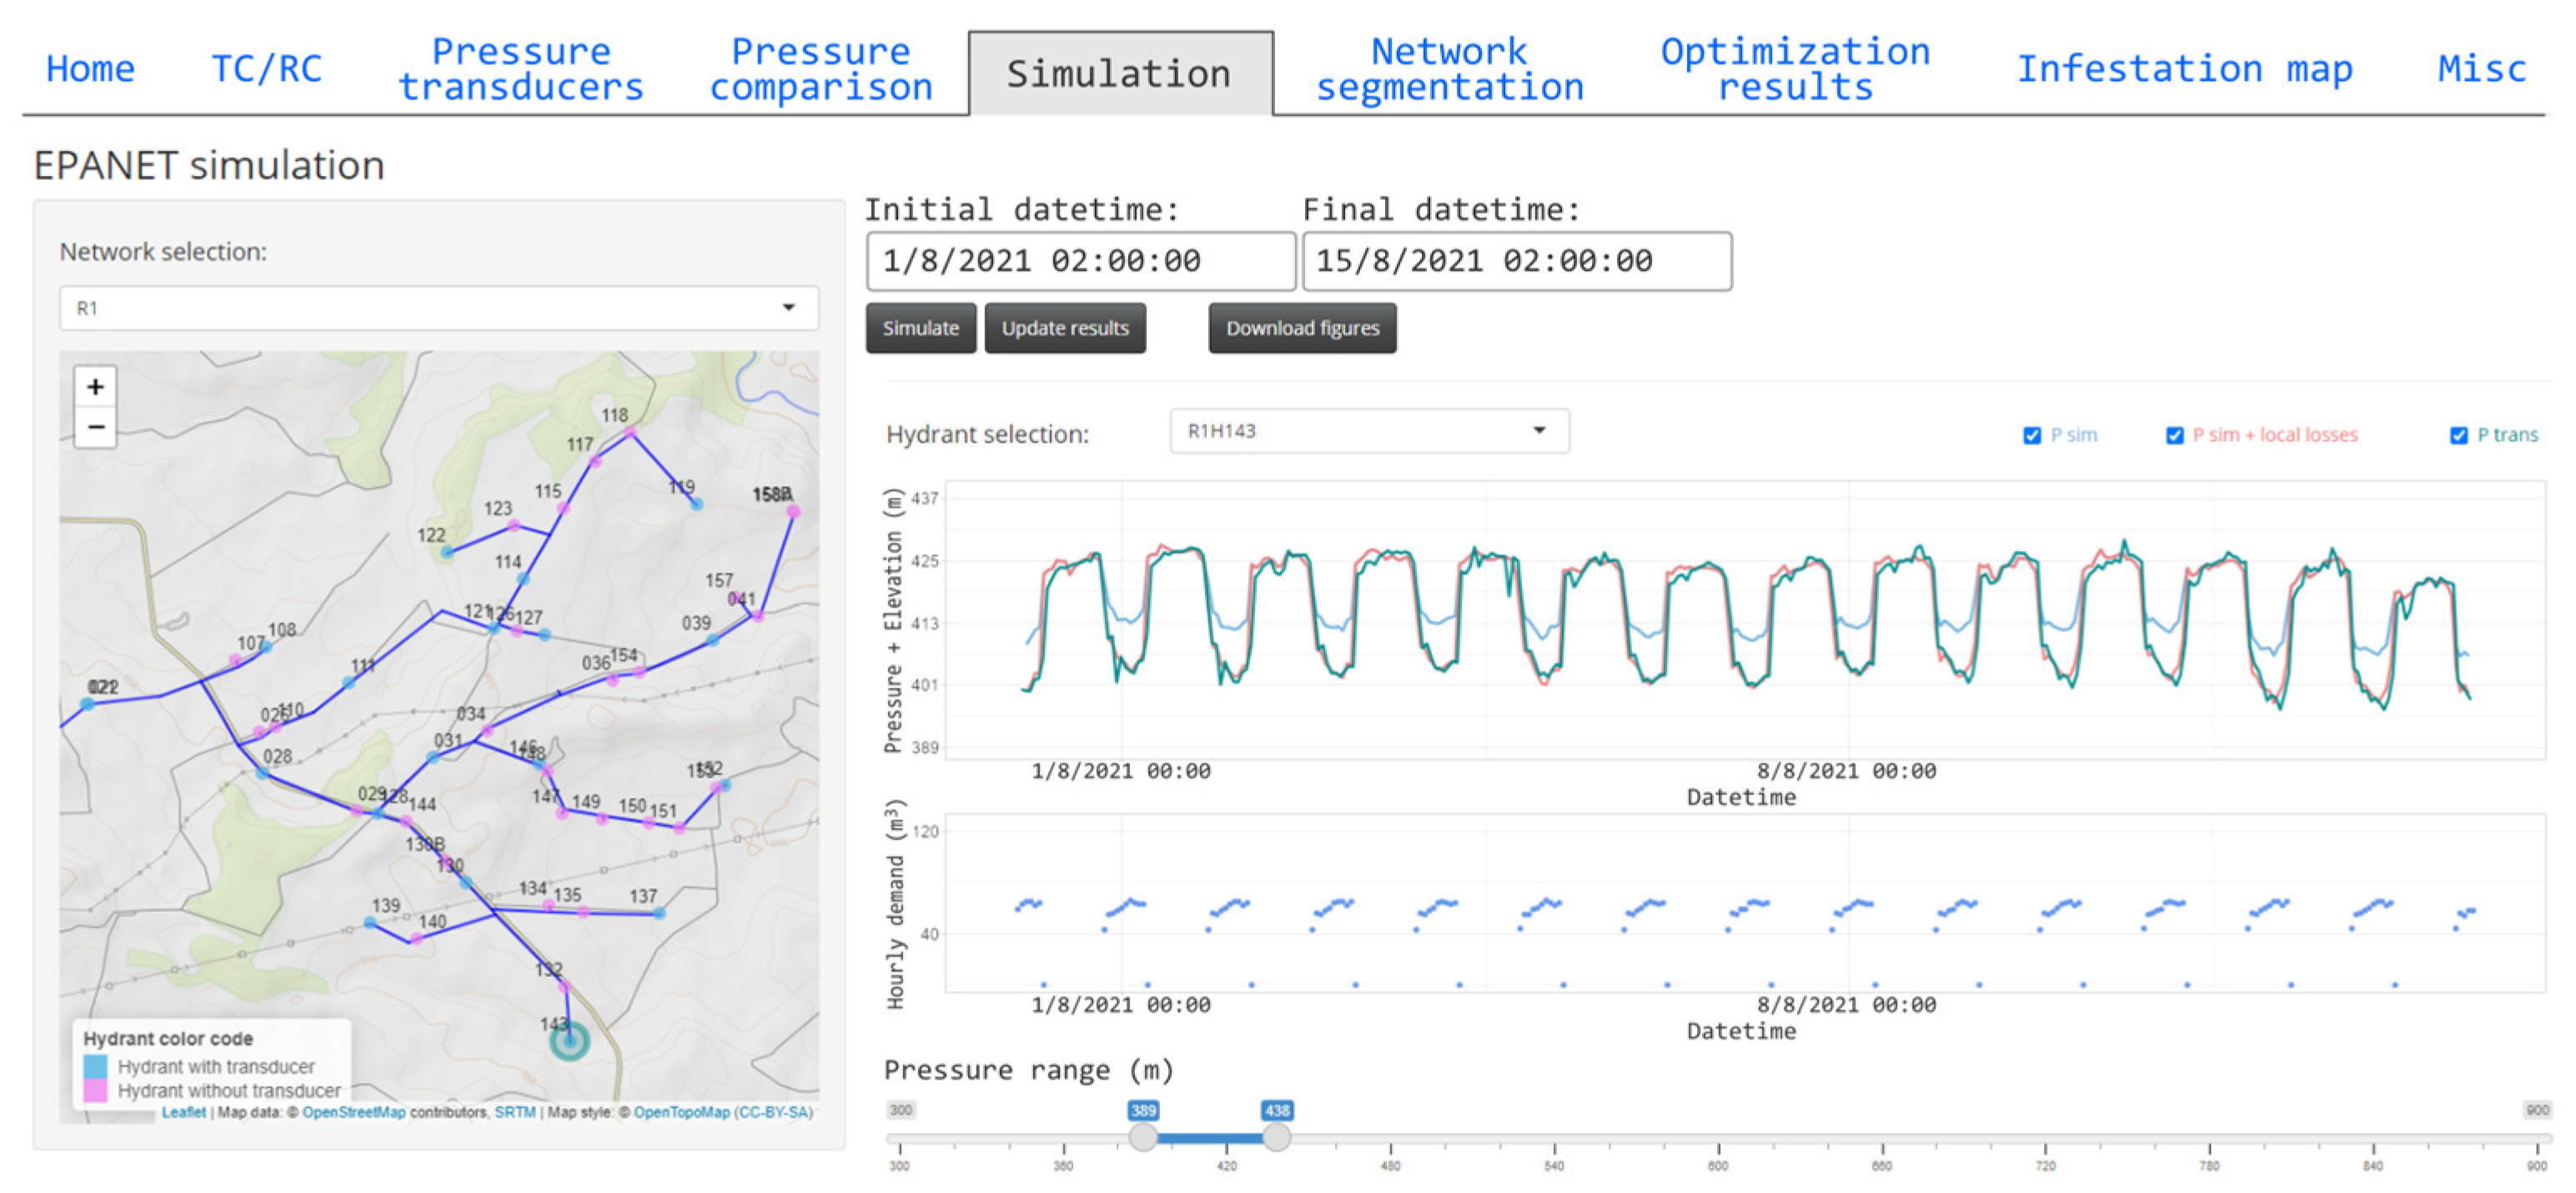
  • Conducting hydraulic simulations for a user-defined temporal window, assuming pipe roughness coefficients corresponding to a mussel-free state;
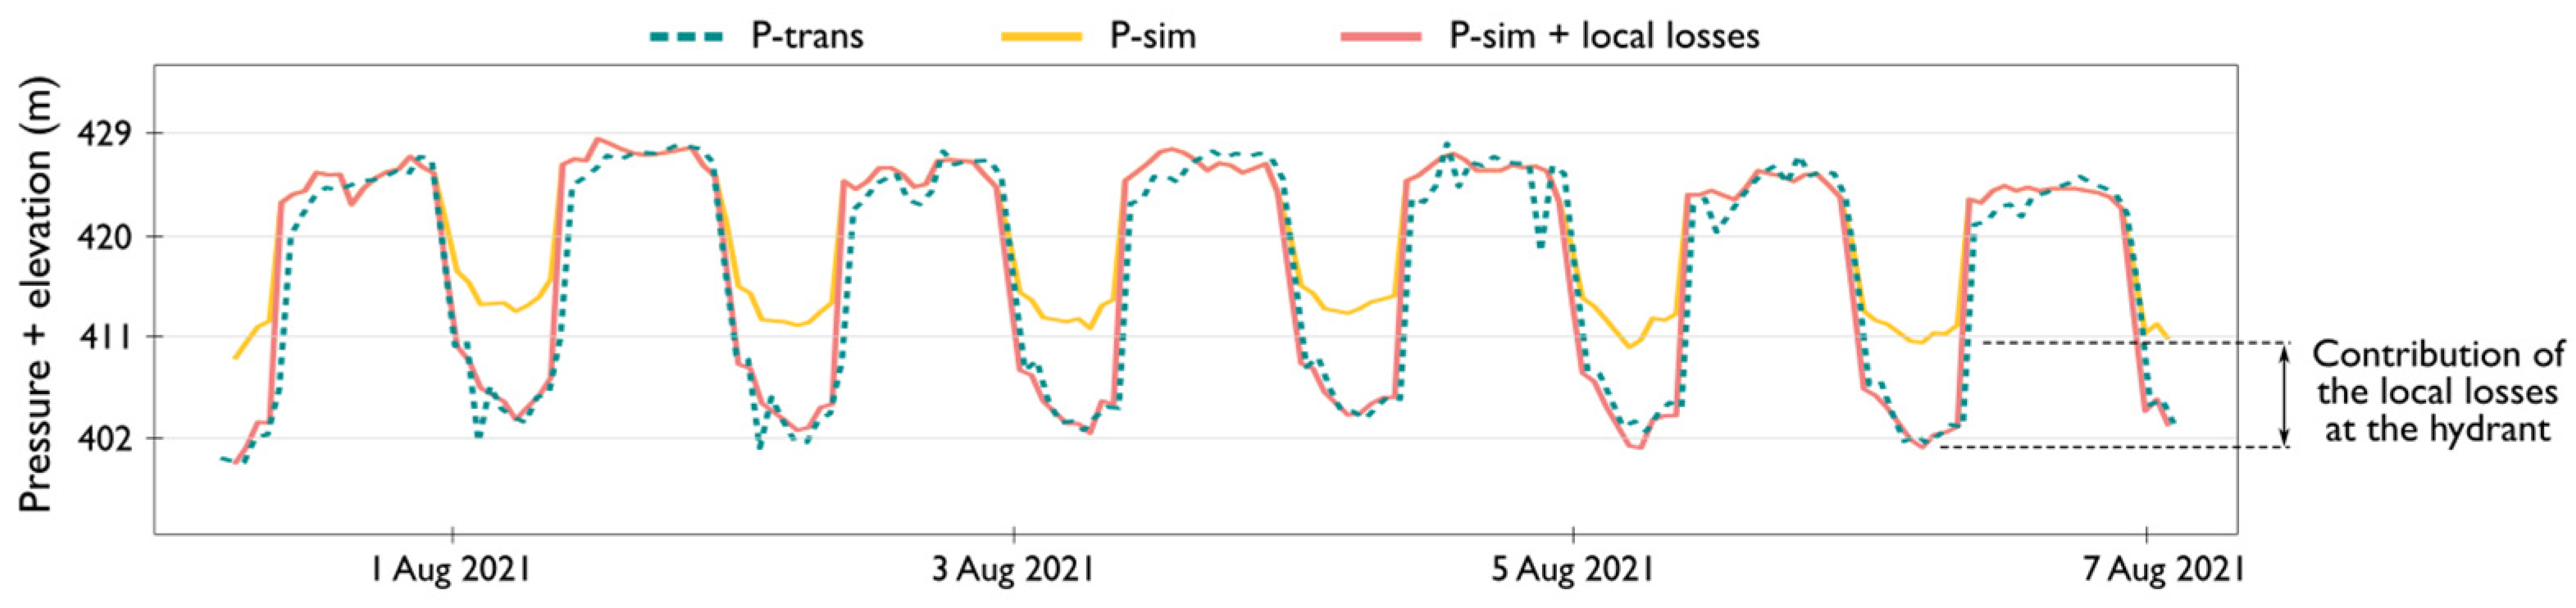
  • Comparing the simulated pressure with the measured pressure at relevant hydrants in the network;
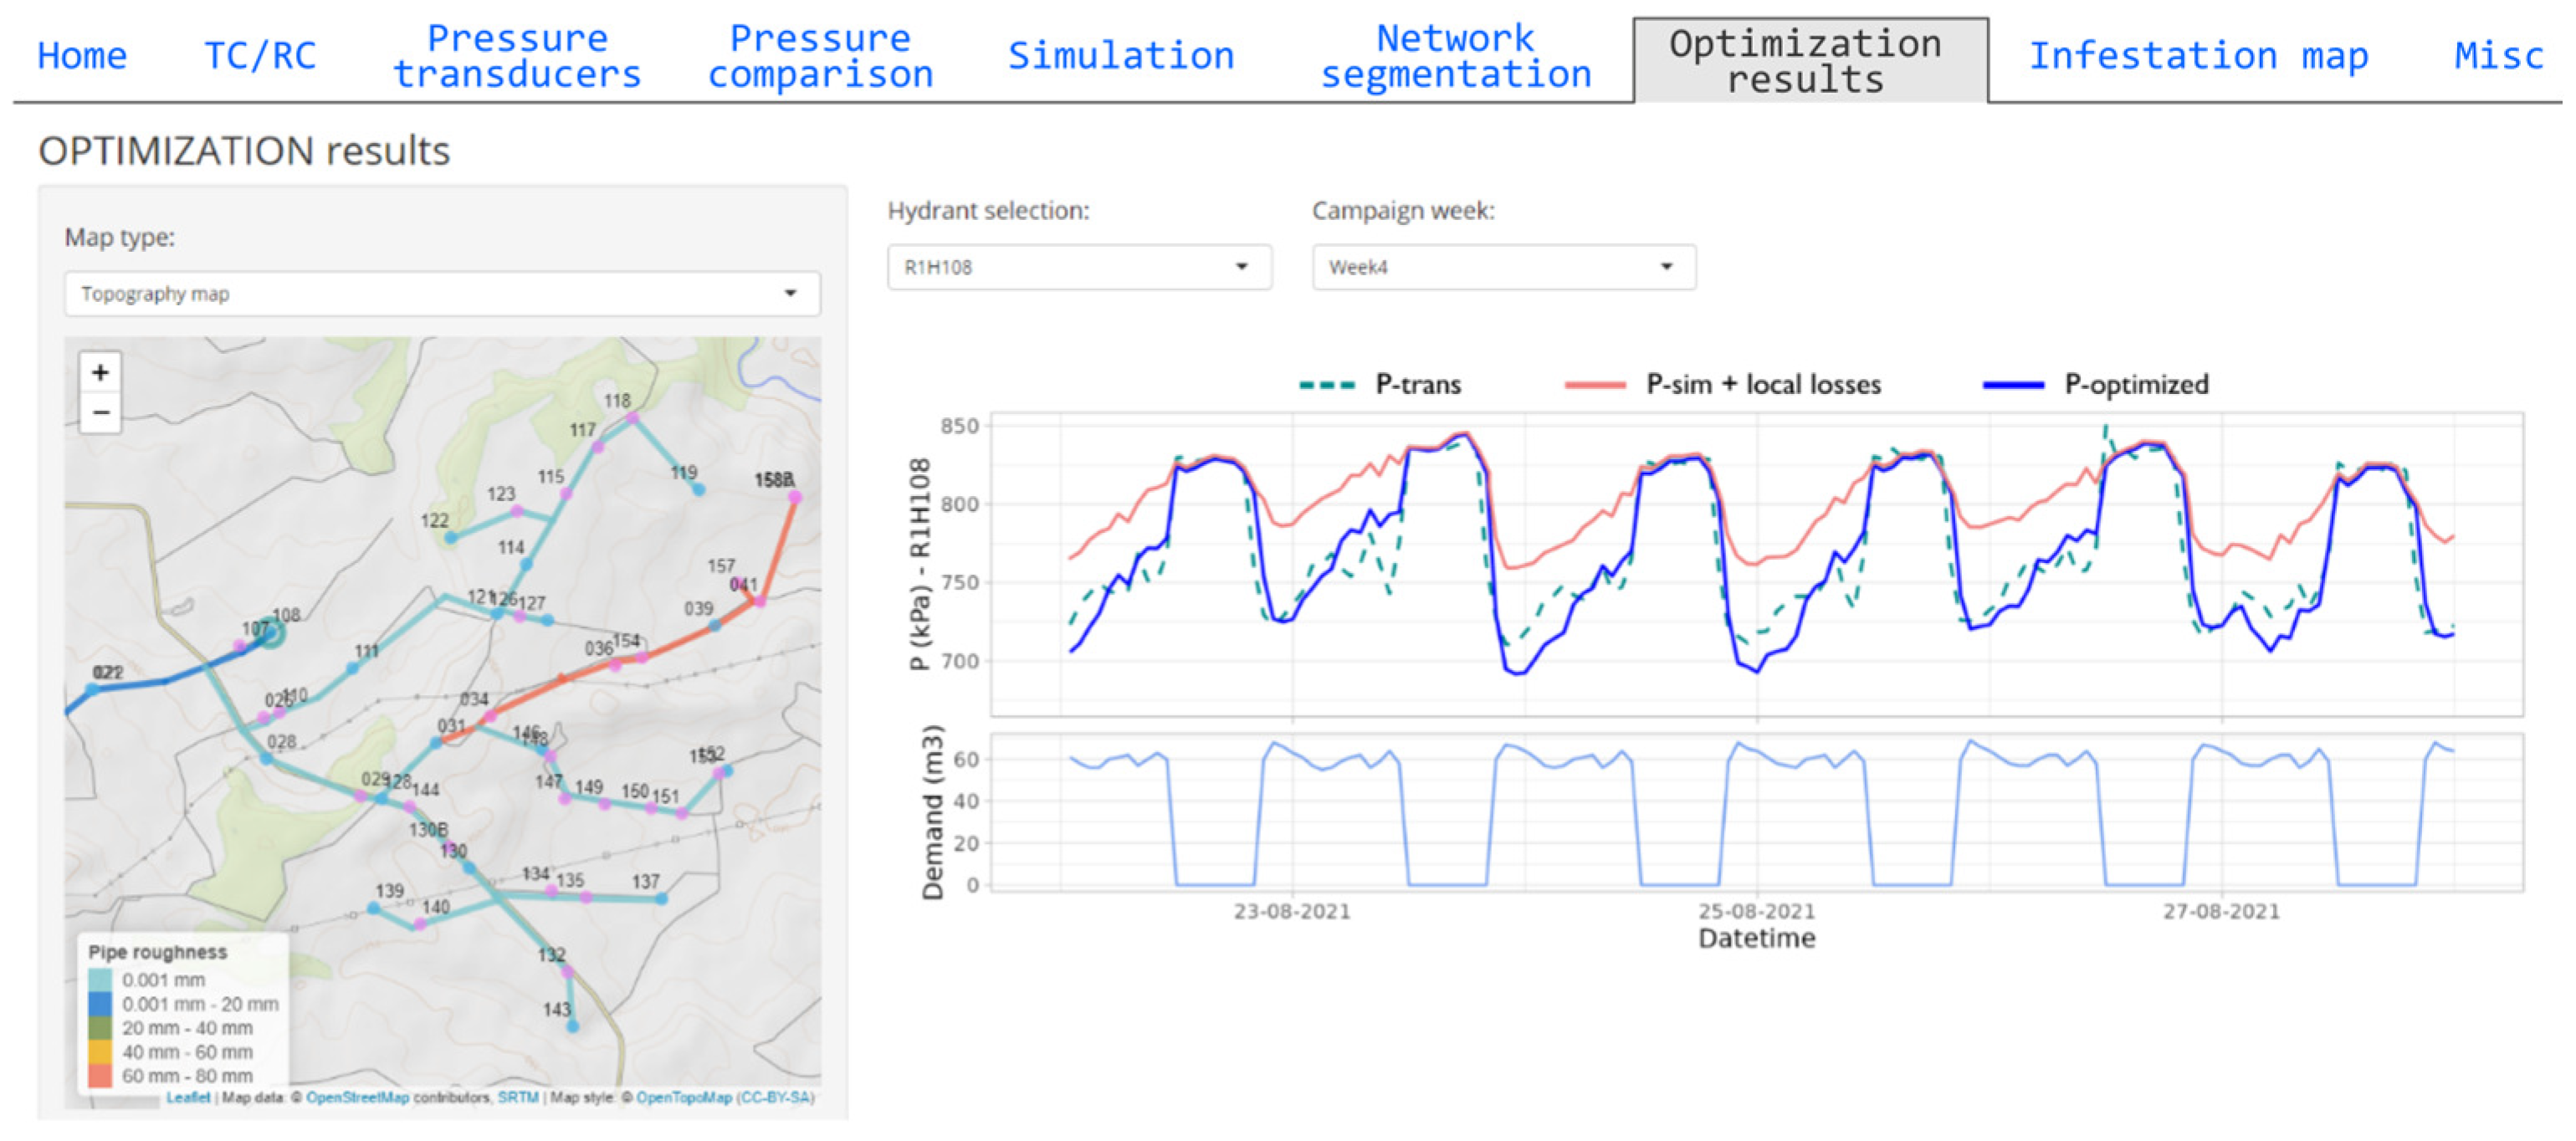
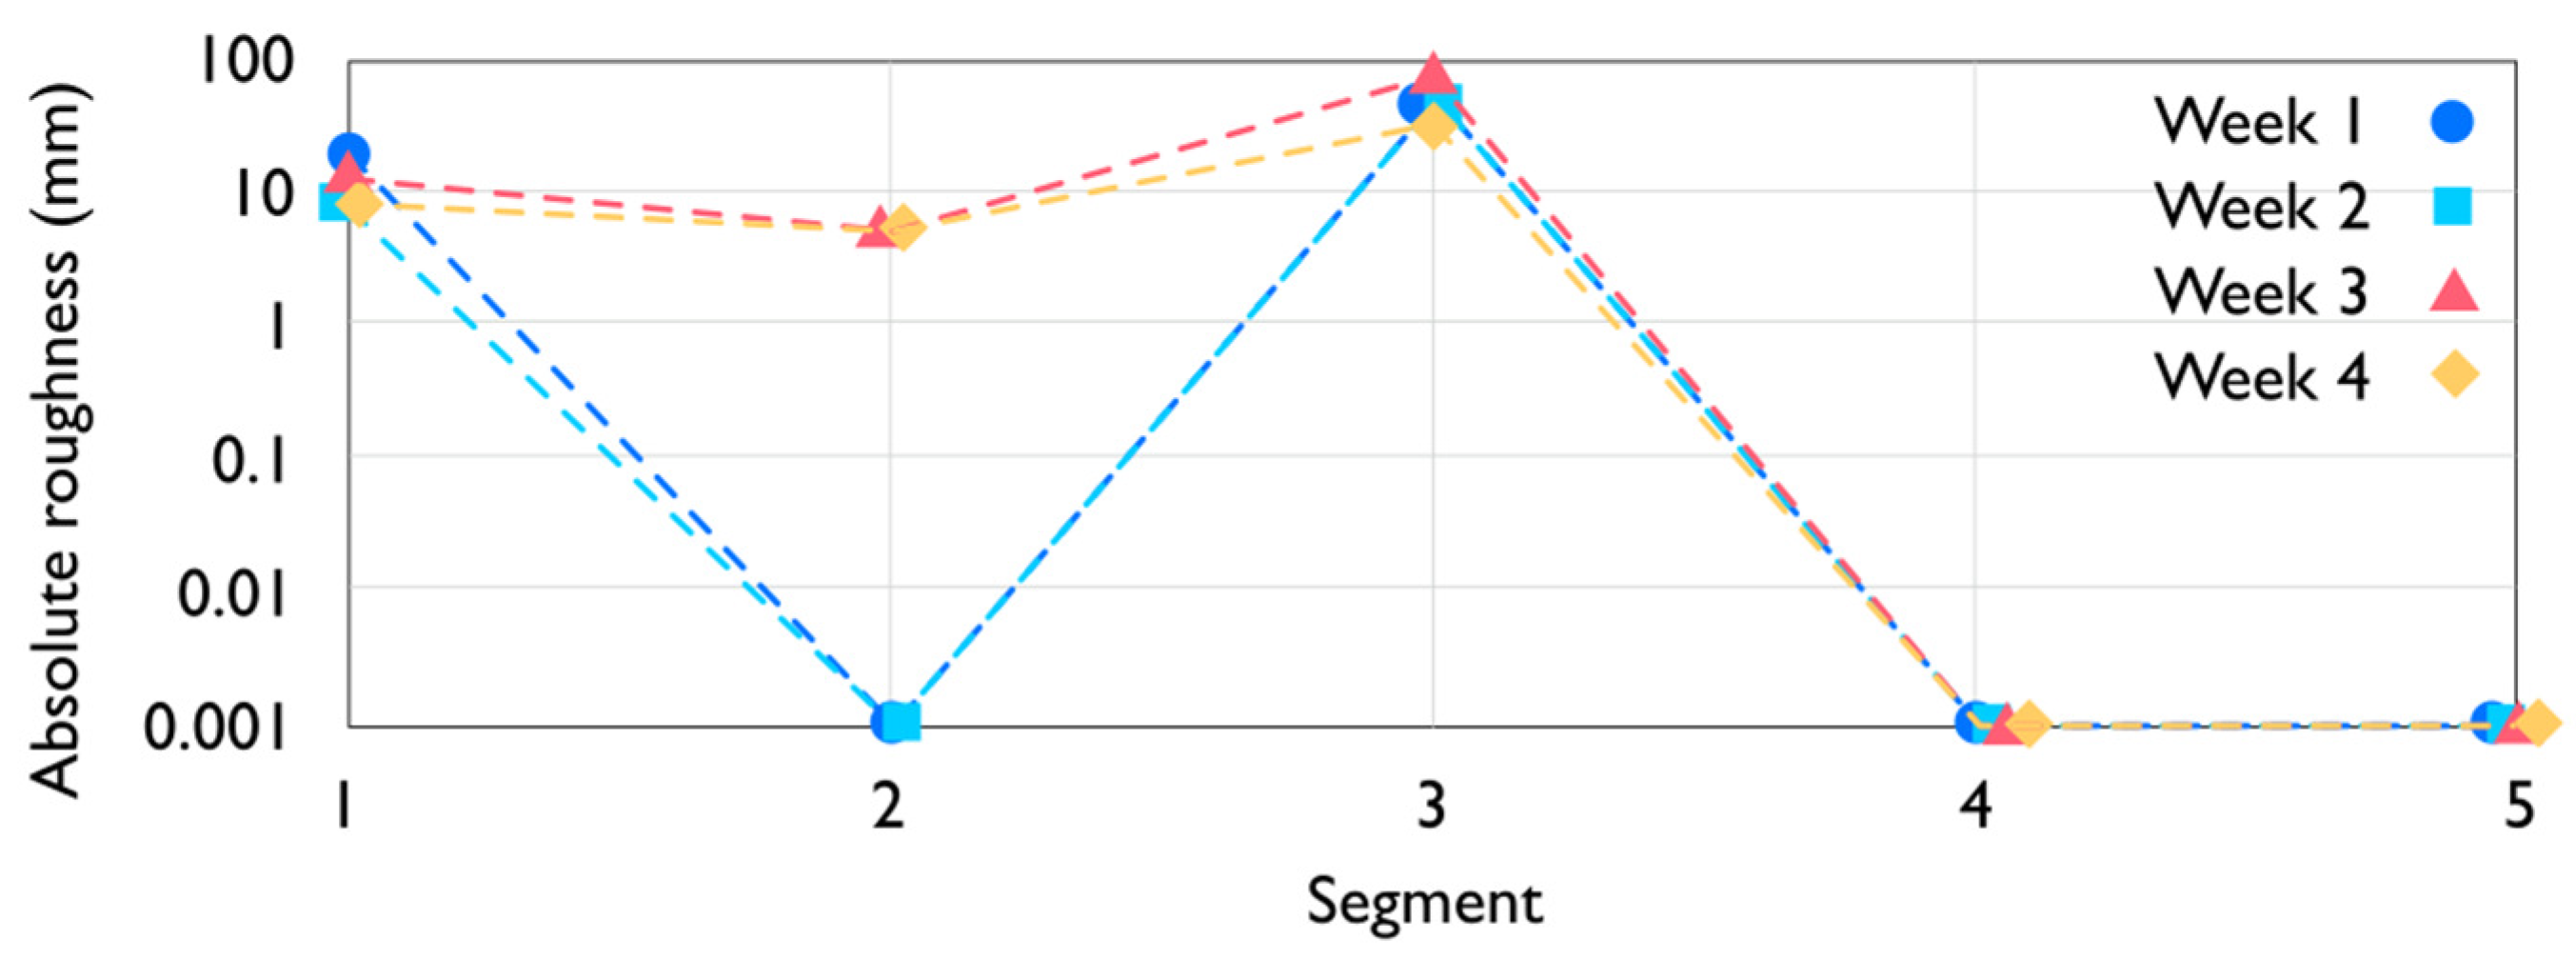
  • Obtaining values of the absolute roughness coefficient by minimizing differences between simulated and measured pressure in different segments of the network;
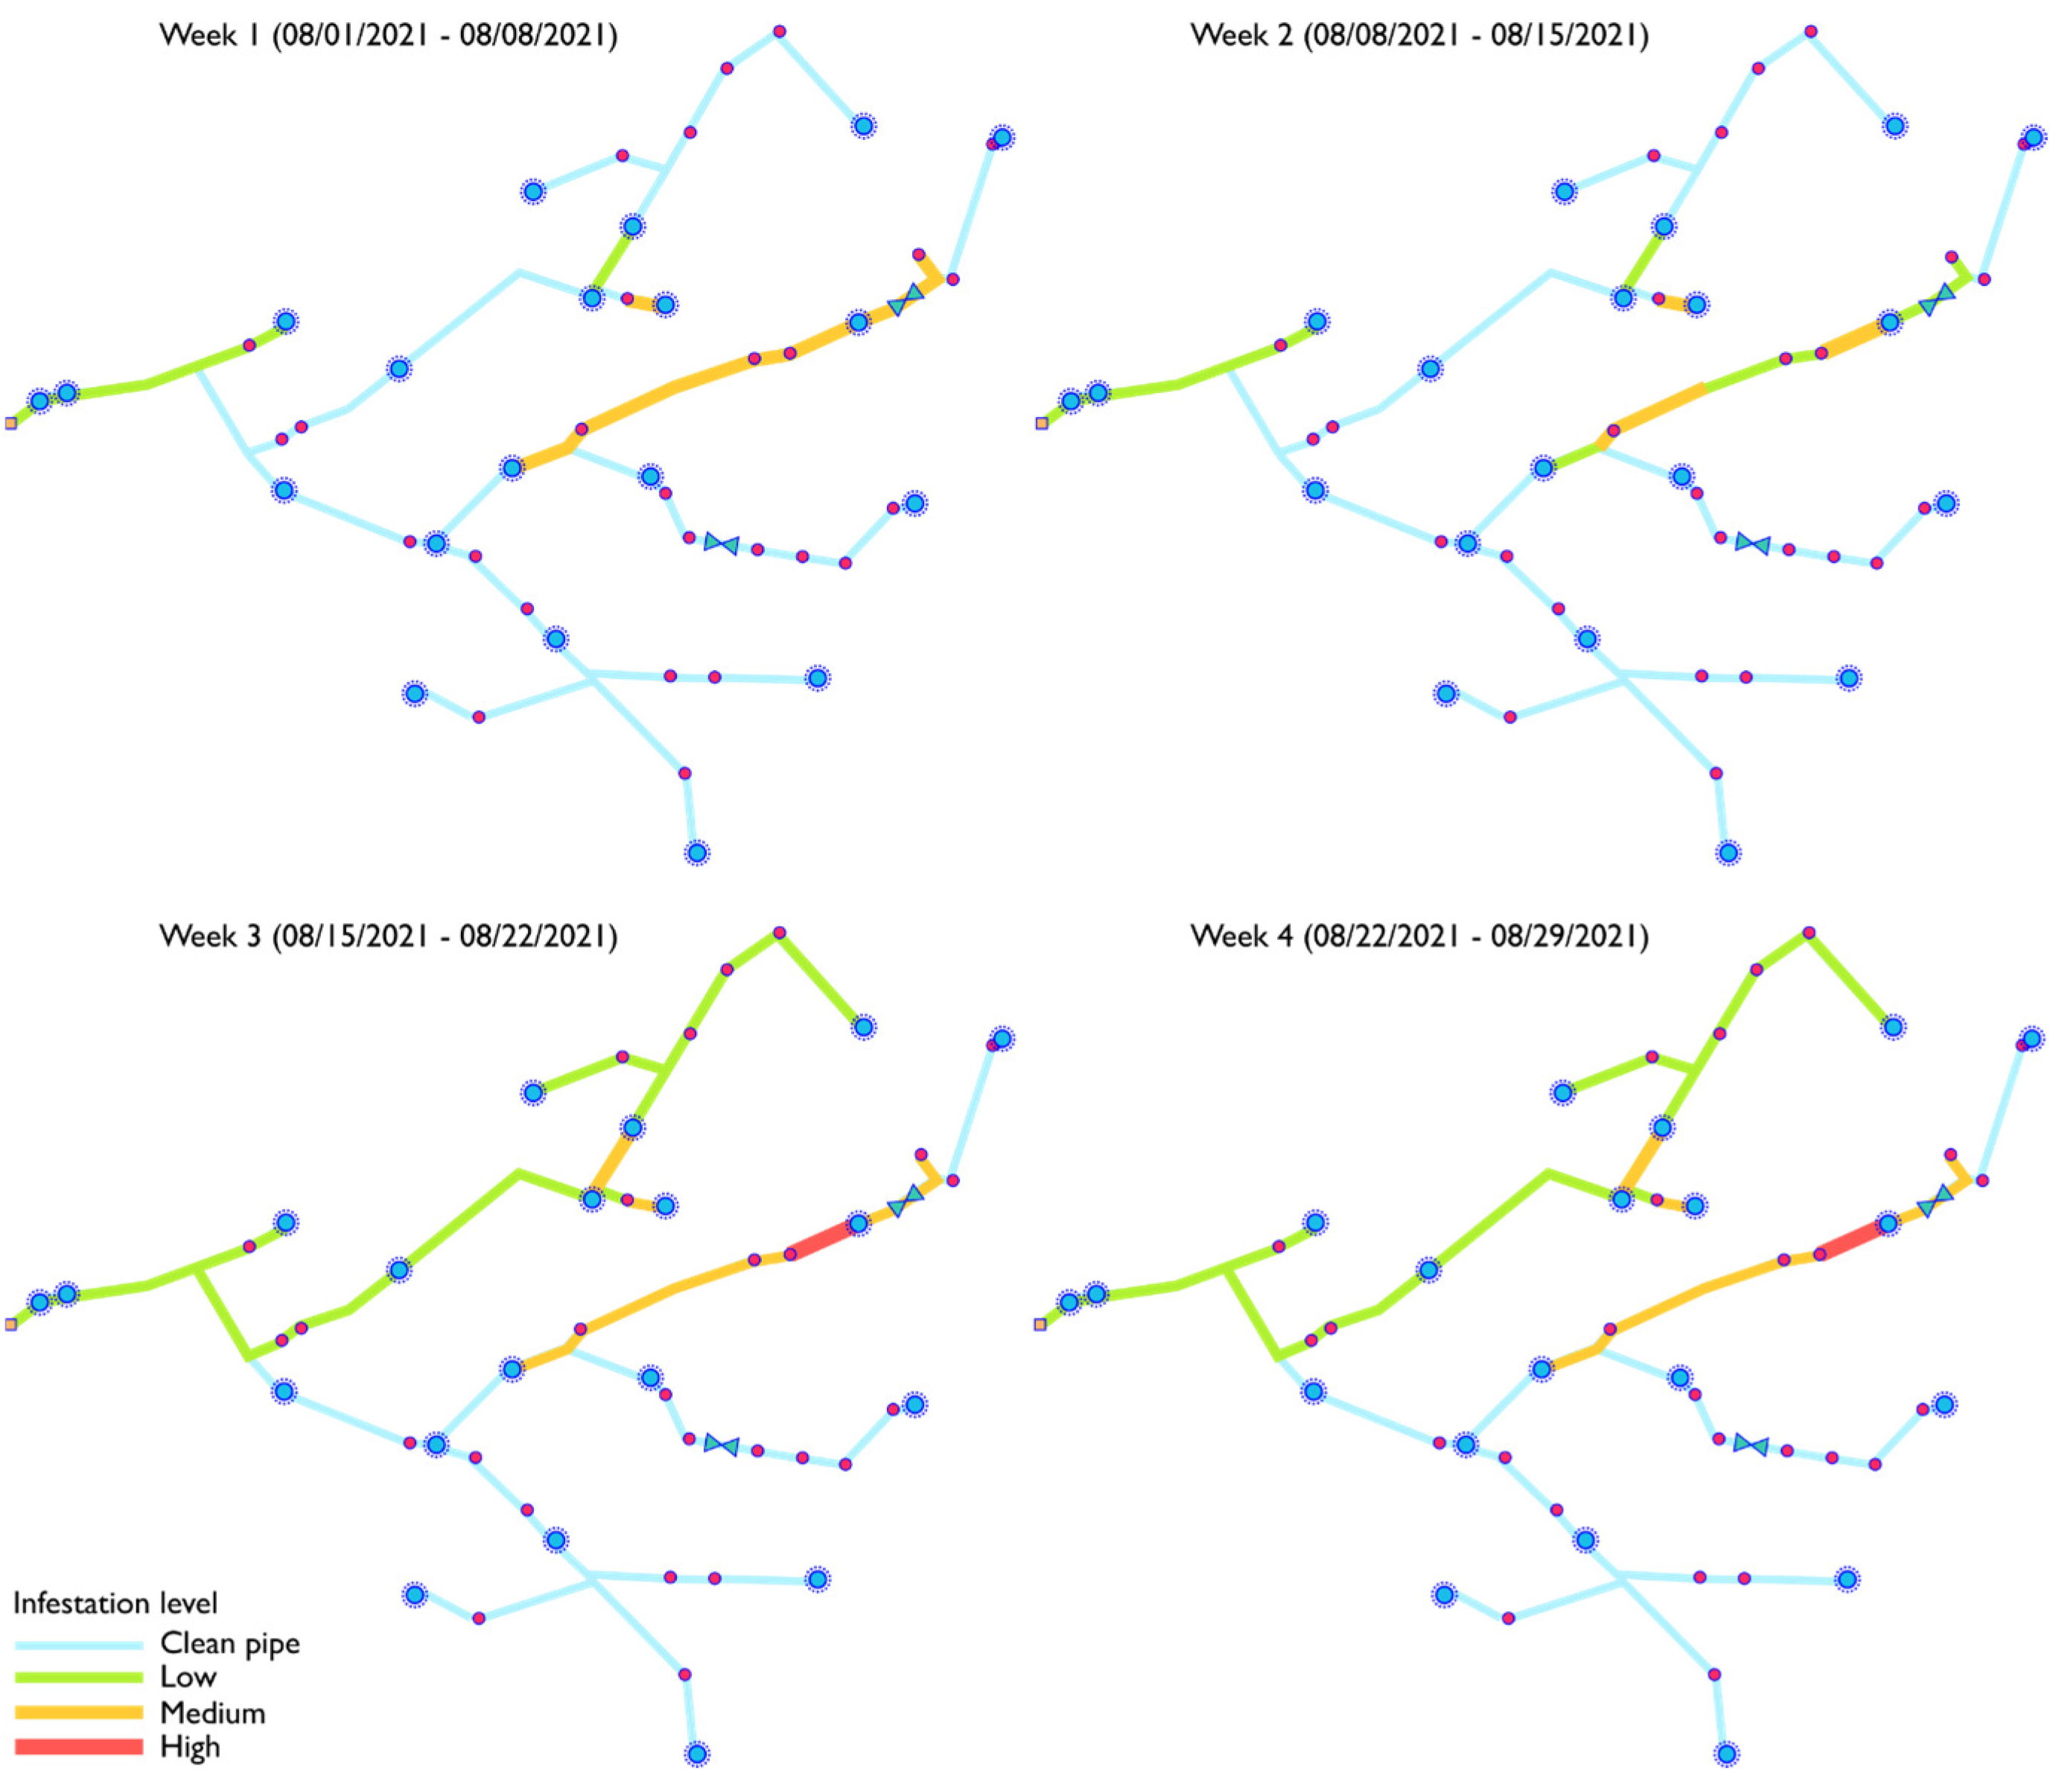
  • Generating distributed infestation maps based on results obtained from ad hoc theoretical and experimental studies.

2. Materials and Methods

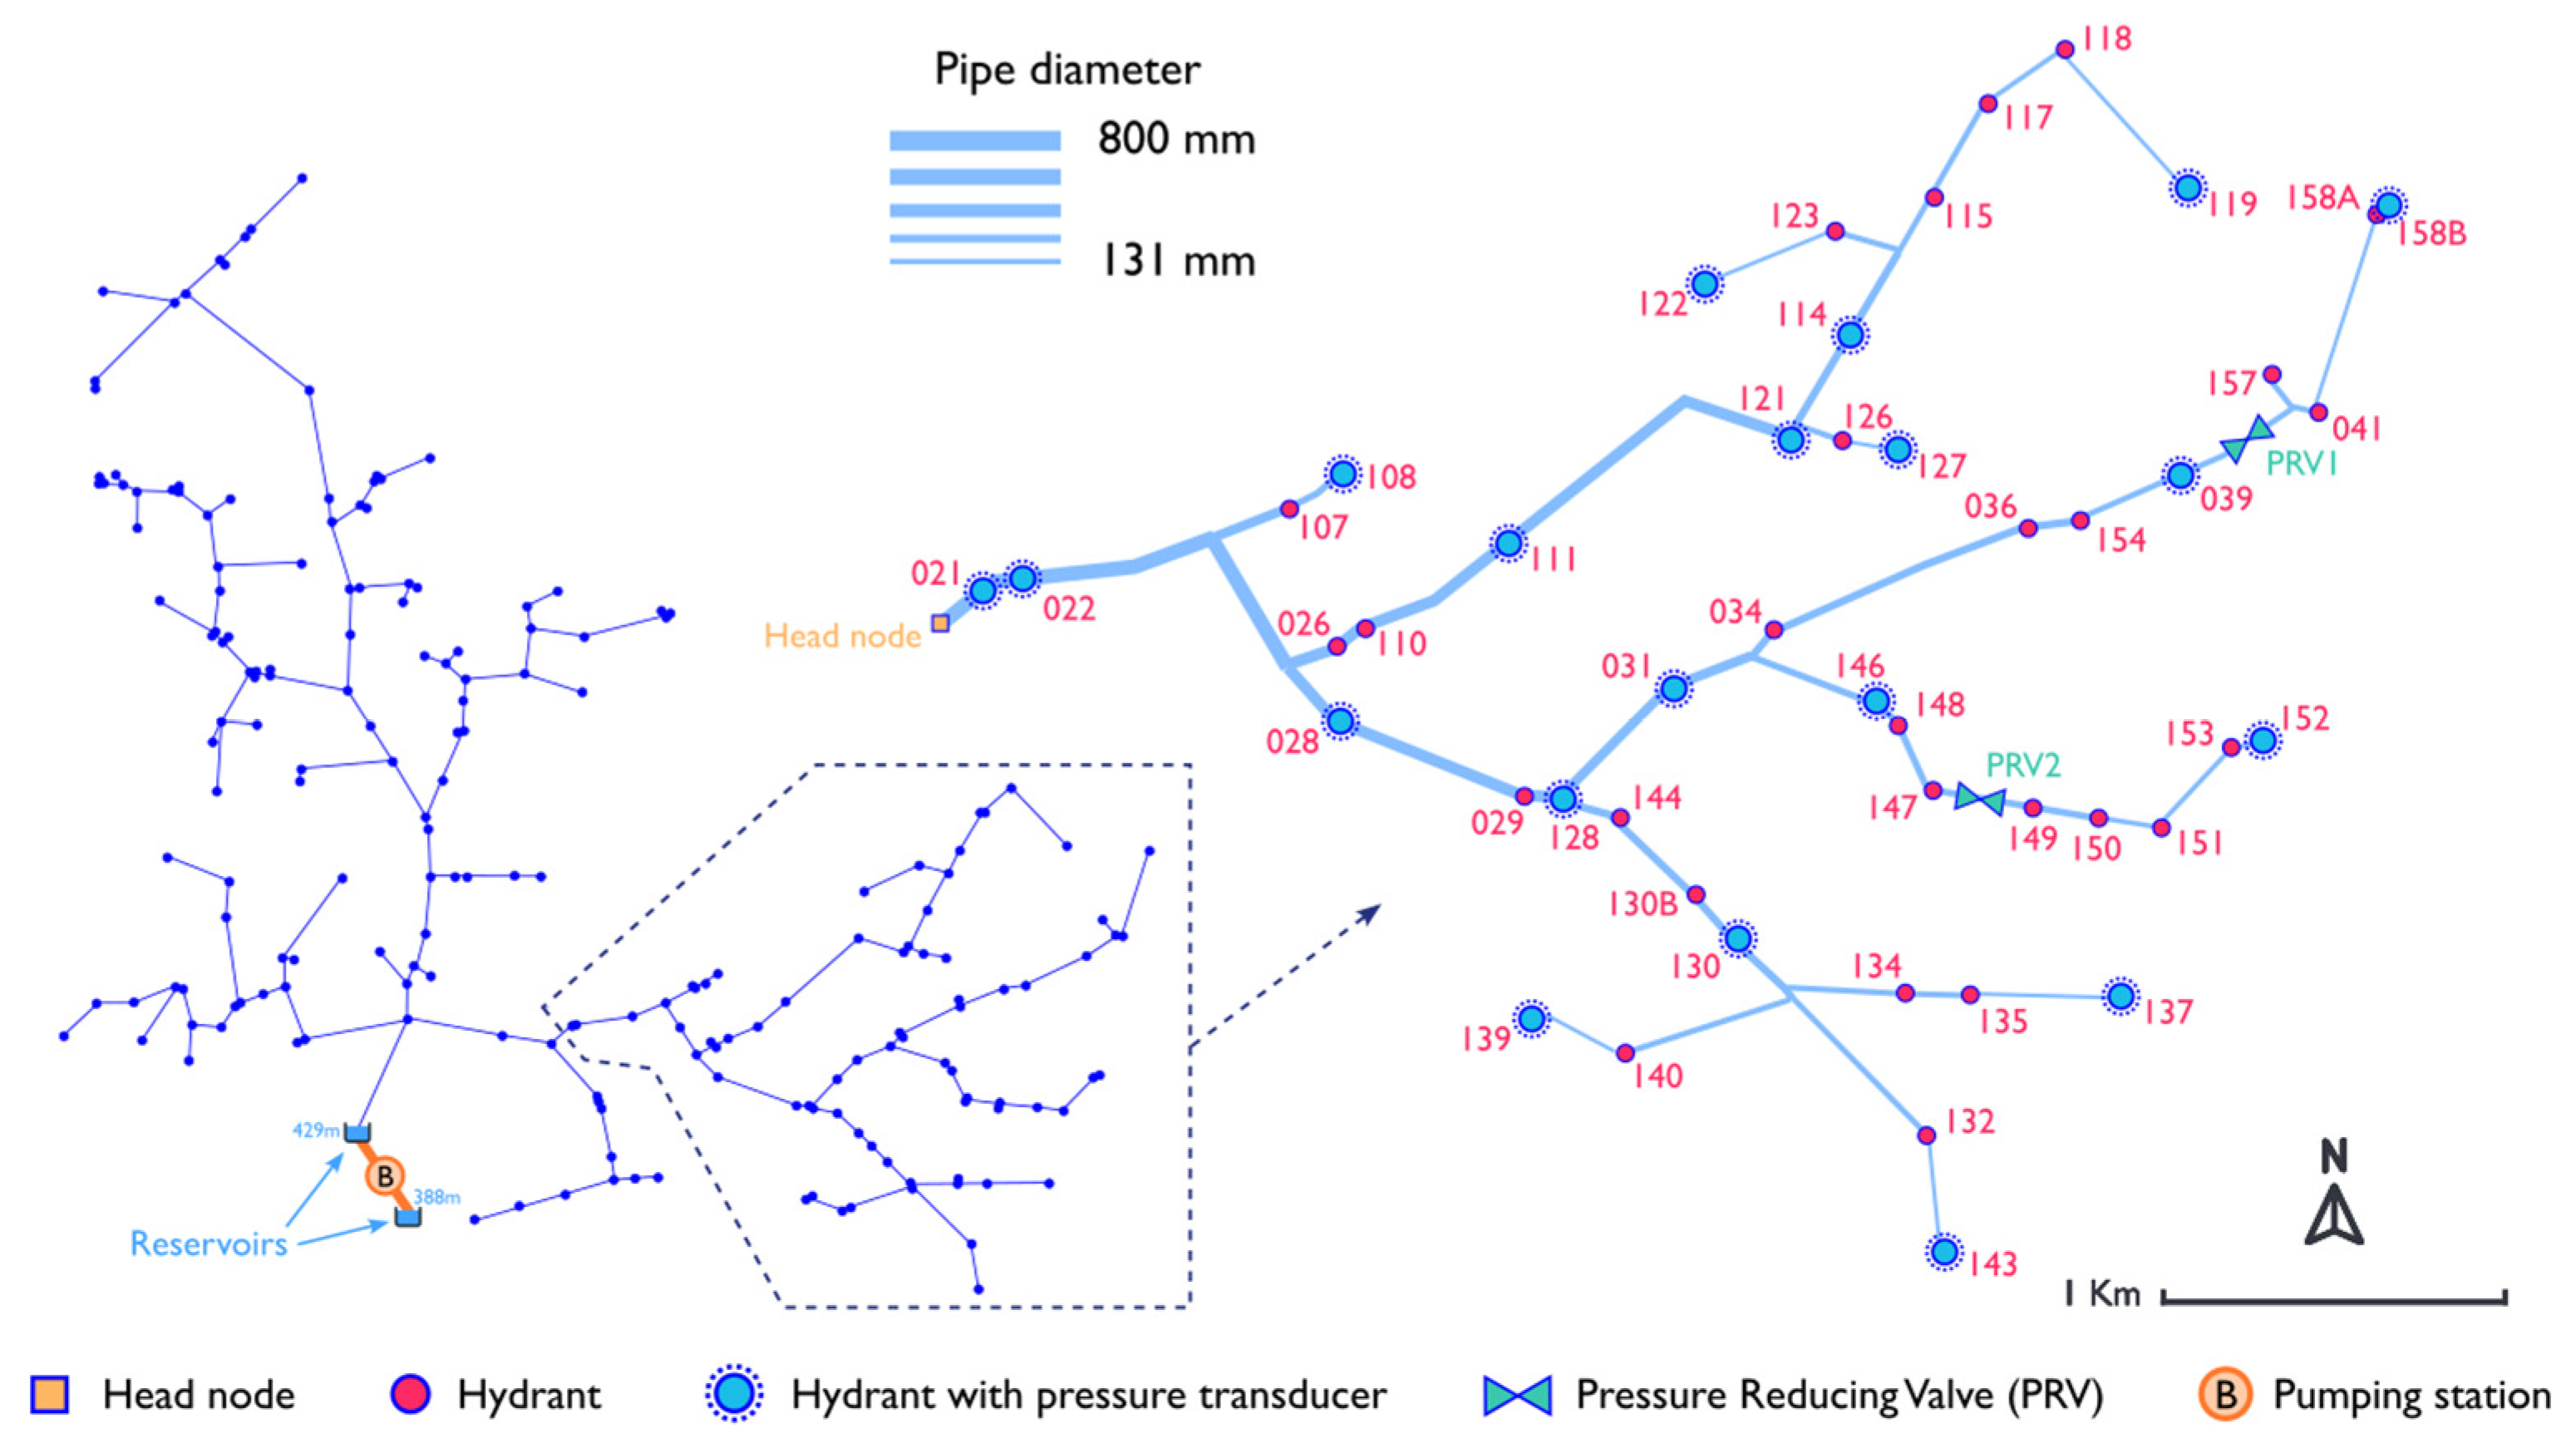
2.1. Network Description and Characterization of the Study Area

The Collarada Segunda Water Users Association (CS-WUA), located in Montesusín (Huesca, Spain), was selected for this study. The CS-WUA covers an irrigated area of 3126 ha, of which 426 ha are equipped with surface irrigation systems and 2700 ha are equipped with pressurized systems. The pressurized area is irrigated by two independent networks. In this study, Network 1 was selected, irrigating approximately 1700 ha. Figure 1 (left) shows a schematic view of the selected network and a detailed view of its eastern part, which is the study area of this work (Figure 1, right). CS-WUA managers identified the study area as the most problematic part of their collective pressurized networks. Field crops are irrigated in the study area (such as corn, barley, wheat, and alfalfa). A pumping station provides the energy required to send water from a reservoir located by the water supply canal to an elevated reservoir at an additional elevation of 41 m. The elevated reservoir is the starting point of the pressurized network supplying water to all hydrants of Network 1 by gravity. The complete Network 1 is made up of 123 hydrants and 208 pipes, with diameters ranging from 131 mm to 1400 mm and a total pipe length of 46.6 km. Regarding the eastern part of the network, the study area, it is composed of 47 hydrants and 76 pipes, with diameters ranging from 131 mm to 800 mm and a total network length of 15.1 km.
Pressure at the network nodes is influenced by various factors, including the water level at the reservoir, the relative elevation of the reservoir outlet and the node, and the discharges circulating in the network. However, as the water level at the reservoir is not directly recorded, the analysis focused on the area downstream from an automatic pressure transducer, indicated as the head node in Figure 1. Pressure at this node serves as the upstream boundary condition for the analysis. Specifically, the head node corresponds to hydrant 021, which is the closest node to the reservoir.
All hydrants within the network are connected to a TM/RC system monitoring recording several hydraulic and operational parameters (Orionis, https://orionis-iot.com). Hydrant irrigation volume, discharge, and operational incidents are recorded at an hourly basis in an SQL database. Data corresponding to the 2021 irrigation season were used in this study. As part of the TM/RC system, several pressure transducers were initially installed throughout the network. However, due to inadequate maintenance and calibration, the pressure data obtained from these transducers were deemed unsuited for the purposes of this research. To address this issue, an additional set of 20 pressure-measuring and recording devices (Dickson PR325, https://dicksondata.com) were strategically installed at hydrants within the study area (indicated by blue dots in Figure 1). The authors of [20], in their study on calibrating roughness in pressurized networks using hydraulic simulation models, emphasized the importance of optimizing the location of pressure transducers, rather than simply increasing their number or the measurement frequency. In this research, sensors were located near junctions and at locations where zebra mussels were causing more problems to CS-WUA users. The devices recorded pressure every minute, holding up to 44 days of records. Prior to installation in the network, the pressure gauges were inspected and calibrated to ensure data quality and accuracy. Statistical data pre-processing techniques were required to mitigate abrupt signal transients resulting from operations within the irrigation network, such as the opening or closing of valves near the transducers. The minute-frequency pressure signal has been smoothed by calculating the hourly median. This approach allows, on one hand, to minimize abrupt transients and, on the other hand, to synchronize the pressure data with the irrigation volume data obtained from the TM/RC monitoring system, which operates on an hourly frequency. Regarding the irrigation volume data, a valid range of 40–360 m3/h has been established, following the design criteria of the network. Values outside this range were considered to be reading errors and were not considered as input data for the simulations.
A comprehensive hydraulic description of the irrigation network is essential for conducting realistic numerical hydraulic simulations and optimizing operational parameters. Insufficient or inadequate hydraulic information can lead to the propagation of errors throughout the entire process [21]. Information regarding pipeline diameter, length, and absolute roughness values corresponding to a clean network (0.001 mm) was obtained from the network construction project. Modifications to the project could have been made during construction, altering certain elements’ geometry. To control for such errors, hydrant elevations were verified using a Digital Terrain Model (DTM) with a spatial resolution of 2 × 2 m [22]. Discrepancies in hydrant elevation between the original network project and the DTM were significant at certain locations, prompting field verification using a high-precision, differential GPS receiver attaining centimetric resolution (GS15 receiver, Leyca Geosystems AG, Heerbrugg, Switzerland). The validation of hydrant elevation was conducted using temporal windows with zero water consumption, identified using the TM/RC database. Under no-flow conditions, differences between pressure transducer measurements could only correspond to the difference in elevation between both points.
The network incorporates two hydraulically operated pressure-reduction valves (PRV) installed at high-pressure network points (see Figure 1). These valves, controlled by a diaphragm, reduce upstream pressure to a constant downstream pressure regardless of the discharge through the valve. For the 2021 season, the CS-WUA manager adjusted the maximum downstream pressure to 800 kPa.
All hydrants within the network consist of the same components: a connecting pipe to the underground hydraulic line, elbows, a manual butterfly isolation valve, a mesh filter, and a hydraulic valve equipped with pressure and discharge regulators. The filter features a 2 mm mesh, providing adequate filtration for the smallest sprinkler nozzles (2.4 mm) and preventing the passage of coarse elements such as stones or zebra mussel shells. Equation (1) [23] was employed to calculate the total local head losses at each hydrant, including pressure losses in pipelines resulting from elbows, joints, valves, and filters:
h L = K U 2 2 g = K 8 Q 2 g π 2 D 2
where U represents the cross-sectional averaged flow velocity, Q the water demand at a certain hydrant, D the pipe diameter, g the acceleration due to gravity, and K a non-dimensional loss coefficient of all the elements.

2.2. Application of the Normalized Pressure Method to the Study Area

The NPM [3,4] consists of comparing observed and simulated pressure. Hydraulic simulations were performed with EPANET for the study area using a value of pipeline roughness corresponding to infestation-free conditions. Measurements were obtained from the pressure transducers installed at selected hydrants (Figure 1). The difference between both pressure signals is called Normalized Pressure. Low values of Normalized Pressure suggest adequate simulation of head losses and minimal or no infestation. Conversely, high values of Normalized Pressure indicate that EPANET underestimates head losses due to the presence of zebra mussels or other flow obstacles.
The total pressure loss within each network pipe can be determined using the Darcy–Weisbach equation (Equation (2)) [24] and the implicit Colebrook equation (Equation (3)) [25,26].
h f = f L U 2 2 g D
1 f = 2 l o g 10 ε 3.7 D h + 2.54 R e f
being f the Darcy friction factor, L the pipe length, Re the Reynolds number, Dh the pipe hydraulic diameter, and ε the absolute roughness coefficient.
An optimization procedure was employed to seek the value of absolute roughness at each pipeline, aiming to set Normalized Pressure to zero at every measuring point. The optimum values of pipeline absolute roughness are associated with a specific infestation level (Section 2.3). Assessing mussel colonization through parameter optimization presents a relevant challenge due to its highly underdetermined nature: the number of unknowns exceeds the available observations [27].
In the present case study, involving 76 pipelines, solving the head loss equation for every pipeline would require 76 pressure transducers, far exceeding the 20 available transducers. Moreover, optimization with a high number of parameters typically incurs excessive computational costs due to the vast number of possible parameter combinations [28]. To address these challenges and streamline the roughness calibration process, the network was divided into five segments (Figure 2). Segmentation was based on the branches serving different hydrants within the network. Each segment was assigned a unique roughness value for its pipelines, reflecting the level of infestation present therein.
The key steps of the simulation and optimization process are outlined in the flowchart depicted in Figure 3. Initially, the hourly discharge and irrigation volume data for each hydrant (obtained from the TM/RC system for the 2021 irrigation season) underwent a screening process to filter out potential non-physical values resulting from sensor errors and hydraulic operations [29]. Regarding the pressure transducers, the hourly median was used to smoothen the 1 min records, accommodating the time step used in the TM/RC variables.
Subsequently, the geometric configuration of the irrigation network and an initial estimate for the absolute roughness of the five segments were processed and prepared as input files to conduct EPANET simulations. A one-week period was selected for the simulation and optimization process.
The simulation loop consists of conducting hourly network steady-state simulations. Upon completion of the temporal loop for one week, the optimization loop processes the numerical results. Simulated and transducer measured pressure values (P-sim and P-trans, respectively) are compared, and the root mean square error (RMSE) is calculated. This process is iterated using a brute force algorithm, wherein all combinations between a minimum (0.001 mm) and a maximum (110 mm) roughness for each parameter, with a specified user-defined resolution, are analyzed.
While the brute-force method guarantees convergence, we also considered several alternative optimization methods commonly used in similar applications, including gradient-based methods [30] or simulated annealing [31]. The simulated annealing method is popular for its ability to explore large solution spaces efficiently and potentially escape local minima, which may make this method appealing for complex optimization problems. However, simulated annealing requires careful parameter tuning, which can introduce variability in performance and increase the complexity of implementation. Additionally, this method may not always guarantee convergence to the optimal solution, which is a key consideration in our application. Gradient-based methods, on the other hand, offer faster convergence but are more sensitive to the initial conditions and may struggle to find global solutions in the presence of non-linearities or multiple local minima, which are common in hydraulic network optimization.
Metaheuristic methods have gained significant attention in the field of water distribution systems, offering efficient solutions to complex optimization problems. A comprehensive review by [32] examined several research papers from major databases focusing on the application of metaheuristic techniques in this context. The review provides a comparative analysis of different metaheuristic approaches, highlighting the challenges of comparing solutions due to varying parameter definitions and optimization strategies.
Given the critical need for both accuracy and reliability in infestation detection, we opted for a brute force algorithm to circumvent potential convergence issues inherent to iterative methods. The brute force algorithm exhaustively analyzes all combinations of parameters within the specified range to identify the combination yielding the minimum RMSE, which is considered optimal for generating zebra mussel infestation maps of segment infestation.
Finally, the entire process is repeated for each week of the irrigation campaign (as depicted by the weekly time loop in Figure 3). The entire analysis for every week of the irrigation campaign using the NPM method in combination with brute-force optimization involves performing thousands or even millions of EPANET simulations, a very expensive task in computational terms. We acknowledge the computational limitations associated with brute-force optimization, particularly when applied to larger networks or networks with finer segmentation. Hence, parallelizing the process using a multi-core processor or a computing cluster proves highly advantageous in terms of computational efficiency and allows the method to remain feasible within practical time constraints. Even for moderately large networks, this parallel implementation enables efficient running of the algorithm.

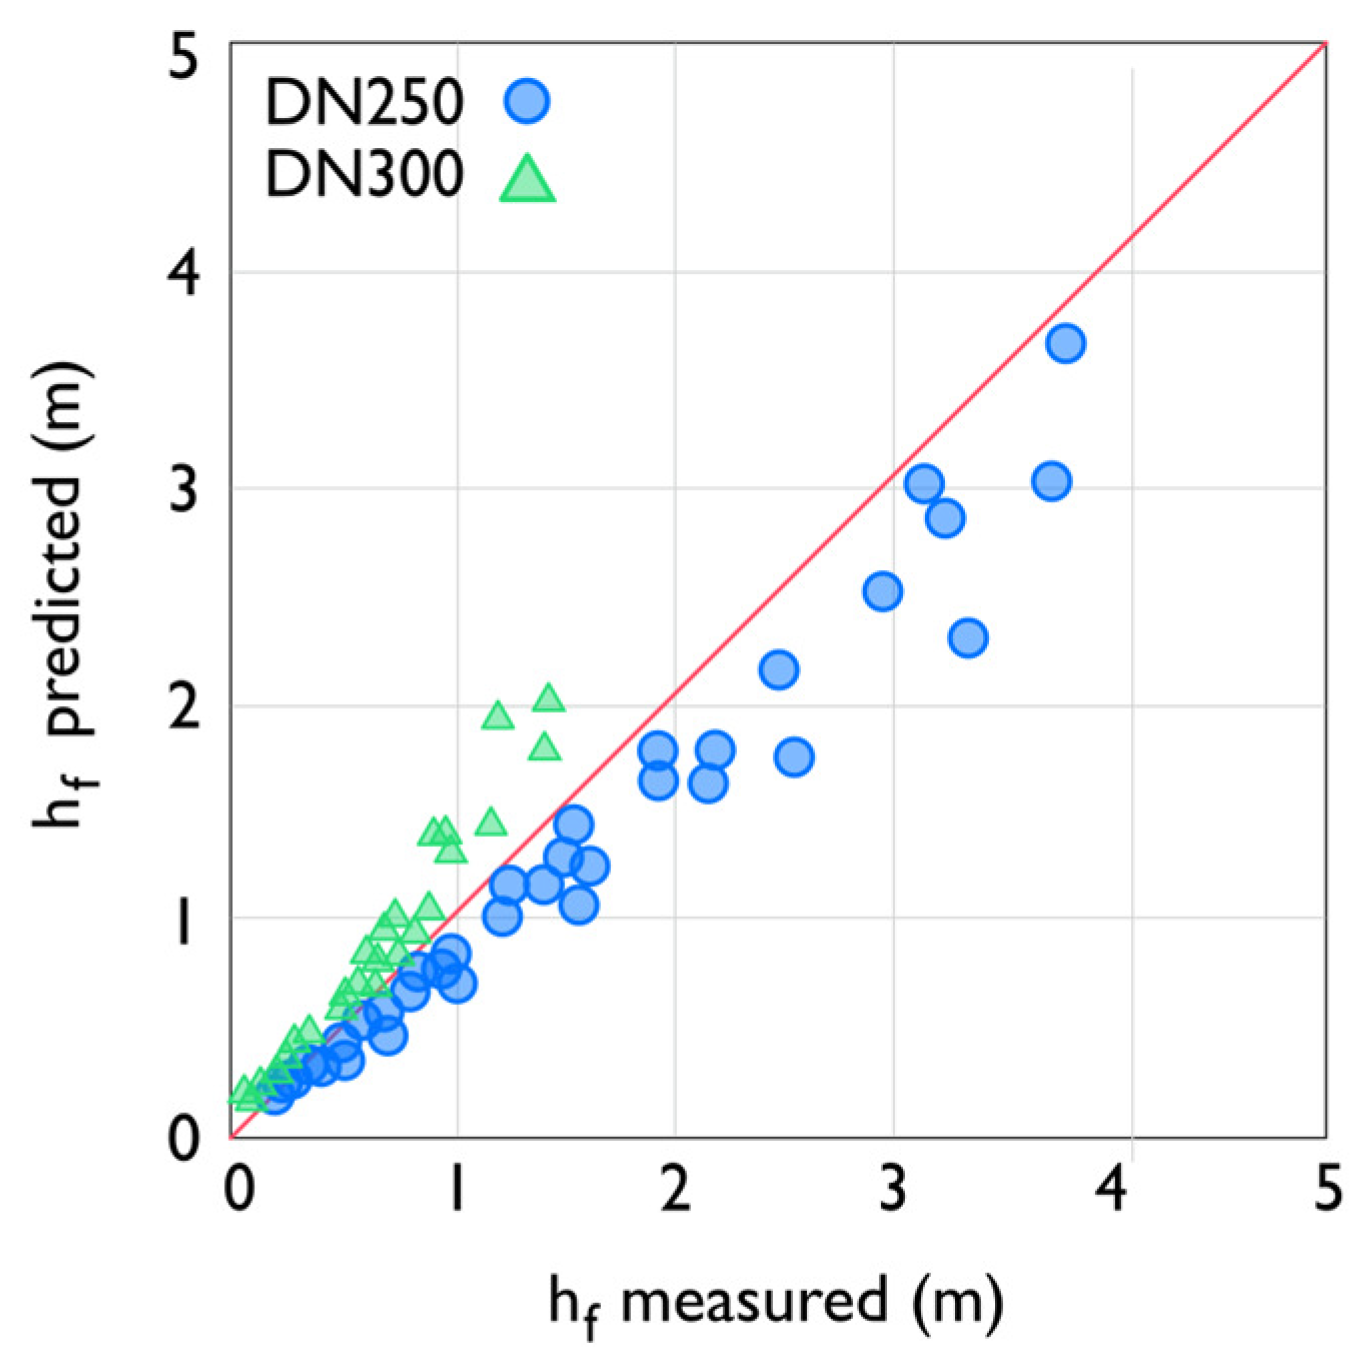
2.3. Experiments and Theoretical Analyses to Develop a Roughness–Infestation Relationship

An experimental study was conducted to analyze the relationship between pipe roughness and infestation level. Measurements were carried out using two different pipe diameters (DN250 and DN300) with a nominal pressure of 1013 kPa and a length of 1.1 m at a certified laboratory (Spanish Central Laboratory for Irrigation Equipment and Materials Testing, CENTER, using UNE-EN ISO/IEC 17.025). To mimic zebra mussels attached to the pipeline wall, a uniform distribution of holes was created across and along the entire cross-sectional area of the experimental pipelines (see Figure 4). Screws were inserted into these holes, serving as proxies for zebra mussels, with their tips appearing inside the pipelines at varying depths to replicate different stages of mussel growth.
The PVC pipes underwent tests with varying densities and depths of screws, resulting in a total of twelve experimental configurations: two pipe diameters (DN250 and DN300) × two screw lengths (30 mm and 40 mm) × three screw densities (25%, 50%, and 75% screw occupation). For each experimental configuration, five steady discharge values were evaluated, ranging from 90 m3/h to 1800 m3/h, taking direct measurements of the head loss in the pipe segment. The absolute roughness of each configuration was determined using the Darcy–Weisbach Equation (2) and the implicit Colebrook Equation (3).
Experiments were only performed for DN 250 and 300 mm due to limitations in the experimental facilities. However, the pipelines of the study area (Figure 1) have a wider range of diameters (from 131 mm to 800 mm). A theoretical analysis was applied to the experimental data in order to derive relationships valid for unmeasured pipeline diameters.
The friction force F s produced by a screw transversely installed in a uniform turbulent flow is given by
F s = 1 2 c s ρ U 2 L s D s
where c s is the screw aerodynamic drag coefficient, ρ is the fluid density, and L s and D s are the screw length and diameter, respectively. In a prismatic pipe in which N s identical screws are disposed on the wall, the total force F t exerted by the flow on the screws can be expressed as
F t = 1 2 N s c s ρ u * 2 L s D s
being u * the flow velocity at a distance L s from the wall. By defining the surface density of screws σ s as the number of screws per unit of pipe area ( N s = σ s π D L ), the pressure loss experimented by the fluid is
h f = 4 F t ρ g π D 2 = 2 σ s c s u * 2 L s D s L g D
By replacing Equation (6) in Equation (2), the friction factor corresponding to the screw contribution can be obtained:
f = 4 σ s c s L s D s u * U 2
The non-dimensional velocity u * U exclusively depends on the velocity profile within the pipe. Due to the pipe geometry, it is convenient to perform a transformation to polar coordinates, establishing the origin at its center:
u * = u r = R L s ,   U = 1 A A u ( r )   d A = 2 R 2 0 R u ( r )   r   d r
where R = D / 2 is the pipe radius. By assuming an exponential velocity profile,
u = u * R r L s a ,   U = 2 u * ( 1 + a ) ( 2 + a ) R L s a
being a an adjustment parameter. By replacing (9) in Equation (7),
f = 1 + a 2 ( 2 + a ) 2 σ s c s L s D s 2 L s D 2 a
On the other hand, the Gauckler–Manning roughness equation [33,34] can be expressed as follows:
h f = n 2 L U 2 R h 4 / 3
being n the Gauckler–Manning roughness coefficient and R h = D / 4 the hydraulic radius. This equation becomes equivalent to the Darcy–Weisbach Equation (2) for a roughness coefficient:
f = 2 11 / 3 g n 2 D 4 / 3
By comparing with Equation (10), an equivalence can be found if
a = 1 6 ,   n 2 = 91 36 2 σ s c s D s L s 4 / 3 2 10 / 3 g ,   f = 91 36 2 σ s c s L s D s 2 L s D 1 / 3
For high Reynolds numbers, the literature proposes a value of the resistance coefficient for cylinders exposed to a uniform flow of c u = 0.51 . For a screw exposed to an exponential velocity profile we postulate a resistance coefficient:
c s c u 0 L s u 2 d r 0 L s u * 2 d r 0 L s u * 2 r L s 1 / 3 d r L s u * 2 3 4   c s 0.38
In the case of zebra mussels, the effective section of the shell can be assumed as triangular (compared to a square effective section in the case of screws), so we will approximate the roughness coefficient as
f 91 36 2 σ m c m 1 2 L m D m 2 L m D 1 / 3
being σ m the zebra mussel surface density per unit pipe length, L m and D m the shell height and width, respectively, and c m = 0.1 the shell aerodynamic coefficient.

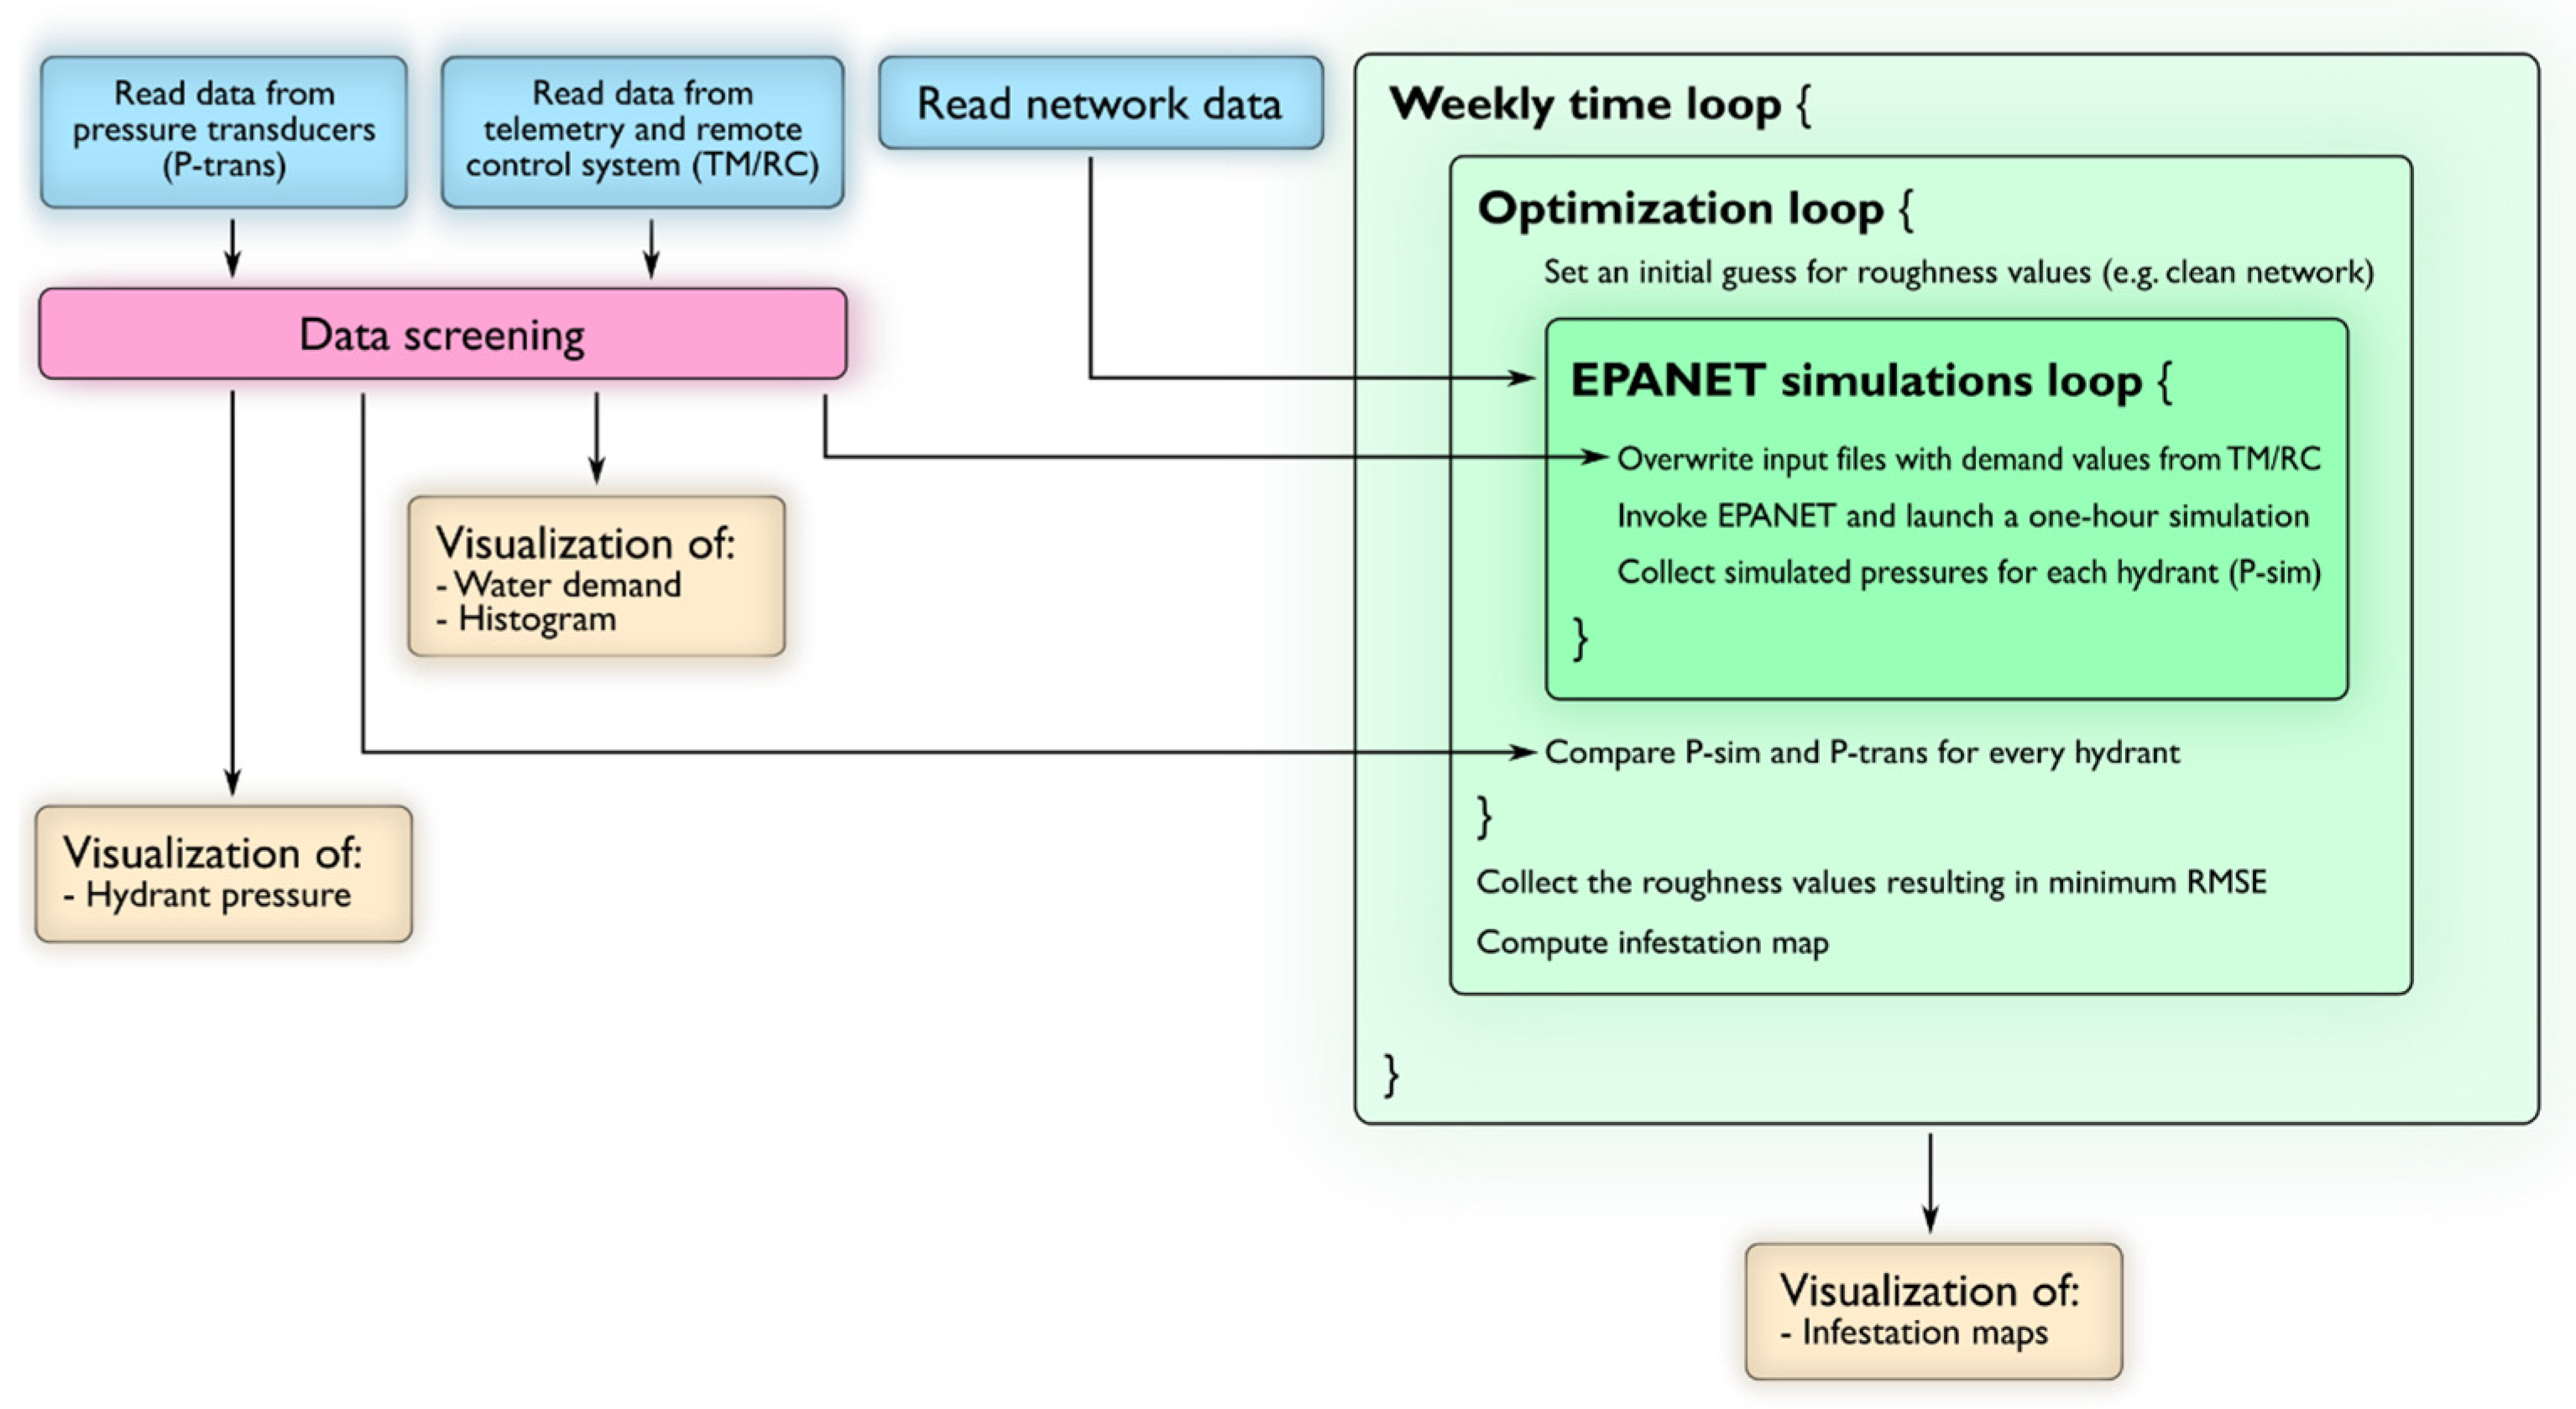
2.4. Development of a Cloud Toolkit

An advanced software solution was produced to implement the methodologies described in the previous Section 2.2 and Section 2.3 and to apply them to the study area (Section 2.1). The name of the cloud toolkit is SIMZEBRA 1.0 (Simulation of Irrigation networks for Mitigation of ZEBRa mussel Advance). The purpose of SIMZEBRA is to facilitate real-time monitoring of infestation by zebra mussels and support decision making in control strategies. However, in this paper, the toolkit was only applied in a retrospective mode. The toolkit is composed by a software package based on the R programming language (version 4.5.0) [35,36] and the EPANET programming libraries, operating remotely on a cloud server. CPU parallelization was used to accelerate EPANET simulations. SIMZEBRA stands at the forefront of transforming raw data into reliable management information.
Cloud computing has become a key approach for efficiently supporting and delivering modern applications across various sectors such as healthcare, agriculture, education, and finance through internet-based platforms [37]. The integration of Internet of Things (IoT)-based real-time pressure monitoring and cloud computing in SIMZEBRA aligns with recent advancements in Artificial Intelligence (AI)-driven water management systems. While traditional detection methods rely on periodic inspections or biological sampling, SIMZEBRA leverages continuous hydraulic monitoring and parallel computing to infer infestation levels with high spatial and temporal resolution. This approach enhances automation, scalability, and decision support, facilitating proactive intervention strategies for irrigation network operators. Future developments may incorporate machine learning algorithms to further refine infestation predictions and optimize mitigation strategies dynamically.

3. Results and Discussion

3.1. A Roughness–Infestation Relationship

Figure 5 illustrates the experimental pressure losses measured at the CENTER laboratory for DN250 (left) and DN300 (right) pipes. It is evident that the fit to the Darcy–Weisbach equation (Equation (2)) is insufficient for low flow velocities. To address this issue, the following modification of Equation (2) is proposed:
h f = h 0 + f L U 2 2 g D
Figure 6 depicts the pressure losses predicted using the modified Darcy–Weisbach equation (Equation (16)), employing the Gauckler–Manning equation (Equation (13)) with the theoretical aerodynamic coefficient value of the wall screws (Equation (14)), plotted against the measured pressure loss values. A reasonable fit was observed, although the model tended to underestimate the values for DN250 and overestimate the values for DN300.

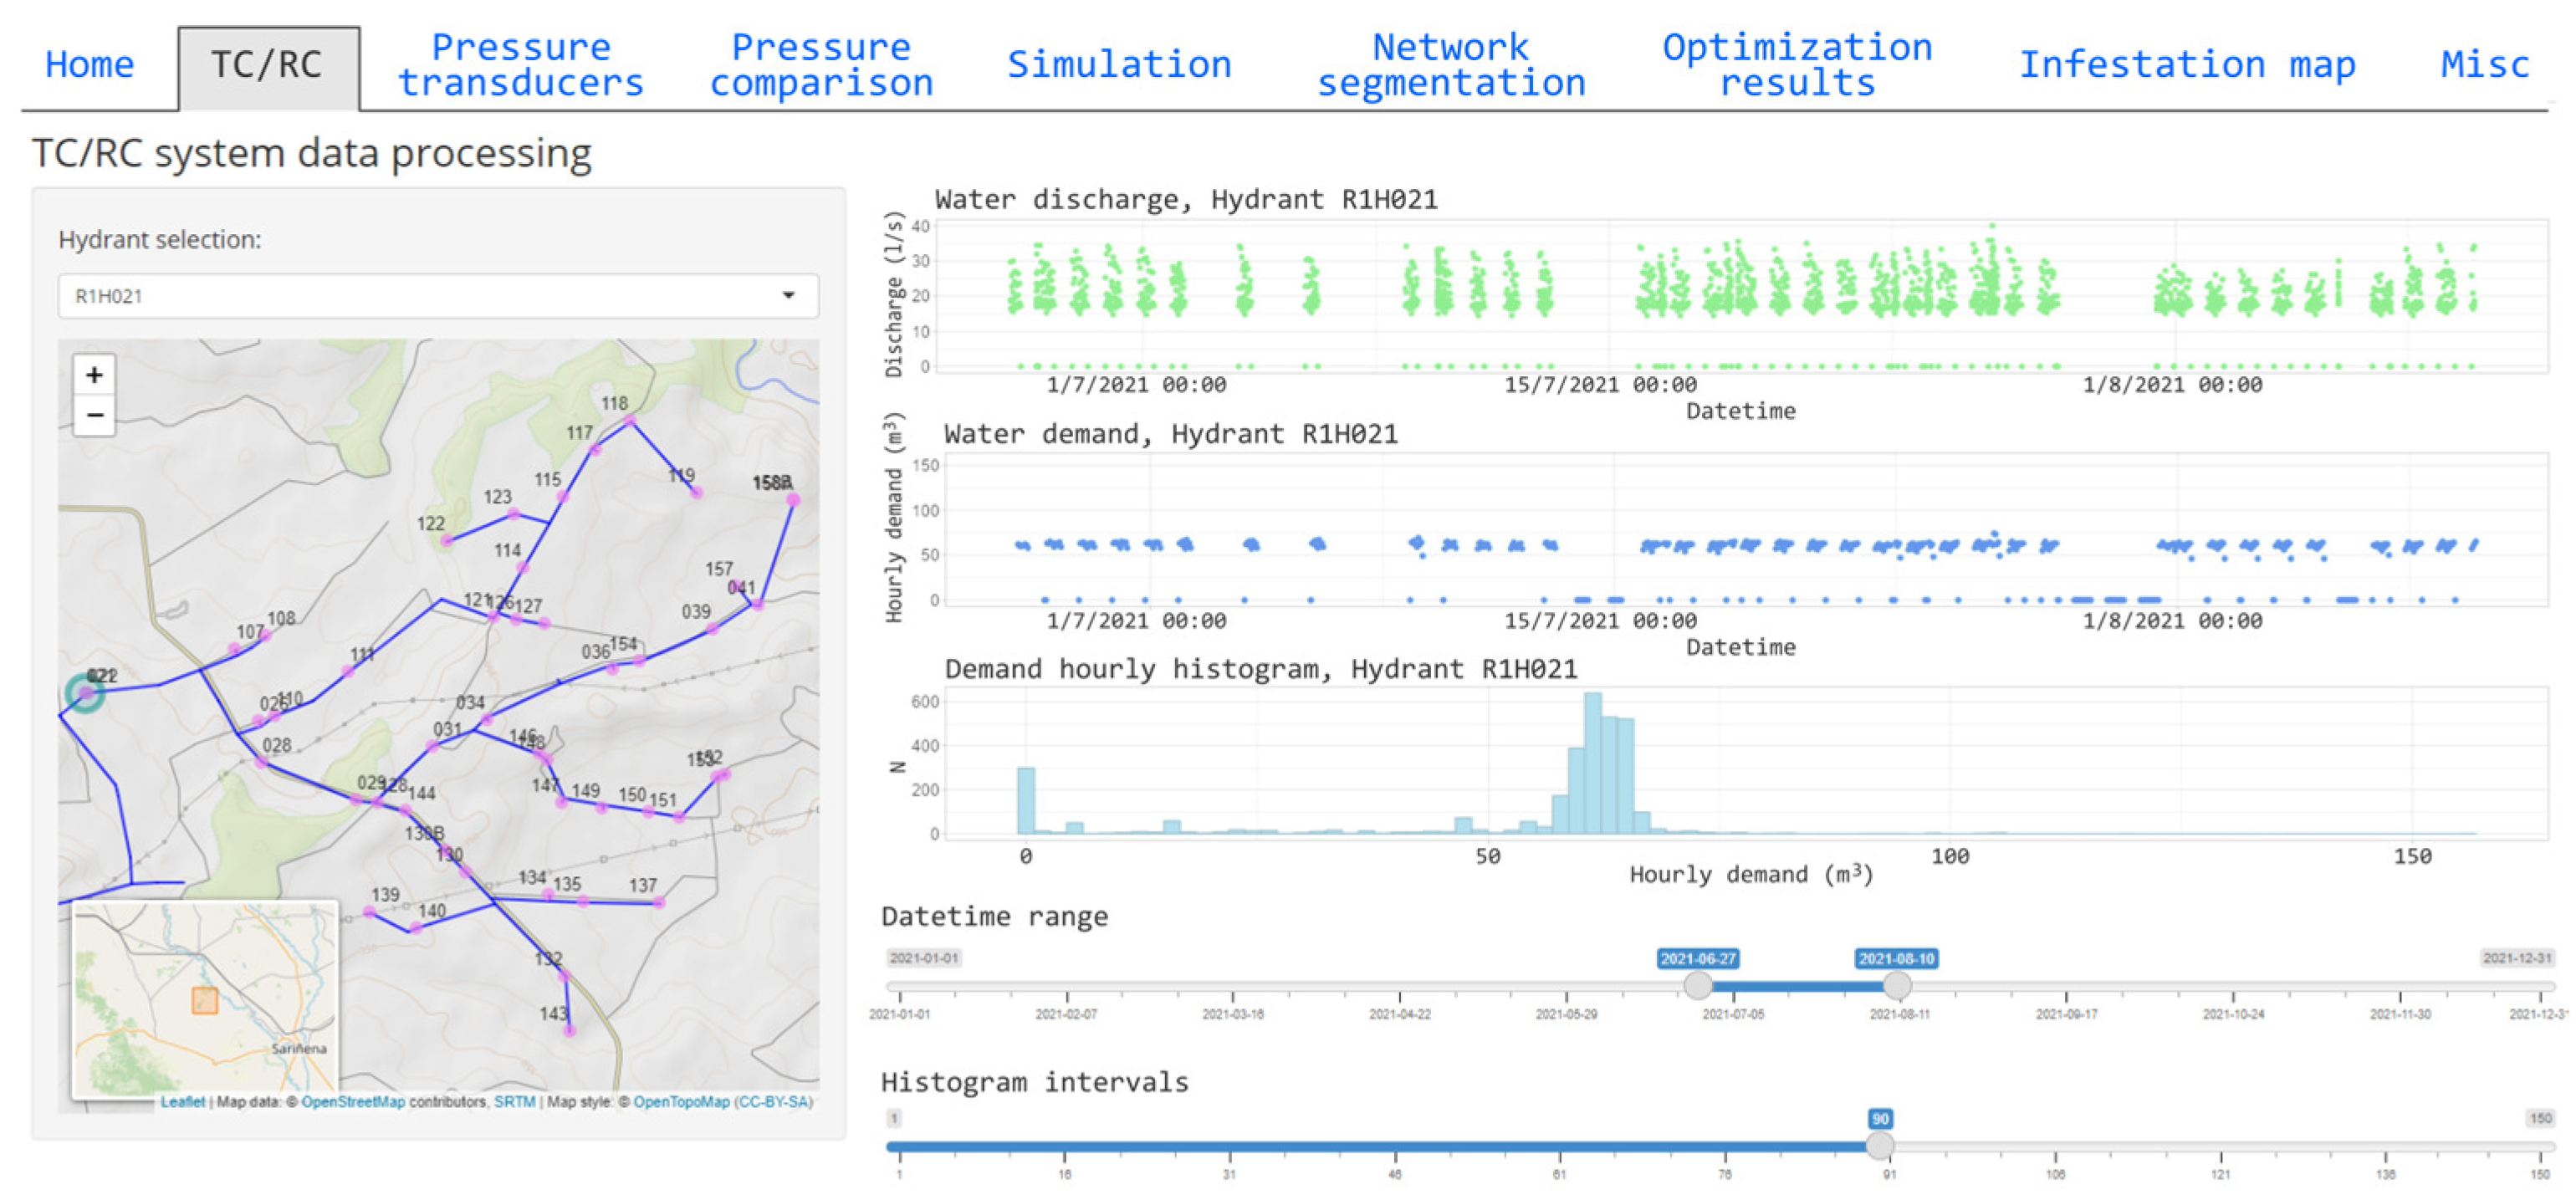
3.2. The SIMZEBRA Cloud Toolkit

A web interface has been developed, divided into different tabs focusing on different stages. The first tab contains general information about the software, while the rest present the computation and analysis steps.
The second tab performs remote access to the TM/RC database and data processing. An interface was built for data access, following the specific requirements of the TM/RC manufacturer. This database contains extensive information, including irrigation water volumes, flow rates, valve openings, and incident records. It should be organized efficiently for real-time graph inspection and use as input for EPANET simulations. The first toolkit component filters and selects the information of interest for each hydrant in the TM/RC database (see Figure 7). The water discharge and irrigation volume are graphically represented within a user-defined time range, with discharge histograms available for users to inspect the variability of discharge serviced by any given hydrant. Figure 8 presents the representation of hourly medians of pressure at the selected hydrant.
The next toolkit tab enables users to initiate EPANET simulations of the irrigation network for a user-defined range of dates, assuming zero presence of zebra mussels within the network pipelines (Figure 9). Upon completion of the simulation, P-sim can be added to the display on the right side of Figure 9 with and/or without local head losses. The user can observe an initial comparison between measured and simulated pressure at the hydrants equipped with transducers. The aim is to quickly identify the most problematic areas of the network, characterized by significant differences between the simulated and measured pressure.
A configuration panel is employed to parameterize the optimization process (Figure 10). The user can specify the number of intervals into which the range of roughness for each network segment will be divided, as well as its minimum and maximum values. Additionally, users can select the number of computational CPU cores for parallel calculation.
Once optimization has been completed, the results corresponding to the optimal set of roughness coefficients are presented in specific tabs. SIMZEBRA permits the assessment of the significance of the optimal network roughness parameters by translating them into infestation levels. This information is presented as maps in the toolkit interface. Figure 11 presents the optimization results in two different ways. First, a pipe roughness color map is shown on the left part of the interface, where pipes are classified in five user-defined levels. All maps can be downloaded as .png images or .html pages. Second, the time evolution of pressure is presented on the right side for each network hydrant. In order to facilitate complete visual comparisons, three pressure signals are shown: P-trans, P-sim + local losses, and P-optimized. Both the roughness map and the pressure plot are specific for the week selected in the dropdown menu.
As discussed in Section 2.3, it is necessary to consider the pipeline diameter to assess zebra mussel infestation from its optimized roughness value. The cloud toolkit can generate infestation maps (Figure 12), classifying infestation into four levels (clean pipelines and low, medium, and high infestation).

3.3. Assessing the Infestation of the Study Area in 2021

The proposed methodology was applied to the study area, retrospectively using SIMZEBRA during the 2021 irrigation season. A screening process of all the available measured data was performed in order to filter outliers at each hydrant. The total number of outliers was less than 1% for the 2021 season.
As stated in Section 2.2, local losses at the hydrants can play a relevant role in the estimation of zebra mussel infestation (Equation (1)). In order to illustrate the relevance of these losses, Figure 13 presents the comparison between the pressure measured by the transducer (P-trans), the simulated pressure without considering the local pressure losses in the hydrant (P-sim), and the simulated pressure considering this effect (P-sim + local losses) for hydrant 143. Similar values of local losses (between 9 and 11 m) were observed in all hydrants.
The temporal evolution of pressure at hydrant 108 is shown in Figure 14, showcasing key data points over the first three weeks of August 2021. The Figure presents P-trans, P-sim + local losses, and the pressure obtained post-optimization (P-optimized). The time evolution of irrigation volume is also presented for comparison purposes. Hydrant 108 holds particular significance due to a notable event on August 18. On that date, the pressure recorded by the transducer plummeted to zero (as shown in the bottom part of Figure 14) because the farmer manually closed the butterfly valve at the hydrant inlet, isolating the transducer from the collective network. Despite such a scenario, the optimization method identified and isolated the anomaly, ensuring that the optimized pressure at the hydrant remained accurate and unaffected by the disturbance. This capability underscores the robustness and reliability of the cloud toolkit in managing unexpected events within the irrigation network.
The optimization results can also be examined at the segment level, providing insights into the network condition at different zones. Figure 15 illustrates the optimized roughness values (in mm) for each segment during August 2021, one of the most active months of the irrigation campaign. This plot offers a comprehensive overview of the roughness magnitude across various segments of the study area. Segments 1 and 3 exhibit high optimized values of roughness throughout the month, indicating a significant likelihood of zebra mussel infestation. Conversely, segments 4 and 5 remain predominantly clean, with minimal roughness levels observed. Segment 2 presents a remarkable case, with an infestation affecting roughness levels emerging notably from the third week of the month. This spatial analysis facilitates understanding of the infestation dynamics within the irrigation network, enabling targeted interventions and management strategies.
Finally, the absolute roughness values were translated into infestation levels using the methodology outlined in Section 2.3. By leveraging the time evolution of optimized absolute roughness for the five network segments, the infestation level was determined for each pipe and each week of the irrigation campaign. It is important to note that a single segment value of absolute roughness can yield varying infestation levels in pipes of different diameters. This pipeline infestation level needs to be cautiously used, since infestation was assessed for the whole segment. Figure 16 illustrates the estimated infestation levels for the four weeks of August 2021. A notable trend of increasing infestation level over time is observed across the study area. Interestingly, despite similar roughness values, segment 3 exhibits a significantly higher infestation level than segment 1. This discrepancy can be attributed to the difference in pipeline diameters between the inlet (segment 1) and a distal branch (segment 3), as depicted in Figure 1. This observation underscores the importance of considering pipeline characteristics and network topology when assessing and addressing zebra mussel infestation within the irrigation network.
The generated infestation maps provide a detailed spatial representation of mussel colonization within the irrigation network. To enhance their practical utility, operational thresholds can be established to support decision-making. Based on previous studies and experimental data, a roughness increase between 1 and 10 mm (corresponding to a medium–high infestation level) may indicate the need for chemical treatment to prevent significant hydraulic losses. Additionally, routine inspections and mitigation measures could be scheduled when roughness approaches this threshold. On the other hand, the optimal frequency of interventions depends on site-specific conditions. Future work should refine these thresholds by integrating field data and evaluating the effectiveness of different treatment strategies under varying infestation levels.

3.4. Recommendations for SIMZEBRA Application and Future Developments

SIMZEBRA represents both a continuation of the works of [3,4] and a relevant improvement. While the basis of the method was established in the early references, SIMZEBRA has made key progress in its implementation, robustness and interpretation. Users can now have access to qualitative infestation levels that facilitate assessment. In this paper, SIMZEBRA has been retrospectively applied to a past irrigation season. However, the tool has been prepared for unattended real-time operation in irrigation networks with TM/RC systems equipped with a sufficient number of pressure sensors.
An obstacle for widespread SIMZEBRA application remains in the access to the TM/RC data. The current implementation is specific for a proprietary TM/RC solution. However, in the context of irrigation modernization policies in Spain, the challenge of TM/RC interoperability has been identified since the first investment plan [38]. The current investment plan [39] requests that TM/RC systems included in modernization projects implement the national Standard UNE 318002-3:2021, promoted by the Spanish Ministry of Agriculture, Fisheries and Food. An international standard with similar implementation has been recently adopted (ISO21622-3:2024: “Irrigation techniques. Remote monitoring and control for irrigation. Part 3: Interoperability”). The adoption of these standards requires the development of a new SIMZEBRA code to access TM/RC data, but ensures its future validity for all compliant systems in the market.
Maximizing the benefits obtained from SIMZEBRA in collective pressurized irrigation networks requires specific network conditions, particularly in what refers to the number and distribution of pressure sensors. While segmentation is an important process to ensure quality in roughness optimization, segment size needs to be commensurate with local network complexity and with the track record of infestation of specific pipelines. Research is needed to optimize the number and location of pressure sensors at the network hydrants and also to respond to SIMZEBRA infestation maps with proposals for additional pressure sensors and therefore for additional segmentation. The application presented in this paper supports the adoption of a time step of one week, but illustrates the need for more detailed segmentation in networks and zones prone to infestation.
This paper focuses on the detection of mussels attached to the interior pipeline walls. However, there is another situation of concern for WUA managers and farmers: the free flow of dead mussel shells following a chemical treatment [4]. Shells tend to accumulate at the filters of large hydrants and/or hydrants located at the end of network branches, provoking a sudden drop in pressure. SIMZEBRA could include specific routines to detect these fast changes in pressure and to identify hydrants and other network points of shell accumulation. More pressure sensors will be required for spatial accuracy, particularly at hydrants of recurrent shell accumulations. WUAs already install sensors at these locations in connection with a hydraulic valve for automatic shell disposal. Connecting these sensors to the TM/RC system will facilitate early, remote detection of the problem.
While the zebra mussel is a serious threat to collective pressurized irrigation networks in Spain and other countries, this is not the only invasive species colonizing pipelines [40]. Other invasive bivalves, such as the Asian clam (Corbicula fluminea), are creating increasing problems in many places of the world [41]. Asian clams are larger than zebra mussels are at the same age, but have very similar shape, colonization traits, and hydraulic obstruction mechanisms. SIMZEBRA would require minor adaptation (if any) to assess the presence of Asian clams. Bryozoans (moss animals) are currently challenging irrigation infrastructure in many areas of the world, lining the interior walls of pipelines, eventually free-flowing in the irrigation streams and clogging filters. The hydraulic characteristics of moss are very different from those of mussels. As a consequence, SIMZEBRA could be eventually used to optimize roughness values in the presence of bryozoans, but the estimation of infestation level from roughness will require in-depth knowledge about this invasive species.

4. Conclusions

In this work, a cloud toolkit has been developed to estimate the infestation of pressurized collective irrigation networks by zebra mussels. SIMZEBRA can assess colonization in different segments of a network at different time periods, offering the following key functionalities:
  • Utilization of TM/RC system data: One of the key strengths of SIMZEBRA lies in its ability to harness the wealth of data generated by TM/RC systems, transforming raw data into actionable insights for WUAs. By providing a centralized platform for data management and analysis, the toolkit increases the value of existing monitoring systems, empowering WUAs to make informed decisions about the management and operation of their irrigation networks.
  • Decision support for chemical treatments: It assists in decision-making regarding the timing and location of chemical treatments by identifying infested pipelines and levels of infestation. WUAs can maximize the effectiveness of chemical control efforts while minimizing environmental impact and operational costs.
  • Reduction in expert personnel requirement: The cloud toolkit streamlines the management of irrigation networks, allowing WUA personnel to focus their efforts on strategic decision-making and proactive interventions. This not only improves operational efficiency but also enhances the overall resilience of irrigation systems in the face of evolving challenges.
To illustrate SIMZEBRA’s capabilities, the 2021 irrigation campaign at the CS-WUA network was analyzed, with a focus on the month of August, known for its high irrigation demand. The NPM, combined with an efficient optimization algorithm yielded absolute roughness values for all network zones. The relationship between absolute roughness and pipe infestation was established through laboratory experiments and analytical developments. An expression for the surface zebra mussel shell density was mathematically deduced. The successful application of the cloud toolkit to part of the CS-WUA network during the 2021 irrigation season demonstrates its efficacy in real-world scenarios. By generating detailed infestation maps, detecting anomalies, and facilitating targeted interventions, SIMZEBRA empowers WUAs to effectively manage and mitigate the impacts of zebra mussel colonization.
The NPM can assist WUA managers in decision-making processes concerning the timing and location of chemical treatments by identifying infested pipelines. This guarantees targeted intervention and optimum investment of labor and chemicals. Leveraging advanced optimization algorithms, the method and the proposed software can support WUAs in determining the most suitable injection point(s) of reactive agents for chemical treatments, thereby ensuring the efficient and sustainable utilization of resources and minimizing environmental effects. As a consequence, treatments targeted in space and time can be applied, instead of the current general and periodic treatments of the complete irrigation network.
SIMZEBRA combines the NPM with an efficient parallel computation scheme and a real-time, web-based user interface operated in a cloud server. The implementation of this simulation tool sets a precedent for the adoption of innovative approaches to integrated water resources management in WUA networks. By combining advanced data analytics, hydraulic modeling, and decision support systems, the toolkit represents a holistic solution for addressing the complex challenges posed by invasive species in irrigation networks.
The development and deployment of the cloud toolkit marks a significant step forward in the sustainable management of pressurized irrigation networks. However, challenges remain in the extension to other invasive species, the application of the ISO standard for interoperability of TM/RC systems, and the detection of masses of free-flowing dead shells.
Future deployment of SIMZEBRA could extend beyond individual irrigation networks to a broader scale, such as irrigation projects or basin authorities. By integrating the toolkit with decision support systems, water managers could receive real-time infestation alerts and dynamically adjust mitigation strategies based on network-wide hydraulic conditions. A promising avenue is the implementation of the toolkit within consortium-level platforms, facilitating coordinated invasive species management across multiple networks. This would enable shared data repositories, regional infestation mapping, and collaborative decision-making to optimize treatment efforts and resource allocation. Such integration would enhance the resilience of irrigation infrastructure against biological fouling while promoting sustainable water management practices. Regarding the toolkit efficiency, potential improvements for future applications to larger-scale networks or finer segmentation include
  • Adaptive search strategies: Implementing hybrid approaches that combine brute-force exploration with intelligent sampling techniques could reduce the number of required simulations while maintaining accuracy;
  • GPU acceleration: Given the highly parallel nature of the optimization process, leveraging GPU-based parallel computing could further reduce computation times, making the method scalable to more complex networks;
  • Multi-resolution approaches: A coarse-to-fine methodology, where initial estimations guide localized refinement in high-risk zones, could significantly reduce computational overhead while preserving accuracy.

Author Contributions

Conceptualization, J.F.-P., B.L., J.B., E.P. and N.Z.; methodology, J.F.-P., B.L., J.B., E.P. and N.Z.; software, J.F.-P.; validation, B.L. and N.Z.; formal analysis, B.L., E.P. and N.Z.; investigation, J.F.-P., B.L., J.B., E.P. and N.Z.; resources, E.P. and N.Z.; data curation, J.F.-P., E.T.M., P.P. and N.Z.; writing—original draft preparation, J.F.-P.; writing—review and editing, J.F.-P., B.L., E.P. and N.Z.; visualization, J.F.-P.; supervision, E.P. and N.Z.; project administration, N.Z.; funding acquisition, N.Z. All authors have read and agreed to the published version of the manuscript.

Funding

This research was funded through grant PID2021-124095OB-I00 by MCIN/AEI/10.13039/501100011033 and by ERDF, a way of making Europe.

Data Availability Statement

The data that support the findings of this study are available on request from the corresponding author.

Acknowledgments

Thanks are due to the managers of the Collarada Segunda Water Users Association. This research would not be possible without their cooperation.

Conflicts of Interest

The authors declare no conflicts of interest.

Abbreviations

The following abbreviations are used in this manuscript:
SIMZEBRASimulation of Irrigation networks for Mitigation of ZEBRa mussel Advance
NPMNormalized Pressure Method
EPAEnvironmental Protection Agency
RAARiegos del Alto Aragón
WUAWater Users Association
CS-WUACollarada Segunda Water Users Association
TM/RCtelemetry and remote-control system
SQLStructured Query Language
DTMDigital Terrain Model
GPSGlobal Positioning System
PRVpressure-reduction valve
RMSEroot mean square error
CENTERSpanish Central Laboratory for Irrigation Equipment and Materials Testing
PVCpolyvinyl chloride
ISOInternational Organization for Standardization
IECInternational Electrotechnical Commission
UNEUna Norma Española
ENEuropean Norm
CPUCentral Processing Unit
IoTInternet of Things
AIArtificial Intelligence

References

  1. Aldridge, D.C.; Elliot, P.; Moggridge, G.D. The recent and rapid spread of the zebra mussel (Dreissena polymorpha) in Great Britain. Biol. Conserv. 2004, 119, 253–261. [Google Scholar] [CrossRef]
  2. Araujo, R. La Afección del Mejillón Cebra y su Posible Lucha en las Infraestructuras, Especialmente en los Riegos Tradicionales y Modernizados del Levante Ibérico; Technical Report from Confederación Hidrológica del Júcar; Confederación Hidrológica del Júcar: Valencia, Spain, 2006. [Google Scholar]
  3. Morales-Hernández, M.; Playán, E.; Gimeno, Y.; Serreta, A.; Zapata, N. Assessing zebra mussel colonization of collective pressurized irrigation networks through pressure measurements and simulations. Agric. Water Manag. 2018, 204, 301–313. [Google Scholar] [CrossRef]
  4. Morales-Hernández, M.; Playán, E.; Latorre, B.; Montoya, F.; Madurga, C.; Sánchez de Rivera, A.; Zapata, N. Normalized pressure: A key variable to assess zebra mussel infestation in pressurized irrigation networks. Agric. Water Manag. 2022, 260, 107300. [Google Scholar] [CrossRef]
  5. Fanslow, D.L.; Nalepa, T.F.; Lang, G.A. Filtration Rates of the Zebra Mussel (Dreissena polymorpha) on Natural Seston from Saginaw Baym Lake Huron. J. Great Lakes Res. 1995, 21, 489–500. [Google Scholar] [CrossRef]
  6. Ruíz-Altaba, C.; Jiménez, P.J.; López, M.A. El temido mejillón cebra empieza a invadir los ríos españoles desde el curso bajo del río Ebro. Quercus 2001, 188, 50–51. [Google Scholar]
  7. Durán, C.; Anadón, A. The zebra mussel invasion in Spain and navigation rules. Aquat. Invasions 2008, 3, 315–324. [Google Scholar]
  8. Rajagopal, S.; Pollux, B.J.A.; Peters, J.L.; Cremers, G.; Moon-van der Staay, S.Y.; van Allen, T.; Eygensteyn, J.; van Hoek, A.; Palau, A.; bij de Vaate, A.; et al. Origin of Spanish invasion by the zebra mussel, Dreissena polymorpha (Pallas, 1771) revealed by amplified fragment length polymorphism (AFLP) fingerprinting. Biol. Invasions 2009, 11, 2147–2159. [Google Scholar] [CrossRef]
  9. Durán, C.; Lanao, M.; Anadón, A.; Touyá, V. Management strategies for the zebra mussel invasion in the Ebro basin. Aquat. Invasions 2010, 5, 309–316. [Google Scholar] [CrossRef]
  10. Connelly, N.A.; O’Neill, C.R., Jr.; Knuth, B.A.; Brown, T.L. Economic Impacts of Zebra Mussels on Drinking Water Treatment and Electric Power Generation Facilities. Environ. Manag. 2007, 40, 108–112. [Google Scholar] [CrossRef]
  11. Wong, W.H.; Gerstenberger, S.L.; Hatcher, D.M.; Thompson, D.R.; Schrimsher, D. Invasive quagga mussels can be attenuated by redear sunfish (Lepomis microlophus) in the Southwestern United States. Biol. Control 2013, 64, 276–282. [Google Scholar] [CrossRef]
  12. Waller, D.; Pucherelli, S.; Barbour, M.; Tank, S.; Meulemans, M.; Wise, J.; Dahlberg, A.; Aldridge, D.C.; Claudi, R.; Cope, W.G.; et al. Review and Development of Best Practices for Toxicity Tests with Dreissenid Mussels. Environ. Toxicol. Chem. 2023, 42, 1649–1666. [Google Scholar] [CrossRef] [PubMed]
  13. Li, Z.; Liu, P.; Chen, S.; Liu, X.; Yu, Y.; Li, T.; Wan, Y.; Tang, N.; Liu, Y.; Gu, Y. Bioinspired marine antifouling coatings: Antifouling mechanisms, design strategies and application feasibility studies. Eur. Polym. J. 2023, 190, 111997. [Google Scholar] [CrossRef]
  14. Zhang, C.; Xu, M.; Wang, Z.; Liu, W.; Yu, D. Experimental study on the effect of turbulence in pipelines on the mortality of Limnoperna fortunei veligers. Ecol. Eng. 2017, 109, 101–118. [Google Scholar] [CrossRef]
  15. Claudi, R.; de Oliveira, M.D. Alternative Strategies for Control of Golden Mussel (Limnoperna fortune) in Industrial Facilities. In Limnoperna Fortune; Boltovskoy, D., Ed.; Invading Nature-Springer Series in Invasion Ecology; Springer: Cham, Switzerland, 2015; Volume 10. [Google Scholar]
  16. Collas, F.P.L.; Koopman, K.R.; Hendriks, A.J.; Verbruggre, L.N.H.; Van der Velde, G.; Leuven, R.S.E.W. Effects of desiccation on native and non-native molluscs in rivers. Freshw. Biol. 2014, 59, 41–55. [Google Scholar] [CrossRef]
  17. Leuven, R.S.E.W.; Collas, F.P.L.; Koopman, K.R.; Matthews, J.; van der Velde, G. Mass mortality of invasive zebra and quagga mussels by desiccation during severe winter conditions. Aquat. Invasions 2015, 9, 243–252. [Google Scholar] [CrossRef]
  18. Sanz-Ronda, F.J.; López-Sáenz, S.; San-Martín, R.; Palau-Ibars, A. Physical habitat of zebra mussel (Dreissena polymorpha) in the lower Ebro River (Northeastern Spain): Influence of hydraulic parameters in their distribution. Hydrobiologia 2014, 735, 137–147. [Google Scholar] [CrossRef]
  19. Rossman, L.; Woo, H.; Tryby, M.; Shang, F.; Janke, R.; Haxton, T. EPANET 2.2 User Manual; EPA/600/R-20/133; U.S. Environment Protection Agency: Washington, DC, USA, 2020. [Google Scholar]
  20. Bezerra, A.A.; Castro, M.A.H.; de Andrade Araújo, R.S. Absolute roughness calculation by the friction factor calibration using the Alternative Hydraulic Gradient Iterative Method on water distribution networks. Braz. J. Water Resour. 2017, 22, e24. [Google Scholar] [CrossRef]
  21. Kapelan, Z.; Savic, D.A.; Walters, G.A. Incorporation of prior information on parameters in inverse transient analysis for leak detection and roughness calibration. Urban Water J. 2004, 1, 129–143. [Google Scholar] [CrossRef]
  22. Instituto Geográfico Nacional. Modelo Digital del Terreno–MDT02; Centro Nacional de Información Geográfica: Huesca, Spain, 2016. [Google Scholar]
  23. Larock, B.E.; Jeppson, R.W.; Watters, G.Z. Hydraulics of Pipeline Systems, 1st ed.; CRC Press: Boca Raton, FL, USA, 1999. [Google Scholar]
  24. Darcy, H. Recherches Expérimentales Relatives au Mouvement de L’eau dans les Tuyaux; Impr. Impèriale: Paris, France, 1857; Volume 1. [Google Scholar]
  25. Colebrook, C.F.; White, C.M. Experiments with Fluid Friction Factor in Roughened Pipes. Proc. R. Soc. Lond. Ser. A Math. Phys. Sci. 1937, 161, 367–381. [Google Scholar]
  26. Colebrook, C.F. Turbulent Flow in Pipes, with Particular Reference to the Transition Region between the Smooth and Rough Pipe Laws. J. Inst. Civ. Eng. 1939, 11, 133–156. [Google Scholar] [CrossRef]
  27. Méndez, M.; Araya, J.A.; Sánchez, L.D. Automated parameter optimization of a water distribution system. J. Hydroinform. 2013, 15, 71–85. [Google Scholar] [CrossRef]
  28. Zhang, Q.; Zheng, F.; Duan, H.-F.; Jia, Y.; Zhang, T.; Guo, X. Efficient numerical approach for simultaneous calibration of pipe roughness coefficients and nodal demands for water distribution systems. J. Water Resour. Plan. Manag. 2018, 144, 04018063. [Google Scholar] [CrossRef]
  29. Ma, K.S.-K. Screening programs incorporating big data analytics. In Big Data Analytics for Healthcare; Academic Press: Cambridge, MA, USA, 2022; Chapter 24; pp. 313–327. [Google Scholar]
  30. Hestenes, M.R.; Stiefel, E. Methods of Conjugate Gradients for Solving Linear Systems. J. Res. Natl. Bur. Stand. 1952, 49, 409–436. [Google Scholar] [CrossRef]
  31. Kirkpatrick, S.; Gelatt, C.D.; Vecchi, M.P. Optimization by Simulated Annealing. Science 1983, 220, 671–680. [Google Scholar] [CrossRef]
  32. Ferrarese, G.; Medoukali, D.; Mirauda, D.; Malavasi, S. Review of Metaheuristic Methodologies for Leakage Reduction and Energy Saving in Water Distribution Networks. Water Resour. Manag. 2024, 38, 3973–4001. [Google Scholar] [CrossRef]
  33. Gauckler, P. Etudes Théoriques et Pratiques sur l’Ecoulement et le Mouvement des Eaux; Comptes Rendues de l’Académie des Sciences: Paris, France, 1867; Volume 64, pp. 818–822. [Google Scholar]
  34. Manning, R. On the flow of water in open channels and pipes. Trans. Inst. Civ. Eng. Irel. 1891, 20, 161–207. [Google Scholar]
  35. Arandia, E.; Eck, B.J. An R package for EPANET simulations. Environ. Model. Softw. 2018, 107, 59–63. [Google Scholar] [CrossRef]
  36. R Core Team. R: A Language and Environment for Statistical Computing; R Foundation for Statistical Computing: Vienna, Austria, 2023. [Google Scholar]
  37. Kour, V.P.; Arora, S. Recent Developments of the Internet of Things in Agriculture: A Survey. IEEE Access 2020, 8, 129924–129957. [Google Scholar] [CrossRef]
  38. Government of Spain. Real Decreto 329/2002, de 5 de Abril, por el que se Aprueba el Plan Nacional de Regadíos. Boletín Oficial del Estado BOE-A-2002-8129. 2002. Available online: https://www.boe.es/eli/es/rd/2002/04/05/329 (accessed on 1 October 2024).
  39. Government of Spain. Plan de Recuperación, Transformación y Resiliencia. 2021. Available online: https://www.lamoncloa.gob.es/temas/fondos-recuperacion/Documents/30042021-Plan_Recuperacion_%20Transformacion_%20Resiliencia.pdf (accessed on 1 October 2024).
  40. Khalanski, M. Industrial and ecological consequences of the introduction of new species in continental aquatic ecosystems: The zebra mussel and other invasive species. Bull. Fr. Peche Piscic. 1997, 344–345, 385–404. [Google Scholar] [CrossRef]
  41. Pigneur, L.M.; Falisse, E.; Roland, K.; Everbecq, E.; Deliège, J.F.; Smitz, J.S.; van Doninck, K.; Descy, J.P. Impact of invasive Asian clams, Corbicula spp.; on a large river ecosystem. Freshw. Biol. 2014, 59, 573–583. [Google Scholar] [CrossRef]
Figure 1. Hydraulic map of the CS-WUA Network 1 (left), and detail of the study area, downstream from the head node (right). Maps show network pipelines, pressure-reducing valves, and hydrants.
Water 17 01145 g001
Figure 2. Division of the network of the study area into five segments for the optimization of pipeline roughness coefficients.
Water 17 01145 g002
Figure 3. Flowchart of the main processes involved in the estimation of Normalized Pressure and the optimum values of network segment roughness.
Water 17 01145 g003
Figure 4. Experiment in pipeline roughness with screws as proxies of zebra mussels. (a) Detail of the perforated pipes with 26 and 32 holes (DN250 and DN300 pipes, respectively) around the pipeline and holes spaced 0.05 m along the pipeline; and (b) installation of the perforated pipe in the experimental bench.
Water 17 01145 g004
Figure 5. Experimental pressure losses for DN250 (left) and DN300 (right) pipes, and for variable levels of screw depths and densities. The fit to the Darcy–Weisbach equation for each case is also presented.
Water 17 01145 g005
Figure 6. Predicted vs. measured pressure loss values for cases DN250 and DN300. A trend can be observed that underestimates the values of DN250 and overestimates the values of DN300.
Water 17 01145 g006
Figure 7. Graphical representation of TM/RC data corresponding to a hydrant: Hourly water discharge, irrigation volume, and histogram for a user-specified time range and intervals.
Water 17 01145 g007
Figure 8. Data inspection and processing for the pressure transducer corresponding to a hydrant. Median hourly data are presented for the 1 min data obtained from the pressure measurement and storage devices.
Water 17 01145 g008
Figure 9. EPANET simulations launcher, showing the difference between the simulated pressure with (red line) and without (blue line) local losses and observed pressure (green line) in the transducer. Hourly irrigation water demand at the hydrant is presented for comparison purposes.
Water 17 01145 g009
Figure 10. Configuration panel for the optimization algorithm. The user can select the resolution, discrete roughness values for the brute force algorithm, and the number of CPU cores used in parallelization.
Water 17 01145 g010
Figure 11. Network roughness optimization results viewer, presenting maps of network optimized roughness (left) and the time evolution of different types of pressure for specific hydrants and simulation periods (weeks).
Water 17 01145 g011
Figure 12. Infestation map for the study area, with pipelines classified in four categories: clean pipes and three degrees of infestation (low, medium, and high).
Water 17 01145 g012
Figure 13. Contribution of local pressure losses at the hydrant 143. The figure presents the pressure transducer signal and the simulated pressure with and without consideration of local losses.
Water 17 01145 g013
Figure 14. Comparison for three consecutive weeks among pressure obtained from the transducer (green dashed line), simulated pressure considering a mussel-free network state (red line), and optimized pressure signal (blue line) for hydrant 108.
Water 17 01145 g014
Figure 15. Values of absolute roughness (mm) in logarithmic scale for each network segment during the month of August 2021.
Water 17 01145 g015
Figure 16. Time evolution of the infestation level in the study area during the four weeks of August 2021.
Water 17 01145 g016
Disclaimer/Publisher’s Note: The statements, opinions and data contained in all publications are solely those of the individual author(s) and contributor(s) and not of MDPI and/or the editor(s). MDPI and/or the editor(s) disclaim responsibility for any injury to people or property resulting from any ideas, methods, instructions or products referred to in the content.

