Abstract
This study analyzed terrestrial water storage (TWS) changes across the Inner Niger Delta (IND) in Mali (West Africa) from April 2002 to September 2022 using Gravity Recovery and Climate Experiment (GRACE), GRACE-Follow-On (GRACE-FO), and Global Land Data Assimilation System (GLDAS) products. TWS changes exhibited strong seasonal patterns (−170 mm to 330 mm) with a high correlation between GRACE/GRACE-FO and GLDAS (r = 0.92, RMSE = 35 mm). The TWS trend was positive (7.3 to 9.5 mm/year). Maximum TWS changes occurred in September, while minimum values were observed between April and May. Wavelet analysis identified dominant seasonal cycles (8–16 months). Finally, we examined the climatic effects on TWS changes along the Niger River, from its source in the humid zones of Guinea to the semi-arid Sahelian zones of the IND in Mali. Precipitation (P) and potential evapotranspiration (PE) influence TWS changes only in the humid regions (r = 0.18–0.26, p-value < 10−2). Surface water bodies (SWB) exhibited a significant correlation with TWS in all regions, with r exceeding 0.50 in most cases. Groundwater changes, estimated from GRACE/GRACE-FO and GLDAS, showed strong agreement (r > 0.60, RMSE < 120 mm), with recharge rates increasing in semi-arid and Sahelian regions (r > 0.70, p-value < 10−3). This study highlights that precipitation, surface water bodies, and groundwater recharge appear as primary drivers of TWS in different regions: precipitation in the humid forest of Guinea, surface water bodies in the Southern and Northern Guinea Savanna along the Guinea–Mali border, and groundwater recharge in the semi-arid and IND Sahelian regions of central Mali.
1. Introduction
The Gravity Recovery and Climate Experiment (GRACE) satellite mission has transformed the study of terrestrial water storage (TWS) by providing global, monthly observations of Earth’s gravity field which reflect changes in water mass distribution [1]. Since its launch, the GRACE has been widely used to monitor large-scale hydrological processes, particularly in regions where ground-based measurements are limited. The GRACE’s ability to detect water mass changes in aquifers, surface water, and soil moisture has made it an essential tool in understanding water resource variability and its drivers across different environments [2,3,4].
While GRACE data have been extensively applied in global and continental-scale studies, its use in localized regions such as river deltas requires careful integration with land surface models due to the relatively coarse spatial resolution of the satellite [5,6,7]. Indeed, a number of studies using satellite gravimetry data have been conducted in the Niger River Basin that covers over 2.106 km2 in West Africa (e.g., [8]). The Inner Niger Delta (IND), located inside the Republic of Mali, is part of the vast ensemble of the Niger River Basin. The IND is one of the largest deltas in the world. It is a region of significant hydrological interest due to the complex interactions between surface and groundwater systems, extensive wetlands, and high levels of human activity [9]. The IND is characterized by seasonal flooding during the wet season (transforming the area in an “interior sea”), followed by long dry seasons that dries out soils and most water bodies. These dynamics make the IND a challenging environment for water resource management.
One of the key applications of GRACE data in the large Niger Basin has been the monitoring of groundwater storage changes. The basin is highly dependent on its groundwater systems, especially in regions where surface water is insufficient or seasonally variable. Groundwater plays a crucial role in supporting agriculture, domestic use, and industrial activities, particularly in rural areas and areas affected by seasonal dry periods. Owing to the lack of extensive monitoring networks, the GRACE has become an important tool for evaluating groundwater dynamics in the region. Several studies have utilized the GRACE in the Niger River Basin. Werth et al. [10] found that water rise was attributed to groundwater in the Sahel Zone of the basin between 2003 and 2013. Barbosa et al. [11] developed a transient groundwater model using GRACE information from 2009 to 2021 in the Goulbi Maradi aquifer (Republic of Niger) and indicated that water extraction from this aquifer is sustainable, even if current groundwater extraction is increased by up to 28%. These studies underscore the critical role of the GRACE in monitoring groundwater resources in areas where direct observations are sparse or unavailable.
Overall, the Niger Basin is characterized by a tropical climate with distinct wet and dry seasons, where the timing and intensity of rainfall are critical to the hydrological balance. The GRACE has proven valuable in assessing the impact of climate variability on water storage in the region. For example, Bibi et al. [12] integrated the GRACE with hydrological models to assess TWS variability across numerous basins, including the Niger River Basin. They highlighted the role of precipitation, evapotranspiration, and human water use in modulating water storage trends. Their study showed pronounced seasonal variations in water storage in the southern part of the large basin, reflecting the influence of wet season flooding and dry season water withdrawal. In addition to groundwater studies, the GRACE has been used to monitor the impact of climate variability and extreme weather events on the hydrology of various basins. Hassan and Jin [13] analyzed GRACE data alongside rainfall records to investigate the impact of climate-driven changes in precipitation patterns on TWS in a series of basins in Africa, including the vast Niger River Basin. Their study found that periods of intense rainfall during the wet season significantly influence the region’s water storage, leading to higher flooding risks, while prolonged dry spells caused a decline in surface and groundwater resources. In a comprehensive study, Hasan et al. [14] focused on understanding the long-term TWS variations across nine of Africa’s transboundary river basins over the past 50 years. They showed significant fluctuations in TWS across the Niger River Basin due to climatic variations and human activities. They also showed that periods of drought, especially during the Sahel droughts of the 1970s and 1980s, led to substantial declines in water storage levels. However, they found some recovery in TWS in recent decades, attributed to increased precipitation and improved water management practices.
Given the spatial resolution limitations, many studies have combined GRACE data with other satellite datasets and hydrological models to improve the understanding of water storage dynamics. For instance, studies by Hinderer et al. [15] combined the GRACE with the Global Land Data Assimilation System (GLDAS) to disaggregate TWS into its component parts, such as soil moisture, surface water, and groundwater. By integrating these datasets, researchers have been able to isolate the drivers of water storage changes, particularly in response to both human activities (e.g., land use changes, oil exploration) and natural phenomena (e.g., rainfall variability, river discharge) [16]. Further, the integration of the GRACE with ground-based measurements and other remote sensing data has enabled more accurate assessments of hydrological processes. Springer et al. [17] combined the GRACE with in situ groundwater monitoring data and local hydrological models to improve groundwater management strategies in the Niger Basin. Their study demonstrated the potential of GRACE data to complement traditional monitoring methods, particularly in regions with limited access to in situ data. Barbosa et al. [18] evaluated groundwater storage changes using GRACE and GLDAS data in two basins (Iullemeden and Chad) in West and Central Africa and found relatively constant values from 2002 to 2010 and a steep rise from 2010 to 2021.
In this study, we focused on the Inner Niger Delta (IND). Part of the Niger River Basin, the IND is a vast floodplain in the heart of the Sahel entirely located in Mali (West Africa). The IND is the third largest Ramsar (www.ramsar.org) Convention site in the world that plays a crucial hydrological, ecological, and economical role. Despite the extensive application of GRACE data in large-scale hydrological assessments, research specifically focused on the IND remains limited. While previous studies have examined groundwater storage changes and TWS variability across the broader Niger River Basin, very few have provided a detailed, region-specific analysis of TWS dynamics in the IND, which is characterized by highly complex hydrological interactions. Additionally, most studies have relied on GRACE-derived TWS trends without integrating complementary datasets that provide insights into surface and groundwater contributions. To address these gaps, we investigated four key objectives to comprehensively analyze terrestrial water storage (TWS) variations in the IND. First, we calculated both the temporal and spatial seasonal trend, as well as the long-term trends of TWS variations, using GRACE and GRACE-FO satellite observations from 2002 to September 2022. These results were then compared with TWS derived from various hydrological parameters of the GLDAS model, identifying the months of maximum and minimum TWS anomalies and conducting a thorough temporal and spatial analysis of TWS changes across both datasets. Second, the IND was divided into four distinct sub-regions based on hydrological, climatological, and geological characteristics, where TWS trends were further analyzed and compared using GRACE/GRACE-FO and GLDAS data. Third, we evaluated the relationship between TWS variations and climatic variables (precipitation and potential evapotranspiration) over selected locations representing different agroecological zones from the source of the Niger River in Guinea up to the IND. Finally, we calculated surface water bodies derived from the WaterGAP Global Hydrology Model (WGHM) and then estimated groundwater recharge from two different methods from 2002 to the end of 2016 across the selected locations, assessing their contributions to TWS variations.
2. Study Area
The Inner Niger Delta (IND), located in Mali, is a vast floodplain and wetland ecosystem that plays a crucial role in the hydrology, ecology, and livelihoods of the region. This unique inland delta is formed by the convergence of the Niger and Bani rivers, covering an area of about 30,000 to 40,000 km2, depending on seasonal variations in water flow [9]. The delta serves as a critical zone for water storage, groundwater recharge, and sediment trapping, with water levels fluctuating dramatically between the wet and dry seasons [19]. The geographical coordinates for the IND are 3° to 5°30′ longitude west and 13°30′ to 16°30′ latitude north, as illustrated in Figure 1a. Figure 1b shows the selected location (size of 0.5° × 0.5°) from the source of the Niger River in Guinea to the IND (see Section 3.2 for explanation).
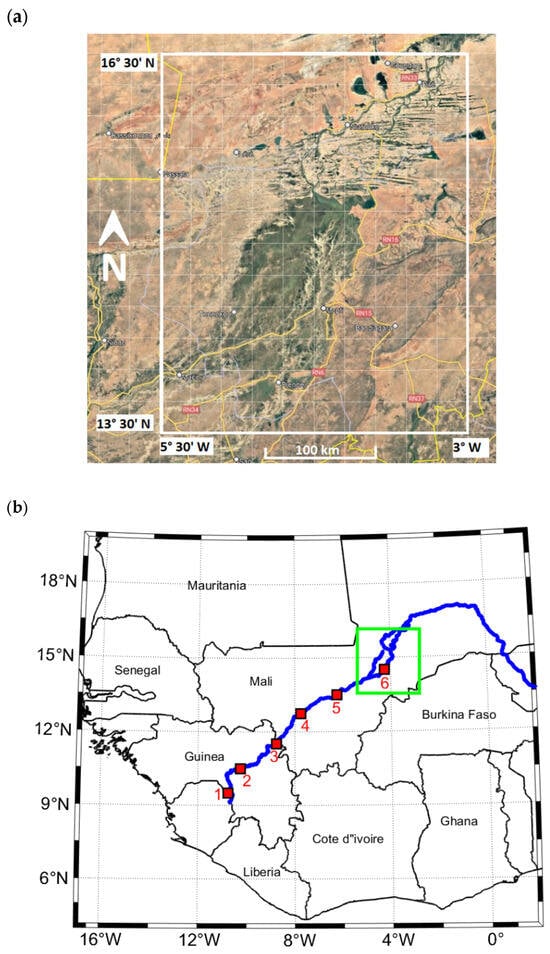
Figure 1.
(a) The location of the Inner Niger Delta in Mali, West Africa (modified Google Earth snapshot). (b) Selected pixels (red square) in different climatic zones. The green rectangle shows the area of study including the IND. The blue line is the Niger River Basin.
The hydrology of the IND is heavily influenced by seasonal floods that peak between August and December, as waters from the upstream Niger River Basin flow into the floodplains [20]. These floods recharge local aquifers, support agriculture, and sustain the region’s biodiversity (Wetlands International, 2020). Communities within the delta depend on this seasonal inundation for rice cultivation, fishing, and livestock grazing. However, changes in climate and upstream water management have impacted the natural flood cycles, causing variations in flood magnitude and timing, which affect the region’s ecosystems and agricultural productivity [21].
The Niger River, the third longest river in Africa, is the lifeline of the region, extending over 4200 km from its source in the Guinea Highlands, through Mali, Niger, and Nigeria, before emptying into the Gulf of Guinea [22]. The river’s basin covers an area of about 2.2 million km2, making it one of the most important water resources in West Africa [23]. The river’s hydrological regime is characterized by pronounced seasonal variability, influenced by rainfall patterns in its upper basin. It is responsible for feeding the IND with water so that it can sustain the ecosystem’s functions [24].
The interaction between the Niger River and the IND is complex, as the delta serves as both a storage area for floodwaters and a groundwater recharge zone [25]. Hydrological parameters such as river discharge, rainfall, and evapotranspiration play a critical role in determining the extent of flooding within the delta [26]. Recharge over the Niger River and its surrounding basins are vital for sustaining long-term water availability in the delta, influencing agricultural productivity and local water security [27].
In recent years, the effects of climate change have further exacerbated these pressures. Changes in rainfall patterns and increasing temperatures are predicted to influence the hydrological cycle of the Niger River, potentially leading to more extreme flood and drought events [28]. Such changes could have profound impacts on the IND, reducing water availability, affecting agricultural practices, and altering the balance of ecosystems [29]. Understanding the TWS changes in the region is essential for assessing the impacts of hydrological and environmental changes on the delta. TWS variations are closely linked to river discharge, groundwater recharge, and surface water dynamics [30]. Analyzing these changes provides insights into how climate variability, water management practices, and natural hydrological processes affect the Niger River’s contribution to the health and sustainability of the IND [31].
3. Data and Methodology
3.1. Data
In this study, we employed the GRACE/GRACE-FO monthly gravity models, focusing on spherical harmonic coefficients up to degree and order 60 (RL-06) from the University of Texas Center for Space Research (UTCSR) [32]. To enhance data reliability, several preprocessing steps were undertaken, including replacing degrees 1 and 2, addressing leakage errors, correcting for the glacial isostatic adjustment (GIA) effect, and applying a de-stripping correction. These refinements were crucial for producing high-quality TWS variation data for our analysis. More details can be found in [33]. The spatial resolution of the GRACE/GRACE-FO observations was 1°, which was downscaled to 0.25° using the method proposed by Fatolazadeh et al. [34]. Additionally, the study period covered the time span from April 2002 to September 2022. To ensure consistency, other datasets used in the analysis were selected based on the same temporal coverage.
The hydrological variables, soil moisture (SM), canopy water (CAN), groundwater (GW), precipitation (P), potential evapotranspiration (PE), and total water storage (TWS), were sourced from the Catchment Land Surface Model (CLSM) L4 daily dataset at a 0.25° × 0.25° resolution (GLDAS_CLSM025_DA1_D 2.2), part of the Global Land Data Assimilation System (GLDAS) [35]. We maintained consistency with the GRACE/GRACE-FO data by focusing on the same time frame. Among the GLDAS models, Catchment L4 V2.2 was selected for its inclusion of both groundwater storage (GWS) and total water storage (TWS) components, which are key for our analysis [36,37]. The daily data were resampled to monthly averages to align with the temporal resolution of the GRACE/GRACE-FO data.
Since the GLDAS does not provide a surface water component, we extracted global lake storage, global wetland storage, reservoir storage, and river storage from the latest version of the WaterGAP Global Hydrology Model (WGHM), version 2.2d, to estimate surface water bodies (SWBs) [38]. The monthly data, originally available at a 0.5° resolution from 2002 to the end of 2016, were resampled to a 0.25° resolution to ensure consistency with other datasets used in this study.
To complete the dataset, we used a geological map [39] to help interpret the results in different subareas of the IND. Also, we considered the agroecological classification [40] to guide the selection of various locations from the source of the Niger River in Guinea to the IND area in order to understand the factors governing the variations in TWS and groundwater.
3.2. Methodology
The first step in the methodology involved processing data from the GRACE/GRACE-FO missions to estimate both seasonal and long-term variations in TWS. We began by utilizing the monthly spherical harmonic coefficients from the latest releases of both datasets, GRACE release-6 and GRACE-FO release-6 (UTCSR06), which provide data up to a maximum degree and order of 60. These coefficients were processed separately to extract regional TWS anomalies. To enhance the spatial resolution of GRACE/GRACE-FO observations, which are typically coarse, we applied a downscaling technique based on the spectral combination method. This approach involves defining an estimator to improve the spatial resolution from the native ~300 km to 0.25° (~25 km). The methodology for this spectral combination follows the approach developed by [34], ensuring a more detailed representation of TWS variations at a finer spatial scale across the study area. In addition to the GRACE/GRACE-FO data, we incorporated terrestrial water components from the GLDAS model. Specifically, we used the soil moisture, canopy water, and groundwater parameters from the GLDAS to derive model-based TWS variations. Since there is no snow in this geographical area, we excluded the Snow Water Equivalent (SWE) from the parameters to be considered. To validate TWS variations derived from the GRACE/GRACE-FO, we compared them with the GLDAS-derived TWS estimates. Statistical metrics, including Root Mean Square Error (RMSE), and Pearson correlation coefficients (r) were employed to evaluate the agreement between the two datasets. Furthermore, we identified the months with the maximum and minimum TWS changes across the study area by analyzing the combined data from the GRACE and GRACE-FO. For each month during the entire study period (April 2002 to September 2022), we computed mean TWS variations to capture both seasonal cycles and long-term trends. This yielded a total of 230 matrices (representing 230 months of data) of TWS changes for the entire period. However, due to data gaps, the missing months were excluded from the computation of the time series (approximately 20 missing months in GRACE and 2 missing months in GRACE-FO). The matrices generated provide a comprehensive overview of the average monthly and seasonal TWS variations across the study area. The same procedure was applied to TWS data derived from the GLDAS to ensure consistency in the comparison.
The second step in the methodology involved dividing the IND into four distinct sub-regions based on the geological characteristics of the area. This division was guided by geological maps (see Section 3.1), which indicate that the region comprises quaternary formations, beginning with sandy plains in the north and extending southwest through alluvial deposits. Additionally, the southeastern part of the IND is characterized by sedimentary formations, including Lower Precambrian and Miocene deposits. The sub-regions were delineated to capture the spatial heterogeneity of the delta, ensuring that each represents different geological and hydrological conditions that may influence TWS dynamics. Once the sub-regions were established, we calculated TWS variations from both the GRACE/GRACE-FO and GLDAS in each case. By comparing the TWS anomalies from the GRACE/GRACE-FO with those derived from the GLDAS, we aimed to assess the consistency and confidence of our satellite-based TWS estimates. For the comparison, we employed several statistical metrics to quantify the level of agreement between the two datasets. These statistical metrics helped us evaluate the reliability of the GRACE/GRACE-FO-derived TWS variations and understand the spatial–temporal dynamics of water storage across the IND.
The third step in our methodology focused on analyzing TWS variations along the Niger River, with particular attention paid to the influence of precipitation and potential evapotranspiration. To achieve this, we selected six key locations along the river, each representing a different agroecological zone, as defined in [39]. The equivalent GIS layer can be found online (Africa Geoportal, 2017). The locations considered were strategically chosen to capture the diverse climatic and ecological conditions present along the Niger River’s path toward the IND. At each location, we analyzed the impact of precipitation and potential evapotranspiration on TWS variations, using data derived from the GRACE and GLDAS model. The latter provides high-resolution estimates of both precipitation and potential evapotranspiration, which are critical factors driving the water balance. We based our analysis on the assumption that TWS changes can be estimated by the difference between precipitation and potential evapotranspiration. This approach follows the method proposed by [4,41,42,43], which relates changes in TWS over time () to the balance between incoming and outgoing water in the system. The relationship is expressed as follows:
where represents the change in TWS at a given time , while P(t) and PE(t) are, respectively, the precipitation (water input) and the potential evapotranspiration (water lost due to evaporation and plant transpiration) at time t. This equation was used to estimate the TWS changes across the IND, allowing us to investigate the relationship between climatic factors and water storage dynamics. By applying this analysis at multiple locations along the river, we could compare how different climatic conditions affect TWS variations and assess whether certain areas are more vulnerable to hydrological changes driven by precipitation and potential evapotranspiration imbalances.
In the fourth step, we calculated surface water body (SWB) variations () across the selected locations and assessed their effects on TWS variations. To estimate SWBs, we derived parameters of global lake storage, global wetland storage, reservoir storage, and river storage from the WGHM and summed them as follows [38]:
Since data for SWBs were only available until the end of 2016, our estimation was limited to this period, as the dataset was not extended until the end of 2022. By applying this analysis at each selected location along the river, we were able to compare how SWBs influence TWS variations in the IND. To quantify the relationship between the variations in SWBs and TWS, we employed statistical metrics to evaluate the agreement between the two datasets, providing valuable insights into their hydrological interactions in the IND.
Finally, we calculated groundwater recharge for the selected locations mentioned in the previous step and then explored its relationship with TWS variations. Groundwater recharge refers to the amount of water that infiltrates the soil and reaches the groundwater system, replenishing aquifers. To assess groundwater recharge, we applied the Water Table Fluctuation (WTF) method used in [18], which is a recognized technique for determining recharge rates by analyzing variations in water table levels. The WTF method is a widely used approach in hydrology to estimate groundwater recharge by observing changes in the water table level [44]. The WTF method takes advantage of the fact that groundwater level rise (usually during wet periods) indicates recharge, while a falling water table (during dry periods) indicates discharge or groundwater extraction. The core idea of the WTF method is based on the principle that changes in groundwater storage are directly related to changes in the water table elevation. The method assumes that all water added to the groundwater system (i.e., recharge) will raise the water table and that declines in the water table are a result of groundwater discharge (e.g., via pumping or natural outflow). The basic equation for groundwater recharge estimation using the WTF method is as follows [18]:
where is the groundwater recharge (usually in units like cm/year or mm/year), is the specific yield (dimensionless), and is the change in water table height (measured in length, e.g., cm or m). This is the difference between the maximum and minimum levels of the water table over a given time period. The method assumes that fluctuations in water table height directly correspond to changes in groundwater storage.
is the time interval over which the change in water table height was observed (e.g., days, months, or years). It represents the time over which the fluctuation in the water table height is measured. The time interval should be appropriate to capture the recharge event (often a wet season) and the subsequent groundwater response. It is generally selected based on seasonal patterns to accurately capture the phases of recharge and depletion.
The traditional WTF method relies on water level data () from wells to estimate recharge based on fluctuations in the water table. However, in this study, the GRACE provides regionally averaged estimates of water storage changes over large areas (up to several hundred kilometers), including changes in TWS, which consists of groundwater, soil moisture, surface water bodies, and other components. This method allows us to express the following relationship by assumption [45]:
To apply the WTF method using GRACE data, the key step is to extract the groundwater storage variation (GWS) component from TWS. This could be achieved by subtracting the various water storage components (soil moisture (SM), canopy (CW), surface water bodies (SWBs), etc.) from TWS. The independent datasets for these components are available from the GLDAS and WGHM. Therefore, GWS can be isolated in the region considered as follows [46]:
Once has been isolated from GRACE data, the recharge can be estimated using the modified form of the WTF method (Equation (3)). The equation remains similar to the traditional WTF method, but instead of using direct water level () measurements from wells, derived from the GRACE is used.
To determine the recharge rate (mm/year), we carefully evaluated seasonal variations in the time-series plots. This evaluation enabled us to identify key periods of recharge and decline. The WTF method assumes that during dry spells, recharge is minimal, leading to a reduction in groundwater levels primarily due to extraction for agricultural or domestic use. The subsequent increase in groundwater levels signifies the recharge phase.
Two methodologies are typically utilized to estimate the recharge rate from the observed data:
Method 1: This approach involves measuring the difference between the lowest point of the decline () and the highest point of the rise (), with this difference representing the net recharge () [18]:
Method 2: In this method, the downward trend is projected from the depletion curve starting from the peak of the previous year () down to the lowest point (). This projection estimates the recharge necessary to balance ongoing discharge (). The total recharge is calculated by combining the net recharge from Method 1 with this balance [18]:
By employing these two methods, we can derive both conservative and liberal estimates of groundwater recharge. Utilizing GRACE-derived groundwater datasets enhances our ability to capture the spatial and temporal variations of recharge, offering valuable insights into the aquifer systems’ sustainability. This comprehensive approach not only aids in the formulation of effective groundwater management strategies but also sheds light on the influences of climatic variability and anthropogenic activities on groundwater resources. By applying this analysis at multiple points along the river, we could compare how recharge affects TWS variations in the IND. Statistical metrics were employed to evaluate the agreement between the two datasets.
4. Results and Discussion
4.1. Analysis of TWS Changes
Figure 2 shows the long-term trends in TWS changes derived from GRACE/GRACE-FO data between April 2002 and September 2022. Figure 3 shows the same results for the GLDAS data. Generally, both datasets indicate a general increase in TWS across the entire region from 2002 to 2022, with no negative trends. Precisely, the GRACE-derived TWS trends exhibit positive values, ranging from a minimum of 4 mm/year to a maximum of 10 mm/year, indicating long-term increases in TWS. The southern part of the region (around 14° N latitude) demonstrates the most significant TWS increases, with values reaching approximately 9–10 mm/year (represented in red). In contrast, the northern areas (around 16° N latitude) experience more moderate increases, with trends of approximately 4–5 mm/year (represented in blue). The GLDAS map, however, shows more heterogeneity, with scattered patches of higher TWS increases. This could be due to surface processes such as soil moisture retention, changes in river discharge, or land surface hydrology. In fact, the GLDAS data cover a broader range (4 to 17 mm/year), showing more variations across the region. The scale again reflects positive trends, with red indicating higher values (around 16–17 mm/year) and blue representing lower values (around 4–5 mm/year). Similar to the GRACE map, the southern regions have smaller increases in TWS, while the northern parts exhibit larger increases (up to 16 mm/year in some areas). The spatial map of TWS trends is consistent with the findings of [10], in which mean TWS trends were found to range from 7 mm/year in the IND.
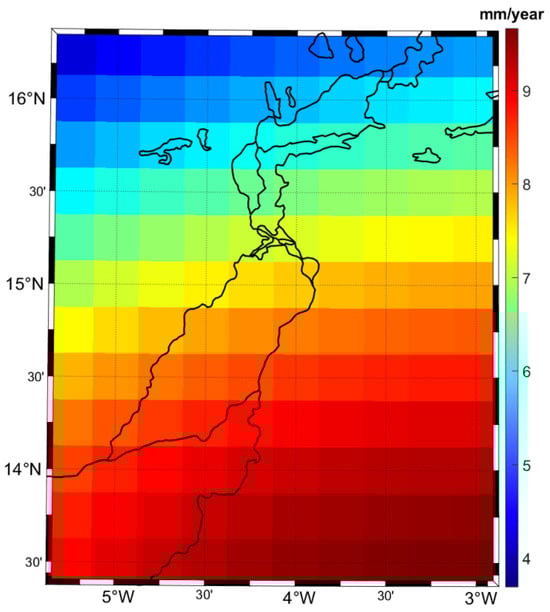
Figure 2.
Long-term trend in TWS changes derived from GRACE and GRACE/FO between April 2002 and September 2022 over Inner Niger Delta.
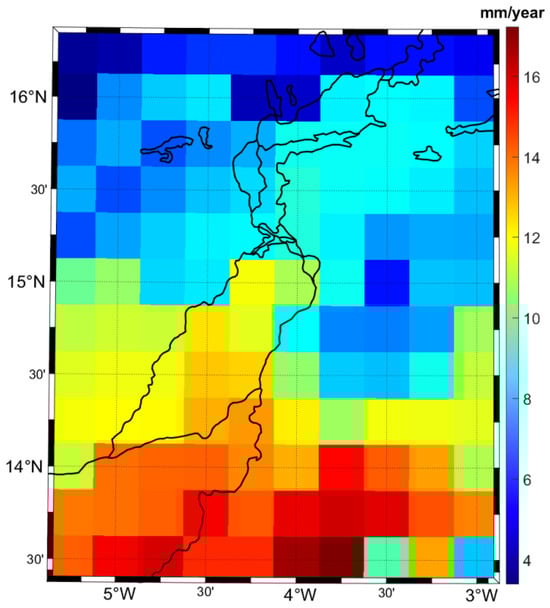
Figure 3.
Long-term trend in TWS changes derived from GLDAS between April 2002 and September 2022 over Inner Niger Delta.
Figure 4 illustrates the mean TWS variations derived from the GRACE/GRACE-FO (in blue) and GLDAS (in green) over time, covering the period from April 2002 to September 2022 (missing months of GRACE-GRACE/FO data were omitted from the analysis). Both the GRACE and GLDAS show a distinct seasonal pattern in TWS variations. Peaks typically occur during the rainy season, and troughs during the dry season, with alternating increases and decreases indicating the natural hydrological cycle of water storage, driven primarily by precipitation, evaporation, and runoff. Overall, the seasonal trends in both datasets align well, with similar peaks and troughs across the entire period. This suggests that both datasets effectively capture the general seasonal variability in TWS in the region. There are some deviations between the datasets in terms of magnitude, with the GLDAS (green) sometimes showing higher peaks and deeper troughs than the GRACE (blue), especially noticeable between 2009 and 2015 [47]. This could reflect differences in how each dataset models or measures soil moisture and groundwater components. Notably, during the 2010–2015 period, the GLDAS shows higher TWS variations values compared to the GRACE. This divergence might be due to factors such as differences in model parameterization, with the GLDAS being a land surface model, whereas the GRACE measures mass variations, primarily in groundwater and large-scale hydrological processes [48]. The deviation is also seen during 2016–2018, where GRACE data exhibit lower values, possibly influenced by a lag in water storage recovery in deeper aquifers, which may not be captured as promptly by the surface water models used in the GLDAS. Around 2017–2018, there is a gap in GRACE data, corresponding to the end of the GRACE mission and the transition to GRACE-FO. After mid-2018, the trend continues with GRACE-FO, closely matching the seasonal trends observed with the GLDAS, indicating the reliability and continuity of GRACE-FO in capturing long-term water storage trends. From 2020 onward, both datasets suggest a steady increase in TWS variations, possibly indicating a recovery phase in the region’s water storage. In 2022, both datasets show a significant increase in TWS, suggesting a possible wet season or recharge event, which could be a notable finding for water resource management. Werth et al. [10] observed similar pattern in TWS variations in the region, particularly noting an increase in amplitude during the rainy seasons. Their study reported TWS variation values ranging from −170 mm in 2003 to 170 mm in 2016, capturing significant seasonal fluctuations over the period.
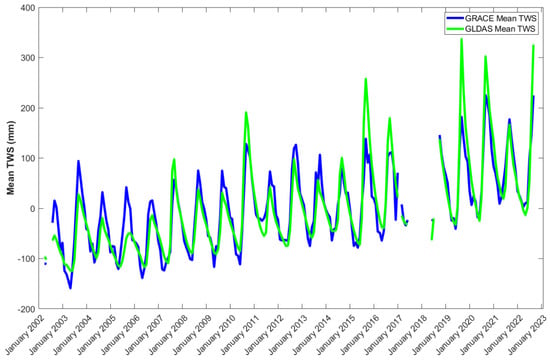
Figure 4.
Mean seasonal TWS variations over the Inner Niger Delta derived from the GRACE/GRACE-FO and GLDAS.
We calculated the RMSE and correlation coefficient between the GRACE and GLDAS mean TWS variations for the entire region. An RMSE of 35.2 mm was obtained, showing that it is relatively small considering the range of TWS variations (~300 mm in the time-series plot). Moreover, a high correlation of 0.92 (p-value < 10−4) was calculated, suggesting a strong linear relationship between the GRACE and GLDAS datasets, and meaning they both capture the same general patterns and trends in TWS variations over the study period. The extremely small p-value indicates that the correlation between the GRACE and GLDAS is highly significant, implying that the likelihood of observing such a strong correlation due to random chance is virtually zero. This further supports the robustness of the comparison, strengthening the validity of using GRACE and GLDAS data in the analysis.
Table 1 represents the timing of the maximum and minimum TWS variations derived from both the GRACE/GRACE-FO and GLDAS for the period from April 2002 to September 2022. For most years, both the GRACE/GRACE-FO and GLDAS show maximum TWS variations consistently around September. This suggests that the region experiences peak water storage during the end of the wet season, likely driven by increased precipitation and runoff. There is a noticeable consistency across the two datasets (GRACE and GLDAS) regarding the timing of maximum water storage, indicating strong agreement in the seasonal hydrological cycle. The minimum TWS variations occur between April and May for most years according to both datasets. This aligns with the end of the dry season, when water storage is at its lowest due to minimal rainfall and higher evapotranspiration. There is a slight variation between April and May for some years in both datasets, reflecting slight differences in the timing of minimum water availability between the satellite observations (GRACE) and model simulations (GLDAS), as the GRACE measures large-scale mass changes, while the GLDAS is model-driven, integrating various land surface processes. Henry et al. [49] found similar results, with the highest anomalies occurring in August, September, and October. They explained that these high anomalies were likely due to rainfall between July and September reaching the saturated zone after a short, one-month delay.

Table 1.
Months in which maximum and minimum TWS changes occurred.
4.2. Analysis of TWS Changes Across Sub-Regions
The four distinct sub-regions were defined based on geological features (Figure 5), and the time series of TWS anomalies were compared between the GRACE/GRACE-FO and GLDAS models (green for GLDAS and blue for GRACE). Figure 6 shows the temporal variations of TWS variations for these sub-regions. Figure 6 also includes wavelet analysis to study the periodicity and variability in the TWS variations for each sub-region, where the wavelet plots show how different periods (in months) contribute to the overall signal over time. The analysis of TWS variations using GRACE/GRACE-FO and GLDAS data, combined with wavelet analysis, provides a detailed view of the hydrological behavior across the four sub-regions. In each sub-region, the amplitude of TWS variations is higher during the rainy seasons, typically peaking in September for the GRACE and GLDAS, which coincides with the wet season in tropical regions. The dry season usually occurs in the months of April to June, as seen in the troughs. Both models (GRACE/GRACE-FO and GLDAS) exhibit similar overall trends, but the GLDAS tends to show higher peaks and occasionally lower troughs compared to the GRACE. This difference may be due to the fact that the GLDAS estimates TWS variations based on modeled surface and subsurface water components, while the GRACE captures actual gravitational changes associated with total water mass [50]. There is visible interannual variability in the time series, particularly with larger variations in certain years (e.g., 2007, 2011, and 2020). This variability could be related to climatic events like ENSO (El Niño Southern Oscillation), which affect rainfall patterns and thus TWS variations [47,51].
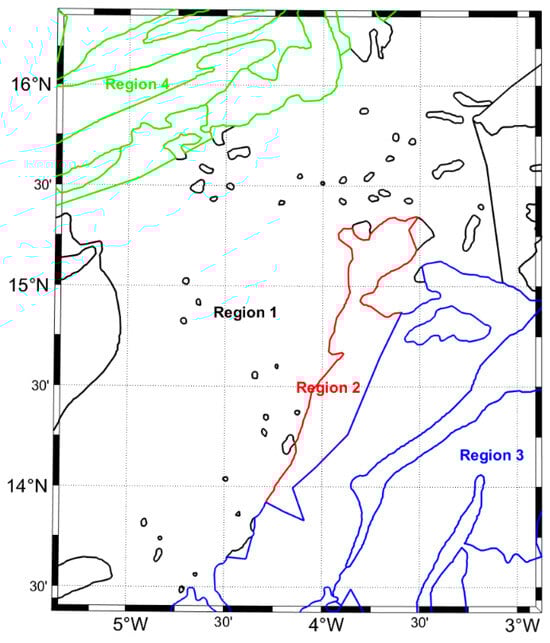
Figure 5.
The division of the Inner Niger Delta into four sub-regions based on geological features [39]. Region 1 consists of sedimentary formations from the Paleogene/Neogene periods, specifically from the Miocene to Pliocene epochs. Region 2 is dominated by quaternary alluvial formations from the Pleistocene, characterized by deposits from ancient rivers. Region 3 features more recent quaternary alluvial formations, with active sediment deposition in modern river systems. Region 4 is made up of quaternary sandy plains, with extensive sand dunes forming the primary landscape.
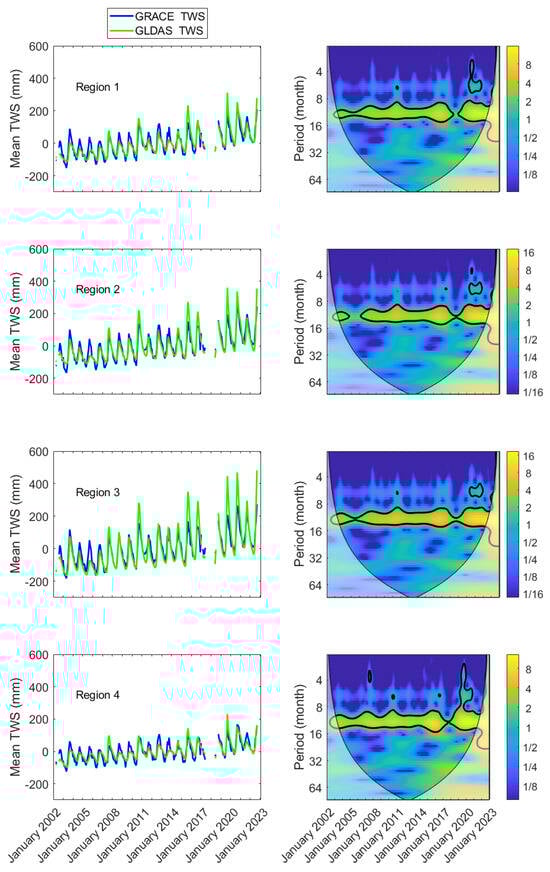
Figure 6.
Mean seasonal TWS variations in each sub-region from GRACE/GRACE-FO (blue color) and GLDAS (green color) data, along with time–frequency spectra of cross-wavelet transform between GRACE/GRACE-FO and GLDAS data.
The wavelet analysis allows us to explore the dominant periodicities in the TWS variation data for each sub-region over time. The y-axis represents the period in months, while the x-axis represents time. Warmer colors (yellow, orange) indicate higher power (dominant signals), and cooler colors (blue) indicate weaker signals. Black contours outline regions of statistically significant periodic signals, while the cone of influence (bottom shaded region) indicates areas affected by edge effects, making those regions less reliable for interpretation. There is a clear annual (12-month) periodicity in Region 1, as indicated by the consistent yellow band along the 12-month period line throughout the time series. This is typical for regions with pronounced seasonal hydrological cycles. In some periods, particularly between 2009 and 2015, there are hints of a semi-annual (6-month) periodicity, which could be related to intra-annual variability in rainfall or groundwater storage changes. While the annual signal remains strong, there is some weakening around 2017–2018, which coincides with the transition from the GRACE to GRACE-FO. This behavior is more likely attributed to the data. Similar to Region 1, Region 2 shows a strong annual signal, with a periodicity of 12 months throughout most of the time series. The 2010–2015 period shows stronger power (more intense yellow band), suggesting a period of more pronounced seasonal TWS changes, which might correlate with significant wet or dry years. The semi-annual signal (6-month period) is also visible, particularly during certain periods like 2010–2014 and around 2021. These shorter periods could reflect intermediate hydrological processes or changes in soil moisture and evapotranspiration. Region 3 also displays periodic signals around the 6-month band, particularly strong from 2012 to 2016 and again from 2019 to 2021. This could reflect intra-annual dynamics or variability in the timing of rainy seasons. The strength of the annual signal appears weaker around 2017–2018, likely due to GRACE data uncertainties at end of the mission rather than potential shifts in water availability, droughts, or changes in other hydrological components. Region 4 continues the pattern of a dominant annual periodicity (12-month period) throughout the time series. The strength of this signal is relatively stable compared to other regions. Similar to other regions, Region 4 also shows occasional semi-annual signals (6-month period), particularly in the 2009–2015 period, which might indicate intra-annual variations in soil moisture or precipitation patterns. The annual cycle in Region 4 appears less variable than in other regions, potentially reflecting more stable seasonal rainfall or groundwater processes. Hasan et al. [14] used the continuous wavelet power spectrum of the reconstructed TWS variations for the whole Niger River Basin and identified high and moderate frequency modes of variability, with sub-annual cycles ranging from 8 to 16 months. The dominant cycle observed was approximately 12 months, which aligns closely with our results for the IND.
The metrics of RMSE and Pearson correlation were calculated for the TWS variations from GRACE and GLDAS data for the four sub-regions in the previous analysis (Table 2). All four regions show high correlation values (ranging from 0.87 to 0.93), indicating that GRACE and GLDAS datasets are strongly aligned in terms of capturing the temporal variability of TWS variations in all sub-regions. The RMSE values, while reasonable, show some variations between regions, with Region 3 having the highest RMSE (54.5 mm) and Region 4 having the lowest (28.7 mm). This suggests that the performance of the GLDAS in estimating TWS variations relative to the GRACE might be region-dependent, possibly due to differences in land cover, water table dynamics, or model assumptions. Regions with a higher RMSE (e.g., Region 3) could benefit from further investigation or calibration of the GLDAS model to better align with GRACE observations. The very low p-values (<10−4) indicate that the correlations are statistically significant for all regions, meaning the relationship between GRACE and GLDAS TWS variations is strong and not due to chance.
Table 2.
RMSE and correlation between GRACE and GLDAS for mean TWS variations across each sub-region of Inner Niger Delta. All correlations are significant at 95% level (p-value < 10−4).
4.3. Relationship Between TWS and Water Budget
Water budget is estimated approximately in this study by the difference between incoming water (precipitation) and lost water (potential evapotranspiration). Figure 7 shows time-series plots of precipitation (blue) and potential evapotranspiration (orange) for the six locations shown in Figure 1b. Across all zones, there is a strong seasonality in both precipitation and potential evapotranspiration. Sharp peaks in precipitation mark the wet season, while the dry season shows minimal rainfall and relatively stable potential evapotranspiration. Precipitation exceeds potential evapotranspiration, especially for the more humid zones (humid forest and Southern Guinea Savanna), indicating a net positive water balance (P-PE > 0) in these areas and therefore significant runoff or water storage potential. The net balance remains important in the Southern and Northern Guinea savanna zones, but with lower values compared to the humid zones. These areas are likely contributing some runoff to the river, though less water surplus is available for storage compared to the humid forest. Potential evapotranspiration is much closer to precipitation when moving toward the IND. Indeed, semi-arid/Sudan Savanna and the Sahelian zones have lower rainfall (peaks around 200–300 mm/month) and higher potential evapotranspiration. The P-PE values are close to neutral, particularly in the Sahelian zone of the IND, indicating limited water availability and potential net water loss.
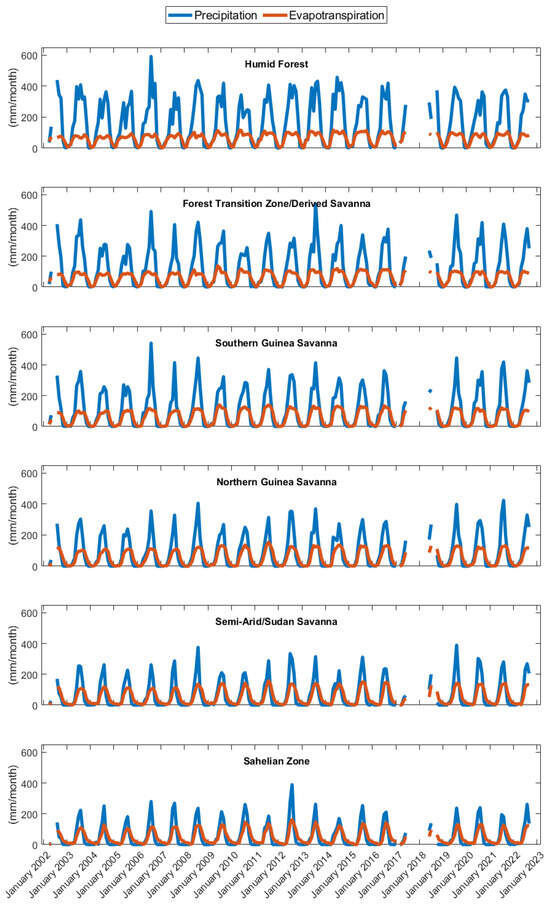
Figure 7.
Absolute precipitation and potential evapotranspiration for each location considered.
The vadose zone (unsaturated zone above the groundwater table) plays a crucial role in regulating the balance between precipitation, evapotranspiration, and TWS. In regions where P-PE > 0, excess water infiltrates the soil, contributing to temporary storage in the vadose zone before percolating into the groundwater system or generating runoff. This process is particularly relevant in humid zones, where the positive water balance suggests a substantial capacity for short-term water retention [52]. Conversely, in semi-arid and arid zones, where P-PE values are close to neutral or negative, limited infiltration occurs, and most available moisture is quickly lost through evapotranspiration, leaving the vadose zone relatively dry. These findings align with previous studies (e.g., [53]), which highlight the influence of climate gradients on water availability and storage dynamics in the Niger River Basin. While the vadose zone contributes to short-term water retention and delayed groundwater recharge, further quantification would require soil moisture observations or modeling approaches that explicitly capture its processes. Descroix et al. [53] reported similar results for the vast Niger River Basin, noting that upstream humid and savanna zones have a net positive water balance, contributing significantly to river flow, while arid regions downstream experience water deficits due to high potential evapotranspiration.
Table 3 presents a correlation analysis between P-PE and TWS extracted from GRACE/GRACE-FO data for each location area. Even if the values are low in general, we can observe statistically significant correlations for the most humid areas, i.e., humid forest, forests transition/savanna, and Guinea southern zones (Location 1 to 3). All of these are located in Guinea where the precipitation is abundant. However, from Northern Guinea Savanna up to the Sahelian ecozone (where the IND is located), the correlations between P-PE and TWS are not significant. Overall, according to the results found, the approximate water budget estimated here (P-PE) cannot fully explain TWS variations, though its contribution appears significant in areas with very high precipitation levels in Guinea. In particular, the model based on P-PE did not capture the variations in TWS in the dry savanna in Mali and in the IND, where precipitation is low and closer to potential evapotranspiration. The weak correlations indicate that additional factors (e.g., groundwater inflows, river discharge, land use, surface or subsurface water exchanges) may need to be considered to understand TWS variations [54]. These factors are often overlooked when focusing solely on P-PE balances. For instance, Cuthbert et al. [55] discussed how groundwater inflows, river discharge, and subsurface water exchanges are crucial for understanding water storage variations in semi-arid regions. Bibi et al. [12] also found that weak correlations between TWS variations and P-PE indicate that river discharge, land use changes, and subsurface interactions need to be considered, especially in regions with complex hydrological systems. Furthermore, Werth et al. [10] highlighted the role of factors beyond precipitation and potential evapotranspiration, such as groundwater contributions and human activities (e.g., irrigation and land use changes), in driving TWS variability in the Niger Basin.
Table 3.
Statistical metrics of the relationships between P-PE and TWS variations for the various locations indicated by their central latitude and longitude.
4.4. Effect of Surface Water Bodies on TWS Variations
Figure 8 illustrates surface water body variations derived from the WGHM for April 2002 to the end of 2016 across six distinct locations. The magnitude of variation differs significantly among regions. In the humid forest and Forest Transition Zone, fluctuations range within ±10 mm, indicating relatively stable water levels. The Southern Guinea Savanna shows more pronounced variations, ranging from approximately −50 mm to +150 mm, reflecting moderate seasonality. The Northern Guinea Savanna and Semi-Arid Sudan Savanna display variations between −20 mm and +40 mm, highlighting a transition toward more pronounced seasonal fluctuations. The Sahelian zone exhibits the most extreme fluctuations, with values spanning from −500 mm to +500 mm, demonstrating high sensitivity to seasonal changes. Across all locations, the data reveal an annual periodicity, with peak water levels occurring consistently during the rainy season.
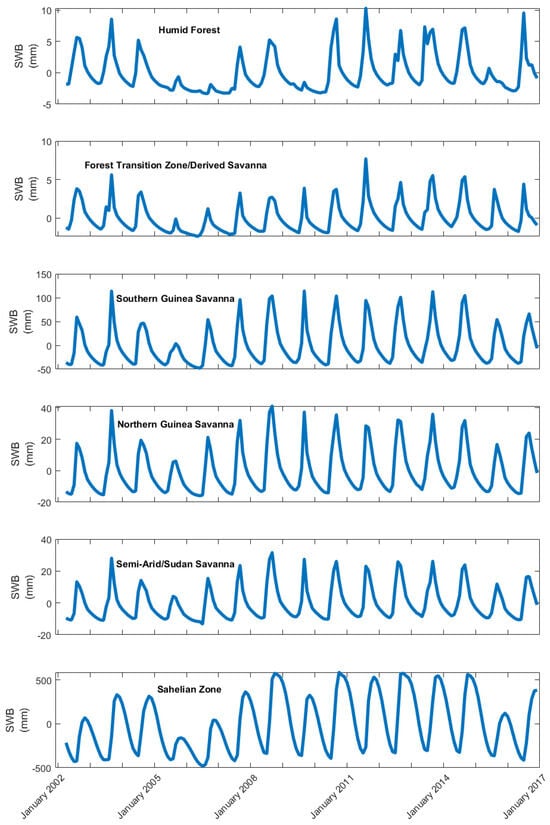
Figure 8.
Surface water body (SWB) variations derived from the WGHM for each location considered.
The figure showcases clear seasonal patterns in all six locations, with periodic rises and falls in surface water levels corresponding to wet and dry seasons. The degree of fluctuation varies by region, with humid areas experiencing minor variations and arid regions showing extreme peaks and troughs. The humid forest and Forest Transition Zone present smooth, low-amplitude cycles, indicating continuous water availability. In contrast, the Sahelian zone demonstrates large fluctuations, suggesting strong dependence on water flow during seasonal precipitation. The Guinea Savanna and Semi-Arid Sudan Savanna regions exhibit an intermediate pattern, reflecting a balanced but distinct wet and dry season cycle. Overall, the differences in surface water variations suggest the influence of regional climatic conditions, hydrological processes, and ecosystem stability.
The similarity in trends observed across all locations in Figure 8 is primarily due to the dominant influence of seasonal precipitation cycles which drive surface water body variations across different climate zones. While the magnitude of fluctuations varies, the general trend follows an annual periodicity dictated by wet and dry seasons. This pattern is expected, as all regions experience peak water levels during the rainy season and reductions during the dry season. However, the extent of these variations is controlled by local hydrological and climatic conditions. Humid areas exhibit smaller fluctuations due to sustained water availability, whereas arid regions display large variations due to their reliance on seasonal precipitation. Additionally, the hydrological connectivity of surface water bodies, such as river networks and groundwater interactions, may contribute to the observed trends [56]. This consistent seasonal response underscores the dominant role of climate-driven hydrological processes in shaping surface water storage variations across different ecological zones.
The correlation analysis between surface water variations and GRACE/GRACE-FO TWS data across the IND and surrounding regions provides further insight into the hydrological dynamics of the area. Given that the IND is located within the Sahelian region, the observed extreme fluctuations in surface water levels can be linked to its strong dependence on seasonal flooding from the Niger River. Table 4 shows the statistic results of this analysis.
Table 4.
The correlations between surface water bodies and TWS from GRACE/GRACE-FO data over the locations considered across the IND. The IND is located in the Sahelian region. Correlations at the different locations are all significant at the 95% level (p-value < 10−4).
The highest values are observed in the Southern Guinea Savanna (r = 0.69), Northern Guinea Savanna (r = 0.67), and Semi-Arid Sudan Savanna (r = 0.66), indicating that surface water variations in these regions are strongly influenced by large-scale water storage changes captured by the GRACE/GRACE-FO. These areas experience moderate to high seasonal variability in water levels, driven by both rainfall and the inflow of floodwaters from the upper Niger River Basin. The strong correlation suggests that TWS changes, which include groundwater, soil moisture, and surface water, closely follow surface water fluctuations, reinforcing the role of seasonal precipitation and hydrological storage processes in maintaining water availability.
The Sahelian zone also shows a moderate correlation with GRACE/GRACE-FO TWS (r = 0.51). This suggests that while seasonal floods significantly impact surface water levels, additional factors such as local water management practices, evapotranspiration, or groundwater interactions influence water storage dynamics. Given that the IND serves as a flood storage and groundwater recharge zone, the moderate correlation indicates a complex interaction between river discharge, aquifer recharge, and surface water retention.
In contrast, the humid forest (r = 0.39) and Forest Transition Zone (r = 0.54) exhibit lower correlations compared to the other regions. These areas receive relatively consistent rainfall throughout the year, leading to less important seasonal fluctuations in surface water levels. As a result, their water storage dynamics are less directly controlled by seasonal flooding and large-scale TWS variations, reducing their dependence on upstream Niger River flows.
These findings further emphasize the vulnerability of the Sahelian region, particularly the IND, to changes in flood magnitude and timing. Since TWS changes are closely linked to river discharge and groundwater recharge, any disruptions in the Niger River’s hydrological regime—whether from climate variability or upstream water management—could significantly impact water availability in the delta. The strong correlations in savanna and semi-arid zones indicate that these regions are particularly sensitive to changes in large-scale water storage, making them more susceptible to droughts and fluctuations in flood cycles.
Overall, the correlation analysis supports the interpretation that seasonal flooding plays a crucial role in regulating water availability across the region. The high correlations in savanna and semi-arid regions suggest a strong dependence on rainfall and water flow contributions, whereas the moderate correlation in the IND highlights the complex interplay of hydrological factors governing water storage.
4.5. Effect of Groundwater Recharge on TWS Variations
To calculate recharge rate, we first computed groundwater storage (GWS) variations (see Section 3.2). Figure 9 presents the corresponding time series from both the GRACE/GRACE-FO (blue) and GLDAS (green) across the six locations. Each region shows distinct seasonal and long-term trends in GWS, reflecting different hydrological behaviors.
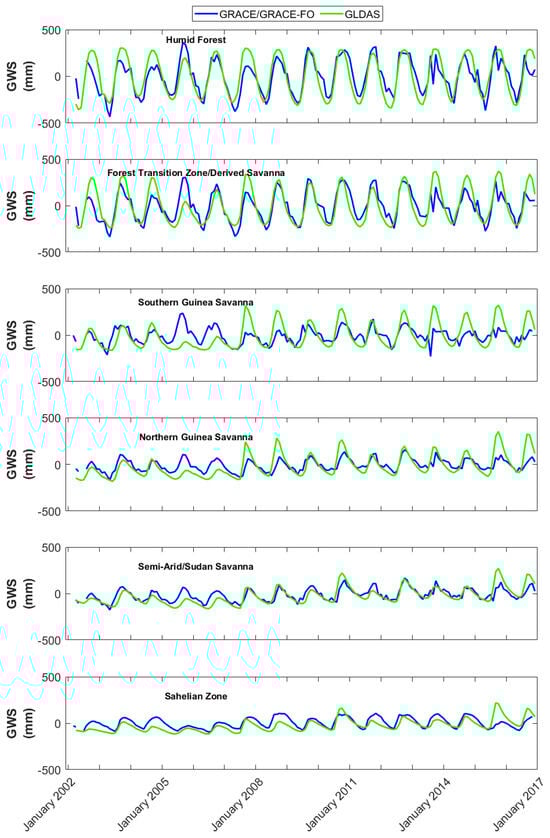
Figure 9.
Time series of groundwater storage (GWS) variations derived from GRACE/GRACE-FO and GLDAS for six different climatic zones.
In the humid forest region, the time series show consistent seasonal fluctuations in GWS with amplitudes of around ±500 mm. The GRACE/GRACE-FO generally follows the GLDAS but with a slight phase lag, indicating a delay in capturing peak seasonal changes [57]. The Forest Transition Zone/Derived Savanna show almost similar patterns, but with slightly reduced amplitudes. In the Southern Guinea Savanna zone, seasonal variations range between ±200 and ±300 mm, significantly lower than in more humid areas. The GRACE/GRACE-FO appears to underestimate the maximum storage compared to the GLDAS, particularly during high-water periods.
It is important to note that the magnitude of GWS variations decreases when moving toward the northeast climatic zones (Northern Guinea Savanna to Sahelian IND). The GRACE/GRACE-FO and GLDAS remain closely aligned in these drier regions, with only minor differences in seasonal peaks. Inside the IND, GWS variations are confined within ±100 mm, with a strong agreement between the GRACE/GRACE-FO and GLDAS.
Table 5 summarizes statistical metrics comparing GWS estimates from the GRACE/GRACE-FO and GLDAS. The Pearson correlation varies from 0.63 to 0.83 (except for the Southern Guinea Savanna zone), with highly significant p-values at the 95% confidence level. Large water dynamics in humid areas may explain the higher RMSE observed in these regions. These findings align with other regional studies, showing that the GRACE captures broader mass variations, while the GLDAS integrates surface-level changes, leading to discrepancies during periods of rapid surface water changes [55].
Table 5.
Statistical metrics of the relationships between groundwater variations (GWS) estimated from GRACE/GRACE-FO and GLDAS data over the six locations considered. Correlations at the different locations are all significant at the 95% level (p-value < 10−4).
In humid regions, such as the humid forest and humid savanna zones, groundwater experiences strong seasonal cycles due to significant rainfall, while in semi-arid and arid regions, it remains more stable due to lower recharge rates and limited water inputs [58,59,60]. Compared to the GRACE/GRACE-FO, the larger amplitudes observed with the GLDAS in humid zones further illustrate the potential influence of seasonal rainfall and land use on groundwater storage dynamics [16].
The GRACE/GRACE-FO captures large-scale hydrological processes and tends to perform well in Sahelian regions like the IND, where groundwater changes are more stable due to lower seasonal variability. In contrast, the GLDAS shows more variability in humid regions, potentially due to land surface model parameterization. These findings are consistent with observations in [57,61,62], in which similar challenges in modeling groundwater in regions with varying land use and climatic conditions are reported.
The corresponding Taylor diagram for groundwater metrics is shown in Figure 10. This figure provides a comprehensive comparison between the standard deviations, correlations, and Root Mean Square Difference (RMSD). For each of the six regions, the RMSD in the Taylor diagram is calculated as a root square by using , where is the standard deviation, is the correlation coefficient, and and are the model and reference datasets. Each point on the diagram represents a specific region, with its position reflecting the degree of agreement between the observed and modeled data, as well as the variability within the region. The correlation values are plotted along the axis of the diagram, with higher values indicating a stronger relationship between the datasets. Additionally, the groundwater standard deviation of each region is represented. Regions further from the origin display greater variability.
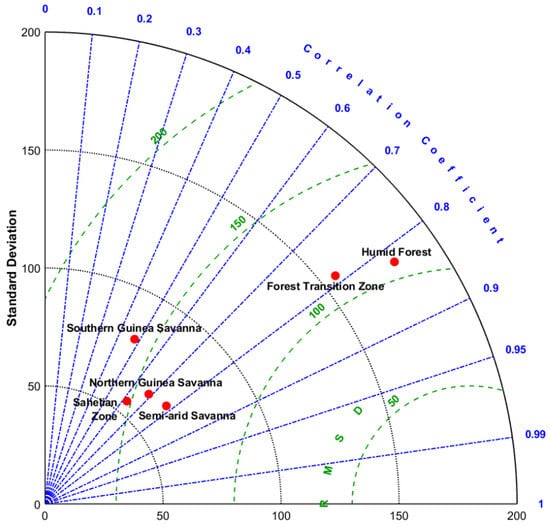
Figure 10.
A Taylor diagram showing the comparison of the standard deviations, correlation coefficients, and RMSD for the various regions: humid forest, Forest Transition Zone, Southern Guinea Savanna, Northern Guinea Savanna, Sudan Savanna, and semi-arid. Each marker represents a region, with the distance from the origin indicating the standard deviation, and the angular position indicating the correlation with the reference dataset. The RMSD values are in green dashed lines.
Figure 11 shows the groundwater recharge rate temporal variations (2002–2016) for the six locations according to the two methods used (see Section 3.2). Regions with higher precipitation like the humid forest show higher recharge rates, consistently between 400 and 600 mm/year. Scanlon et al. [63] discussed the impact of higher precipitation on recharge rates in humid regions and noted that such areas tend to have more substantial groundwater recharge, aligning with our observations of higher recharge rates in the humid forest. In contrast, the semi-arid savanna and Sahelian zone (corresponding to IND location) display much lower recharge rates, between 0 and 200 mm/year, indicating limited groundwater replenishment due to lower rainfall. Ferreira et al. [64] analyzed recharge rates in arid and semi-arid regions, noting much lower rates of groundwater replenishment due to limited rainfall, particularly in places like the Niger Basin and Sahel regions.
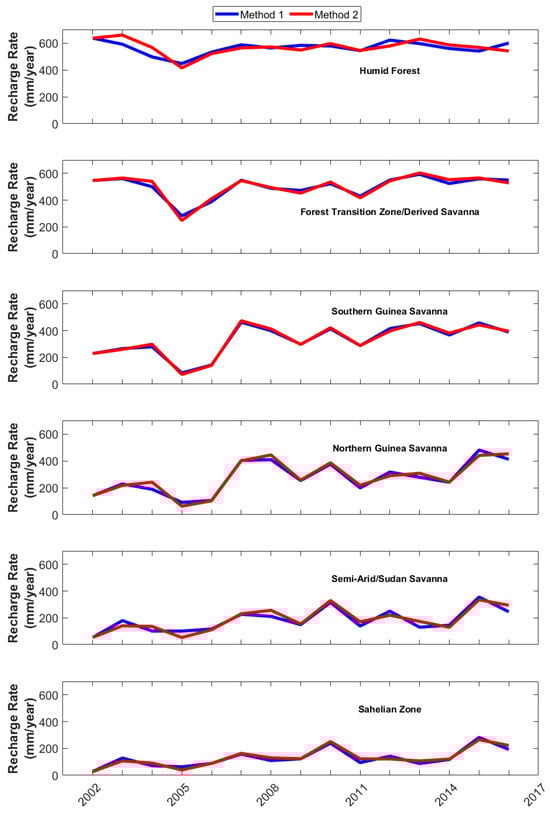
Figure 11.
Recharge rate on each pixel number over Niger River.
Methods 1 and 2 used here produce almost similar results and trends in each location, indicating consistency. However, Method 2, which accounts for ongoing discharge, tends to estimate slightly higher recharge rates in regions experiencing greater groundwater variability (e.g., Forest Transition Zone and Northern Guinea Savanna). This suggests that Method 2 may capture additional recharge dynamics due to human or environmental factors, providing a more liberal estimate of recharge. Rodell et al. [65] compared different methods for estimating recharge, noting that methods accounting for dynamic factors like groundwater discharge can lead to higher estimates of recharge in regions with fluctuating groundwater conditions. Fluctuations in recharge rates, particularly during 2008–2015, could correspond to changes in rainfall patterns, especially in the savanna and Sahelian regions, with episodes of drought in the intervals 2002–2004 and 2011–2013. Anthropogenic activities such as groundwater withdrawal could also contribute. Recharge rates in the IND appear to be relatively low. This could raise some concerns about eventual groundwater sustainability, like in other semi-arid and arid areas [66].
Table 6 shows the statistical relationship between recharge (using both Method 1 and Method 2) and GRACE TWS variations. Regardless of the method, groundwater recharge has no significant effect on TWS variations in the humid forest of Guinea, in contrast to P-PE. Likely, water components (e.g., surface water, soil moisture) other than groundwater recharge alone dominate TWS changes in this region. The recharge shows significant relationships with TWS in the other ecosystems, which become stronger as we move toward the semi-arid savanna and Sahelian zone in the IND. Indeed, the correlations vary between 0.73 and 0.86 from the Southern Guinea savanna to the IND Sahelian ecosystem. The strongest correlation is observed in the IND (r = 0.86), indicating that TWS is highly dependent on recharge, in contrast to P-PE. Method 2, which accounts for ongoing discharge, provides generally higher correlation values compared to Method 1, reflecting a more comprehensive view of recharge dynamics. This highlights the importance of considering ongoing groundwater discharge when estimating recharge, especially in semi-arid and Sahelian regions. The findings of this study are in agreement with some previous works that also underlined the critical roles of groundwater recharge in semi-arid and arid regions [67,68].
Table 6.
Correlations between groundwater recharge over locations considered and TWS GRACE data across IND. IND is located in Sahelian region.
Land use changes significantly influence groundwater recharge and storage. In regions with extensive vegetation, such as the humid forest, the process of water infiltration into the ground is enhanced by dense root systems, allowing for greater recharge to the groundwater table. On the other hand, areas that have experienced deforestation or are used for agriculture often see reduced infiltration due to the alteration in soil structure and water retention capacity, leading to decreased groundwater recharge [69]. This is particularly true in regions with higher human impact, where land cover changes accelerate runoff and limit the water that reaches the groundwater. These land use effects may contribute to discrepancies observed between the GRACE and GLDAS, especially in more humid regions, where land surface models used by the GLDAS may not fully capture the effects of land cover and vegetation change on the water balance. For instance, in semi-arid and arid regions like the Sahel, where land use is heavily influenced by farming and grazing, reduced vegetation cover may further limit groundwater recharge, making groundwater storage more stable but lower in overall magnitude [16,70].
Therefore, land use, alongside climate and hydrology, plays a critical role in determining the magnitude and timing of groundwater recharge. This highlights the importance of considering both natural and anthropogenic factors when analyzing groundwater storage and its variations across different climatic and land use zones.
5. Conclusions
The Inner Niger Delta is a region of great ecological and economic importance in the Sahel. Despite this importance, knowledge of water dynamics from the surface to deep aquifers is still very limited. This study has provided new insights into the understanding of TWS variations in the IND by analyzing the impact of climate (precipitation–potential evapotranspiration), surface water, and aquifer recharge using GRACE/GRACE-FO data over a twenty-year period. Most previous studies have relied solely on GRACE-derived TWS trends without integrating complementary datasets to distinguish surface and groundwater contributions. This study addressed some of these gaps by (i) estimating seasonal and long-term TWS variations, (ii) assessing TWS dynamics in four hydroclimatic sub-regions, (iii) examining the relationship between TWS and climatic variables (precipitation and potential evapotranspiration), and (iv) quantifying surface water contributions and groundwater recharge to TWS.
It revealed the following results:
- Monthly TWS exhibited seasonal variations from −170 mm to 330 mm, with a positive trend over the study period. Maximum TWS changes occurred in September, while minimum values were recorded in April–May.
- GRACE/GRACE-FO and GLDAS data showed a strong correlation in the IND (r = 0.92, RMSE = 35 mm), with sub-region correlations ranging from 0.87 to 0.93.
- Wavelet analysis indicated that most of the shared variance between GRACE/GRACE-FO and GLDAS TWS changes occurred at seasonal timescales of 8 to 16 months.
- The water budget (P-PE) influenced TWS variations only in humid areas near the Niger River’s source in Guinea, with no significant correlation in the semi-arid savanna and Sahelian IND regions.
- Groundwater recharge was the dominant driver of TWS changes in semi-arid and Sahelian regions, explaining 58–78% of TWS variance (r > 0.76).
- Surface water bodies significantly influenced TWS variations across the savanna areas along the Guinea–Mali border, particularly in Northern Guinea and southern Mali (r = 0.68).
While this study provides valuable insights into TWS dynamics in the IND, some limitations can be noted. The GRACE/GRACE-FO datasets have a coarse spatial resolution, which may mask localized hydrological variations. Additionally, GLDAS land surface models may not fully capture water storage changes in regions with complex hydrology. Future research should integrate high-resolution hydrological models, in situ groundwater observations, and satellite remote sensing techniques to refine these estimates.
This study enhances our understanding of TWS variability in the IND and highlights the dominant role of groundwater recharge in semi-arid and Sahelian regions. These findings have significant implications for water resource management, flood prediction, and climate adaptation strategies in the Sahel. Furthermore, the results of this study may contribute to several sustainable development goals, including clean water and sanitation (improved understanding of water storage dynamics, and resources management), climate action (impact of climate variability on water resources in the vulnerable Sahel region), and life on land (knowledge of water dynamics crucial for ecosystems, biodiversity, and livelihoods).
Future research will focus on the combined use of hydrological modeling and downscaled GRACE/GRACE-FO observations to further contribute to the improvements in water management strategies, long-term environmental sustainability, and the resilience of local communities in the Inland Niger Delta in changing climate conditions. By addressing these challenges, the research will further contribute to the achievement of the sustainable development goals.
Author Contributions
Conceptualization, F.F.; methodology, F.F.; software, F.F.; validation, F.F.; formal analysis, F.F.; writing—original draft, F.F.; writing—review and editing, F.F.; visualization, F.F.; supervision, K.G.; funding acquisition, K.G. All authors have read and agreed to the published version of the manuscript.
Funding
This research was funded by the Natural Sciences and Engineering Research Council of Canada (NSERC Discovery grants RGPIN-2018-06101, RGPIN-2024-05199, and NSERC CREATE 543360-2020); Natural Resources Canada: Contract No: 3000754155.
Data Availability Statement
The data are available from the corresponding author upon reasonable request.
Conflicts of Interest
The authors declare no conflict of interest.
References
- Tapley, B.D.; Bettadpur, S.; Watkins, M.; Reigber, C. The gravity recovery and climate experiment: Mission overview and early results. Geophys. Res. Lett. 2004, 31, L09607. [Google Scholar] [CrossRef]
- Famiglietti, J.S.; Rodell, M. Water in the balance. Science 2013, 340, 1300–1301. [Google Scholar] [CrossRef] [PubMed]
- Khorrami, B.; Ali, S.; Abadi, L.H.; Jehanzaib, M. Spatio-temporal variations in characteristics of terrestrial water storage and associated drought over different geographic regions of Türkiye. Earth Sci. Inform. 2022, 16, 717–731. [Google Scholar] [CrossRef]
- Deng, S.; Liu, S.; Mo, X. Assessment of three common methods for estimating terrestrial water storage change with three reanalysis datasets. J. Clim. 2020, 33, 511–525. [Google Scholar] [CrossRef]
- Landerer, F.W.; Swenson, S.C. Accuracy of scaled GRACE terrestrial water storage estimates. Water Resour. Res. 2012, 48, 1–11. [Google Scholar] [CrossRef]
- Fatolazadeh, F.; Goïta, K. Mapping terrestrial water storage changes in Canada using GRACE and GRACE-FO. Sci. Total Environ. 2021, 779, 146435. [Google Scholar] [CrossRef]
- Khorrami, B.; Gündüz, O. Remote sensing-based monitoring and evaluation of the basin-wise dynamics of terrestrial water and groundwater storage fluctuations. Environ. Monit. Assess. 2023, 195, 868. [Google Scholar] [CrossRef]
- Sun, Z.; Long, D.; Yang, W.; Li, X.; Pan, Y. Reconstruction of GRACE data on changes in total water storage over the global land surface and 60 basins. Water Resour. Res. 2020, 56, e2019WR026250. [Google Scholar] [CrossRef]
- Zwarts, L.; van Beukering, P.; Kone, B.; Wymenga, E. The Niger, a Lifeline: Water Management in the Inner Niger Delta in Mali; Wetlands International: Wageningen, The Netherlands, 2005. [Google Scholar]
- Werth, S.; White, D.; Bliss, D.W. GRACE detected rise of groundwater in the Sahelian Niger River basin. J. Geophys. Res. Solid Earth 2017, 122, 10459–10477. [Google Scholar] [CrossRef]
- Barbosa, S.A.; Jones, N.L.; Williams, G.P.; Mamane, B.; Begou, J.; Nelson, E.J.; Ames, D.P. Exploiting earth observations to enable groundwater modeling in the data-sparse region of Goulbi Maradi, Niger. Remote Sens. 2023, 15, 5199. [Google Scholar] [CrossRef]
- Bibi, S.; Zhu, T.; Rateb, A.; Scanlon, B.R.; Kamran, M.A.; Elnashar, A.; Bennour, A.; Li, C. Benchmarking multimodel terrestrial water storage seasonal cycle against Gravity Recovery and Climate Experiment (GRACE) observations over major global river basins. Hydrol. Earth Syst. Sci. 2024, 28, 1725–1750. [Google Scholar] [CrossRef]
- Hassan, A.; Jin, S. Water storage changes and balances in Africa observed by GRACE and hydrologic models. Geodesy Geodyn. 2016, 7, 39–49. [Google Scholar] [CrossRef]
- Hasan, E.; Tarhule, A.; Zume, J.T.; Kirstetter, P.-E. +50 years of terrestrial hydroclimatic variability in Africa’s transboundary waters. Sci. Rep. 2019, 9, 12327. [Google Scholar] [CrossRef] [PubMed]
- Hinderer, J.; Team, G.; Pfeffer, J.; Boucher, M.; Nahmani, S.; De Linage, C.; Boy, J.-P.; Genthon, P.; Seguis, L.; Favreau, G.; et al. Land water storage changes from ground and space geodesy: First results from the GHYRAF (Gravity and Hydrology in Africa) experiment. Pure Appl. Geophys. 2011, 169, 1391–1410. [Google Scholar] [CrossRef]
- Lu, Y.; Dai, L.; Yan, G.; Huo, Z.; Chen, W.; Lan, J.; Zhang, C.; Xu, Q.; Deng, S.; Chen, J. Effects of various land utilization types on groundwater at different temporal scales: A case study of Huocheng plain, Xinjiang, China. Front. Environ. Sci. 2023, 11, 1225916. [Google Scholar] [CrossRef]
- Springer, A.; Lopez, T.; Owor, M.; Frappart, F.; Stieglitz, T. The role of space-based observations for groundwater resource monitoring over Africa. Surv. Geophys. 2023, 44, 123–172. [Google Scholar] [CrossRef]
- Barbosa, S.A.; Pulla, S.T.; Williams, G.P.; Jones, N.L.; Mamane, B.; Sanchez, J.L. Evaluating groundwater storage change and recharge using GRACE data: A case study of aquifers in Niger, West Africa. Remote Sens. 2022, 14, 1532. [Google Scholar] [CrossRef]
- Cools, J.; Innocenti, D.; O’brien, S. Lessons from flood early warning systems. Environ. Sci. Policy 2016, 58, 117–122. [Google Scholar] [CrossRef]
- Klop, E.; Sikkema, M.; Diawara, M.; Gado, A. Ecological Hotspots and Land Use Patterns in the Upper Niger Basin, Guinea. Altenburg & Wymenga Ecological Consultants. Available online: https://www.altwym.nl/wp-content/uploads/2020/05/Klop-cs-2019.-Hotspots-Upper-NIger-Basin-Guinea-def.pdf (accessed on 17 May 2019).
- Oguntunde, P.G.; Abiodun, B.J. The impact of climate change on the Niger River Basin hydroclimatology, West Africa. Clim. Dyn. 2012, 40, 81–94. [Google Scholar] [CrossRef]
- Andersen, I.; Dione, O.; Jarosewich-Holder, M.; Olivry, J.C.; Golitzen, K.G. The Niger River Basin: A Vision for Sustainable Management; Water P-Notes, 16; World Bank Group: Washington, DC, USA, 2005; Available online: http://documents.worldbank.org/curated/en/446841468290737812/The-Niger-river-basin-a-vision-for-sustainable-management (accessed on 1 October 2008).
- Schuol, J.; Abbaspour, K.C.; Srinivasan, R.; Yang, H. Estimation of freshwater availability in the West African sub-continent using the SWAT hydrologic model. J. Hydrol. 2008, 352, 30–49. [Google Scholar] [CrossRef]
- Dada, O.A.; Li, G.; Qiao, L.; Asiwaju-Bello, Y.A.; Anifowose, A.Y.B. Recent Niger Delta shoreline response to Niger River hydrology: Conflict between forces of nature and humans. J. Afr. Earth Sci. 2018, 139, 222–231. [Google Scholar] [CrossRef]
- Bonkoungou, B.; Bossa, A.Y.; van der Kwast, J.; Mul, M.; Sintondji, L.O. Inner Niger Delta inundation extent (2010–2022) based on Landsat imagery and the Google Earth Engine. Remote Sens. 2024, 16, 1853. [Google Scholar] [CrossRef]
- Thompson, J.R.; Crawley, A.; Kingston, D.G. Future river flows and flood extent in the Upper Niger and Inner Niger Delta: GCM-related uncertainty using the CMIP5 ensemble. Hydrol. Sci. J. 2017, 62, 2239–2265. [Google Scholar] [CrossRef]
- Yang, J.; Yang, Y.C.E.; Khan, H.F.; Xie, H.; Ringler, C.; Ogilvie, A.; Seidou, O.; Djibo, A.G.; van Weert, F.; Tharme, R. Quantifying the sustainability of water availability for the water-food-energy-ecosystem nexus in the Niger River Basin. Earth’s Futur. 2018, 6, 1292–1310. [Google Scholar] [CrossRef]
- Nicholson, S.E. The nature of rainfall variability over Africa on time scales of decades to millenia. Glob. Planet. Change 2000, 26, 137–158. [Google Scholar] [CrossRef]
- Mahmood, R.; Jia, S.; Zhu, W. Analysis of climate variability, trends, and prediction in the most active parts of the Lake Chad basin, Africa. Sci. Rep. 2019, 9, 6317. [Google Scholar] [CrossRef]
- Kornfeld, R.P.; Arnold, B.W.; Gross, M.A.; Dahya, N.T.; Klipstein, W.M.; Gath, P.F.; Bettadpur, S. GRACE-FO: The Gravity Recovery and Climate Experiment Follow-On Mission. J. Spacecr. Rocket. 2019, 56, 931–951. [Google Scholar] [CrossRef]
- Vörösmarty, C.J.; McIntyre, P.B.; Gessner, M.O.; Dudgeon, D.; Prusevich, A.; Green, P.; Glidden, S.; Bunn, S.E.; Sullivan, C.A.; Liermann, C.R.; et al. Global threats to human water security and river biodiversity. Nature 2010, 467, 555–561. [Google Scholar] [CrossRef]
- Chen, J.; Cazenave, A.; Dahle, C.; Llovel, W.; Panet, I.; Pfeffer, J.; Moreira, L. Applications and challenges of GRACE and GRACE Follow-On satellite gravimetry. Surv. Geophys. 2022, 43, 305–345. [Google Scholar] [CrossRef]
- Fatolazadeh, F.; Eshagh, M.; Goïta, K. New spectro-spatial downscaling approach for terrestrial and groundwater storage variations estimated by GRACE models. J. Hydrol. 2022, 615, 128635. [Google Scholar] [CrossRef]
- Fatolazadeh, F.; Eshagh, M.; Goïta, K.; Wang, S. A New Spatiotemporal Estimator to Downscale GRACE Gravity Models for Terrestrial and Groundwater Storage Variations Estimation. Remote Sens. 2022, 14, 5991. [Google Scholar] [CrossRef]
- Rodell, M.; Houser, P.R.; Jambor, U.; Gottschalck, J.; Mitchell, K.; Meng, C.-J.; Arsenault, K.; Cosgrove, B.; Radakovich, J.; Bosilovich, M.; et al. The global land data assimilation system. Bull. Am. Meteorol. Soc. 2004, 85, 381–394. [Google Scholar] [CrossRef]
- Li, B.; Rodell, M.; Kumar, S.; Beaudoing, H.K.; Getirana, A.; Zaitchik, B.F.; de Goncalves, L.G.; Cossetin, C.; Bhanja, S.; Mukherjee, A.; et al. Global GRACE data assimilation for groundwater and drought monitoring: Advances and challenges. Water Resour. Res. 2019, 55, 7564–7586. [Google Scholar] [CrossRef]
- Li, B.; Beaudoing, H.; Rodell, M. GLDAS Catchment Land Surface Model L4 Daily 0.25 × 0.25 Degree GRACE-DA1 V2; Goddard Earth Sciences Data and Information Services Center (GES DISC): Greenbelt, MD, USA, 2020. [CrossRef]
- Schmied, H.M.; Cáceres, D.; Eisner, S.; Flörke, M.; Herbert, C.; Niemann, C.; Peiris, T.A.; Popat, E.; Portmann, F.T.; Reinecke, R.; et al. The global water resources and use model WaterGAP v2.2d: Model description and evaluation. Geosci. Model Dev. 2021, 14, 1037–1079. [Google Scholar] [CrossRef]
- Díaz-Alcaide, S.; Martínez-Santos, P.; Villarroya, F. A commune-level groundwater potential map for the Republic of Mali. Water 2017, 9, 839. [Google Scholar] [CrossRef]
- Onyekuru, N.A.; Marchant, R.; Touza, J.M.; Ume, C.; Chiemela, C.; Onyia, C.; Eboh, E.C.; Eze, C.C. A–Z of cost-effective adaptation strategies to the impact of climate change among crop farmers in West Africa. Environ. Dev. Sustain. 2023, 26, 20311–20332. [Google Scholar] [CrossRef]
- Biancamaria, S.; Mballo, M.; Le Moigne, P.; Pérez, J.M.S.; Espitalier-Noël, G.; Grusson, Y.; Cakir, R.; Häfliger, V.; Barathieu, F.; Trasmonte, M.; et al. Total water storage variability from GRACE mission and hydrological models for a 50,000 km2 temperate watershed: The Garonne River basin (France). J. Hydrol. Reg. Stud. 2019, 24, 100609. [Google Scholar] [CrossRef]
- Jia, Y.; Lei, H.; Yang, H.; Hu, Q. Terrestrial water storage change retrieved by GRACE and its implication in the Tibetan Plateau: Estimating areal precipitation in ungauged regions. Remote Sens. 2020, 12, 3129. [Google Scholar] [CrossRef]
- Neves, M.C.; Nunes, L.M.; Monteiro, J.P. Evaluation of GRACE data for water resource management in Iberia: A case study of groundwater storage monitoring in the Algarve region. J. Hydrol. Reg. Stud. 2020, 32, 100734. [Google Scholar] [CrossRef]
- Nimmo, J.R.; Horowitz, C.; Mitchell, L. Discrete-storm water-table fluctuation method to estimate episodic recharge. Groundwater 2014, 53, 282–292. [Google Scholar] [CrossRef]
- Wu, Q.; Si, B.; He, H.; Wu, P. Determining regional-scale groundwater recharge with GRACE and GLDAS. Remote Sens. 2019, 11, 154. [Google Scholar] [CrossRef]
- Fatolazadeh, F.; Goïta, K. Reconstructing groundwater storage variations from GRACE observations using a new Gaussian-Han-Fan (GHF) smoothing approach. J. Hydrol. 2022, 604, 127234. [Google Scholar] [CrossRef]
- Li, F.; Kusche, J.; Rietbroek, R.; Wang, Z.; Forootan, E.; Schulze, K.; Lück, C. Comparison of data-driven techniques to reconstruct (1992–2002) and predict (2017–2018) GRACE-like gridded total water storage changes using climate inputs. Water Resour. Res. 2020, 56, e2019WR026551. [Google Scholar] [CrossRef]
- Tangdamrongsub, N. Comparative analysis of global terrestrial water storage simulations: Assessing CABLE, Noah-MP, PCR-GLOBWB, and GLDAS performances during the GRACE and GRACE-FO era. Water 2023, 15, 2456. [Google Scholar] [CrossRef]
- Henry, C.; Allen, D.M.; Kirste, D. Characterizing recharge in southern Mali using a combination of modeling and stable isotopes. Front. Water 2022, 4, 778957. [Google Scholar] [CrossRef]
- Johnston, R.; Smakhtin, V. Hydrological modeling of large river basins: How much is enough? Water Resour. Manag. 2014, 28, 2695–2730. [Google Scholar] [CrossRef]
- Li, F.; Kusche, J.; Chao, N.; Wang, Z.; Löcher, A. Long-term (1979–present) total water storage anomalies over the global land derived by reconstructing GRACE data. Geophys. Res. Lett. 2021, 48, e2021GL093492. [Google Scholar] [CrossRef]
- Fatolazadeh, F.; Eshagh, M.; Goïta, K. A new approach for generating optimal GLDAS hydrological products and uncertainties. Sci. Total Environ. 2020, 730, 138932. [Google Scholar] [CrossRef]
- Descroix, L.; Mahé, G.; Lebel, T.; Favreau, G.; Galle, S.; Gautier, E.; Olivry, J.-C.; Albergel, J.; Amogu, O.; Cappelaere, B.; et al. Spatio-temporal variability of hydrological regimes around the boundaries between Sahelian and Sudanian areas of West Africa: A synthesis. J. Hydrol. 2009, 375, 90–102. [Google Scholar] [CrossRef]
- Seka, A.M.; Zhang, J.; Ayele, G.T.; Demeke, Y.G.; Han, J.; Prodhan, F.A. Spatio-temporal analysis of water storage variation and temporal correlations in the East Africa lake basins. J. Hydrol. Reg. Stud. 2022, 41, 101094. [Google Scholar] [CrossRef]
- Cuthbert, M.O.; Taylor, R.G.; Favreau, G.; Todd, M.C.; Shamsudduha, M.; Villholth, K.G.; MacDonald, A.M.; Scanlon, B.R.; Kotchoni, D.O.V.; Vouillamoz, J.-M.; et al. Observed controls on resilience of groundwater to climate variability in sub-Saharan Africa. Nature 2019, 572, 230–234. [Google Scholar] [CrossRef] [PubMed]
- Sur, K.; Verma, V.K.; Pateriya, B. Surface water estimation at regional scale using hybrid techniques in GEE environment-A case study on Punjab State of India. Remote Sens. Appl. Soc. Environ. 2021, 24, 100625. [Google Scholar] [CrossRef]
- Scanlon, B.R.; Zhang, Z.; Save, H.; Wiese, D.N.; Landerer, F.W.; Long, D.; Longuevergne, L.; Chen, J. Global evaluation of new GRACE mascon products for hydrologic applications. Water Resour. Res. 2016, 52, 9412–9429. [Google Scholar] [CrossRef]
- Pavelic, P.; Giordano, M.; Keraita, B.N.; Ramesh, V.; Rao, T. Groundwater Availability and Use in Sub-Saharan Africa: A Review of 15 Countries; International Water Management Institute (IWMI): Colombo, Sri Lanka, 2012. [Google Scholar] [CrossRef]
- Taylor, R.G.; Scanlon, B.; Döll, P.; Rodell, M.; Van Beek, R.; Wada, Y.; Longuevergne, L.; Leblanc, M.; Famiglietti, J.S.; Edmunds, M.; et al. Ground water and climate change. Nat. Clim. Change 2013, 3, 322–329. [Google Scholar] [CrossRef]
- Ramillien, G.; Frappart, F.; Seoane, L. Application of the regional water mass variations from GRACE satellite gravimetry to large-scale water management in Africa. Remote Sens. 2014, 6, 7379–7405. [Google Scholar] [CrossRef]
- Syed, T.H.; Famiglietti, J.S.; Rodell, M.; Chen, J.; Wilson, C.R. Analysis of terrestrial water storage changes from GRACE and GLDAS. Water Resour. Res. 2008, 44, W02433. [Google Scholar] [CrossRef]
- Werth, S.; Güntner, A.; Petrovic, S.; Schmidt, R. Integration of GRACE mass variations into a global hydrological model. Earth Planet. Sci. Lett. 2009, 277, 166–173. [Google Scholar] [CrossRef]
- Scanlon, B.R.; Faunt, C.C.; Longuevergne, L.; Reedy, R.C.; Alley, W.M.; McGuire, V.L.; McMahon, P.B. Groundwater depletion and sustainability of irrigation in the US High Plains and Central Valley. Proc. Natl. Acad. Sci. USA 2012, 109, 9320–9325. [Google Scholar] [CrossRef]
- Ferreira, V.G.; Yang, H.; Ndehedehe, C.; Wang, H.; Ge, Y.; Xu, J.; Xia, M.; Kalu, I.; Jing, M.; Agutu, N. Estimating groundwater recharge across Africa during 2003–2023 using GRACE-derived groundwater storage changes. J. Hydrol. Reg. Stud. 2024, 56, 102046. [Google Scholar] [CrossRef]
- Rodell, M.; Famiglietti, J.S.; Wiese, D.N.; Reager, J.T.; Beaudoing, H.K.; Landerer, F.W.; Lo, M.-H. Emerging trends in global freshwater availability. Nature 2018, 557, 651–659. [Google Scholar] [CrossRef]
- Aeschbach-Hertig, W.; Gleeson, T. Regional strategies for the accelerating global problem of groundwater depletion. Nat. Geosci. 2012, 5, 853–861. [Google Scholar] [CrossRef]
- Pazola, A.; Shamsudduha, M.; French, J.; MacDonald, A.M.; Abiye, T.; Goni, I.B.; Taylor, R.G. High-resolution long-term average groundwater recharge in Africa estimated using random forest regression and residual interpolation. Hydrol. Earth Syst. Sci. 2024, 28, 2949–2967. [Google Scholar] [CrossRef]
- Turkeltaub, T.; Bel, G. Changes in mean evapotranspiration dominate groundwater recharge in semi-arid regions. Hydrol. Earth Syst. Sci. 2024, 28, 4263–4274. [Google Scholar] [CrossRef]
- Ndehedehe, C.E.; Adeyeri, O.E.; Onojeghuo, A.O.; Ferreira, V.G.; Kalu, I.; Okwuashi, O. Understanding global groundwater-climate interactions. Sci. Total Environ. 2023, 904, 166571. [Google Scholar] [CrossRef] [PubMed]
- Deng, S.; Liu, Y.; Zhang, W. A comprehensive evaluation of GRACE-like terrestrial water storage (TWS) reconstruction products at an interannual scale during 1981–2019. Water Resour. Res. 2023, 59, e2022WR034381. [Google Scholar] [CrossRef]
Disclaimer/Publisher’s Note: The statements, opinions and data contained in all publications are solely those of the individual author(s) and contributor(s) and not of MDPI and/or the editor(s). MDPI and/or the editor(s) disclaim responsibility for any injury to people or property resulting from any ideas, methods, instructions or products referred to in the content. |
© 2025 by the authors. Licensee MDPI, Basel, Switzerland. This article is an open access article distributed under the terms and conditions of the Creative Commons Attribution (CC BY) license (https://creativecommons.org/licenses/by/4.0/).