Article

Central Valley Hydrologic Model Version 2 (CVHM2): Decision Support Tool for Groundwater and Land Subsidence Management

1
California-Great Basin Regional Office, US Bureau of Reclamation, Sacramento, CA 95826, USA
2
Berkeley National Laboratory, Berkeley, CA 94720, USA
3
California Water Science Center, US Geological Survey, Sacramento, CA 95819, USA
*
Author to whom correspondence should be addressed.
Water 2025, 17(8), 1120; https://doi.org/10.3390/w17081120
Submission received: 3 February 2025 / Revised: 8 March 2025 / Accepted: 12 March 2025 / Published: 9 April 2025

Abstract

:
The San Joaquin Valley (SJV) of California is one of the world’s most productive agricultural regions. Reliance on groundwater has led to some of the greatest rates of human-induced land subsidence in the world in the 20th century, as well as more recently. The United States Geological Survey (USGS) has recently developed an integrated surface–subsurface hydrologic model, the Central Valley Hydrologic Model 2 (CVHM2), that represents the major components of the hydrologic system of California’s Central Valley. In this study, CVHM2 was applied as a decision support tool while simulating various management strategies to mitigate the land subsidence caused by the extraction of groundwater. CVHM2 was extended through to 2073 and applied to simulate management scenarios in terms of three primary drivers and their impact on subsidence along the Delta–Mendota Canal (DMC), a critical piece of infrastructure in the western SJV. The drivers considered were agricultural water demands, managed aquifer recharge (MAR), and changes in future climate. The results show that future subsidence is most sensitive to water demands, second most sensitive to future changes in climate, and relatively insensitive to MAR when it is applied as a surface application in the western SJV. However, we demonstrate via proof-of-concept scenarios that the MAR is capable of arresting subsidence when implemented via injection below the Corcoran Clay Member of the Tulare Formation instead of as a surface application. We also examine the uncertainty that is the result of climate variability and how to use the tool to identify the most appropriate strategies to constrain future subsidence to acceptable levels.

1. Introduction

The San Joaquin Valley (SJV) of California has experienced some of the greatest rates of human-induced land subsidence in the world [1]. The development of the western SJV into a major agricultural production region in the 20th century is associated with a reliance on groundwater pumping as the primary source of the irrigation water supply. When groundwater levels drop below their historical minimum (i.e., critical head) values, the solid material of the aquifer matrix above is unable to withstand the overlying pressure and compression of the aquifer occurs until an equilibrium of forces is re-established [1]. This condition, if sustained, can lead to inelastic compaction and an irrecoverable loss of groundwater storage space. Land subsidence resulting from this compaction also causes undesirable impacts such as a loss of conveyance capacity in canals and damage to canals and other structures, as well as having negative impacts on habitats. Groundwater pumping rates in the SJV in the mid-to-late 20th century caused groundwater levels to drop below their historic lows (i.e., critical or “preconsolidated” head values, the prior minimum groundwater heads associated with historical compaction; when heads drop below this value, new compaction occurs). A recorded major impact of this circumstance was widespread land subsidence, which affected 13,468 km2 of irrigable land (one-half of the valley), with a maximum subsidence level of 9 m recorded in western Fresno County in 1977 [1]. Recent studies have shown that although there was a hiatus, the average rate of Valley-wide subsidence between December 2006 and December 2022 has more than doubled in comparison with the historical period of 1944–1968 and that the volume of subsidence in these two periods is equivalent [2]. The Central Valley Project (CVP) in the SJV was developed by the Bureau of Reclamation (Reclamation), in large part to address the impacts (including land subsidence) of the groundwater overdraft caused by the expansion of irrigated agriculture. In the 1960s, surface water deliveries from the CVP alleviated the need for groundwater extraction and, thus, it began to slow down, and in some cases reverse, the occurrence of subsidence within the SJV. However, recurring periods of drought (e.g., 1976–1977, 1987–1992, 2007–2009, 2012–2016), together with the hydrologic consequences of legal and regulatory actions related to the balancing of multiple uses of project water (e.g., ecological restoration of salmon habitats, salinity control in the Sacramento–San Joaquin Delta, flood control, and urban and agricultural demands) have led to another imbalance of supplies and demands. Imported CVP surface water is not always able to offset excess groundwater pumping which is primarily used to sustain agricultural irrigation demands. Further irrigation expansion and the introduction of higher value, more water-consumptive crops have further stressed the regional aquifers and their ability to supply irrigation water without damaging water supply infrastructure. Permanent (inelastic) land subsidence has returned as a major water resource concern in the past two decades, as climate change introduces greater climate variability and the potential for longer drought episodes [3,4].
Another highly relevant regulatory development occurred in 2014 with passage of California’s Sustainable Groundwater Management Act (SGMA) [5]. This law requires that all groundwater basins in the state identified as high or medium priority must develop and implement groundwater sustainability plans (GSPs) to achieve groundwater resource sustainability over a 20-year horizon. The basins with the highest priority were identified as Critically Overdrafted Basins [6] and were required to submit their own GSPs by 2020, thus required to achieve sustainability by 2040. The Delta–Mendota Basin was identified as 1 of the 21 basins in this category, 11 of which are in the Central Valley (all are in the SJV). Sustainability is measured by the avoidance of undesirable results across six different sustainability indicators: the chronic lowering of groundwater levels, reduction in groundwater storage, seawater intrusion, degraded water quality, land subsidence, and depletions of interconnected surface water.
Land subsidence is of particular concern to the Bureau of Reclamation because of its direct impacts on the Delta–Mendota Canal (DMC), Reclamation’s primary conveyance facility for CVP water in the SJV. Land subsidence has caused damage to the canal, including buckling, the reversal of hydraulic gradients, and a reduction in delivery capacity. The study described in this paper was undertaken to simulate the current rates of subsidence in the most northerly west-side subbasin, the Delta–Mendota subbasin (Figure 1), and to provide a decision support tool to help guide future groundwater management. Climate change is likely to lead to extreme weather events in the future, with the prospect of longer and more severe droughts that could place further stresses on the current groundwater resources in the Delta–Mendota subbasin and other subbasins in the Central Valley. The decision support tool described in this paper could be valuable in the management of other critically overdrafted groundwater basins (Figure 1). We must note that in this study we have focused on the land subsidence sustainability indicator; similar analyses could be carried out for other indicators.

2. Background

The first major study of land subsidence in the SJV was conducted by the authors of [7], who documented widespread subsidence due to groundwater overdraft that started in the mid-1920s and continued largely unabated until about 1970. The findings of this study included that (1) groundwater withdrawals for irrigation increased from 3.7 billion m3 in 1942 to 12.3 billion m3 in 1966; (2) groundwater levels declined at unprecedented rates during the 1950s and early 1960s; (3) by 1970, 13,468 km2 of the SJV had been affected by land subsidence and the maximum subsidence exceeded 9 m; (4) the total volume of subsidence in the SJV totaled 19.2 billion m3, which is equivalent to one-half of the initial storage capacity of Lake Mead; and (5) this subsidence was described as “one of the great environmental changes imposed by man”. Ref. [7] also found that the importation of surface water, beginning with the northwestern and eastern areas of SJV in the 1950s and then the western and southern areas in the late 1960s, produced rising groundwater levels that led to a stabilization of groundwater elevations in the subsiding land surfaces in problem areas by 1973. The Poland et al. report [6] contains 10–13 years of measurements of both groundwater level changes and compaction that form the physical basis for the relationship that has been established between groundwater withdrawals and land subsidence.
Ref. [1] identified three major areas of land subsidence in the SJV: (1) the Los Banos–Kettleman City area (which contains the DMC); (2) the Tulare–Wasco area in Tulare County; and (3) the Arvin–Maricopa area in Kern County. This report found that subsidence rates in the Los Banos–Kettleman City area had decreased sharply with the importation of surface water through the California Aqueduct in the late 1960s and early 1970s. However, subsidence increased again during the drought of 1976–77. Extensometer measurements recorded compactions of 0.03 to 0.1 m in 1977, and this was linked to a massive increase in groundwater extraction in the SJV (from 9.5 million acre-ft in 1974 to 13 million acre-ft in 1977) that occurred during the drought, which resulted in artesian head declines that occurred at a rate 10 to 20 times faster than those that had occurred during the first long-term groundwater extraction period that ended in the late 1960s. Ref. [1] recommended continued monitoring of land subsidence in the SJV via extensometers, water-level measurements, and periodic land surveys to avoid a reoccurrence of widespread land subsidence that could lead to a permanent reduction in groundwater storage.
A comprehensive groundwater modeling study of the western SJV, based on a detailed analysis of groundwater, was conducted by [8]. The Belitz numerical model, motivated largely by water quality concerns related to selenium in agricultural drain water, was constructed using available hydrologic data for the simulated period of 1972 to 1988. This period coincided with the establishment of the San Luis Unit of the CVP and the provision of irrigation water supply via a surface water delivery system originating in the Sacramento–San Joaquin Delta. The model covers 550 mi2 and includes the Panoche Creek alluvial fan and parts of the Little Panoche Creek and Cantua Creek alluvial fans. The sediments deposited on these alluvial fans were major selenium sources from the Coastal Range mountains and incorporated into the southern portion of the DMC—the federally owned water supply conveyance that delivers water to the Delta–Mendota subbasin. The authors of [9] used a modified version of the Belitz model [8] to simulate land subsidence in the Los Banos–Kettleman City area to generate estimates of safe groundwater yields that would avoid significant inelastic compaction (resulting in land subsidence) and could be achieved under a range of groundwater management scenarios. Ref. [9] used the Interbed Storage Package-1 (IBS1) [9] of MODFLOW [10] to add subsidence simulation capabilities to the original Belitz model, which did not have this feature. Ref. [9] devised three management alternatives that were analyzed over a thirty-year simulation period and that incorporated a probable future drought scenario. The three alternatives included maintaining current practices (as of 2001) and two alternatives that increased groundwater withdrawals. It was found that maintaining groundwater withdrawals at their existing levels virtually eliminated further land subsidence; however, the authors questioned whether this scenario would be sustainable in the long term due to the growing urban population in the SJV (with an associated increasing demand on the groundwater) and ecological reasons for reducing water supply deliveries from the Sacramento–San Joaquin Delta.
Ref. [3] assessed land subsidence along the DMC for the period of 2003–2010 via extensometer, Global Positioning System (GPS), Interferometric Synthetic Aperture Radar (InSAR), land survey, and groundwater-level data. Land surface deformation measurements indicated that the land in the vicinity of the southern reach of the DMC (Checks 15–21) subsided in concert with a larger areal subsidence feature that was centered about 15 km northeast of the canal, south of the town of El Nido. The results of the InSAR analysis indicated land subsidence near the San Joaquin River and the Eastside Bypass of more than 540 mm during 2008–10. This region was part of a 3200 square kilometer area—including the southern part of the Delta–Mendota Canal—that was affected by 20 mm or more of subsidence during the same period. Calculations made by the US Geological Survey (USGS) indicated that the rate of subsidence doubled in some areas in 2008. Independent GPS surveys that were performed in both 2008 and 2010 using InSAR confirmed these large subsidence rates. Water levels in many shallow and deep wells in this area also declined during 2007–2010. Water levels in many deep wells reached historical lows, suggesting that the land subsidence measured during this period was largely in the inelastic range that would lead to a permanent loss of aquifer storage.
Recently, ref. [2] used satellite geodetic subsidence measurements to quantify the Valley-wide subsidence volume between the years 2006 and 2022 and found a total subsidence volume of 14 km3 over the 16 years—the same volume measured during 24 years of monitoring in the historic period of subsidence the mid-20th century. Given the alarming increase in subsidence in recent years, ref. [2] notes the importance of focusing on groundwater overdraft reductions in the deeper aquifers where subsidence currently originates and on localities where subsidence impacts are the greatest.
A major advance in our modeling capabilities for land subsidence simulation was accomplished by applying the MODFLOW family of groundwater software developed by the USGS [11] to construct the Central Valley Hydrologic Model (CVHM) [12]. This model initially utilized a specialized version of the USGS MODFLOW code [13,14,15] and updated versions of CVHM used the more advanced MODFLOW One-Water Hydrologic Flow Model (MODFLOW-OWHM [16]) (Figure 2). CVHM is recognized as the most comprehensive regional-scale model representing surface water and groundwater flow in both the Sacramento and San Joaquin Valleys. CVHM took advantage of the newly acquired Geographic Information System (GIS) capabilities to assimilate and analyze hydrologic and geophysical data, which helped in the creation of texture models that improved the characterization of aquifer stratigraphy and produced more reliable estimates of aquifers’ hydraulic properties. MODFLOW-OWHM includes the “farm process” to more realistically simulate land use processes and estimate irrigation demand [15,16]. Subsidence can also be more accurately simulated in the CVHM using the SUB package [14,15]. Recently, CVHM has been updated significantly and released as Central Valley Hydrologic Model version 2 (CVHM2) [17].
Another model that is widely used for groundwater studies in California, including SGMA implementation, is C2VSIM [18] (https://data.cnra.ca.gov/dataset/c2vsimcg-v1-0, accessed on 1 February 2025), which was developed by the California Department of Water Resources (DWR). While C2VSIM does include an accounting of subsidence, it has only three layers and does not simulate all the physical aspects of subsidence mechanisms, such as separating elastic and inelastic components, transient time-delay effects due to the slow draining of clays, and aquifer matrix deformation.
The most recent version of the Central Valley Hydrologic Model, CVHM2 [17,19,20,21,22,23,24,25,26,27], uses the updated MODFLOW OWHM [28,29] and extends its historical hydrology data through 2019, as well as having added groundwater management enhancements such as the simulation of managed aquifer recharge (MAR), pumping with multi-aquifer wells, the recognition of surface and subsurface inflows from ungauged watersheds, and more customized water balance subregions that conform to Groundwater Sustainability Agency (GSA) or political water district boundaries. In this new version of the model [17], changes were made to better emulate minor streams, canal diversions, subsurface tile drainage networks, and subsidence. Subsidence is simulated in the CVHM2 using the SUB package [14], which utilizes code enhancements that simulate interbed drainage within the groundwater system and consider the elastic and inelastic components of land subsidence separately [29]. Another feature allows model grid deformation that supports a more realistic visualization of the effects of land subsidence—creating opportunities for animation of the subsidence process. Updates were also made to land use, aquifer properties, groundwater level, and land subsidence observations. The updated land subsidence observations were included in the model calibration, which also included groundwater levels, changes in groundwater levels, streamflow, and drain flow [17]. While the calibration focused on matching general trends in groundwater levels and land subsidence, a more localized focus was also included in locations with a continuous observed record; this included three subsidence locations near the southern end of the DMC for which the agreement between the simulated and observed values was very good, as shown in Figure 3 of Reference. [17]. More details regarding model calibration are available in [17]. The CVHM2 was used for the subsidence sensitivity analysis that follows and is the fundamental basis for the decision support tool that we describe.

3. Methods

The overall goal of this work was to develop a long-term planning and decision support tool for water managers to protect an essential surface water conveyance facility in an important agricultural area within the Delta–Mendota subbasin of the Central Valley of California (Figure 1). This analysis was carried out by using CVHM2 to analyze various surface and groundwater management strategies, referred to here as interventions, to reduce subsidence. Several research hypotheses have been tested in this study:
  • In this application, the CVHM2 is capable of realistically simulating various surface and groundwater management strategies such as a reduced agricultural surface water demand, managed aquifer recharge interventions (MAR), and the potential impacts of climate change.
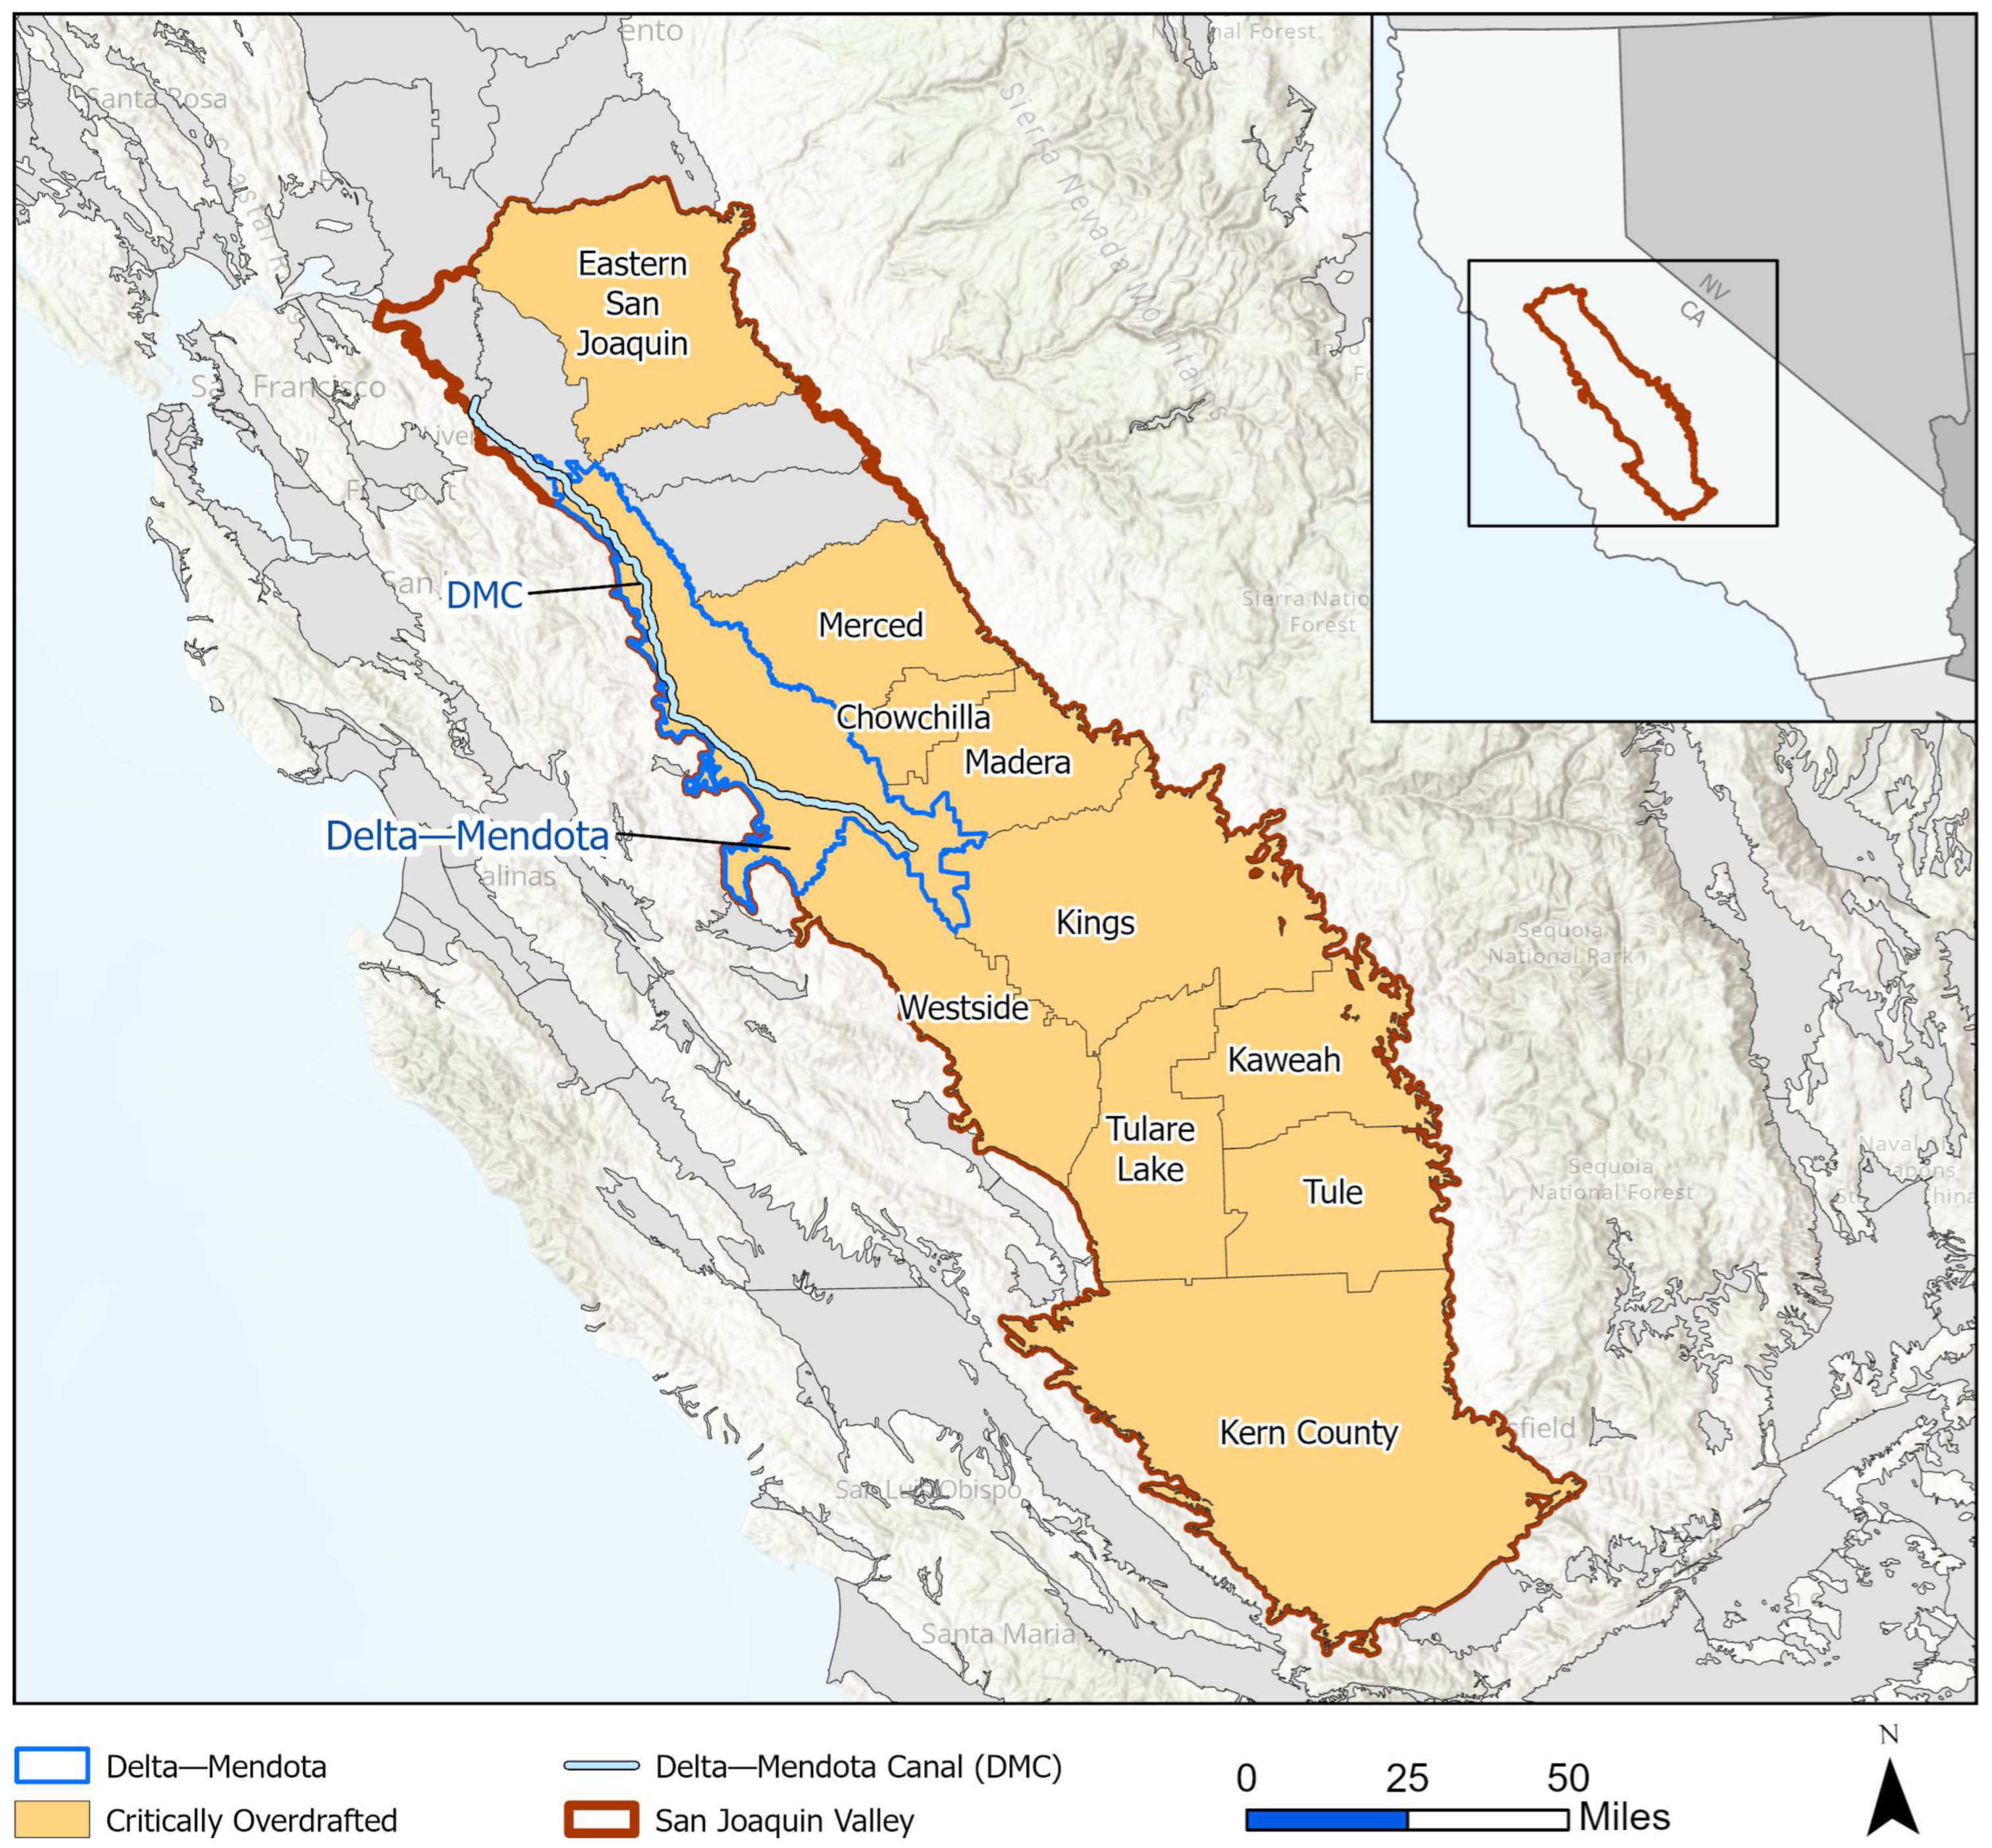
  • The updated CVHM2 provides realistic simulations of aquifer subsidence along the DMC—the primary surface water delivery conveyance for the Delta–Mendota subregion.
  • The extended CVHM2 provides appropriate results and analyses, and visualizations of these results can be used to guide water managers (including GSAs and local water districts) and landowners in their potential modification of current water-use management practices and in taking actions to mitigate the effects of potential climate-change/variability impacts and achieve groundwater sustainability.
The concept of a “no-action” alternative or baseline scenario is useful for water management studies as it creates a basis for the comparison of different potential management strategies. Developing a baseline scenario that is detailed enough to be realistic and transparent enough to be understandable can be challenging. Addressing potential climate change impacts adds another layer of complexity, as we are not just comparing no-action to different possible actions, but we are doing so without knowing the future climate with any certainty; thus, the baseline scenario assumes that the current climate extends into the future unchanged. Once the baseline is established, the relative impact of the various water management scenarios can be evaluated in terms of their impact on groundwater sustainability.
The initial attempts to create a baseline scenario with CVHM2 that approximates the baseline scenario simulated by the HydroGeoSphere San Joaquin Valley Model (HGSSJVM) [30] resulted in greater subsidence than yielded by HGSSJVM or than would be consistent with successful SGMA implementation. Several iterations were needed to ensure that the sensitivity of the scenarios to changes in agricultural demands would include demand reductions sufficient to minimize future land subsidence to 2.0 ft or less (the minimum threshold cited in the July 2024 Draft GSP for the Delta–Mendota subbasin). The scenario with the most effective subsidence reduction required the level of demands represented by the 21% reduction in agricultural demand in the HGSSJVM baseline scenario to be reduced by 50% (scenarios 1, 4, and 7). Demand reductions in the range of 50% to 75% of the initial 21% demand reduction scenario appeared to provide bookends to the level of demands that are consistent with sustainability as defined by SGMA. The complete set of scenarios is listed in Table 1; note that Scenario 3 corresponds approximately (to the degree allowed by a different model structure, input data requirements, etc.) to the baseline scenario of the HGSSJVM Technical Memorandum [30] by implementing a 21% reduction in agricultural water demands. However, to obtain equivalent CVHM2 scenarios in terms of future subsidence being constrained to 2.0 ft or less, the results suggest that this occurs somewhere in-between Scenarios 1 and 2 with respect to agricultural demands (between 50% and 75% of the 21% reduction). Thus, the baseline scenario was taken as the first scenario and represented the greatest reduction in agricultural water demands (~50% of the 21% reduction scenario), with no deviation in the climate inputs and no implementation of managed aquifer recharge (MAR). This scenario suggests that subsidence may be safely constrained within acceptable limits (which we assume to be the minimum threshold of 2.0 ft for subsidence in the Delta–Mendota July 2024 Draft GSP) through to 2073. Note that the scenarios used to find the CVHM2 baseline scenario are also included in the sensitivity analysis reported in the Results below. In this way, these scenarios were both part of the method and the results. To further explore the dependence of future subsidence on demands, three additional demand scenarios were simulated: the Current Level of Demand (LOD), 60% of baseline, and 65% of baseline. These additional scenarios were simulated to provide a better estimate of the magnitude of groundwater pumping reductions that may be required to limit land subsidence to an acceptable level.
Following [30], the DMC Subsidence Correction Project requested a more detailed sensitivity analysis of key drivers of the land subsidence process. CVHM2 was identified as the most appropriate modeling tool, based on its rigorous simulation of subsidence (e.g., including the time delay due to the drainage of clay beds) not found in other models available for the region, to perform this sensitivity and uncertainty analysis. The CVHM2 baseline scenario ran from April 1961 to September 2019 using historic observed data and was extrapolated for an additional 58 years to allow a long-term simulation of projected future conditions. The natural hydrology of these future years was determined by reversing the annual hydrology from prior years: for example, future WY1 (2020) uses historical WY2019, future WY2 (2021) uses historical WY2018, future WY3 (2022) uses historical WY2017, etc., until WY58 (2077), which uses historical WY1962 data. This approach was chosen to represent the natural variability in hydrology and allow for the matching of land use processes with commonly defined water year (WY) types. For land use processes that vary by year, such as surface water deliveries, representative recent year data from the historical time series were used to simulate future years with a similar hydrologic year type; as follows:
  • Future critical years used WY2008;
  • Future below-normal years used WY2009;
  • Future dry years used WY2012;
  • Future above-normal years used WY2010;
  • Future wet years used WY2011.
Once the CVHM2 baseline scenario was established, groundwater pumping mitigation, represented by MAR, and climate change were used as perturbations of the hydrologic record, while future agricultural water demands, as a factor applied to historical crop water demands, were developed and analyzed. Sensitivity analyses probed the sensitivity of land subsidence along the DMC (within the area of the 1-square-mile model cells containing the canal) for three different drivers, with two representing potential interventions to reduce subsidence and one the impact of future climate variability: (1) MAR, which is used as a mitigation measure as it adds groundwater recharge; (2) changes in projected agricultural water demands, which conceptually can be thought of as resulting from land use changes, crop selection and agricultural policy incentive programs promoting water conservation, improvements in irrigation efficiency, and, as a last resort, agricultural land retirement; and (3) changes in future precipitation due to climate variability. We should note that changes in evapotranspiration resulting from future climate variability were not considered, and evapotranspiration drives irrigation demand in future warming scenarios; thus, we only considered the impact of the climate on the irrigation supply, and not on demand. Therefore, our estimates of the reductions in groundwater extraction needed are conservative. In the projected agricultural water demand portion of these scenarios, we reduced crop acreages by a fixed percentage across all crop types to achieve lower levels of demand.
To explore the sensitivity of subsidence to the main interventions considered in this analysis, three factors representing the interventions considered in each scenario were used to capture a range of projected conditions while holding the other two intervention scenarios constant. Reductions in agricultural water demands showed the greatest sensitivity, followed by climate parameters. As simulated, land subsidence showed minimal sensitivity to permutations of the MAR intervention, but other techniques for implementing the MAR intervention may lead to a greater response and warrant further study (as will be demonstrated via a proof-of-concept scenario presented in The Potential of MAR section below).
To simulate the potential long-term impacts of changes in agricultural irrigation water requirements, the land use factors were scaled to represent a range of conditions. As previously noted, these changes can result from changes in land use, crop selection, and improvements in crop drought tolerance, as well as from government policy that can incentivize land retirement and improve irrigation efficiency and agricultural drainage reuse. Permutations of land use changes were expressed in relation to the original baseline demands and were produced within the range of 50 to 100% of the original baseline demand values. Because many locations within the Delta–Mendota subregion utilize both surface water and groundwater to meet their irrigation water demands, the CVHM2 algorithms assume that irrigation water supply demands are first met with available surface water before pumping is initiated from the underlying groundwater resources [28,29]. The scaling of water demand is not always linear in terms of its impact on groundwater pumping. A small reduction in agricultural irrigation demand can occasionally result in an even greater percentage reduction or even a complete cessation of groundwater pumping.
To represent the MAR intervention in CVHM2, the recharge was scaled to simulate the increase in annual recharge volumes produced by MAR. These MAR interventions were applied only in the San Luis Delta–Mendota Water Authority (SLDMWA) service within the Delta–Mendota subbasin—along the major canals and other locations with access to surface water. The range of MAR mitigation measures represented in this set of scenarios includes a No MAR and increased recharge volumes of 81.8 million m3/year and 204 million m3/year. MAR is only feasible if there is sufficient runoff or streamflow that can be diverted into surface conveyances and lands willing and suitable to accept this excess surface water. Hence, the actual MAR potential may be substantially lower than the volume of the flood flow or excess surface return flow. While other regions within the Central Valley are considered to have significant MAR potential, the Delta–Mendota subbasin is perennially water-short and there is a considerable amount of surface and drainage water reuse already practiced within this subarea.
To represent changes in hydrology due to climate change, the precipitation was scaled globally in the CVHM2, which has the effect of changing the portion of agricultural crop and vegetation demand that is met by rainfall, and hence the volumes of recharge and runoff due to rainfall, simulated by the model. For this set of scenarios, three different potential future hydrology conditions were created: the baseline hydrology; a dry hydrology, for which precipitation was assumed to be 50% of the baseline; and a wet hydrology, for which precipitation was assumed to be 50% greater than the baseline. It is important to note that no secondary effects were simulated, such as a change in stream inflows, small watershed inflows, or potential adjustments to surface water deliveries. This simple approach does not fully capture the potential increase in frequency of extreme events, but it captures a range of first-order effects of future climate variability on hydrology. In other words, by following this approach of considering a wide range of potential future precipitation magnitudes, we capture the likely range of climate impacts on the water supply, as expressed through precipitation. Consideration of a more explicit representation of extreme events (both droughts and floods) via the incorporation of ensemble Global Circulation Model (GCM) outputs is a topic for future work.

4. Results

4.1. Sensitivity Analysis

The baseline scenario that was formulated in this study represents an optimistic scenario in which SGMA is successful in achieving sustainable groundwater through decreasing agricultural water demands. We also explored the potential for the implementation of mitigation through MAR to contribute to the achievement of SGMA sustainability goals. However, we found that the surface application of MAR water was unlikely to provide a significant contribution. We demonstrate later in this paper, through a proof-of-concept scenario, that MAR accomplished via the direct injection of water to the sediment layers of the aquifer beneath the Corcoran Clay member of the Tulare Formation may be able to have significant beneficial impacts for groundwater sustainability. However, since the feasibility of implementing this approach still needs to be demonstrated, the contribution of any type of MAR was not included in the baseline scenario. The baseline scenario reported in this study was adapted from a previous study performed with the HydroGeoSphere San Joaquin Valley Model (HGSSJVM) [31], in which it was assumed that ramping down groundwater pumping by 21% from 2020 to 2040 would achieve SGMA sustainability. The results from the HGSSJVM projections were documented in a Technical Memorandum [30]. In HGSSJVM, groundwater pumping was specified explicitly, whereas, in CVHM2, groundwater pumping was solved for based on surface water deliveries and agricultural water demands. To adapt the pumping reduction to the baseline scenarios used by CVHM2, we ramped down the agricultural water demands by 21% between 2020 and 2040. The results presented in Table 2 and Table 3 and Figures 4 and 5 below show that the simulations of the extension of CVHM2 exhibited a high degree of sensitivity to agricultural water demands and effectively no sensitivity to MAR. This finding suggests that as simulated (i.e., as a surface application), MAR does not address the primary drivers of aquifer subsidence.
The CVHM2 sensitivity scenarios exhibit expected behavior in two of the three types of interventions, with a decrease in agricultural groundwater demand and with an increase in precipitation resulting in increased aquifer recharge and lower agricultural demands, resulting in decreased annual land subsidence. As previously noted, land subsidence rates did not appear to be sensitive to the MAR intervention simulated in this study. Simulations show that subsidence is most sensitive to changes in agricultural demands and secondly to changes in regional hydrology. As implemented and simulated, irrigation demand management appears to be the most important intervention for limiting land subsidence along the major reaches of the DMC. The diminished sensitivity to regional hydrology in part reflects the uncertainty inherent in modeling future changes in climate. The insensitivity to MAR interventions shows that as implemented and simulated, this intervention is insufficient by itself to fully mitigate land subsidence. Further study could help to fully assess the various MAR implementation strategies that could be used to potentially mitigate land subsidence, especially if greater volumes of recharge water can be made available to the most severely impacted areas or if other means of application can be utilized.
The CVHM2 simulations provide subsidence projections that vary in both space (laterally and vertically) and time. The spatial variations in these projections are due to the spatial variability in aquifer properties and stresses such as groundwater extraction and regional hydrology. One way these stresses are manifested is in the rate and amount of elastic and inelastic compaction, where prolonged periods of stresses resulting in heads below previous low heads are more likely to be associated with irrecoverable inelastic compaction and a long-term reduction in aquifer storage [32]. The projected subsidence values were reported as cumulative annual subsidence both in terms of the maximum value along the canal and the spatial average along the canal. The agencies responsible for (a) maintaining the DMC and funding necessary repairs and (b) complying with SGMA can benefit from a decision support tool such as CVHM2 that can provide estimates of the impacts of alternative management scenarios. For the greatest utility to such agencies, it is important to report subsidence rates in familiar terms so that these rates of subsidence can be compared directly to prior canal bank surveys performed during prolonged drought periods when negative impacts requiring costly repairs were identified. Table 2 and Table 3 present cumulative land subsidence projections for the years 2035, 2040, and 2073 in each scenario. These cumulative subsidence projections were tracked from 2020 and are output at 1/3 mile intervals along the DMC. Table 2 presents the spatial average (i.e., the average of all 1/3 mile locations) of cumulative subsidence for the years 2035, 2040, and 2073. Table 3 shows the maximum cumulative subsidence value along the canal in each scenario for the years 2035, 2040, and 2073. These values represent the maximum land subsidence simulated for any location along the DMC (note that Scenarios 1–9 utilize the baseline hydrology, 10–18 utilize a dry hydrology sequence, and 19–27 represent periods of wet hydrology).
The analysis of Table 2 and Table 3 suggests that for the projected cumulative land subsidence to remain below 2 feet by the year 2073, irrigation demand reductions of between 50 and 75% of the HGSSJVM baseline irrigation demands [30] would be necessary. The values presented in Table 2 and Table 3 are depicted graphically in Figure 3 and Figure 4, respectively.

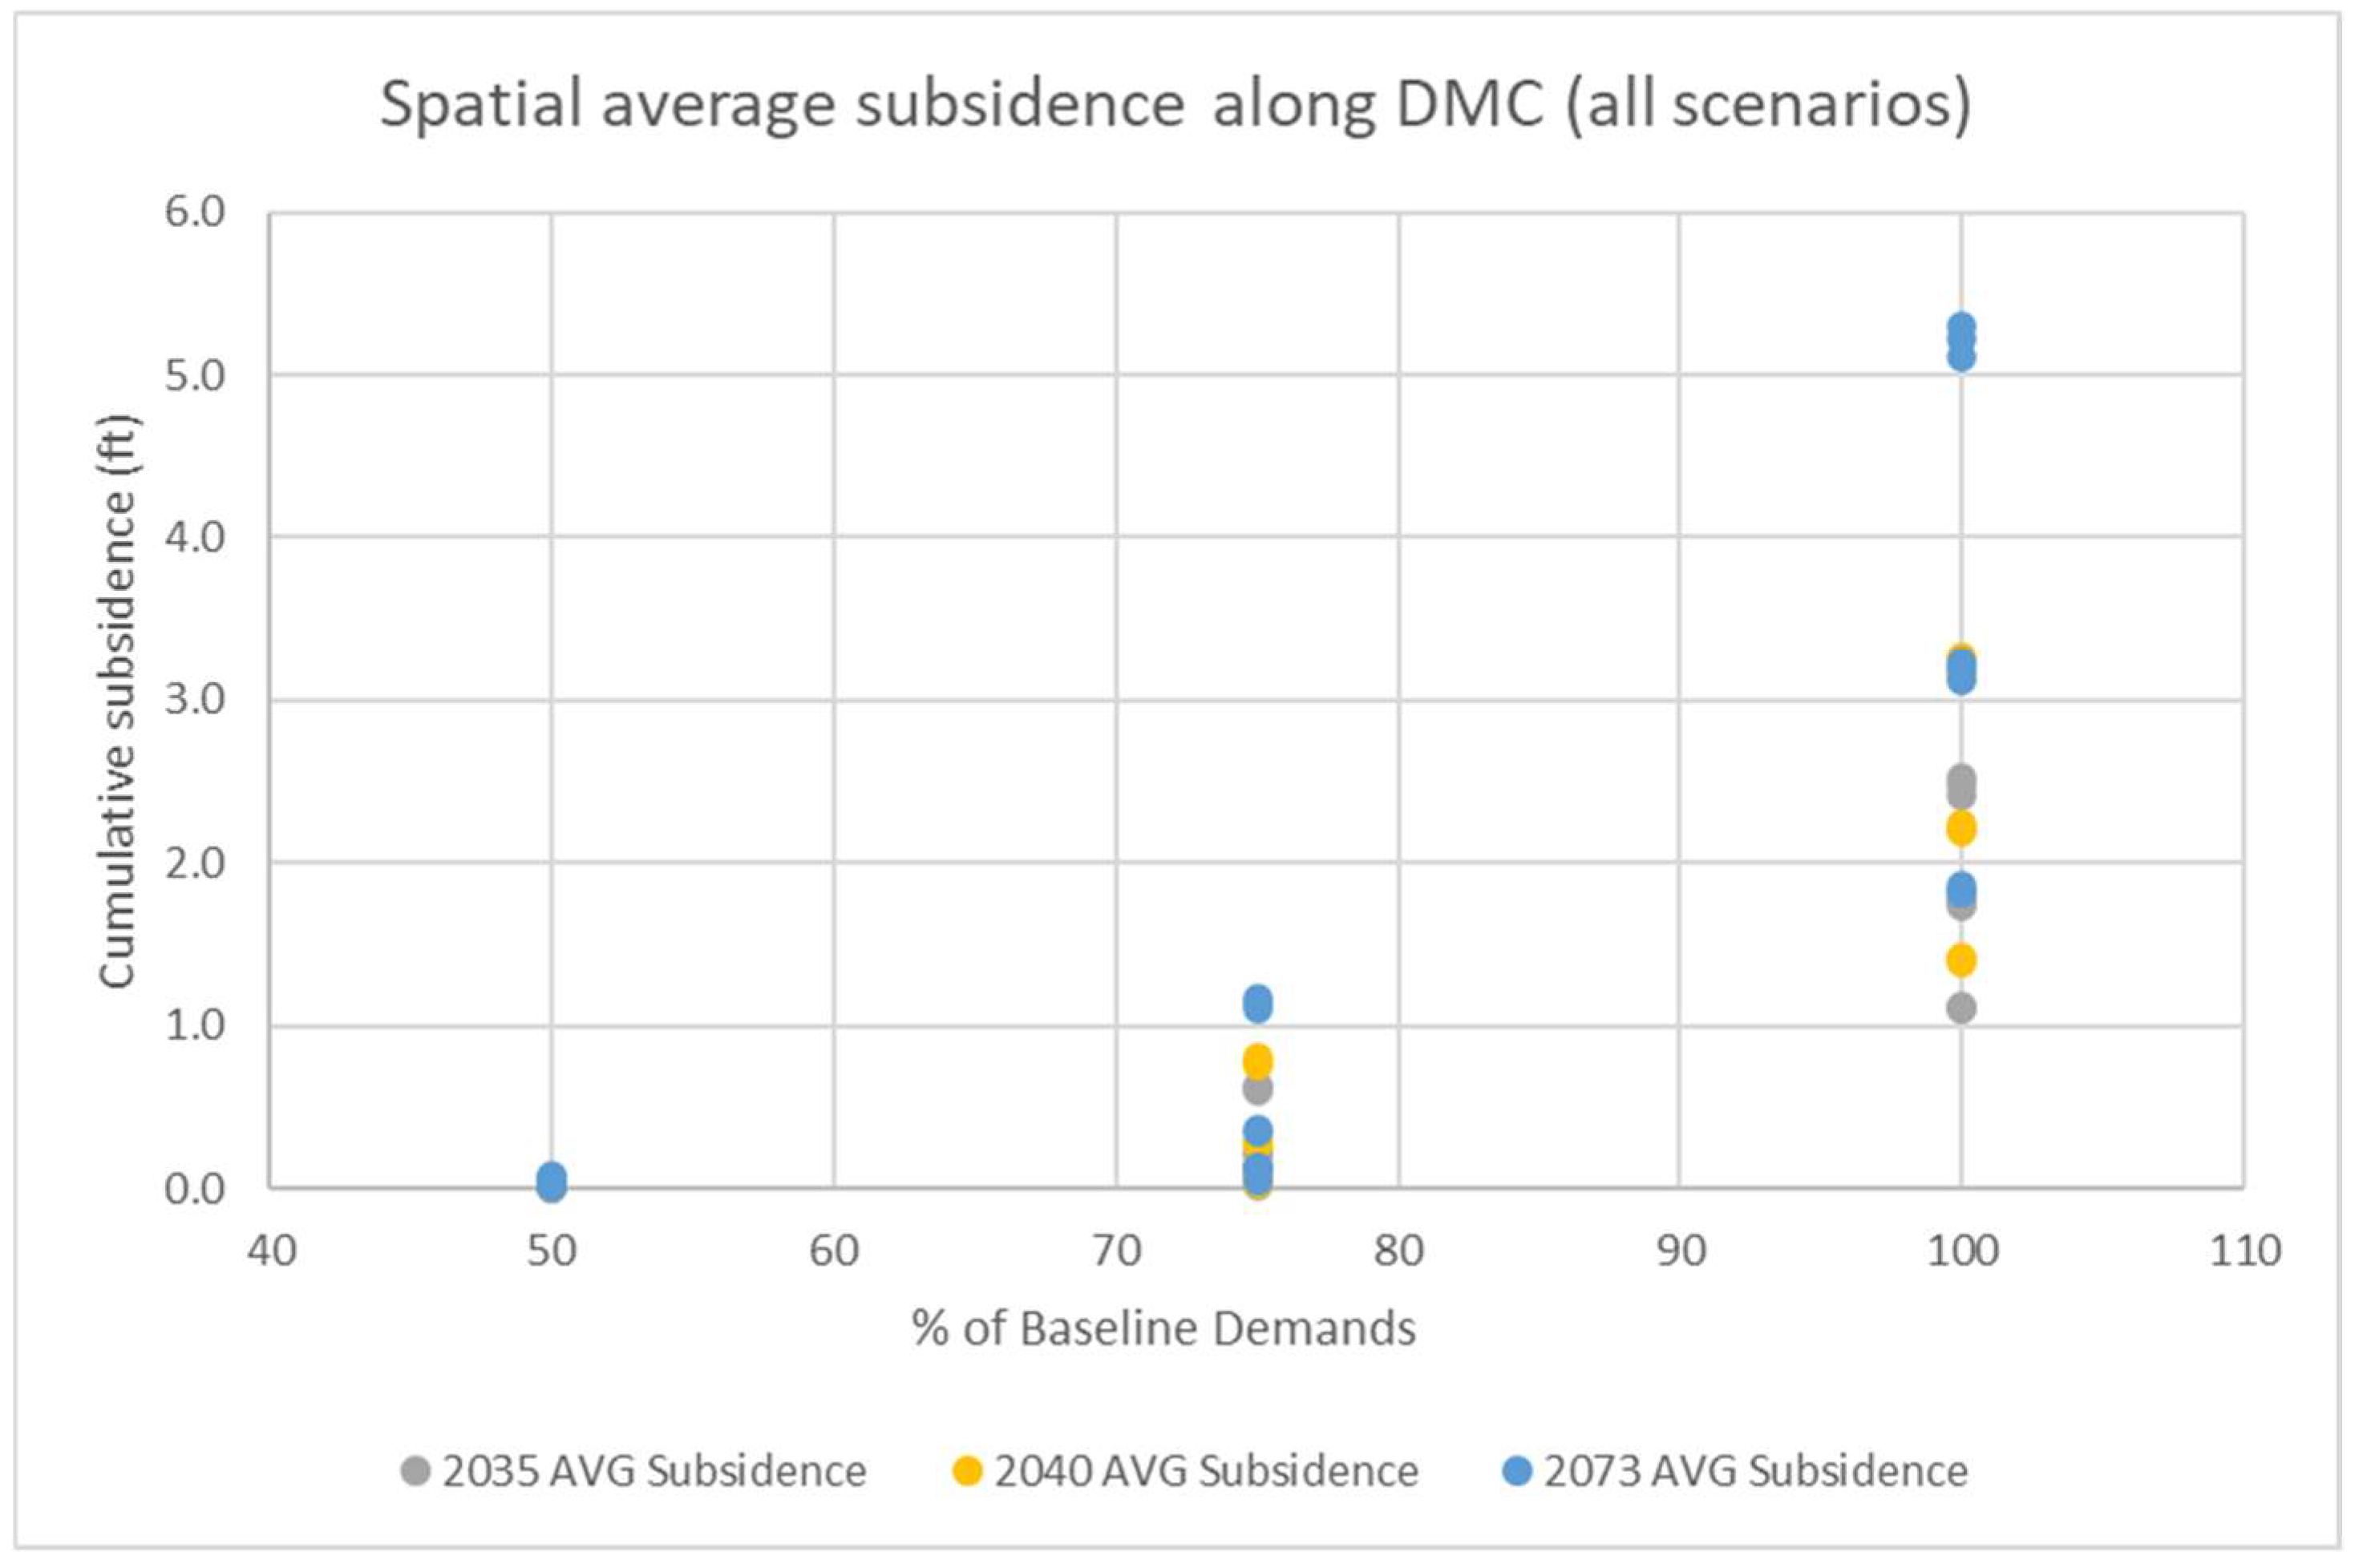
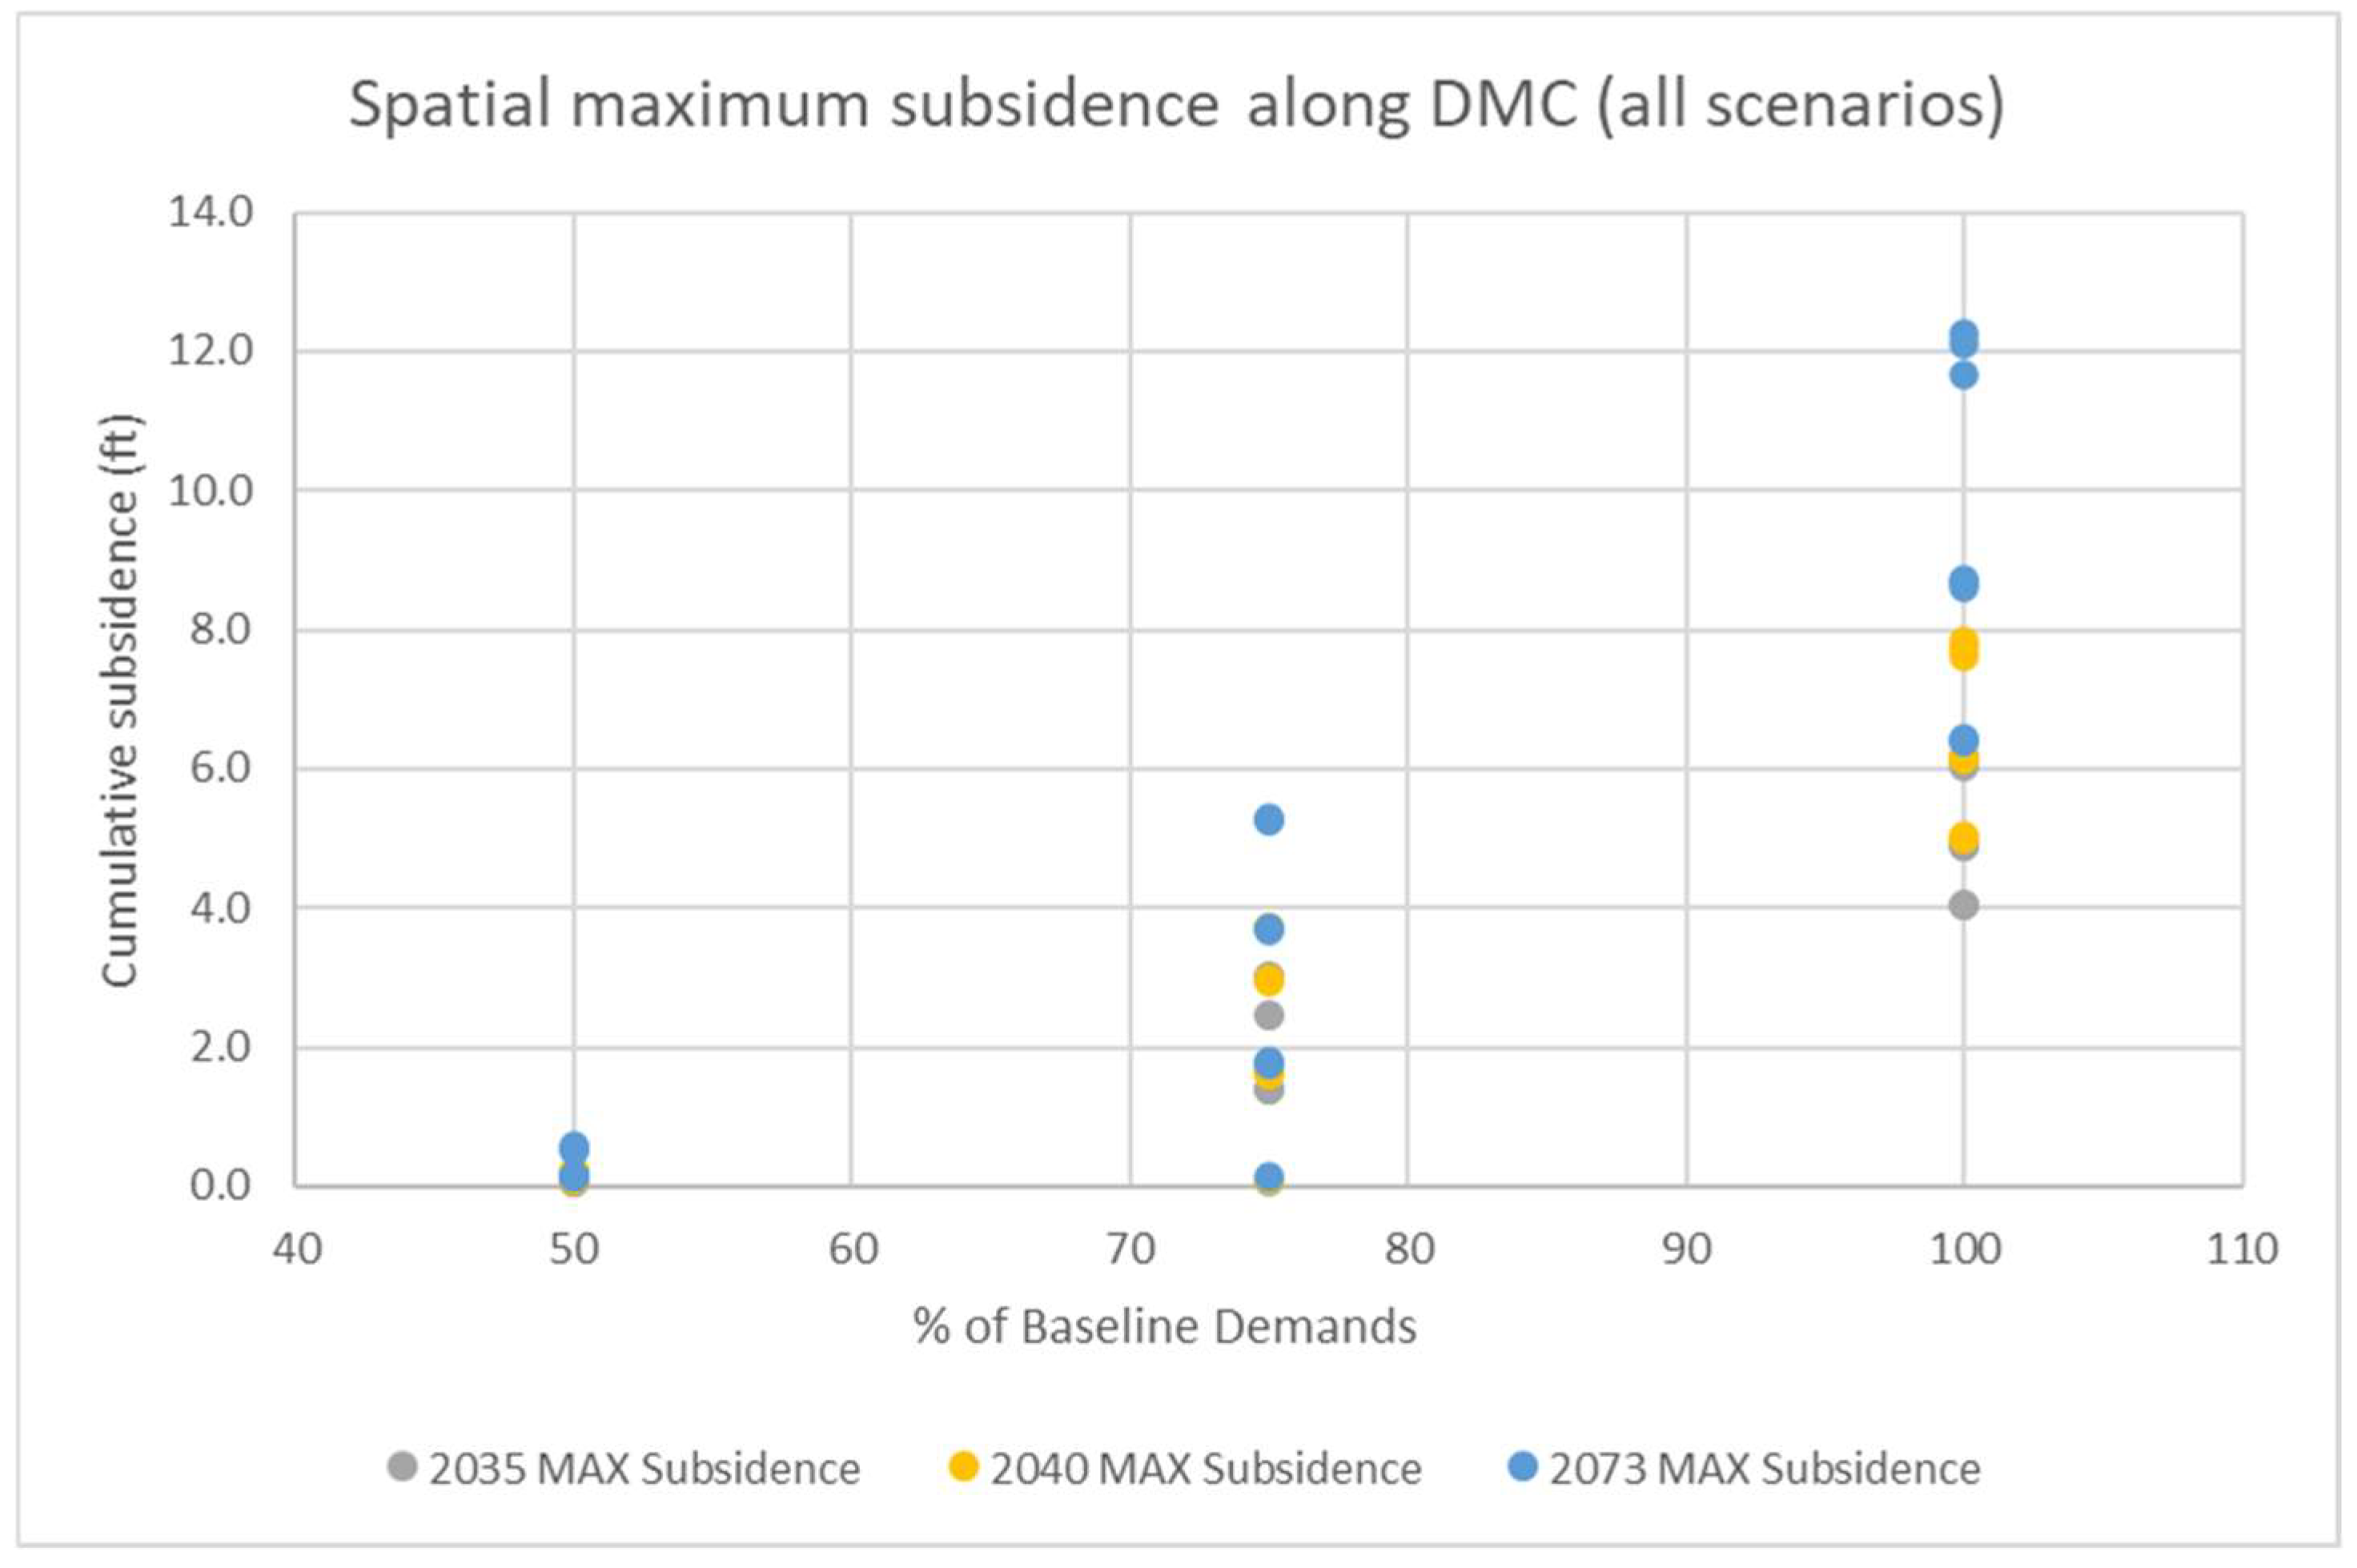
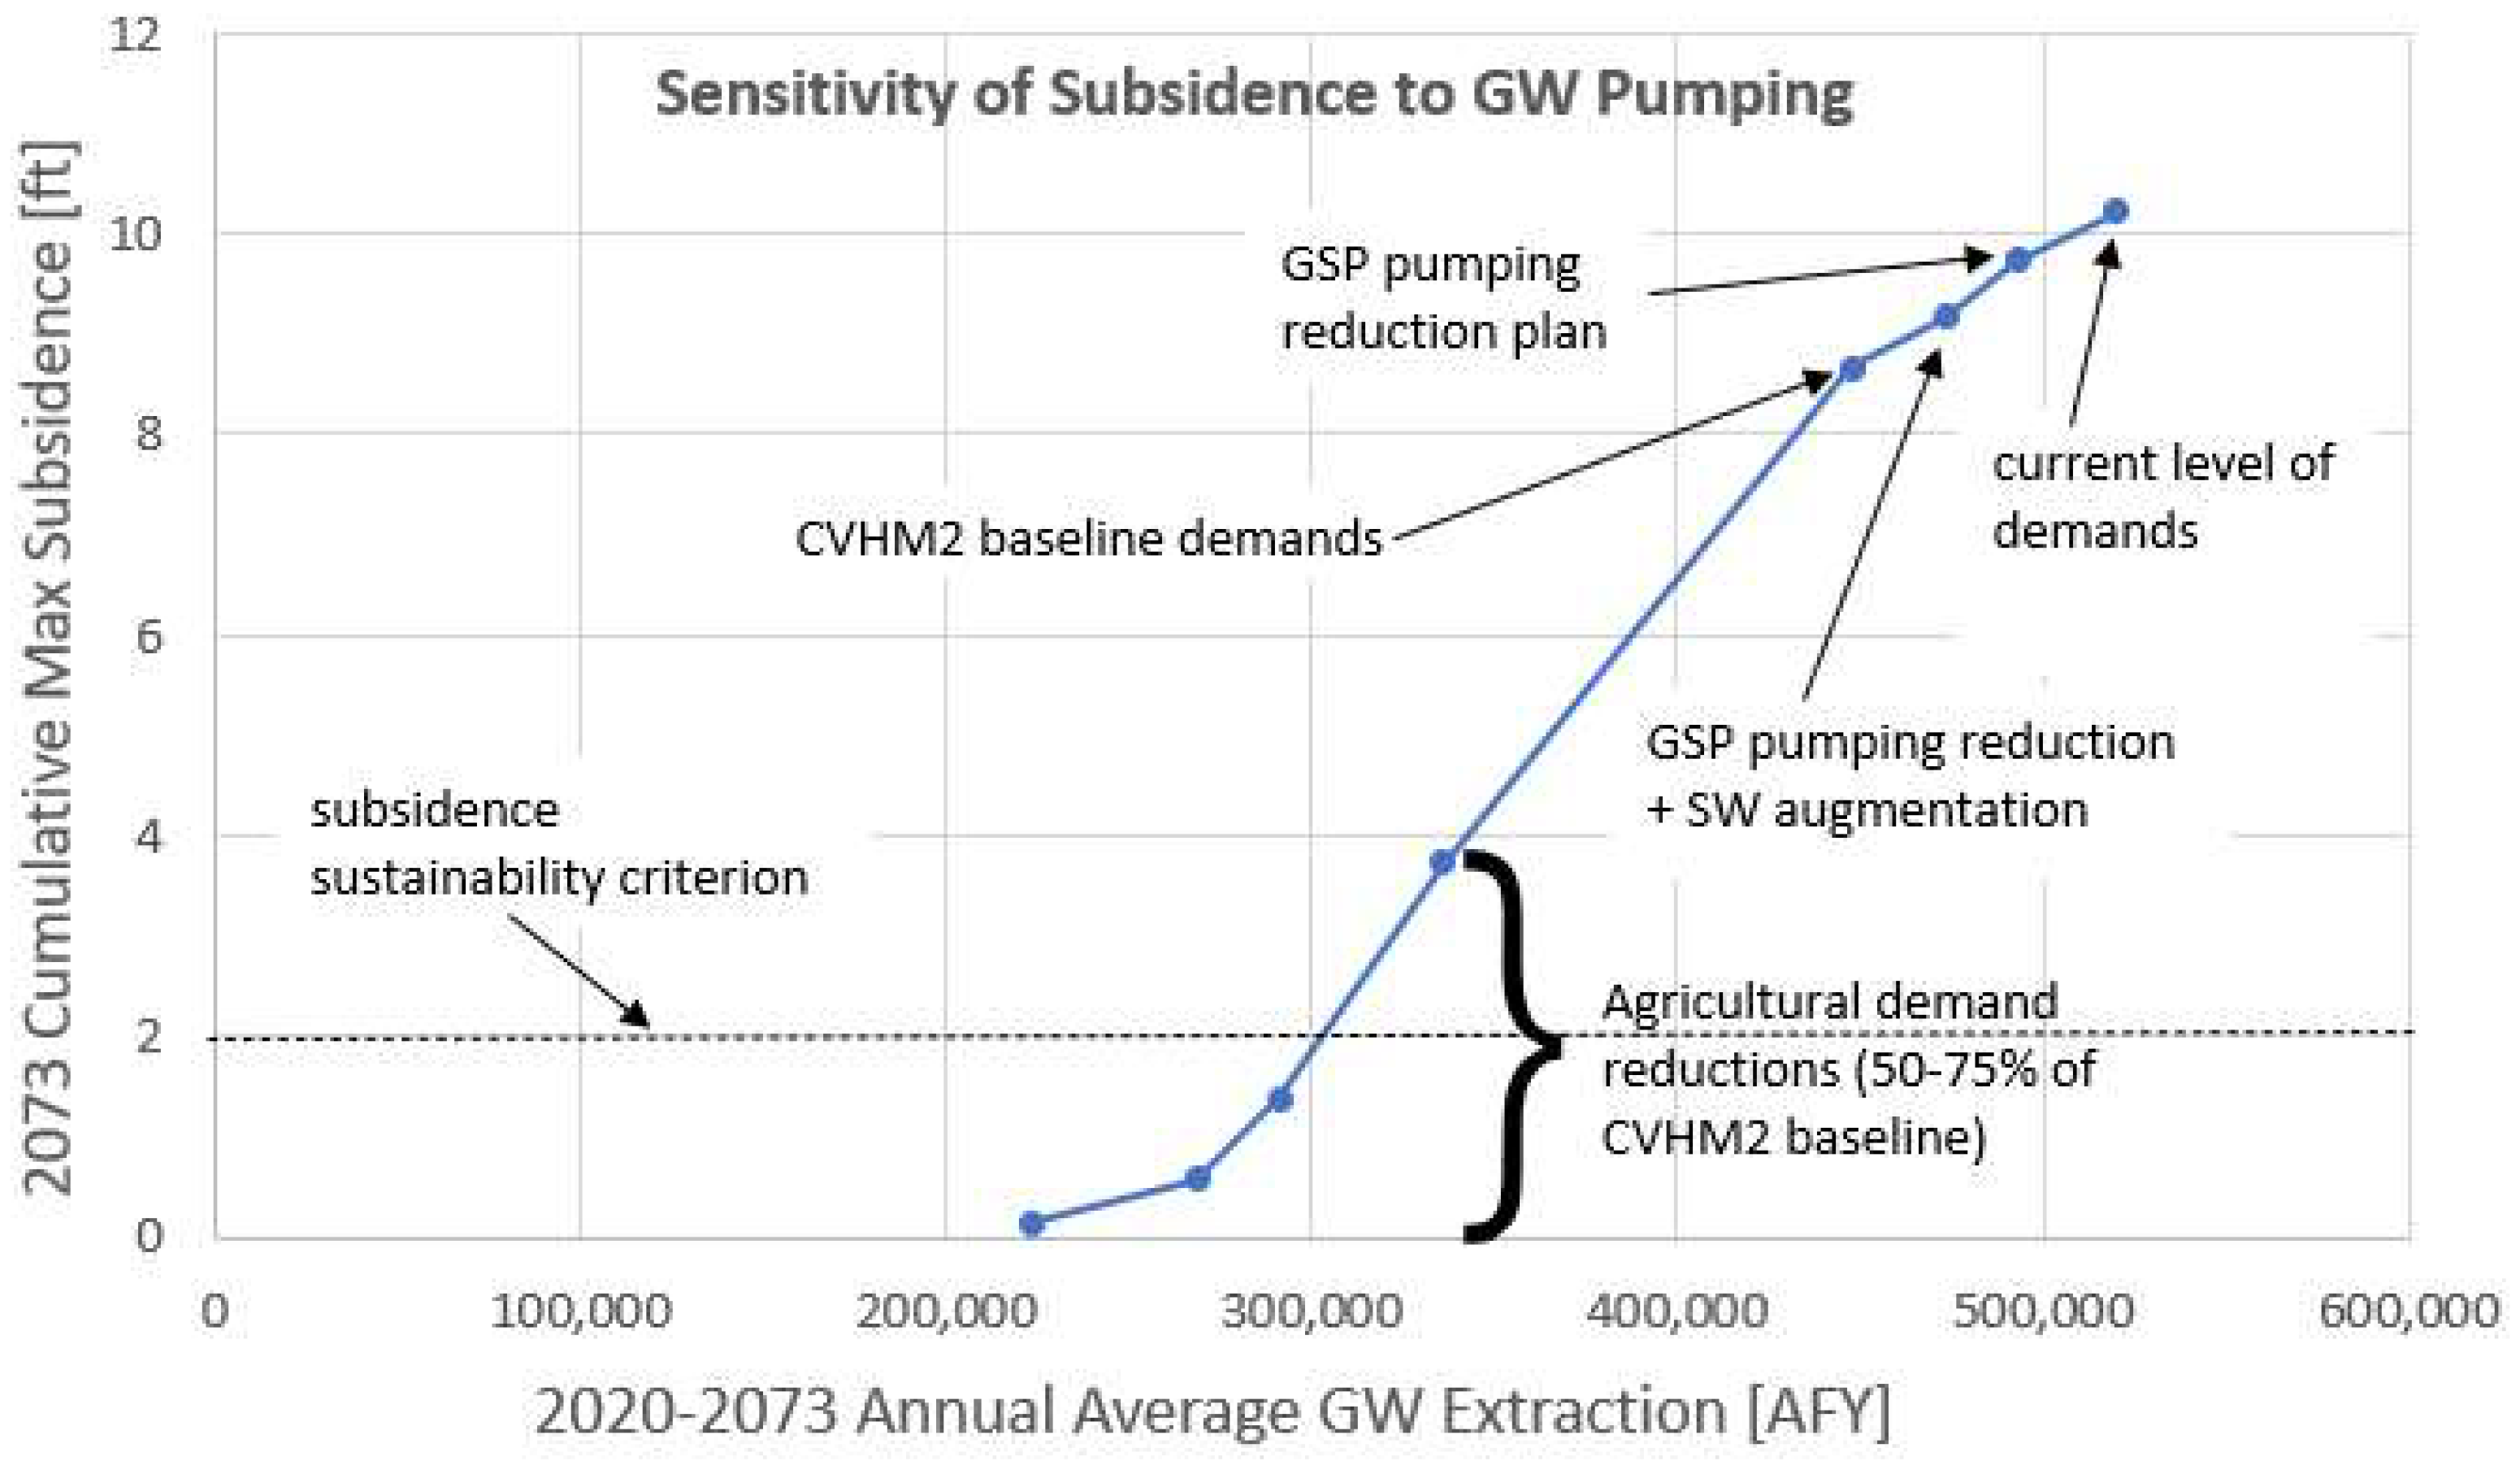
4.2. Future Subsidence as a Function of Groundwater Extraction

To demonstrate the utility of CVHM2 as a tool for evaluating groundwater management strategies, the June 2024 Public Review Draft of the Delta-Mendota Subbasin GSP that was recently released by the Delta–Mendota subbasin GSAs [33] was evaluated [34]. A review was conducted of the GSP’s planned actions that was presented in a Draft TM [33] to the DMC Subsidence Corrections Project. The Delta–Mendota GSP includes projects and management actions (P/MAs) that are planned to meet the sustainability goals of SGMA and that address known water table, groundwater storage, subsidence, and water quality problems in the basin. These P/MAs include a combination of groundwater pumping reduction and surface water augmentation projects (note that MAR projects are lumped into the surface water augmentation group). To evaluate the potential efficacy of the P/MAs presented in the June Public Draft GSP by the Delta–Mendota GSAs, two scenarios were simulated: (a) a groundwater pumping reduction of 42,000 AFY and (b) a groundwater pumping reduction of 42,000 AFY plus 125,000 AFY of water supply augmentation. The CVHM2 was set up to allow additional surface water supply to be considered without having to specify a source for this additional water supply. The demand for groundwater pumping for irrigation is typically calculated by the model based on specified crops and their agricultural water needs, basin hydrology, and the available project and non-project surface water supply. Therefore, to approximate the necessary groundwater pumping reductions, CVHM2 had to be run iteratively to converge on the desired volume of annual groundwater pumping reductions. Rather than actively reducing agricultural irrigation water demands, we achieved these reductions by setting constraints on the maximum pumping volumes allowed within the four different zones of the Delta–Mendota subbasin, for which the GSP specifies target reductions (see Figure 5 for a map of the zones). The top half of Table 4 shows the GSP-specified groundwater pumping reductions per zone and per upper and lower aquifers. The upper and lower aquifer reductions are summed in the right-hand column, while the zone reductions are summed below the four different zone totals. The bottom half of Figure 5 shows the approximations used for the groundwater pumping reductions in the CVHM2 simulations. The totals summed over all four zones and both upper and lower aquifers yield a total of 42,010 AFY for the GSP target reductions compared to 57,832 AFY for the CVHM2-simulated reductions. The analysis presented is thus conservative, given that the reduction simulated in all cases exceeded these minimum reduction levels.
Table 4. GSP pumping reduction plan and its approximation by CVHM2.
P/MA ZoneGSP Pumping Reduction from Upper Aquifer [AFY]GSP Pumping Reduction from Lower Aquifer [AFY]GSP Pumping Reduction Lower + Upper [AFY]
1279828865683
2461931397758
380390239826
4130317,44018,743
Total Basin952332,48842,010
P/MA ZoneCVHM2 Pumping Reduction from Upper Aquifer [AFY]CVHM2 Pumping Reduction from Lower Aquifer [AFY]CVHM2 Pumping Reduction Lower + Upper [AFY]
112,247358515,833
2450537168221
3204411,08013,124
4101719,63720,654
Total Basin19,81338,01857,832
Figure 5. Map of zones in the Delta–Mendota subbasin. Map of zones in the Delta-Mendota subbasin. The sum of these four zones constitute the entire Delta-Mendota subbasin as shown in Figure 1. These four zones were defined in [33] and used to allocate pumping reductions under the June 2024 Draft Delta-Mendota Groundwater Sustainability Plan (GSP).
Water 17 01120 g005
To compare the results of the CVHM2 representations of the GSP P/MAs with those of the other scenarios simulated in our sensitivity analysis, the maximum subsidence predicted by the CVHM2 for the period from 2020 to 2073 has been plotted in Figure 6 against the average annual volume of acre-ft extracted in the subbasin. By “maximum subsidence”, we are referring to the maximum value of subsidence simulated along the length of the DMC (which is typically represented by fixed mileposts that correspond to the location of control structures, as shown in the graphs in Appendix A). Two GSP action scenarios were compared to the CVHM2 baseline, and an additional scenario was presented that represents the Current Level of Demand (LOD). Further reductions in groundwater extraction ranging from 50% to 75% of the baseline demand were also plotted (Figure 6). The Current LOD represents a greater level of pumping than the CVHM2 baseline. The two GSP scenarios lie the between Current LOD and CVHM2 baseline in terms of groundwater pumping levels. Additionally, the dashed line at 2 feet of subsidence is included to represent what we consider to be the “subsidence sustainability criterion”. This criterion is based on the Delta–Mendota Draft GSP [33], which specifies a maximum subsidence of 2 feet between 2020 and 2040 as its minimum threshold (i.e., the minimum level of sustainability that must be achieved for subsidence in the terminology of SGMA), followed by 0.0 ft of subsidence after 2020. As such, any scenario in which the subsidence between 2020 and 2073 is greater than 2 ft represents a scenario in which sustainability in terms of subsidence is not achieved.
As shown in Figure 6, there appears to be an approximate linear relationship between land subsidence along the DMC and the total volume of groundwater extracted. These results suggest that in the absence of any effective MAR projects, the maximum annual volume of groundwater extraction that is permissible to minimize subsidence to 2 ft or less by 2073 should be on the order of 300,000 AFY or less (compared to the nearly 500,000 AFY that would be expected under the GSPs). There are many uncertainties in this analysis—the results presented are model-based approximations. However, these results do strongly suggest that the pumping reductions called for by the GSPs are likely inadequate. As mentioned previously, reductions in groundwater extraction can be achieved by either demand reduction or by surface water supply augmentation (where additional supply exists or can be safely captured and stored during flood events). There is not necessarily a one-to-one correspondence between reduced groundwater pumping and a reduction in agricultural irrigation water demand. Inefficiencies in water conveyance, irrigation applications, and groundwater responses are factors affecting this association. Another uncertainty is the extent to which MAR has an impact on addressing subsidence locally, since much of current subsidence occurs at depth and is associated with the drainage of aquitards and clay lenses that are deeper in the ground and were not involved in earlier subsidence events recorded in the 1960s and 1970s. It is also important to note that a recent study notes the importance of focusing on groundwater overdraft reductions in the deeper aquifers where subsidence originates and in localities where subsidence impacts are greatest [2]. In Section 4.4, we further address this question of uncertainty and provide a proof-of-concept scenario to demonstrate the potential benefits of MAR and the ability of CVHM2 to simulate targeted MAR strategies.

4.3. The Potential of MAR to Mitigate Subsidence

In [30], the MAR scenarios simulated relied on the seepage of water diverted from existing conveyances and applied to the land surface. The representation of MAR simulated by the application of large volumes of surface water showed no appreciable impact on land subsidence. In our post-processing of the results, we found that a substantial fraction of the water applied for the purpose of MAR in these simulations became return flows to streams and drains and failed to relieve stresses in the deep groundwater aquifers and aquitards responsible for land subsidence along the DMC. To test the capability of MAR to reduce land subsidence along the DMC, we carried out two proof-of-concept simulations in which, rather than applying the MAR-augmented water supply to the surface, we injected water into the clay layers of selected cells in Zones 1 and 2 of the Delta–Mendota subbasin (see Figure 5 for a map of the zones). In the first scenario, we injected 1000 acre-ft per month into an appropriate model layer within each selected model cell. In the second scenario, we injected 10,000 acre-ft per month into the model layer and within the same model cells. The total predicted land subsidence by the end of the simulation period in 2073 was plotted for these scenarios and compared to the CVHM2 baseline (Figure 7). In this plot, the cumulative subsidence from 2020 to 2073 is plotted against mileposts that typically correspond to the location of control structures along the canal. These mileposts increase as one travels from north to south along the canal. In these proof-of-concept scenarios, the injected MAR water has a dramatic effect on the resulting subsidence. We did not change the demand from the Current Level of Demand for these scenarios, nor did we put any additional constraints on groundwater pumping. Hence, this proof-of-concept exercise helps to confirm the validity of the CVHM2 and shows that MAR can, in theory, if applied in a manner that circumvents hydraulic barriers to downward transmission in the groundwater system, contain land subsidence without any further reductions in groundwater pumping. Making this scenario effective would require deep well injection rather than surface water ponding, which is more typical of MAR applications, and it may not be economically feasible or technically achievable. For example, if aquifer properties are not favorable in the desired injection area or if clogging of the injection well occurs, it may not be possible to inject the desired volume of water. Nonetheless, the finding of our proof-of-concept MAR injection scenarios does suggest that a wider and more comprehensive examination of feasible MAR technologies and cost–benefit analyses would be desirable. While MAR alone, as currently conceived, cannot be expected to provide adequate constraints on future land subsidence along the DMC, it may have unrealized additional potential to mitigate future potential land subsidence.

4.4. Comparison with Recent Subsidence Measurements
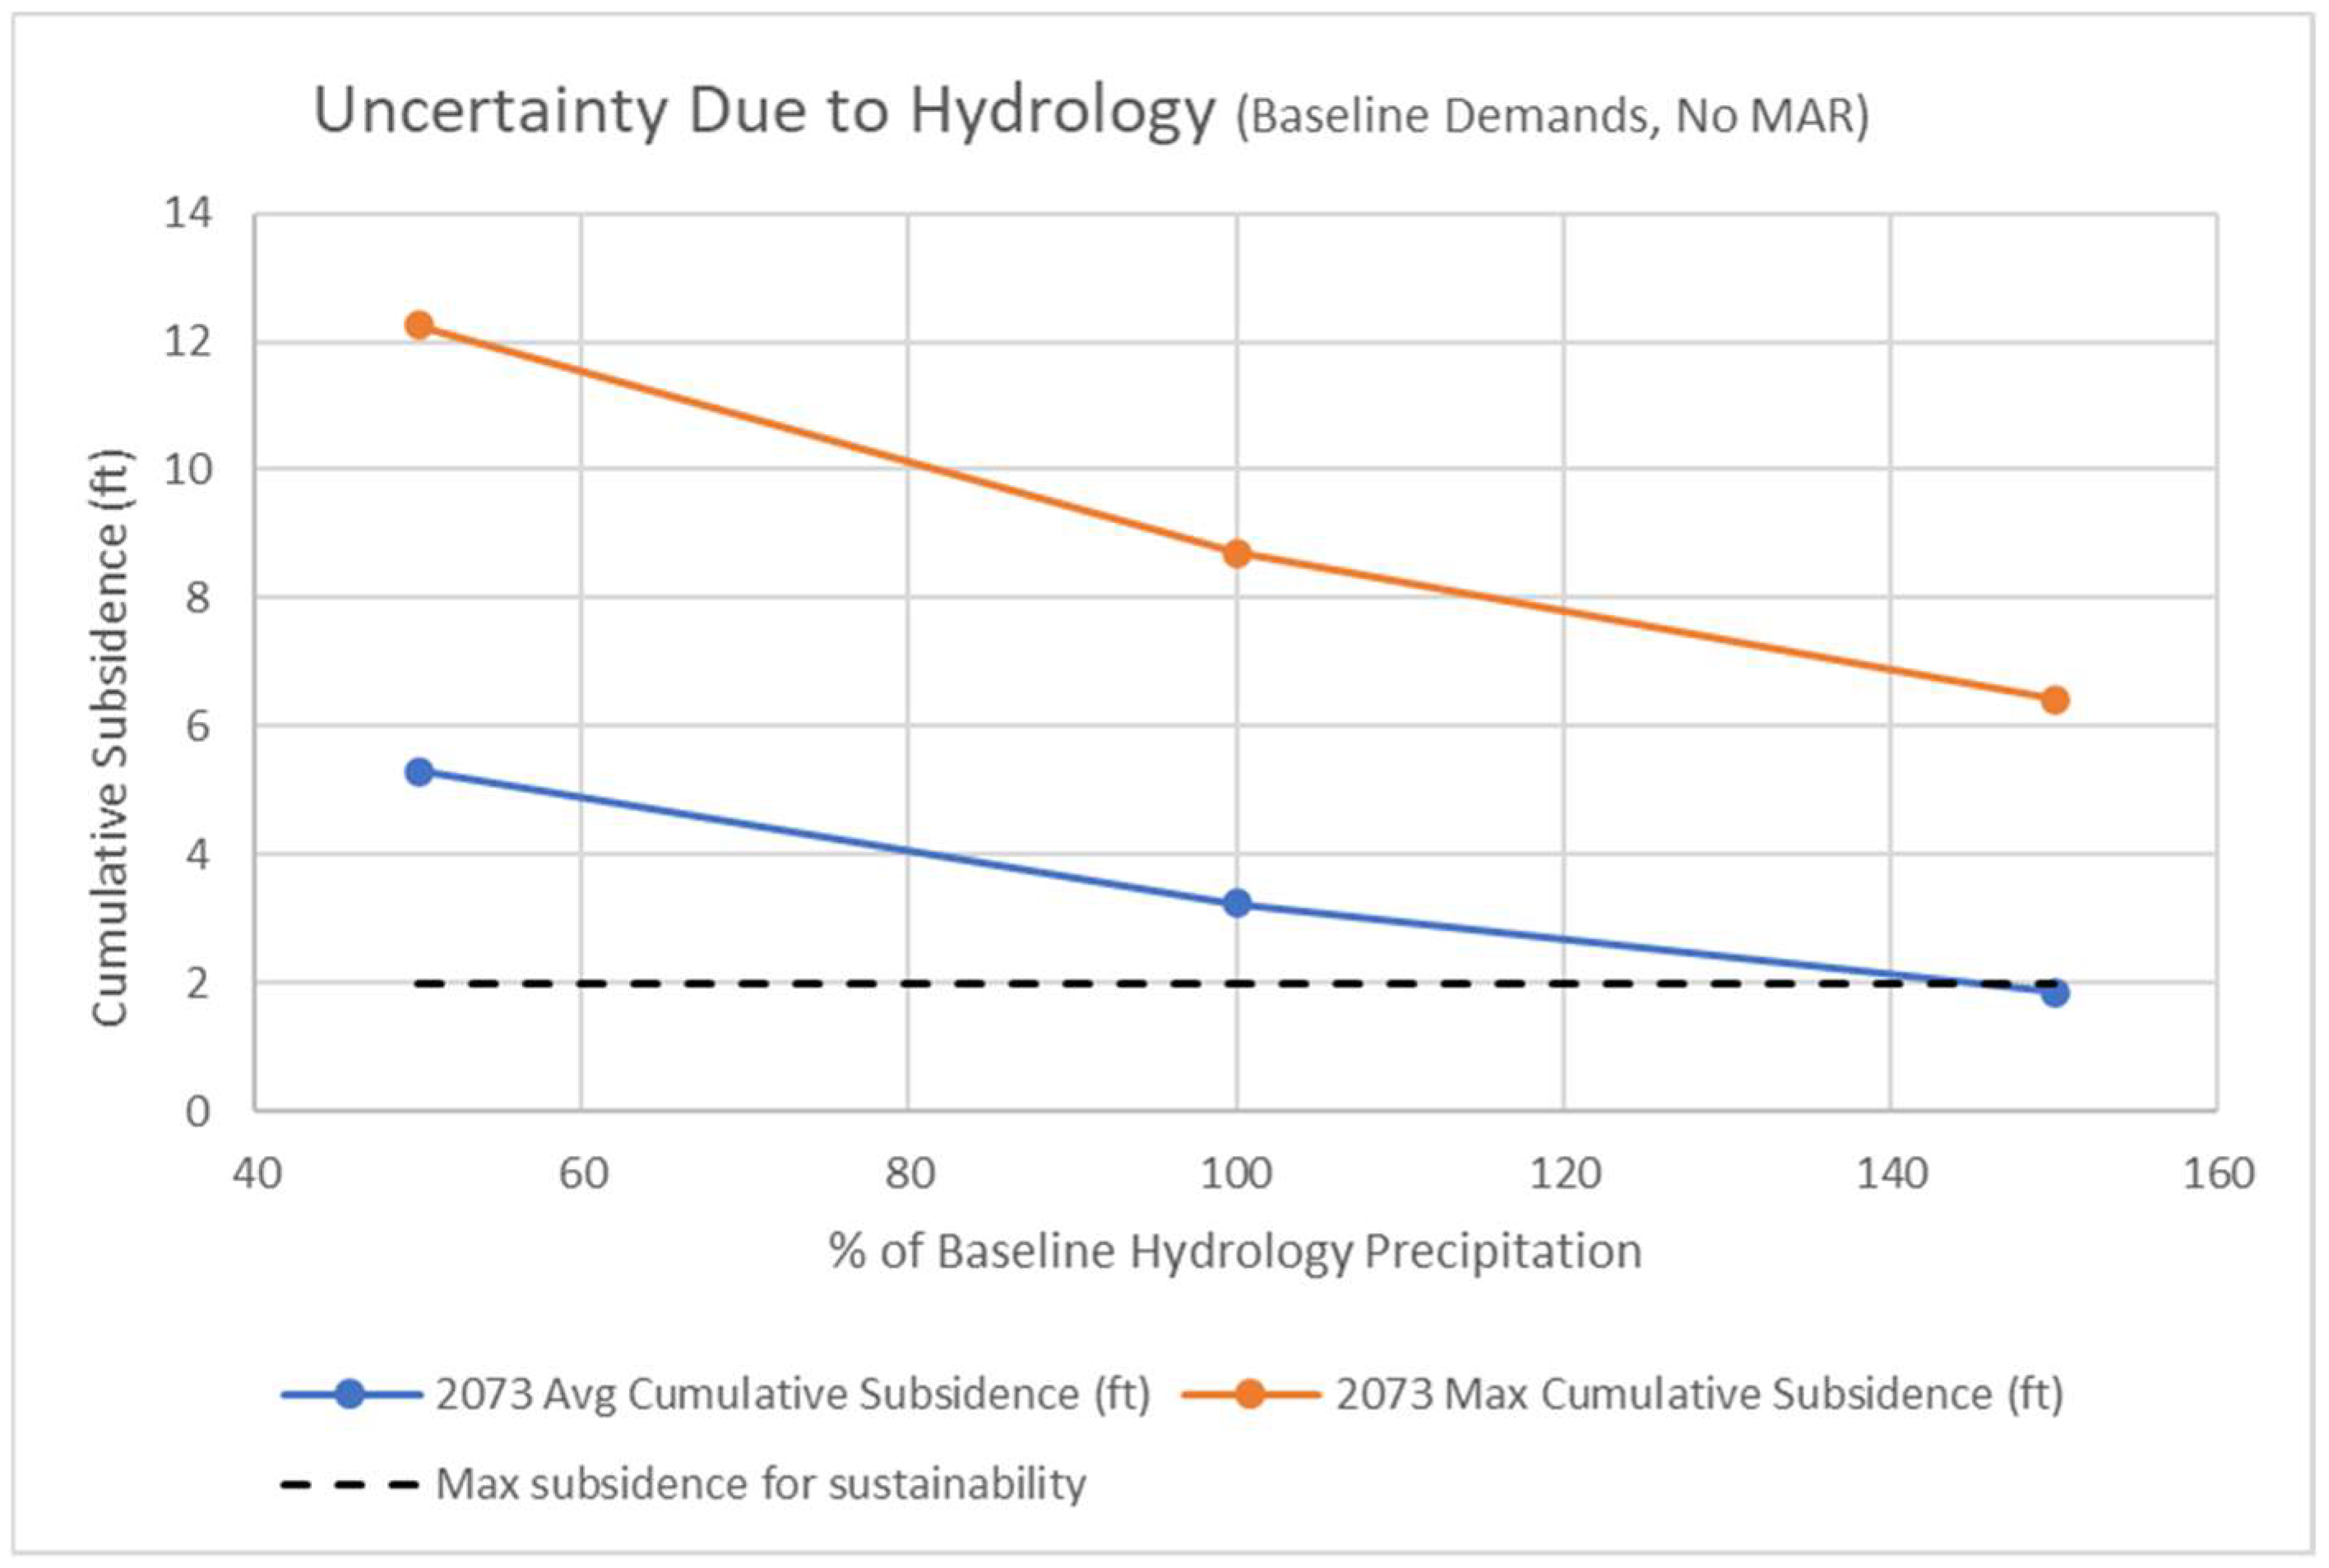
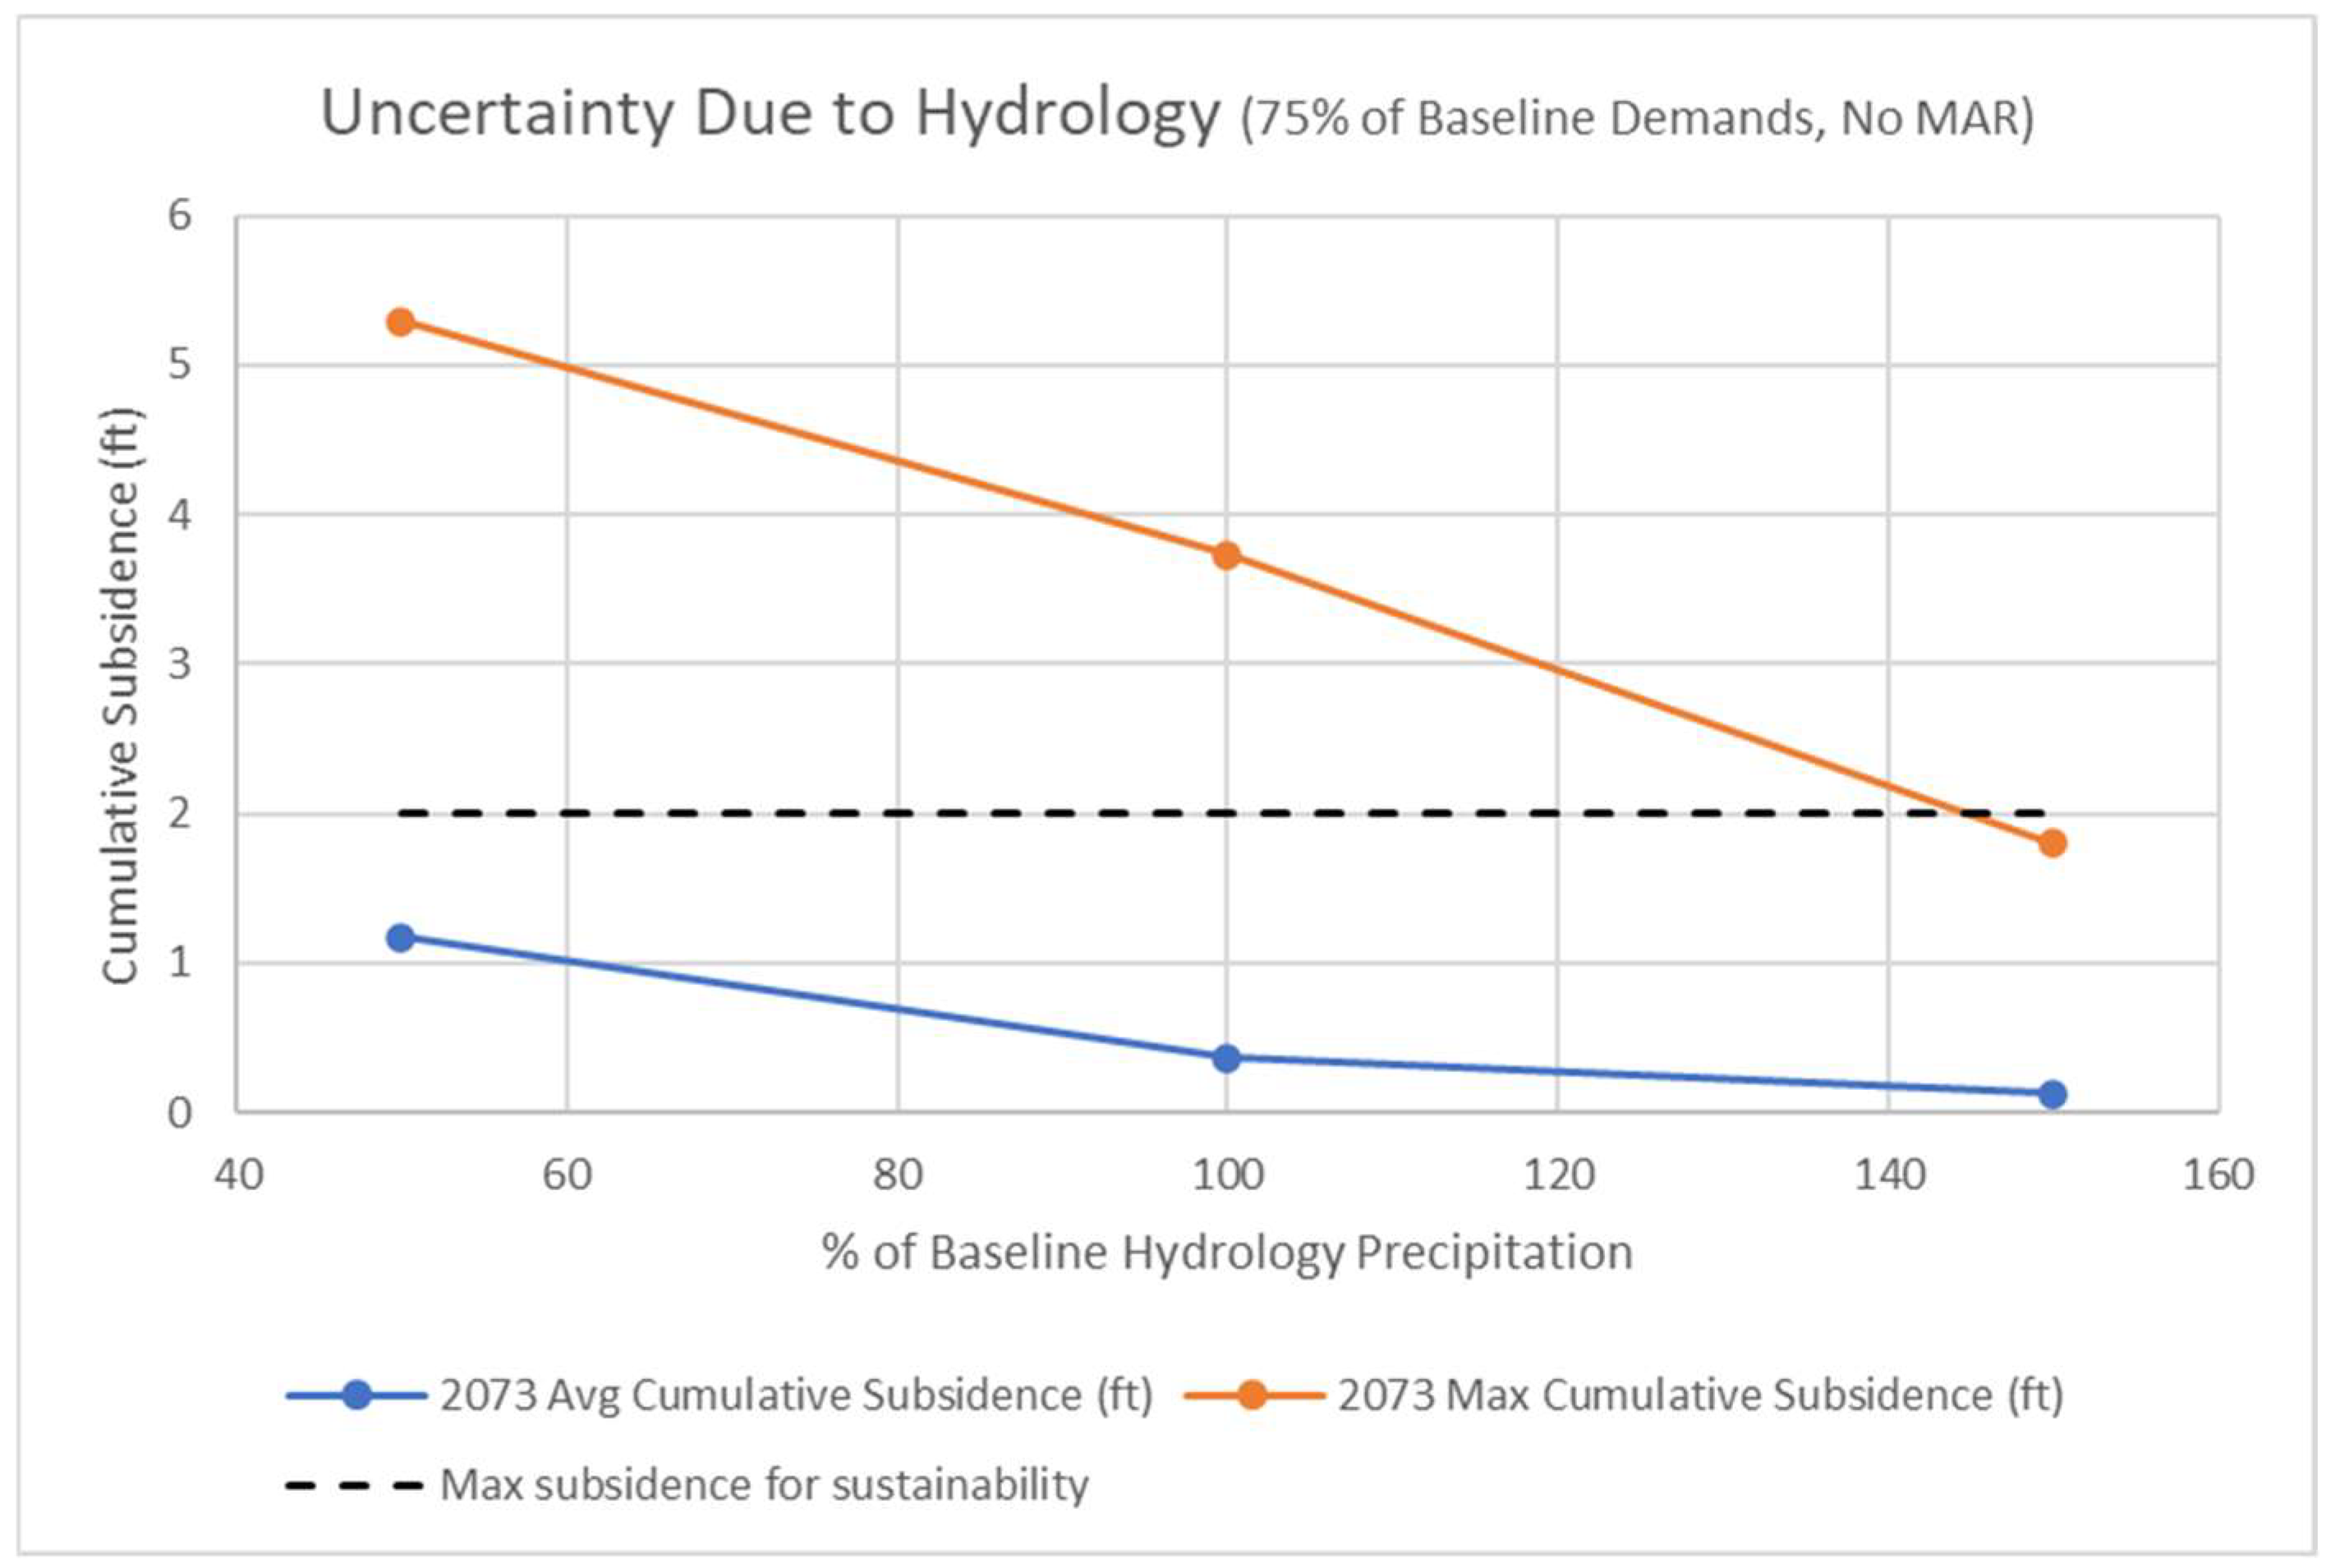
The enhanced capability of the CVHM2 to independently account for elastic and inelastic compaction and slow interbed drainage (a phenomenon that has been recognized from the analysis of models and InSAR and extensometer data) provides us with a more detailed understanding of the dynamic processes of land subsidence. This phenomenon has not, hitherto, been simulated in other regional groundwater models of the Central Valley. In some regions and layers, the CVHM2 simulates a greater elastic response and less permanent loss of storage due to inelastic deformation than had been shown in earlier models. However, the CVHM2 showed low rates of subsidence in the central reaches of the DMC, where prior models had suggested an absence of any subsidence. These results match recently observed canal subsidence measurements from well-controlled accurate canal survey data made in the vicinity of check 8 (~milepost 20). Thus, CVHM2 simulates the potential impacts on this reach of the DMC and may indicate that there are effects on conveyance in this stretch of the canal. Cracks in the canal lining are costly to repair and can be disruptive to timely agricultural deliveries. The subsidence of long reaches of the DMC and adjacent agricultural delivery canals can require raising the elevation of these conveyances, which potentially leads to even greater repair costs and longer supply disruptions.

4.5. Uncertainty

The analysis presented thus far has focused on the sensitivity of future subsidence to water demands and MAR. Examination of the results also suggests that hydrological uncertainty, such as that represented by future climate change, can have a significant effect on land subsidence. In this work, uncertainty is represented solely by unknown changes in precipitation; in other words, future climate regimes may be wetter or dryer. The perturbations performed demonstrated that this uncertainty has an impact on the resulting subsidence. For example, if we compare scenarios with undiminished Baseline Demands and No MAR in terms of the three different hydrology conditions, we find that by the year 2073 the cumulative land subsidence is an average of 5.30 ft in the dry hydrology scenario, 3.24 ft in the baseline hydrology scenario, and 1.85 ft in the wet hydrology scenario over the study area. The cumulative maximum land subsidence values are 12.26 ft, 8.71 ft, and 6.43 ft for the dry, baseline, and wet hydrology scenarios, respectively. This uncertainty due to hydrology in future subsidence projections is illustrated in Figure 8. It can be seen that the maximum 2073 cumulative subsidence values vary by a factor of two (~6 ft for wet hydrology vs. ~12 ft for dry hydrology). The assumed maximum 2073 cumulative subsidence limit of 2 ft is represented by the dashed line in Figure 8, illustrating that while hydrology has a significant effect, all scenarios simulated under the assumption of Baseline Demands violate this maximum limit.
The uncertainty with respect to hydrology in the 75% Baseline Demand scenario is depicted in Figure 9. It can be seen that the same trends with respect to hydrology are exhibited, with wetter hydrology leading to less subsidence. The difference between these scenarios and the Baseline Demand scenario is that reducing the demand to 75% of the Baseline Demand scenario reduces subsidence. The maximum subsidence values are still greater than 2 ft for the dry and baseline hydrology scenarios, but the wet hydrology scenario satisfies the maximum sustainability limit due to its reduced demands in comparison to the 100% Baseline Demand case (Figure 8). Thus, by reducing the demand for water from 100% of the baseline to 75% of the baseline, we can now expect sustainability to achieved in at least one of the hydrology scenarios simulated.
The uncertainty with respect to hydrology in the 50% Baseline Demand scenarios is depicted in Figure 10. It can be seen that the same trend with respect to hydrology is exhibited, with wetter hydrology leading to less subsidence (at least in terms of the maximum subsidence values). However, we now see that the large demand reductions in the 50% of baseline case reduce subsidence to within acceptable limits for all future hydrologic scenarios, from dry to wet. Thus, by reducing the demand for water from 100% of the baseline to 50% of the baseline, these CVHM2 scenarios give us a good degree of confidence that demand reductions of this magnitude can be assumed to constrain future subsidence along the DMC to acceptable levels for sustainability through to 2073. The analysis presented in Figure 8, Figure 9 and Figure 10 demonstrates the uncertainty with respect to future hydrology, expressed as % changes in precipitation due to climate change, and it also underscores that demand reductions are a key lever in constraining future subsidence, suggesting that demands need to be reduced by somewhere between 50% and 75% of current levels to achieve sustainability with respect to the subsidence criterion. The more demands are reduced, the less of a risk hydrologic uncertainty presents.

5. Discussion

This study has demonstrated the utility of a regional model to guide water managers in their selection of long-term groundwater management strategies to meet SGMA goals in the Delta–Mendota subbasin of the San Joaquin Valley. This modeling tool may be effective in evaluating different water management strategies for the following reasons:
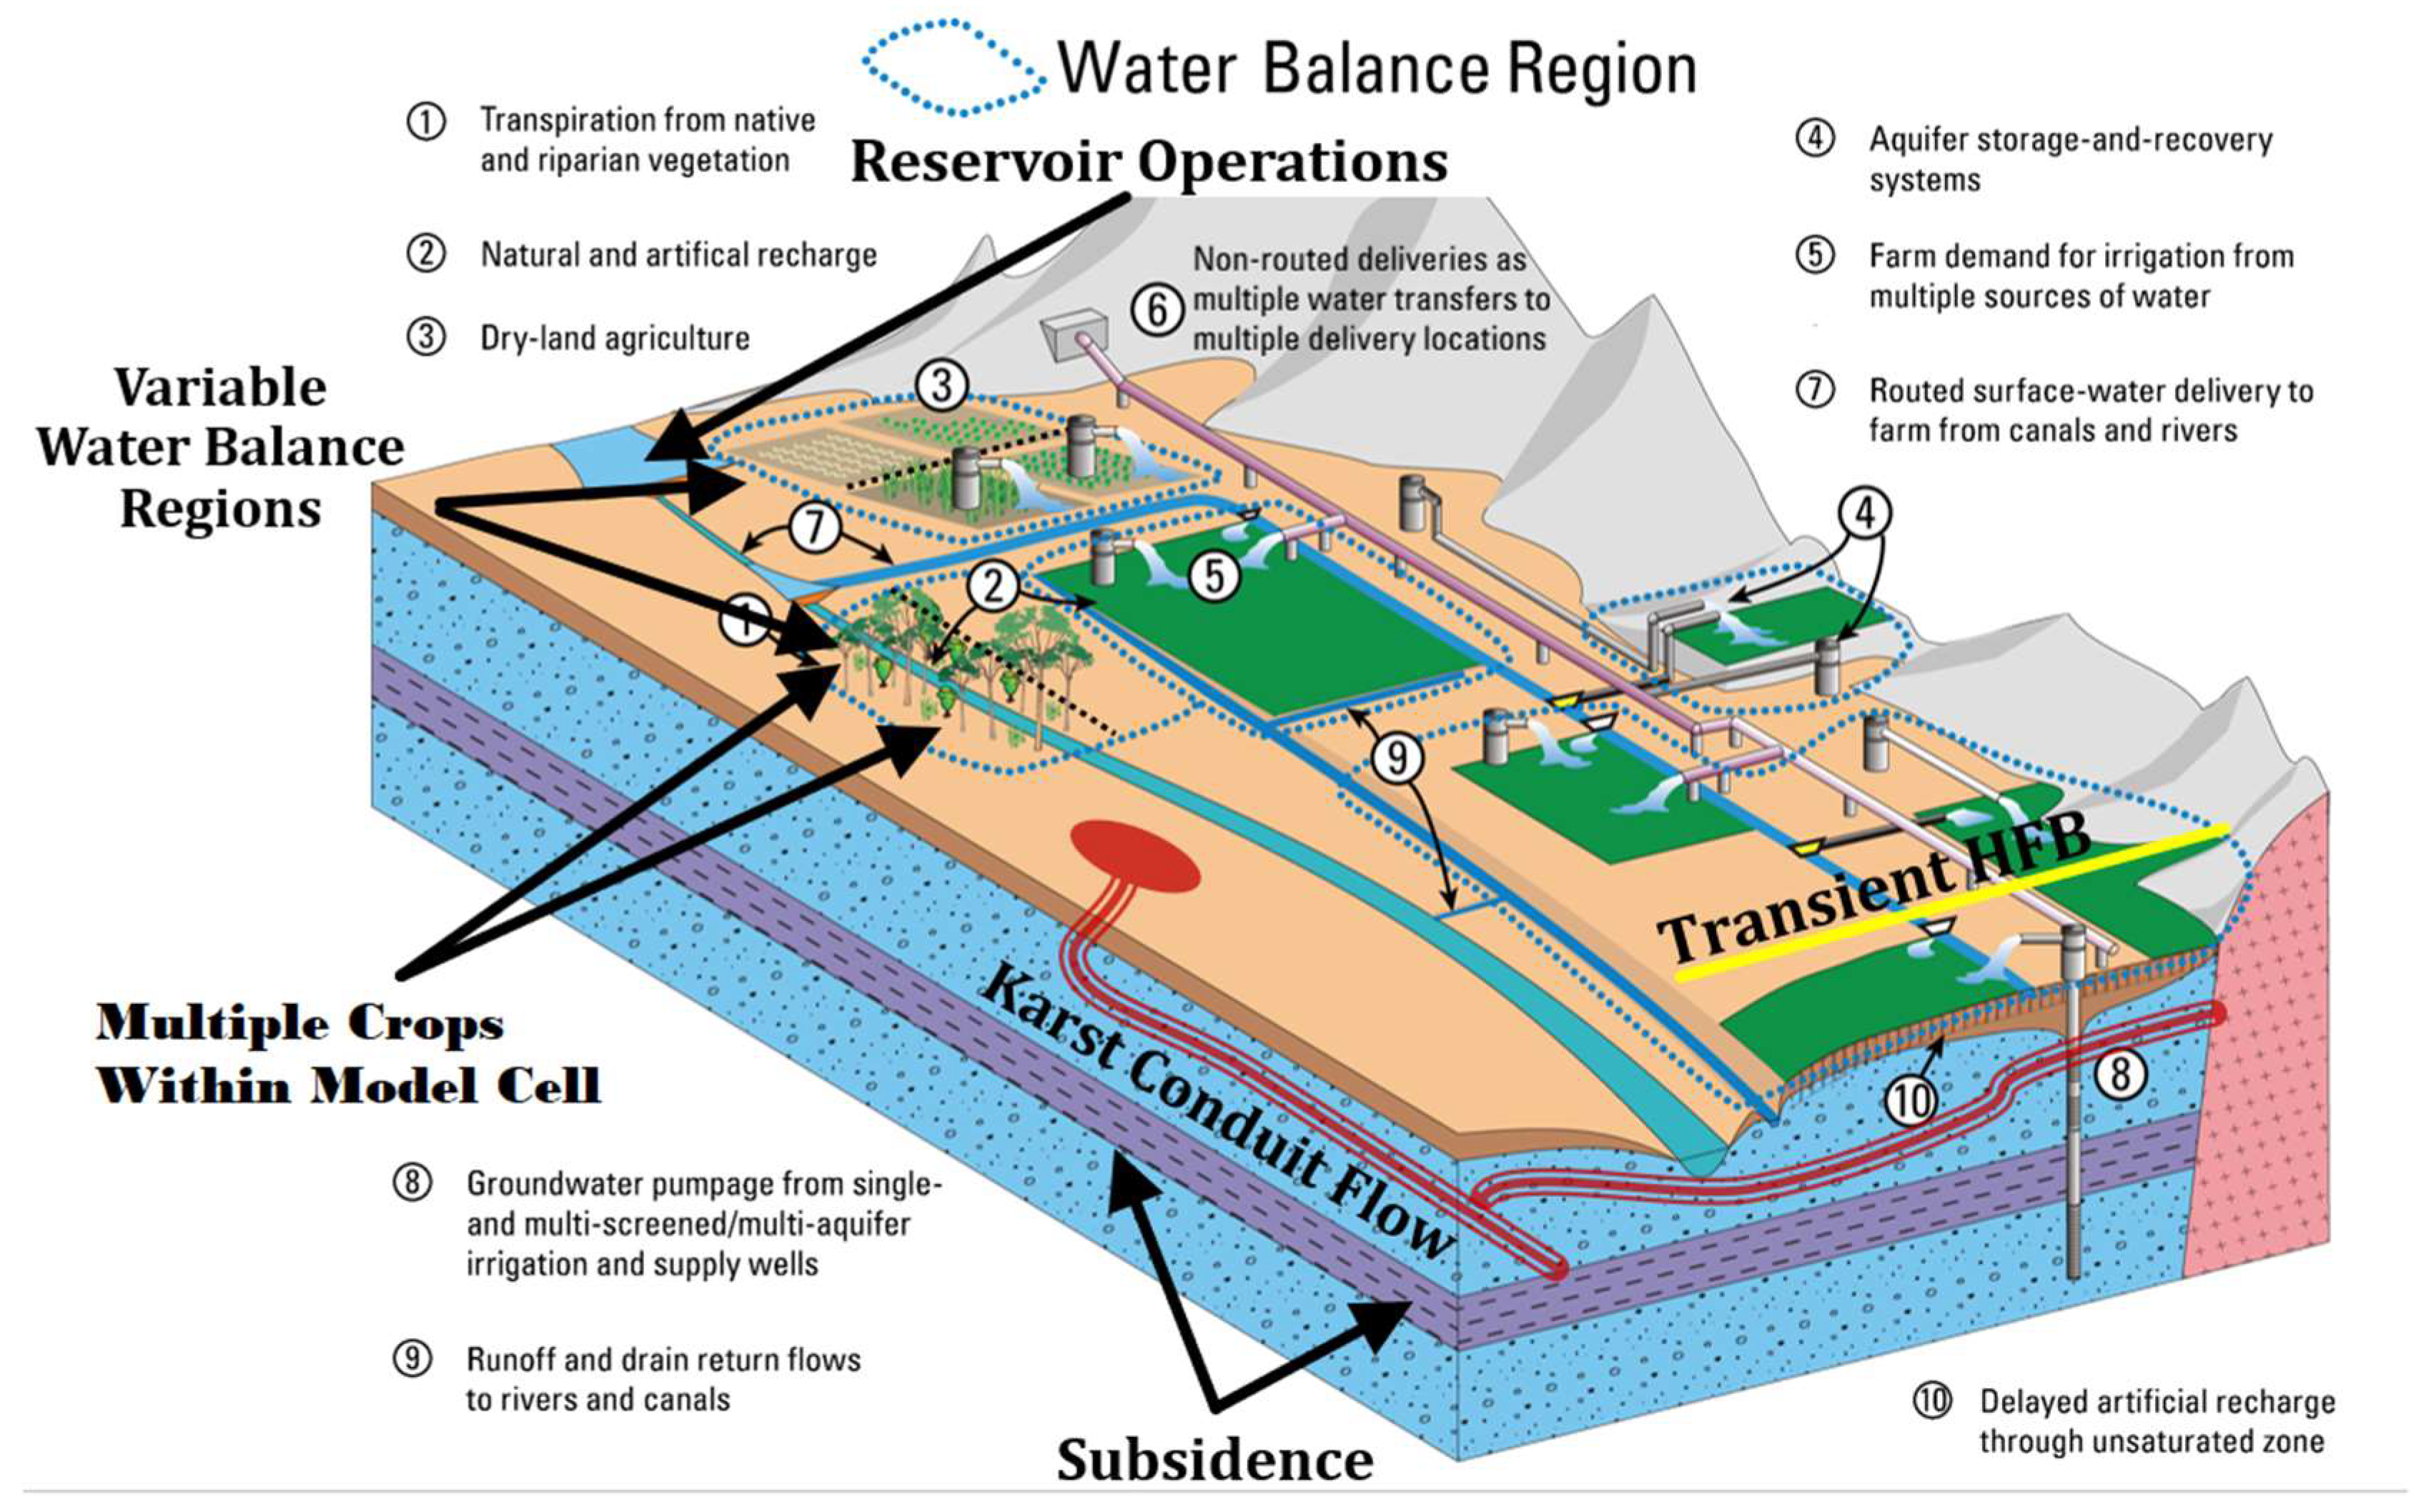
  • The USGS CVHM2 regional model utilized an updated version of the farm process and incorporated the MODFLOW One Water Hydrologic Flow Model MF-OWHM [14], which provided additional features for the simulation of agricultural irrigation hydrology. This has made the underlying hydrology more transparent (although at the expense of model complexity), with the aim of being aligned with datasets more familiar to agricultural stakeholders.
  • The USGS worked for more than 6 years after the release of a prior version of the model (CVHM), allowing time for stakeholder data to be assimilated and utilized directly in the version 2 model. An important refinement has been the disaggregation of water balance subregions into “farms” or subareas which are delineated to closely match (to the extent possible with a 1-mile model grid mesh) political water district boundaries. This was critical in the Delta–Mendota subbasin, where surface drainage is prohibited and where reuse is managed at the water district level.
  • Surface and subsurface drainage reuse is widespread within the Delta–Mendota subbasin—some formal and practiced on-farm in the southern part of the subarea and others more informal and regional, where irrigation return flows into surface drains and can be reused. The Grassland water district—a 50,000-acre tract of managed seasonal wetlands—relies heavily on water reuse to flood these wetlands in winter months. Properly accounting for reuse in the Delta–Mendota subregion was critical for successful model calibration [17] and the model’s potential utility as a decision support tool.
  • Proper accounting of irrigation water supply, crop evapotranspiration, water reuse, and runoff can help to accurately track groundwater extraction. Subsidence modeling is only credible if groundwater pumping rates and the groundwater pumping response to drought and other climate change-induced perturbations to regional hydrology can be properly accounted for.
  • Enhancement of the algorithms encoded in the CVHM2 and used to simulate land subsidence, including the partition of elastic and inelastic compaction and the model’s ability to simulate aquifer interbed drainage, has greatly improved the capabilities of the model. In particular, results from simulations [15] and extensometer measurements [3] in the Delta–Mendota subbasin have demonstrated these enhanced capabilities.

6. Conclusions

In conclusion, we have conducted an analysis that probes the sensitivity of future subsidence to major drivers of subsidence along the Delta–Mendota Canal (DMC) by extending the recently released CVHM2 in order to investigate a range of future scenarios and evaluate the subsidence along the DMC associated with several expected management interventions. We also incorporated the uncertainty of future hydrology due to climate change into the modeled scenarios. Our analysis included the consideration of three primary drivers (or stressors): agricultural water demands, the future climate in terms of precipitation and inflows from surrounding mountains, and the implementation of potential applications of managed aquifer recharge (MAR) as a mitigation measure. Based on our stressors, our results suggest that future subsidence is most sensitive to agricultural water demands. Further, our analysis suggests that agricultural water demands may need to be reduced to approximately 300,000 AFY to limit future subsidence along the canal to less than 2 ft between 2020 and 2073. The second most sensitive parameter was the future climate, which added to the uncertainty in future subsidence projections and the level of water demands that can be considered compatible with sustainability. Subsidence was relatively insensitive to MAR, but further study can help probe the possible efficacy of more focused MAR strategies, as demonstrated by our proof-of-concept scenario, which simulated the direct injection of excess water below the Corcoran clay where most of this subsidence is occurring. Overall, this study demonstrates the utility of CVHM2 as a tool that can help water managers, including those within Groundwater Sustainability Agencies (GSAs) in California, achieve sustainability under SGMA. The importance of achieving groundwater sustainability with respect to the land subsidence problem in California, and elsewhere, is highlighted by the significant role played by groundwater in supporting the global food supply [35], the correlation between agricultural groundwater use and groundwater depletion [36] and land subsidence [37,38], and the increased likelihood of excessive subsidence occurring due to both droughts and the reduced delivery of surface water supplies, which are being increasingly stressed by multiple objectives, including environmental objectives [2]. MAR is a promising intervention that has shown potential in contributing to groundwater sustainability [39,40] but, as demonstrated here, we need more detailed technical analyses of its utility in protecting critical infrastructure. CVHM2 is a modeling tool that can leverage both historical [41], recent [42], and ongoing subsidence measurements using state-of-the-art technologies, e.g., those in [43,44]. Figure A1, Figure A2 and Figure A3 depict the scenario results for cumulative subsidence from 2020 to 2073 for the baseline, dry, and wet hydrology scenarios respectively. These figures show the cumulative subsidence for the period plotted against the length of the canal in terms of mile post. By projecting future subsidence in both space and time along critical infrastructure such as the DMC, CVHM2 is an important decision support tool capable of guiding the design of the water management approaches spelled out in groundwater sustainability plans (GSPs) by identifying the mix of groundwater demand management, MAR, and potentially other mitigation measures that can help minimize land subsidence and achieve groundwater sustainability.

Author Contributions

Conceptualization, K.N., N.Q. and J.T.; methodology, K.N. and J.T.; software, J.T.; data curation, J.T.; writing—original draft preparation, K.N.; writing—review and editing, N.Q. and J.T.; visualization, K.N.; project administration, K.N. All authors have read and agreed to the published version of the manuscript.

Funding

This research was funded by the Bureau of Reclamation’s Delta-Mendota Canal Subsidence Correction Project.

Data Availability Statement

The original contributions presented in this study are archived in the modeling data and files at https://data.usbr.gov/catalog/8087.

Acknowledgments

Guidance on conceptualization and methodology was provided by Claudia Faunt (USGS, California Water Science Center, Program Chief—Groundwater Availability and Use Assessments). Logan Platt (USGS and Scripps Institution of Oceanography) assisted with the construction of the model inputs used to represent groundwater pumping reductions in the simulation of the Delta–Mendota Draft GSP. This study also benefitted from extensive discussion and input from Numan Mizyed (US Bureau of Reclamation Technical Services Center). Tom Heinzer (USBR) assisted with Figure 1.

Conflicts of Interest

The authors declare no conflict of interest.

Abbreviations

The following abbreviations are used in this manuscript:
AFYAcre-ft per year
CVHMCentral Valley Hydrologic Model
CVHM2Central Valley Hydrologic Model v2
CVPCentral Valley Project
DMCDelta–Mendota Canal
GSAGroundwater Sustainability Agency
GSPGroundwater Sustainability Plan
HGSSJVMHydroGeoSphere San Joaquin Valley Model
MF-OWHMMODFLOW-One Water Hydrologic Model
MODFLOWU.S. Geological Survey modular finite-difference flow model
MARManaged aquifer recharge
SGMASustainable Groundwater Management Act
SJVSan Joaquin Valley
SLDMWASan Luis Delta–Mendota Water Authority
USGSUnited States Geological Survey

Appendix A

Figure A1. Cumulative subsidence from 2020 to 2073 along the Delta–Mendota Canal, simulated by extending the CVHM2 using baseline hydrology scenarios.
Water 17 01120 g0a1
Figure A2. Cumulative subsidence from 2020 to 2073 along the Delta–Mendota Canal, simulated by extending the CVHM2 using dry hydrology scenarios.
Water 17 01120 g0a2
Figure A3. Cumulative subsidence from 2020 to 2073 along the Delta–Mendota Canal, simulated by extending the CVHM2 using wet hydrology scenarios.
Water 17 01120 g0a3

References

  1. Ireland, R.L.; Poland, J.F.; Riley, F.S. Land Subsidence in the San Joaquin Valley, California, as of 1980; US Geological Survey Professional Paper 437-I; USGS Publications Warehouse: Reston, VA, USA, 1984; 93p.
  2. Lees, M.; Knight, R. Quantification of record-breaking subsidence in California’s San Joaquin Valley. Commun. Earth Environ. 2024, 5, 677. [Google Scholar] [CrossRef]
  3. Sneed, M.; Brandt, J.; Solt, M. Land Subsidence Along the Delta-Mendota Canal in the Northern Part of the San Joaquin Valley, California, 2003–2010; US Geological Survey Scientific Investigations Report 2013-5142; USGS Publications Warehouse: Reston, VA, USA, 2013; 87p.
  4. Faunt, C.C.; Sneed, M.; Traum, J.; Brandt, J.T. Water Availability and Land Subsidence in the Central Valley, California, USA. Hydrogeol. J. 2016, 24, 675–684. [Google Scholar] [CrossRef]
  5. California Department of Water Resources. Sustainable Groundwater Management Act (SGMA). Available online: https://water.ca.gov/Programs/Groundwater-Management/SGMA-Groundwater-Management (accessed on 25 June 2024).
  6. California Department of Water Resources. California’s Groundwater Update 2020 (Bulletin 118); California Department of Water Resources: Sacramento, CA, USA, 2020.
  7. Poland, J.F.; Lofgren, B.E.; Ireland, R.L.; Pugh, R.G. Land Subsidence in the San Joaquin Valley, California, as of 1972; US Geological Survey Professional Paper 437-H; USGS Publications Warehouse: Reston, VA, USA, 1975; 78p.
  8. Belitz, K.; Phillips, S.P.; Gronber, J.M. Numerical Simulation of Ground-Water Flow in the Central Part of the Western San Joaquin Valley, California; Water Supply Paper 2396; USGS Publications Warehouse: Reston, VA, USA, 1993.
  9. Larson, K.J.; Basagaoglu, H.; Mariño, M.A. Prediction of optimal safe ground water yield and land subsidence in the Los Banos-Kettleman City area, California, using a calibrated numerical simulation model. J. Hydrol. 2001, 242, 79–102. [Google Scholar] [CrossRef]
  10. Leake, S.A.; Prudic, D.E. Documentation of a computer program to simulate aquifer-system compaction using the modular finite-difference ground water flow model. In US Geological Survey Techniques of Water Resources Investigation, Book 6, Chap. A2; USGS Publications Warehouse: Reston, VA, USA, 1991; 68p. [Google Scholar]
  11. McDonald, M.G.; Harbaugh, A.W. A modular three-dimensional finite-difference ground-water flow model. In US Geological Survey Techniques of Water Resources Investigations, Book 6, Chap. A1; USGS Publications Warehouse: Reston, VA, USA, 1988; 586p. [Google Scholar]
  12. Faunt, C.C. (Ed.) Groundwater Availability of the Central Valley Aquifer, California; U.S. Geological Survey Professional Paper 1766; U.S. Geological Survey: Reston, VA, USA, 2009; ISBN 978-1-4113-2515-9.
  13. Harbaugh, A.W.; Banta, E.R.; Hill, M.C.; McDonald, M.G. MODFLOW-2000: U.S. Geological Survey Modular Ground-Water Model—User Guide to Modularization Concepts and the Ground-Water Flow Process: U.S. Geological Survey Open-File Report 00–92; USGS Publications Warehouse: Reston, VA, USA, 2000; 121p.
  14. Hoffman, J.; Leake, S.A.; Galloway, D.L.; Wilson, A.M. MODFLOW–2000 Ground-Water Model—User Guide to the Subsidence and Aquifer-System Compaction (SUB) Package: U.S. Geological Survey Open-File Report 03–233; USGS Publications Warehouse: Reston, VA, USA, 2003; 46p.
  15. Schmid, W.; Hanson, R.T.; Thomas, M., III; Leake, S.A. User Guide for the Farm Process (FMP1) for the U.S. Geological Survey’s Modular Three-Dimensional Finite-Difference Ground-Water Flow Model, MODFLOW-2000: U.S. Geological Survey Techniques and Methods 6-A17; USGS Publications Warehouse: Reston, VA, USA, 2006; 127p.
  16. Hanson, R.T.; Boyce, S.E.; Schmid, W.; Hughes, J.D.; Mehl, S.M.; Leake, S.A.; Maddock, T.; Niswonger, R.G. One-Water Hydrologic Flow Model (MODFLOW-OWHM) U.S. Geological Survey Techniques and Methods 6–A51; USGS Publications Warehouse: Reston, VA, USA, 2014; 120p. [CrossRef]
  17. Faunt, C.C.; Traum, J.A.; Boyce, S.E.; Seymour, W.A.; Jachens, E.R.; Brandt, J.T.; Sneed, M.; Bond, S.; Marcelli, M.F. Groundwater Sustainability and Land Subsidence in California’s Central Valley. Water 2024, 16, 1189. [Google Scholar] [CrossRef]
  18. Brush, C.F.; Dogrul, E.C.; Kadir, T.N. Development and Calibration of the California Central Valley Groundwater-Surface Water Simulation Model (C2VSim), Version 3.02-CG; Technical Memorandum; California Department of Water Resources: Sacramento, CA, USA, 2013.
  19. Bond, S.; Jachens, E.R.; Faunt, C.C. Central Valley Hydrologic Model Version 2 (CVHM2): Water Banking for Water Years 1961–2019 (Ver. 2.0, Aug 2023); U.S. Geological Survey Data Release; U.S. Geological Survey: Reston, VA, USA, 2022.
  20. Earll, M.M. Central Valley Hydrologic Model Version 2 (CVHM2): Surface Water Network for Water Years 1922–2019; U.S. Geological Survey Data Release; U.S. Geological Survey: Reston, VA, USA, 2022.
  21. Faunt, C.C. Central Valley Hydrologic Model Version 2 (CVHM2): Model Setup Files; U.S. Geological Survey Data Release; U.S. Geological Survey: Reston, VA, USA, 2022.
  22. Faunt, C.C.; Stamos-Pfeiffer, C.L.; Brandt, J.; Sneed, M.; Boyce, S.E. Central Valley Hydrologic Model Version 2 (CVHM2): Observation Data (Groundwater Level, Streamflow, Subsidence) from 1916 to 2018 (Ver. 2.0, June 2023); U.S. Geological Survey Data Release; U.S. Geological Survey: Reston, VA, USA, 2022.
  23. Marcelli, M.F.; Shepherd, M.M.; Faunt, C.C. Central Valley Hydrologic Model Version 2 (CVHM2): Well Log Lithology Database and Texture Model; U.S. Geological Survey Data Release; U.S. Geological Survey: Reston, VA, USA, 2022.
  24. Seymour, W.A.; Martin, D. Central Valley Hydrologic Model Version 2 (CVHM2): Climate Data (Precipitation, Evapotranspiration, Recharge, Runoff) from the Basin Characterization Model for Water Years 1922–2019 (Ver. 2.0, June 2023); U.S. Geological Survey Data Release; U.S. Geological Survey: Reston, VA, USA, 2022.
  25. Seymour, W.A.; Faunt, C.C. Central Valley Hydrologic Model Version 2 (CVHM2): Land Use Properties (Ver. 3.0, October 2023); U.S. Geological Survey Data Release; U.S. Geological Survey: Reston, VA, USA, 2022.
  26. Traum, J.A. Central Valley Hydrologic Model Version 2 (CVHM2): Subsidence Package; U.S. Geological Survey Data Release; U.S. Geological Survey: Reston, VA, USA, 2022.
  27. Traum, J.A.; Faunt, C.C. Central Valley Hydrologic Model Version 2 (CVHM2): Groundwater Pumping; U.S. Geological Survey Data Release; U.S. Geological Survey: Reston, VA, USA, 2022.
  28. Boyce, S.E.; Hanson, R.T.; Ferguson, I.; Schmid, W.; Henson, W.R.; Reimann, T.; Mehl, S.W.; Earll, M.M. One-Water Hydrologic Flow Model: A MODFLOW Based Conjunctive-Use Simulation Software; Techniques and Methods 6-A60; U.S. Geological Survey: Reston, VA, USA, 2020; 435p. [CrossRef]
  29. Boyce, S.E. MODFLOW One-Water Hydrologic Flow Model (MF-OWHM) Conjunctive Use and Integrated Hydrologic Flow Modeling Software, Version 2.3.0; U.S. Geological Survey Software Release; U.S. Geological Survey: Reston, VA, USA, 2024. [CrossRef]
  30. Nelson, K.E. Technical Memorandum—“Estimated Subsidence Projections Along the Delta-Mendota-Canal (DMC)”; US Bureau of Reclamation: Washington, DC, USA, 2019.
  31. Nelson, K.E. Science & Technology Program Final Report ST-2017-3117-01—“Evaluation of Land Subsidence Impacts Due to Groundwater Pumping Near the Delta-Mendota-Canal (DMC)”; Science & Technology Program Final Report ST-2017-3117-01; US Bureau of Reclamation: Washington, DC, USA, 2017.
  32. Galloway, D.; Jone, D.R.; Ingebritsen, S.E. Mining ground water. Land subsidence in the United States; U.S. Geological Survey; U.S. Geological Survey: Reston, VA, USA, 1999; Volume 1182, pp. 7–34.
  33. Delta-Mendota SGMA (Delta-Mendota SGMA—Delta-Mendota SGMA) and Eki Environment& Water. Groundwater Sustainability Plan for the Delta-Mendota Subbasin—June 2024 Public Review Draft; Delta-Mendota SGMA (Delta-Mendota SGMA—Delta-Mendota SGMA) and Eki Environment & Water: Daly City, CA, USA, 2024. [Google Scholar]
  34. Nelson, K. Draft Technical Memorandum—Review of Delta-Mendota Groundwater Sustainability Plan (GSP); US Bureau of Reclamation: Washington, DC, USA, 2024.
  35. Turner, S.W.D.; Hejazi, M.; Calvin, K.; Kyle, P.; Kim, S. A Pathway of Global Food Supply Adaptation in a World with Increasingly Constrained Groundwater. Sci. Total Environ. 2019, 673, 165–176. [Google Scholar] [CrossRef]
  36. Bierkens, M.F.P.; Wada, Y. Non-Renewable Groundwater Use and Groundwater Depletion: A Review. Environ. Res. Lett. 2019, 14, 063002. [Google Scholar] [CrossRef]
  37. Pierre, J.; Farr, T.G.; Rutqvist, J.; Vasco, D.W. Role of agricultural activity on land subsidence in the San Joaquin Valley, California. J. Hydrol. 2019, 569, 462–469. [Google Scholar]
  38. Corbett, F.; Schetrit, T.; Harter, T. Crop Water Use, Groundwater Flow, and Subsidence at Naval Air Station Lemoore, Fresno and Kings County, California, Final Report; California Cooperative Ecosystem Studies Unit, Department of Defense, The Regents of the University of California: Davis, CA, USA, 2011.
  39. Dillon, P.; Stuyfzand, P.; Grischek, T.; Lluria, M.; Pyne, R.D.G.; Jain, R.C.; Bear, J.; Schwarz, J.; Wang, W.; Fernandez, E.; et al. Sixty Years of Global Progress in Managed Aquifer Recharge. Hydrogeol. J. 2019, 27, 1–30. [Google Scholar] [CrossRef]
  40. California Department of Water Resources. Flood-MAR: Using Flood Water for Managed Aquifer Recharge to Support Sustainable Water Resources; California Department of Water Resources: Sacramento, CA, USA, 2018.
  41. Prokopovich, N.P.; Hebert, D.J. Land Subsidence Along the Delta-Mendota Canal, California. JAWRA J. Am. Water Resour. Assoc. 1968, 60, 915–920. [Google Scholar] [CrossRef]
  42. Sneed, M.; Brandt, J. Land subsidence in the San Joaquin Valley, California, USA, 2007–2014. Proc. Int. Assoc. Hydrol. Sci. 2015, 372, 23–27. [Google Scholar] [CrossRef]
  43. Vasco, D.W.; Farr, T.G.; Pierre, J.; Doughty, C.; Nico, P. Satellite-based monitoring of groundwater depletion in California’s Central Valley. Sci. Rep. 2019, 9, 16053. [Google Scholar] [CrossRef] [PubMed]
  44. Jones, J.; Jones, C.E.; Bekaert, D.P.S. Value of InSAR for Monitoring Land Subsidence to Support Water Management in the San Joaquin Valley, California. JAWRA J. Am. Water Resour. Assoc. 2022, 58, 995–1001. [Google Scholar] [CrossRef]
Figure 1. Critically overdrafted groundwater subbasins in the San Joaquin Valley, California. This study focuses on the Delta–Mendota subbasin and the Delta–Mendota Canal (DMC), a critical piece of infrastructure for water conveyance. The Sustainable Groundwater Management Act (SGMA) gives stakeholder-formed Groundwater Sustainability Areas (GSAs) 20 years from inception or until 2040 to achieve groundwater sustainability.
Water 17 01120 g001
Figure 2. Diagram showing the interdependencies within MF-OWHM of groundwater flow, subsidence, crop water use, natural and artificial recharge, and reservoir operations (adapted and modified from [15,16] with permission from Wolfgang Schmid).
Water 17 01120 g002
Figure 3. Cumulative average subsidence projections for 2035, 2040, and 2073.
Water 17 01120 g003
Figure 4. Cumulative maximum subsidence projections for 2035, 2040, and 2073.
Water 17 01120 g004
Figure 6. Sensitivity of future land subsidence along the Delta-Mendota Canal (DMC) to groundwater pumping as simulated by Central Valley Hydrologic Model version 2 (CVHM2). Annual average groundwater (GW) extraction is depicted on the x-axis in acre-feet per year (AFY), and the maximum (Max) cumulative subsidence at any location along the canal for the cumulative period 2020–2073 is potted on the y-axis in feet (ft). The project/management actions in the June 2024 Delta-Mendota Groundwater Sustainability Plan (GSP) [33] are represented as the scenarios labeled “GSP pumping reduction plan” which represents the reduction in groundwater extraction alone and “GSP pumping reduction plan + surface water (SW) augmentation” which represents the reduction in groundwater extraction plus SW augmentation.
Water 17 01120 g006
Figure 7. Managed aquifer recharge (MAR) proof-of-concept scenarios simulated by Central Valley Hydrologic Model version 2 (CVHM2) compared to CVHM2 baseline scenario. The simulated values plotted depict cumulative subsidence for the period 2020-2073 plotted along the length of the Delta-Mendota Canal (DMC) where mile post values go from 0 at the north end of the canal to 118 at the south end of the canal.
Water 17 01120 g007
Figure 8. Uncertainty in 2073 cumulative subsidence projections due to hydrology, considering Baseline Demands and No MAR. This graph shows the effect of hydrologic uncertainty due to climate change as we go from dryer to wetter future climates by moving from left to right on the x-axis.
Water 17 01120 g008
Figure 9. Uncertainty in 2073 cumulative subsidence projections due to hydrology, considering 75% Baseline Demands and No MAR. This graph shows the effect of hydrologic uncertainty due to climate change as we go from dryer to wetter future climates by moving from left to right on the x-axis.
Water 17 01120 g009
Figure 10. Uncertainty in 2073 cumulative subsidence projections due to hydrology, considering 50% Baseline Demands and No MAR. This graph shows the effect of hydrologic uncertainty due to climate change as we go from dryer to wetter future climates by moving from left to right on the x-axis.
Water 17 01120 g010
Table 1. Sensitivity scenarios. The values used in testing the sensitivity of future subsidence projections to agricultural demands, managed aquifer recharge (MAR), and future precipitation.
Scenario #Demands [m3/yr]MAR [m3/yr]Future Precipitation [% of Current]
12.75 × 1080100
24.14 × 1080100
35.52 × 1080100
42.75 × 1088.18 × 107100
54.14 × 1088.18 × 107100
65.52 × 1088.18 × 107100
72.75 × 1082.04 × 108100
84.14 × 1082.04 × 108100
95.52 × 1082.04 × 108100
102.75 × 108050
114.14 × 108050
125.52 × 108050
132.75 × 1088.18 × 10750
144.14 × 1088.18 × 10750
155.52 × 1088.18 × 10750
162.75 × 1082.04 × 10850
174.14 × 1082.04 × 10850
185.52 × 1082.04 × 10850
192.75 × 1080150
204.14 × 1080150
215.52 × 1080150
222.75 × 1088.18 × 107150
234.14 × 1088.18 × 107150
245.52 × 1088.18 × 107150
252.75 × 1082.04 × 108150
264.14 × 1082.04 × 108150
275.52 × 1082.04 × 108150
Table 2. Scenario results for the spatial average (AVG) subsidence along the Delta-Mendota Canal (DMC) from the Central Valley Hydrologic Model version 2 (CVHM2) for simulated cumulative subsidence along the DMC in San Joaquin Valley, California. Subsidence values are cumulative for the periods 2020–2035, 2020–2040, and 2020–2073. The input parameters for each scenario are listed in Table 1.
Scenario #2020–2035 AVG Subsidence (ft)2020–2040 AVG Subsidence (ft)2020–2073 AVG Subsidence (ft)
10.010.030.04
20.220.290.37
31.772.243.24
40.010.030.04
50.170.240.30
61.752.213.19
70.010.030.04
80.200.270.34
91.732.193.13
100.020.05.07
110.630.801.17
122.523.275.30
130.020.050.07
140.610.771.14
152.473.215.22
160.020.050.07
170.600.751.10
182.423.145.11
190.010.030.02
200.070.120.13
211.131.421.85
220.010.030.02
230.070.120.12
241.111.411.83
250.010.030.02
260.070.110.12
271.101.391.81
Table 3. Scenario results for the spatial maximum (MAX) subsidence along the Delta-Mendota Canal (DMC) from the Central Valley Hydrologic Model version 2 (CVHM2) for simulated cumulative subsidence along the DMC in San Joaquin Valley, California. Subsidence values are cumulative for the periods 2020–2035, 2020–2040, and 2020–2073. The input parameters for each scenario are listed in Table 1.
Scenario #2020–2035 MAX Subsidence (ft)2020–2040 MAX Subsidence (ft)2020–2073 MAX Subsidence (ft)
10.070.100.15
22.472.963.73
34.906.198.71
40.070.100.15
52.452.943.70
64.896.178.67
70.070.100.15
82.452.933.68
94.886.168.62
100.160.230.58
113.013.715.29
126.197.8212.26
130.140.210.55
143.013.705.26
156.107.7212.12
160.130.190.51
173.023.705.25
186.027.6311.66
190.070.100.13
201.411.641.80
214.055.036.43
220.070.100.13
231.391.621.77
244.045.026.41
250.070.100.13
261.381.601.75
274.035.016.39
Disclaimer/Publisher’s Note: The statements, opinions and data contained in all publications are solely those of the individual author(s) and contributor(s) and not of MDPI and/or the editor(s). MDPI and/or the editor(s) disclaim responsibility for any injury to people or property resulting from any ideas, methods, instructions or products referred to in the content.

