1. Introduction
In the context of potable water supply in developing areas, where the appropriate technical level for proper management is often lacking, public companies responsible for supply need tools to assist in decision making and support from consultants. International development banks or agencies typically finance improvements in water infrastructure in such regions, with the allocation and proper use of funds monitored by consultants hired by the financing entity.
Small and mid-sized public water utilities often face significant challenges due to a lack of technical expertise and financial resources [
1].
These companies typically lack in-house specialists capable of performing traditional hydraulic modelling and cannot afford to hire external hydraulic consultants. As a result, they urgently need accessible tools and external support to aid in decision making and ensure proper system management.
Consultants in this setting oversee the projects and works defined in the financing agreements between the utility and the development bank and are crucial in overseeing projects and the outlined works. They are also tasked with transferring knowledge and training staff within the public water supply companies at all levels. However, challenges often arise once the consultants depart, as local staff frequently lack the necessary skills to maintain and further develop the networks effectively, jeopardizing the long-term sustainability of the systems. Recent advancements have highlighted the role of artificial intelligence in enhancing hydrological models and water resource management strategies [
2].
To facilitate knowledge transfer for water supply management in such projects, an application called Water Smart (WS) was developed by Macs Energy and Water (Frankfurt am Main, Germany). It integrates open-access hydraulic calculation tools from EPANET with GIS features and other modules necessary for decision making and water supply design [
3].
MACS Water Smart features a simple, user-friendly interface, a broad range of automated data generation functionalities (such as preset network properties and intelligent elevation or gradient estimation tools) and a sensible scenario analysis functionality. Its intelligent data generation, verification, and error correction algorithms allow users with little or no specific training in hydraulics to use Water Smart efficiently while ensuring high levels of plausibility and correct analytical products [
4].
Broadly, WS enables public utilities to maintain an updated hydraulic system model, run simulations for proper operation and planning, visualize flow and pressure readings from district metering areas (DMAs), and automatically perform the water balance proposed by the International Water Association (IWA) to estimate non-revenue water (NRW) [
5].
Introducing a strategy to control or reduce NRW is a crucial indicator in financing programs, with funds tied to meeting specific performance targets. WS comprises a core system with all essential elements for hydraulic modelling, GIS integration, and modules tailored to water supply management and NRW reduction.
The beginning of the WS design included a preliminary module for water utility management called the Non-revenue Water Change Management Index (NRW CMI). This module contributed to establishing a first step within the utilities to help the managers optimize the water systems and reduce the NRW.
The NRW CMI specifically focussed on combining technical (including commercial) and institutional dimensions in one effective application [
6,
7].
Recent advances in artificial intelligence (AI) have increasingly been applied to water resource management, demonstrating improvements in hydraulic modelling, failure prediction, and system optimization [
8,
9]. Machine learning techniques such as Random Forests, Neural Networks, and Genetic Algorithms have shown great promise in addressing complex tasks like leak detection and pressure optimization [
10]. However, many of these tools are designed for large utilities with sufficient technical capacity, leaving small and mid-sized utilities with limited access to such innovations. This gap highlights the need for accessible, automated, and user-friendly solutions tailored to low-resource contexts.
This article focuses on updating the WS using artificial intelligence (AI) algorithms to support water supply managers in decision making within the commented knowledge transfer framework.
Specifically, the application is programmed to support public utility managers in solving observed pressure problems in the potable water network of Khelvachauri, Georgia.
The developed pressure recovery module using Random Forest regression logarithms solves water supply problems by optimizing pipe diameters for pressure recovery and demonstrating reliability compared with traditional hydraulic modelling methods.
2. Materials and Methods
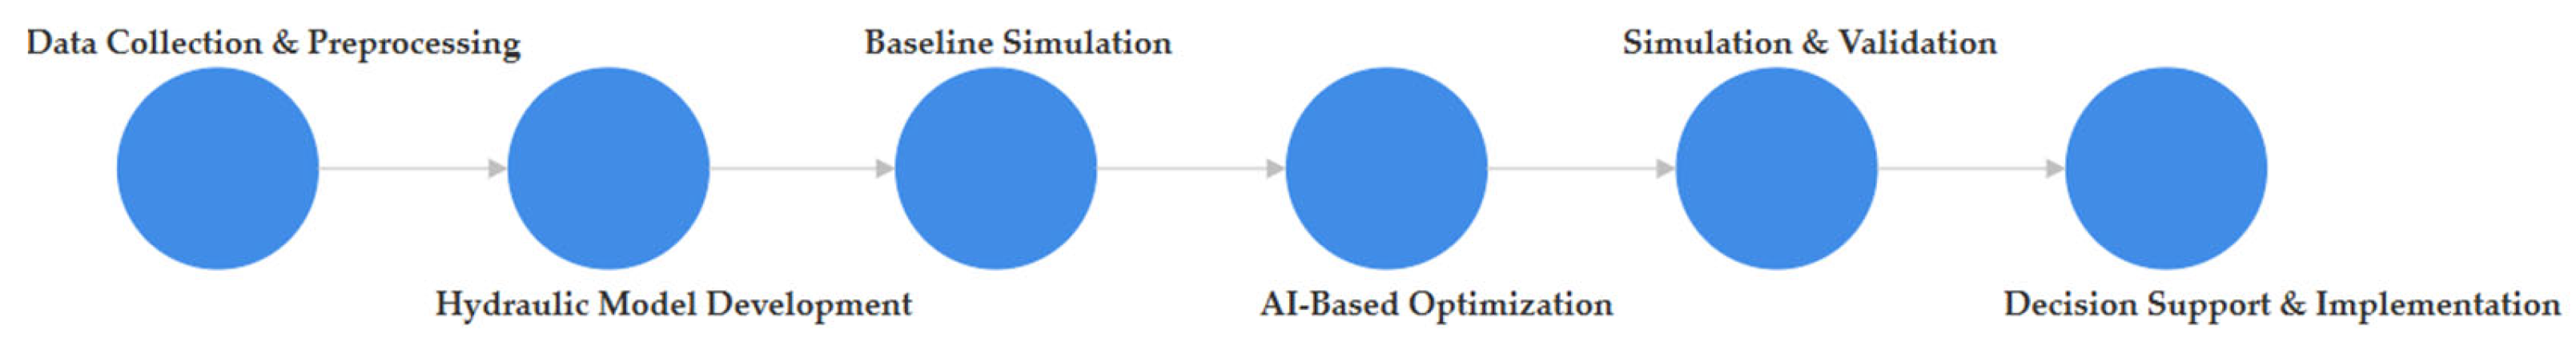
Introducing this section, the next flowchart sets the methodology used to obtain the application.
The flowchart in
Figure 1 outlines the workflow of the AI-powered hydraulic optimization process:
Data Collection and Preprocessing
Input: Network topology, GIS elevation data, historical flow/pressure data.
Process: Data cleaning, missing value handling, and trend analysis.
Output: Structured dataset for model training and simulation.
Hydraulic Model Development
Input: EPANET model parameters, pipe network data.
Process: Load network into EPANET, define boundary conditions, calibrate against real-world flow/pressure measurements.
Output: Validated hydraulic model ready for simulation.
Baseline Simulation
Input: Existing network parameters and demand values.
Process: Run initial hydraulic simulation to identify inefficiencies (low pressure, high velocities, flow imbalances).
Output: Baseline performance metrics.
AI-Based Optimization
Input: Baseline simulation results, network constraints, operational goals.
Process:
- ○
Train Random Forest on historical simulations.
- ○
Optimize pipe diameters based on pressure/flow constraints.
- ○
Iterative improvement through reinforcement learning.
Output: Optimized pipe sizes and flow parameters.
Simulation and Validation
Input: Optimized network parameters.
Process: Run EPANET simulations with AI-optimized configurations.
Output: Performance improvement analysis compared with baseline.
Decision Support and Implementation
2.1. Case Study
Khelvachauri is a municipality in the southwestern region of Georgia near the Black Sea coast, adjacent to Batumi, the main city of the Adjara region.
Currently, the city of Batumi and its region is known as a tourist area in the Black Sea, especially during summertime.
The rise of the tourism industry permitted the reactivation of the local economy and the modernization of the area at all levels.
During the last few years, the German Development Bank, in collaboration with the local authorities and with the support of international consultants, rehabilitated all the water supply and wastewater infrastructure, which dated at that moment from the Soviet time and had many problems due to the lack of maintenance and management.
The project included training the staff of the water public utility at all levels and transferring technology.
The area’s geography features mountainous terrain and deep valleys, posing unique challenges for water infrastructure. Its humid subtropical climate, with mild winters and hot summers, significantly influences seasonal water demand.
The history of water supply in Khelvachauri reflects progressive infrastructure development responding to population growth and industrial needs. Initially reliant on natural springs and artesian wells, increasing urbanization necessitated more sophisticated systems.
The water distribution network has recently seen significant improvements, including pipe replacements and integration with Batumi’s modernized hydraulic system. Khelvachauri’s potable water supply comes from the “Injalo” reservoir and other additional connections to Batumi’s system.
However, these measures have not fully addressed the demand, especially in the southern part of the municipality, where low pressure persists during peak consumption hours.
Population growth and urban development continue to increase demand, requiring effective planning and management. This highlights the importance of technological and managerial solutions to optimize water use and ensure availability for all residents.
Initially, Khelvachauri’s water network operated with low-pressure pumping from surface water near the Mejinis Tskali River, requiring consumers to depend on booster pumps and storage tanks. Later, the network operation was transferred to Batumi’s public water company, “Batumi Tskali”, which integrated it into their infrastructure without conducting hydraulic modelling or simulations. This led to performance challenges, including high non-revenue water (NRW) rates. In response, the German Development Bank (KfW), as the financier of the water infrastructure rehabilitation, commissioned consultants to evaluate the system. Through this evaluation, a comprehensive water supply simulation was conducted to identify solutions and establish a decision-support module as part of a broader knowledge transfer initiative.
2.2. Mathematical Network Model Development
First, the as-built plans of the executed network were obtained, and the connections made with the Batumi supply system were checked for the supply to Khelvachauri. There were three connections, one at the outlet of the Injalo tank and two connections to DN355 pipes, all of which are in the northern part of the Khelvachauri network.
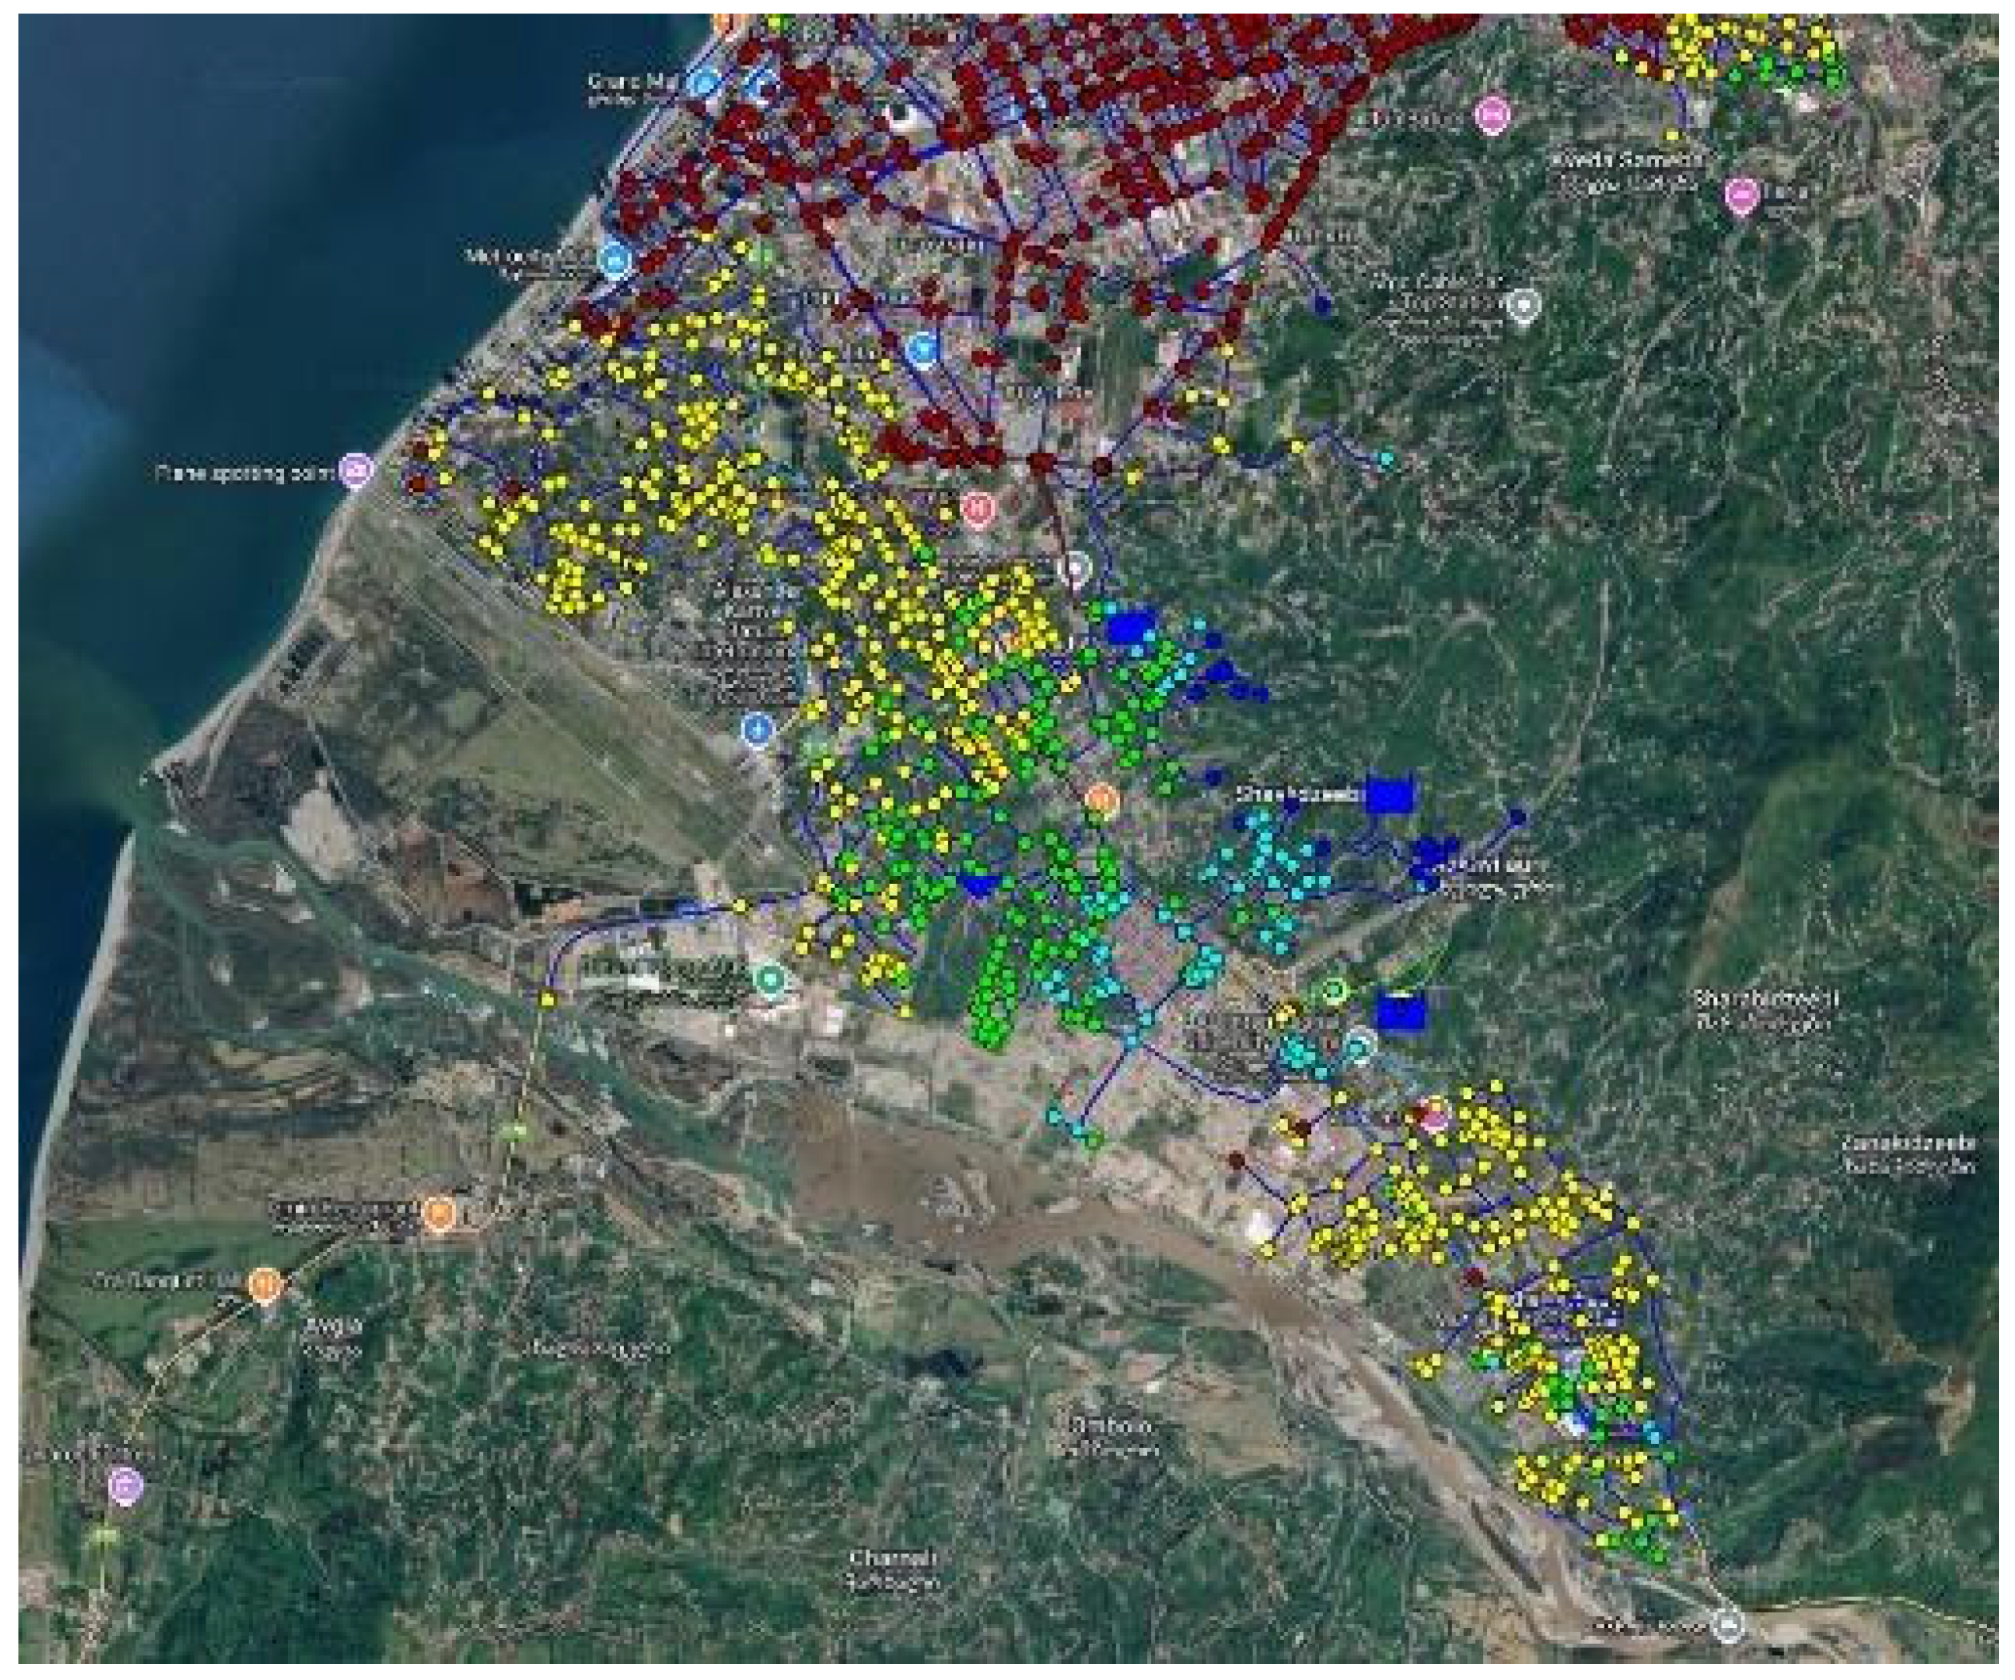
The next step was to load the network into Water Smart to calibrate the hydraulic model.
Figure 2 shows the water system model simulated by the WS.
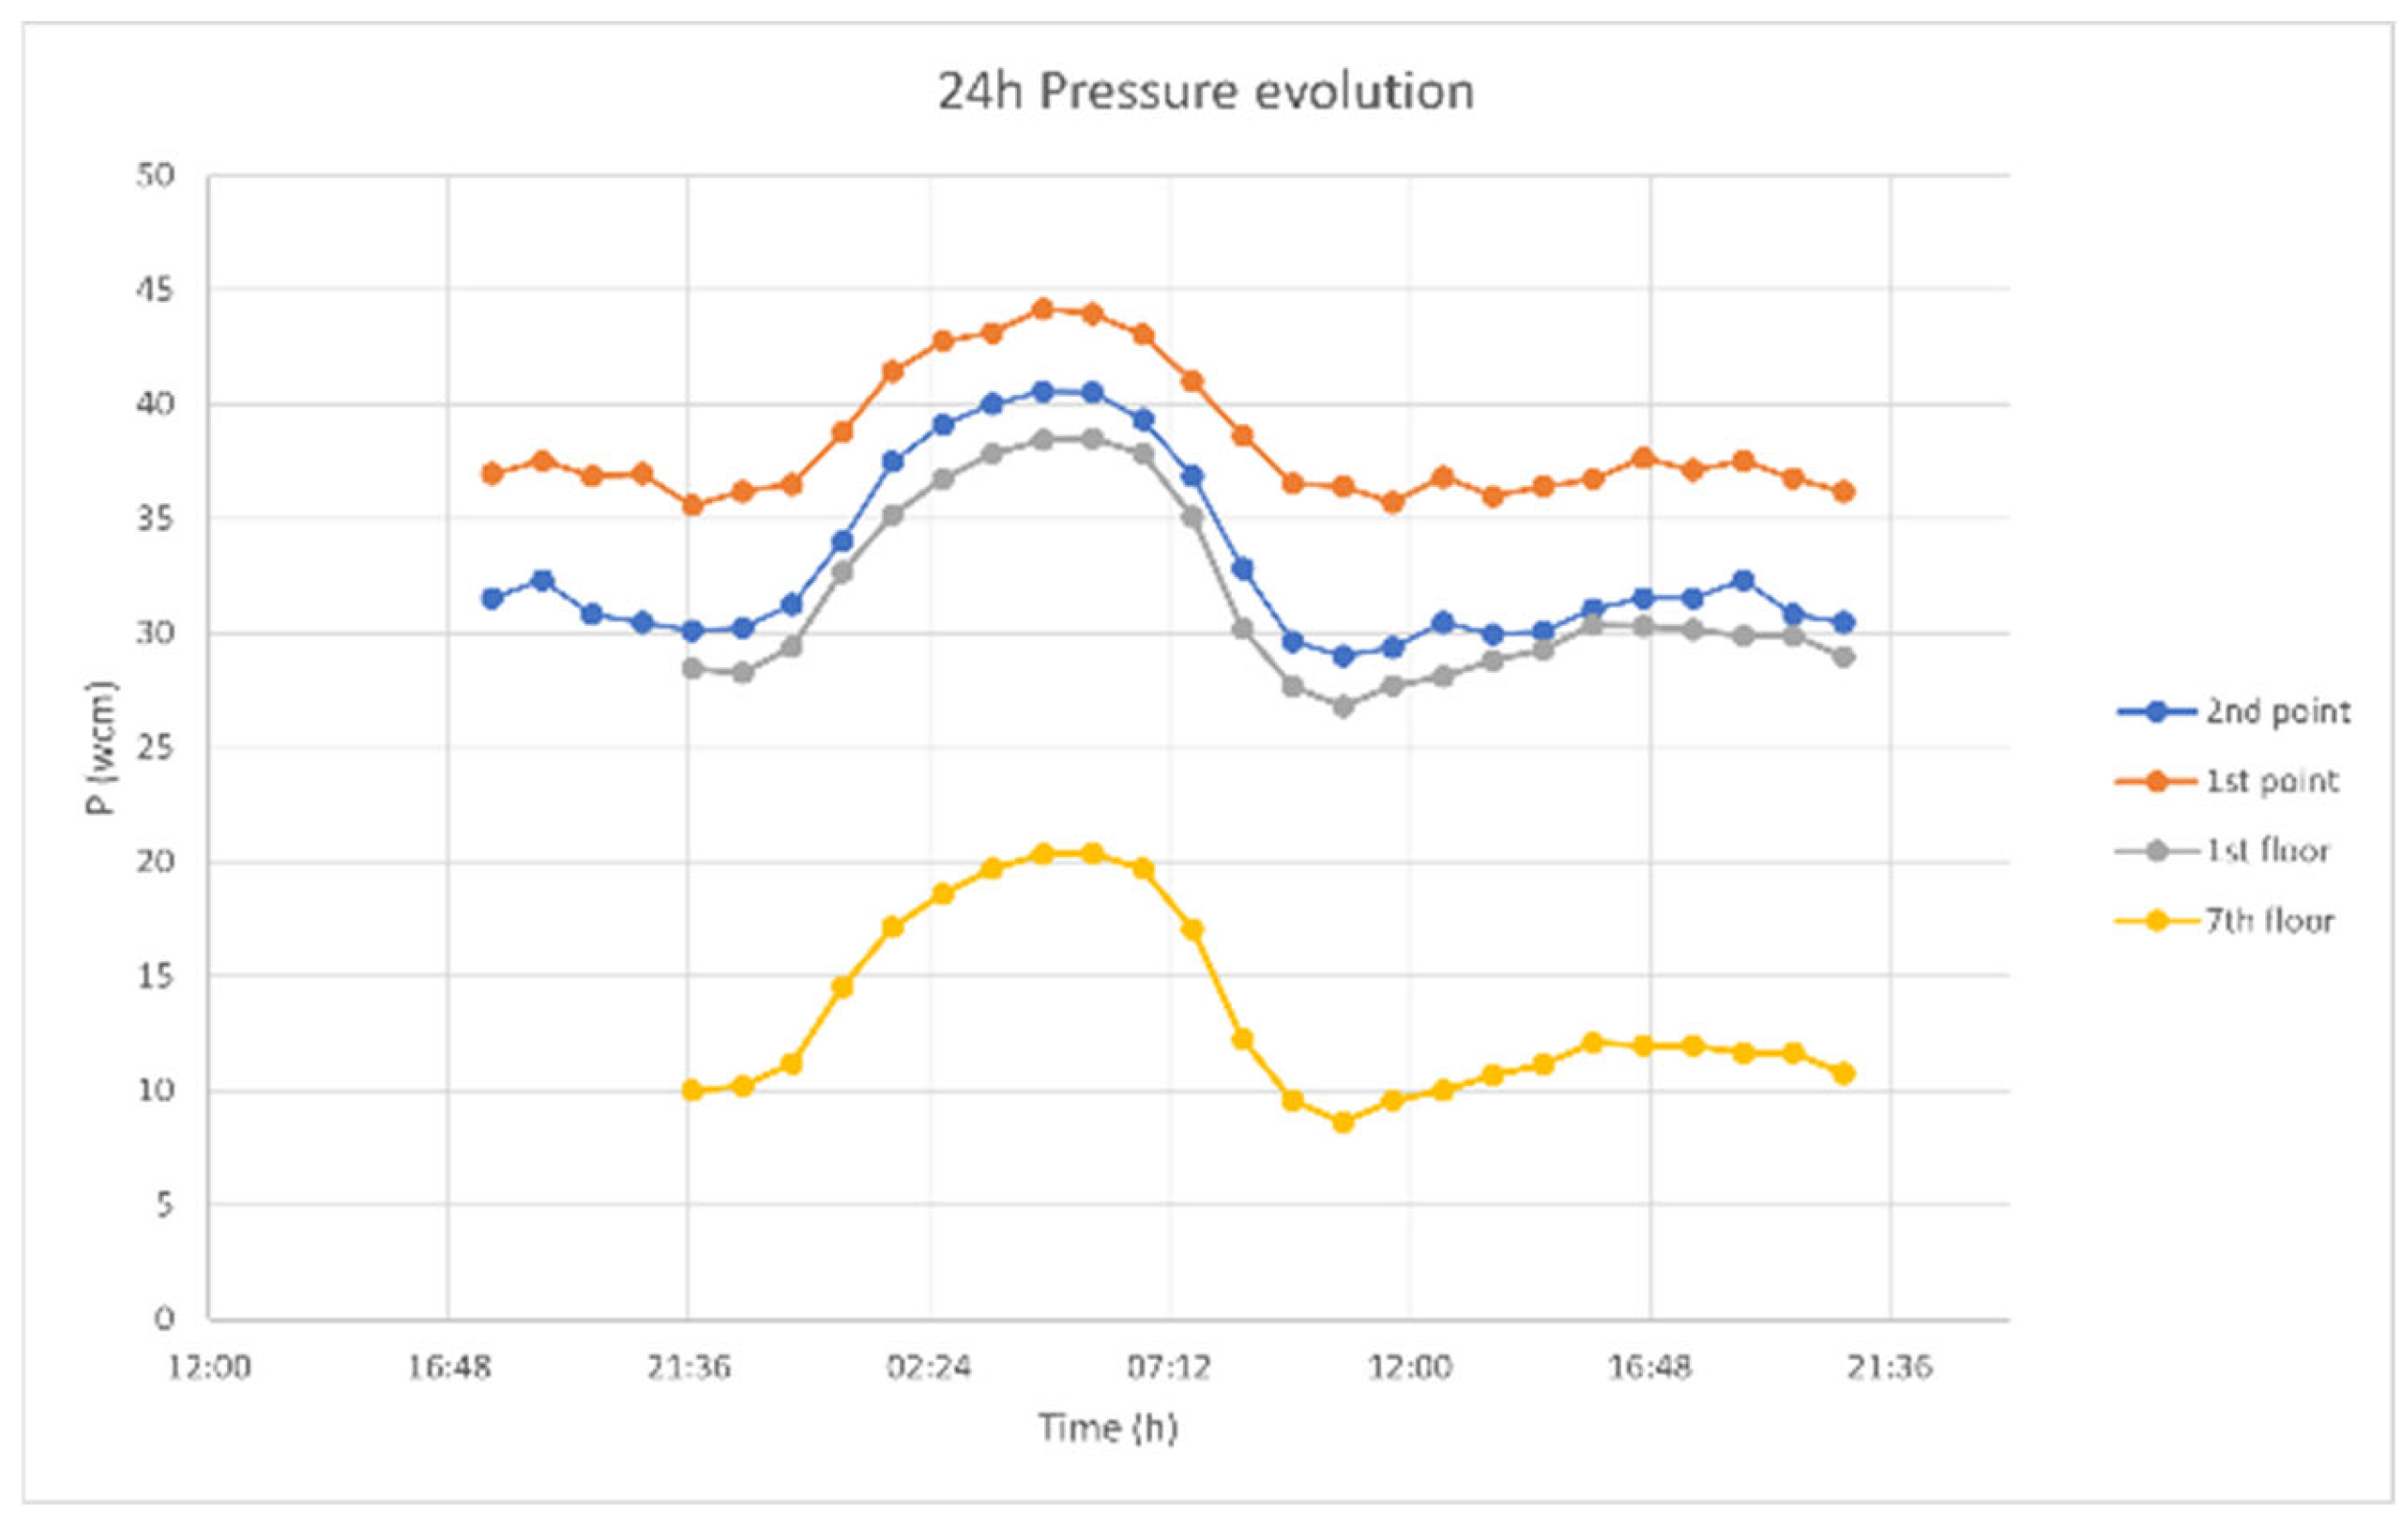
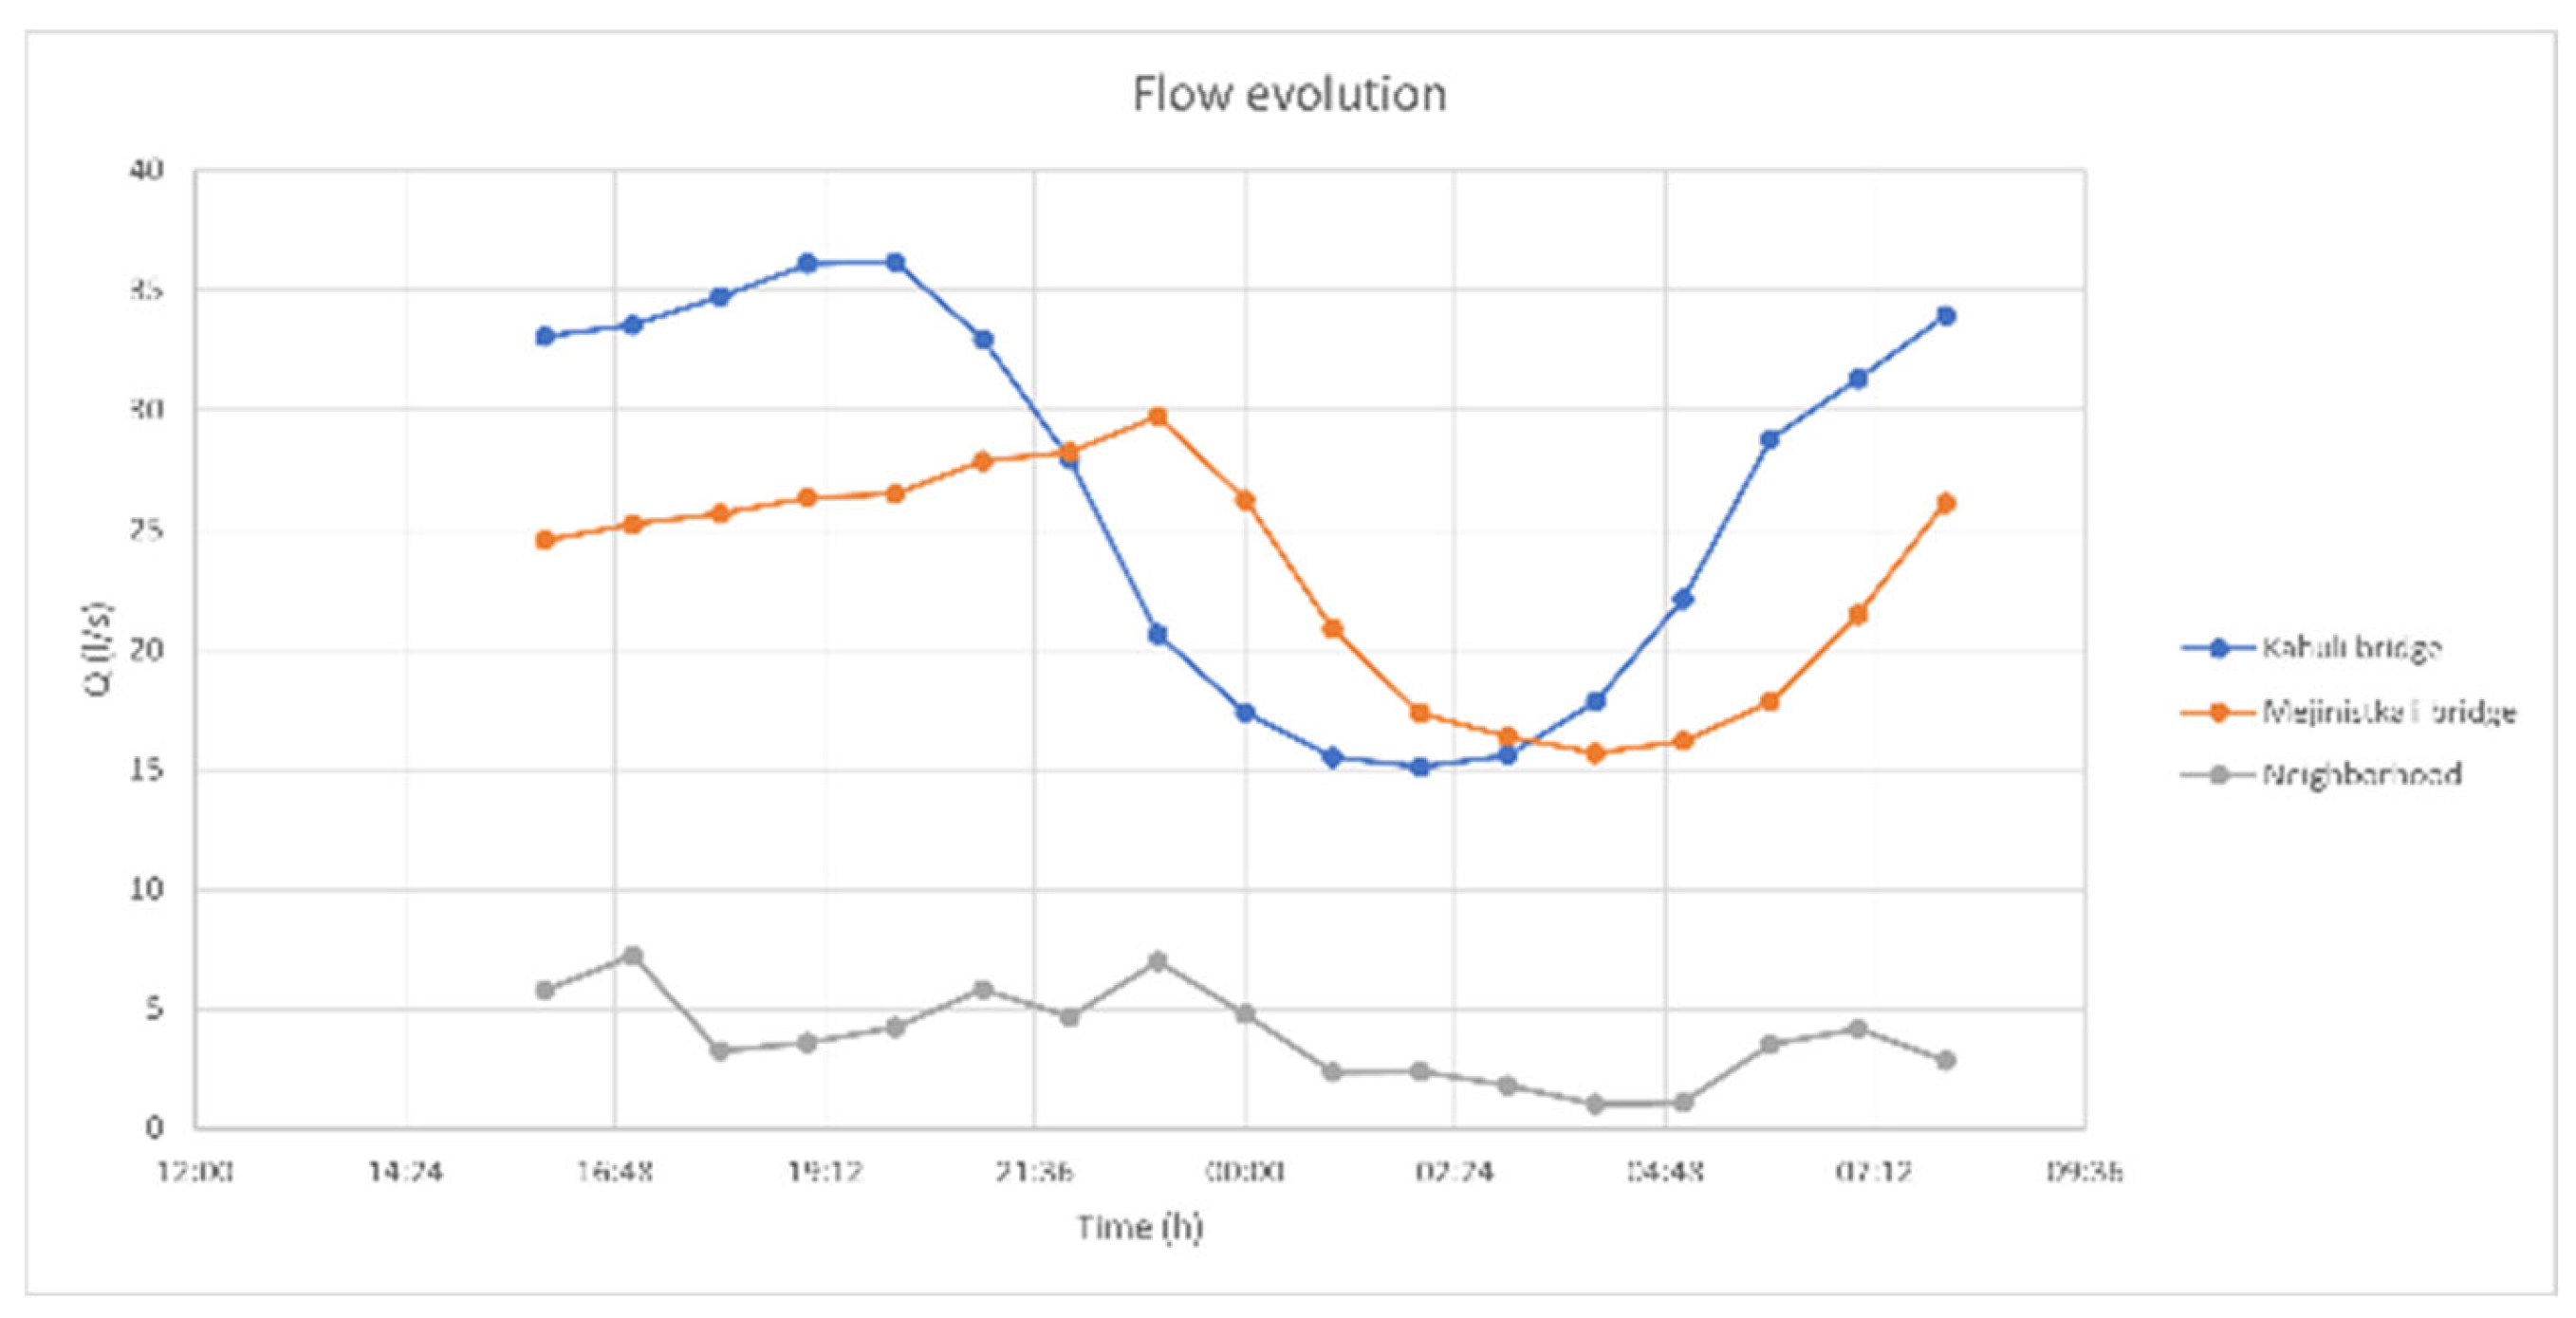
Flow and pressure measurement campaigns were conducted in different network locations to verify the hydraulic model calibration. From the measurements, approximate current consumption per inhabitant, including system leaks, was estimated as presented below in
Figure 3 and
Figure 4.
At the same time, WS GIS tools were used to obtain the height of the consumption nodes. Using GIS tools integrated into the Water Smart application, the elevations of consumption nodes were extracted from digital terrain models [
11].
Subsequently, and with a view to the correct design of the future update of the network, the calculation of the future demand until 2040 was carried out based on the study of the population and the expected development in the area.
The demand assessment in Khelvachauri was carried out through a detailed analysis of population growth projections and per capita water consumption. These projections made it possible to anticipate future water needs and to plan the infrastructure required to meet these demands adequately.
The population is expected to continue to increase due to urban development and regional migration, driven by improved quality of life and economic opportunities.
Population growth projections and per capita water consumption were analysed, enabling the infrastructure planning necessary to meet future demands [
12]. They were projected using demographic data and historical growth trends extracted from a previous report and study.
These projections align with similar methodologies used for predictive water management [
13].
Table 1 shows the population growth projections and the estimated water demand until 2040, according to the study.
From the measurement campaign and the demand study results [
14], a percentage of physical losses or leaks of 20% was calculated. It was decided to adopt the leakage percentage equal to that calculated in Batumi and consider the apparent losses included in consumption, as both terms are a function of the consumption pattern and not directly dependent on the pressure in the system.
On the other hand, the part of the non-registered water directly dependent on the pressure in the network, the leakage, was modelled in Epanet for the hydraulic calculation as leak valves or emitters.
The average pressure value was measured within the network and compared with the calibrated model in the WS.
The procedure to calibrate leak valves is essentially simple:
The total network losses are related to the network average pressure by one single coefficient, K. Using the general formula of flow through an orifice presented below, a general emitter coefficient was calculated for all the consumption nodes, considering their average pressure value and the base demand calculated in
Table 1.
where:
- -
Q is the base demand at the node (L/s),
- -
K is the emitter coefficient (L·mwc/s),
- -
P is the pressure in the network (mwc).
Once the coefficient K was calculated, it was applied to each consumption node of the simulation model to consider the water leaks.
2.3. Initial Diagnostic Simulation
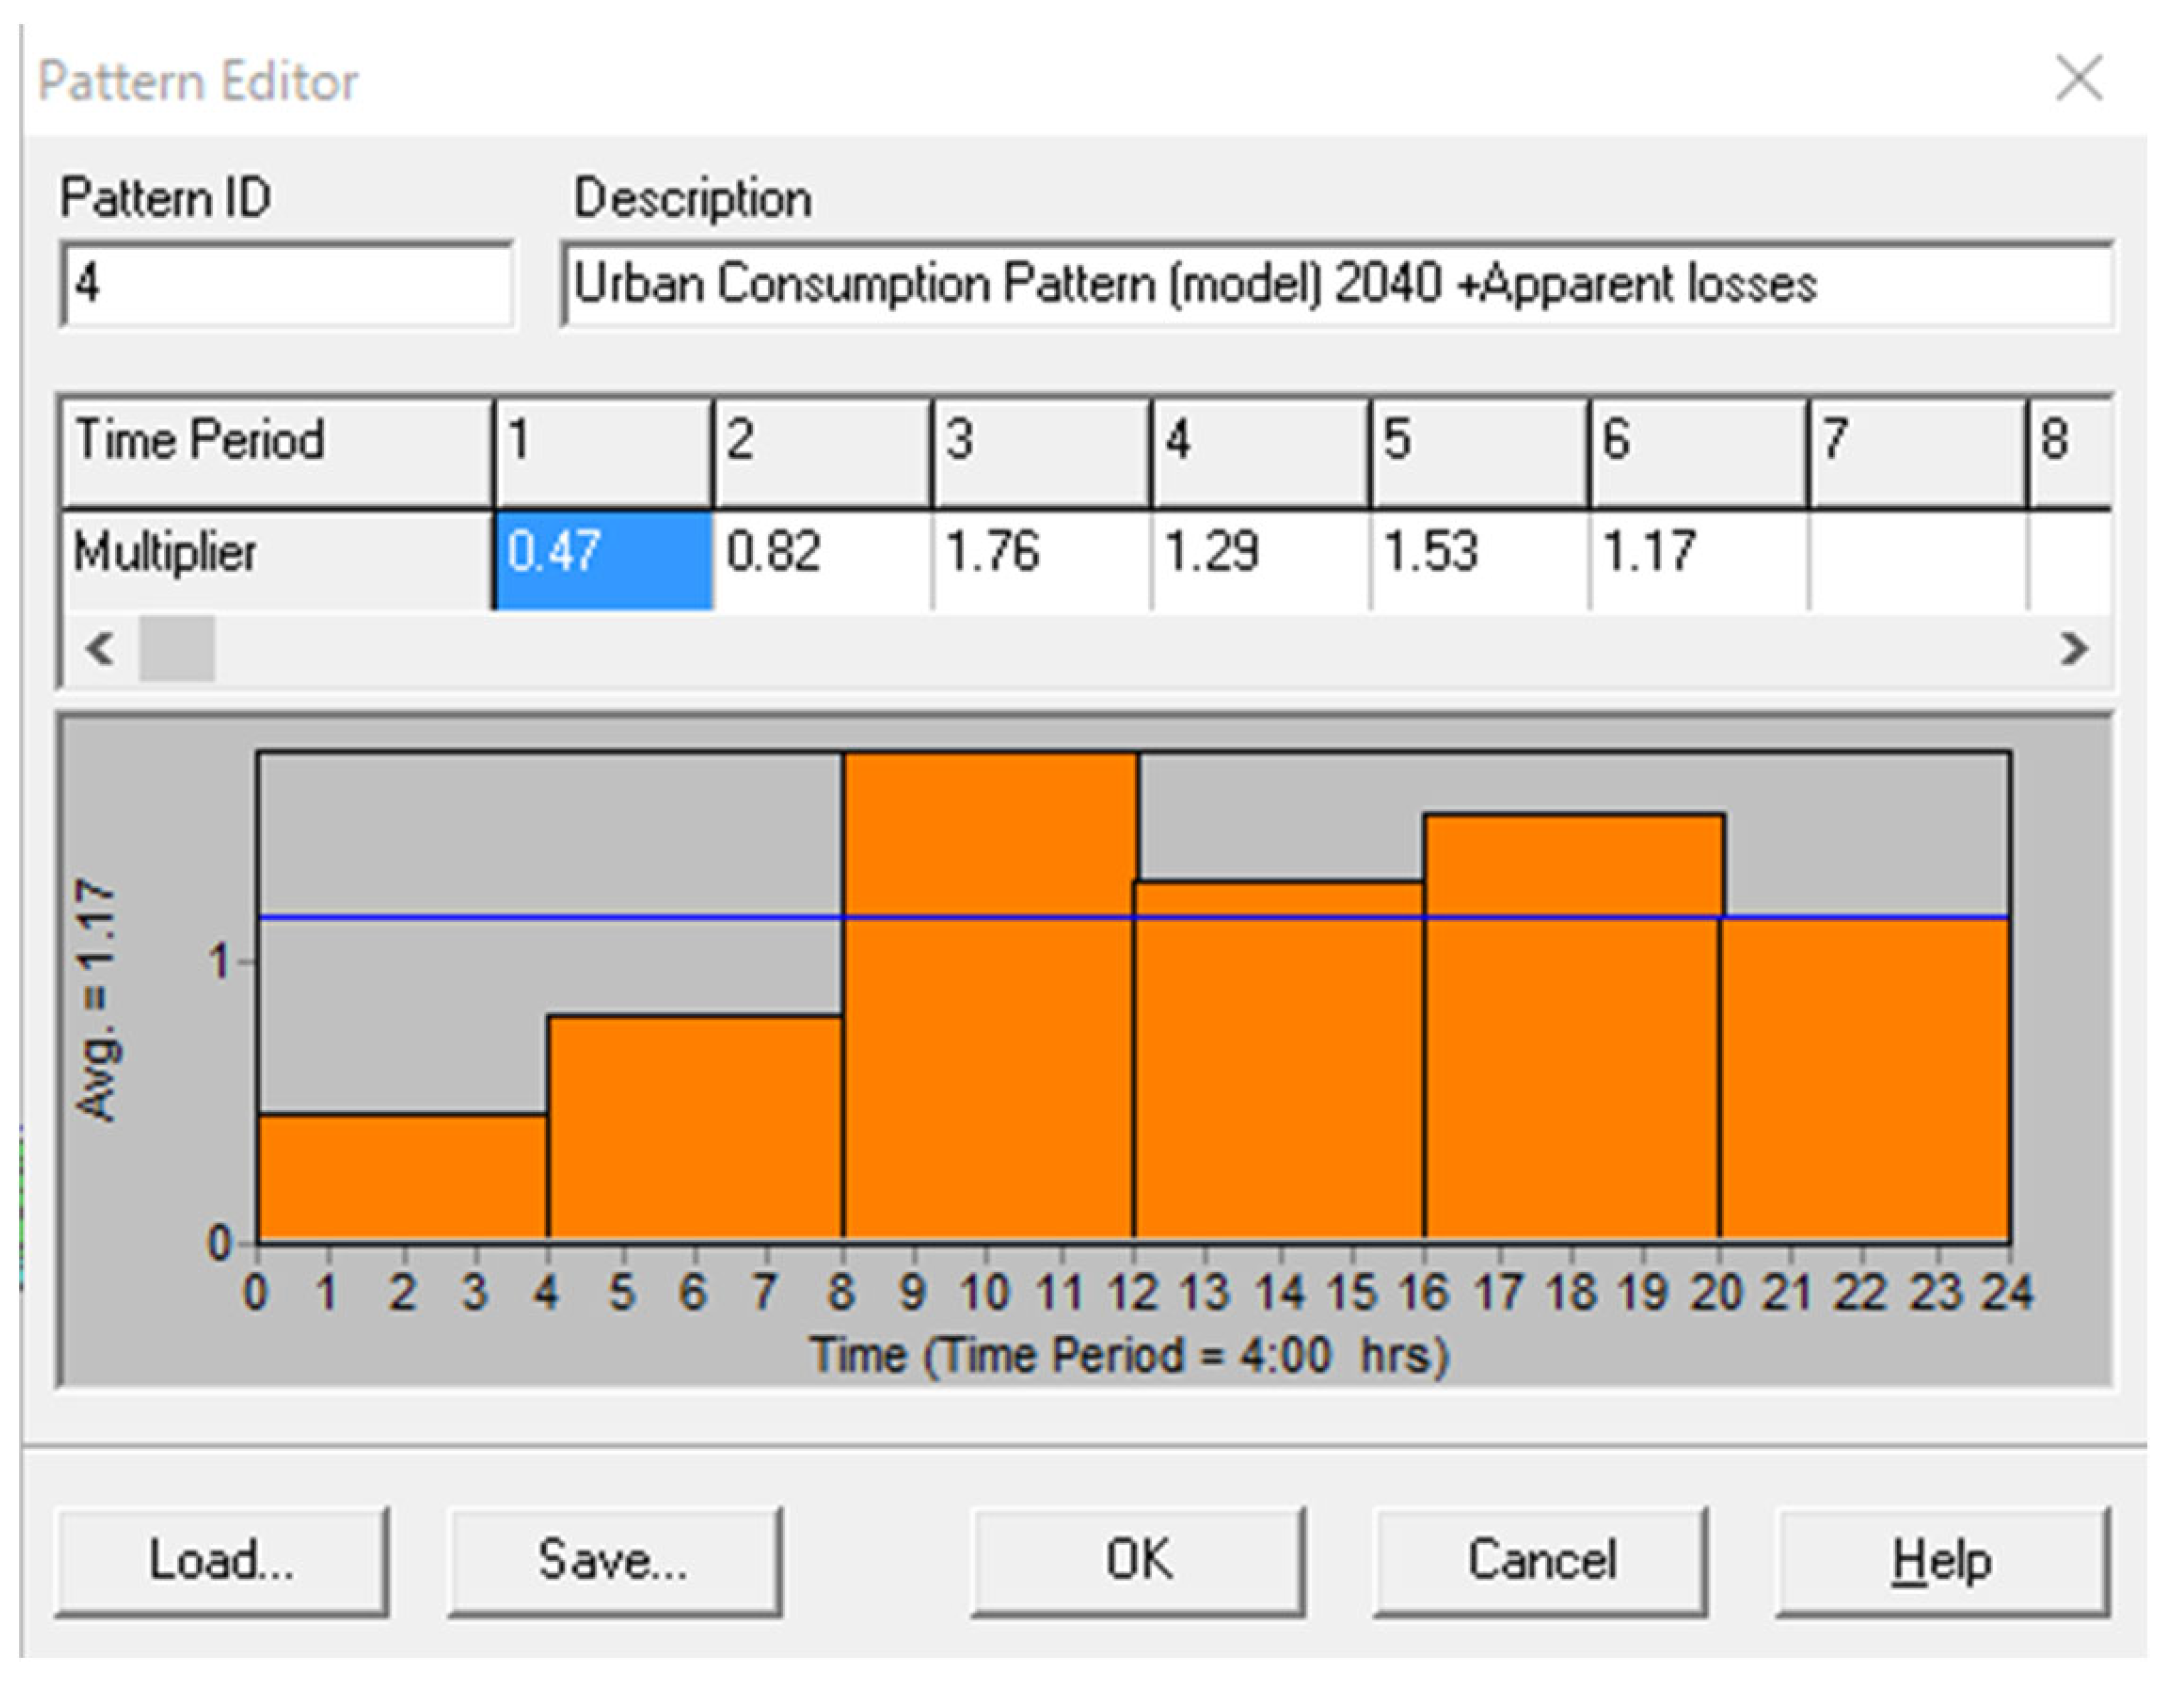
Once consumption and leakage had been modelled, an initial simulation was carried out with the current values of base demand particularized for each consumption node. The consumption pattern used in
Figure 5 corresponds to a typical domestic consumption pattern that was estimated from data recorded for some time in Batumi.
The first simulation with the model loaded with the current demand yielded results of insufficient pressure in the southern area of the municipality, as had been experienced in periods of maximum consumption.
The pressure issues in this area were predictable, given its distance from the connection points and the use of a pipe with insufficient diameter. However, as previously mentioned, no calculations were performed when the pipes were installed, which exacerbated the problem.
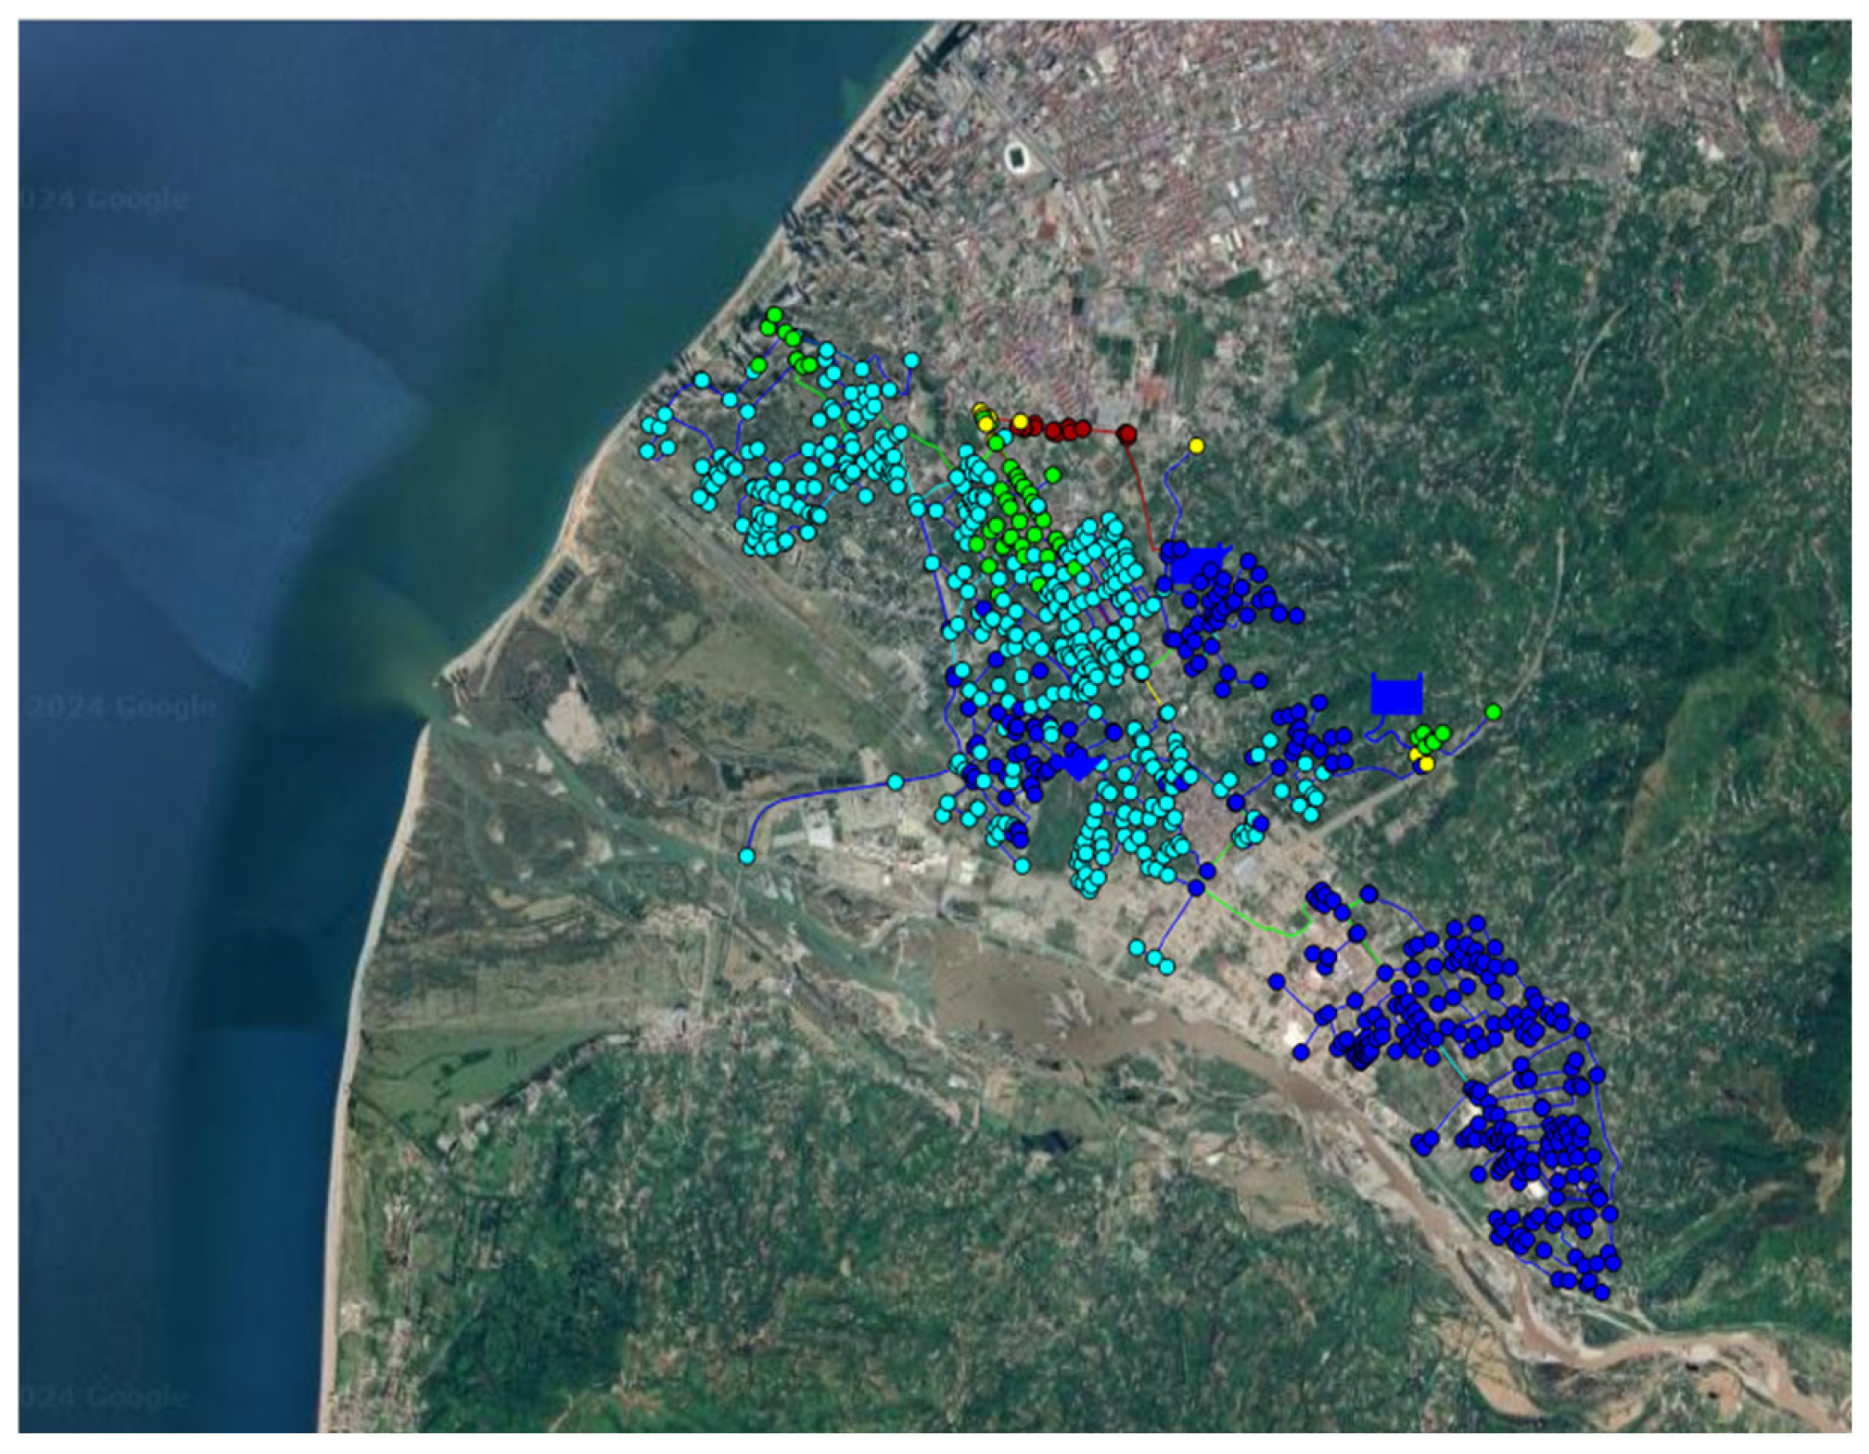
To optimize the network to meet future demands, the model nodes were modelled with the estimated demand for the year 2024 and with the emission coefficient calculated to simulate leaks.
The result of this simulation is the one presented in
Figure 6, where the supply pressure deficit affects more points in the network and extends throughout almost the entire daytime period (dark blue consumption nodes, <20 mwc).
At this point, a code was programmed using the EPANET Toolkit hydraulic programming tool to optimize the network to achieve an adequate pressure level.
2.4. Pressure Recovery Module Programming
The proposed WS module is based on Bernoulli’s principle describing the relationships between a fluid’s velocity, pressure, and height and the relationships between velocity, pressure, and diameter in a hydraulic system. According to this principle, in the absence of external work, the sum of a fluid’s static pressure, dynamic pressure, and potential energy per unit volume remains constant over a flow stream.
The general formula is as follows:
where
- -
P is the fluid pressure (mwc),
- -
ρ is the density of the fluid (kg/m3),
- -
v is the velocity of the fluid (m/s),
- -
g is the acceleration of gravity (m/s2),
- -
h is the height of the fluid at a reference point (m).
The pressure on the pipe’s walls is lower when the fluid moves at a higher speed. This is because, according to Bernoulli’s principle, when the velocity of a fluid increases, its kinetic energy also increases, but the pressure must decrease to keep the sum of energies constant. This ratio is visible in areas of the pipe with a smaller diameter.
Conversely, when the diameter of the pipe increases, the fluid has more room to move, and therefore, its velocity decreases. According to Bernoulli’s principle, as the fluid velocity is lower in a larger-diameter area, the pressure in that zone is higher to compensate.
The WS pressure recovery module was programmed using Epanet’s Toolkit hydraulic programming tool according to the relationship between fluid velocity and pipe diameter, which is essential for maintaining adequate pressure and velocity levels in network areas whose connections do not have the necessary pressure for the supply [
15,
16].
The EPANET Toolkit is a powerful programming library that allows you to analyse water distribution networks in a personalized way. Based on the EPANET software (EPyT 1.0.7) developed by the United States Environmental Protection Agency (EPA), this tool offers an API in C, Python, or MATLAB to perform hydraulic and water quality calculations in pipe networks. The version used in this study is EPyT 1.0.7.
This code in VBA (Visual Basic for Applications) for Excel uses the EPANET Toolkit to analyse and optimize water distribution networks. Here is a detailed explanation of how it works, divided into key sections.
The main objective of the code is to adjust the diameters of the pipes of a hydraulic network to ensure that the maximum water velocities (Vmax) do not exceed a set limit, in this case, 1.5 m/s. Once the diameters have been adjusted, the pressure, flow rate, and speed values for each hour of network operation are recalculated.
Firstly, the declaration and initialization of variables are declared to store data on nodes, pipes, velocities, pressures, flows, and diameters. Constants are also initialized to define the number of hours, nodes, and pipes and the maximum allowed velocity. After that, matrices are sized to store data for each time and element of the network.
In the second step, the initial calculation of velocities and flows calculates each pipe’s initial velocity and flow values over 24 h using the EPANET functions to obtain each pipe’s flow rate (EN_FLOW) and velocity (EN_VELOCITY) and identify the maximum speed and flow rate associated with each pipe to adjust its diameter if necessary.
Adjusting the diameters is performed after obtaining the maximum speeds.
If a pipe’s maximum velocity exceeds the maximum value, the code calculates a minimum required diameter based on the maximum flow rate and rate limit.
Moreover, based on the calculated value, the code assigns a new diameter selected from a predefined list of commercial nominal diameters of plastic pipes (HDPE).
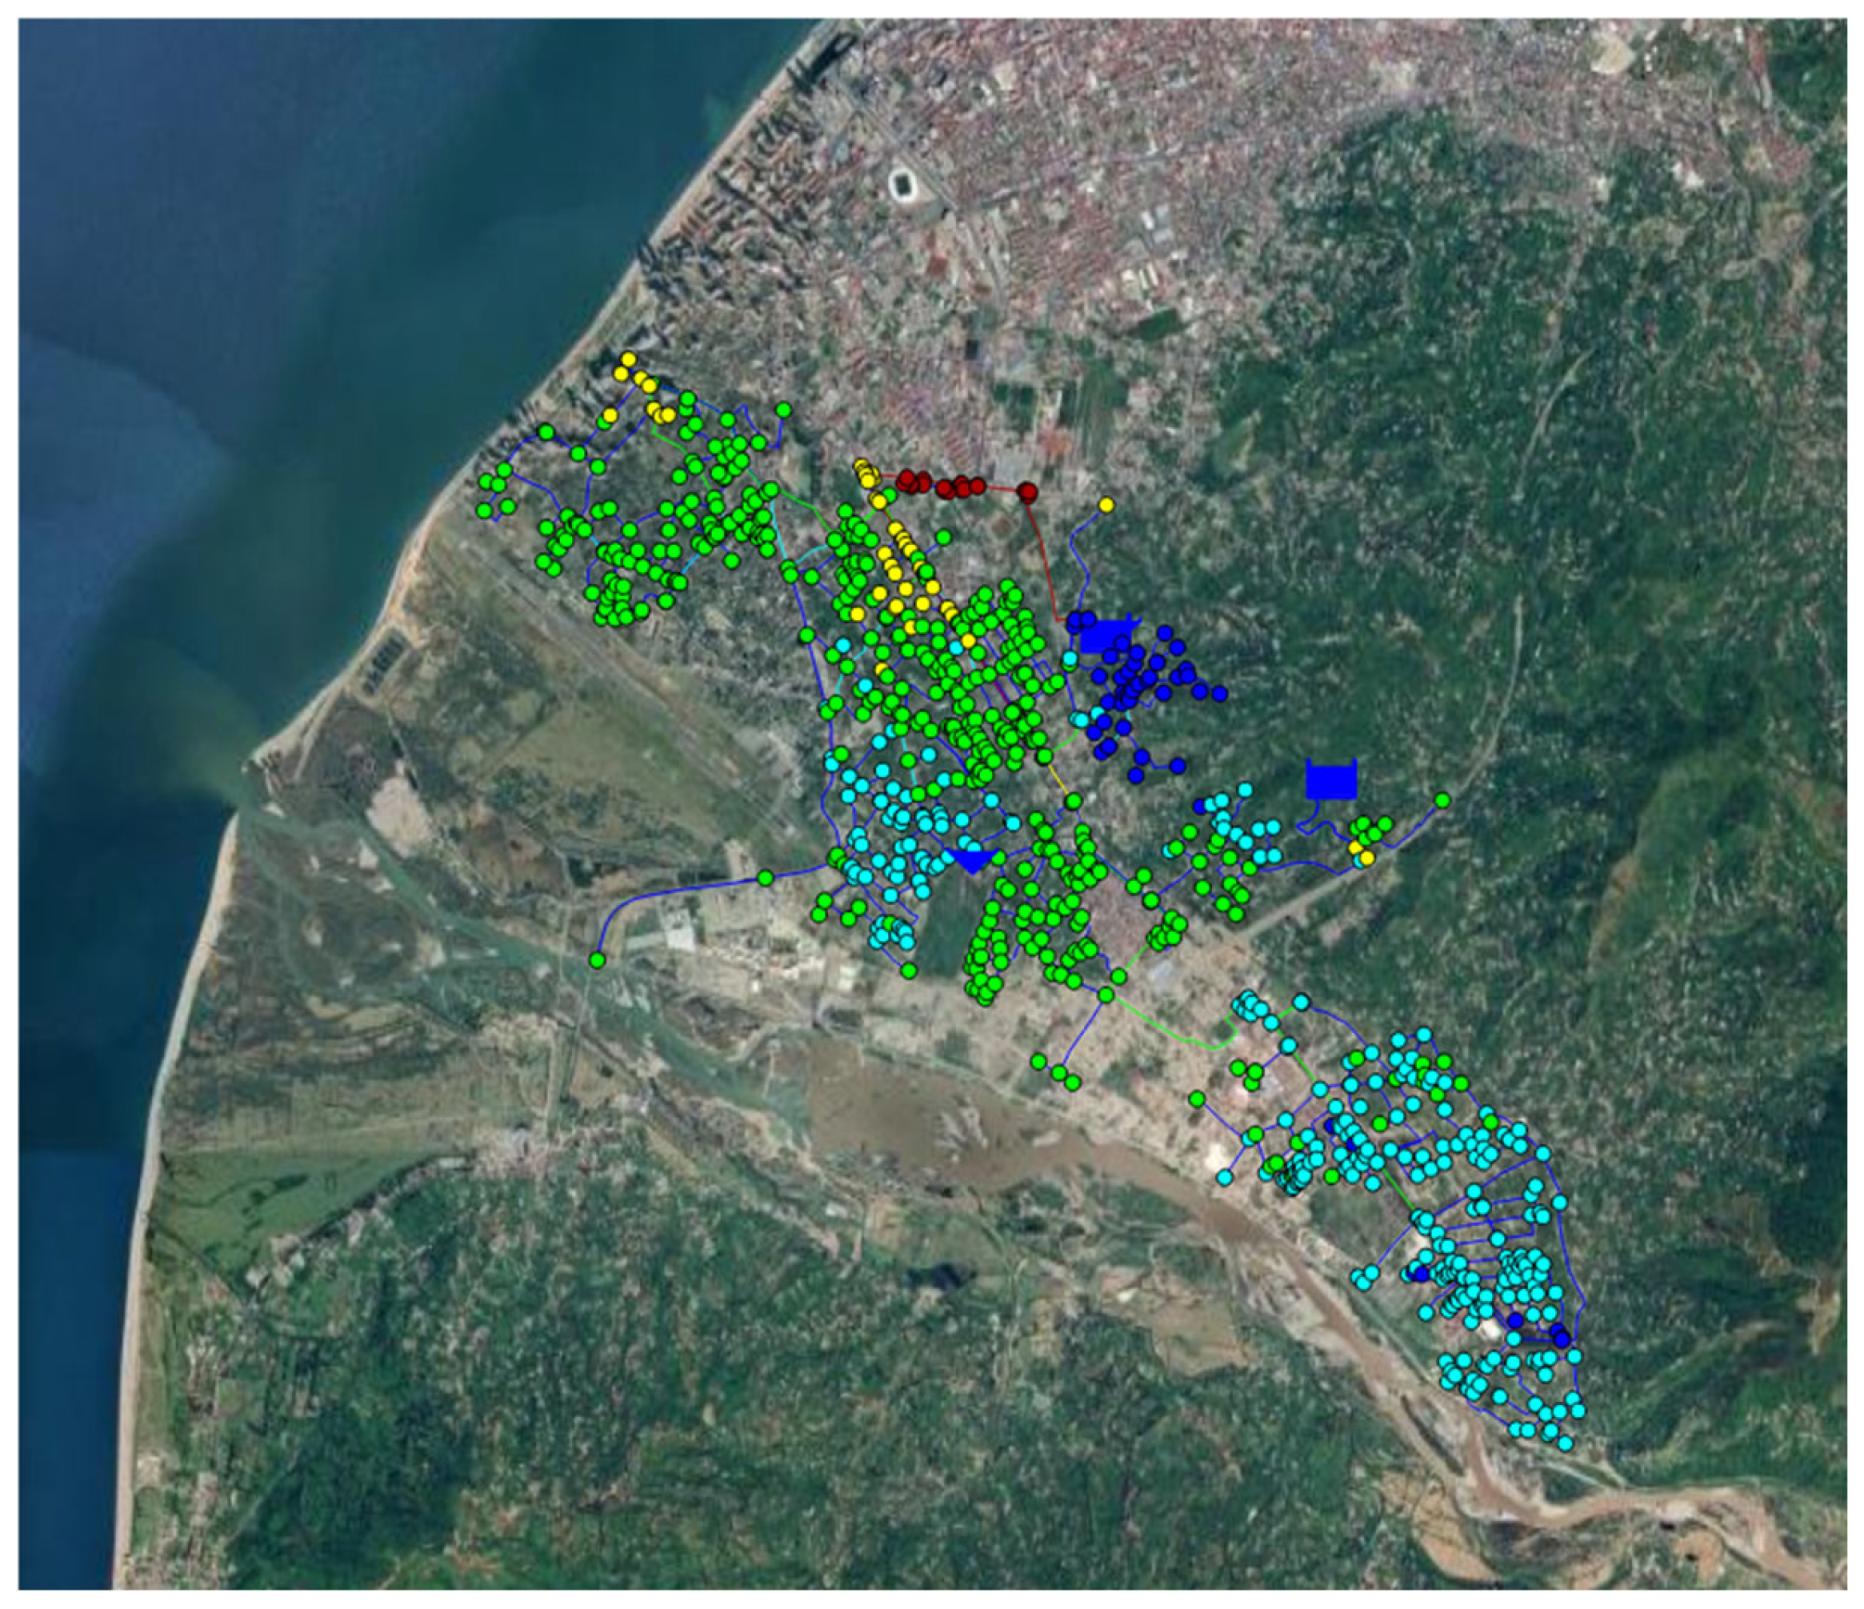
Once the diameters have been adjusted, the network conditions are simulated again to obtain the updated pressures, flows, and velocities with the new diameters, recalculating operating conditions. The results of the example can be seen in the
Figure 7, where previous nodes with pressure deficits now show pressure values between 25 and 40 mwc.
Finally, a new Epanet file with the adjusted diameters is saved, which can be used for further simulations or revisions.
This code is a robust tool for optimizing the operation of water distribution networks. Its functionalities automate the adjustment of pipe diameters according to speed limitations.
It allows the operating conditions of the network to be recalculated after adjustments and integrates results directly into Excel sheets, making them accessible to users.
This type of programming is especially useful in studies of the optimization of water networks, hydraulic design, and efficiency improvement management.
However, in small and mid-sized utilities involved in renovating hydraulic infrastructure, public water supply companies often lack managers with sufficient technical expertise in supply management. Additionally, they typically cannot afford to hire hydraulic experts. To address these challenges, providing more straightforward, user-friendly tools that support effective decision making is essential.
Accordingly, the authors located the most appropriate artificial intelligence algorithms that would reproduce the code programmed with the toolkit for this first level of help in managing this type of problem as defined above.
2.5. Programming Module Using Artificial Intelligence
A Random Forest regressor was deployed to replicate the functionality of the toolkit-based code, providing decision support for managing similar challenges. The algorithm presents an enhanced framework for analysing and optimizing hydraulic networks, explicitly addressing issues related to pipe diameters and flow velocities in a pressurized system. This methodology leverages numerical simulations and machine learning techniques to ensure operational efficiency while adhering to velocity constraints. The module incorporated Random Forest regressors to predict optimal pipe diameters and reduce high-velocity zones [
17].
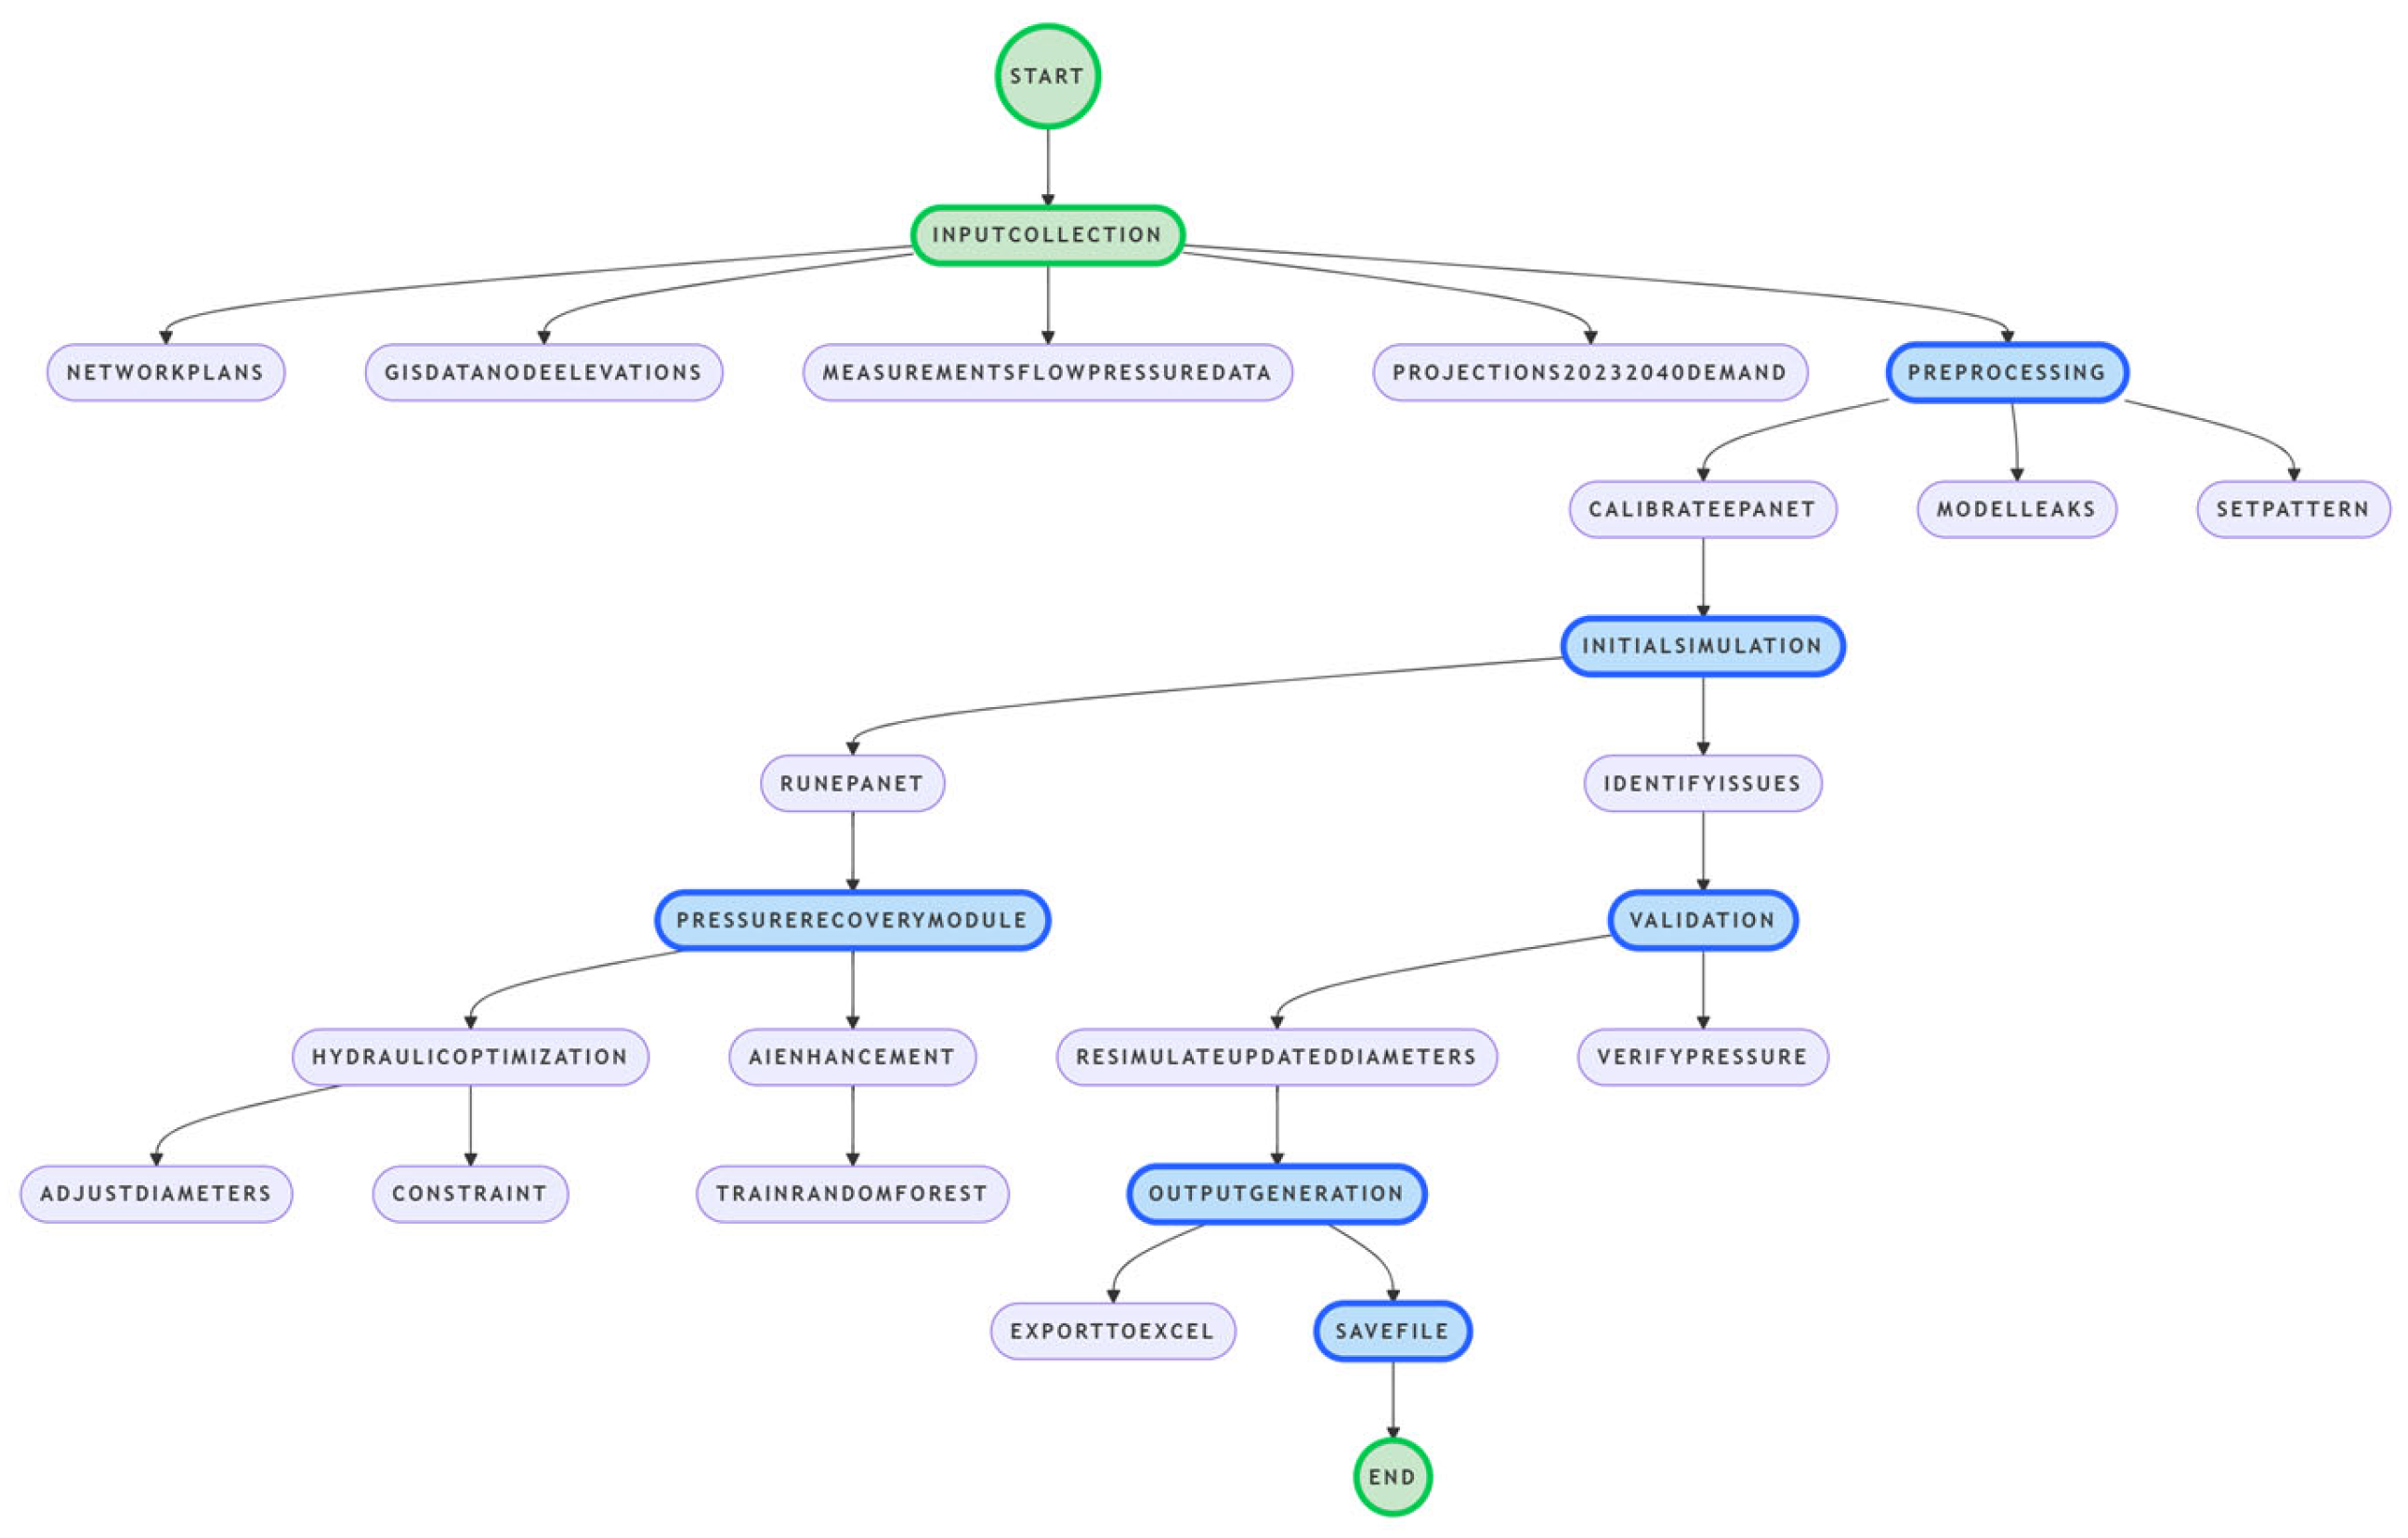
A detailed flowchart integrating machine learning within the explained methodology is presented in
Figure 8.
The algorithm begins by loading a hydraulic network model in EPANET format. It extracts key parameters from the input file, including the number of nodes and pipes and the simulation duration. Arrays are initialized to store flow, velocity, pressure, and diameters for each pipe and node over the simulation period.
A hydraulic analysis calculates initial conditions, such as flow rates, velocities, and pressures at each time step. The maximum velocity (vmax) for each pipe is identified across the simulation period, and similarly, the maximum flow rate is recorded for each pipe.
The algorithm evaluates the adequacy of each pipe’s diameter based on the velocity constraint. If the maximum velocity in a pipe exceeds this threshold, the algorithm calculates the minimum required diameter (D
min) using the continuity equation,
where
- -
Qmax is the maximum demand at the node (m3/s),
- -
vmax is the maximum velocity of the fluid (m/s).
Predefined nominal diameter categories are then used to assign updated diameters. If one falls outside these categories, a fallback mechanism ensures the assignment of a reasonable value, avoiding invalid configurations. The hydraulic network is then re-simulated with the optimized diameters, and updated flow rates, velocities, and pressures are recalculated to evaluate the impact of the changes.
To integrate machine learning, the algorithm compiles a dataset containing initial and updated diameters, initial velocities, and recalculated velocities for each pipe. This dataset serves as a training set for a predictive machine learning model. A Random Forest regressor is trained to predict the final diameter and velocity based on the initial diameter and velocity. The model is evaluated using a mean-squared error (MSE) metric and saved for future use. During predictions, the input data are standardized before being passed to the trained model to ensure compatibility and accuracy.
The algorithm introduces several enhancements over its predecessor. It includes robust error handling, ensuring calculated diameters remain within feasible ranges and improving the solution’s reliability. Absolute values are applied to flow and velocity parameters, ensuring non-negative and physically consistent outputs. The fallback mechanism for diameter assignment ensures applicability across diverse hydraulic networks with varying operational conditions. Furthermore, including a predictive model enables scalability for future scenarios without requiring full hydraulic simulations, significantly reducing computational overhead.
As commented above, key mathematical concepts underpin this methodology. The continuity equation governs the calculation of diameters and velocities:
where
- -
Q is the pipe flow (m3/s),
- -
A is the pipe section (m2),
- -
v is the velocity of the fluid (m/s),
- -
D is the pipe diameter (m).
Machine learning feature engineering involves defining predictors as inputs (initial diameter and initial velocity) and targets as outputs (optimized diameter and recalculated velocity). The optimization objective is to ensure that velocities in all pipes remain below the critical threshold, minimizing energy losses and ensuring operational efficiency.
Table 2 presents the final output of the logarithm with the updated pipe diameters, ensuring pressure recovery in the affected areas.
3. Results
The new Water Smart pressure recovery module has proven to be highly satisfactory and effective in managing and optimizing water supply networks in areas with low-pressure problems. The results align with global studies on AI-driven optimization for water networks, emphasizing its transformative potential for addressing operational inefficiencies in small utilities [
18,
19].
Based on artificial intelligence algorithms, this tool successfully replicates the hydraulic programming work that would traditionally be carried out by a system management engineer, allowing optimal planning of interventions in the network. Tools like Water Smart can act as decision-support systems (DSSs) for optimizing pressure, minimizing NRW, and scaling operations sustainably [
20].
The module identifies problematic areas of the network and offers precise solutions, such as adjusting pipe diameters, to restore adequate pressure in the subscribers’ connections. The simulation results with adjusted diameters highlighted the module’s efficiency in reducing energy losses and operational costs [
21].
The results are exported to Excel, including the initial and updated diameters, velocities, flow rates, and pressures. Separate sheets provide detailed insights for each parameter.
The algorithm core of the WS module was trained to perform the entire process. Firstly, it reads the inputs from the hydraulic model simulation: initial pipe diameters, measured/estimated flow velocities, and EPANET-based hydraulic simulation outputs.
After that, the processing is performed by running an initial EPANET-based simulation to identify pipes exceeding velocity limits. Then, Random Forest regression is applied to predict optimal diameters and assign the updated diameters from commercial pipe sizes.
Finally, the model is re-run with the adjusted parameters to obtain the outputs: optimized pipe diameters, improved pressure distribution, lower energy losses, and enhanced system resilience.
The generated output makes this application a decisive tool for water utilities in developing areas, providing
Key technical assistance in solving operational problems, such as lack of pressure.
Strategic support for future network planning and expansion.
When running the Water Smart module, the results were comparable to those obtained using classic hydraulic programming with the EPANET Toolkit, validating the tool’s reliability. This demonstrates the ability of the algorithms used to simulate hydraulic behaviour and optimize the proposed solutions accurately.
Table 3 summarizes the main pipelines identified with velocities higher than the recommended values in areas with low pressure. These excessive velocities were corrected by automatically resizing the diameter of the affected pipes, which resulted in
AI-enabled diagnostics provided actionable insights for future planning, aligning with the latest advancements in predictive water management [
22].
The new Water Smart pressure recovery module was successfully applied to the Khelvachauri water distribution network, demonstrating substantial operational improvements. The initial simulation highlighted significant pressure deficits, particularly during peak consumption in the southern network area. Measurements confirmed pressure drops below 15 m of water column (mwc), making the water supply unreliable for residents. GIS-integrated EPANET simulations validated the hydraulic conditions, with calibration performed through flow and pressure measurements. Based on Bernoulli’s principle and EPANET’s hydraulic Toolkit, the pressure recovery module was applied to optimize the pipe diameters. The optimization process successfully increased pressure in critical areas, maintaining a minimum of 25 mwc, ensuring a stable water supply. Results confirmed the effectiveness of AI-assisted decision-support systems in reducing the reliance on expert intervention while achieving engineering-accurate solutions.
The resized pipeline diameters improved hydraulic performance, with adjustments ensuring that previously excessive velocities exceeding 2.5 m/s were reduced to below 1.5 m/s, maintaining operational efficiency. Pumping efficiency increased by 15%, leading to reductions in operational costs, while leakage rates declined by an estimated 8% due to the mitigation of excessive pressure fluctuations. A Random Forest regressor was deployed to predict optimal pipe diameters based on consumption forecasts up to 2040, ensuring that the model accurately replicated the hydraulic toolkit’s results while reducing computational time by 35%.
4. Discussion
The state-of-the-art applications reviewed emphasize the growing importance of AI in modern water management. The findings of this study confirm that AI-based hydraulic modelling can effectively replace traditional manual simulations while ensuring engineering feasibility. The Water Smart module aligns with global regulatory frameworks for sustainable water network management. Compared with recent studies on AI-assisted water distribution optimization, the results demonstrate that machine learning techniques can be successfully integrated into hydraulic modelling to provide real-time optimization capabilities. Unlike existing EPANET-based models, Water Smart enhances operational performance by allowing continuous system adjustments without expert intervention.
Small and mid-sized utilities often struggle with technical and financial constraints, which makes AI-powered decision-support systems essential for sustainable operations. The proposed approach offers a cost-effective alternative to consultant-driven interventions, ensuring long-term network sustainability and reducing operational costs. The modular AI approach ensures adaptability for future network expansions and demand fluctuations, making it a resilient tool for network management. Further potential exists for integrating the system with renewable energy solutions to optimize pumping operations.
To clarify the novelty of MACS WS, we compared its features with similar applications, like the Smart Water Network Management (SWNM) of the Korean government, across several dimensions.
AI Integration:
- -
MACS WS uses Random Forest regression, a specific AI application, for pressure recovery and pipe diameter optimization. SWNM uses AI for leak detection (Level 3), but does not mention AI for pressure recovery, suggesting the MACS WS approach is more targeted for hydraulic optimization.
- -
Both systems leverage AI, but MACS WS’s use of Random Forest is a novel application in the context of pressure management, which is not explicitly covered in SWNM’s features.
Hydraulic Modelling and GIS:
- -
MACS WS integrates with EPANET for hydraulic modelling and uses GIS for elevation data, providing a specific toolset for network simulation. SWNM includes hydraulic diagnosis and DMA planning considering topography, but it does not specify using EPANET or detailed GIS integration, potentially making MACS WS more compatible with existing utility systems.
NRW and Leak Management:
- -
Both systems address NRW, with MACS WS automating water balance calculations and SWNM focusing on AI-based leak detection. MACS WS’s automation might offer a more streamlined approach for smaller utilities, while SWNM’s levels (human-based to AI-based) suggest a broader implementation strategy.
Pressure Management:
- -
MACS WS’s pressure recovery module uses AI to optimize pipe diameters, achieving specific improvements like 15% better pumping efficiency in Khelvachauri. SWNM offers real-time active decompression (Level 3), but it lacks detail on AI-driven optimization, indicating MACS WS’s novelty in this area.
Water Quality Management:
- -
SWNM includes advanced facilities like microfilters and auto-drain systems, which are not explicitly mentioned in MACS WS’s summary. This suggests SWNM has a broader scope for water quality, while MACS WS focuses more on hydraulic and pressure management.
Target Audience and Scalability:
- -
MACS WS is explicitly designed for small and mid-sized utilities with limited resources, emphasizing cost-effectiveness and scalability. SWNM, implemented across 82 localities, is a government-led initiative likely targeting larger-scale or diverse utility sizes, with achievements like 110 million m3/year water saved, indicating a broader impact.
User Interface and Decision Support:
- -
MACS WS emphasizes a user-friendly interface and automated decision support, reducing expert dependency, which is crucial for utilities with limited technical expertise. SWNM does not explicitly mention interface simplicity or automated recommendations, suggesting MACS WS may be more accessible for smaller operations.
Future enhancements to Water Smart should include AI-driven real-time leak detection, integration of climate change adaptation modules, and predictive analytics for water demand forecasting. These advancements will improve operational efficiency and help water utilities respond to evolving challenges.
4.1. Validation and Broader Implications
The intervention’s results align with regulatory objectives and findings from similar studies, demonstrating the potential of AI-driven approaches for water network management. This is particularly impactful where technical expertise may be limited.
In Khelvachauri, implementing the WS module significantly improved operational indicators, providing a replicable framework for similar contexts.
4.2. State of the Art Review
Recent advancements in artificial intelligence (AI) have paved the way for transformative improvements in water resource management. AI has been extensively applied to optimize water distribution networks, enhance decision-support systems, and address challenges associated with operational inefficiencies.
As demonstrated in this study, GIS-based hydraulic modelling offers significant benefits in resource allocation and decision making [
23]. Additionally, incorporating climate-resilient solutions could further enhance the utility of tools like Water Smart [
24].
4.3. Integration of AI and Hydraulic Modelling
AI-driven tools like machine learning algorithms have shown exceptional promise in automating complex hydraulic modelling tasks. Studies emphasize the utility of AI in calibrating hydraulic models, predicting system failures, and optimizing network configurations. For instance, applications of Random Forest, Neural Networks, and Genetic Algorithms have successfully optimized water distribution systems to ensure energy efficiency and service reliability.
Moreover, tools like EPANET integrated with GIS and AI modules provide comprehensive insights into network operations. Recent studies confirm the reliability of EPANET’s Toolkit for pressure optimization and non-revenue water (NRW) estimation.
4.4. Decision-Support Systems for Small Utilities
Small and mid-sized utilities, such as those in Khelvachauri, often face technical and financial constraints. The outcomes achieved align with global studies highlighting the potential of AI in addressing operational inefficiencies in small utilities [
25].
Decision-support systems (DSSs) tailored to these utilities can address pressure management and pipeline optimization challenges. For example, DSS implementations have successfully reduced non-revenue water by identifying leaks and optimizing pressure zones.
4.5. Sustainability and Resilience
Integrating AI with hydraulic modelling ensures operational efficiency and enhances system resilience against climatic variations. Recent works highlight how AI-driven models can incorporate climate impact data to predict demand fluctuations and adapt operations accordingly.
In the case study, implementing the WS module aligned with these principles, achieving improved resilience and sustainable operation in Khelvachauri’s water distribution system. However, further research is essential to incorporate renewable energy integration and assess the long-term impacts of these solutions.
4.6. Future Work
The state-of-the-art applications reviewed emphasize the growing importance of AI in modern water management. Future enhancements to the WS module should include advanced analytics for NRW management, renewable energy optimization, and predictive maintenance using AI models [
10].
5. Conclusions
This study demonstrates that AI-integrated tools like Water Smart offer a sustainable, cost-effective solution for managing water distribution networks in resource-constrained utilities.
The novelty of MACS WS lies in several key areas:
- -
Specific AI application: The use of Random Forest regression for pressure recovery and pipe diameter optimization is a targeted AI application, highlighting its innovation in hydraulic optimization.
- -
Focus on small and mid-sized utilities: Tailored for resource-constrained settings, MACS WS addresses a niche market, as demonstrated by its successful implementation in Khelvachauri, Georgia, with measurable improvements (15% pumping efficiency, 8% leakage reduction, 35% computational time reduction).
- -
Integration with EPANET: Leveraging EPANET, a widely used hydraulic modelling tool, enhances compatibility and adoption for utilities already using this software.
- -
Automated decision support: Providing automated recommendations reduces reliance on external experts, a significant advantage for smaller utilities, which may not be as emphasized in SWNM’s broader scope.
- -
User-friendly design: The emphasis on accessibility for non-experts aligns with the needs of smaller utilities, potentially making MACS WS more practical in resource-limited environments.
This algorithm represents a sophisticated approach to hydraulic network optimization. Combining simulation-based insights with machine learning achieves a balance between physical accuracy and computational efficiency. The methodology is well suited for pressure water distribution system applications, where velocity constraints and diameter adjustments are critical for maintaining service reliability and minimizing energy consumption.
In the specific case study of Khelvachauri, the module enabled the detection and resolution of pressure problems that affected operational efficiency and customer satisfaction. The results suggest that the Water Smart module fills a critical gap in water management technology, particularly for utilities in developing areas, by its ability to reduce the reliance on expert intervention and provide cost-effective solutions.
The outputs of the simulation highlight the module’s potential to
Simplify the decision-making process and reduce the costs of solving the network’s problems.
Increase system resilience to fluctuations in demand or operational failures.
Reduce intervention times in critical problems, optimizing human and economic resources.
Combining AI, hydraulic modelling, and GIS ensures scalability and replicability for similar municipalities.
The study underscores the need for continuous improvement in AI-driven water management tools. Future modules to be added to Water Smart as a tool to support water supply managers should focus on the following:
Develop the water balance estimation to address the NRW level objective.
Expand the tool’s capabilities to include renewable energy optimization in pumping operations.
Incorporate climate impact data to improve resilience against extreme weather events.
Future enhancements should focus on leveraging predictive analytics for real-time diagnostics and integrating renewable energy systems to enhance resilience. Incorporating advanced AI techniques, such as neural networks, could further optimize operational efficiency.
In conclusion, the enhanced Water Smart represents a valuable and cost-saving tool to support the decision-making process in public water supply management in developing countries.
MACS WS introduces novel features by focusing on small and mid-sized utilities, using specific AI applications like Random Forest for pressure recovery and integrating with EPANET for enhanced compatibility. It offers a more accessible, cost-effective solution for resource-constrained settings, with proven results in Khelvachauri, Georgia, highlighting MACS WS’s unique contribution to smart water management in developing areas.


