Abstract
It is important to comprehend the evolution of drought characteristics and the relationships between different kinds of droughts for effective drought mitigation and early warnings. The study area was the Pearl River Basin, where spatiotemporal changes in the multiscale water balance and soil moisture at various depths were analyzed. The meteorological data used in this study were derived from the China Meteorological Forcing Dataset, while the soil moisture data were obtained from the ECMWF ERA5-Land reanalysis dataset. The Standardized Precipitation Evapotranspiration Index (SPEI) and Standardized Soil Moisture Index (SSI) were applied to represent meteorological and agricultural droughts, respectively. By using the run theory for drought event identification, the characteristic values of drought events were analyzed. The correlation between the multiscale SPEI and SSI was examined to represent the propagation time from meteorological drought to agricultural drought. This study indicated that while the western part of the Pearl River Basin experienced a worsening atmospheric moisture deficit and the southern part had intensifying dry conditions for soil moisture, the rest of the basin remained relatively moist and stable. Soil conditions were moister in the deeper soil layers. The durations of agricultural droughts have generally been shorter than those of meteorological droughts over the past 40 years. Within the top three soil layers, the severity, duration, and frequency of drought events progressively increased, increased, and decreased, respectively, as soil depth increased. The propagation time scale from a meteorological drought to a four-layer agricultural drought was typically within 1–5 months. This study advanced existing research by systematically analyzing drought propagation times across soil depths and seasons in the Pearl River Basin. The methodology in this study is applicable to other basins to analyze drought complexities under climate change, contributing to global drought resilience strategies. Understanding the spatiotemporal characteristics of meteorological and agricultural droughts and the propagation time between them can help farmers and agricultural departments predict droughts and take appropriate drought-resistant measures to alleviate the damage of droughts on agricultural production.
1. Introduction
Drought is one of the most economically damaging types of natural disaster [1]. In recent years, under the combined influence of global warming and intensified human activity, the scope of multi-type droughts has broadened, with more frequent and widespread drought events, increased disaster rates, and longer durations [2]. Drought types include meteorological, hydrological, agricultural, and socioeconomic droughts. Recently, agricultural droughts triggered by meteorological droughts have become increasingly common. According to global drought disasters from 1900 to 2022 released by the United Nations Convention to Combat Desertification, agricultural drought has caused the deaths of over 10 million people and economic losses of over several hundred billion dollars. In China, drought has caused a reduction in annual crop yield of more than 30 million tons, leading to direct economic losses of over 44 billion yuan annually [3]. While global studies highlight the cascading impacts of drought propagation, significant gaps remain in comprehending the multiscale temporal dynamics and soil depth-dependent responses, especially within monsoon-driven basins characterized by uneven rainfall distribution. The Pearl River Basin, located at the intersection of the South China Sea and southwestern monsoons, has abundant water resources and rainfall with recurrent droughts due to high evaporation (~1400 mm/year) and uneven precipitation distribution. Since 2003, a drought has occurred almost every year, with severe drought events in 2009, 2010, and 2011 resulting in a reduction of more than 5% in the total grain output and the weakening of the vegetation’s carbon absorption capacity [4,5,6]. Studying the evolution and propagation from meteorological drought to agricultural drought is beneficial for planning and arranging agricultural irrigation, structuring crops, allocating water resources, and maintaining stable growth periods for various vegetation types and crops, and it also has significant implications for achieving carbon peak and carbon neutrality goals.
Current research on droughts primarily focuses on the spatiotemporal evolution of multi-type droughts and the factors driving drought propagation. For example, Tian et al. [7] identified drought events by constructing a multivariate drought index capable of simultaneously representing meteorological and hydrological droughts to study the evolutionary characteristics and development trends of annual-scale droughts in the Xijiang River Basin. In a study on the spatiotemporal evolution and joint probability characteristics of agricultural droughts, Chen et al. [8] used a geographic detector to explore the driving mechanisms of agricultural drought and established a weighted regression model for scaling soil moisture studies. Most existing studies have examined the spatiotemporal variations in droughts at annual and seasonal scales, primarily integrating single and multiple variables to analyze the driving factors of drought. Research on the propagation of meteorological droughts into agricultural droughts has predominantly adopted a holistic perspective. However, investigations into multitemporal drought evolution and propagation remain limited. Additionally, there are inherent differences in drought propagation across different soil depths and finer spatial scales, which require further exploration and analysis. For instance, deeper soils likely exhibit longer propagation lags due to slower moisture infiltration.
This study aimed to determine the response time of agricultural drought to meteorological drought in different soil layers. Initially, we analyzed the spatiotemporal evolution of typical climatic elements and soil moisture. Then, based on the Standardized Precipitation Evapotranspiration Index (SPEI) and the Standardized Soil Moisture Index (SSI), we examined the spatiotemporal change patterns of characteristic variables of the two types of drought events and explored whether there was a lag effect between them. Finally, through a correlation study between the monthly SSI and SPEI across 48 timescales, the timescale corresponding to the strongest correlation was identified as the drought propagation time.
2. Materials and Methods
2.1. Study Area
The Pearl River Basin (PRB) is located in southern China, adjacent to the South China Sea, and includes the Xijiang, Beijiang, Dongjiang, and Pearl River Delta watersheds, with a total area of approximately 453.7 thousand square kilometers (Figure 1) [4]. There is significant water evaporation (~1400 mm/year) and uneven spatial and temporal distributions of rainfall within the basin, and these conditions lead to frequent and widespread drought events [4,6]. In Xijiang, Karst-dominated western areas face chronic groundwater depletion, accelerating drought propagation. The decrease in precipitation caused by climate change is the main cause of drought in Dongjiang and Beijiang. In the Pearl River Delta, urbanization increases water demand and dry-season saltwater intrusion reduces water intake time, which exacerbates water scarcity [9,10]. Drought in the PRB is becoming increasingly prominent and complex, affecting regional water security and the positive development of the economy and society.
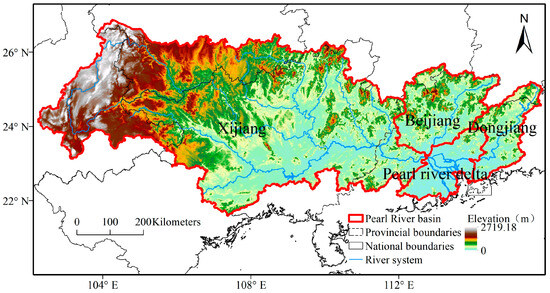
Figure 1.
A map of the Pearl River Basin.
2.2. Data
The meteorological data used in this study were obtained from the China Meteorological Forcing Dataset (1979–2018) of the National Tibetan Plateau/Third Pole Environment Data Center and the original data of the dataset are from the observation data of the Meteorological Bureau, reanalysis data, and satellite remote sensing data [11,12]. This dataset spans 1979 to 2018 with a spatial resolution of 0.1° and a temporal resolution of 3 h. We used this dataset to compile monthly data and calculate potential evapotranspiration (PET) based on the FAO (Food and Agriculture Organization) Penman–Monteith formula [13,14]. Water balance, which refers to precipitation (P) minus PET, was applied as a typical climatic element to analyze dry and wet variations in this study [15]. The potential evapotranspiration calculated in this study is consistent with most studies [16].
The soil moisture (SM) data used in this article were derived from the ECMWF (European Centre for Medium-Range Weather Forecasts) ERA5-Land (ECMWF Reanalysis v5-Land) reanalysis dataset [17]. From 1950 to the present, it has a spatial resolution of 0.1° and a temporal resolution of 1 h. The soil moisture data in this reanalysis dataset have been extensively used and analyzed by many scholars and can accurately represent the changes in soil moisture [17,18,19,20,21]. For example, Zhang et al. found that soil moisture in ERA5-Land is overestimated compared with in situ data, but the calculation of drought index can reduce this bias to some extent [19]. We extracted monthly data of four layers of soil moisture designated as VSW1, VSW2, VSW3, and VSW4, with units in m3/m3, in the PRB from 1979 to 2018. The depths of the four soil moisture layers were 0–7 cm, 7–28 cm, 28–100 cm, and 100–289 cm, respectively.
2.3. Theil–Sen Slope for Trend Detection
We employed the Theil–Sen slope estimator as a trend diagnostic method to analyze the annual scale trends of water balance and soil moisture changes in the PRB. The Theil–Sen slope method is a robust nonparametric statistical approach for trend calculations [22]. This method is computationally efficient and insensitive to measurement errors and outlier data, making it suitable for trend analyses of long time-series data. The formula is as follows:
2.4. Calculation of Drought Indices
We used SPEI to assess meteorological drought [23] and SSI to evaluate agricultural drought [24]. The specific calculation method was as follows:
where represents the standard normal inverse transformation which ensures that the indices follow a standard normal distribution, enabling consistent drought classification across timescales and locations [23]. D represents the variable to be analyzed, indicating the accumulation of P-PET or SM over different timescales:
where represents the rank of the length of the entire monthly time series, which equals 480 (12 × 40), and represents the aggregation length, which has 48 timescales from 1 to 48 months.
represents the probability distribution used to fit P-PET or SM. For SPEI, the commonly used approach is the three-parameter log-logistic probability distribution with parameters estimated via the linear moment method. For SSI, which uses a gamma distribution which is determined by the Kolmogorov–Smirnov (K-S) test to be a suitable theoretical distribution function [25], the parameters are estimated via the maximum likelihood method:
As the gamma distribution did not include the case of zero soil moisture, the probability of an event with zero precipitation was
where is the number of cases in which the precipitation is 0 and is the total number of time series.
2.5. Drought Feature Identification
We applied run theory to identify drought events and analyzed the changing patterns with three characteristic variables: drought duration, drought severity, and frequency of drought occurrences [26]. Run theory defines a drought event as a consecutive period where the drought index remains below a predefined threshold which helps objectively identify the start, end, duration, and cumulative deficit (severity) of drought episodes [27]. Drought duration refers to the period from the start to the end of a drought event, whereas drought severity is defined as the absolute value of the sum of all drought indices during the drought period. Furthermore, a preliminary judgment of drought was made for periods when the drought index value was less than −0.1.
2.6. Drought Propagation Analysis
Among the various types of droughts, meteorological drought is generally seen as a precursor to other forms of drought, such as agricultural drought, with a certain latency. Numerous prior studies have used correlation analyses to determine the lag times between different types of droughts [28,29]. We calculated the correlation between the multiscale SPEI series (ranging from 1 to 48 months in this study) and the monthly SSI series to analyze the sizes of the correlation coefficients, thereby determining the timescales of drought propagation. The calculation is as follows:
where denotes the maximum correlation coefficient in the th month at the month timescale, indicates the maximum value, represents the Pearson correlation coefficient, represents the SPEI sequences of the ith month at the j-month timescale, and represents the 1-month timescale SSI sequences of the ith month.
A value of greater than 0 indicates a positive correlation, whereas a value less than 0 indicates a negative correlation. The stronger the linear correlation between the variables, the closer the absolute value of is to 1.
Figure 2 shows the technical route of this paper. All data analysis, calculations, and plotting are implemented using Python 3.11 code.
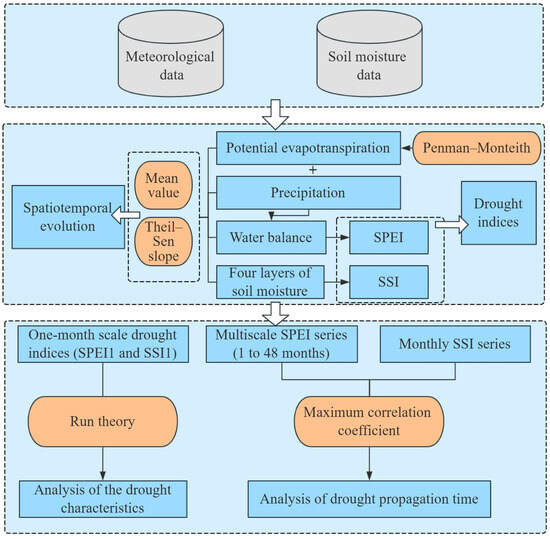
Figure 2.
Method flow chart.
3. Results
3.1. The Spatiotemporal Evolution of Typical Climatic Elements and Soil Moisture
3.1.1. Analysis of the Spatiotemporal Evolution of Water Balance
This study selected water balance as a typical climatic element to study the dry and wet changes in the PRB from 1979 to 2018. A water balance value greater than 0 indicates a water surplus, suggesting a humid climate, and a value less than 0 indicates a water deficit, suggesting a dry climate. Figure 3 displays the interannual spatial variation in the water balance. A 10-year moving average was used to study the spatial changes in atmospheric moisture. Figure 4 shows the water balance time series on a yearly scale.
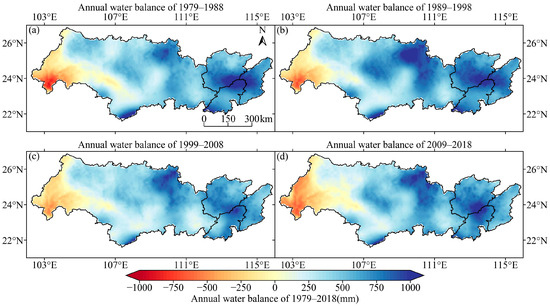
Figure 3.
Spatial distribution of the decadal average water balance. (a–d) The annual average water balance from 1979 to 1988, 1989 to 1998, 1999 to 2008, and 2009 to 2018, respectively.
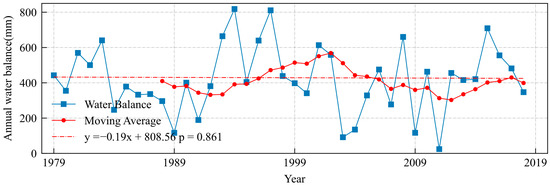
Figure 4.
Annual-scale temporal changes in water balance.
As shown in Figure 3, the westernmost part of Xijiang has been in a state of water deficit for a long time, whereas the central and eastern parts of Xijiang and most areas of Beijiang, Dongjiang, and the Pearl River Delta region have consistently maintained a state of water surplus. Temporally, from 1979 to 2008, the water deficit in the westernmost part of Xijiang showed an alleviating trend; however, from 2008 to 2018, the water deficit worsened. From 1979 to 1998, the central and eastern parts of Xijiang, Beijiang, most areas of Dongjiang, and the Pearl River Delta region all experienced a trend toward increased wetness in their water balance conditions, which remained essentially stable from 1998 to 2018.
As shown in Figure 4, from 1979 to 2018, the PRB was in a state of water surplus, with the water balance levels fluctuating continuously. The highest water balance level reached 810 mm, and the lowest was close to 0 mm, showing an overall insignificant (p = 0.861) downward trend in water balance.
Gao et al. [30] found that the water balance in the eastern part of the Pearl River Basin increased while the water balance in the western part decreased from 1961 to 2010. The spatial distribution and change trend of water balance in this study are consistent with those results.
3.1.2. Analysis of the Spatiotemporal Evolution of Soil Moisture
Figure 5, Figure 6, Figure 7 and Figure 8 show the spatial distributions of the decadal average soil moisture for VSW1–VSW4, respectively. These figures show that, specifically, the southern and eastern parts of Xijiang, the southern part of Beijiang, most areas of Dongjiang, and the Pearl River Delta experienced relatively more arid conditions in the soil moisture from the first to the fourth layers. The central and northern parts of Xijiang and northern parts of Beijiang experienced more humid conditions in terms of soil moisture from the first to fourth layers. Temporally, from 1979 to 2008, the soil moisture in the four layers in the southern and eastern parts of Xijiang, the southern part of Beijiang, most areas of Dongjiang, and the Pearl River Delta showed a trend of becoming drier; however, the degree of dryness was somewhat alleviated from 2008 to 2018. The soil moisture in the other areas remained unchanged in the four layers.
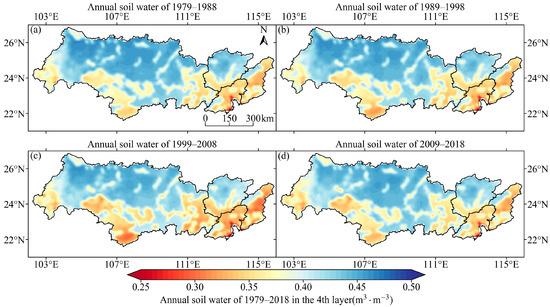
Figure 5.
Spatial distribution of the decadal average soil moisture in VSW1. (a–d) The annual average soil moisture in VSW1 from 1979 to 1988, 1989 to 1998, 1999 to 2008, and 2009 to 2018, respectively.
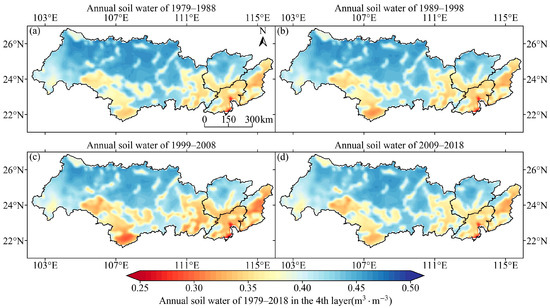
Figure 6.
Spatial distribution of the decadal average soil moisture in VSW2. (a–d) The annual average soil moisture in VSW2 from 1979 to 1988, 1989 to 1998, 1999 to 2008, and 2009 to 2018, respectively.
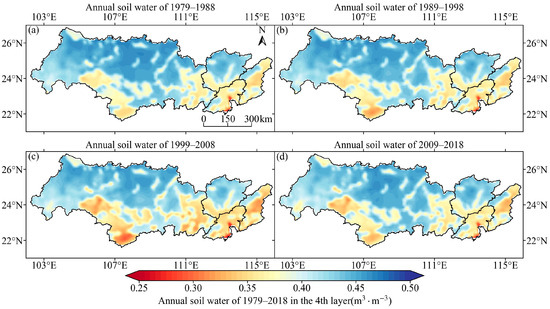
Figure 7.
Spatial distribution of the decadal average soil moisture in VSW3. (a–d) The annual average soil moisture in VSW3 from 1979 to 1988, 1989 to 1998, 1999 to 2008, and 2009 to 2018, respectively.
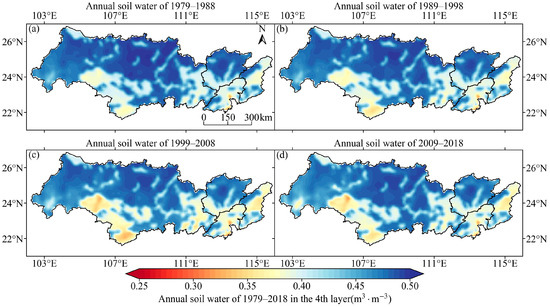
Figure 8.
Spatial distribution of the decadal average soil moisture in VSW4. (a–d) The annual average soil moisture in VSW4 from 1979 to 1988, 1989 to 1998, 1999 to 2008, and 2009 to 2018, respectively.
Figure 9 shows the overall annual average soil moisture temporal trend in the PRB region. Overall, the soil moisture in all four layers exhibited a drier trend, with the fourth layer showing a significant (p = 0.003) trend. The annual average soil moisture levels in VSW1, VSW2, and VSW3 were similar. However, the soil moisture in VSW4 was larger than the soil moisture in VSW1, VSW2, and VSW3, indicating more humid conditions in VSW4. There are some hydrological mechanisms to the higher moisture retention in deeper soil layers: (1) Deeper soil layers are less exposed to atmospheric evaporative demand compared to surface soils. (2) The surface layer is usually sandy loam with high hydraulic conductivity that promotes rapid drainage, while the deeper layer contains a higher clay content. (3) Deep soil moisture is responsive to precipitation anomalies on a longer time scale.
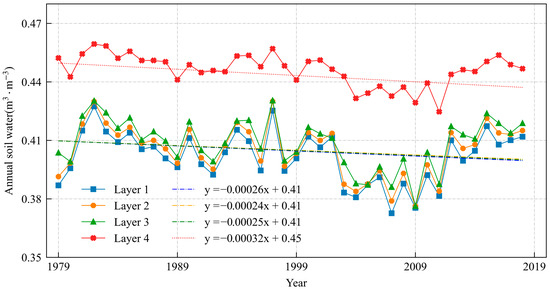
Figure 9.
Annual-scale temporal changes in soil moisture in VSW1–VSW4.
3.2. Analysis of the Spatiotemporal Evolution of Drought Based on Drought Characteristics
This study used one-month scale drought indices (SPEI1 and SSI1) to identify meteorological and agricultural drought events and obtained drought characteristics to analyze the spatiotemporal evolution of drought in the PRB.
3.2.1. Spatial Differences in Drought Characteristics
Figure 10 shows the spatial distribution of the characteristic values for meteorological drought events. Figure 11 displays the spatial distribution of the characteristic values for agricultural drought events, calculated separately for the four soil layers.
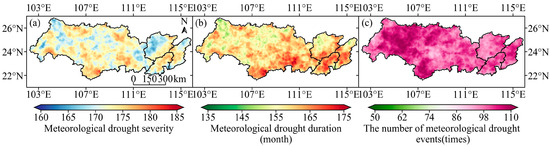
Figure 10.
Spatial distribution of characteristic values for meteorological drought events from 1979 to 2018. (a–c) The meteorological drought severity, meteorological drought duration, and number of meteorological drought events, respectively.
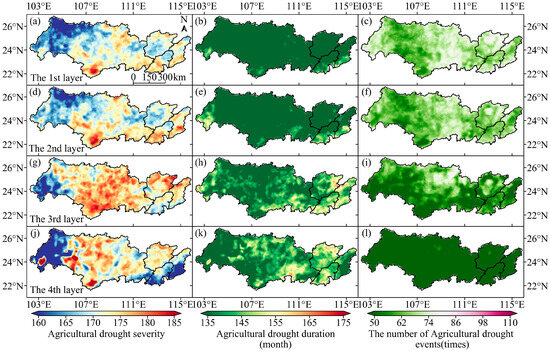
Figure 11.
Spatial distribution of characteristic values for agricultural drought events from 1979 to 2018. (a,d,g,j) The agricultural drought severity from VSW1 to VSW4, respectively. (b,e,h,k) The agricultural drought duration from VSW1 to VSW4, respectively. (c,f,i,l) The number of agricultural drought events from VSW1 to VSW4, respectively.
Figure 10 shows that meteorological drought events occurred throughout the PRB, with the range of drought event occurrences per pixel being 87 to 114 times, the cumulative drought duration ranging from 143 to 177 months, and the drought severity ranging from 162.9 to 181.7. Spatially, the drought intensities in most areas of Xijiang, the Pearl River Delta, the southeast of Beijiang, and the middle of Dongjiang were relatively high. In areas with high drought intensity, the drought duration was relatively long. The spatial variability of drought events in the PRB was small.
Chen found that the south of Guizhou and the east of Yunnan, which are located in the west of the Pearl River Basin, have a significant drought trend and have become the drought center of the PRB [4]. This study found that the most frequent drought events occurred in the western part of the Pearl River Basin, which is consistent with Chen’s study.
Figure 11 shows that agricultural drought events in VSW1 also occurred throughout the PRB, with the range of drought event occurrences per pixel being 50 to 87 times, the cumulative drought duration ranging from 93 to 152 months, and the drought severity ranging from 148.6 to 185.6. The range of drought event occurrences per pixel in VSW2 was 45 to 82 times, with the cumulative drought duration ranging from 95 to 163 months and the drought severity ranging from 150.9 to 186.5. The range of drought event occurrences per pixel in VSW3 was 23 to 84 times, with the cumulative drought duration ranging from 113 to 166 months and the drought severity ranging from 146.9 to 186.5. The range of drought event occurrences per pixel in VSW4 was 3 to 57 times, with the cumulative drought duration ranging from 81 to 166 months and the drought severity ranging from 127.5 to 199.6. Overall, in the PRB, the severity of agricultural drought from the first to the third layers increased with each layer, whereas the severity of agricultural drought in the fourth layer decreased compared with the third layer. The duration of agricultural drought from the first to the fourth layer increased with each layer. The number of agricultural drought occurrences from the first to the fourth layer decreased with each layer.
3.2.2. Analysis of the Synchronicity Between Meteorological Drought and Agricultural Drought
Before investigating the lag relationship between meteorological and agricultural droughts, we analyzed the synchronicity of the two types of drought events by examining the starting months and number of drought events from 1979 to 2018, excluding minor drought events that lasted for only a single unit of time. Figure 12 shows a comparative analysis of the total number of meteorological and agricultural drought events in the same month. Figure 13 shows the correlation coefficient between the total number of meteorological drought events and the total number of agricultural drought events delayed by 0–48 months.
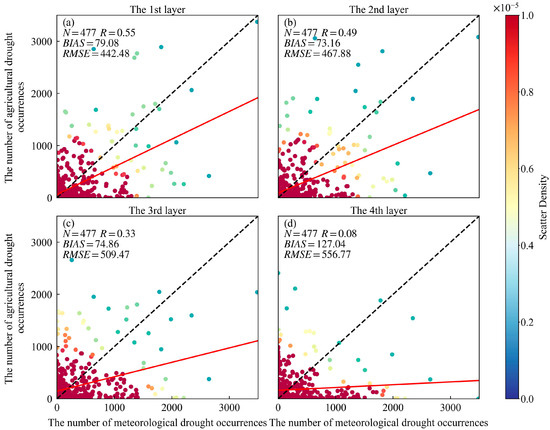
Figure 12.
Comparative analysis of simultaneous monthly occurrences of meteorological and agricultural drought events in (a) VSW1, (b) VSW2, (c) VSW3, and (d) VSW4. The solid red line indicates a linear regression line between the number of meteorological drought occurrences and agricultural drought occurrences.
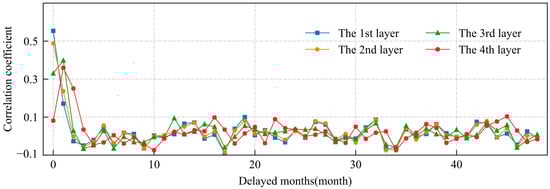
Figure 13.
Correlation coefficients between meteorological drought events and agricultural drought events occurring 0–48 months later.
Figure 12 shows that the synchronization of the occurrence times of meteorological drought events and agricultural drought events decreased with the increase in soil layer. In general, the total number of regional meteorological drought events over longer time periods was lower than that of regional agricultural drought events. Figure 13 shows that the correlation between the number of agricultural drought events in the first and second layers and the number of meteorological drought events decreased with an increase in the number of delayed months, suggesting the propagation time scale from meteorological drought to agricultural drought in the first and second layers was fast and that the lag time was short. The correlation between agricultural drought events in the third and fourth layers and meteorological drought events reached a maximum one month later, suggesting that the propagation time scale from meteorological drought to agricultural drought in the third and fourth layers was approximately one month, with a longer lag time.
3.3. Drought Propagation Time from Meteorological Drought to Agricultural Drought
3.3.1. Spatial Distribution Characteristics of Drought Propagation Time
We calculated the correlation between the 1–48-month scale SPEI and the 1-month scale SSI, and the timescale corresponding to the maximum correlation coefficient was taken to be the propagation time from meteorological drought to agricultural drought in the PRB. Figure 14 shows the propagation time scale from meteorological drought to agricultural drought of the four soil layers in the PRB.
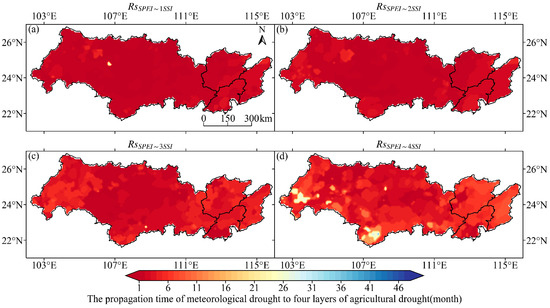
Figure 14.
Spatial distribution of the propagation time from meteorological drought to agricultural drought in four layers of soil in the PRB. (a–d) The spatial distribution of the propagation time from VSW1 to VSW4, respectively.
Figure 14 shows that the propagation times from meteorological drought to agricultural drought in the first and second soil layers were spatially consistent. In the PRB, 43.4% of regions showed a one-month propagation time scale from meteorological to agricultural drought at the first soil depth. At two months, it was 43.8%, and at three months it was 10.5%. The average spread time was 1.7 months. The proportion of agricultural drought propagation time scale from meteorological drought to agricultural drought at the second soil depth was 24.7% at one month, 45.7% at two months, and 23.4% at three months. The average propagation time was 2.1 months. The proportion of agricultural drought propagation time scale from meteorological drought to agricultural drought in the third layer of soil depth was 30.2% at two months, 20.9% at three months, and 18.6% at four months. The average propagation time was 3.4 months. The proportion of agricultural drought spreading from meteorological drought to the fourth layer of soil depth was 17.0% at 3 months, 16.9% at 4 months, and 12.6% at 5 months. The average propagation time was 5.3 months. With increasing soil depth, the propagation time scale from meteorological to agricultural drought in the PRB increased.
3.3.2. Temporal Distribution Characteristics of Drought Propagation Time
We considered each of the four soil layers in the entire PRB as a whole and calculated the average drought propagation time for each month at each soil depth. Figure 15 shows the drought propagation times corresponding to the four soil layers.
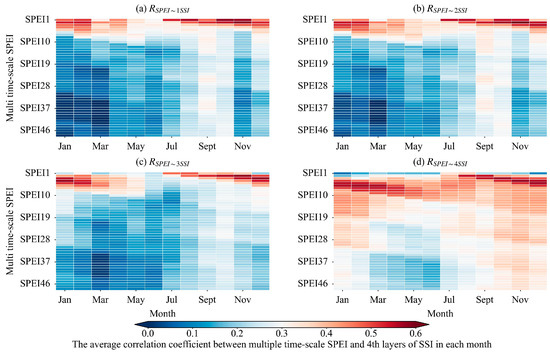
Figure 15.
The drought propagation time corresponding to the four soil layers in the PRB. (a–d) The propagation time from VSW1 to VSW4, respectively.
In the PRB, the drought propagation time scale for VSW1 in spring, summer, autumn, and winter were 2, 1, 1, and 2 months, respectively. For VSW2, they were 2, 1, 2, and 2 months, respectively. For VSW3, they were 5, 1, 2, and 3 months, respectively. For VSW4, they were 7, 6, 3, and 5 months, respectively. With increasing soil depth, the drought propagation time scale increased in spring and winter. The drought propagation time scale remained essentially unchanged during summer and autumn from VSW1 to VSW3, but it increased in VSW4, reaching 6 months in summer and 3 months in autumn.
4. Discussion
At the basin scale, the spatiotemporal evolution and propagation of drought exhibited various differences and changes that were influenced and driven by multiple factors, such as reservoir structures, underlying surface characteristics, and human activities. The reservoir in the PRB regulates river flow, reducing peak flow during the rainy season and releasing stored water during droughts. This redistribution changes the natural precipitation–evapotranspiration–runoff balance. In terms of land use change, deforestation reduces canopy interception and transpiration, increases surface runoff, but reduces evapotranspiration. On the contrary, the conversion of farmland to orchards increases water absorption in the root zone and changes soil water dynamics. Urban expansion increases impervious surfaces, which reduces infiltration and groundwater recharge while amplifying surface runoff. In their study on drought transmission in China, Han [31] found that the drought propagation time from meteorological to agricultural drought in the PRB ranged from one to five months in spring, summer, autumn, and winter. The results of this study were as follows. The drought propagation times for the first to fourth soil layer depths in spring, summer, autumn, and winter were 2, 1, 1, and 2 months; 2, 1, 2, and 2 months; 5, 1, 2, and 3 months; and 7, 6, 3, and 5 months, respectively. The findings of this study were largely consistent with those reported in prior research [31]. Owing to differences in the study timescales and soil depths, drought propagation times varied across seasons and soil layers. Overall, the results of this study on the PRB were similar to those of other researchers.
In terms of soil depth, for the first to third soil layers, owing to the abundant precipitation in the southern summer and autumn seasons, the rapid replenishment of runoff, and the dense cluster of reservoirs in the south that can quickly regulate hydrological drought and thereby affect agricultural drought, the drought propagation times were relatively short throughout the four seasons. As the soil depth increased, the evapotranspiration capacity weakened, and the response of the first three soil layers to meteorological drought was faster than that of the fourth. Generally, drought occurs in the first three soil layers before it occurs in the fourth layer. Therefore, the drought propagation time for the fourth soil layer was relatively long in all seasons. It is widely recognized that the root systems of different vegetation types differ in length, thereby varying their capacity to extract water from different soil layers. The findings of this study offer insight into drought mitigation strategies for vegetation across various soil layers. Table 1 shows that vegetation with roots in the first to third soil layers consists primarily of herbaceous plants and shrubs with crops, such as vegetables and rice (Fan et al., 2016; Yang et al., 2016) [32,33]. These types of vegetation and the soil layers in which they are rooted were rapidly affected by meteorological drought, calling for timely water replenishment. In contrast, the vegetation in the fourth soil layer was predominantly medium and tall trees, and the crops grown here were corn and cotton. These vegetation types and their root systems are less susceptible to drought.

Table 1.
The soil layers where vegetation types and crop root systems are mainly distributed.
5. Conclusions
Based on multiple timescales of water balance and different soil depths, this study analyzed the spatiotemporal evolution of typical climatic elements and soil moisture in the PRB and investigated the propagation time scale from meteorological drought to agricultural drought in different seasons. The following conclusions were drawn. (1) While the western part of the PRB experienced a worsening atmospheric moisture deficit and the southern part experienced intensified dry conditions for soil moisture, the rest of the basin remained relatively moist and stable. Soil moisture conditions were moister in the deeper soil layers. (2) The durations of agricultural droughts were generally shorter than those of meteorological droughts over the past 40 years. Within the top three soil layers, the severity, duration, and frequency of drought events progressively increased, increased, and decreased, respectively, as the soil depth increased. (3) The propagation time scale from meteorological drought to the first and second layers of agricultural drought was typically 1–2 months, whereas that to the third and fourth layers was typically 3–5 months. An understanding of the spatiotemporal characteristics of meteorological and agricultural droughts and the propagation times between them can help to better predict the drought patterns of ecosystems and agriculture, understand the water requirements of vegetation and crops in the development of irrigation and water allocation plans, adjust planting structures to ensure that crops are not affected by drought during the growing period, and provide practical value for maintaining food production security, drought prevention, and mitigation in crops. This study also has limitations. While the effects of reservoirs are well established, the detailed interactions between irrigation practices, groundwater extraction, and drought propagation require mechanism modeling. As for future directions, we want to extend this framework to other monsoon basins and to assess how changes in monsoon intensity and evaporation caused by warming alter the propagation timescales, which could inform adaptive water management.
Author Contributions
Y.Z.: Conceptualization, Data Curation, Software, Methodology, Visualization, and Writing—Original Draft. J.L.: Data Curation, Methodology, and Writing—Original Draft. W.J.: Conceptualization, Investigation, Resources, Project Administration, Supervision, and Writing—Review and Editing. F.Z.: Writing—Original Draft and Formal Analysis. H.Z.: Writing—Original Draft and Validation. S.W.: Funding Acquisition and Resources. All authors have read and agreed to the published version of the manuscript.
Funding
This research was funded by the National Key Research and Development Plan of China, grant number 2021YFC3001000; the Science and Technology Innovation Program from Water Resources of Guangdong Province, grant number 2023-01; the Major Science and Technology Projects of the Ministry of Water Resources of China, grant number SKS-2022005; and the Pearl River Delta Water Resources Allocation Project Water Intake Impact on Downstream Water Supply Research Project, grant number CD88-QT01-2023-0022.
Data Availability Statement
The China Meteorological Forcing Dataset (1979–2018) is provided by the National Tibetan Plateau/Third Pole Environment Data Center “http://data.tpdc.ac.cn (accessed on 25 July 2023)”. Muñoz Sabater et al. (2021) [17] was downloaded from the Copernicus Climate Change Service (2023). The results contain modified Copernicus Climate Change Service information 2020. Neither the European Commission nor ECMWF is responsible for any use that may be made of the Copernicus information or data it contains.
Conflicts of Interest
Author Yaoqiang Zhou was employed by the company Guangdong Yuehai Pearl River Delta Water Supply Co., Ltd. The remaining authors declare that the research was conducted in the absence of any commercial or financial relationships that could be construed as a potential conflict of interest.
References
- Qu, Y.; Lv, J.; Su, Z.; Sun, H.; Ma, M. Research Review and Perspective of Drought Mitigation. J. Hydraul. Eng. 2018, 49, 115–125. [Google Scholar] [CrossRef]
- Dai, A. Drought Under Global Warming: A Review. WIREs Clim. Change 2011, 2, 45–65. [Google Scholar] [CrossRef]
- Xue, L.; Yuan, S.; Wang, J. Progress and Prospects of Research on Causes of Meteorological Drought in Different Regions in China. J. Arid Meteorol. 2023, 41, 1–13. [Google Scholar]
- Chen, Z. Empirical Diagnostic Analysis on Spatial and Temporal Variations of Droughts in the Pearl River Basin. Acta Sci. Nat. Univ. Sunyatseni 2020, 59, 33–42. [Google Scholar]
- Huang, Q.; Chen, Z.; Tang, C.; Li, S. Monitoring the Spatio-Temporal Process of Severe Droughts in the Pearl River Basin. Adv. Earth Sci. 2019, 34, 1050–1059. [Google Scholar] [CrossRef]
- Jing, J.; Xu, Y.; Wang, Y.; Dou, S.; Yin, M. Characteristics of Multi-Scale Drought and Flood in the Pearl River Basin from 1960 to 2019. Res. Agric. Mod. 2021, 42, 557–569. [Google Scholar] [CrossRef]
- Tian, Q.; Wang, F.; Tian, Y.; Jiang, Y.; Weng, P.; Li, J. Copula-Based Comprehensive Drought Identification and Evaluation over the Xijiang River Basin in South China. Ecol. Indic. 2023, 154, 110503. [Google Scholar] [CrossRef]
- Chen, L.; He, Z.; Pan, S.; Gu, X.; Xu, M.; You, M.; Pi, G. Spatial and Temporal Evolution Characteristics of Karst Agricultural Drought Based on Different Time Scales and Driving Detection—A Case Study of Guizhou Province. J. Soil Water Conserv. 2023, 37, 136–148. [Google Scholar] [CrossRef]
- Wang, B. Speeding up Construction of a Defense Line for Flood and Drought Disasters to Increase the Capability of Water Security Guarantee in the Pearl River Basin. China Water Resour. 2022, 8, 15–17. [Google Scholar]
- Yang, G.; Huang, H. Practice and Exploration on Water Supply Security in the Pearl River Basin Arid Region. China Water Resour. 2022, 945, 17–20. [Google Scholar]
- He, J.; Yang, K.; Tang, W.; Lu, H.; Qin, J.; Chen, Y.; Li, X. The First High-Resolution Meteorological Forcing Dataset for Land Process Studies over China. Sci. Data 2020, 7, 25. [Google Scholar] [CrossRef] [PubMed]
- Yang, K.; He, J.; Tang, W.; Qin, J.; Cheng, C.C.K. On Downward Shortwave and Longwave Radiations over High Altitude Regions: Observation and Modeling in the Tibetan Plateau. Agric. For. Meteorol. 2010, 150, 38–46. [Google Scholar] [CrossRef]
- Allen, R.; Pereira, L.; Raes, D.; Smith, M. FAO Irrigation and Drainage Paper No. 56; Food and Agriculture Organization of the United Nations: Rome, Italy, 1998; Volume 56, pp. 26–40. [Google Scholar]
- Monteith, J.L. Evaporation and Environment. Symp. Soc. Exp. Biol. 1965, 19, 205–234. [Google Scholar] [PubMed]
- Vicente-Serrano, S.M.; Gouveia, C.; Camarero, J.J.; Beguería, S.; Trigo, R.; López-Moreno, J.I.; Azorín-Molina, C.; Pasho, E.; Lorenzo-Lacruz, J.; Revuelto, J.; et al. Response of Vegetation to Drought Time-Scales Across Global Land Biomes. Proc. Natl. Acad. Sci. USA 2013, 110, 52–57. [Google Scholar] [CrossRef]
- Li, X.; Jiang, T.; Wu, P.; Wang, Y.; Su, B. Relationship between actual evapotranspiration and potential evapotranspiration in the Pearl River basin. Trans. Atmos. Sci. 2016, 39, 692–701. [Google Scholar] [CrossRef]
- Muñoz-Sabater, J.; Dutra, E.; Agustí-Panareda, A.; Albergel, C.; Arduini, G.; Balsamo, G.; Boussetta, S.; Choulga, M.; Harrigan, S.; Hersbach, H.; et al. ERA5-Land: A State-of-the-Art Global Reanalysis Dataset for Land Applications. Earth Syst. Sci. Data 2021, 13, 4349–4383. [Google Scholar] [CrossRef]
- Zha, X.; Xiong, L.; Liu, C.; Shu, P.; Xiong, B. Identification and Evaluation of Soil Moisture Flash Drought by a Nonstationary Framework Considering Climate and Land Cover Changes. Sci. Total Environ. 2023, 856, 158953. [Google Scholar] [CrossRef]
- Zhang, R.; Li, L.; Zhang, Y.; Huang, F.; Li, J.; Liu, W.; Mao, T.; Xiong, Z.; Shangguan, W. Assessment of Agricultural Drought Using Soil Water Deficit Index Based on ERA5-Land Soil Moisture Data in Four Southern Provinces of China. Agriculture 2021, 11, 411. [Google Scholar] [CrossRef]
- Shangguan, W.; Zhang, R.; Li, L.; Zhang, S.; Zhang, Y.; Huang, F.; Li, J.; Liu, W. Assessment of Agricultural Drought Based on Reanalysis Soil Moisture in Southern China. Land 2022, 11, 502. [Google Scholar] [CrossRef]
- Beck, H.E.; Pan, M.; Miralles, D.G.; Reichle, R.H.; Dorigo, W.A.; Hahn, S.; Sheffield, J.; Karthikeyan, L.; Balsamo, G.; Parinussa, R.M.; et al. Evaluation of 18 Satellite- and Model-Based Soil Moisture Products Using In Situ Measurements from 826 Sensors. Hydrol. Earth Syst. Sci. 2021, 25, 17–40. [Google Scholar] [CrossRef]
- Sen, P.K. Estimates of the Regression Coefficient Based on Kendall’s Tau. J. Am. Stat. Assoc. 1968, 63, 1379–1389. [Google Scholar] [CrossRef]
- Vicente-Serrano, S.M.; Beguería, S.; López-Moreno, J.I. A Multiscalar Drought Index Sensitive to Global Warming: The Standardized Precipitation Evapotranspiration Index. J. Clim. 2010, 23, 1696–1718. [Google Scholar] [CrossRef]
- Hao, Z.; AghaKouchak, A. Multivariate Standardized Drought Index: A Parametric Multi-Index Model. Adv. Water Resour. 2013, 57, 12–18. [Google Scholar] [CrossRef]
- Xu, Y.; Zhang, X.; Hao, Z.; Singh, V.P.; Hao, F. Characterization of Agricultural Drought Propagation over China Based on Bivariate Probabilistic Quantification. J. Hydrol. 2021, 598, 126194. [Google Scholar] [CrossRef]
- Zhang, X.; Hao, Z.; Singh, V.P.; Zhang, Y.; Feng, S.; Xu, Y.; Hao, F. Drought Propagation under Global Warming: Characteristics, Approaches, Processes, and Controlling Factors. Sci. Total Environ. 2022, 838, 156021. [Google Scholar] [CrossRef]
- Herbst, P.H.; Bredenkamp, D.B.; Barker, H.M.G. A Technique for the Evaluation of Drought from Rainfall Data. J. Hydrol. 1966, 4, 264–272. [Google Scholar] [CrossRef]
- Ding, Y.; Gong, X.; Xing, Z.; Cai, H.; Zhou, Z.; Zhang, D.; Sun, P.; Shi, H. Attribution of Meteorological, Hydrological and Agricultural Drought Propagation in Different Climatic Regions of China. Agric. Water Manag. 2021, 255, 106996. [Google Scholar] [CrossRef]
- Xu, Y.; Zhang, X.; Wang, X.; Hao, Z.; Singh, V.P.; Hao, F. Propagation from Meteorological Drought to Hydrological Drought Under the Impact of Human Activities: A Case Study in Northern China. J. Hydrol. 2019, 579, 124147. [Google Scholar] [CrossRef]
- Gao, G.; Xu, C. Characteristics of water surplus and deficit change in 10 major river basins in China during 1961–2010. Acta Geogr. Sin. 2015, 70, 380–391. [Google Scholar] [CrossRef]
- Han, Z. Study on the Evolution Characteristics and Propagation Process of Multi-Type Drought in China. Ph.D. Thesis, Xi’an University of Technology, Xi’an, China, 2022. [Google Scholar]
- Fan, J.; McConkey, B.; Wang, H.; Janzen, H. Root Distribution by Depth for Temperate Agricultural Crops. Field Crops Res. 2016, 189, 68–74. [Google Scholar] [CrossRef]
- Yang, Y.; Donohue, R.J.; McVicar, T.R. Global Estimation of Effective Plant Rooting Depth: Implications for Hydrological Modeling. Water Resour. Res. 2016, 52, 8260–8276. [Google Scholar] [CrossRef]
Disclaimer/Publisher’s Note: The statements, opinions and data contained in all publications are solely those of the individual author(s) and contributor(s) and not of MDPI and/or the editor(s). MDPI and/or the editor(s) disclaim responsibility for any injury to people or property resulting from any ideas, methods, instructions or products referred to in the content. |
© 2025 by the authors. Licensee MDPI, Basel, Switzerland. This article is an open access article distributed under the terms and conditions of the Creative Commons Attribution (CC BY) license (https://creativecommons.org/licenses/by/4.0/).