Article

Effects of High Salinity on Nitrogen Removal Efficiency and Microbial Community Structure in a Three-Stage AO System

1
School of Resources and Environmental Engineering, Wuhan Textile University, Wuhan 430200, China
2
Beijing Origin Water Technology Co., Ltd., Beijing 102206, China
3
Engineering Research Center of Clean Production for Textile Dyeing and Printing, Ministry of Education, Wuhan 430200, China
*
Author to whom correspondence should be addressed.
Water 2025, 17(8), 1112; https://doi.org/10.3390/w17081112
Submission received: 28 February 2025 / Revised: 31 March 2025 / Accepted: 2 April 2025 / Published: 8 April 2025
(This article belongs to the Section Wastewater Treatment and Reuse)

Abstract

:
This study investigated the nitrogen removal performance of a three-stage AO reactor for refractory TN and the changes in microbial community structure within the activated sludge system under varying sodium chloride concentration conditions. Under an influent sodium chloride concentration of 0 g/L with sufficient carbon source, the removal rates of Total Nitrogen (TN), Chemical Oxygen Demand (CODcr), and Ammonium (NH4+-N) remained stable at 98%, 99.7%, and 99.9%, respectively. When the sodium chloride concentration increased to 20 g/L, the activity of AOB was significantly inhibited, with removal efficiency rates dropping to 83%, 89%, and 70%, respectively, and the NAR increasing to 91.97%. Analytical results demonstrated that both ammonia-oxidizing bacteria (AOB) and nitrite-oxidizing bacteria (NOB) exhibited inhibited metabolic activities, with NOB experiencing earlier functional impairment. Under NaCl concentrations ≤ 10 g/L, conventional nitrogen removal via nitrification–denitrification (ND) remained dominant. When NaCl concentrations exceeded 10 g/L, due to the accumulation of NO2-N, the phyla Planctomycetota and Proteobacteria maintained dominance in the microbial community, while partial nitrification (PN) and denitrification pathways gradually replaced ND. Extracellular polymeric substance (EPS) secretion emerged as the primary microbial defense mechanism against salinity stress. Experimental findings informed proposed strategies including phased acclimatization for salt-tolerance enhancement, EPS production regulation, and targeted enrichment of functional consortia, which collectively improved the denitrification efficiency by 18.7–22.3% under salinity levels ≤ 20 g/L. This study provides theoretical foundations and technical references for process optimization in hypersaline industrial wastewater treatment systems.

1. Introduction

High-salinity wastewater contains large amounts of inorganic salts and nitrogen pollutants, mainly originating from industries such as textiles, petroleum, and leather [1]. With the increasing discharge of saline wastewater, the interference of salinity in wastewater treatment has become more severe, and high-nitrogen wastewater can lead to eutrophication and inhibit microbial activity in activated sludge [2,3]. Although traditional methods such as advanced oxidation, evaporation crystallization, and air flotation are widely applied in high-salinity wastewater treatment, these methods have limitations in wastewater treatment plants and yield low economic benefits [4,5,6]. Biological treatment methods offer economic advantages for handling high-salinity wastewater and are commonly used in wastewater treatment plants. However, high salinity inhibits microbial growth and metabolism, posing challenges for biological treatment processes [7]. Although biological treatment has been used for high-salinity wastewater and salt-tolerant microorganisms are being developed, there is a lack of comprehensive evaluation of salinity management, especially concerning the inhibitory mechanisms of the salinity on microorganisms and its impact on treatment efficiency [8,9].
As the salinity increases, wastewater treatment systems become unstable. Traditional nitrogen removal (ND) pathways struggle under salt stress, leading to deteriorated sludge settling performance and reduced microbial diversity [10]. Nitrification performance also decreases, which is crucial for biological nitrogen removal and is primarily carried out by ammonia-oxidizing bacteria (AOB) and nitrite-oxidizing bacteria (NOB) [11]. Studies have shown that AOB have a higher tolerance to salinity than NOB [2]; under high-salinity stress, NOB activity decreases, leading to nitrite accumulation [12]. Despite the impairment of nitrification functionality at high salinity, microbial systems still maintain some removal efficiency [13].
The multi-stage AO (anoxic–oxic) process, a multi-phase system combining anaerobic and aerobic stages, is recognized for its advantages of high carbon source utilization efficiency, low sludge bulking rate, and enhanced nitrogen and phosphorus removal. It facilitates the enrichment of nitrifying and denitrifying bacteria, thus improving total nitrogen removal efficiency [6]. Through repeated anaerobic and aerobic alternating reactions, this approach incrementally removes nitrogen and organic matter from wastewater, presenting a promising solution for high-salinity and high-nitrogen wastewater treatment.
In recent years, research on the A/O (anoxic–oxic) process for high-salinity wastewater treatment has achieved certain progress, though practical applications still face significant challenges [14]. Existing studies indicate that targeted domestication of salt-tolerant microorganisms (e.g., Halomonas and Marinobacter strains) can enhance system nitrogen removal efficiency [14], with salinity gradient optimization (<3%) and carbon-to-nitrogen ratio regulation (3–5:1) identified as critical parameters for maintaining microbial activity [15]. Some research coupling A/O processes with membrane bioreactors (MBR) achieved 85–90% ammonia nitrogen removal under 3% salinity [16], yet nitrifier activity still declined by 60–80% when the salinity exceeded 5% [17]. For engineering applications, pilot-scale systems (<50 m3/day) testing salinity fluctuation adaptability show recovery cycles exceeding 72 h under sudden salinity changes >2% [13], while actual industrial wastewater salinity fluctuations often reach 5–8%, highlighting the need for improved shock-load resistance.
Therefore, the main objectives of this study are the following: (1) to understand the impact of the salinity on nitrogen removal efficiency in high-nitrogen wastewater; (2) to investigate changes in nitrogen removal pathways with increasing salinity; and (3) to explore the response characteristics of activated sludge under salt stress and examine microbial community succession in activated sludge at different salinity levels. This study reveals the shifts in nitrogen removal pathways and microbial community structure in a three-stage AO reactor under salinity stress, providing scientific insights and process guidance for high-salinity wastewater treatment to achieve efficient and sustainable biological nitrogen removal.

2. Materials and Methods

2.1. Reactor Setup and Operating Conditions

The experimental system was constructed using a three-stage anaerobic–oxic (AO) process, with the tripartite configuration selected to balance treatment efficiency with operational costs under nitrogen removal optimization principles. As illustrated in Figure 1, the AO reactor assembly comprises polymethyl methacrylate (PMMA) components featuring dual-cylinder configuration (inner diameter 200 mm/outer diameter 260 mm) with a 50 mm annular insulation layer. The system maintains 10 L effective volume (400 mm operational height) through precision hydraulic design. A top-mounted acrylic cover plate integrates mechanical agitation components ensuring complete activated sludge suspension. The cover incorporates 20 mm diameter sampling ports for dissolved oxygen (DO) monitoring, while bottom-located aeration control valves enable precise regulation of air supply rates (0.5–2.5 L/min), achieving simultaneous biomass fluidization and process parameter stability.
Using an SBR reactor to simulate a three-stage AO process, two cycles are operated daily, with an influent and effluent volume of 5 L per cycle. Each operating cycle lasts 12 h: Influent (2 min) → Anoxic (90 min) → Aerobic (120 min) → Settling (30 min) → Anoxic (90 min) → Aerobic (120 min) → Settling (30 min) → Anoxic (90 min) → Aerobic (120 min) → Settling (30 min) → Effluent (2 min). The sludge concentration was maintained at 5000 mg/L by discharging sludge once a week (SRT of 7 days), with an aeration intensity of 0.3 L/min. The DO during the aerobic phase was around 3 mg/L, while it was approximately 0.3 mg/L during the anoxic phase. The stirring rate was set to 13 rpm. The temperature was controlled at 25 ± 3 °C by means of insulation. After a two-week acclimation period, the effluent concentration of each pollutant stabilized below the first grade A criteria of the “Discharge standard of pollutants for municipal wastewater treatment plant” (GB 18971-2002) [18] in China; the experiment was initiated after one week of stabilization. Subsequent experiments were conducted. The salinity in the system was adjusted by adding sodium chloride to the prepared simulated wastewater. The influent sodium chloride concentration was gradually increased to 5 g/L, 10 g/L, 15 g/L, and 20 g/L. In addition, 1 g/L NaCl concentration was added before 5 g/L for activated sludge adaptation training to prevent a large number of activated sludge deaths caused by a sudden increase in the salinity.

2.2. Sludge and Experimental Water Quality

The seeding sludge was sourced from the activated sludge at the terminal end of the aerobic tank in a municipal–industrial wastewater treatment facility. The influent was artificially simulated industrial wastewater, with concentrations of Total Nitrogen (TN) at 101.23 mg/L, Total Phosphorus (TP) at 5.14 mg/L, Chemical Oxygen Demand (CODcr) at 801.22 mg/L, along with trace elements. The detailed concentrations of each component are listed in Table 1.

2.3. Analytical Methods

2.3.1. Conventional Water Quality Analysis Methods

The methods for water quality indicator analysis are shown in Table 2. CODcr was measured by the potassium dichromate method; NH4+-N was measured using Nessler’s reagent spectrophotometry; NO3-N and TN were analyzed using UV spectrophotometry; NO2-N was determined by N-(1-naphthyl)-ethylenediamine spectrophotometry. Instruments used included a UV–Vis spectrophotometer (TU-1900, Beijing Purkinje General Instrument Co., Ltd., Beijing, China), a CODcr intelligent digester (TX1616, Zhejiang Ditex Technology Co., Ltd., Ningbo, China), a dissolved oxygen meter (JPB-607A, Shanghai Yitian Scientific Instruments Co., Ltd., Shanghai, China), and a pH meter (PHS-3C, Shanghai Yitian Scientific Instruments Co., Ltd., Shanghai, China).

2.3.2. Extraction and Detection of EPS

The LB-EPS and TB-EPS fractions of EPS were extracted using the method described in the literature [19].
① The sample was centrifuged at 3200 rpm for 30 min and the supernatant was discarded; ② the remaining sludge solids were washed with distilled water, then resuspended in a 0.9% NaCl solution, and stirred on a magnetic stirrer until thoroughly mixed; ③ the suspension was placed in an ultrasonic separator for ultrasonic separation for 2 min; ④ the mixture was centrifuged again and the supernatant was collected to measure the volatile solids (LB), TOC content in LB, or the carbohydrate and protein content in LB; the sum of carbohydrate and protein content was considered as LB-EPS; ⑤ the remaining sludge solids were diluted, then stirred on a magnetic stirrer until thoroughly mixed; ⑥ the mixture was heated at 100 °C for 1 h; ⑦ after being cooled to room temperature, the sample was centrifuged under the same conditions; ⑧ the volatile solids in the obtained supernatant were measured to obtain TB, or TOC content, carbohydrate, and protein content in TB were measured; the sum of carbohydrate and protein content was considered as TB-EPS.

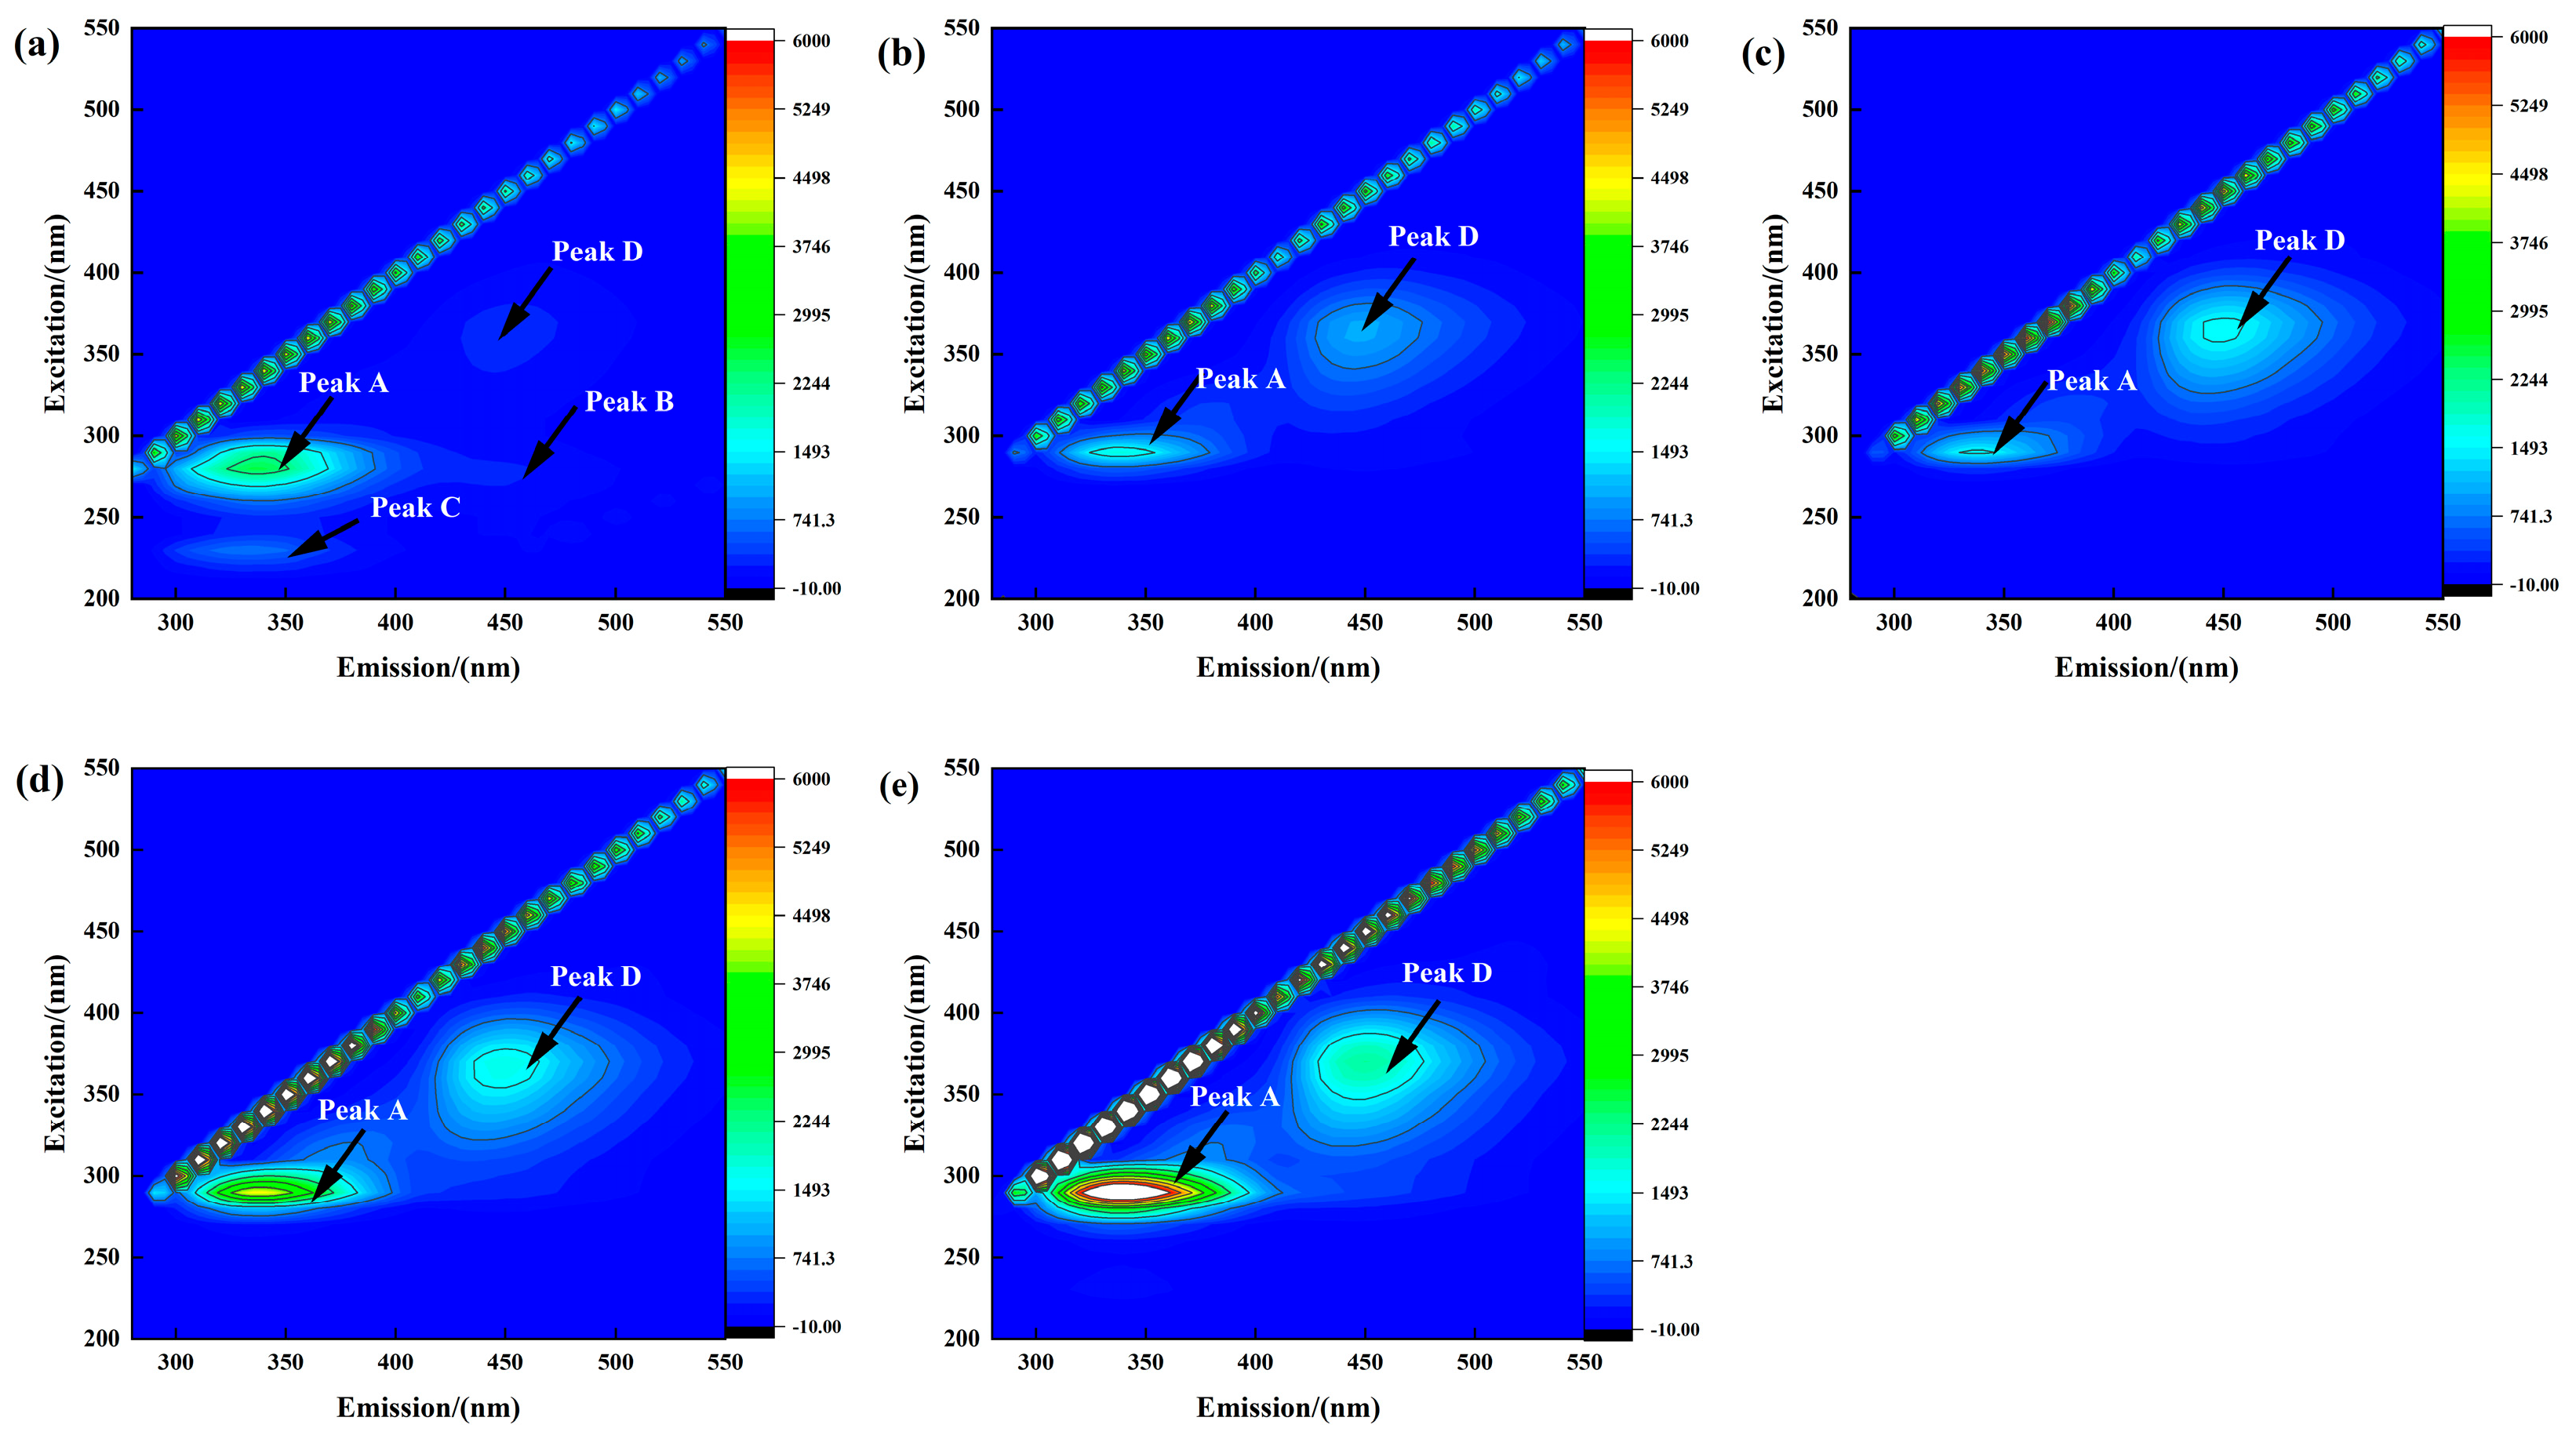
2.3.3. Three-Dimensional Excitation–Emission Matrix (3D-EEM) Fluorescence Spectroscopy

After centrifuging the sludge–water mixture, filter it through a 0.45 μm filter membrane and use the supernatant for 3D-EEM fluorescence analysis with an RF-6000 fluorescence spectrophotometer. The excitation wavelength range is set from 200 to 600 nm with a 10 nm interval, the emission wavelength ranges from 200 to 550 nm with a 2 nm interval, and the scan speed is 30,000 nm/min.

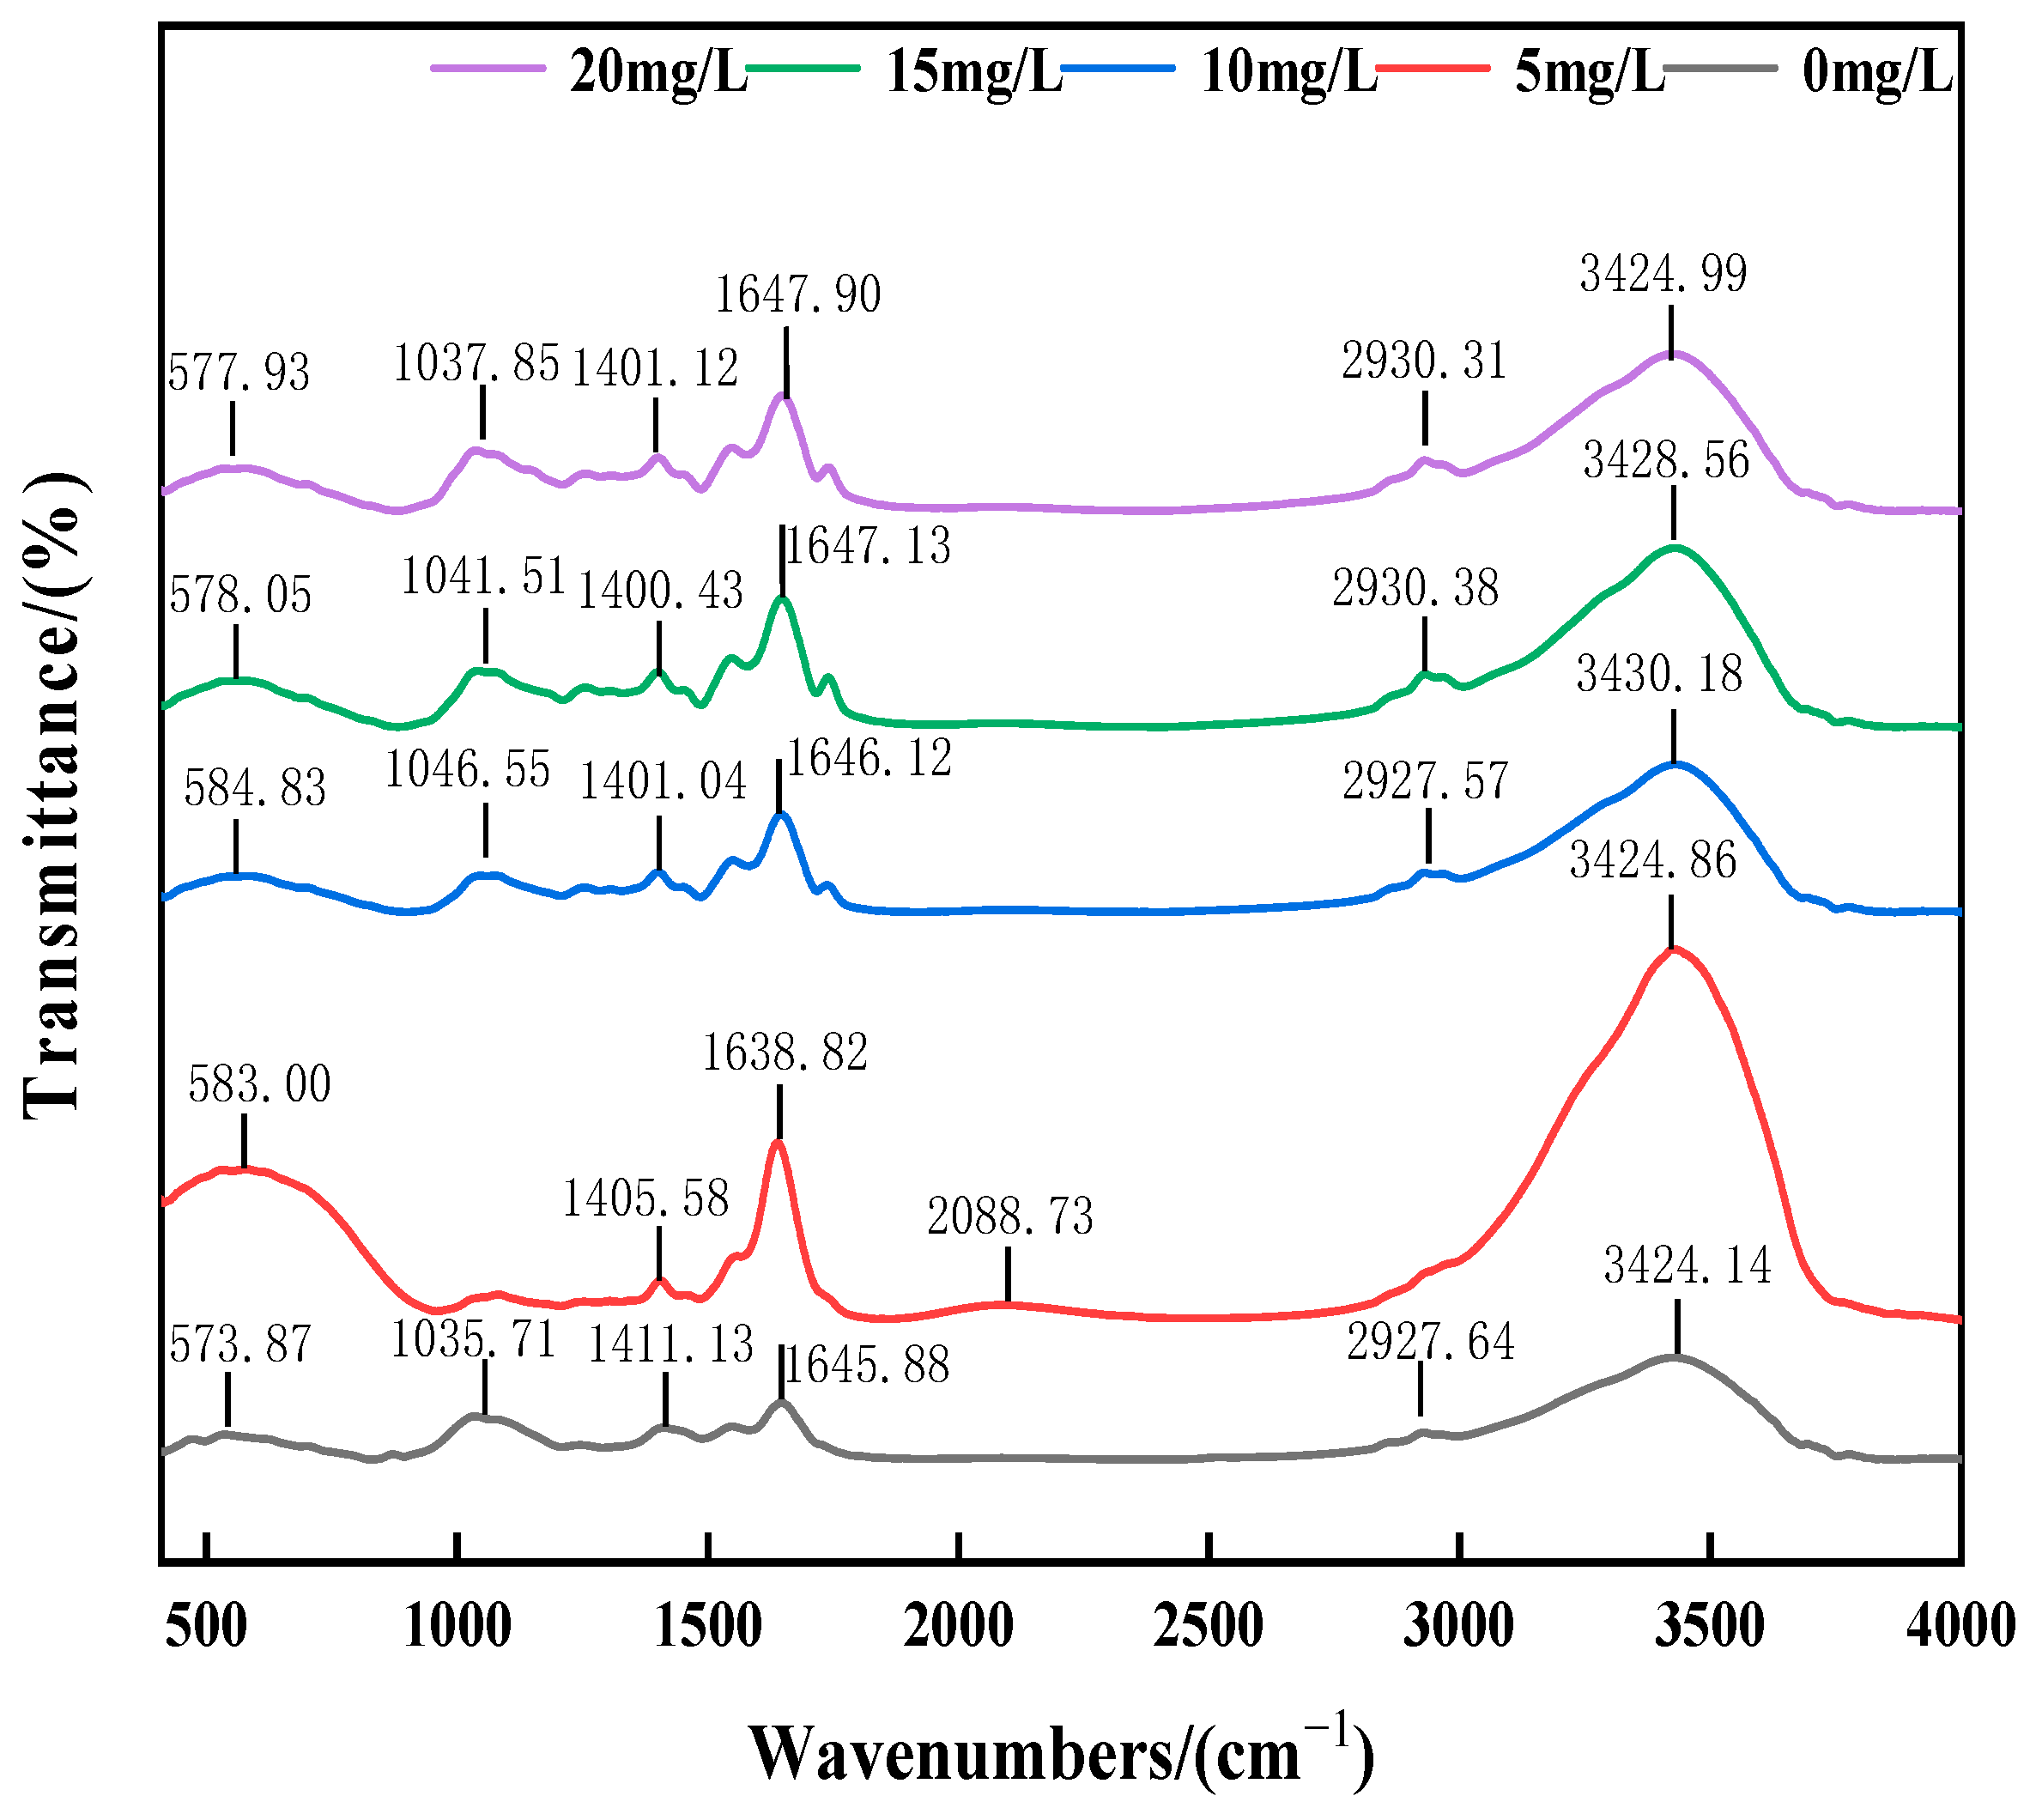
2.3.4. Fourier Transform Infrared (FTIR) Spectroscopy

Sample preparation: take 10 mL of the sludge–water mixture, centrifuge at 8000 rpm for 10 min, and vacuum dry the precipitate for storage.
Sample analysis: Grind the KBr–sludge powder mixture at a mass ratio of 100:1 in an agate mortar until well mixed. Place a suitable amount of the ground powder into a tablet mold to form a tablet for analysis. Test the sample in the infrared spectrometer within a wavelength range of 400–4000 cm−1.

2.3.5. High-Throughput Sequencing

After achieving stable treatment effects at each salinity level, three activated sludge samples were collected (totaling 15 samples), centrifuged for 5 min, freeze-dried under vacuum, and sent to Shanghai Personal Biotechnology Co., Ltd. (Shanghai) in China. for paired-end sequencing of community DNA fragments using the Illumina platform. Sampling bottles were used to collect activated sludge at the end of each functional stage, followed by centrifugation. The remaining sludge after supernatant removal was stored in sterile centrifuge tubes, labeled, preserved at approximately −20 °C, and transferred to professional analysts. This experiment analyzed community abundance, diversity, and structural composition at the phylum, genus, and class levels.

3. Results

Prior to the main experiment, an adaptation phase was conducted for the sludge in the three-stage AO reactor. The influent concentrations were set at TN 101.23 mg/L, CODcr 801.22 mg/L, NH4+-N 100.56 mg/L, and TP 5.14 mg/L, with the sodium chloride concentrations gradually increased to 5, 10, 15, and 20 g/L. Once the removal rates stabilized at each salinity level, the experiment proceeded to the next stage. Under the sodium chloride concentration of 0 g/L, optimal removal conditions for high-TN wastewater were determined as follows: aeration rate of 0.3 L/min during the aerobic phase, stirring rate of 13 rpm during the anoxic phase, and temperature at 25 °C. The results showed a CODcr removal rate of 99.7%, TN removal rate of 98%, and NH4+-N removal rate of 99.9%. After running under optimal conditions for one week, the salinity was gradually increased to avoid the shock of high-salinity levels on microorganisms, which could cause microbial toxicity and death, thereby protecting system stability [19].

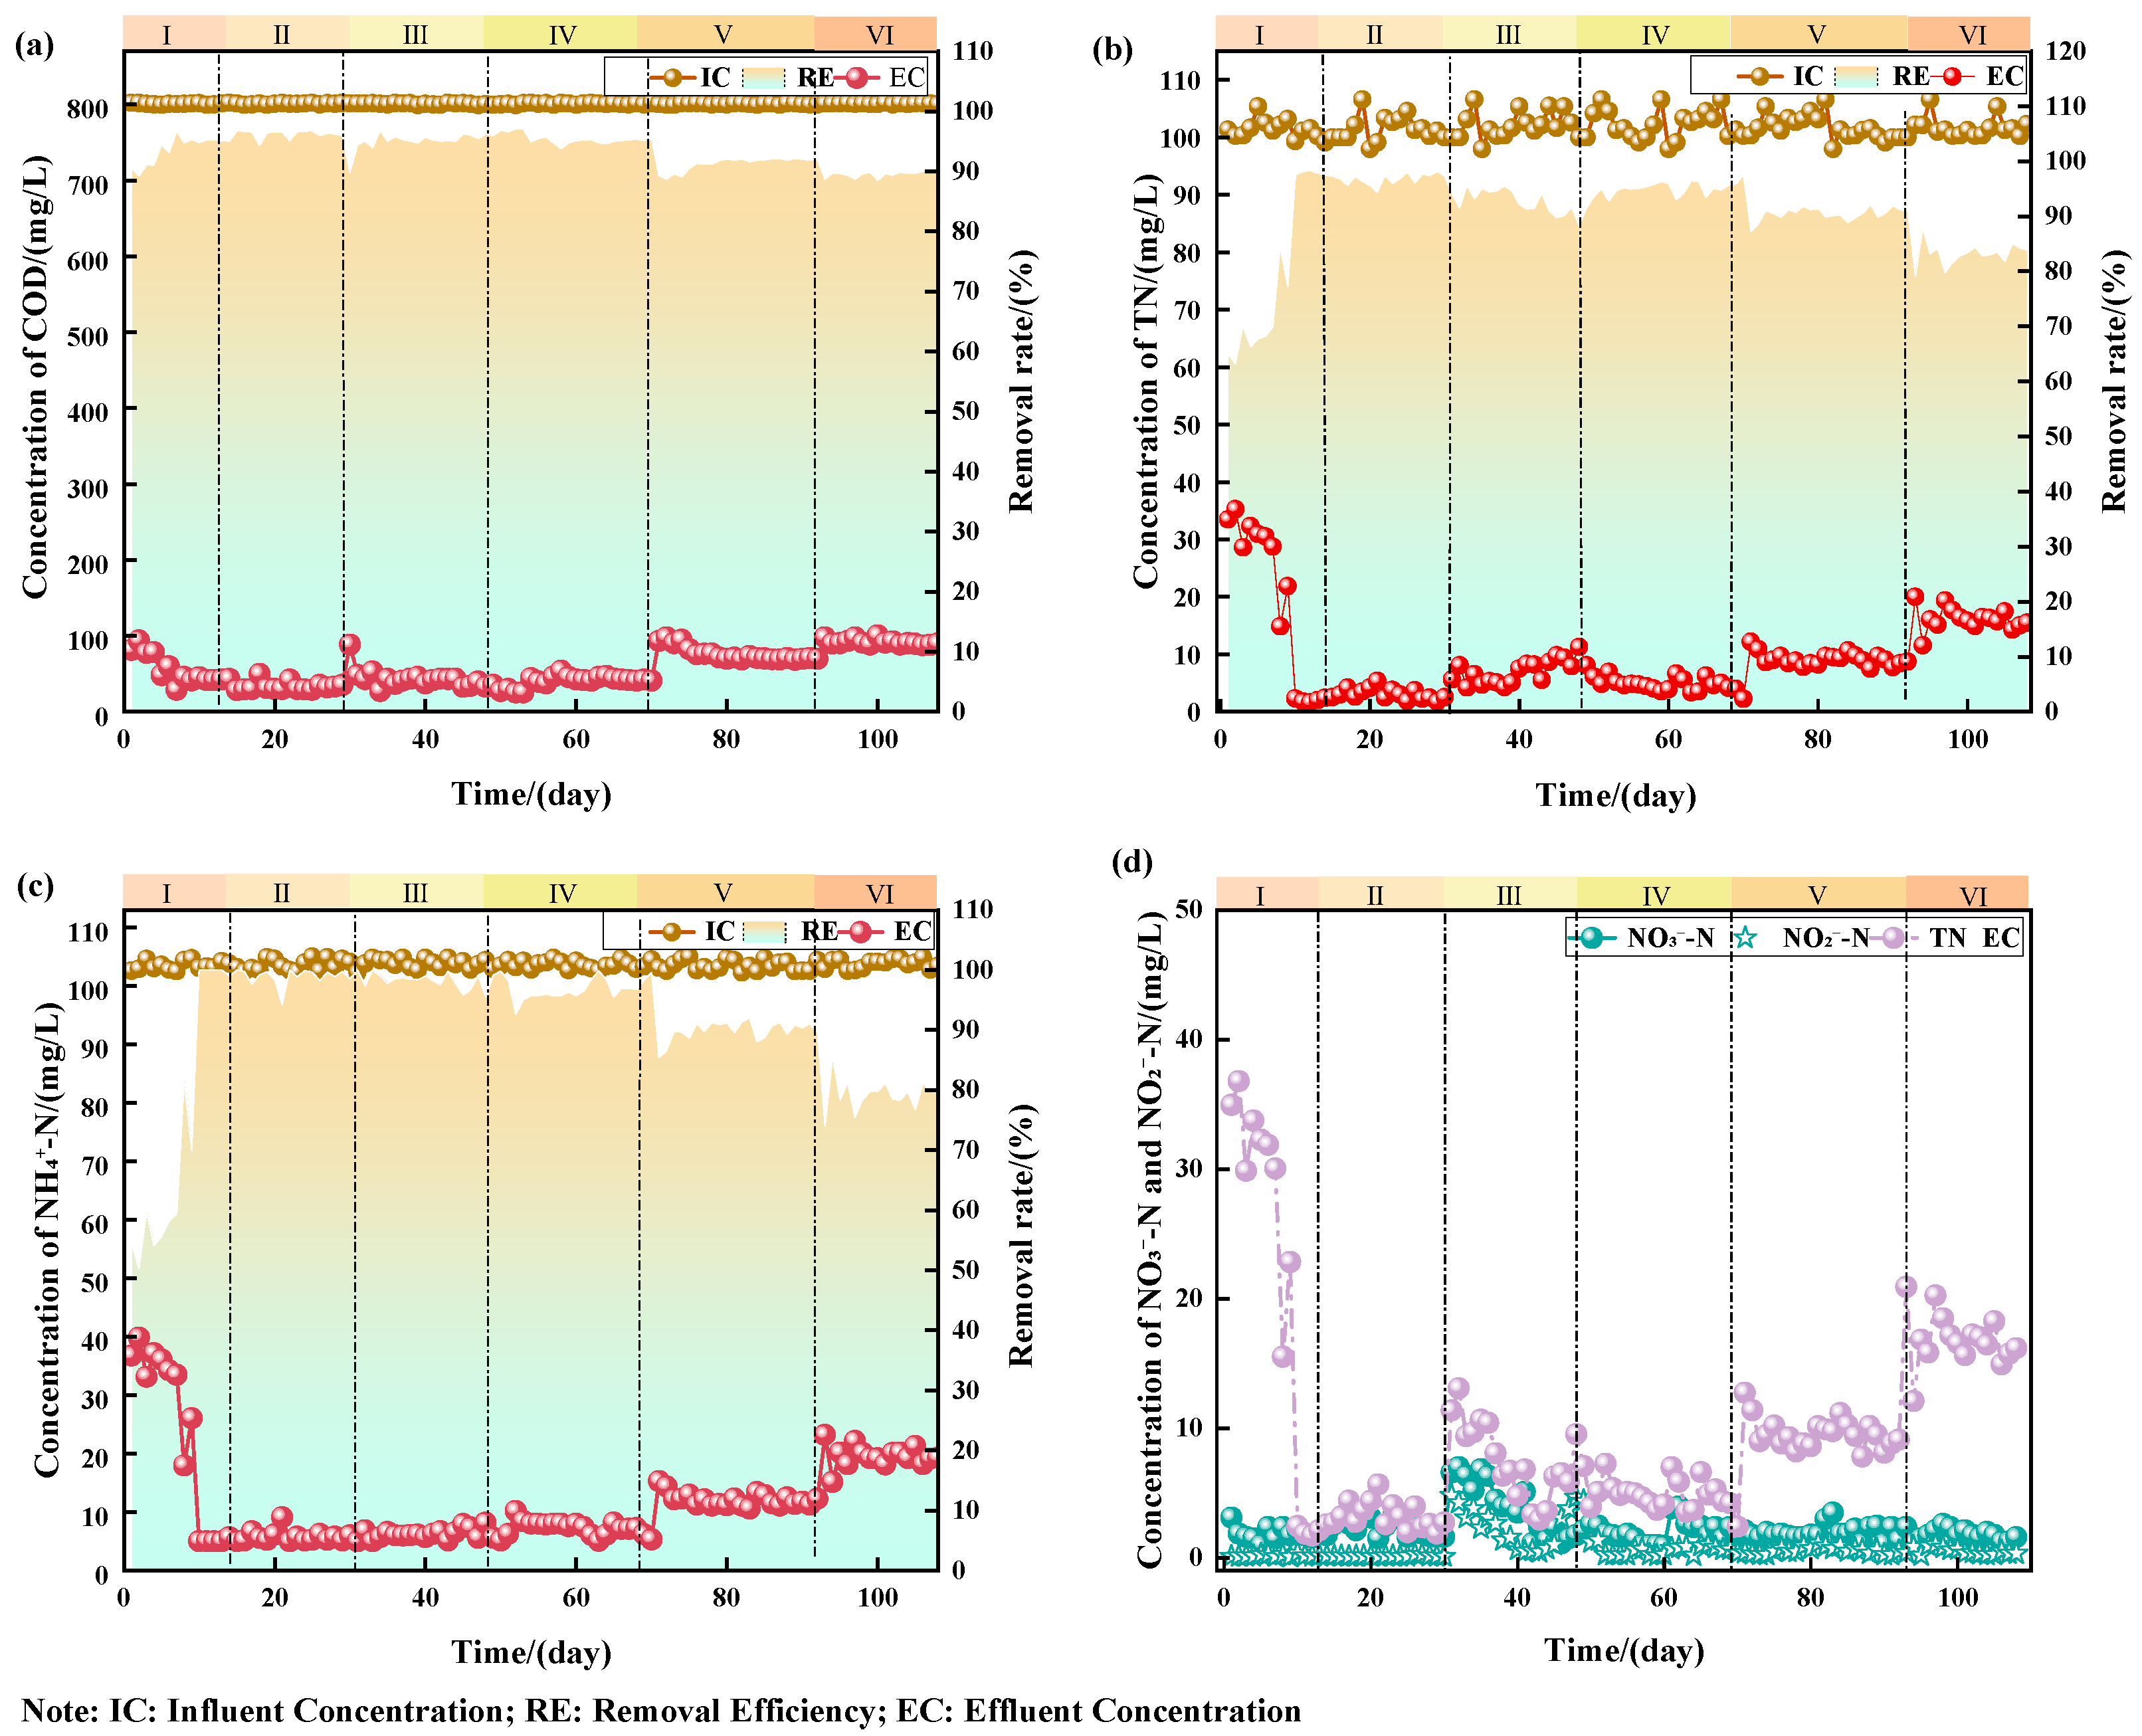
3.1. Effect of Salinity on Pollutant Removal Performance of the Reactor

Figure 2a–c show the removal efficiencies of CODcr, TN, and NH4+-N under different salinities using the three-stage AO system. When the NaCl concentration ranges from 0 to 10 g/L, there is no significant negative impact on the multi-stage AO system, and the removal efficiency remains stable without noticeable fluctuations. The effluent concentration of NH4+-N ranges from 0.5 to 1.5 mg/L, and CODcr effluent concentration ranges from 25 to 40 mg/L. The average removal rates of NH4+-N and CODcr both reached 98.3 ± 0.4% or higher, indicating that the heterotrophic carbon-oxidizing bacteria and AOB were not inhibited. However, the TN removal rate showed a temporary decrease for 3–5 days at the initial addition of NaCl, which was due to the salt’s impact on the microorganisms. The microbial system needed some time to adapt to the added salinity, and after a period of adaptation, the average TN removal rate remained around 97.5%. The results suggest that although nitrifying and denitrifying bacteria are impacted when the salinity is initially added, they eventually adapt and reach a stable state, maintaining a high removal rate [20].
At a NaCl concentration of 15 g/L, the system’s removal efficiency begins to decline. The effluent CODcr concentration rises to 70 mg/L, and the removal efficiency drops from 98% to 90%. The effluent NH4+-N concentration increases to 7.5 mg/L, with the removal efficiency dropping to 90%. When the NaCl concentration increases to 20 g/L, the various parameters fluctuate significantly. The effluent TN concentration rises to 17.5 mg/L, and the removal efficiency decreases to 83%. The effluent concentrations of CODcr and NH4+-N increase to 85 mg/L and 14.5 mg/L, respectively, with the removal efficiencies dropping to 89% and 70%. The decline in NH4+-N removal efficiency makes it difficult to meet the Class A discharge standard, directly confirming that AOB is inhibited, and its ammonia oxidation function is compromised, which in turn affects the TN removal efficiency [21].
Figure 2d shows the variation in NO3-N and NO2-N under different salinities. The results indicate that the effluent NO3-N concentration fluctuates little across various salinities, remaining between 1 and 4 mg/L. On the other hand, the effluent NO2-N concentration stays below 0.2 mg/L when the NaCl concentration is less than 1 g/L. However, when the NaCl concentration exceeds 5 g/L, it rises sharply to 4.78 mg/L. After a period of acclimatization, the concentration gradually decreases to below 1 mg/L. This suggests that the initial salinity inhibits the PN performance, but as the system adapts, the performance gradually recovers. When the salinity exceeds 10 g/L, the NO2-N concentration increases after the first-stage aerobic treatment, indicating that denitrifying bacteria are more salt-tolerant than nitrifying bacteria [22]. The increase in NO2-N concentration is mainly due to the sensitivity of NOB in nitrifying bacteria to the salinity, causing NH4+-N to be oxidized to NO2-N in the aerobic phase but not further converted to NO3-N, resulting in NO2-N accumulation.
The study identifies the salinity tolerance limits of the three-stage AO system. Under low-salinity conditions (≤10 g/L), the three-stage AO system can effectively remove pollutants such as CODcr, TN, and NH4+-N, and meet the Class A discharge standards specified in the “Pollutant Discharge Standards for Urban Wastewater Treatment Plants (GB 18918-2002)”. This indicates that within a certain salinity range, the three-stage AO system still maintains a high removal efficiency for TN. However, when the salinity exceeds 10 g/L, it significantly inhibits the system’s nitrification function, severely affecting TN removal. During the initial phase of a rapid increase in the salinity, the pollutant removal efficiency temporarily declines, but after a period of adaptation, the removal efficiency gradually recovers.

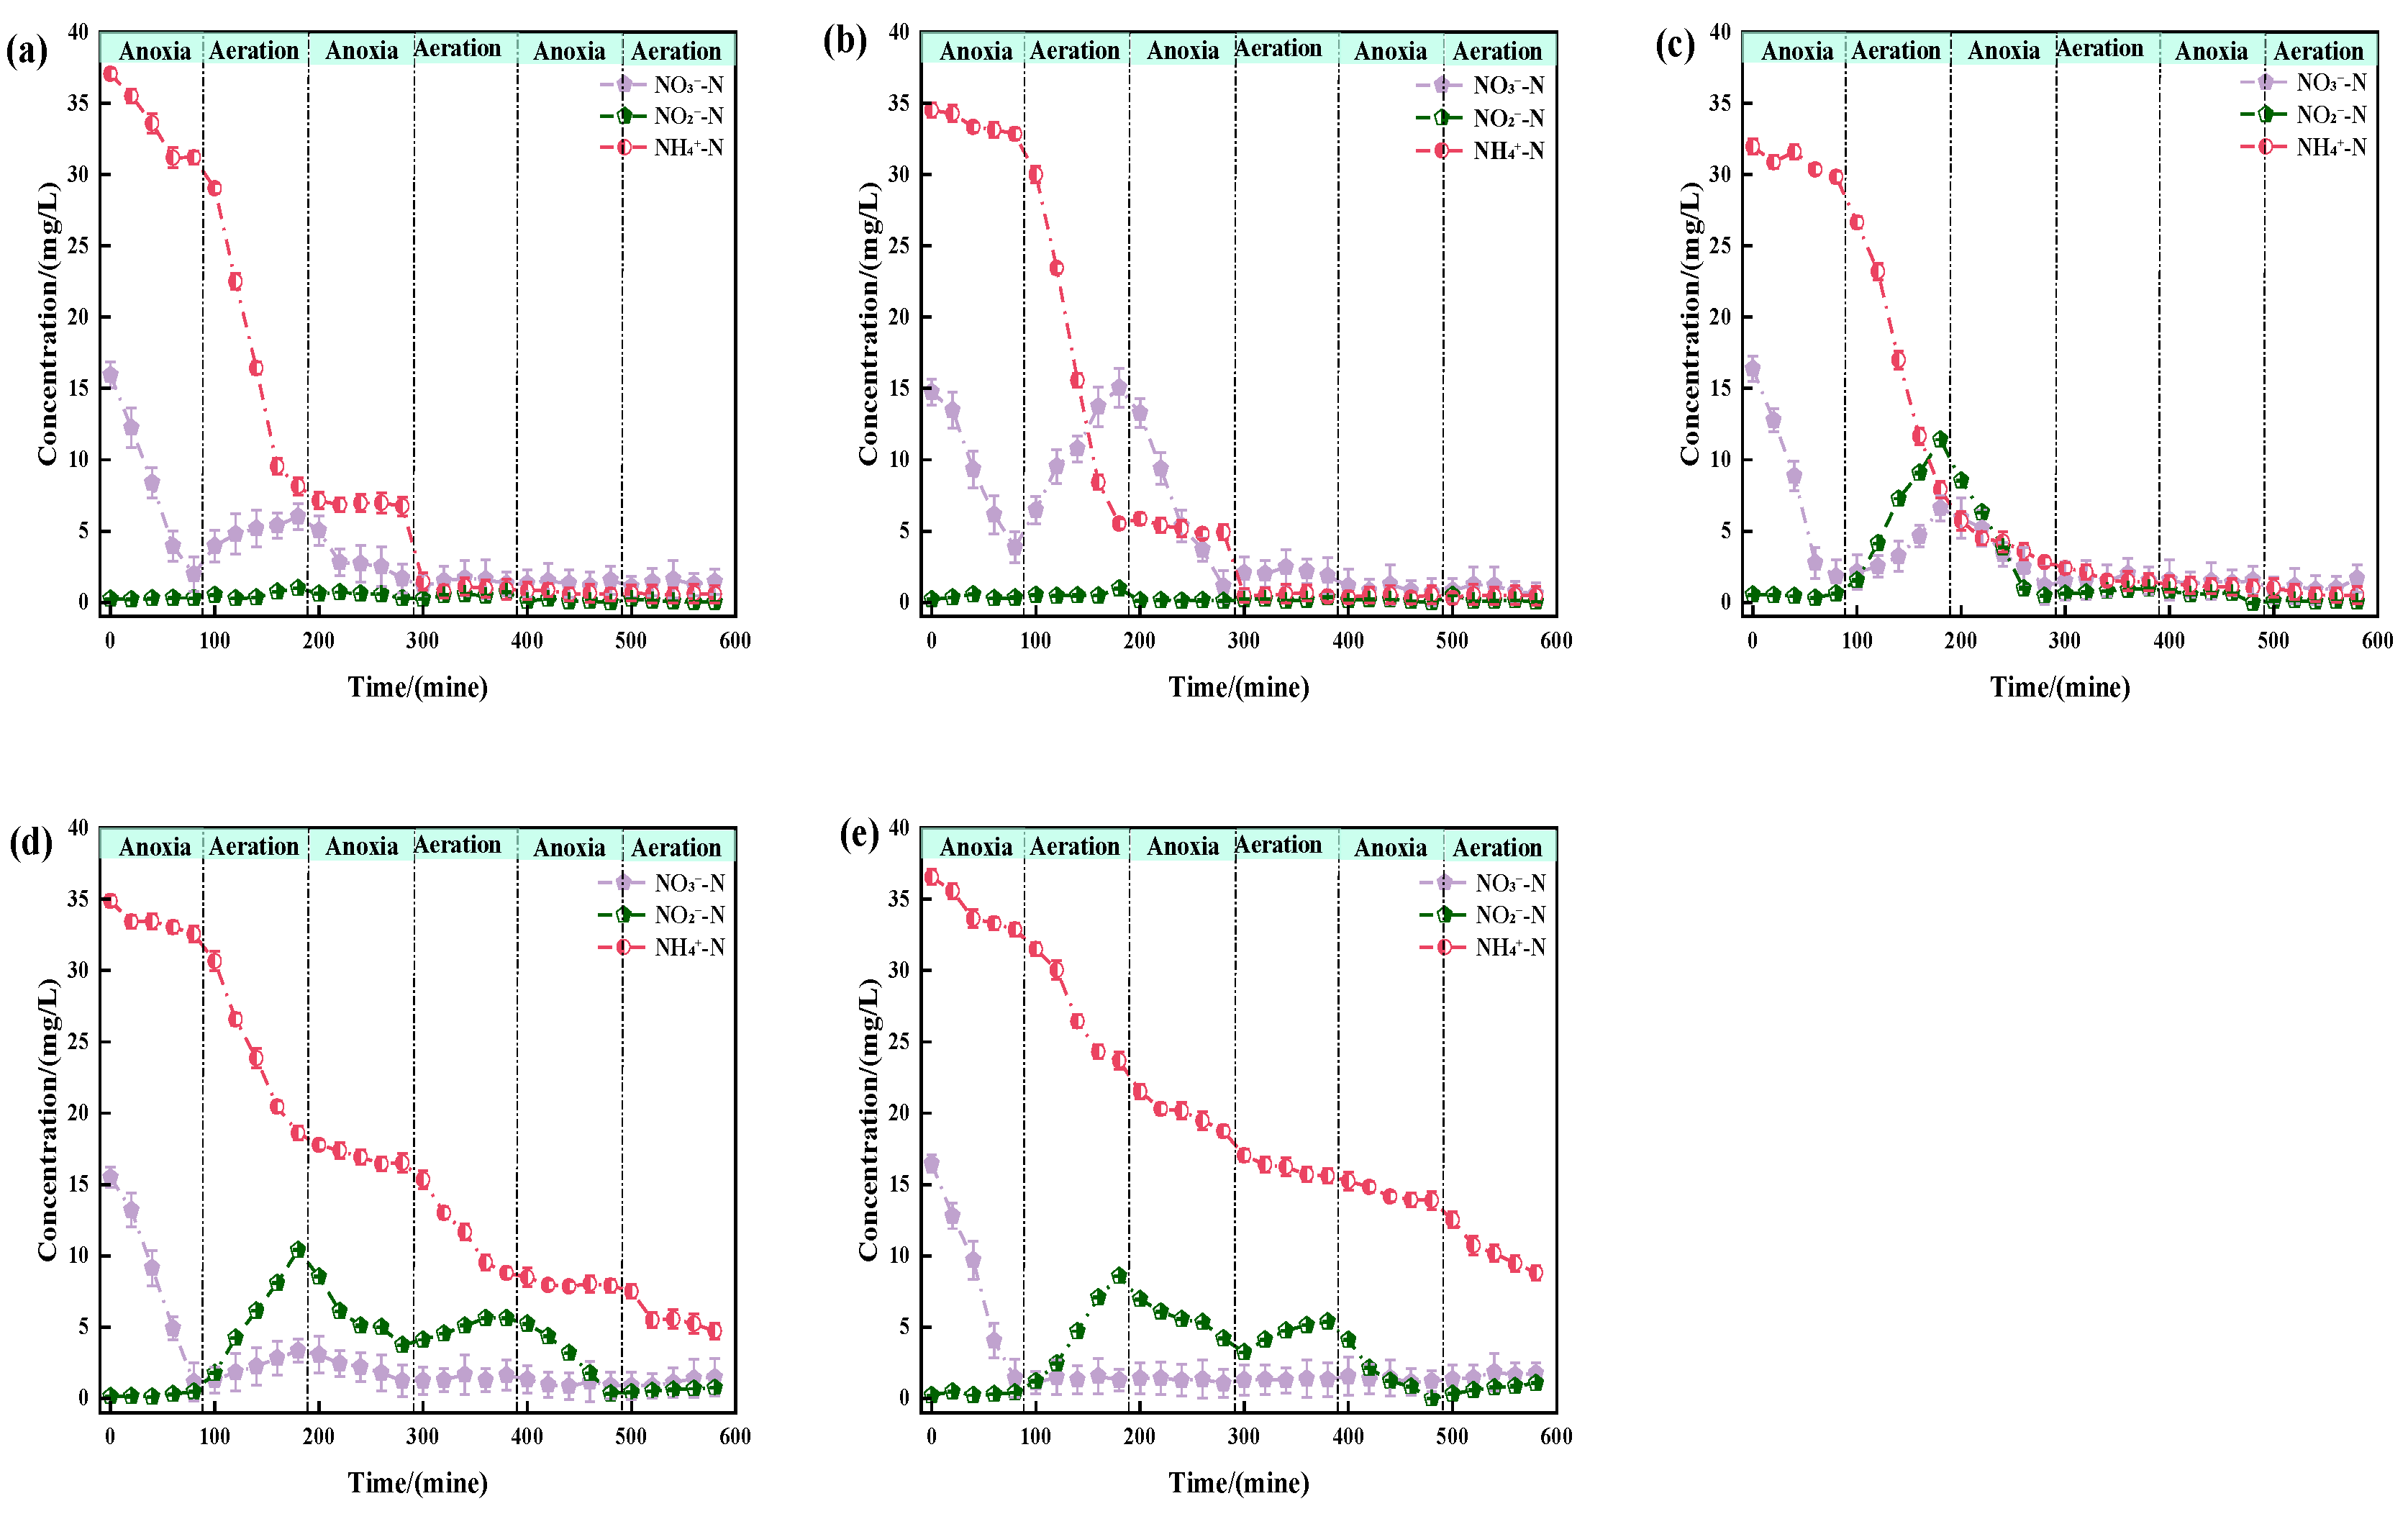
3.2. Effect of Salinity on Nitrogen Removal Pathways

Figure 3 shows the simultaneous nitrification and denitrification efficiency (SND) and nitrite accumulation rate (NAR) under different salinity conditions, with specific calculation formulas as shown in Equations (1) and (2).
SND = 1 N O x - produced N H 4 + - removal × 100 %
NAR = N O 2 N [ N O 2 N ] + [ N O 3 N ] × 100 %
In the equations, NOxproduced represents the increase in NOx-N before and after aeration in the reactor (mg/L); NH4+removal indicates the reduction of ammonia nitrogen before and after aeration (mg/L); NO2-N and NO3-N are the concentrations in the water sample (mg/L).
Figure 3 shows the simultaneous nitrification–denitrification (SND) efficiency and nitrite accumulation rate (NAR) at different salinities. The experimental results indicate that at NaCl concentrations of 1, 5, 10, 15, and 20 g/L, the NAR progressively increases to 15.89%, 6.73%, 65.64%, 79.02%, and 91.97%, respectively, which is consistent with the nitrite accumulation observed in Figure 2. The average SND efficiency is 82.38%, 57.34%, 28.58%, 10.16%, and 9.52%, respectively.
Figure 4a,b show nitrogen changes at influent salinities of 0 g/L and 5 g/L. Under low-salinity conditions, after the aerobic phase in the second stage, NH4+-N is almost completely oxidized. The remaining nitrogen in the first stage is mainly in the form of NO3-N, and the NO2-N concentration changes little, indicating that the main nitrogen removal pathway at this point is ND. Figure 4c shows the nitrogen changes at a NaCl concentration of 10 g/L. After the aerobic phase in the first stage, the NH4+-N concentration is 7.48 mg/L, indicating incomplete oxidation. Meanwhile, the NO2-N concentration increases significantly to 11.43 mg/L, and the NO3-N concentration is 5.98 mg/L. This suggests that NOB activity is inhibited by the salinity, but PN is partially retained, leading to a reduction in NO3-N generation. The denitrification efficiency declines, and the decrease in SND may be related to an increase in dissolved oxygen [23].
At a salinity of 15 g/L (Figure 4d), after the first aerobic phase, the nitrite concentration reaches 10.43 mg/L, which is higher than the nitrate concentration of 2.77 mg/L. NH4+-N is not completely oxidized, and NO2-N continues to accumulate. After aeration in the second and third stages, the concentrations of NH4+-N, NO2-N, and NO3-N are 8.504, 5.65, and 0.89 mg/L, respectively. The ammonia oxidation rate decreases, and the system primarily relies on the PN pathway. As a result, the denitrification efficiency significantly declines [24]. At a NaCl concentration of 20 g/L (Figure 4e), the ammonia oxidation rate decreases, while the PN function is enhanced. NO2-N accumulates significantly, the SND drops to 9.52%, and the NAR increases to 91.97%. Conventional nitrogen removal pathways became ineffective, and the nitrogen removal efficiency was extremely low.
In Figure 3, the NaCl concentrations of 5 g/L (starting point of NOB activity inhibition) and 10 g/L (slope change point of SND) correspond to the inflection points of TN and NH4+-N removal in Figure 2a,b, confirming that the salinity affects the overall nitrogen removal efficiency of the system by regulating the nitrogen metabolism pathways. In summary, during high-salinity, high-TN wastewater treatment, the system’s nitrogen removal pathways are significantly impacted. After the gradual failure of traditional ND pathways, enhanced PN pathways and denitrification pathways may become the primary nitrogen removal mechanisms.

3.3. Effect of Salinity on Activated Sludge Performance

3.3.1. Effect of Salinity on Activated Sludge Settling Performance

Figure 5 shows the dynamic changes in the sludge concentration (MLSS), sludge volume index (SVI), and sludge settleability (SV30) under different salinity levels. When the sodium chloride concentration is 5 g/L, the SV30 slightly increases, with an average value of 22%, falling within the optimal settling performance range (15–30%). This may be due to increased buoyancy from the added salinity. However, as the sodium chloride concentration exceeds 10 g/L, the SV30 gradually decreases, reaching 17%, 13%, and 11% at salinities of 10, 15, and 20 g/L, respectively. This decrease suggests that under saline stress, the spacing between sludge flocs reduces, and inter-particle interactions strengthen, improving the settling performance.
At 0 g/L, the SVI is 60 mL/g, which falls within the ideal performance range of 50–120 mL/g. As the salinity increases, the SVI significantly decreases, especially at 15 and 20 g/L, where it drops to 31.25 mL/g and 21.36 mL/g, respectively, below the normal range, indicating reduced sludge activity. After 30 min of settling, the supernatant becomes turbid, with severe sludge disintegration and deteriorated effluent quality, likely due to sludge toxicity induced by high-salinity stress [25].

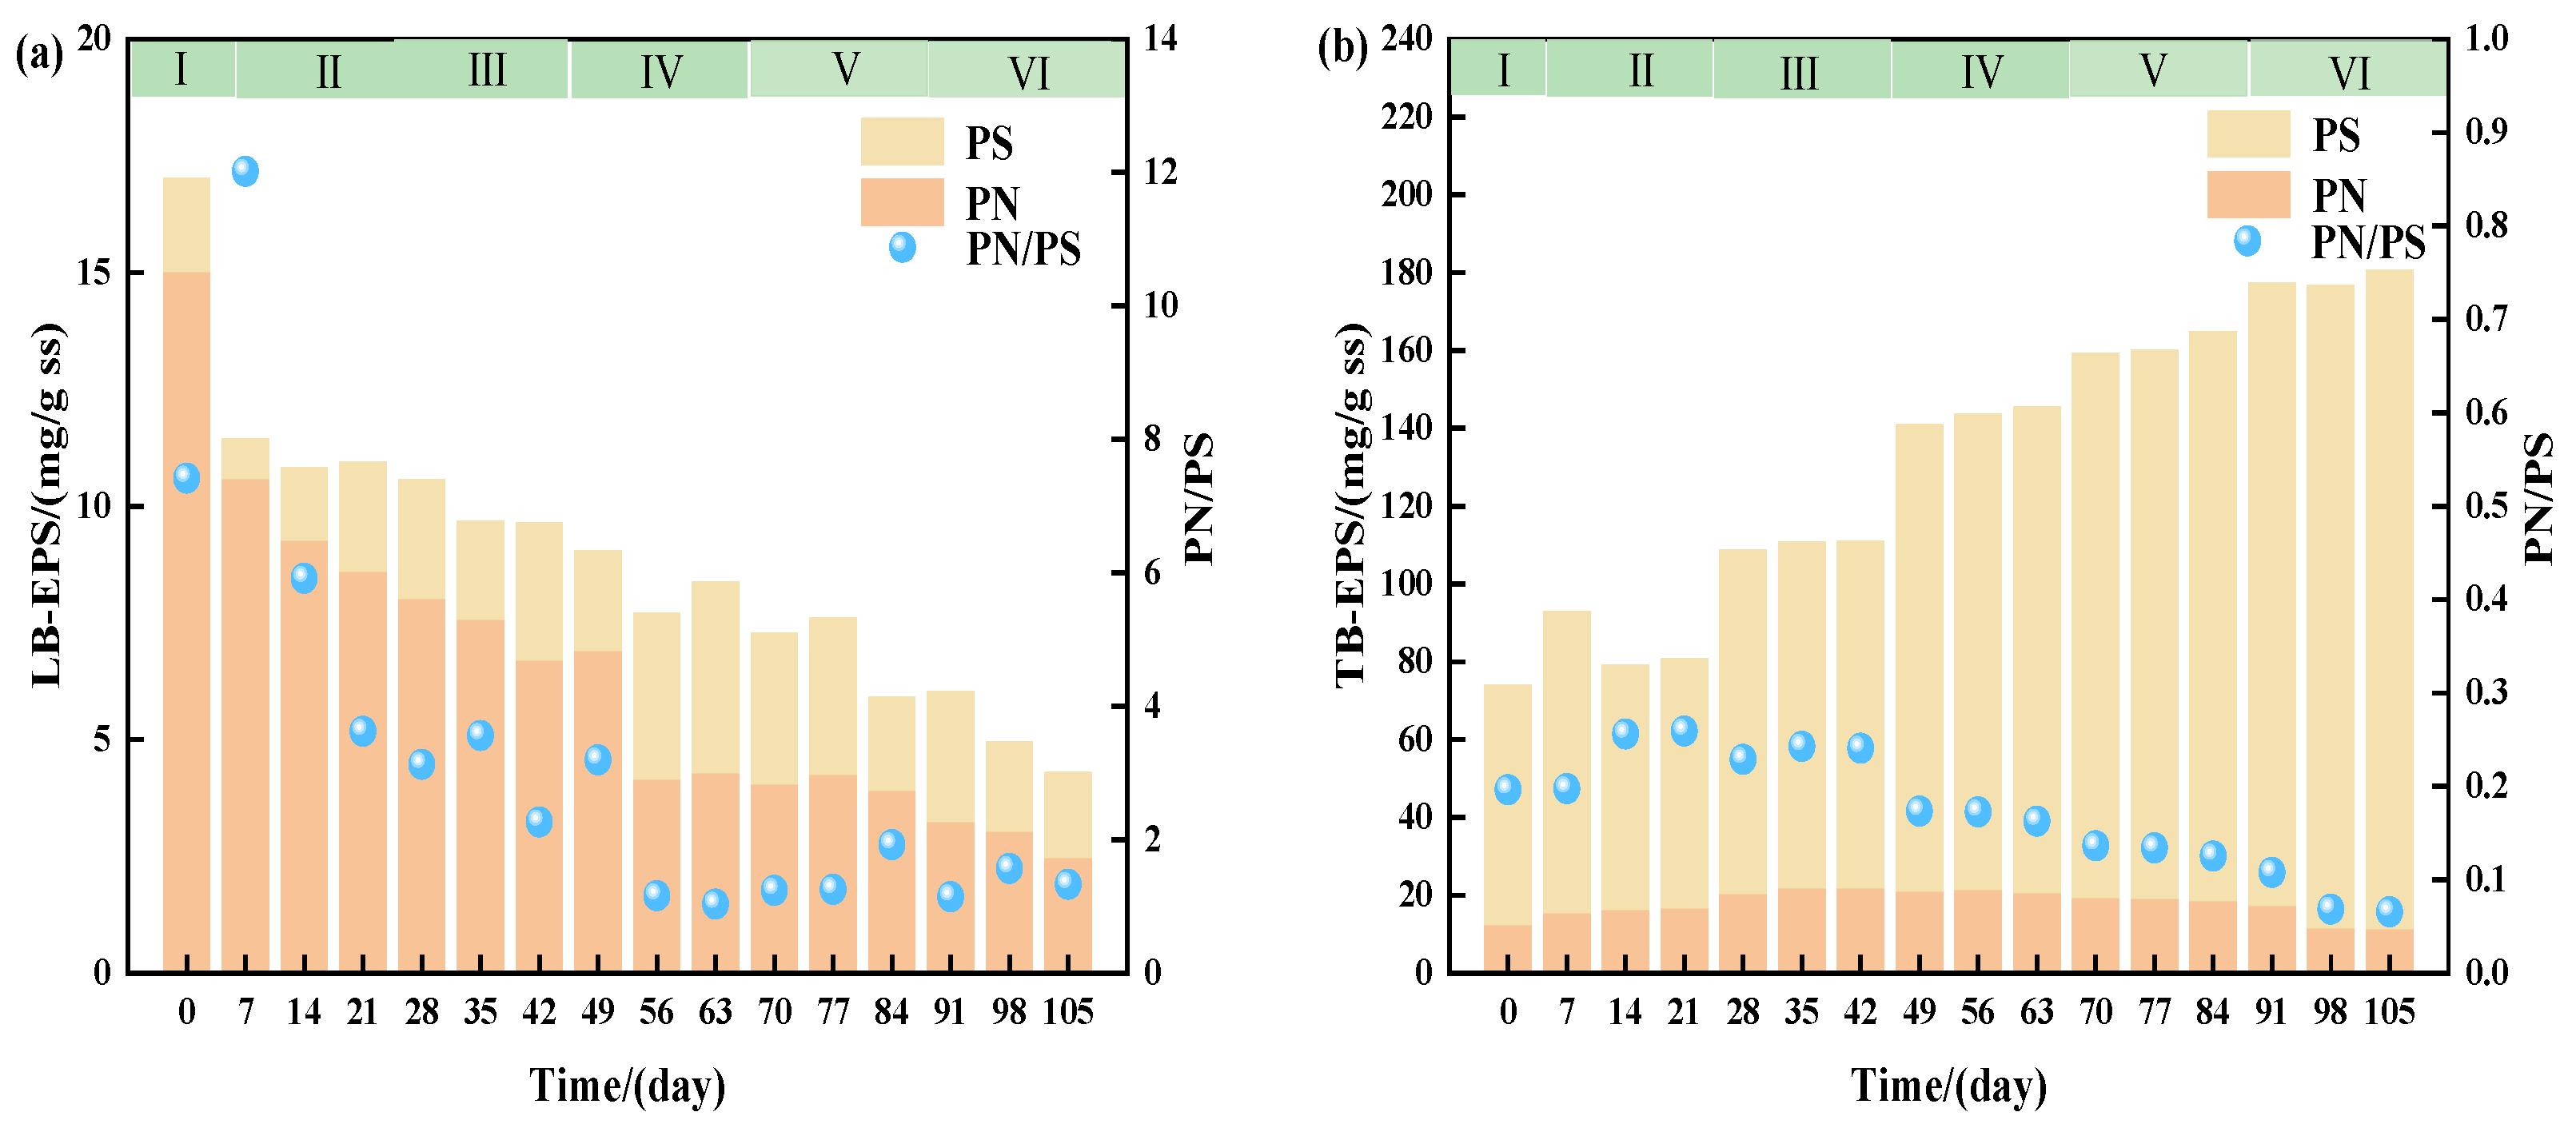
3.3.2. Effect of Salinity on EPS

Extracellular polymeric substances (EPSs) are organic compounds produced by microorganisms during metabolic activities, mainly composed of proteins (PNs) and polysaccharides (PS) [26]. Figure 6 shows the variation in the PN and PS contents in the EPS (TB-EPS and LB-EPS) at different salinity levels. The experimental results indicate that the total EPS content increases with the rising salinity. As the salinity increases from 0 g/L to 20 g/L, the EPS content rises from 91.14 mg/g·SS to 185 mg/g·SS, while the LB-EPS content decreases from 27.05 mg/g·SS to 13.5 mg/g·SS. Additionally, the PN/PS ratio in LB-EPS decreases from 7.42 to 1.33. The TB-EPS content, however, increases from 74.12 mg/g·SS to 180.69 mg/g·SS, with the PN/PS ratio declining from 0.196 to 0.066.
These results suggest that under salinity stress, activated sludge secretes a large amount of EPSs to adjust osmotic pressure in its environment. This mechanism enhances the resistance of activated sludge to saline conditions, increasing its resilience to toxic substances under high salinity and protecting cell viability.
The experimental results show that the TB-EPS content is higher than the LB-EPS content under all salinity conditions, and as the salinity increases, the increase in PS is greater than that in PN. When the salinity rose from 0 g/L to 20 g/L, the PN content in LB-EPS decreased from 14.99 to 2.46 mg/g·SS., while the PS content remained relatively unchanged. In contrast, the PS content in TB-EPS increased significantly from 61.95 mg/g·SS to 169.57 mg/g·SS. Studies suggest that the LB-EPS content affects the settling performance of activated sludge, with a higher LB-EPS content resulting in a poorer settling performance. Thus, as the salinity increases and the LB-EPS content decreases, the activated sludge settling performance improves, consistent with the reduction in SV30 shown in Figure 5 [7,27,28].
In TB-EPS, the PS content increases substantially with the rising salinity, while the PN content shows little change. This indicates that under salinity stress, activated sludge microorganisms secrete PS to enhance resistance. Research suggests that PS can protect cells by helping microorganisms withstand the increased osmotic pressure and reduce the impact of toxic substances on cells [29]. Since most of the PS secreted by microorganisms is present in TB-EPS, it suggests that microorganisms adapt to high-salinity environments by adjusting the TB-EPS levels. The increase in TB-EPS also contributes to the improved settling performance of activated sludge [30].
Figure 7 shows the infrared spectra of the EPS at different salinity levels. As seen in the figure, when the salinity ranges from 0 to 20 g/L, there are six primary absorption peaks within the wavenumber range of 560–3500 cm−1, located near 3430, 2930, 1640, 1400, 1040, and 580 cm−1. The main functional groups in the EPS include hydroxyl (-OH), imine (N-H), carbonyl (C=O), and cyano (C-N) groups. The infrared spectra of the EPS are similar in position under different salinity levels, but the peak intensities increase with the rising salinity. When the salinity increases from 0 g/L to 20 g/L, a broad peak near 580 cm−1 appears, indicating the presence of phosphorus- and sulfur-containing groups in the EPS; the absorption peak at 1040 cm−1 is associated with the C-O stretching vibration in carbohydrates [31]; the band near 1640 cm−1 corresponds to the C=O stretching vibration in amide I of proteins [31]; the absorption peak at 2930 cm−1 is attributed to the asymmetric stretching vibration of C-H [32]; and a broad absorption peak around 3430 cm−1 likely relates to the stretching vibrations of -OH and N-H groups [33]. At sodium chloride concentrations ranging from 0 to 20 g/L, the EPS spectra showed the most prominent bands around 1040, 2930, and 3430 cm−1., indicating that the EPS is rich in polysaccharides and protein-related compounds. Additionally, the peaks around 3430 cm−1 and 1640 cm−1 become more pronounced as the salinity increases, showing an intensity increase compared to the 0 g/L condition. These results suggest that increasing salinity leads to a higher protein and polysaccharide content in the EPS within activated sludge, consistent with the observed increase in the EPS content shown in Figure 6.
Figure 8 presents the 3D-EEM spectra of the EPS in the multi-stage AO system at different salinity levels. The experimental results indicate the presence of four main fluorescence peaks: Peak A (Ex/Em = 250–280 nm/330–350 nm), Peak B (Ex/Em = 200–250 nm/380–550 nm), Peak C (Ex/Em = 220–250 nm/300–380 nm), and Peak D (Ex/Em = 250–400 nm/380–550 nm). Peak A is associated with soluble microbial by-products, Peak B with fulvic acid-like substances, Peak C with tryptophan-like protein substances, and Peak D with humic acid-like substances [32,33,34]. The results show that as the salinity increases, the intensities of Peak A and Peak D gradually strengthen, indicating an increase in soluble microbial by-products and humic substances in the EPS within the three-stage AO system. The presence of Peak C suggests that proteins in the EPS primarily consist of tryptophan-related components.
Under salinities of 0 g/L and 5 g/L, the EPS is mainly composed of proteins and polysaccharides, with microorganisms focusing on maintaining basic structural integrity. At sodium chloride concentrations of 10 g/L and 15 g/L, EPS composition becomes more complex, with a significant increase in polysaccharides, nucleic acids, and humic substances, marking a peak period of EPS production. At 20 g/L salinity, the EPS is predominantly composed of polysaccharides, while proteins and other components decrease, with microorganisms again focusing on basic structural maintenance.
The results indicate that the salinity significantly impacts the structure and composition of the EPS, primarily through adjustments in the polysaccharide and protein content and changes in hydration characteristics. In high-salinity environments, the EPS becomes more compact and stable, reflecting a strong adaptability to external conditions, which is crucial for microbial survival and stability in high-salinity settings [35]. EPS production is highest at low to moderate salinity levels, helping microorganisms cope with osmotic pressure from salinity; however, at extremely high salinity, EPS production decreases, with polysaccharides becoming the dominant component of secreted EPS. These findings are important for understanding how the salinity can influence microbial behavior and metabolism. In practical applications, such as wastewater treatment or microbial environmental control, moderate salinity may promote EPS production by beneficial microbial communities.

3.4. Effect of Salinity on Microbial Community Structure

In the three-stage AO system, as the salinity increases from 0 g/L to 20 g/L, significant changes occur in the abundance of microorganisms at the phylum and genus levels, directly influencing the system’s main nitrogen removal pathways. Figure 9 summarizes the functions, salinity adaptability, and relationships with the nitrogen removal pathways of microbial phyla and genera. After stable operation for 14 days in the three-stage AO system, activated sludge samples were collected under NaCl concentrations of 0, 5, 10, 15, and 20 g/L. Each group included three biological replicates, with samples labeled sequentially as S0-1~S0-3, S1-1~S1-3, S2-1~S2-3, S3-1~S3-3, and S4-1~S4-3, totaling 15 samples.
The Proteobacteria phylum constitutes the largest proportion of the total microbial abundance in the system and includes several important denitrifying bacteria, such as Thauera and Paracoccus, as well as some nitrifying bacteria like Nitrosomonas [36]. The second-largest dominant phylum, Bacteroidota, primarily participates in organic matter decomposition, converting large organic molecules into smaller ones to provide carbon sources for other nitrogen-removing microbial populations in the system [37]. The third-largest dominant phylum, Planctomycetota, may participate in nitrogen cycling through PN, anaerobic ammonia oxidation, or other metabolic pathways and is an important autotrophic denitrifying microbial group [38,39]. Phylum-level community structure analysis shows that Proteobacteria has strong salinity tolerance under conditions of 0 g/L to 10 g/L salinity. However, under high-salinity conditions (above 10 g/L), its abundance decreases, with the proportion dropping from 61.34% to 44.45%, indicating that high salinity suppresses the denitrification process. The abundance of Bacteroidota slightly decreases to 18.28% at 10 g/L but recovers to 23.25% at 15 g/L and demonstrates strong adaptation in the 20 g/L high-salinity environment, indicating its rapid adaptation to salinity stress.
To further investigate the impact of the salinity on the microbial community structure in the three-stage AO reactor, the relative abundance of microorganisms at the genus level was analyzed. The dominant genera under different salinity conditions were mainly Candidatus_Competibacter, Thauera, Paracoccus, Defluviicoccus, OM190, and Nitrosomonas. The experimental results showed that the proportion of Competibacter decreased as the salinity increased. As a polyphosphate-accumulating bacterium, Competibacter is inhibited when the NaCl concentration exceeds 10 g/L, indicating that high salinity reduces the TP removal efficiency of the three-stage AO reactor. Additionally, high salinity negatively affects its organic matter decomposition ability, which further corroborates the observed decrease in TN removal efficiency [40,41].
Thauera and Paracoccus, typical denitrifiers capable of converting nitrate and nitrite to nitrogen gas, also showed a decrease in abundance with increasing salinity, consistent with the findings at the phylum level. Under high-salinity stress, although their abundance decreased and denitrification efficiency declined, they still maintained some denitrification function [42,43,44].
As the salinity increases, salt-tolerant bacteria like Candidatus Competibacter and Defluviicoccus continue to decompose organic matter, providing carbon sources for other nitrogen-removing microbial populations, thus sustaining the overall function of the system. Notably, when the salinity increased from 0 g/L to 5 g/L, the abundance of the “Others” group significantly decreased, suggesting that most common activated sludge microorganisms are sensitive to salinity, and only salt-tolerant species can survive under high-salinity stress. As the salinity further increases, the proportion of the “Others” group gradually increases, possibly indicating the presence of some previously undiscovered salt-tolerant microorganisms.
The relative abundance of Nitrosomonas increased to 8.22% at a NaCl concentration of 20 g/L, primarily functioning to maintain nitrification, particularly ammonia oxidation [40]. This indicates that partial nitrification was preserved as the salinity increased. Consistent with earlier experimental results, the traditional ND pathway in the system was altered, and denitrifying bacteria became dominant. This suggests a shift from the ND pathway to a combination of PN and denitrification pathways. Furthermore, previous studies on pollutant removal revealed NO2-N accumulation, and high-throughput sequencing showed no NOB-related bacteria at high-salinity levels. The nitrogen removal pathway in the system may have transitioned to partial nitrification–denitrification.

4. Conclusions

(1)
The nitrogen removal efficiency of the three-stage AO process and microbial adaptation mechanisms exhibit significant threshold effects related to the salinity. A critical salinity threshold of 10 g/L was identified: Below this level, the system stably maintained CODcr, TN, and NH4+-N removal rates > 98%, meeting Class 1A standards. Above 10 g/L, stronger inhibition of NOB compared to AOB resulted in nitrite accumulation, triggering a shift in the nitrogen removal pathways from traditional nitrification–denitrification (ND) to partial nitrification (PN) and denitrification. This caused a sharp decline in the TN removal efficiency with the increasing salinity (dropping to 83% at 20 g/L).
(2)
Microorganisms adapted to high-salt stress through dual strategies: (1) Enhanced resistance via extracellular polymeric substances (EPSs): Increased polysaccharide (PS) production dominated EPS secretion, while elevated TB-EPS proportions optimized sludge settleability. (2) Functional microbial community restructuring: Despite reduced Proteobacteria abundance, synergistic coupling with Planctomycetota established novel nitrogen removal metabolic pathways. High-salt-tolerant denitrifying bacteria like Thauera became dominant nitrogen removal contributors in later stages.
In practical applications, a salinity gradient regulation system should be established: the influent salinity should be controlled below 10 g/L or targeted enrichment of functional bacteria achieved through gradient acclimation—the initial stage (≤10 g/L) protects AOB to maintain ammonia oxidation, while the subsequent stage (≥15 g/L) activates halotolerant denitrifying microbial communities. The synchronized implementation of dynamic monitoring synergistically ensures system stability, and this strategy provides a systematic solution for high-salinity wastewater treatment, spanning from microbial adaptation to process intensification.

5. Additional Requirements

Practitioner Points:
  • At sodium chloride concentrations of 0–10 g/L, the three-stage AO system achieves stable CODcr, TN, and NH4+-N removal efficiencies above 98%, meeting the first-grade A standard in China’s discharge standards (GB 18918-2002). At a sodium chloride concentration above 20 g/L, removal efficiency significantly declines.
  • When sodium chloride concentrations exceed 10 g/L, AOB and NOB are inhibited, shifting from the conventional ND pathway to PN and denitrification pathways, causing NO2-N accumulation and reduced nitrogen removal efficiency (NAR).
  • The EPS content rises with the salinity, with TB-EPS exceeding LB-EPS; PS increases more than PN, enhancing sludge salt tolerance and settling properties.

Author Contributions

Conceptualization, X.Y. and S.S.; methodology, X.Y. and S.S.; validation, X.Y., S.S. and S.W.; writing—original draft preparation, S.S.; writing—review and editing, X.Y. and P.C.; visualization, J.L. All authors have read and agreed to the published version of the manuscript.

Funding

This research received no external funding.

Data Availability Statement

The data presented in this study are available upon request from the corresponding authors. These data are not publicly available for reasons that have not been summarized.

Conflicts of Interest

Pengfei Cui was employed by Beijing Origin Water Technology Co., Ltd. The remaining authors declare that the research was conducted in the absence of any commercial or financial relationships that could be construed as a potential conflict of interest.

References

  1. Alattabi, A.W.; Harris, C.B.; Alkhaddar, R.M.; Ortoneda-Pedrola, M.; Alzeyadi, A.T. An investigation into the effect of MLSS on the effluent quality and sludge settleability in an aerobic-anoxic sequencing batch reactor (AASBR). J. Water Process Eng. 2019, 30, 100479. [Google Scholar] [CrossRef]
  2. Li, W.; Zhang, Q.; Li, J.; Gao, R.; Kao, C.; Li, X.; Peng, Y. Nitrogen removal from high-saline municipal wastewater via anammox-based process driven by both nitritation and denitratation. Chem. Eng. J. 2023, 462, 142269. [Google Scholar] [CrossRef]
  3. Ji, B.; Zhang, H.; Zhou, L.; Yang, J.; Zhang, K.; Yuan, X.; Ma, J.; Qian, Y. Effect of the rapid increase of salinity on anoxic-oxic biofilm reactor for treatment of high-salt and high-ammonia–nitrogen wastewater. Bioresour. Technol. 2021, 337, 125363. [Google Scholar] [CrossRef]
  4. Cataldo, S.; Iannì, A.; Loddo, V.; Mirenda, E.; Palmisano, L.; Parrino, F.; Piazzese, D. Combination of advanced oxidation processes and active carbons adsorption for the treatment of simulated saline wastewater. Sep. Purif. Technol. 2016, 171, 101–111. [Google Scholar] [CrossRef]
  5. Dahmardeh, H.; Akhlaghi Amiri, H.A.; Nowee, S.M. Evaluation of mechanical vapor recompression crystallization process for treatment of high salinity wastewater. Chem. Eng. Process.-Process Intensif. 2019, 145, 107682. [Google Scholar] [CrossRef]
  6. Song, Q.; Chen, X.; Hua, Y.; Chen, S.; Ren, L.; Dai, X. Biological treatment processes for saline organic wastewater and related inhibition mechanisms and facilitation techniques: A comprehensive review. Environ. Res. 2023, 239, 117404. [Google Scholar] [CrossRef]
  7. Liu, Z.; Zhang, D.; Ning, F.; Zhang, S.; Hou, Y.; Gao, M.; Wang, J.; Zhang, A.; Liu, Y. Resistance and adaptation of mature algal-bacterial granular sludge under salinity stress. Sci. Total Environ. 2023, 861, 160558. [Google Scholar] [CrossRef]
  8. Cao, T.N.-D.; Bui, X.-T.; Le, L.-T.; Dang, B.-T.; Tran, D.P.-H.; Vo, T.-K.-Q.; Tran, H.-T.; Nguyen, T.-B.; Mukhtar, H.; Pan, S.-Y.; et al. An overview of deploying membrane bioreactors in saline wastewater treatment from perspectives of microbial and treatment performance. Bioresour. Technol. 2022, 363, 127831. [Google Scholar] [CrossRef]
  9. Lin, L.; Pratt, S.; Li, Z.; Ye, L. Adaptation and evolution of freshwater Anammox communities treating saline/brackish wastewater. Water Res. 2021, 207, 117815. [Google Scholar] [CrossRef]
  10. Gomes, M.B.; Gonzales-Limache, E.E.; Sousa, S.T.P.; Dellagnezze, B.M.; Sartoratto, A.; Silva, L.C.F.; Gieg, L.M.; Valoni, E.; Souza, R.S.; Torres, A.P.R.; et al. Exploring the potential of halophilic bacteria from oil terminal environments for biosurfactant production and hydrocarbon degradation under high-salinity conditions. Int. Biodeterior. Biodegrad. 2018, 126, 231–242. [Google Scholar] [CrossRef]
  11. Chhetri, R.K.; Karvelas, S.; Sanchez, D.F.; Droumpali, A.; Kokkoli, A.; Andersen, H.R. A modified nitrification inhibition test for high-salinity wastewater. Chem. Eng. J. 2022, 429, 132460. [Google Scholar] [CrossRef]
  12. Ma, T.; Sun, S.; Fu, G.T.; Hall, J.W.; Ni, Y.; He, L.H.; Yi, J.W.; Zhao, N.; Du, Y.Y.; Pei, T.; et al. Pollution exacerbates China’s water scarcity and its regional inequality. Nat. Commun. 2020, 11, 650. [Google Scholar] [CrossRef] [PubMed]
  13. Liu, J.; Chu, G.; Wang, Q.; Zhang, Z.; Lu, S.; She, Z.; Zhao, Y.; Jin, C.; Guo, L.; Ji, J.; et al. Metagenomic analysis and nitrogen removal performance evaluation of activated sludge from a sequencing batch reactor under different salinities. J. Environ. Manag. 2022, 323, 116213. [Google Scholar] [CrossRef]
  14. Zhang, J.; Wang, D.; Liu, J.; Huang, Y.; Yang, H.; Deng, L. How to combine SBR and A/O process for pollutant removal in treating digested effluent of swine wastewater. J. Environ. Manag. 2025, 375, 124189. [Google Scholar] [CrossRef]
  15. Lou, T.; Peng, Z.; Jiang, K.; Niu, N.; Wang, J.; Liu, A. Nitrogen removal characteristics of biofilms in each area of a full-scale AAO oxidation ditch process. Chemosphere 2022, 302, 134871. [Google Scholar] [CrossRef]
  16. Jijingi, H.E.; Yazdi, S.K.; Abakar, Y.A.; Etim, E. Evaluation of membrane bioreactor (MBR) technology for industrial wastewater treatment and its application in developing countries: A review. Case Stud. Chem. Environ. Eng. 2024, 10, 100886. [Google Scholar] [CrossRef]
  17. Yan, Z.; Han, X.; Wang, H.; Jin, Y.; Song, X. Influence of aeration modes and DO on simultaneous nitrification and denitrification in treatment of hypersaline high-strength nitrogen wastewater using sequencing batch biofilm reactor (SBBR). J. Environ. Manag. 2024, 359, 121075. [Google Scholar] [CrossRef]
  18. Zhao, H. A new technology for the effluent of the municipal sewage treatment plant to reach the first-class A standard. Water Supply Drain. Dyn. 2011, 2. [Google Scholar]
  19. Salama, Y.; Chennaoui, M.; Sylla, A.; Mountadar, M.; Rihani, M.; Assobhei, O. Characterization, structure, and function of extracellular polymeric substances (EPS) of microbial biofilm in biological wastewater treatment systems: A review. Desalination Water Treat. 2016, 57, 16220–16237. [Google Scholar] [CrossRef]
  20. She, Z.L.; Zhao, L.T.; Zhang, X.L.; Jin, C.J.; Guo, L.; Yang, S.Y.; Zhao, Y.G.; Gao, M.C. Partial nitrification and denitrification in a sequencing batch reactor treating high-salinity wastewater. Chem. Eng. J. 2016, 288, 207–215. [Google Scholar] [CrossRef]
  21. Zhang, M.; Jiao, T.; Chen, S.; Zhou, W. A review of microbial nitrogen transformations and microbiome engineering for biological nitrogen removal under salinity stress. Chemosphere 2023, 341, 139949. [Google Scholar] [CrossRef] [PubMed]
  22. Corsino, S.F.; Capodici, M.; Di Pippo, F.; Tandoi, V.; Torregrossa, M. Comparison between kinetics of autochthonous marine bacteria in activated sludge and granular sludge systems at different salinity and SRTs. Water Res. 2019, 148, 425–437. [Google Scholar] [CrossRef] [PubMed]
  23. Zheng, W.; Zhang, Y.; Li, L.; Pen, Y.; Wang, S. Simultaneous nitritation and denitritation of domestic wastewater without addition of external carbon sources at limited aeration and normal temperatures. Desalination Water Treat. 2010, 21, 210–219. [Google Scholar] [CrossRef]
  24. Lin, C.; Liu, Y.; Li, Y.-Y.; Liu, J. Achieving rapid start-up of mainstream partial nitritation by sludge treatment using high salinity. Chem. Eng. J. 2024, 483, 149290. [Google Scholar] [CrossRef]
  25. Wang, Z.; van Loosdrecht, M.C.M.; Saikaly, P.E. Gradual adaptation to salt and dissolved oxygen: Strategies to minimize adverse effect of salinity on aerobic granular sludge. Water Res. 2017, 124, 702–712. [Google Scholar] [CrossRef]
  26. Chen, Y.; Liu, Y.; Lv, J.; Wu, D.; Jiang, L.; Lv, W. Short-time aerobic digestion treatment of waste activated sludge to enhance EPS production and sludge dewatering performance by changing microbial communities: The impact of temperature. Water Cycle 2024, 5, 146–155. [Google Scholar] [CrossRef]
  27. Moussa, M.S.; Sumanasekera, D.U.; Ibrahim, S.H.; Lubberding, H.J.; Hooijmans, C.M.; Gijzen, H.J.; van Loosdrecht, M.C.M. Long term effects of salt on activity, population structure and floc characteristics in enriched bacterial cultures of nitrifiers. Water Res. 2006, 40, 1377–1388. [Google Scholar] [CrossRef]
  28. Pronk, M.; Bassin, J.P.; de Kreuk, M.K.; Kleerebezem, R.; van Loosdrecht, M.C.M. Evaluating the main and side effects of high salinity on aerobic granular sludge. Appl. Microbiol. Biotechnol. 2014, 98, 1339–1348. [Google Scholar] [CrossRef]
  29. Li, J.; Ma, Z.; Gao, M.; Wang, Y.; Yang, Z.; Xu, H.; Wang, X.-H. Enhanced aerobic granulation at low temperature by stepwise increasing of salinity. Sci. Total Environ. 2020, 722, 137660. [Google Scholar] [CrossRef]
  30. Sivasubramanian, R.; Chen, G.-h.; Mackey, H.R. Shock effects of monovalent cationic salts on seawater cultivated granular sludge. J. Hazard. Mater. 2021, 403, 123646. [Google Scholar] [CrossRef]
  31. Badireddy, A.R.; Chellam, S.; Gassman, P.L.; Engelhard, M.H.; Lea, A.S.; Rosso, K.M. Role of extracellular polymeric substances in bioflocculation of activated sludge microorganisms under glucose-controlled conditions. Water Res. 2010, 44, 4505–4516. [Google Scholar] [CrossRef] [PubMed]
  32. Li, B.; Liu, Y.; Wan, P.; Yu, X.; Chen, H.; Lv, W. New perspectives on enhancing waste activated sludge dewaterability through extracellular polymeric substances (EPS) biodegradation: Investigating the impact of EPS stratification and conversion. J. Water Process Eng. 2024, 65, 105803. [Google Scholar] [CrossRef]
  33. Wang, Z.; Gao, M.; Wang, Z.; She, Z.; Chang, Q.; Sun, C.; Zhang, J.; Ren, Y.; Yang, N. Effect of salinity on extracellular polymeric substances of activated sludge from an anoxic–aerobic sequencing batch reactor. Chemosphere 2013, 93, 2789–2795. [Google Scholar] [CrossRef] [PubMed]
  34. Zhou, J.; Wang, J.J.; Baudon, A.; Chow, A.T. Improved Fluorescence Excitation-Emission Matrix Regional Integration to Quantify Spectra for Fluorescent Dissolved Organic Matter. J. Environ. Qual. 2013, 42, 925–930. [Google Scholar] [CrossRef]
  35. Gao, M.; Yang, J.; Liu, Y.; Zhang, J.; Li, J.; Liu, Y.; Wu, B.; Gu, L. Deep insights into the anaerobic co-digestion of waste activated sludge with concentrated leachate under different salinity stresses. Sci. Total Environ. 2022, 838, 155922. [Google Scholar] [CrossRef]
  36. Miao, L.; Wang, S.; Li, B.; Cao, T.; Zhang, F.; Wang, Z.; Peng, Y. Effect of carbon source type on intracellular stored polymers during endogenous denitritation (ED) treating landfill leachate. Water Res. 2016, 100, 405–412. [Google Scholar] [CrossRef]
  37. Wen, X.; Cui, L.; Lin, H.; Zhu, W.; Shao, Z.; Wang, Y. Comparison of nitrification performance in SBR and SBBR with response to NaCl salinity shock: Microbial structure and functional genes. Environ. Res. 2024, 252, 118917. [Google Scholar] [CrossRef]
  38. Liu, J.; Hu, M.; Hu, M.; Wang, J.; Zhang, T.; Wang, Y.; Wang, X. Responses of suspended sludge and biofilm in a SNAD system under C/N elevation: Microbial activity, nitrogen conversion flux and molecular ecological network. Sci. Total Environ. 2024, 954, 176236. [Google Scholar] [CrossRef]
  39. Wang, Y.-C.; Fu, H.-M.; Shen, Y.; Wang, J.; Wang, N.; Chen, Y.-P.; Yan, P. Biosynthetic potential of uncultured anammox community bacteria revealed through multi-omics analysis. Bioresour. Technol. 2024, 401, 130740. [Google Scholar] [CrossRef]
  40. Rubio-Rincón, F.J.; Lopez-Vazquez, C.M.; Welles, L.; van Loosdrecht, M.C.M.; Brdjanovic, D. Cooperation between Candidatus Competibacter and Candidatus Accumulibacter clade I, in denitrification and phosphate removal processes. Water Res. 2017, 120, 156–164. [Google Scholar] [CrossRef]
  41. Zhang, K.; Miao, Y.; Zou, J.; Wang, S.; Hu, C.; Wang, Z. The start-up of anammox system inoculated with sludge overwhelmingly dominated by Candidatus Competibacter: System performance and microbial community succession. J. Water Process Eng. 2024, 57, 104605. [Google Scholar] [CrossRef]
  42. Jiang, H.; Wang, Z.; Ren, S.; Qiu, J.; Zhang, Q.; Li, X.; Peng, Y. Enrichment and retention of key functional bacteria of partial denitrification-Anammox (PD/A) process via cell immobilization: A novel strategy for fast PD/A application. Bioresour. Technol. 2021, 326, 124744. [Google Scholar] [CrossRef] [PubMed]
  43. Jing, J.; Sun, L.; Chen, Z.; Guo, X.; Qu, Y. Simultaneous selenite reduction and nitrogen removal using Paracoccus sp.: Reactor performance, microbial community, and mechanism. Environ. Res. 2024, 240, 117564. [Google Scholar] [CrossRef] [PubMed]
  44. Ren, T.; Chi, Y.; Wang, Y.; Shi, X.; Jin, X.; Jin, P. Diversified metabolism makes novel Thauera strain highly competitive in low carbon wastewater treatment. Water Res. 2021, 206, 117742. [Google Scholar] [CrossRef]
Figure 1. Schematic diagram of the experimental reactor (a) and photograph of the actual reactor (b).
Water 17 01112 g001
Figure 2. (a) CODcr, (b) TN, (c) NH4+-N removal performance and (d) nitrogen variation at different salinity levels (I: 0 g/L, II: 1 g/L, III: 5 g/L, IV: 10 g/L, V: 15 g/L, VI: 20 g/L).
Water 17 01112 g002
Figure 3. Variations in SND and NAR at different salinity levels.
Water 17 01112 g003
Figure 4. Nitrogen variation at different salinity levels ((a) 0 g/L, (b) 5 g/L, (c) 10 g/L, (d) 15 g/L, and (e) 20 g/L).
Water 17 01112 g004
Figure 5. Physicochemical properties of activated sludge at different salinity levels (I: 0 g/L, II: 1 g/L, III: 5 g/L, IV: 10 g/L, V: 15 g/L, VI: 20 g/L).
Water 17 01112 g005
Figure 6. Variation in (a) LB-EPS and (b) TB-EPS content at different salinity levels (I: 0 g/L, II: 1 g/L, III: 5 g/L, IV: 10 g/L, V: 15 g/L, VI: 20 g/L).
Water 17 01112 g006
Figure 7. Infrared spectra of activated sludge EPS at different salinity levels.
Water 17 01112 g007
Figure 8. The 3D-EEM spectra of EPS at different salinity levels ((a) 0 g/L, (b) 5 g/L, (c) 10 g/L, (d) 15 g/L, and (e) 20 g/L).
Water 17 01112 g008
Figure 9. Microbial community structure at different salinity levels ((a) phylum level and (b) genus level) (S0: 0 g/L, S1: 5 g/L, S2: 10 g/L, S3: 15 g/L, S4: 20 g/L).
Water 17 01112 g009
Table 1. Artificial simulation of sewage composition table.
ComponentConcentration (mg/L)ComponentConcentration (mg/L)
Sodium acetate5120Iron (III) chloride1500
Magnesium sulfate90Copper (II) sulfate30
Calcium chloride14Potassium iodide180
Ammonium chloride1340Manganese chloride153
Dipotassium hydrogen phosphate 184Sodium molybdate60
Yeast extract10Boric acid150
Cobalt chloride hexahydrate150Zinc sulfate120
EDTA10,000
Table 2. Methods for analyzing water quality indicators.
Parameter IndicatorAnalytical Method
CODcrRapid digestion spectrophotometry (HJ/T 399-2007)
NH4+-NNessler’s reagent spectrophotometry (HJ 535-2009)
NO3-NUV spectrophotometry (SL 84-1994)
NO2-NSpectrophotometry (GB 7493-1987)
TNAlkaline persulfate digestion–UV spectrophotometry (HJ 636-2012)
Disclaimer/Publisher’s Note: The statements, opinions and data contained in all publications are solely those of the individual author(s) and contributor(s) and not of MDPI and/or the editor(s). MDPI and/or the editor(s) disclaim responsibility for any injury to people or property resulting from any ideas, methods, instructions or products referred to in the content.

