Assessing Seasonal Biogeochemical Variations in the Mun River Watershed Using Water Quality Data and the Geochemical Mass Balance Method
Abstract
1. Introduction
2. Materials and Methods
2.1. Study Area
2.2. Sample Collection and Analysis
2.3. Hydrochemical Facies
2.4. Geochemical Mass Balance (GMB) Analysis
3. Results
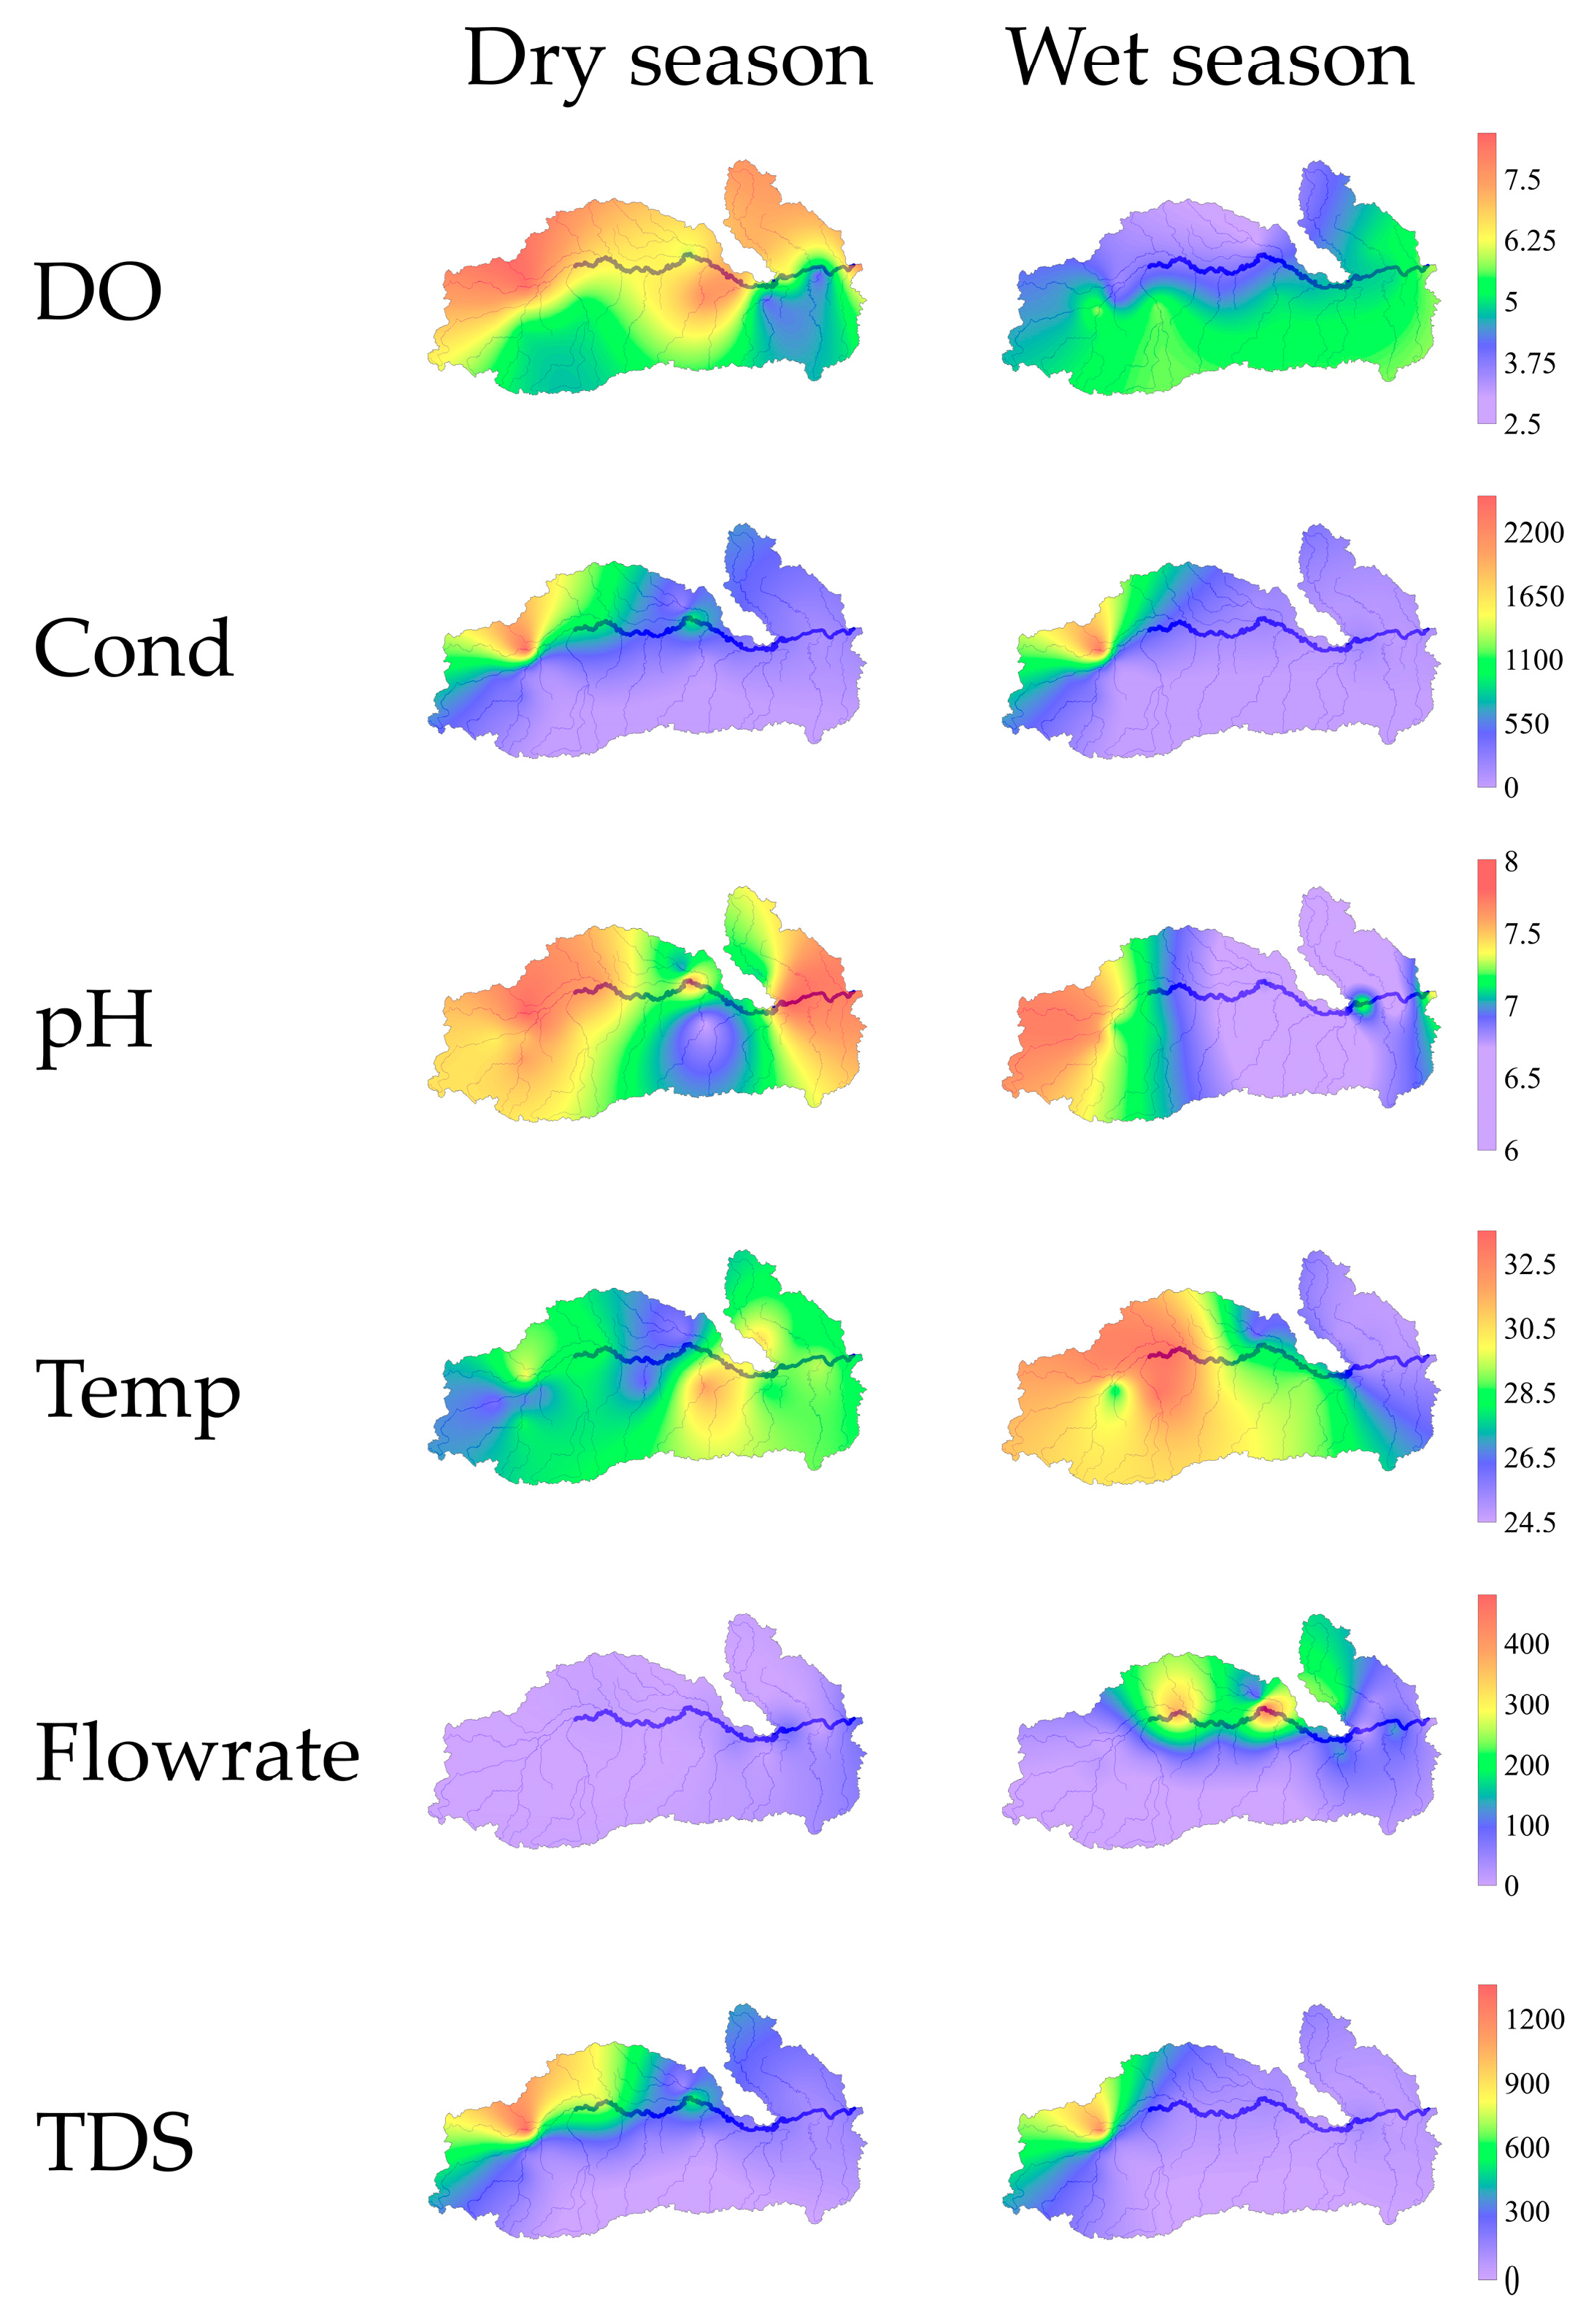
3.1. Physicochemical Parameters
3.2. Major Dissolved Species Chemistry
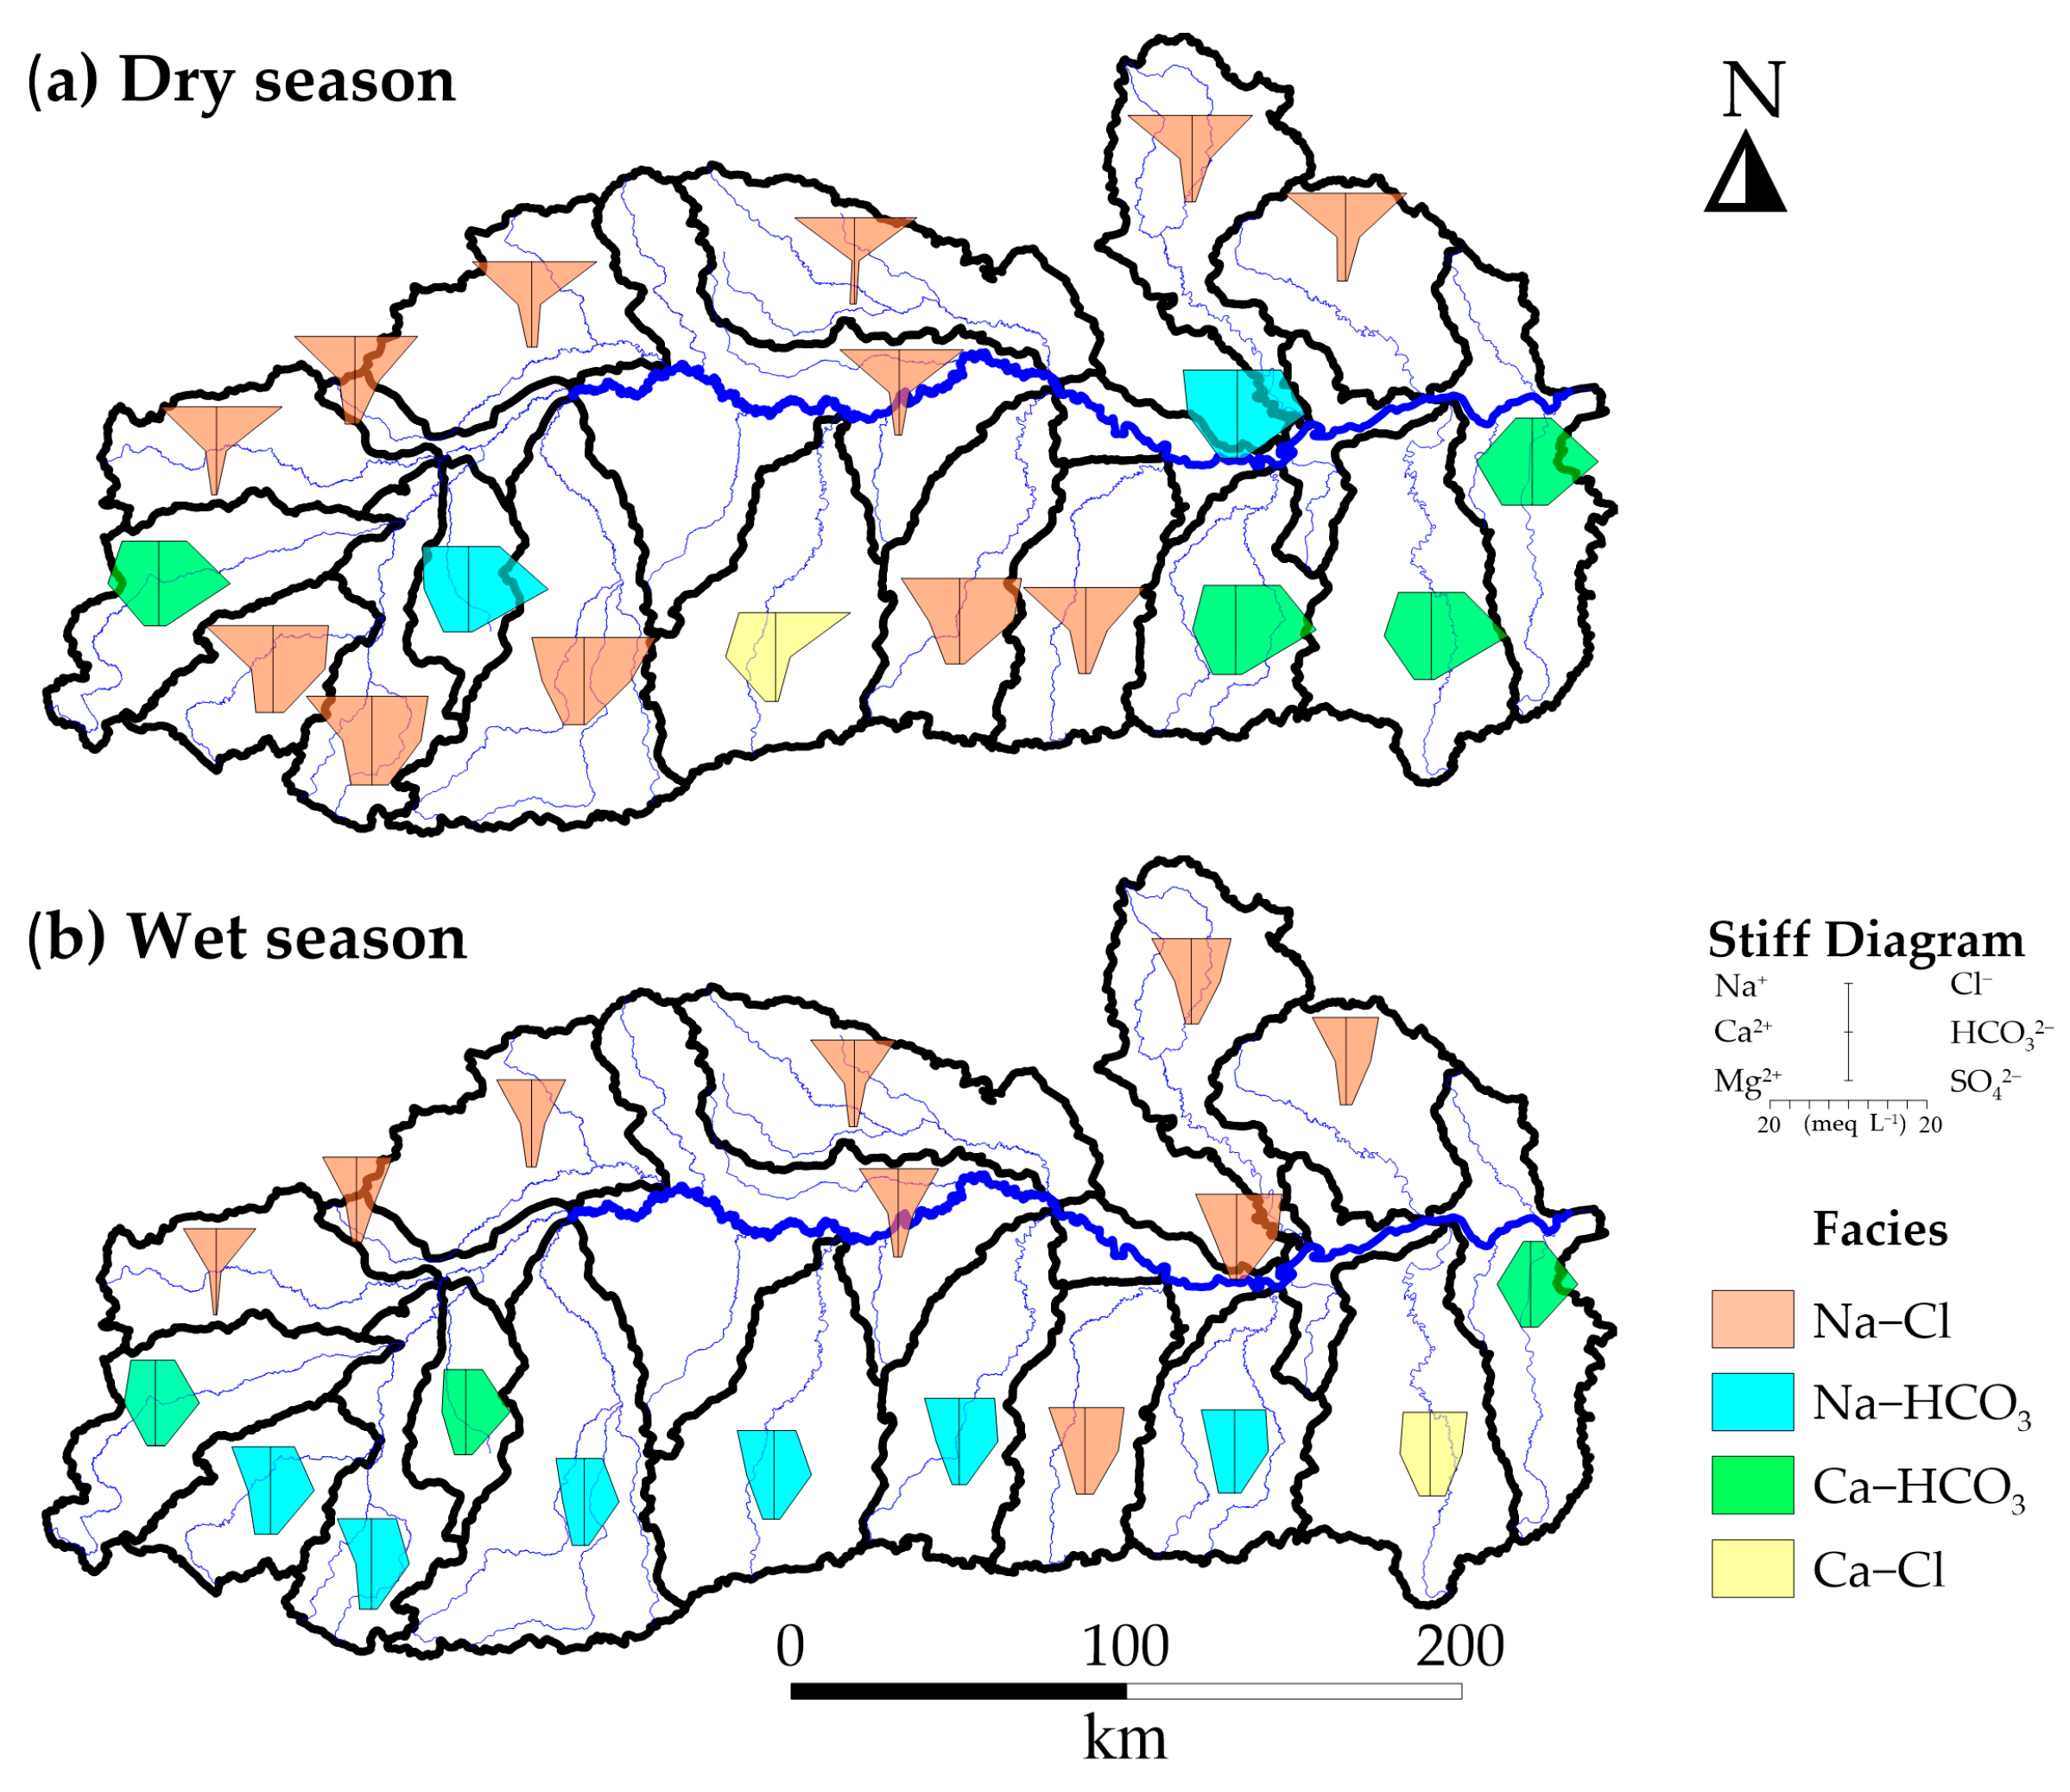
3.3. Hydrochemical Facies, Water Type Shifts, and Spatial Distribution
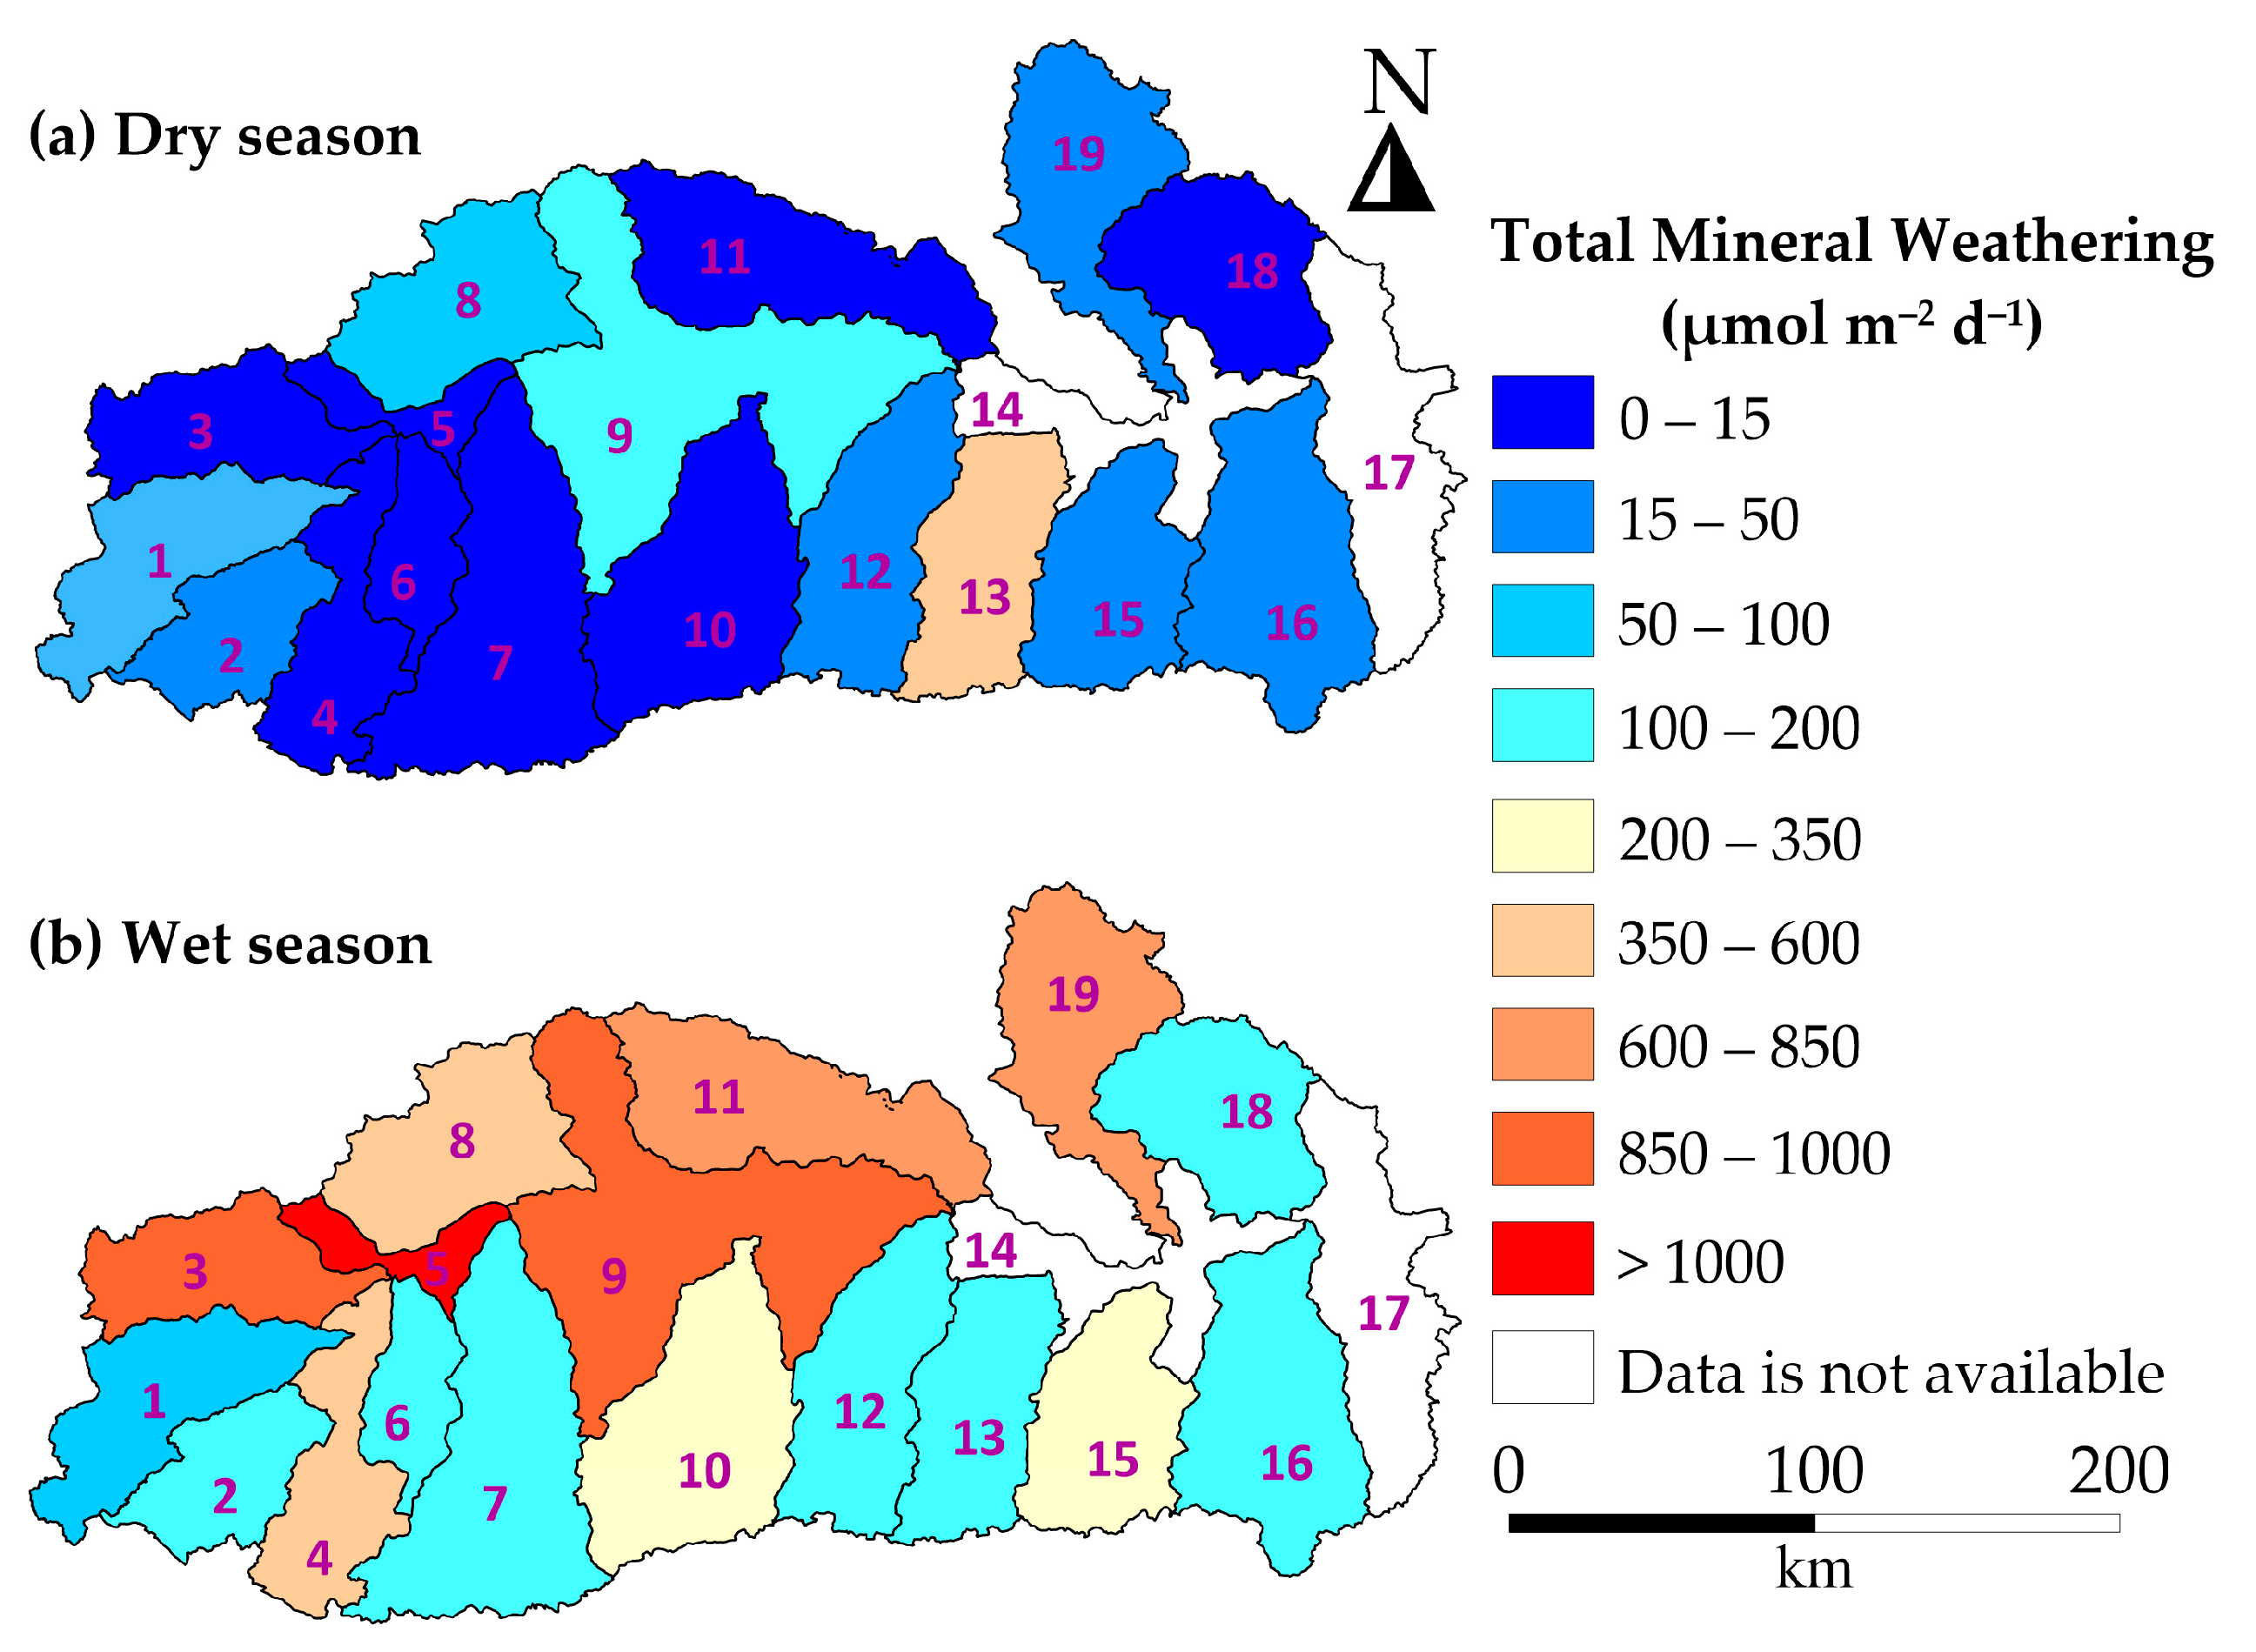
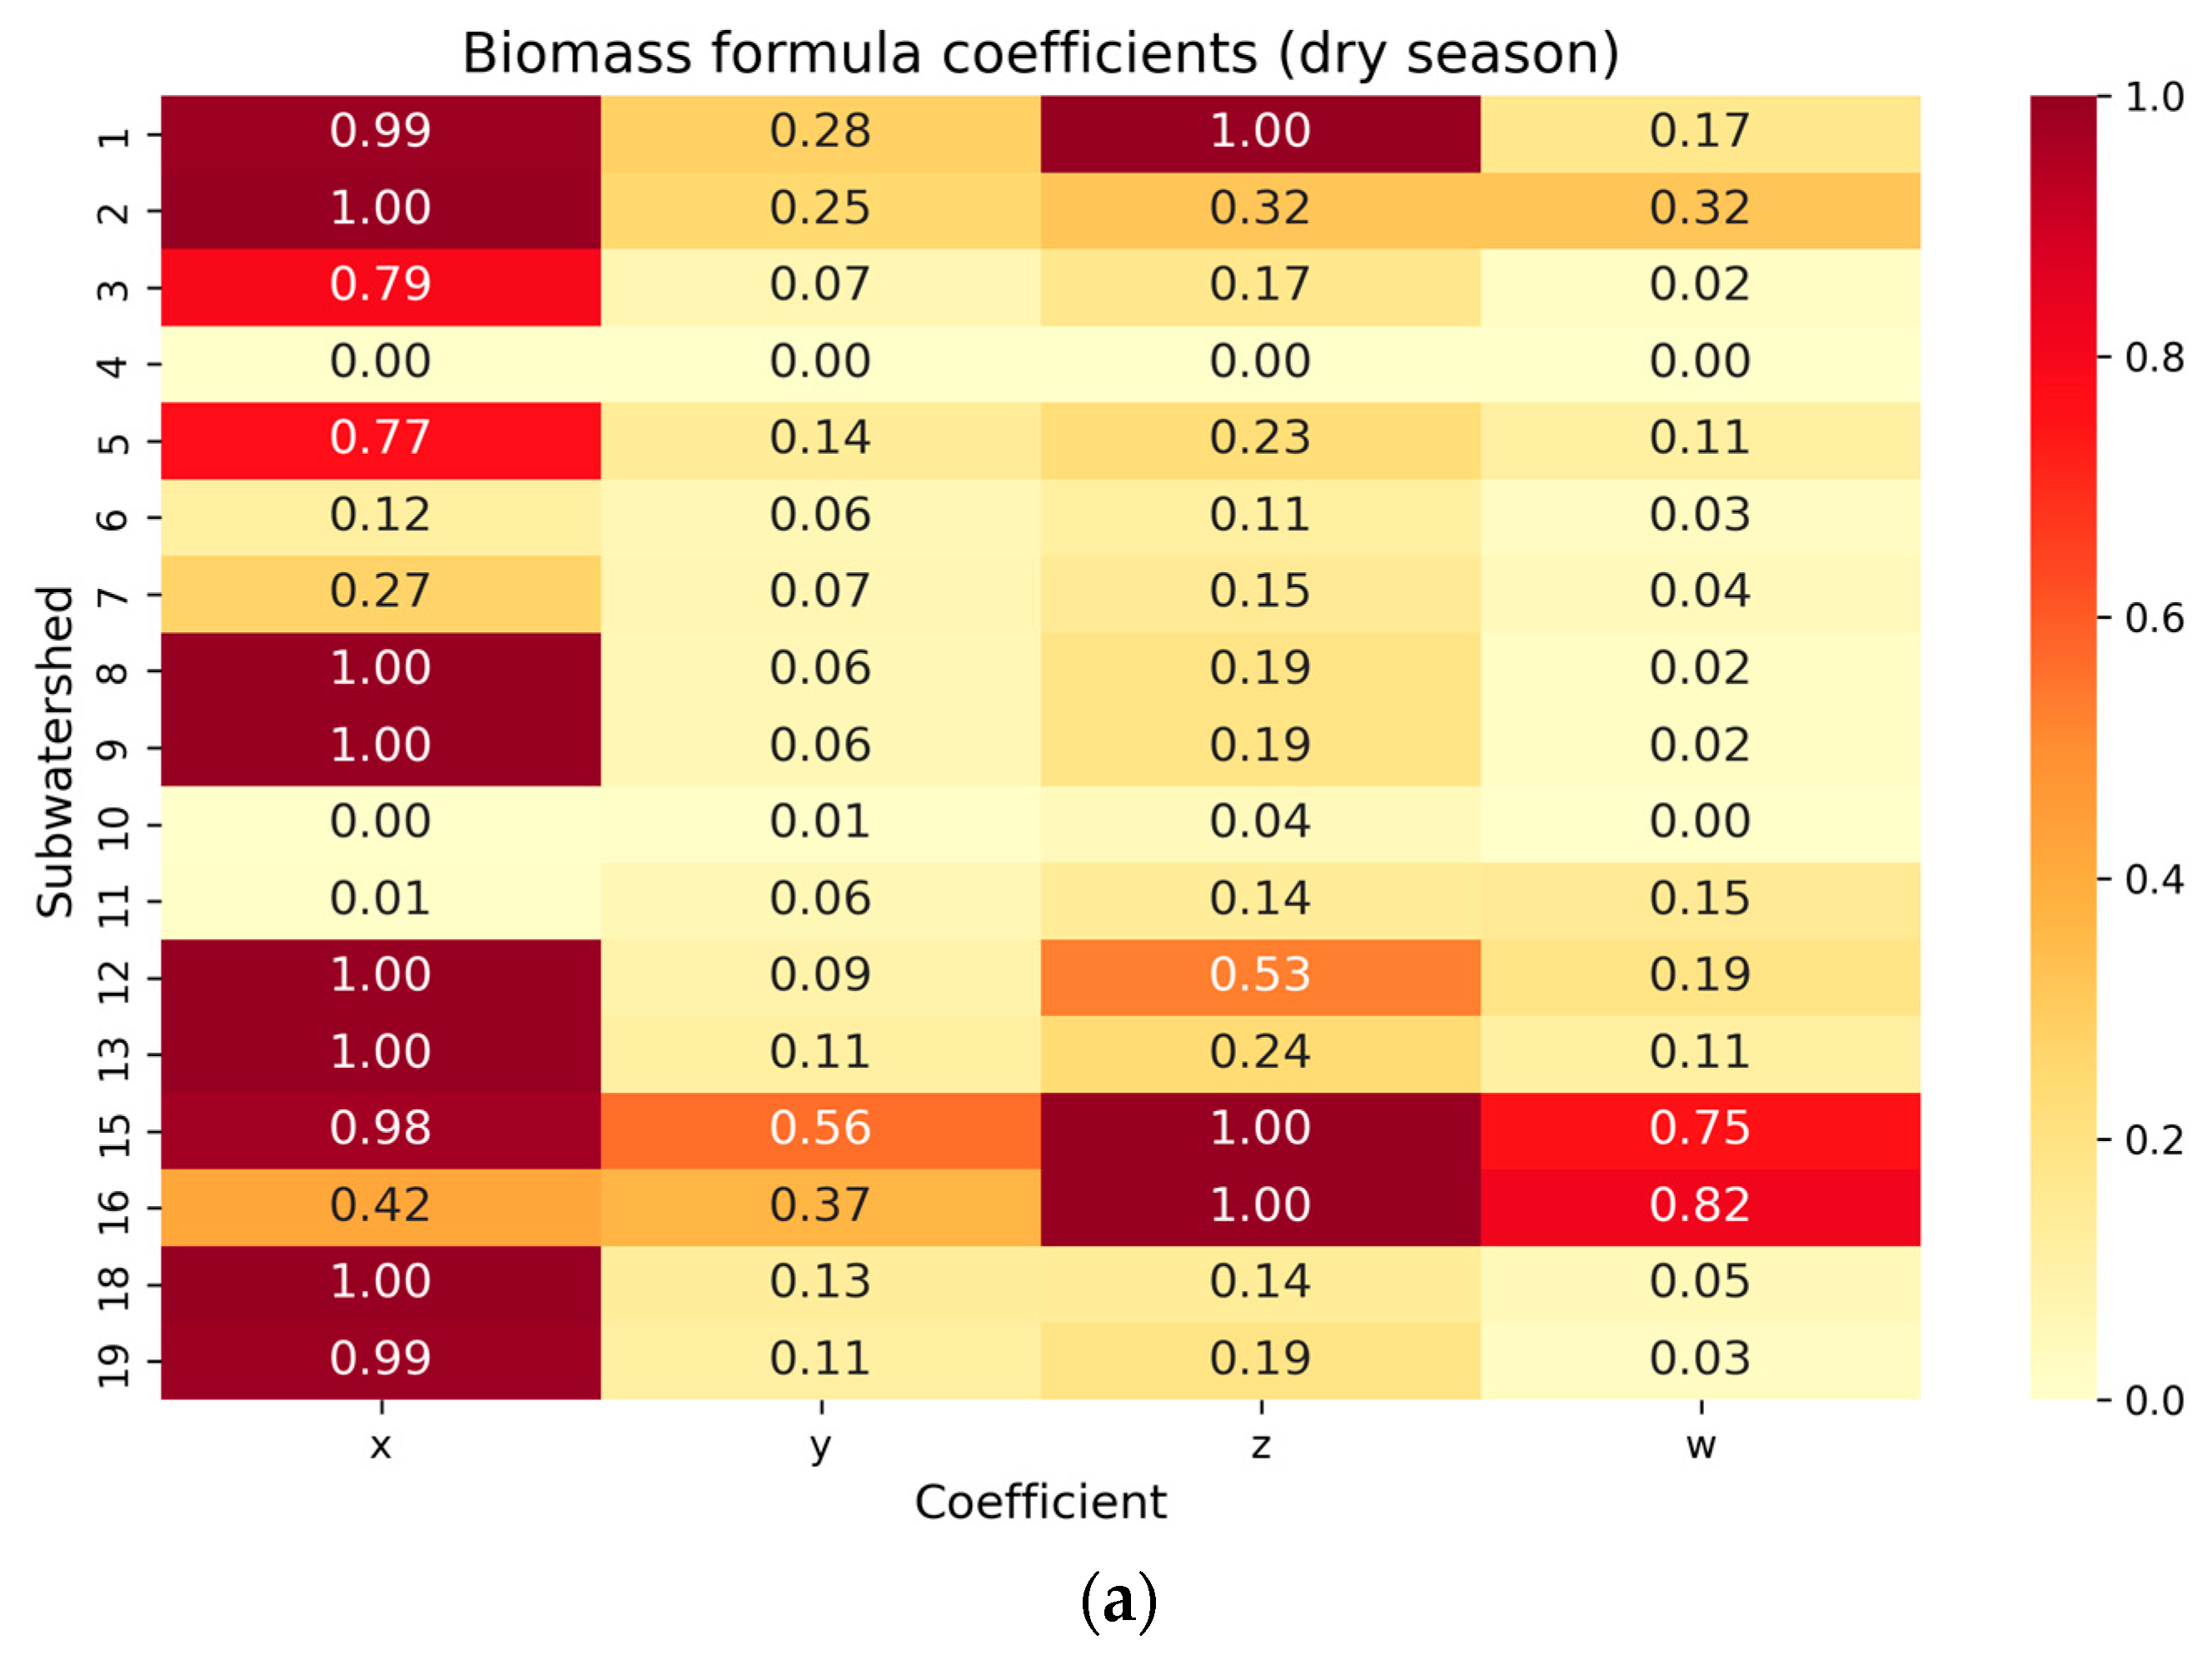
3.4. Mineral Weathering and Biomass Degradation
3.5. Geochemical Mass Balance Calculations
3.5.1. Results from GMB Analysis
3.5.2. Geochemical Mass Balance Outputs and Mineral-Specific Contributions
3.5.3. Seasonal Trends in Total Weathering and Biomass Degradation Rates
3.6. Spatial and Flux Data Visualizations
4. Discussion
4.1. Seasonal Biogeochemical Dynamics
4.2. Major Dissolved Species and Their Implications
4.3. Hydrochemical Facies and Spatial Patterns
4.4. Mineral Weathering and Biomass Degradation Processes
4.5. Geochemical Mass Balance Insights
4.6. Seasonal Variability in Weathering and Biomass Degradation
4.7. Seasonal and Spatial Influence on Weathering and Biomass Degradation
4.8. Spatial Patterns of Dissolved Species and Physicochemical Parameters
4.9. Dissolved Species Fluxes and Hydrological Influences
4.10. Interplay of Biomass Degradation and Mineral Weathering
5. Conclusions
Author Contributions
Funding
Data Availability Statement
Acknowledgments
Conflicts of Interest
References
- Bridhikitti, A.; Prabamroong, T.; Yu, G. Problem identification on surface water quality in the Mun River Basin, Thailand. Sustain. Water Resour. Manag. 2020, 6, 53. [Google Scholar] [CrossRef]
- Prabnakorn, S.; Maskey, S.; Suryadi, F.X.; de Fraiture, C. Assessment of drought hazard, exposure, vulnerability, and risk for rice cultivation in the Mun River Basin in Thailand. Nat. Hazards 2019, 97, 891–911. [Google Scholar] [CrossRef]
- Babel, M.S.; Chawrua, L.; Khadka, D.; Tingsanchali, T.; Shanmungam, M.S. Agricultural drought risk and local adaptation measures in the Upper Mun River Basin, Thailand. Agric. Water Manag. 2024, 292, 108655. [Google Scholar] [CrossRef]
- Wang, J.; Lu, X.X.; Kummu, M. Sediment load estimates and variations in the Lower Mekong River. River Res. Appl. 2011, 27, 33–46. [Google Scholar] [CrossRef]
- Khadka, D.; Babel, M.S.; Kamalamma, A.G. Assessing the impact of climate and land-use changes on the hydrologic cycle using the SWAT Model in the Mun River Basin in Northeast Thailand. Water 2023, 15, 3672. [Google Scholar] [CrossRef]
- Kosa, P.; Sukwimolseree, T. Effect of climate change on runoff in the Upper Mun River Basin, Thailand. Int. J. Environ. Ecol. Eng. 2014, 8, 423–427. [Google Scholar]
- Ziv, G.; Baran, E.; Nam, S.; Rodríguez-Iturbe, I.; Levin, S.A. Trading-off fish biodiversity, food security, and hydropower in the Mekong River Basin. Proc. Natl. Acad. Sci. USA 2012, 109, 5609–5614. [Google Scholar] [CrossRef]
- Hecht, J.S.; Lacombe, G.; Arias, M.E.; Dang, T.D.; Piman, T. Hydropower dams of the Mekong River basin: A review of their hydrological impacts. J. Hydrol. 2019, 568, 285–300. [Google Scholar] [CrossRef]
- Li, R.; Huang, H.; Yu, G.; Yu, H.; Bridhikitti, A.; Su, T. Trends of runoff variation and effects of main causal factors in Mun River, Thailand during 1980–2018. Water 2020, 12, 831. [Google Scholar] [CrossRef]
- Pingmuanglek, P.; Jakrawatana, N.; Gheewala, S.H. Freshwater use analysis of cassava for food feed fuel in the Mun River basin, Thailand. Int. J. Life Cycle Assess. 2017, 22, 1705–1717. [Google Scholar] [CrossRef]
- Prabnakorn, S.; Suryadi, F.X.; Chongwilaikasem, J.; De Fraiture, C. Development of an integrated flood hazard assessment model for a complex river system: A case study of the Mun River Basin, Thailand. Model. Earth Syst. Environ. 2019, 5, 1265–1281. [Google Scholar] [CrossRef]
- Prabnakorn, S.; Ruangpan, L.; Tangdamrongsub, N.; Suryadi, F.X.; de Fraiture, C. Improving flood and drought management in agricultural river basins: An application to the Mun River Basin in Thailand. Water Policy 2021, 23, 1153–1169. [Google Scholar] [CrossRef]
- Zhao, Z.; Liu, G.; Liu, Q.; Huang, C.; Li, H. Studies on the spatiotemporal variability of river water quality and its relationships with soil and precipitation: A case study of the Mun River Basin in Thailand. Int. J. Environ. Res. Public Health 2018, 15, 2466. [Google Scholar] [CrossRef]
- Khadka, D.; Babel, M.S.; Collins, M.; Shrestha, S.; Virdis, S.G.; Chen, A.S. Projected changes in the near-future mean climate and extreme climate events in northeast Thailand. Int. J. Climatol. 2021, 42, 2470–2492. [Google Scholar] [CrossRef]
- Liu, M.; Han, G.; Li, X. Using stable nitrogen isotope to indicate soil nitrogen dynamics under agricultural soil erosion in the Mun River basin, Northeast Thailand. Ecol. Ind. 2021, 128, 107814. [Google Scholar] [CrossRef]
- Artlert, K.; Chaleeraktrakoon, C. Modeling and analysis of rainfall processes in the context of climate change for Mekong, Chi, and Mun River Basins (Thailand). J. Hydro-Environ. Res. 2013, 7, 2–17. [Google Scholar] [CrossRef]
- Bridhikitti, A.; Ketuthong, A.; Prabamroong, T.; Renzhi, L.; Jing, L.; Gaohuan, L. Forecasting 100-year changes of streamflow in the Mun River Basin (NE Thailand) under the HAPPI experiment using the SWAT model. J. Water Clim. Chang. 2022, 13, 1706–1724. [Google Scholar] [CrossRef]
- Li, C.; Fang, H. Assessment of climate change impacts on the streamflow for the Mun River in the Mekong Basin, Southeast Asia: Using SWAT model. Catena 2021, 201, 105199. [Google Scholar] [CrossRef]
- Li, S.; Liu, C.; Li, J.; Lang, Y.; Ding, H.; Li, L. Geochemistry of dissolved inorganic carbon and carbonate weathering in a small typical karstic catchment of Southwest China: Isotopic and chemical constraints. Chem. Geol. 2010, 277, 301–309. [Google Scholar] [CrossRef]
- Oliva, P.; Viers, J.; Dupré, B. Chemical weathering in granitic environments. Chem. Geol. 2003, 202, 225–256. [Google Scholar] [CrossRef]
- West, A.J.; Galy, A.; Bickle, M. Tectonic and climatic controls on silicate weathering. Earth Planet Sci. Lett. 2005, 235, 211–228. [Google Scholar] [CrossRef]
- Millot, R.; Gaillardet, J.; Dupré, B.; Allègre, C.J. The global control of silicate weathering rates and the coupling with physical erosion: New insights from rivers of the Canadian Shield. Earth Planet Sci. Lett. 2002, 196, 83–98. [Google Scholar] [CrossRef]
- Moosdorf, N.; Hartmann, J.; Lauerwald, R.; Hagedorn, B.; Kempe, S. Atmospheric CO2 consumption by chemical weathering in North America. Geochim. Cosmochim. Acta 2011, 75, 7829–7854. [Google Scholar] [CrossRef]
- Zhao, Z.; Liu, K.; Yu, B.; Liu, G.; Wang, Y.; Wu, C. Modeling of agricultural nonpoint-source pollution quantitative assessment: A case study in the mun river basin, Thailand. Sustainability 2023, 15, 10325. [Google Scholar] [CrossRef]
- Zhao, Z.; Liu, G.; Liu, Q.; Huang, C.; Li, H.; Wu, C. Distribution characteristics and seasonal variation of soil nutrients in the Mun River Basin, Thailand. Int. J. Environ. Res. Public Health 2018, 15, 1818. [Google Scholar] [CrossRef] [PubMed]
- Sukwimolseree, T.; Kosa, P. The relationship between land use change and runoff. Int. J. Environ. Ecol. Eng. 2014, 8, 428–431. [Google Scholar]
- Tian, H.; Yu, G.; Tong, L.; Li, R.; Huang, H.Q.; Bridhikitti, A.; Prabamroong, T. Water quality of the Mun river in Thailand—Spatiotemporal variations and potential causes. Int. J. Environ. Res. Public Health 2019, 16, 3906. [Google Scholar] [CrossRef]
- Yadav, S.; Babel, M.S.; Shrestha, S.; Deb, P. Land use impact on the water quality of large tropical river: Mun River Basin, Thailand. Environ. Monit. Assess. 2019, 191, 614. [Google Scholar] [CrossRef]
- Han, G.; Yang, K.; Zeng, J.; Zhao, Y. Dissolved iron and isotopic geochemical characteristics in a typical tropical river across the floodplain: The potential environmental implication. Environ. Res. 2021, 200, 111452. [Google Scholar] [CrossRef]
- Han, G.; Liu, M.; Li, X.; Zhang, Q. Sources and geochemical behaviors of rare earth elements in suspended particulate matter in a wet-dry tropical river. Environ. Res. 2023, 218, 115044. [Google Scholar] [CrossRef]
- Floch, P.; Molle, F.; Loiskandl, W. Marshalling Water Resources: A Chronology of Irrigation Development in the Chi-Mun River Basin, Northeast Thailand; CGIAR Challenge Program on Water and Food: Colombo, Sri Lanka, 2007. [Google Scholar]
- PCD. Development of an Action Plan to Improve the Water Quality in the Northeastern Basin, Thailand; Mun Basin Data; Annex I: Part 3, 10(C.3); Pollution Control Department: Bangkok, Thailand, 1995. [Google Scholar]
- Liu, J.; Han, G.; Liu, X.; Liu, M.; Song, C.; Zhang, Q.; Yang, K.; Li, X. Impacts of anthropogenic changes on the Mun River water: Insight from spatio-distributions and relationship of C and N species in Northeast Thailand. Int. J. Environ. Res. Public Health 2019, 16, 659. [Google Scholar] [CrossRef] [PubMed]
- Binnie and Partners. Mun River Basin Water Resources Development Master Plan; Technical Report; Royal Irrigation Department: Bangkok, Thailand, 1995. [Google Scholar]
- Harriman, R.; Morrison, B.; Caines, L.A.; Collen, P.; Watt, A.W. Long-term changes in fish populations of acid streams and lochs in Galloway south west Scotland. Water Air Soil Pollut. 1987, 32, 89–112. [Google Scholar] [CrossRef]
- Reynolds, B.; Stevens, P.A.; Hughes, S.; Parkinson, J.A.; Weatherley, N.S. Stream chemistry impacts of conifer harvesting in Welsh catchments. Water Air Soil Pollut. 1995, 79, 147–170. [Google Scholar] [CrossRef]
- Li, H.; Fu, D.; Huang, C.; Su, F.; Liu, Q.; Liu, G.; Wu, S. An approach to high-resolution rice paddy mapping using time-series Sentinel-1 SAR data in the Mun River Basin, Thailand. Remote Sens. 2020, 12, 3959. [Google Scholar] [CrossRef]
- Park, S.; Im, J.; Park, S.; Yoo, C.; Han, H.; Rhee, J. Classification and mapping of paddy rice by combining Landsat and SAR time series data. Remote Sens. 2018, 10, 447. [Google Scholar] [CrossRef]
- Phalke, A.R.; Özdoğan, M. Large area cropland extent mapping with Landsat data and a generalized classifier. Remote Sens. Environ. 2018, 219, 180–195. [Google Scholar] [CrossRef]
- Velbel, M.A.; Price, J.R. Solute geochemical mass-balances and mineral weathering rates in small watersheds: Methodology, recent advances, and future directions. Appl. Geochem. 2007, 22, 1682–1700. [Google Scholar] [CrossRef]
- Zhang, S.; Han, G.; Zeng, J.; Xiao, X.; Malem, F. A strontium and hydro-geochemical perspective on human impacted tributary of the Mekong River Basin: Sources identification, fluxes, and CO2 consumption. Water 2021, 13, 3137. [Google Scholar] [CrossRef]
- Penny, J.; Alves, P.B.; De-Silva, Y.; Chen, A.S.; Djordjević, S.; Shrestha, S.; Babel, M. Analysis of potential nature-based solutions for the Mun River Basin, Thailand. Water Sci. Technol. 2023, 87, 1496–1514. [Google Scholar] [CrossRef]
- Toda, O.; Tanji, H.; Somura, H.; Higuchi, K.; Yoshida, K. Evaluation of tributaries contribution in the Mekong River Basin during rainy and dry season. In Proceedings of the 2nd Asia Pacific Association of Hydrology and Water Resources Conference, Singapore, 5–8 July 2004; pp. 239–248. [Google Scholar] [CrossRef]
- Prabnakorn, S.; Maskey, S.; Suryadi, F.X.; de Fraiture, C. Rice yield in response to climate trends and drought index in the Mun River Basin, Thailand. Sci. Total Environ. 2018, 621, 108–119. [Google Scholar] [CrossRef]
- Akter, A.; Babel, M.S. Hydrological modeling of the Mun River basin in Thailand. J. Hydrol. 2012, 452, 232–246. [Google Scholar] [CrossRef]
- Li, X.; Han, G.; Liu, M.; Song, C.; Zhang, Q.; Yang, K.; Liu, J. Hydrochemistry and dissolved inorganic carbon (DIC) cycling in a tropical agricultural river, Mun River Basin, Northeast Thailand. Int. J. Environ. Res. Public Health 2019, 16, 3410. [Google Scholar] [CrossRef] [PubMed]
- Akter, A.; Babel, M.S. Water quality of Mun river, Thailand. In Proceedings of the International Conference on Environmental Science and Technology, Rhodes, Greece, 1–3 September 2005; pp. 44–49. [Google Scholar]
- Wongsomsak, S. Salinization in northeast Thailand. Jpn. J. Southeast Asian Stud. 1986, 24, 133–153. [Google Scholar] [CrossRef]
- Chomcheawchan, P.; Pawana, V.; Julphunthong, P.; Kamdee, K.; Laonamsai, J. Innovative Assessment of Mun River Flow Components through ANN and Isotopic End-Member Mixing Analysis. Geosciences 2024, 14, 150. [Google Scholar] [CrossRef]
- Plummer, N.; Back, W. The mass balance approach: Application to interpreting the chemical evolution of hydrologic systems. Am. J. Sci. 1980, 280, 130–142. [Google Scholar] [CrossRef]
- Taylor, A.B.; Velbel, M.A. Geochemical mass balances and weathering rates in forested watersheds of the southern Blue Ridge II. Effects of botanical uptake terms. Geoderma 1991, 51, 29–50. [Google Scholar] [CrossRef]
- World Health Organization Guidelines for drinking-water quality. WHO Chron. 2011, 38, 104–108.
- Doherty, J. PEST model-independent parameter estimation user manual. Watermark Numer. Comput. 2004, 3338, 3349. [Google Scholar]
- Liang, B.; Han, G.; Liu, M.; Li, X.; Song, C.; Zhang, Q.; Yang, K. Spatial and temporal variation of dissolved heavy metals in the Mun River, Northeast Thailand. Water 2019, 11, 380. [Google Scholar] [CrossRef]
- Bridhikitti, A.; Prabamroong, T.; Liu, G.; Yu, G. Best management practices for mitigating agricultural nutrient pollution in the Mun River Basin, Thailand. Soil Water Res. 2021, 16, 121–128. [Google Scholar] [CrossRef]
- Liu, J.; Han, G. Tracing riverine sulfate source in an agricultural watershed: Constraints from stable isotopes. Environ. Pollut. 2021, 288, 117740. [Google Scholar] [CrossRef] [PubMed]
- Li, X.; Han, G.; Liu, M. Seasonal and Spatial Variations of δ13CDIC Values in the Mun River, Northeast Thailand. Water 2022, 14, 1340. [Google Scholar] [CrossRef]
- Ma, S.; Han, G.; Yang, Y.; Li, X. Agricultural activity on the Mun River basin: Insight from spatial distribution and sources of dissolved rare earth elements in northeast Thailand. Environ. Sci. Pollut. Res. 2023, 30, 106736–106749. [Google Scholar] [CrossRef]
- Correll, D.L.; Jordan, T.E.; Weller, D.E. Transport of nitrogen and phosphorus from Rhode River watersheds during storm events. Water Resour. Res. 1999, 35, 2513–2521. [Google Scholar] [CrossRef]
- Beaulac, M.N.; Reckhow, K.H. An examination of land use-nutrient export relationships 1. JAWRA J. Am. Water Resour. Assoc. 1982, 18, 1013–1024. [Google Scholar] [CrossRef]
- Vanni, M.J.; Renwick, W.H.; Headworth, J.L.; Auch, J.D.; Schaus, M.H. Dissolved and particulate nutrient flux from three adjacent agricultural watersheds: A five-year study. Biogeochemistry 2001, 54, 85–114. [Google Scholar] [CrossRef]
- Williams, R.J.; Brooke, D.N.; Matthiessen, P.; Mills, M.; Turnbull, A.; Harrison, R.M. Pesticide transport to surface waters within an agricultural catchment. Water Environ. J. 1995, 9, 72–81. [Google Scholar] [CrossRef]
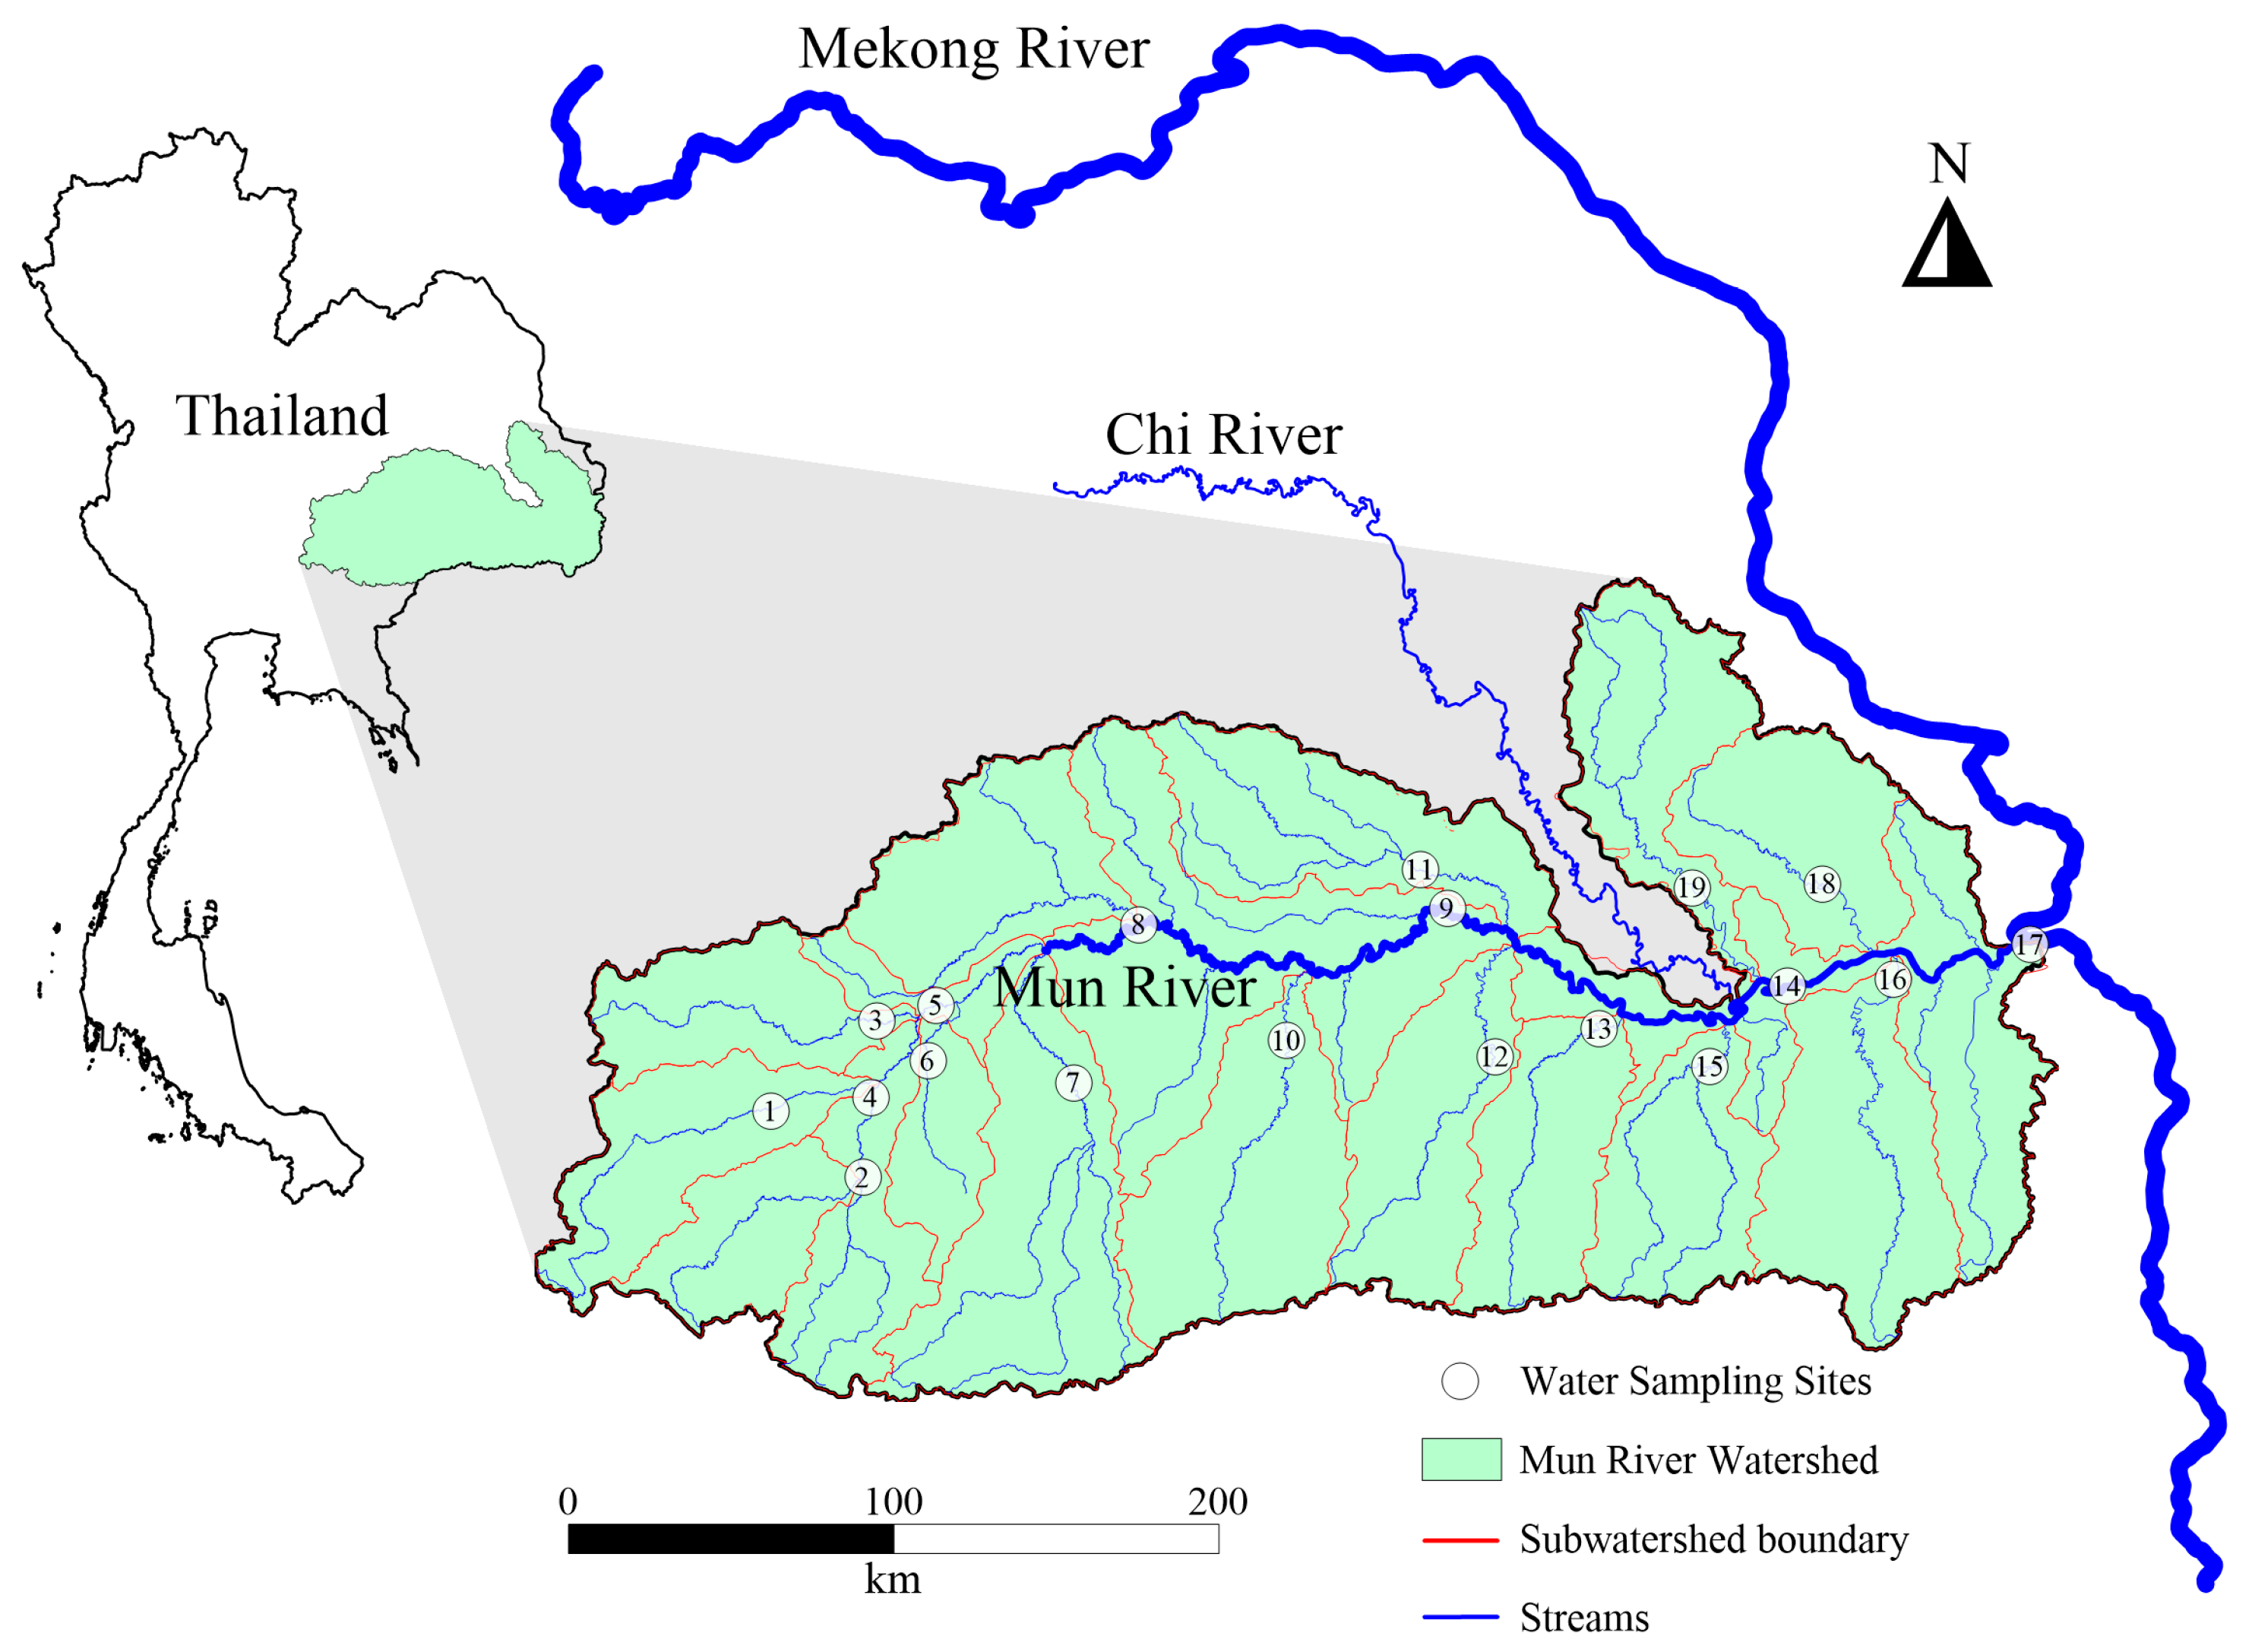
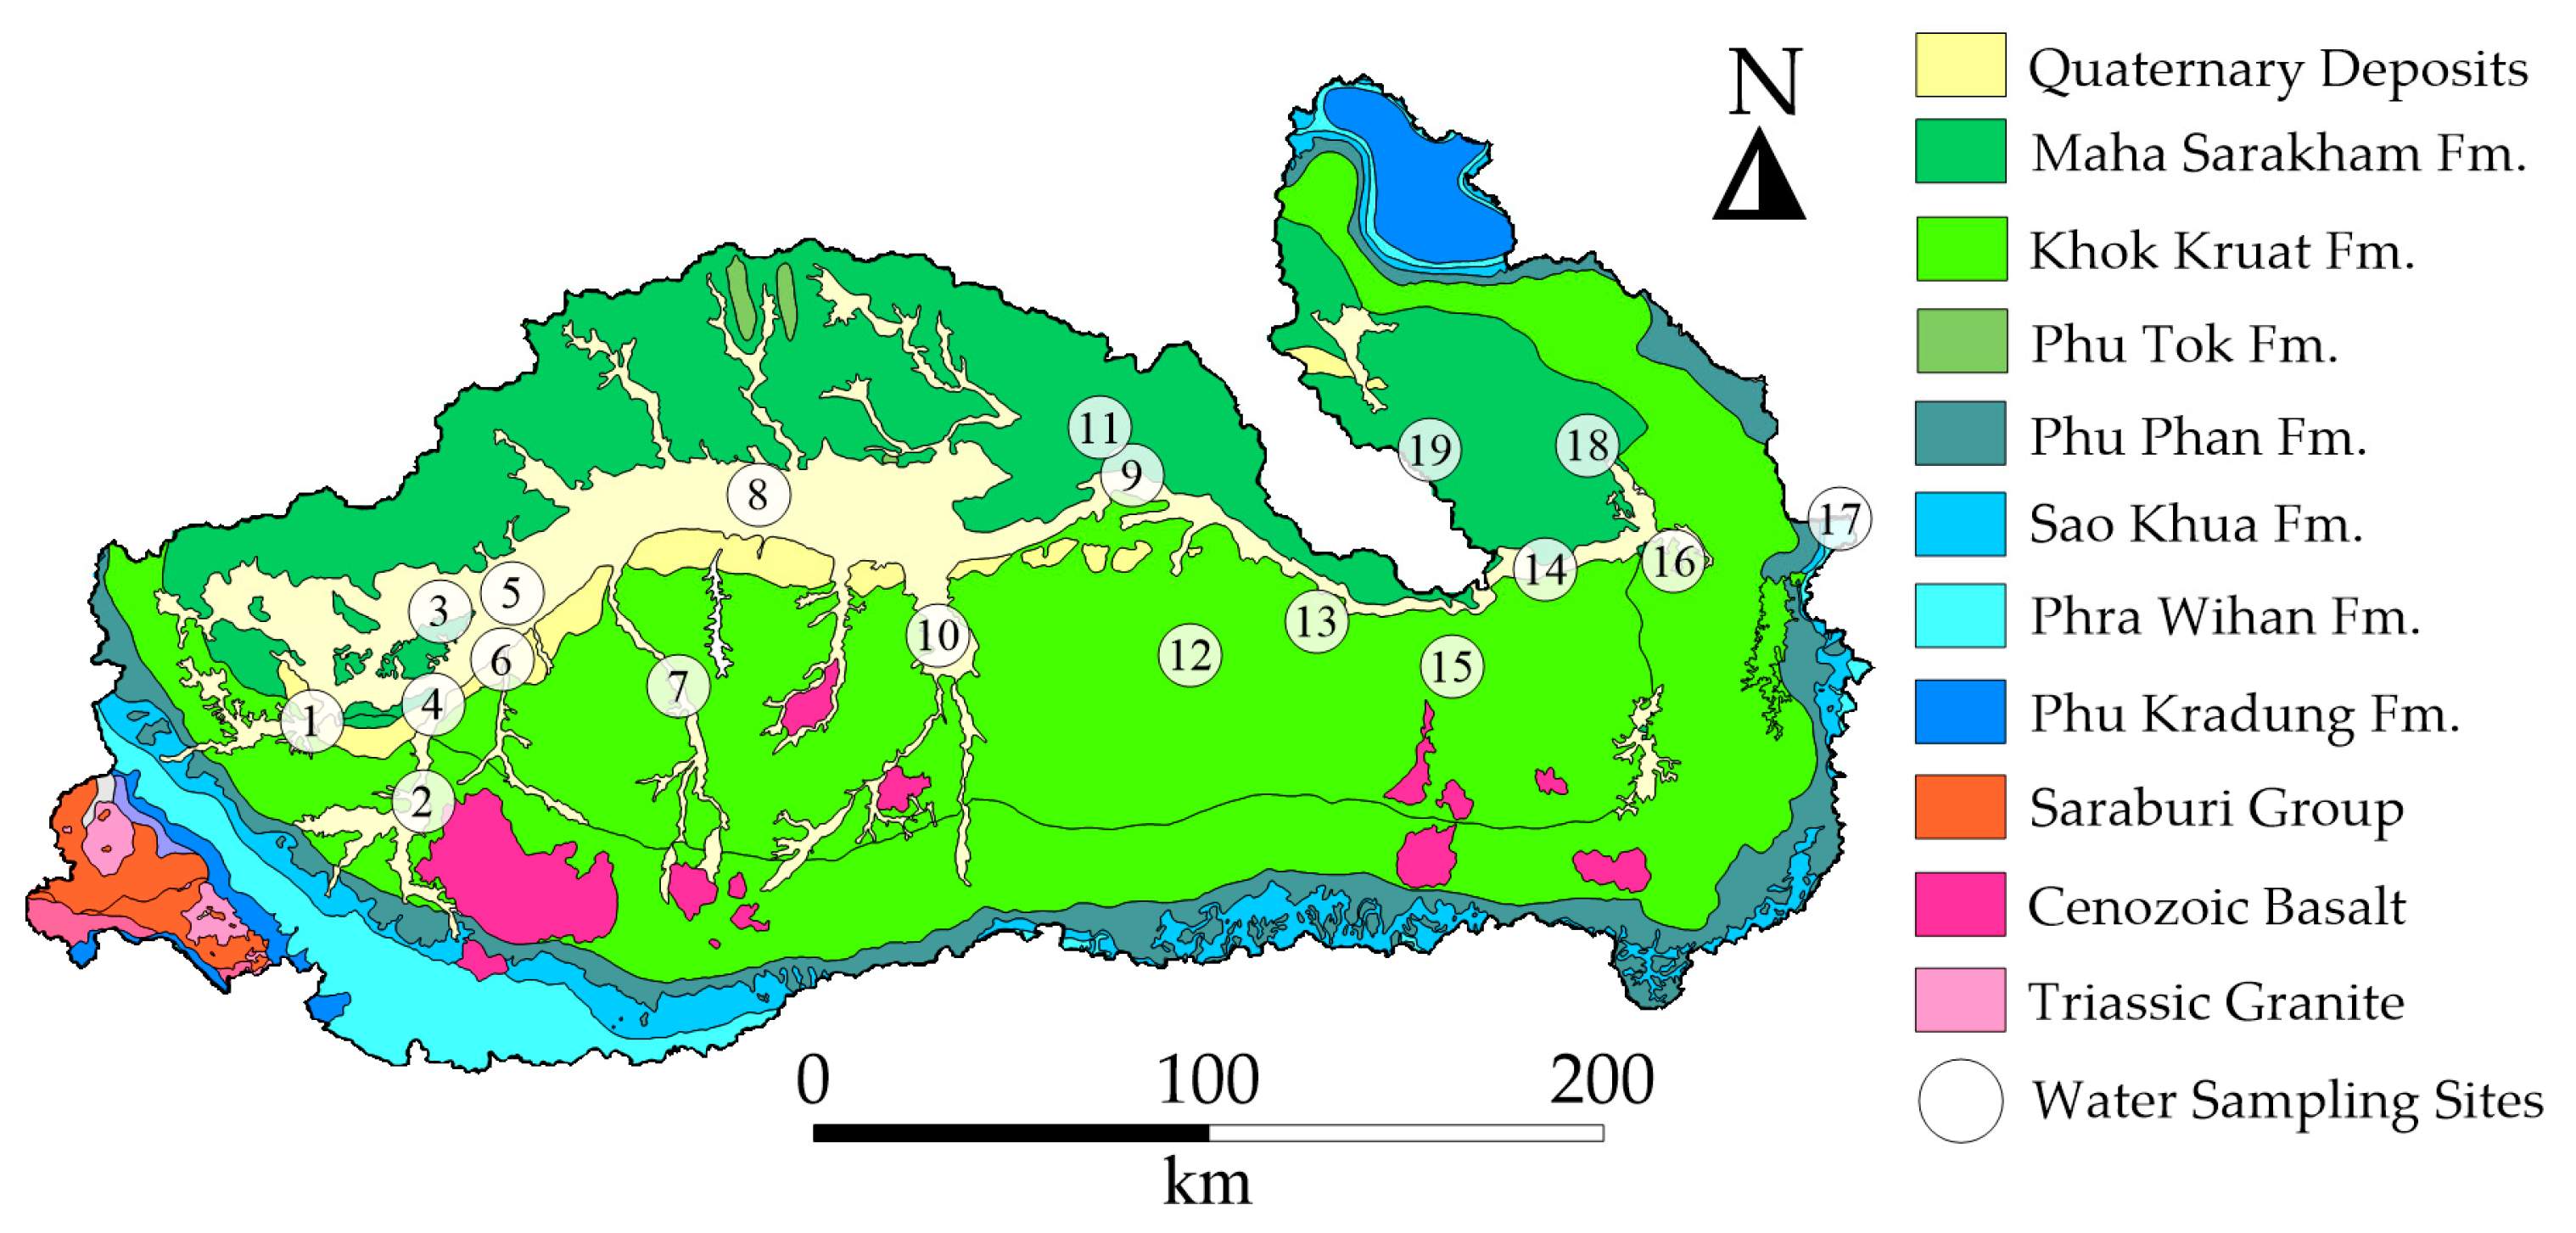




| Subwatershed | UTM-E | UTM-N | Zone | Surrounding Environment |
|---|---|---|---|---|
| 1 | 817584 | 1652994 | 47 | Agricultural (rice fields), sandstone geology |
| 2 | 199802 | 1631988 | 48 | Agricultural (cassava), sandstone geology |
| 3 | 205436 | 1680176 | 48 | Intensive agriculture, evaporite-rich Maha Sarakham Formation |
| 4 | 202911 | 1656643 | 48 | Agricultural (rice), siltstone geology |
| 5 | 223737 | 1684280 | 48 | Mixed agriculture/urban, basalt formations |
| 6 | 220760 | 1667281 | 48 | Agricultural (rice), sandstone geology |
| 7 | 265275 | 1659400 | 48 | Agricultural (cassava), sedimentary formations |
| 8 | 286745 | 1707469 | 48 | Mixed agriculture/forest, basalt geology |
| 9 | 381400 | 1709662 | 48 | Intensive agriculture, evaporite-rich formations |
| 10 | 331063 | 1670577 | 48 | Agricultural (rice), siltstone geology |
| 11 | 373466 | 1721910 | 48 | Urban influence, sedimentary geology |
| 12 | 394768 | 1663902 | 48 | Agricultural (cassava), sandstone geology |
| 13 | 426793 | 1671492 | 48 | Agricultural (rice), evaporite-rich formations |
| 14 | 484804 | 1683050 | 48 | Forested, basalt geology |
| 15 | 460599 | 1659065 | 48 | Agricultural (rice), sedimentary geology |
| 16 | 517251 | 1684212 | 48 | Mixed agriculture/urban, basalt formations |
| 17 | 559367 | 1693668 | 48 | Forested, sandstone geology |
| 18 | 496344 | 1714089 | 48 | Agricultural (cassava), siltstone geology |
| 19 | 456597 | 1714007 | 48 | Intensive agriculture, evaporite-rich formations |
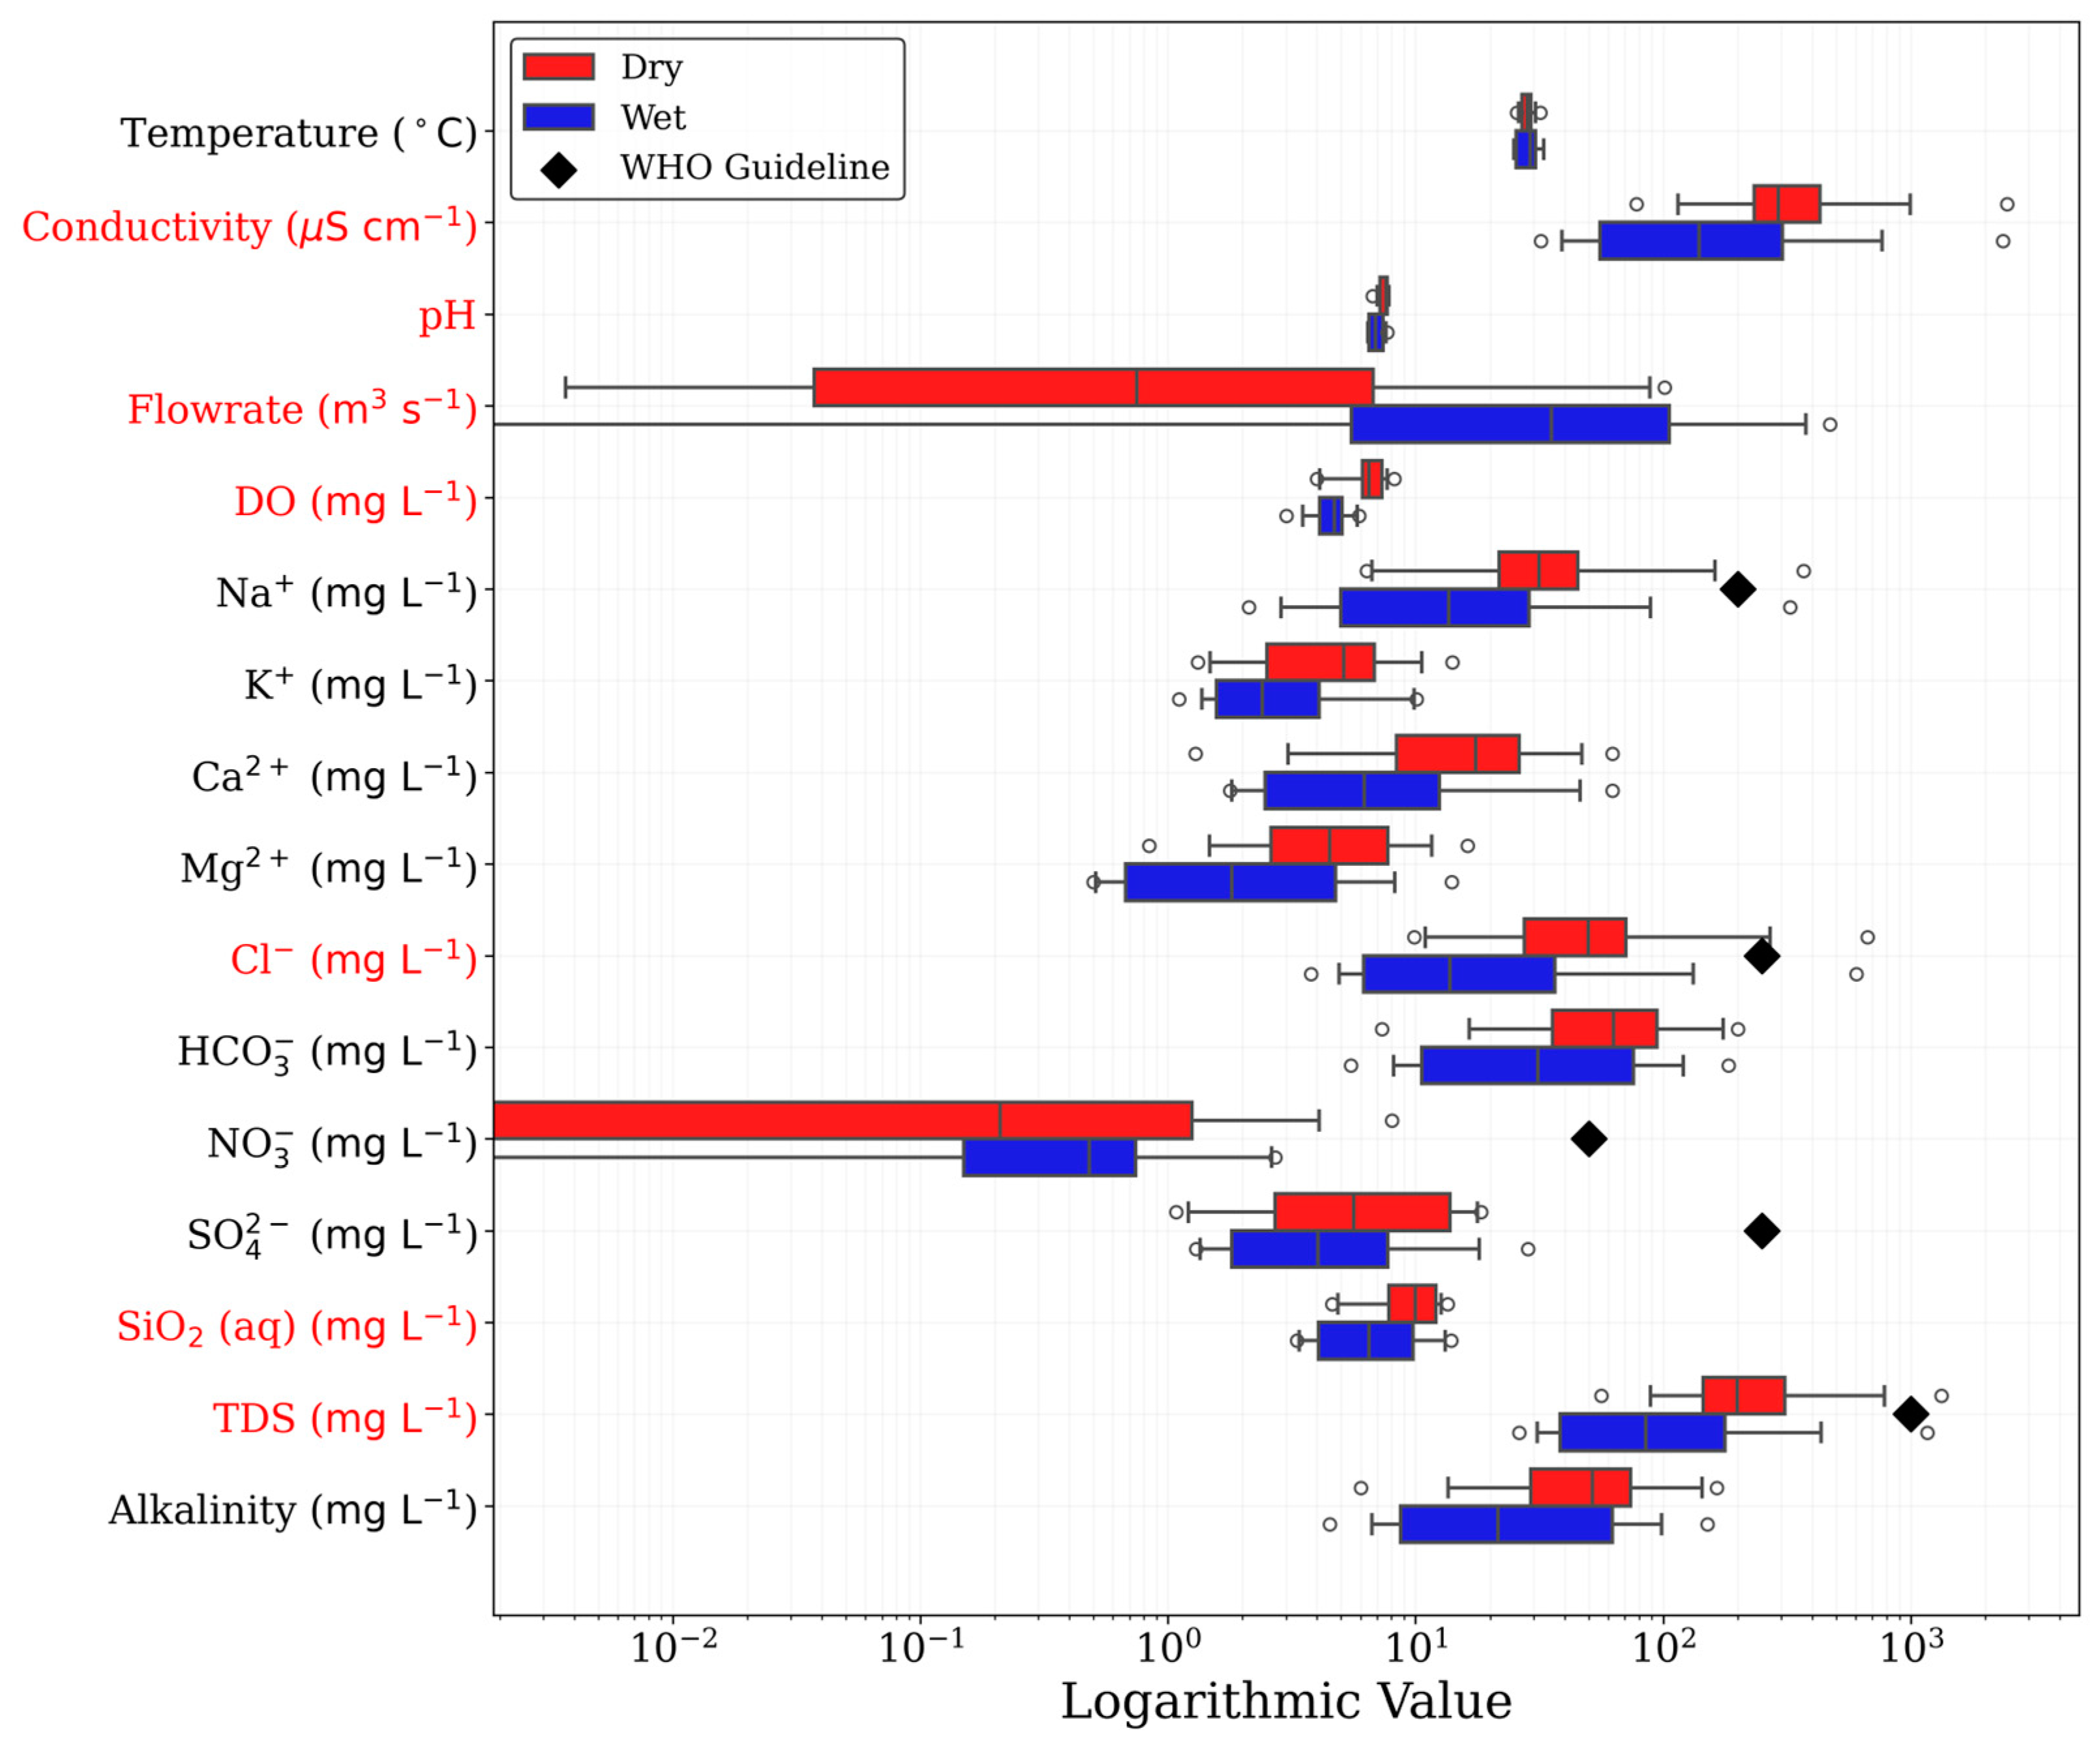
| Parameter | Season | Min | Max | Mean | Median | SD 1 | p-Value |
|---|---|---|---|---|---|---|---|
| T (°C) | Dry | 25.60 | 31.80 | 28.23 | 28.30 | 1.62 | 0.538 |
| Wet | 25.00 | 33.00 | 28.63 | 29.00 | 2.78 | ||
| pH | Dry | 6.70 | 7.80 | 7.44 | 7.60 | 0.31 | 0.027 |
| Wet | 6.40 | 7.70 | 6.97 | 6.90 | 0.45 | ||
| Cond (µS cm−1) | Dry | 78.00 | 2449.00 | 490.53 | 291.00 | 536.26 | 0.027 |
| Wet | 32.00 | 2357.00 | 313.26 | 140.00 | 517.71 | ||
| TDS (mg L−1) | Dry | 56.34 | 1332.07 | 312.44 | 198.67 | 304.77 | 0.009 |
| Wet | 26.19 | 1166.50 | 179.33 | 84.85 | 258.19 | ||
| Alkalinity (mg L−1 CaCO3) | Dry | 6.00 | 164.36 | 60.34 | 51.79 | 43.13 | 0.153 |
| Wet | 4.50 | 150.94 | 39.51 | 21.48 | 39.54 | ||
| DO (mg L−1) | Dry | 4.00 | 8.20 | 6.40 | 6.50 | 1.13 | <0.001 |
| Wet | 3.00 | 5.90 | 4.63 | 4.70 | 0.76 | ||
| Flow rate (m3 s−1) | Dry | 0.00 | 101.42 | 14.27 | 0.75 | 29.65 | <0.001 |
| Wet | 1.60 | 471.70 | 100.99 | 44.60 | 132.64 | ||
| (mg L−1) | Dry | 6.35 | 369.60 | 62.87 | 31.58 | 85.32 | 0.068 |
| Wet | 2.12 | 326.23 | 35.87 | 13.65 | 71.55 | ||
| (mg L−1) | Dry | 1.32 | 14.05 | 5.21 | 5.12 | 3.29 | 0.153 |
| Wet | 1.11 | 10.10 | 3.62 | 2.41 | 2.98 | ||
| (mg L−1) | Dry | 1.29 | 62.50 | 19.24 | 17.48 | 15.18 | 0.153 |
| Wet | 1.78 | 62.40 | 12.60 | 6.20 | 15.87 | ||
| (mg L−1) | Dry | 0.84 | 16.18 | 5.43 | 4.49 | 3.80 | 0.068 |
| Wet | 0.50 | 13.99 | 3.24 | 1.81 | 3.54 | ||
| (mg L−1) | Dry | 4.59 | 13.47 | 9.65 | 9.98 | 2.65 | 0.009 |
| Wet | 3.32 | 13.94 | 7.41 | 6.50 | 3.57 | ||
| (mg L−1) | Dry | 9.87 | 668.55 | 104.72 | 49.86 | 152.79 | 0.027 |
| Wet | 3.77 | 603.01 | 57.11 | 13.75 | 132.29 | ||
| (mg L−1) | Dry | 7.32 | 200.39 | 74.05 | 63.14 | 52.73 | 0.306 |
| Wet | 5.49 | 184.03 | 48.65 | 31.14 | 48.02 | ||
| (mg L−1) | Dry | 1.08 | 18.34 | 8.06 | 5.64 | 6.14 | 0.538 |
| Wet | 1.30 | 28.36 | 6.39 | 4.03 | 6.73 | ||
| (mg L−1) | Dry | 0.21 | 8.01 | 1.98 | 1.06 | 2.24 | 0.395 |
| Wet | 0.30 | 2.71 | 1.07 | 0.62 | 0.90 |
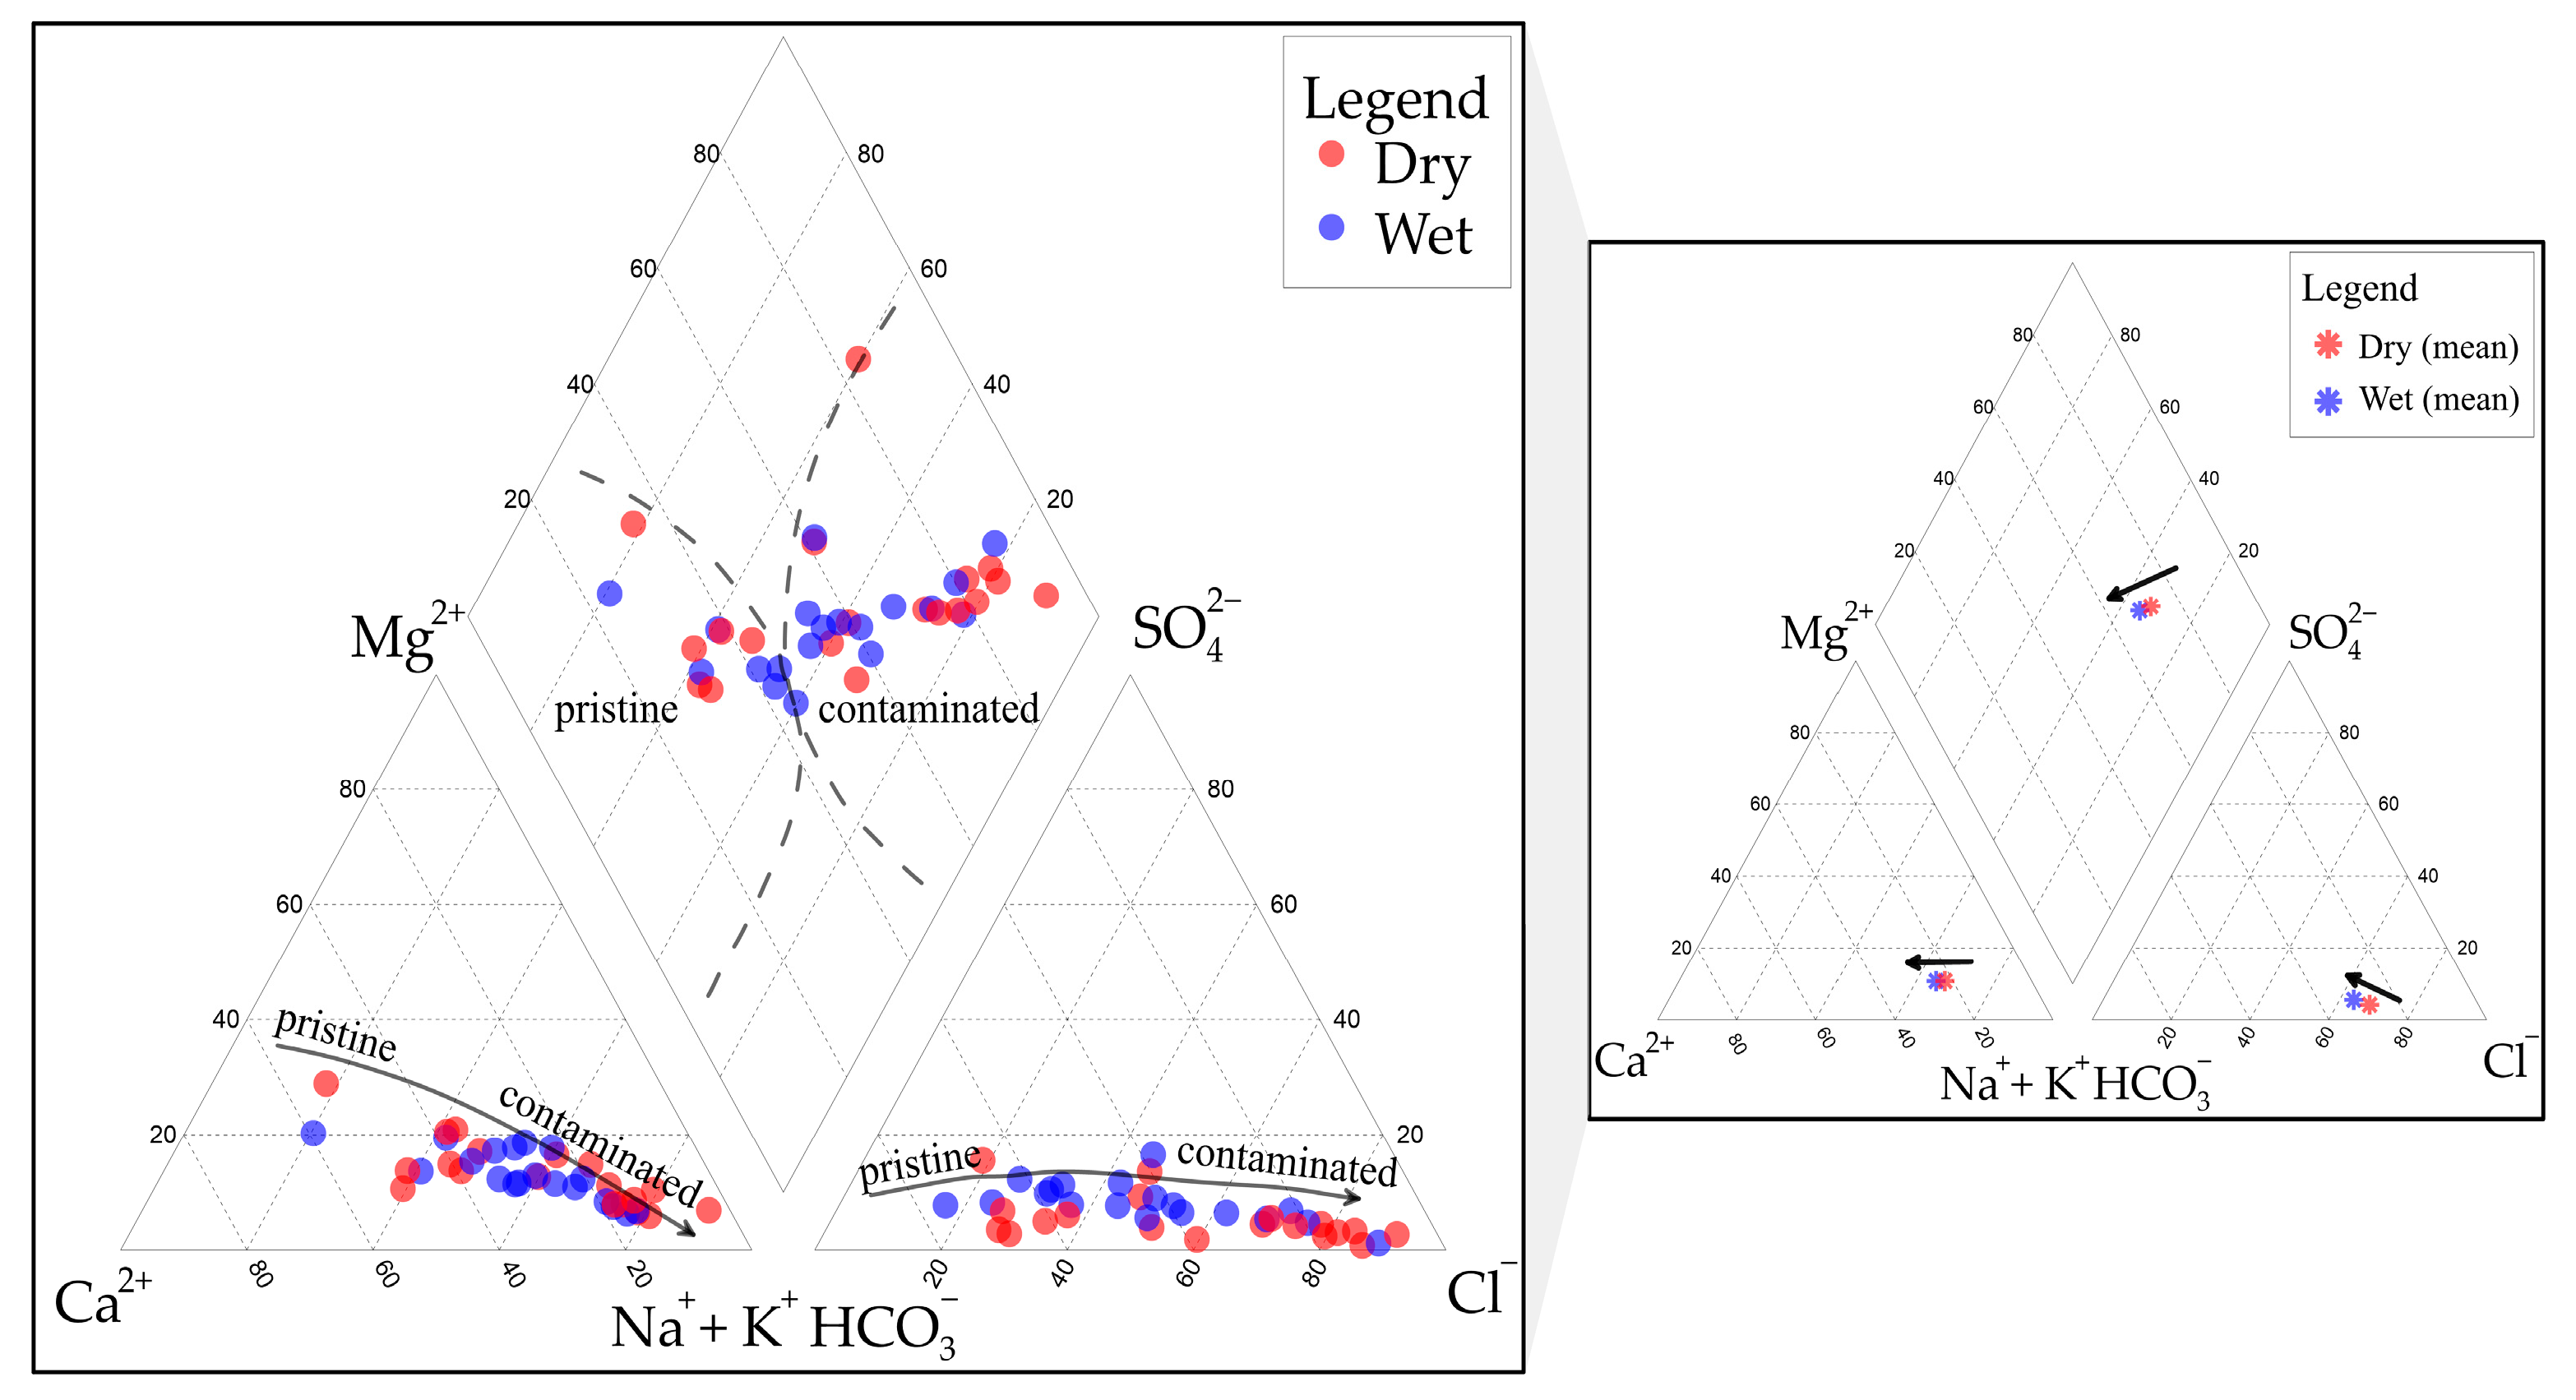
| Subwatershed | Δ% | Facies | ||
|---|---|---|---|---|
| Wet | Dry | Wet | Dry | |
| 1 | 1.20 | 0.52 | Ca-HCO3 | Ca-HCO3 |
| 2 | 1.34 | 1.44 | Na-HCO3 | Na-Cl |
| 3 | 1.70 | 2.73 | Na-Cl | Na-Cl |
| 4 | 1.02 | 1.21 | Na-HCO3 | Na-Cl |
| 5 | 1.23 | 1.15 | Na-Cl | Na-Cl |
| 6 | 1.11 | 2.11 | Ca-HCO3 | Na-HCO3 |
| 7 | 1.01 | 0.23 | Na-HCO3 | Na-Cl |
| 8 | 1.23 | 0.64 | Na-Cl | Na-Cl |
| 9 | 1.44 | 1.64 | Na-Cl | Na-Cl |
| 10 | 1.43 | 3.52 | Na-HCO3 | Ca-Cl |
| 11 | 1.76 | 0.37 | Na-Cl | Na-Cl |
| 12 | 2.57 | 4.82 | Na-HCO3 | Na-Cl |
| 13 | 1.75 | 0.41 | Na-Cl | Na-Cl |
| 14 | 1.17 | 2.48 | Na-Cl | Na-HCO3 |
| 15 | 4.38 | 8.55 | Na-HCO3 | Ca-HCO3 |
| 16 | 4.23 | 1.33 | Ca-Cl | Ca-HCO3 |
| 17 | 2.52 | 2.15 | Ca-HCO3 | Ca-HCO3 |
| 18 | 1.20 | 0.52 | Ca-HCO3 | Ca-HCO3 |
| 19 | 1.34 | 1.44 | Na-HCO3 | Na-Cl |
| Mineral | Chemical Formula | Mineral Weathering Rate or Biomass Degradation Rate (µmol m−2 d−1) |
|---|---|---|
| Quartz | ||
| Halite | NaCl | |
| Feldspar | ||
| Garnet | ||
| Biotite | ||
| Vermiculite | ||
| Biomass 1 |
| (a) Dry Season | ||||||||||||
| Subwatershed | Area | Flow Rate | Concentration (mg L−1) | Elemental Flux (µmol m−2 d−1) | ||||||||
| (km2) | (m3 s−1) | Na | K | Ca | Mg | SiO2 | Na | K | Ca | Mg | SiO2 | |
| 1 | 3420 | 0.9223 | 38.82 | 7.65 | 46.92 | 8.07 | 7.78 | 39.33 | 4.56 | 27.28 | 7.73 | 3.02 |
| 2 | 2319 | 0.3968 | 39.52 | 10.6 | 10.93 | 5.29 | 10.51 | 25.4 | 4.01 | 4.03 | 3.22 | 2.59 |
| 3 | 2888 | 0.0373 | 369.6 | 6.9 | 62.5 | 16.18 | 13.47 | 17.95 | 0.2 | 1.74 | 0.74 | 0.25 |
| 4 | 2898 | 0.0037 | 26.81 | 8.23 | 10.4 | 4.49 | 12.23 | 0.13 | 0.02 | 0.03 | 0.02 | 0.02 |
| 5 | 1061 | 0.0373 | 134.8 | 14.05 | 29.99 | 11.6 | 8.02 | 17.82 | 1.09 | 2.28 | 1.45 | 0.41 |
| 6 | 1654 | 0.0373 | 26.29 | 5.12 | 22.05 | 7.55 | 11.25 | 2.23 | 0.26 | 1.07 | 0.61 | 0.37 |
| 7 | 5934 | 0.2240 | 26.6 | 5.21 | 18.64 | 5.5 | 11.94 | 3.77 | 0.43 | 1.52 | 0.74 | 0.65 |
| 8 | 3666 | 9.2113 | 213.7 | 5.08 | 43.3 | 8.44 | 13.26 | 2008.3 | 28.2 | 234.5 | 75.4 | 47.9 |
| 9 | 7869 | 11.4092 | 141.2 | 6.07 | 27.64 | 7.88 | 11.92 | 765.7 | 19.4 | 86.4 | 40.6 | 24.9 |
| 10 | 4966 | 0.0373 | 21.51 | 2.57 | 25.58 | 3.23 | 4.87 | 0.61 | 0.04 | 0.41 | 0.09 | 0.05 |
| 11 | 4443 | 0.0037 | 36.09 | 1.74 | 1.29 | 1.47 | 4.59 | 0.11 | 0 | 0 | 0 | 0.01 |
| 12 | 3803 | 3.2387 | 6.68 | 1.53 | 3.06 | 0.84 | 7.81 | 21.36 | 2.87 | 5.61 | 2.56 | 9.56 |
| 13 | 3376 | 47.0710 | 37.13 | 3.52 | 8.29 | 2.17 | 7.29 | 1944.82 | 108.49 | 249.18 | 107.6 | 146.17 |
| 14 | 2681 | 88.4194 | - | - | - | - | - | - | - | - | - | - |
| 15 | 3360 | 4.2742 | 8.37 | 6.75 | 9.94 | 3.21 | 12.59 | 39.98 | 18.97 | 27.26 | 14.53 | 23.03 |
| 16 | 4840 | 2.9523 | 6.35 | 6.31 | 7.95 | 1.75 | 7.93 | 14.54 | 8.51 | 10.45 | 3.8 | 6.96 |
| 17 | 4041 | 101.419 | - | - | - | - | - | - | - | - | - | - |
| 18 | 3493 | 0.6961 | 31.58 | 1.32 | 3.75 | 2.21 | 7.49 | 23.64 | 0.58 | 1.61 | 1.56 | 2.15 |
| 19 | 3878 | 0.7467 | 50.74 | 1.48 | 8.49 | 3 | 12.67 | 36.7 | 0.63 | 3.53 | 2.05 | 3.51 |
| Mun 1 | 70,589 | 101.419 | 24.08 | 3.33 | 16.95 | 3.62 | 7.50 | 129.97 | 10.57 | 52.50 | 18.50 | 15.51 |
| (b) Wet Season | ||||||||||||
| Subwatershed | Area | Flow Rate | Concentration (mg L−1) | Elemental Flux (µmol m−2 d−1) | ||||||||
| (km2) | (m3 s−1) | Na | K | Ca | Mg | SiO2 | Na | K | Ca | Mg | SiO2 | |
| 1 | 3420 | 1.6 | 42.1 | 8.5 | 46.2 | 8.3 | 9.4 | 73.1 | 8.7 | 46.0 | 13.6 | 6.2 |
| 2 | 2319 | 4.3 | 27.8 | 8.1 | 14.0 | 5.8 | 13.1 | 195.3 | 33.3 | 56.2 | 38.6 | 35.3 |
| 3 | 2888 | 4.2 | 326.2 | 4.1 | 62.4 | 14.0 | 13.2 | 1777.2 | 13.0 | 195.1 | 72.1 | 27.5 |
| 4 | 2898 | 17.1 | 29.6 | 9.9 | 12.0 | 5.5 | 13.0 | 655.6 | 128.4 | 152.1 | 116.1 | 110.0 |
| 5 | 1061 | 24.6 | 89.1 | 10.1 | 28.4 | 8.1 | 13.9 | 7745.5 | 516.9 | 1415.1 | 667.9 | 464.2 |
| 6 | 1654 | 6.7 | 13.7 | 4.1 | 13.1 | 3.9 | 10.2 | 209.1 | 36.8 | 114.7 | 57.1 | 59.6 |
| 7 | 5934 | 35.3 | 8.7 | 2.5 | 5.6 | 1.8 | 7.6 | 194.2 | 32.4 | 72.4 | 38.2 | 65.0 |
| 8 | 3666 | 377.0 | 23.6 | 2.4 | 6.5 | 1.7 | 6.3 | 9077.4 | 545.4 | 1440.9 | 621.6 | 931.7 |
| 9 | 7869 | 471.7 | 46.5 | 2.45 | 10.31 | 2.52 | 6.5 | 10,425.6 | 324.5 | 1332.3 | 537.1 | 560.3 |
| 10 | 4966 | 66.8 | 6.3 | 1.6 | 4.0 | 0.9 | 5.8 | 316.1 | 47.8 | 115.3 | 41.0 | 111.3 |
| 11 | 4443 | 82.9 | 17.8 | 2.0 | 3.2 | 0.9 | 3.4 | 1248.2 | 82.5 | 128.1 | 56.7 | 91.0 |
| 12 | 3803 | 44.6 | 3.9 | 1.4 | 2.4 | 0.5 | 4.2 | 173.0 | 37.2 | 59.4 | 20.6 | 70.4 |
| 13 | 3376 | 55.2 | 3.7 | 1.7 | 1.9 | 0.5 | 3.9 | 226.0 | 60.7 | 68.0 | 30.6 | 91.0 |
| 14 | 2681 | - | - | - | - | - | - | - | - | - | - | - |
| 15 | 3360 | 128.8 | 2.9 | 1.6 | 1.8 | 0.7 | 5.3 | 411.6 | 133.0 | 146.7 | 89.9 | 294.5 |
| 16 | 4840 | 132.7 | 2.1 | 1.6 | 2.0 | 0.5 | 4.0 | 218.5 | 95.0 | 120.4 | 49.9 | 156.0 |
| 17 | 4041 | - | - | - | - | - | - | - | - | - | - | - |
| 18 | 3493 | 30.7 | 6.0 | 1.1 | 1.8 | 0.6 | 3.3 | 198.9 | 21.5 | 34.3 | 20.0 | 42.0 |
| 19 | 3878 | 232.6 | 6.5 | 1.4 | 2.6 | 0.7 | 3.8 | 1456.7 | 181.9 | 333.4 | 146.3 | 324.1 |
| Mun 1 | 70,589 | 2543.1 | 9.0 | 1.9 | 5.0 | 1.1 | 4.6 | 1220.0 | 149.9 | 390.5 | 145.0 | 237.3 |
| (a) Dry Season | ||||||||||||
| Subwatershed | Biomass Formula: | Mineral Weathering Rates (µmol m−2 d−1) | Total Mineral Weathering (µmol m−2 d−1) | Biomass Degradation (µmol m−2 d−1) | ||||||||
| x | y | z | w | α1 | α2 | α3 | α4 | α5 | α6 | α7 | ||
| 1 | 0.99 | 0.28 | 1.00 | 0.17 | 3.02 | 12.15 | 0.00 | 0.00 | 0.00 | 0.00 | 15.17 | 27.35 |
| 2 | 1.00 | 0.25 | 0.32 | 0.32 | 2.58 | 12.75 | 0.00 | 0.00 | 0.00 | 0.00 | 15.34 | 12.65 |
| 3 | 0.79 | 0.07 | 0.17 | 0.02 | 0.25 | 10.08 | 0.00 | 0.00 | 0.00 | 0.00 | 10.33 | 10.02 |
| 4 | 0.00 | 0.00 | 0.00 | 0.00 | 0.02 | 0.13 | 0.00 | 0.00 | 0.00 | 0.00 | 0.15 | 100.00 |
| 5 | 0.77 | 0.14 | 0.23 | 0.11 | 0.41 | 10.08 | 0.00 | 0.00 | 0.00 | 0.00 | 10.48 | 10.02 |
| 6 | 0.12 | 0.06 | 0.11 | 0.03 | 0.37 | 1.00 | 0.00 | 0.00 | 0.00 | 0.00 | 1.37 | 10.08 |
| 7 | 0.27 | 0.07 | 0.15 | 0.04 | 0.65 | 1.03 | 0.00 | 0.00 | 0.00 | 0.00 | 1.67 | 10.00 |
| 8 | 1.00 | 0.06 | 0.19 | 0.02 | 0.00 | 262.86 | 5.68 | 0.00 | 0.00 | 0.00 | 85.34 | 118.99 |
| 9 | 1.00 | 0.06 | 0.19 | 0.02 | 0.00 | 262.86 | 5.68 | 0.00 | 0.00 | 0.00 | 183.20 | 255.42 |
| 10 | 0.00 | 0.01 | 0.04 | 0.00 | 0.00 | 0.61 | 0.00 | 0.00 | 0.02 | 0.00 | 0.63 | 9.92 |
| 11 | 0.01 | 0.06 | 0.14 | 0.15 | 1.00 | 10.00 | 1.00 | 1.00 | 1.00 | 1.00 | 15.00 | 10.00 |
| 12 | 1.00 | 0.09 | 0.53 | 0.19 | 5.79 | 10.69 | 0.00 | 0.00 | 0.88 | 0.46 | 17.82 | 10.62 |
| 13 | 1.00 | 0.11 | 0.24 | 0.11 | 0.00 | 470.13 | 27.27 | 0.00 | 0.00 | 0.00 | 497.40 | 483.74 |
| 14 | - | - | - | - | - | - | - | - | - | - | - | - |
| 15 | 0.98 | 0.56 | 1.00 | 0.75 | 5.56 | 11.44 | 5.62 | 0.80 | 0.00 | 0.00 | 23.42 | 25.30 |
| 16 | 0.42 | 0.37 | 1.00 | 0.82 | 6.30 | 10.04 | 0.24 | 0.00 | 0.00 | 0.00 | 16.59 | 10.37 |
| 17 | - | - | - | - | - | - | - | - | - | - | - | - |
| 18 | 1.00 | 0.13 | 0.14 | 0.05 | 2.14 | 11.86 | 0.00 | 0.00 | 0.00 | 0.00 | 14.00 | 11.78 |
| 19 | 0.99 | 0.11 | 0.19 | 0.03 | 3.51 | 18.47 | 0.00 | 0.00 | 0.00 | 0.00 | 21.98 | 18.33 |
| Mun 1 | 1.00 | 0.37 | 1.00 | 0.21 | 0.00 | 75.38 | 5.79 | 0.00 | 0.00 | 0.00 | 81.17 | 50.66 |
| Average | 0.70 | 0.18 | 0.44 | 0.18 | ||||||||
| (b) Wet Season | ||||||||||||
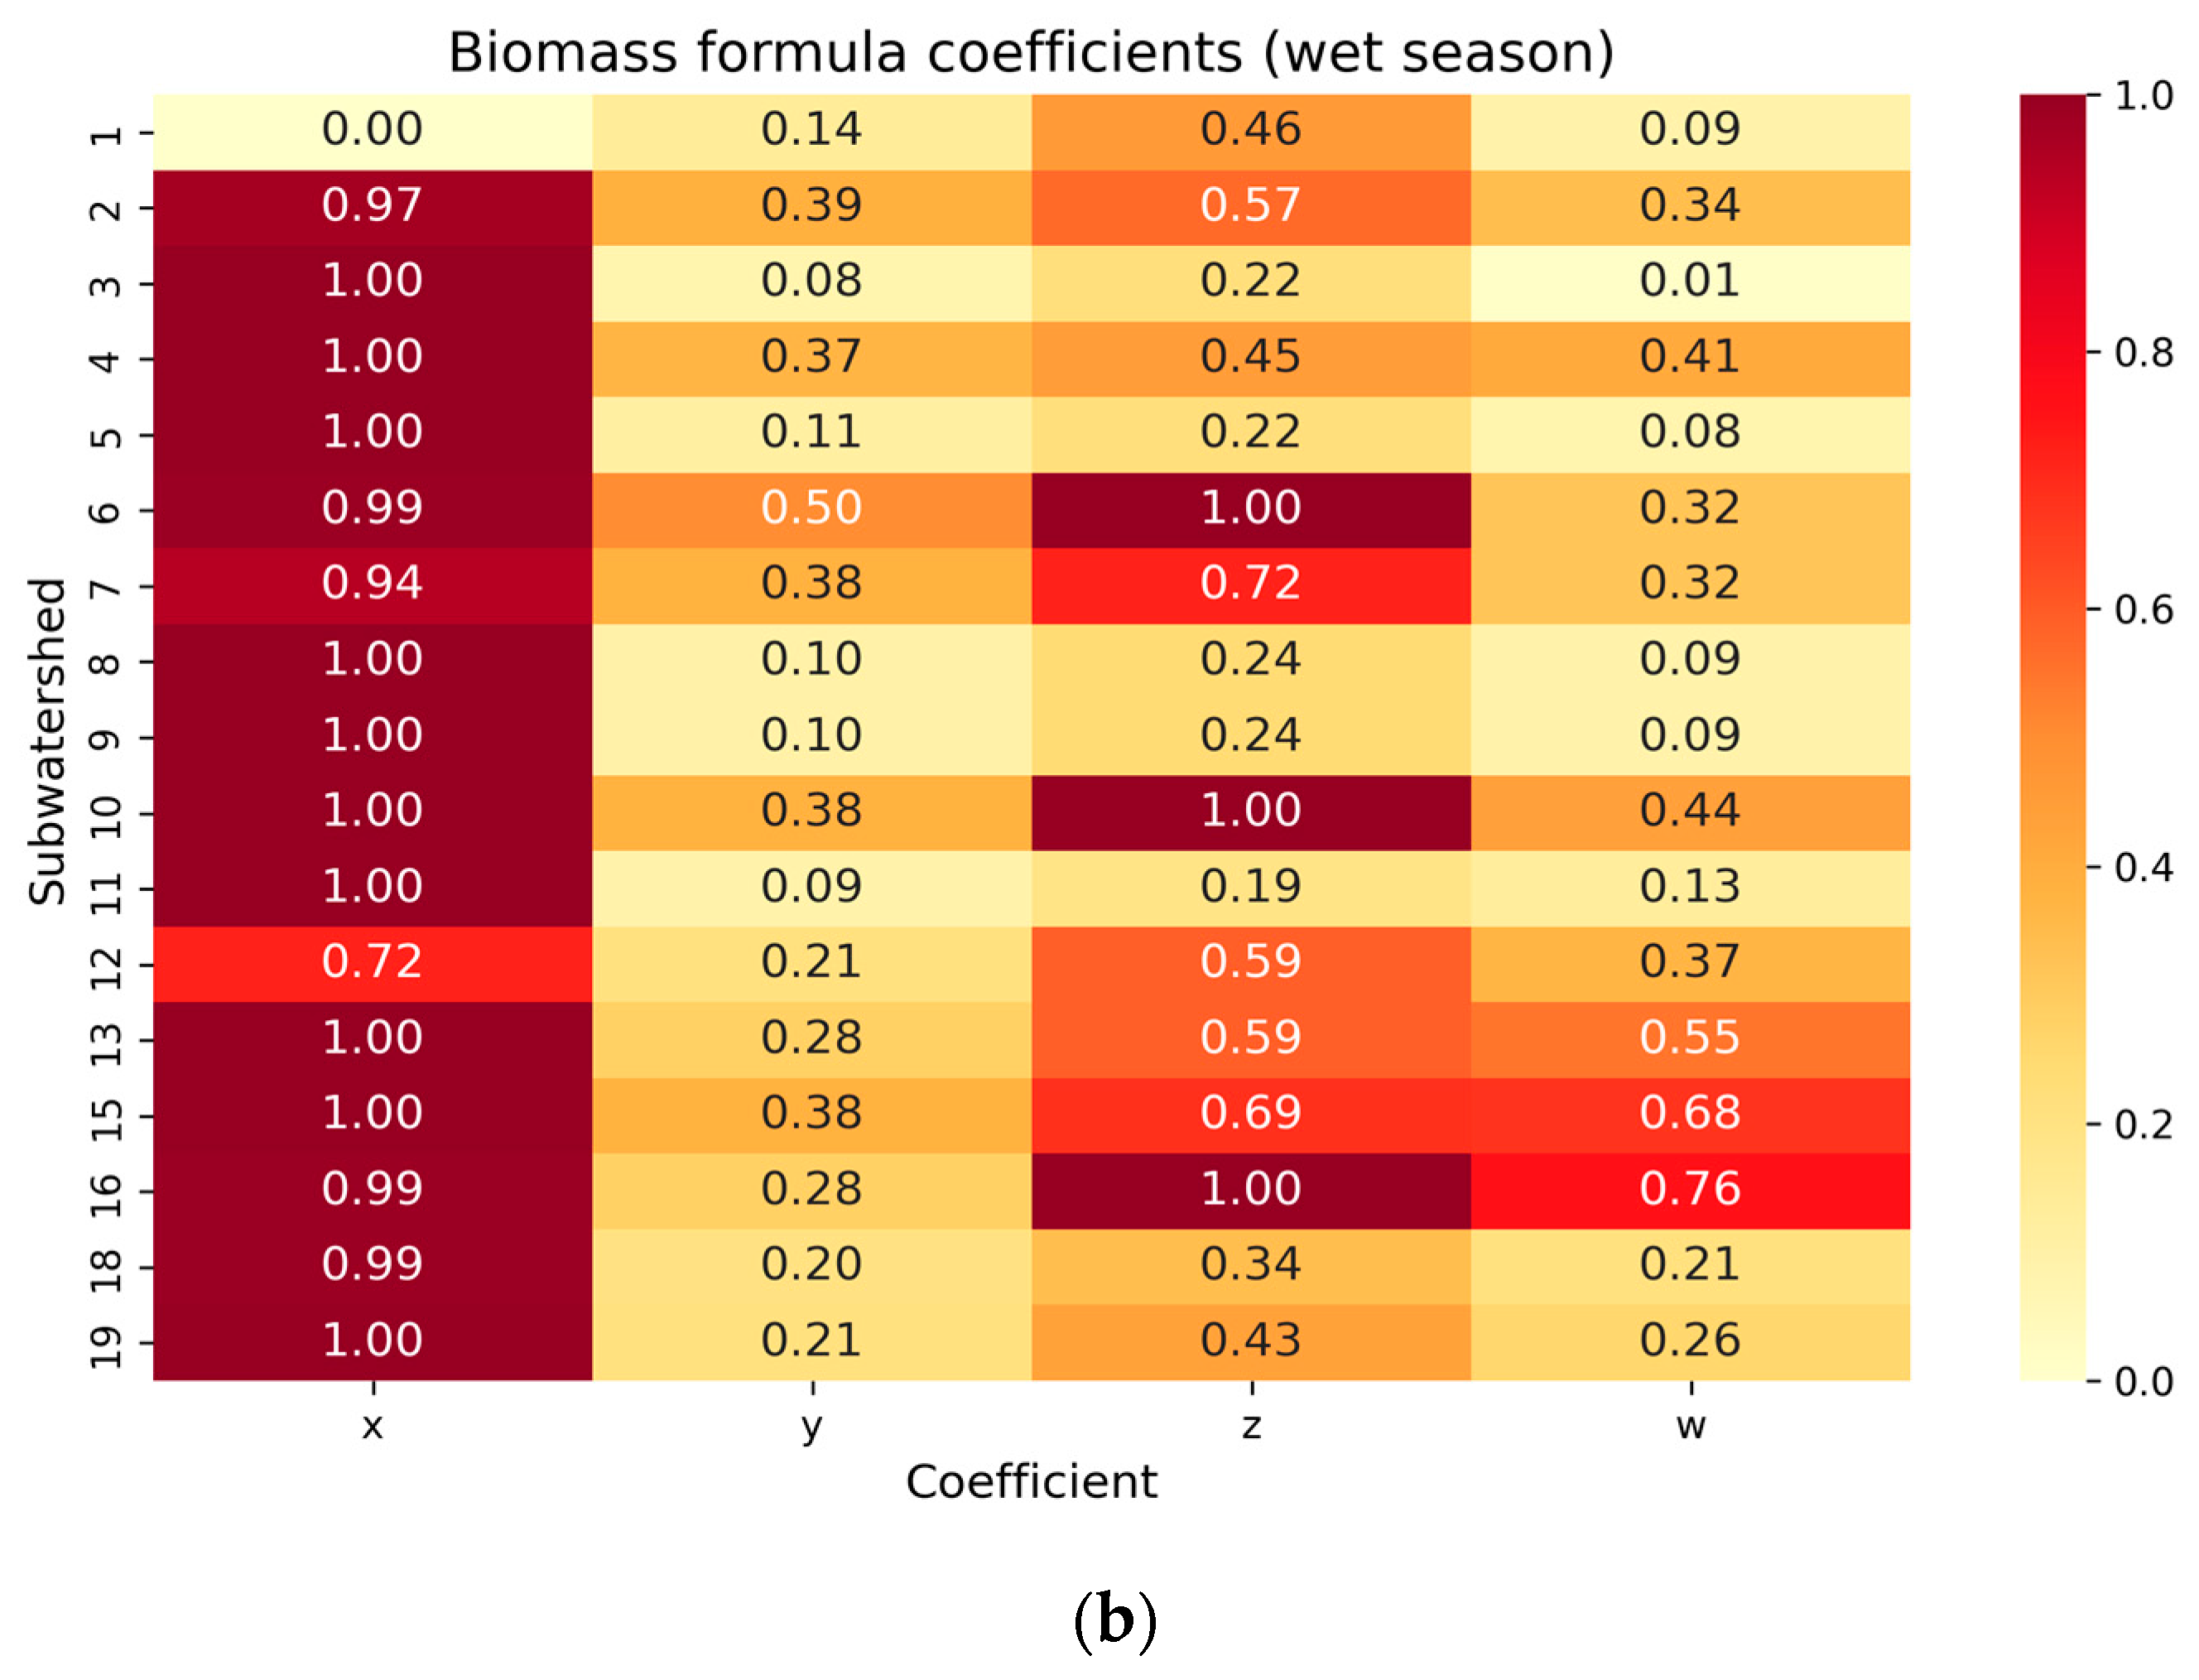
| Subwatershed | Biomass Formula: | Mineral Weathering Rates (µmol m−2 d−1) | Total Mineral Weathering (µmol m−2 d−1) | Biomass Degradation (µmol m−2 d−1) | ||||||||
| x | y | z | w | α1 | α2 | α3 | α4 | α5 | α6 | α7 | ||
| 1 | 0.00 | 0.14 | 0.46 | 0.09 | 6.2 | 73.1 | 0.0 | 0.0 | 0.0 | 0.0 | 79.3 | 100.0 |
| 2 | 0.97 | 0.39 | 0.57 | 0.34 | 35.3 | 100.1 | 0.0 | 0.0 | 0.0 | 0.0 | 135.4 | 98.0 |
| 3 | 1.00 | 0.08 | 0.22 | 0.01 | 0.0 | 884.9 | 10.3 | 0.0 | 0.0 | 0.0 | 895.2 | 885.3 |
| 4 | 1.00 | 0.37 | 0.45 | 0.41 | 20.3 | 316.4 | 33.5 | 0.0 | 0.0 | 0.0 | 370.2 | 316.4 |
| 5 | 1.00 | 0.11 | 0.22 | 0.08 | 178.2 | 1386.5 | 106.7 | 0.0 | 0.0 | 0.0 | 1671.4 | 6286.5 |
| 6 | 0.99 | 0.50 | 1.00 | 0.32 | 59.6 | 94.8 | 0.0 | 0.0 | 0.0 | 0.0 | 154.4 | 115.1 |
| 7 | 0.94 | 0.38 | 0.72 | 0.32 | 63.0 | 100.0 | 0.8 | 0.0 | 0.0 | 0.0 | 163.7 | 100.0 |
| 8 | 1.00 | 0.10 | 0.24 | 0.09 | 294.0 | 997.6 | 0.0 | 0.0 | 0.0 | 0.0 | 410.44 | 603.06 |
| 9 | 1.00 | 0.10 | 0.24 | 0.09 | 294.0 | 997.6 | 0.0 | 0.0 | 0.0 | 0.0 | 881.06 | 1294.54 |
| 10 | 1.00 | 0.38 | 1.00 | 0.44 | 56.7 | 193.5 | 20.4 | 0.0 | 0.0 | 0.0 | 270.6 | 108.7 |
| 11 | 1.00 | 0.09 | 0.19 | 0.13 | 0.0 | 612.6 | 34.0 | 0.0 | 0.0 | 0.0 | 646.5 | 612.6 |
| 12 | 0.72 | 0.21 | 0.59 | 0.37 | 64.4 | 99.8 | 2.2 | 0.0 | 0.0 | 0.0 | 166.4 | 99.6 |
| 13 | 1.00 | 0.28 | 0.59 | 0.55 | 64.0 | 109.6 | 10.1 | 0.0 | 0.0 | 0.0 | 183.6 | 109.6 |
| 14 | - | - | - | - | - | - | - | - | - | - | - | - |
| 15 | 1.00 | 0.38 | 0.69 | 0.68 | 66.3 | 182.9 | 66.2 | 0.0 | 7.4 | 10.7 | 333.6 | 182.9 |
| 16 | 0.99 | 0.28 | 1.00 | 0.76 | 66.8 | 94.4 | 13.8 | 4.5 | 6.9 | 7.0 | 193.3 | 115.0 |
| 17 | - | - | - | - | - | - | - | - | - | - | - | - |
| 18 | 0.99 | 0.20 | 0.34 | 0.21 | 42.0 | 100.0 | 0.0 | 0.0 | 0.0 | 0.0 | 142.0 | 100.0 |
| 19 | 1.00 | 0.21 | 0.43 | 0.26 | 0.0 | 687.2 | 120.9 | 0.0 | 0.0 | 0.0 | 808.2 | 687.2 |
| Mun 1 | 1.00 | 0.25 | 0.62 | 0.26 | 0.0 | 579.9 | 88.5 | 0.0 | 0.0 | 0.0 | 668.4 | 579.9 |
| Average | 0.96 | 0.26 | 0.58 | 0.31 | ||||||||
| Subwatershed | Mineral Weathering Rate (µmol m−2 d−1) | Biomass Degradation Rate (µmol m−2 d−1) | ||
|---|---|---|---|---|
| Dry | Wet | Dry | Wet | |
| 1 | 15.17 | 79.3 | 27.35 | 100 |
| 2 | 15.34 | 135.4 | 12.65 | 98 |
| 3 | 10.33 | 895.2 | 10.02 | 885.3 |
| 4 | 0.15 | 370.2 | 100 | 316.4 |
| 5 | 10.48 | 1671.40 | 10.02 | 6286.50 |
| 6 | 1.37 | 154.4 | 10.08 | 115.1 |
| 7 | 1.67 | 163.7 | 10 | 100 |
| 8 | 85.34 | 410.44 | 118.99 | 603.06 |
| 9 | 183.2 | 881.06 | 255.42 | 1294.54 |
| 10 | 0.63 | 270.6 | 9.92 | 108.7 |
| 11 | 15 | 646.5 | 10 | 612.6 |
| 12 | 17.82 | 166.4 | 10.62 | 99.6 |
| 13 | 497.4 | 183.6 | 483.74 | 109.6 |
| 14 | - | - | - | - |
| 15 | 23.42 | 333.6 | 25.3 | 182.9 |
| 16 | 16.59 | 193.3 | 10.37 | 115 |
| 17 | - | - | - | - |
| 18 | 14 | 142 | 11.78 | 100 |
| 19 | 21.98 | 808.2 | 18.33 | 687.2 |
| Parameter | Season | Min | Max | Mean | Median | SD 1 | p-Value |
|---|---|---|---|---|---|---|---|
| Dry | 0.11 | 2716.85 | 419.63 | 23.65 | 785.59 | 0.001 | |
| Wet | 0.00 | 17,971.18 | 2044.28 | 286.03 | 4378.72 | ||
| Dry | 0.00 | 252.15 | 30.80 | 2.88 | 65.64 | 0.003 | |
| Wet | 0.00 | 556.74 | 121.13 | 47.86 | 165.76 | ||
| Dry | 0.00 | 1456.98 | 171.56 | 4.03 | 421.61 | 0.001 | |
| Wet | 0.00 | 2285.57 | 323.61 | 113.96 | 584.88 | ||
| Dry | 0.00 | 788.52 | 77.12 | 2.54 | 198.56 | 0.003 | |
| Wet | 0.00 | 921.04 | 143.07 | 56.37 | 245.88 | ||
| Dry | 0.11 | 2206.43 | 404.12 | 22.71 | 712.29 | 0.003 | |
| Wet | 0.00 | 18,905.60 | 2069.60 | 222.37 | 4565.26 | ||
| Dry | 0.01 | 3433.52 | 435.96 | 19.51 | 1066.09 | 0.001 | |
| Wet | 0.00 | 4946.36 | 828.19 | 295.32 | 1360.18 | ||
| Dry | 0.00 | 155.63 | 10.57 | 0.01 | 36.04 | 0.003 | |
| Wet | 0.00 | 84.98 | 17.26 | 7.00 | 22.83 | ||
| Dry | 0.00 | 400.91 | 37.88 | 0.83 | 97.68 | 0.001 | |
| Wet | 0.00 | 570.70 | 85.74 | 22.77 | 148.85 | ||
| Dry | 0.01 | 402.66 | 54.24 | 3.02 | 120.32 | 0.001 |
Disclaimer/Publisher’s Note: The statements, opinions and data contained in all publications are solely those of the individual author(s) and contributor(s) and not of MDPI and/or the editor(s). MDPI and/or the editor(s) disclaim responsibility for any injury to people or property resulting from any ideas, methods, instructions or products referred to in the content. |
© 2025 by the authors. Licensee MDPI, Basel, Switzerland. This article is an open access article distributed under the terms and conditions of the Creative Commons Attribution (CC BY) license (https://creativecommons.org/licenses/by/4.0/).
Share and Cite
Suntikoon, S.; Poatprommanee, P.; Taweelarp, S.; Khebchareon, M.; Saenton, S. Assessing Seasonal Biogeochemical Variations in the Mun River Watershed Using Water Quality Data and the Geochemical Mass Balance Method. Water 2025, 17, 985. https://doi.org/10.3390/w17070985
Suntikoon S, Poatprommanee P, Taweelarp S, Khebchareon M, Saenton S. Assessing Seasonal Biogeochemical Variations in the Mun River Watershed Using Water Quality Data and the Geochemical Mass Balance Method. Water. 2025; 17(7):985. https://doi.org/10.3390/w17070985
Chicago/Turabian StyleSuntikoon, Supanut, Pee Poatprommanee, Sutthipong Taweelarp, Morrakot Khebchareon, and Schradh Saenton. 2025. "Assessing Seasonal Biogeochemical Variations in the Mun River Watershed Using Water Quality Data and the Geochemical Mass Balance Method" Water 17, no. 7: 985. https://doi.org/10.3390/w17070985
APA StyleSuntikoon, S., Poatprommanee, P., Taweelarp, S., Khebchareon, M., & Saenton, S. (2025). Assessing Seasonal Biogeochemical Variations in the Mun River Watershed Using Water Quality Data and the Geochemical Mass Balance Method. Water, 17(7), 985. https://doi.org/10.3390/w17070985


