Article

Effective Combination of MOF and MoS2 Layers: A Novel Composite Material Capable of Rapidly Degrading Dyes

1
College of Environmental Science and Engineering, Yangzhou University, Yangzhou 225127, China
2
Key Laboratory of Cultivated Land Quality Monitoring and Evaluation, Ministry of Agriculture and Rural Affairs, Yangzhou University, Yangzhou 225127, China
3
Jiangsu Collaborative Innovation Center for Solid Organic Waste Resource Utilization, Yangzhou 225127, China
4
School of Civil and Hydraulic Engineering, Bengbu University, Bengbu 233030, China
5
College of Environmental Science and Engineering, Donghua University, Shanghai 201620, China
*
Authors to whom correspondence should be addressed.
Water 2025, 17(7), 980; https://doi.org/10.3390/w17070980
Submission received: 8 February 2025 / Revised: 24 March 2025 / Accepted: 24 March 2025 / Published: 27 March 2025
(This article belongs to the Section Wastewater Treatment and Reuse)

Abstract

:
This study successfully prepared MIL-101(Fe)@MoS2 composite photocatalysts via hydrothermal methods to address the efficient removal of refractory organic dyes in dye wastewater. Characterization using X-ray diffraction (XRD), Fourier transform infrared (FT-IR), scanning electron microscopy (SEM), and energy-dispersive X-ray spectroscopy (EDS) confirmed that molybdenum disulfide (MoS2) was uniformly loaded onto the surface of MIL-101(Fe), forming a heterojunction that significantly enhanced light absorption capacity and charge separation efficiency. In a visible-light-driven photo-Fenton system, this material exhibited excellent degradation performance for Congo red (CR). At an initial CR concentration of 50 mg/L, a catalyst dosage of 0.2 g/L, 4 mL of added H2O2, and pH 7, CR was completely degraded within 30 min, with the total organic carbon (TOC) removal reaching 72.5%. The material maintained high degradation efficiency (>90%) across a pH range of 3–9, overcoming the traditional Fenton system’s dependency on acidic media. Radical-trapping experiments indicated that superoxide radicals (·O2) and photogenerated holes (·h+) were the primary active species responsible for degradation, revealing a synergistic catalytic mechanism at the heterojunction interface. Recyclability tests showed that the material retained 90.8% degradation efficiency after five cycles, and an X-ray photoelectron spectroscopy (XPS) analysis demonstrated the stable binding of Fe and Mo, preventing secondary pollution. This study provides a scientific basis for developing efficient, stable, and wide-pH adaptable photo-Fenton catalytic systems, contributing significantly to the advancement of green water treatment technologies.

1. Introduction

With industrial development and population growth, the problem of water pollution is becoming increasingly serious, especially regarding the wastewater discharged from the printing and dyeing industry, which contains a large amount of organic dyes that are difficult to degrade [1]. Congo red (CR), as a typical azo dye, is widely utilized in the textile industry [2,3] According to GB8978-1996 [4], the wastewater discharge standard stipulates that the concentration of CR in wastewater must not exceed 0.1 mg/L. CR is difficult to degrade, and it poses significant carcinogenic risks to humans and other organisms. Moreover, CR causes environmental harm and poses a serious threat to both the environment and human health [5,6,7]. Therefore, the development of efficient, economical, and convenient wastewater treatment technologies is particularly important [8].
Among many wastewater treatment technologies, dye removal using advanced oxidation processes (AOPs) stands out as one of the most promising and effective techniques. This method excels in achieving rapid decolorization and environmental protection [9,10,11]. Recent studies have highlighted the potential of alternative AOPs, such as ultrasonic irradiation for the disruption of complex dye molecules [12] and electrochemical oxidation for the mineralization of persistent organic pollutants [13] However, challenges including high energy consumption and secondary pollution limit the scalability of these techniques. Photo-Fenton, as the most typical and widely studied AOP, has attracted much attention due to its strong oxidizing effect, high efficiency, and environmental friendliness [14]. Photo-Fenton oxidation is an important AOP [15] that is suitable for treating wastewater containing refractory organic compounds. In the photo-Fenton reaction system, iron ions can catalyze hydrogen peroxide to produce various highly oxidized oxygen species, such as 1O2 and ·O2, which can convert the macromolecules in organic dyes into carbon dioxide and water [16].
Metal–organic frameworks (MOFs) are representative porous crystalline materials that are characterized by a highly ordered porosity, large specific surface areas, and abundant coordinated unsaturated metal sites [17,18,19,20]. They can also be customized and optimized according to specific needs [21]. Therefore, extensive research has focused on MOFs with the aim of discovering their potential applications in photo-Fenton [22,23,24]. MIL-101, as an MOF series material, is a promising iron-based MOF [25] that is well known for its excellent stability and adsorption capacity. The introduction of metal ions into the organic ligand structure of MIL-101 enables materials to exhibit diverse properties, and MIL-101 is widely utilized in many fields [26,27].
Molybdenum disulfide (MoS2) is a common semiconductor material that has been widely applied in various fields, including lubrication, electronic transistors, batteries, and catalysis [28,29,30]. MoS2 can act as a co-catalyst in photo-Fenton, promoting the decomposition of hydrogen peroxide into ·OH, accelerating the cycle of Fe2+ and Fe3+, and significantly reducing the consumption of H2O2 and Fe3+, thus improving the overall degradation efficiency of the photo-Fenton AOP [31,32].
In this study, a new composite photocatalytic material, MIL-101(Fe)@MoS2, was successfully prepared using the hydrothermal method, and its photocatalytic performance in the removal of CR dyes from dyed wastewater was investigated in depth. The results showed that MIL-101(Fe)@MoS2 exhibited excellent performance in CR degradation driven by visible light and good pH adaptability. The purpose of this study was to provide a scientific basis for the field of organic printing and dyed wastewater treatment, offering strong support for the further promotion of green and sustainable development.

2. Experimental Part

2.1. Experimental Test Materials

2.1.1. Chemical Reagents

Ferric chloride hexahydrate (FeCl3·6H2O); terephthalic acid (C8H6O4, BDC); molybdenum disulfide (MoS2); N, N-Dimethylformamide (C3H7NO, DMF); Congo red (C32H22N6Na2O6S2); hydrogen peroxide (H2O2, 30 wt%); ethanol (C2H5OH); ethylenediaminetetraacetic acid disodium salt dihydrate (C10H14N2O8Na2·2H2O, EDTA-2Na); n-Butanol (C4H10O, nBuOH); isopropyl alcohol ((CH3)2CHOH, IPA); benzoquinone (BQ, C6H4O2); potassium hydrogen phthalate (for TOC standard curve); and distilled water.

2.1.2. Experimental Instruments

IKA RH basic KT/C magnetic stirrer (IKA, Staufen, Germany); FE28-Standard pH meter (Mettler-Toledo, Shanghai, China); DZF-6050 vacuum drying oven (Shanghai Experimental Instrument Factory, Shanghai, China); BSA224S-CW electronic balance (Shanghai Shuangxu Electronics, Shanghai, China); H1850 science benchtop high-speed centrifuge (Hunan Xiangyi Centrifuge, Changsha, China); SU8010 scanning electron microscope (Hitachi, Tokyo, Japan); XRD-6000 X-ray diffractometer (Shimadzu, Kyoto, Japan); TU-19-01 double-beam ultraviolet spectrophotometer (Beijing Purkinje General Instrument, Beijing, China); Shimadzu TOC-L analyzer (Shimadzu, Kyoto, Japan); Double-layer glass photocatalytic reactor (Custom equipment, Huamo, Hangzhou, China); High-resolution transmission electron microscope (HRTEM) (Hitachi, Tokyo, Japan); Fourier transform infrared spectrometer (FT-IR) (Thermo Fisher Scientific, Waltham, MA, USA); Energy-dispersive X-ray spectrometer (EDS) (Oxford Instruments, Abingdon, UK).

2.2. Catalyst Preparation

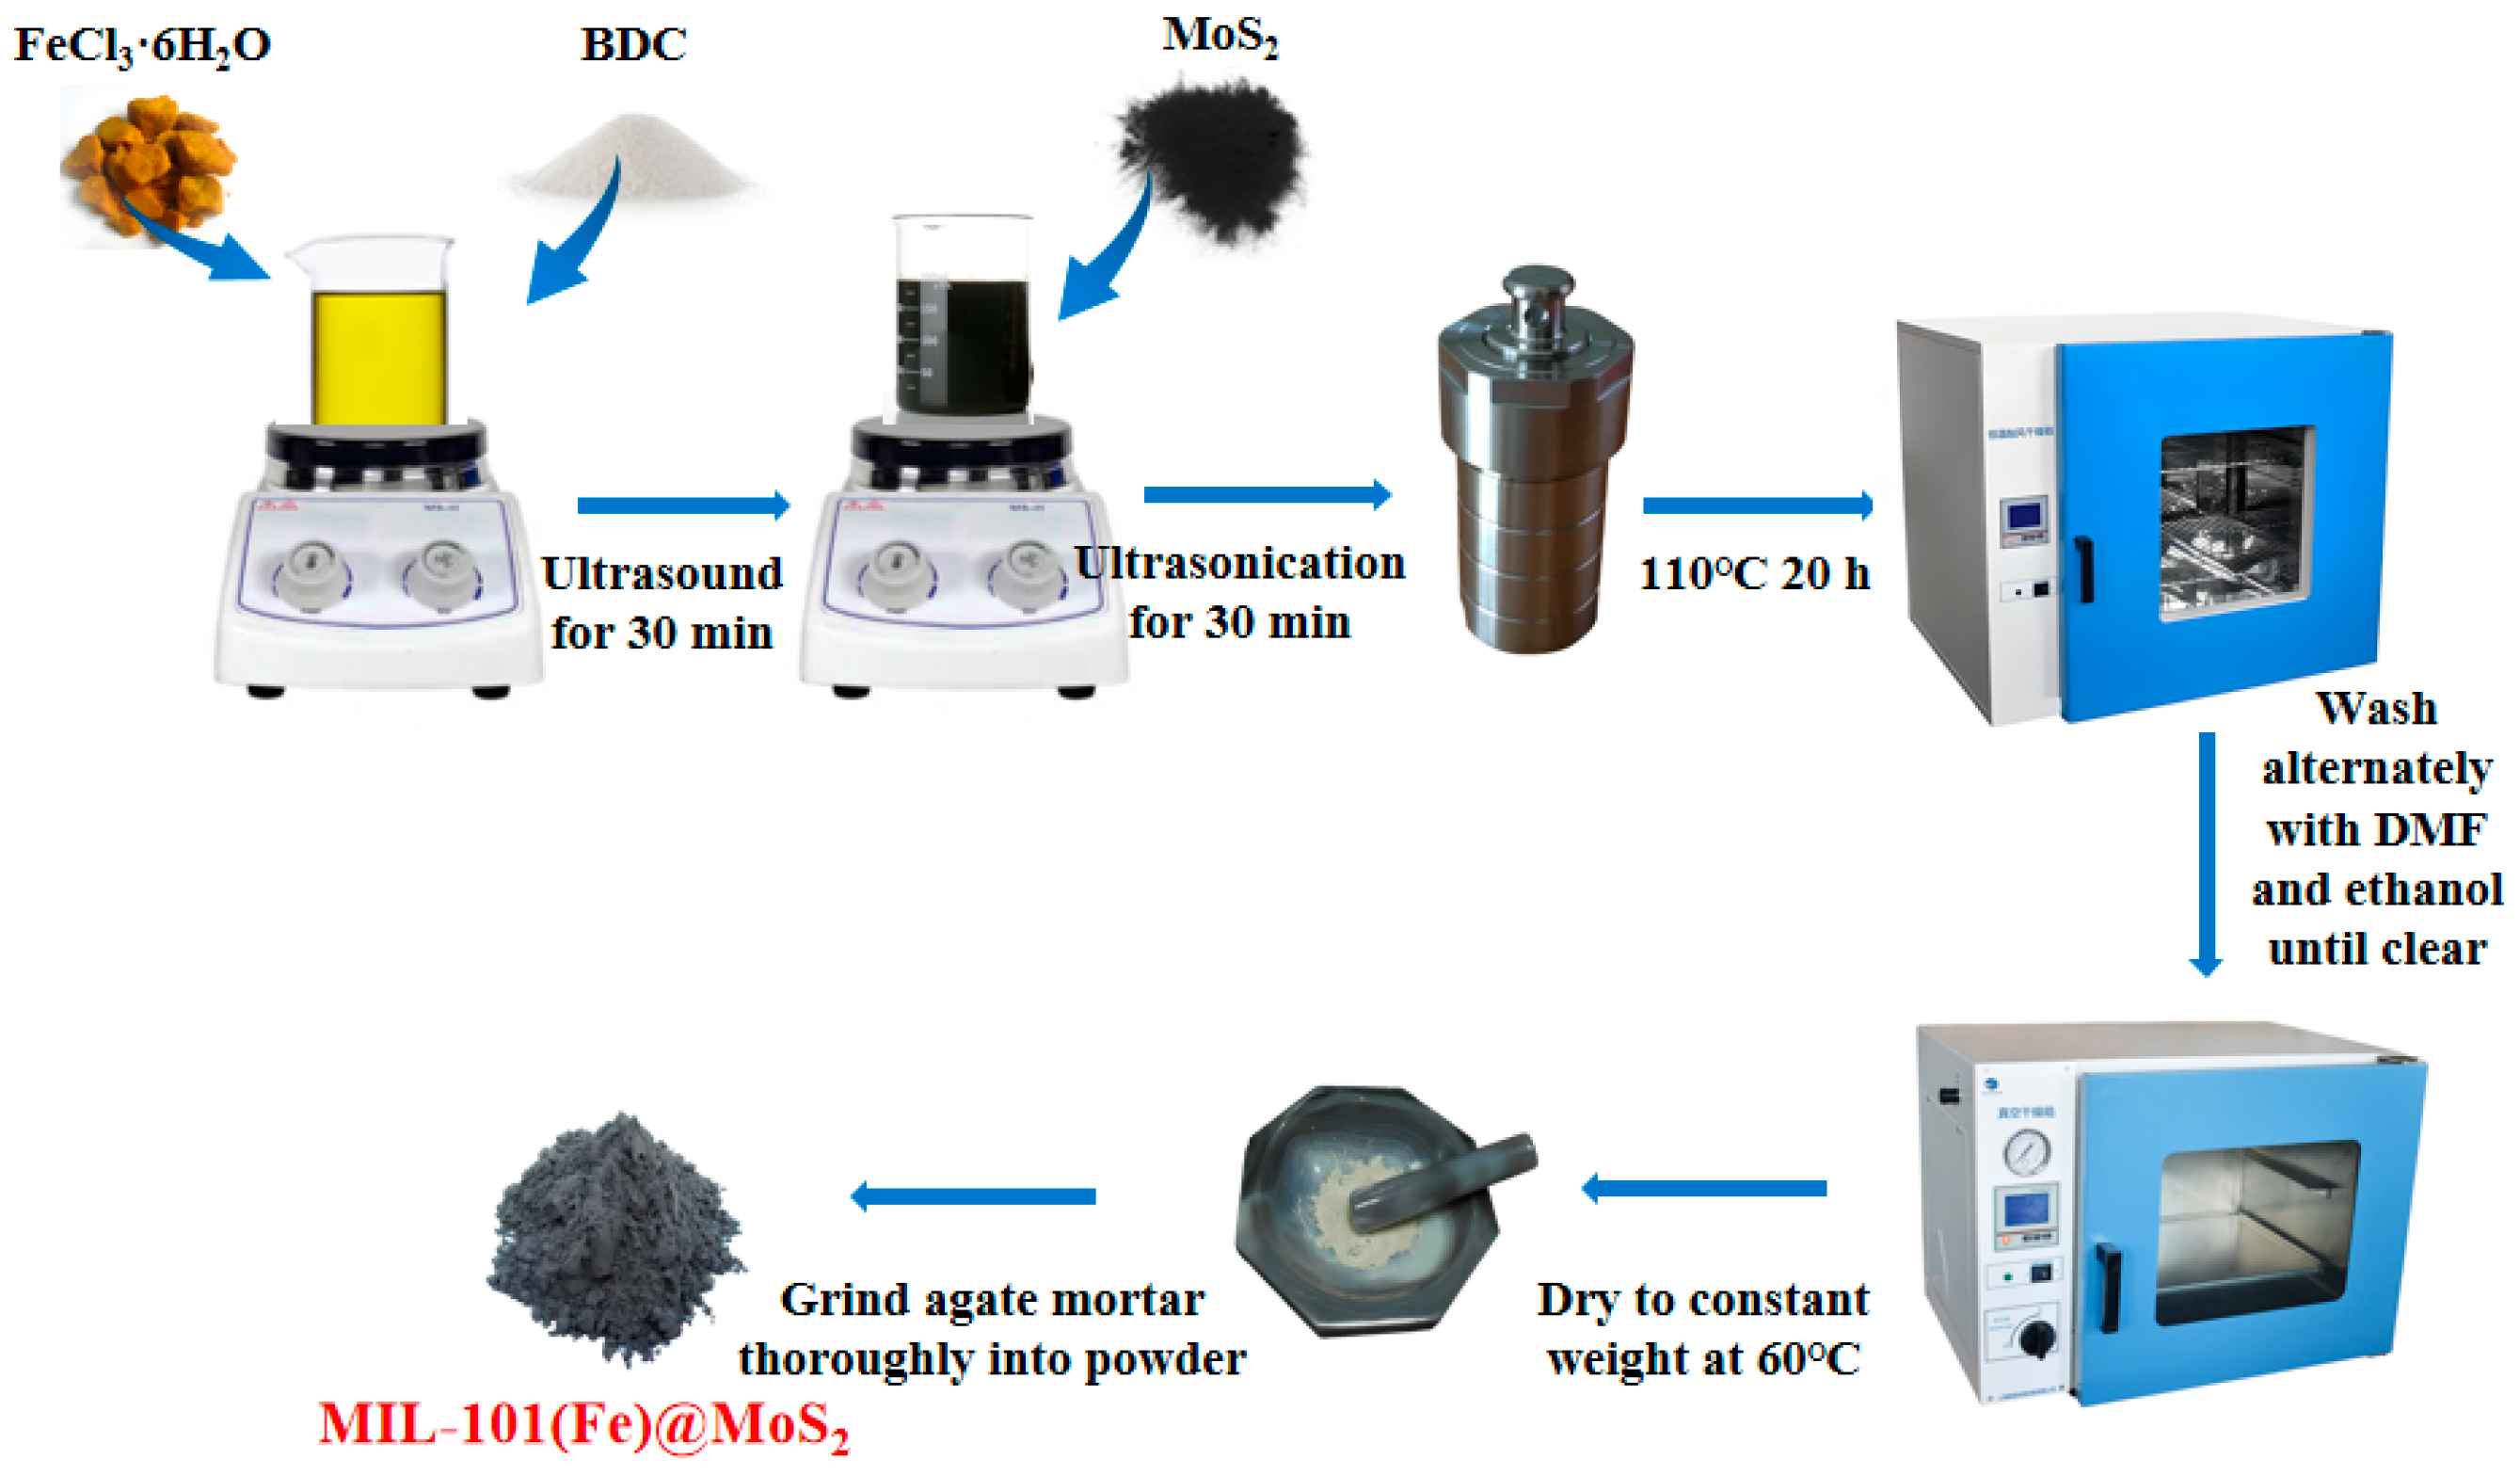
2.2.1. Preparation of MIL-101(Fe)

MIL-101(Fe) was synthesized using previously reported hydrothermal methods [33]. First, 1.3244 g FeCl3·6H2O and 0.412 g terephthalic acid (BDC) were dissolved in 30 mL of N, N-dimethylformamide (DMF) solution and sonicated for 20 min. Subsequently, the above mixture was transferred into a Teflon-lined autoclave and heated at 110 °C for 20 h. After cooling to 20 °C room temperature, the resulting precipitate was collected via centrifugation, washed thoroughly with DMF and ethanol until the supernatant became clear, and then dried at 60 °C under vacuum until the product reached a constant weight. The obtained product was then ground into fine brown–red MIL-101(Fe) powder using an agate mortar.

2.2.2. Preparation of MIL-101(Fe)@MoS2

The synthesis of the MIL-101(Fe)@MoS2 nanocomposite material was conducted using the hydrothermal method, with the preparation process as illustrated in Figure 1. Specifically, 1.3244 g of FeCl3·6H2O and 0.412 g of BDC were dissolved in 30 mL of DMF solution. After 20 min of ultrasonic treatment, MoS2 powders of different masses (0.1042, 0.2084, and 0.4167 g) were added to the solution and ultrasonicated for 30 min. The subsequent steps were the same as those utilized for the synthesis of MIL-101(Fe), and the resulting samples were denoted as xMIL-101(Fe)@MoS2 (where x represents the mass percentage of MoS2 in the composite material, which are 6%, 12%, and 24% for the different composites).

2.3. Analytical Methods

2.3.1. Photo-Fenton Degradation of CR Experiment

The photo-Fenton catalytic performance of the catalyst samples using the degradation of CR was evaluated as a model reaction. Experiments were conducted in a double-layer glass photocatalytic reactor (Huamo, Hangzhou, China) at a constant temperature of 25 °C, where 20 mg of catalyst sample was added to 100 mL of CR solution (pH = 7). Irradiation was conducted using a 300 W xenon lamp (Perfect Light Co., Ltd., Beijing, China) equipped with a cut-off filter (λ > 420 nm). After turning on the xenon lamp, magnetic stirring was performed at a speed of 400 r/min, and H2O2 (30 wt%) was added to initiate the photo-Fenton reaction. At regular intervals, 3 mL of the reaction solution was drawn out and filtered through a 0.45 μm filter membrane, and the absorbance value was determined at a wavelength of 498 nm using spectrophotometry to ascertain the CR content in the solution. The degradation rate of the CR was calculated as follows:
C = (1 − Ct/C0) × 100%,
where C0 and Ct represent the initial concentration and real-time concentration of CR, respectively.

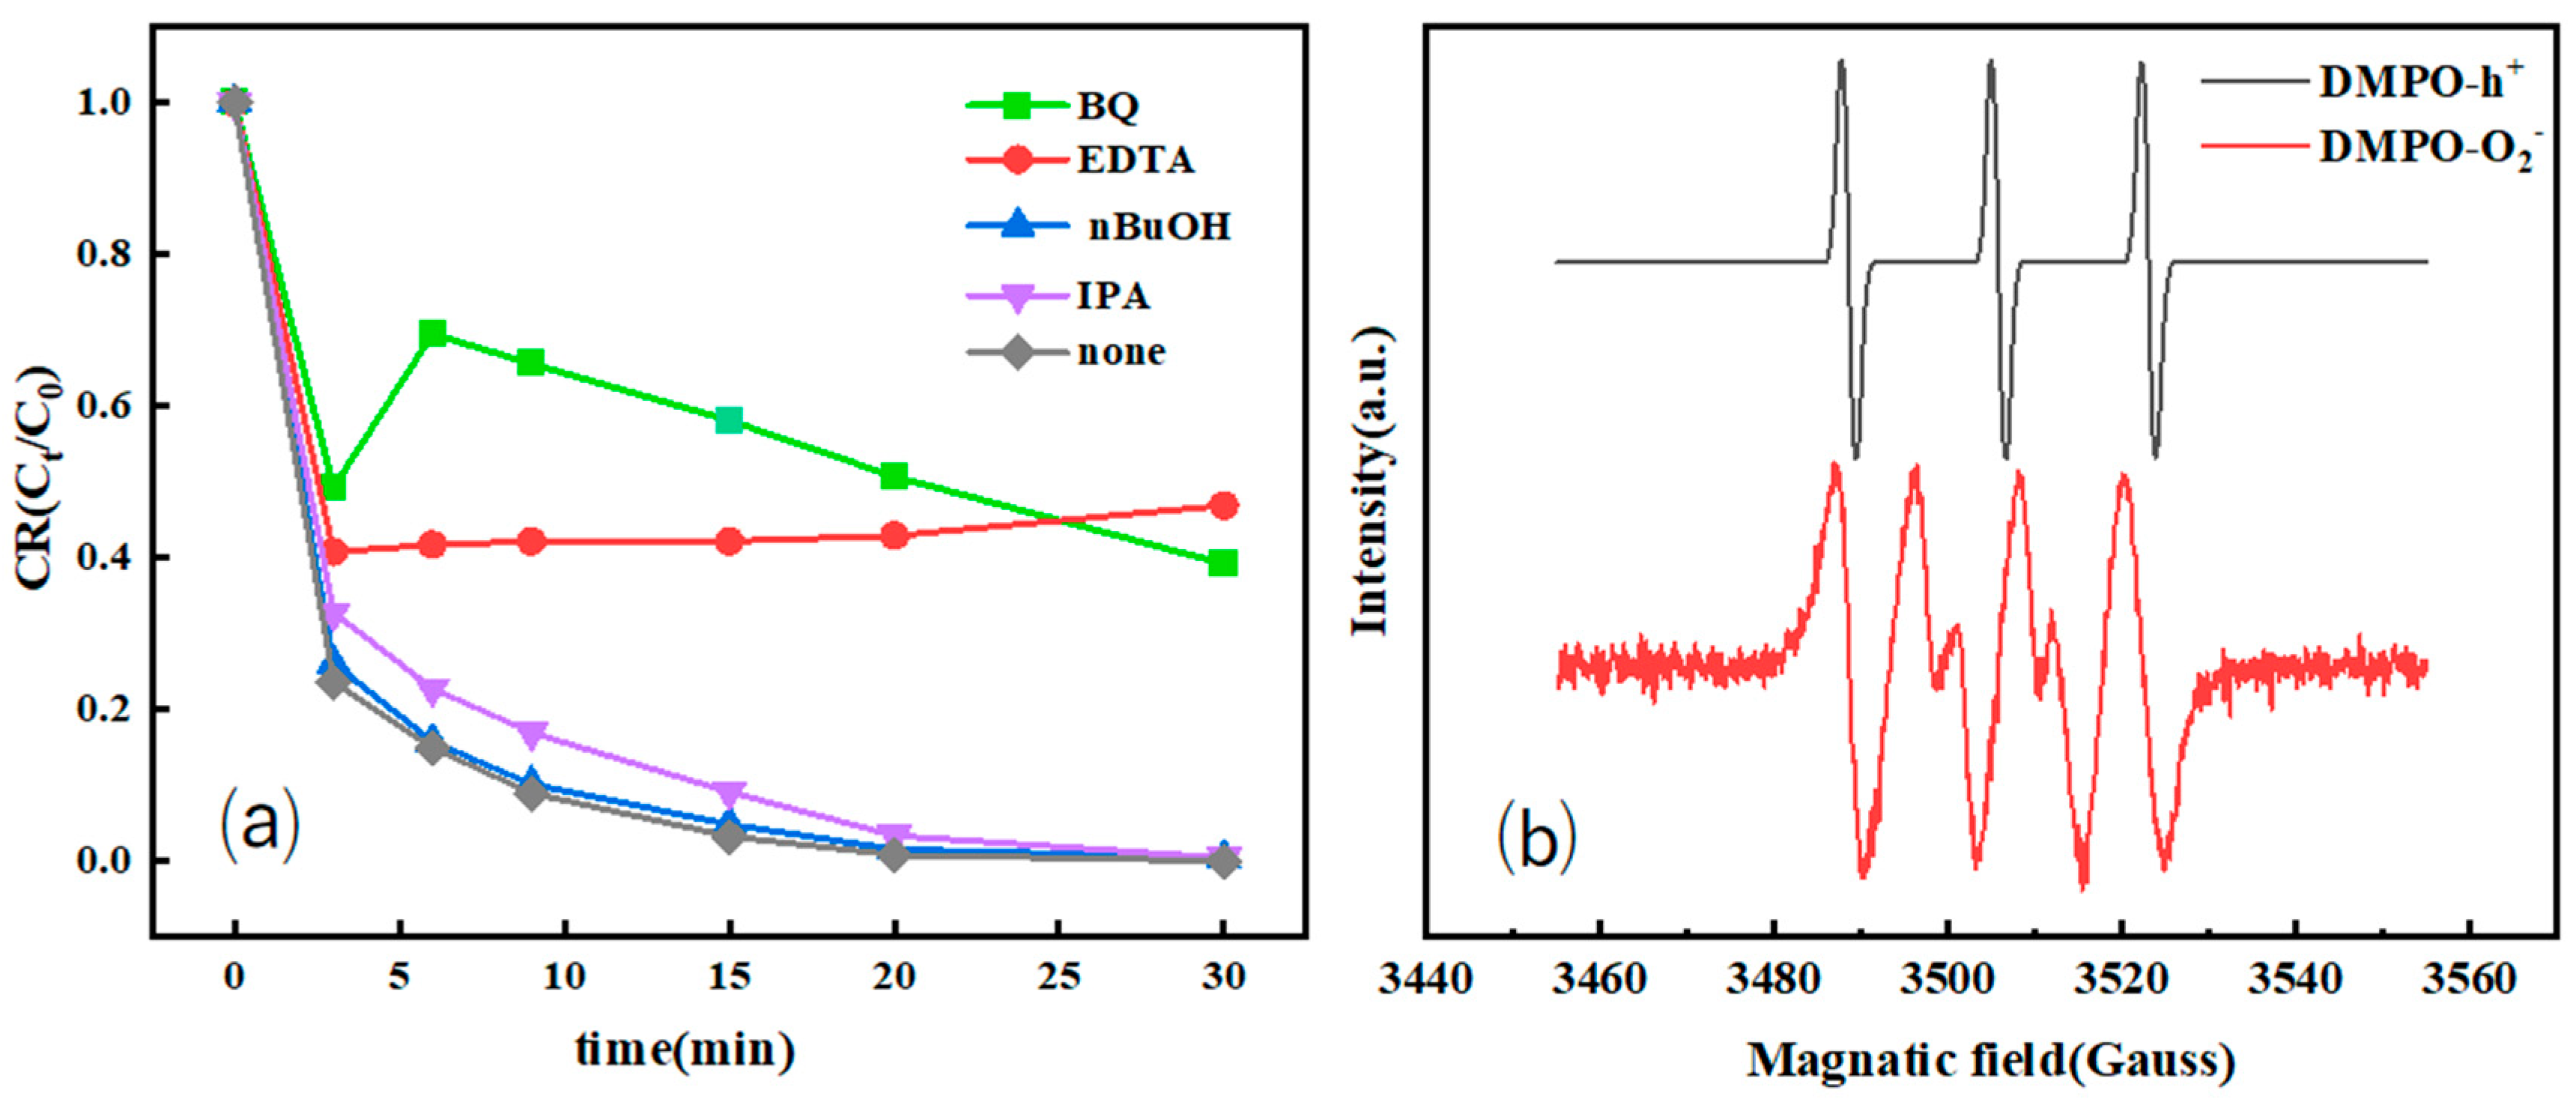
2.3.2. Free-Radical-Trapping Experiments

In the CR solution, fixed amounts (0.1 mol/L) of p-benzoquinone (BQ), ethylenediaminetetraacetic acid disodium salt (EDTA-2Na), n-butanol (nBuOH), and isopropanol (IPA) were added as radical scavengers for superoxide anion radicals (·O2), photogenerated holes (·h+), hydroxyl radicals (·OH), and sulfate radicals (·SO4), respectively. This was conducted to capture the superoxide radicals ·O2, ·h+, ·OH, and ·SO4, which were produced during the photochemical reaction process. The remaining operations followed the steps of the photocatalytic degradation experiment.

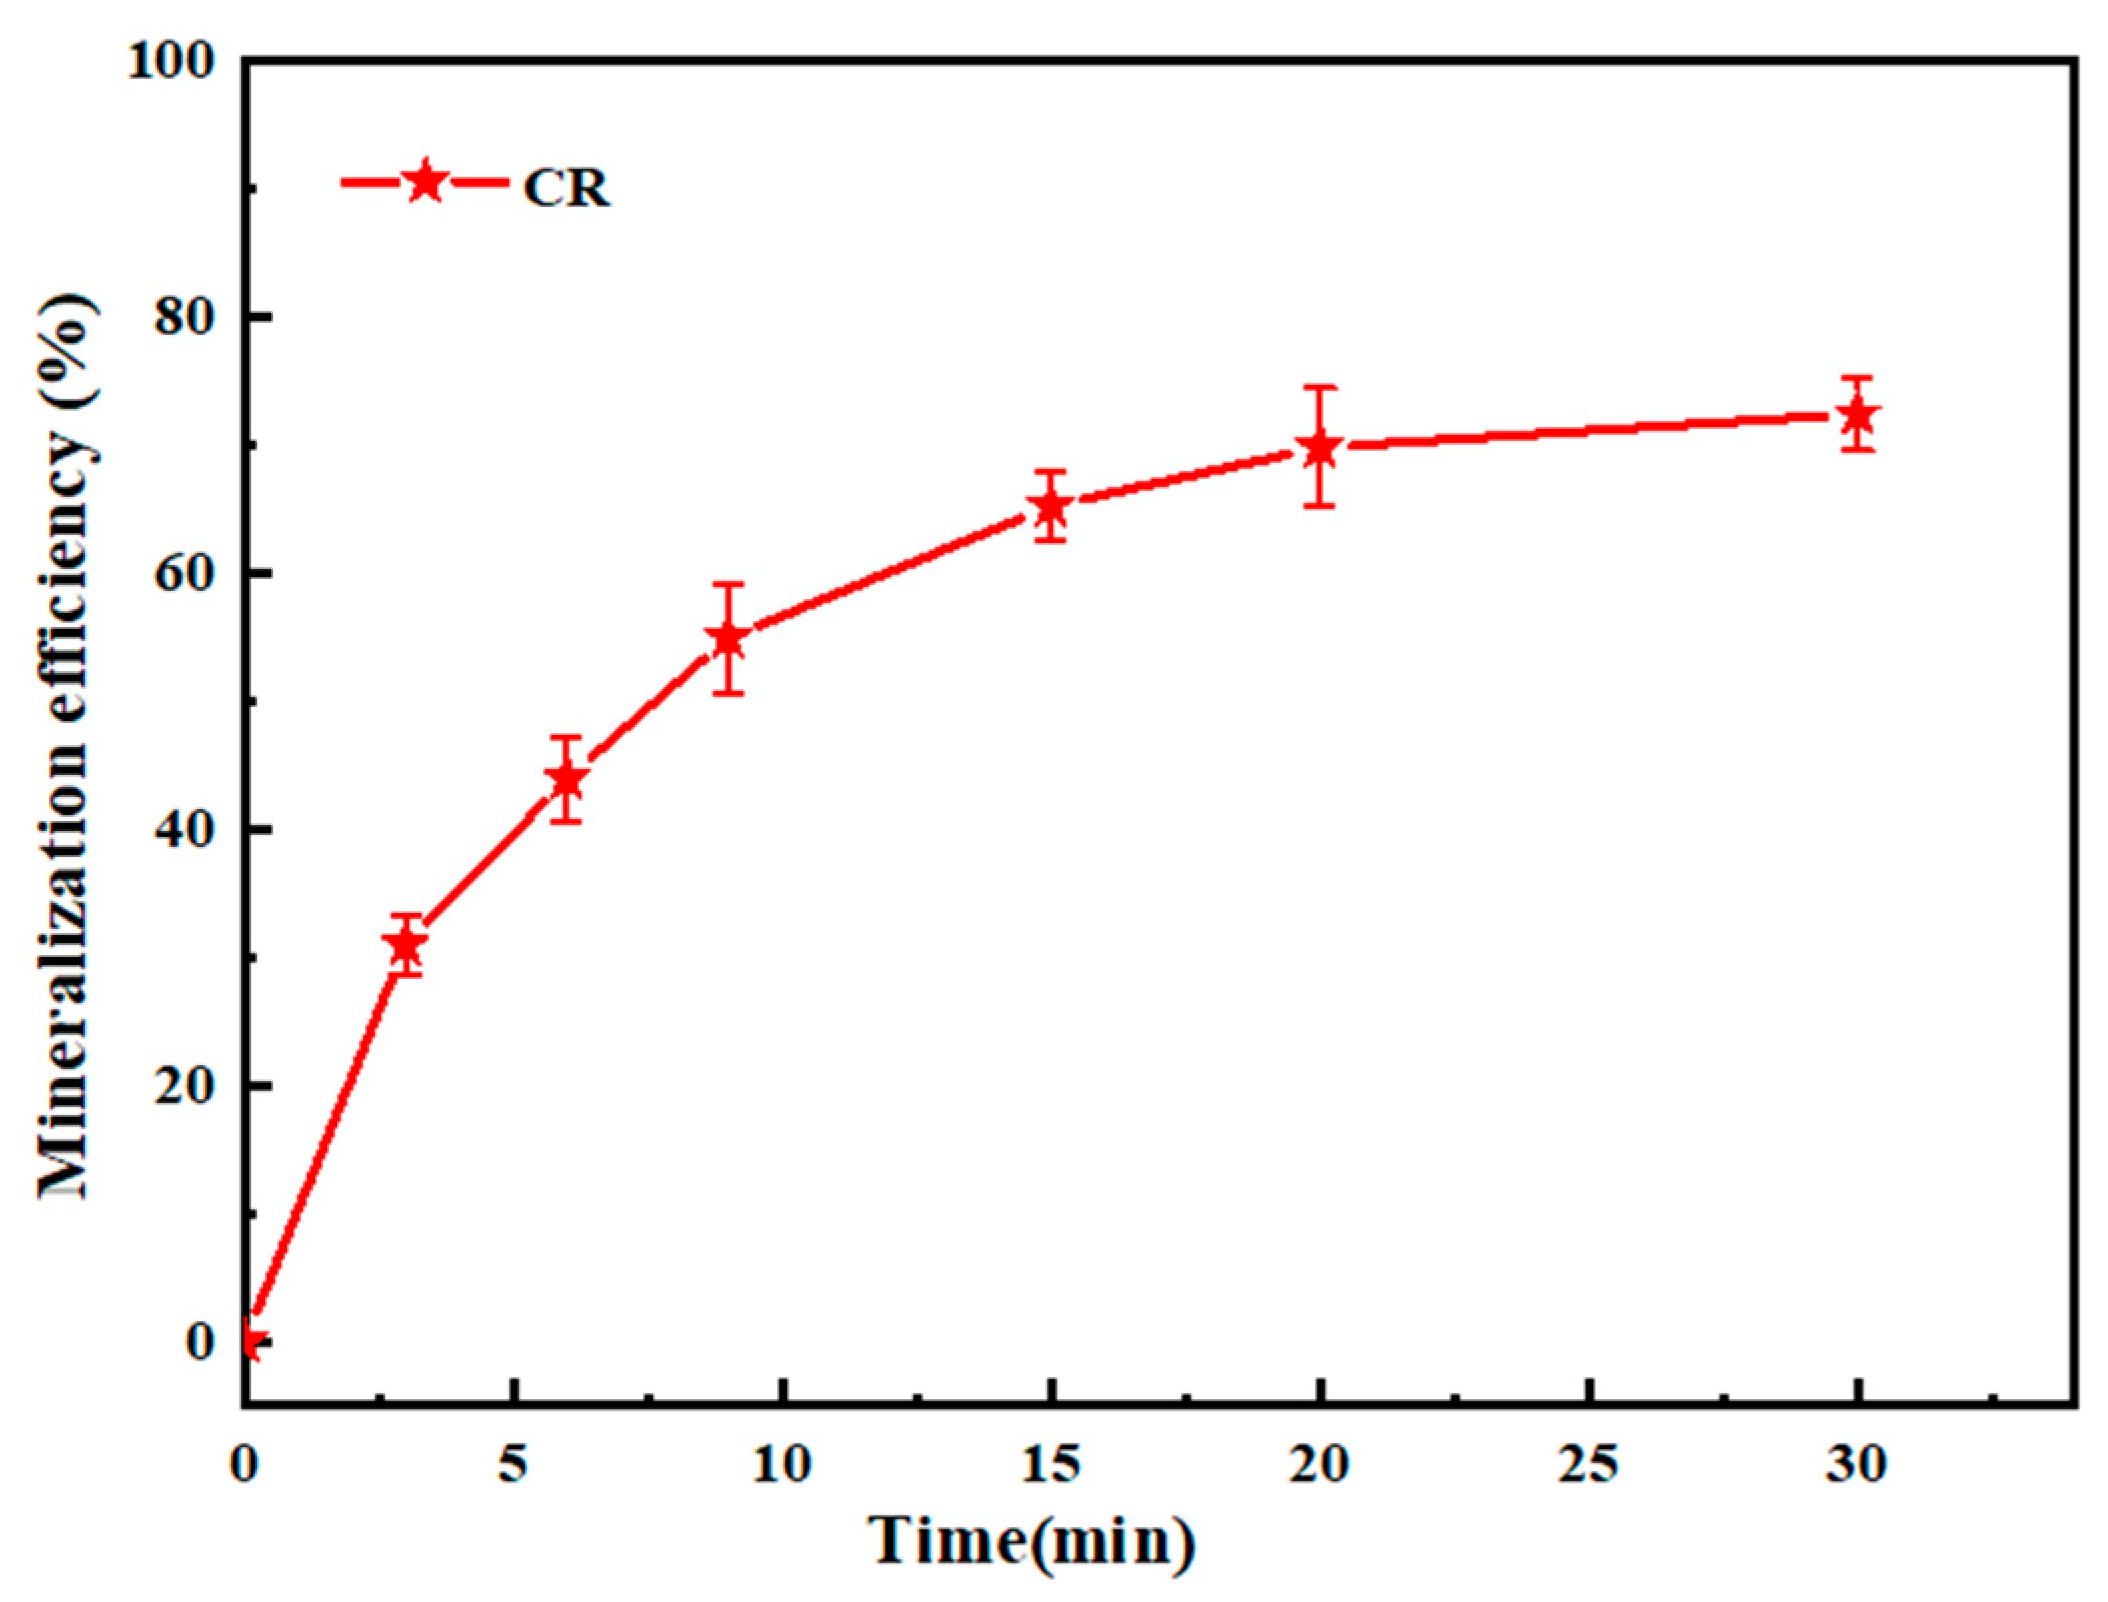
2.3.3. Total Organic Carbon (TOC) Determination and Mineralization Rate Assessment

The TOC contents of the system before and after the reaction were determined using a Shimadzu TOC-L analyzer, and the mineralization rate was calculated using the difference method. A 10 mL CR degradation solution was filtered through a 0.45 μm filter membrane, and a standard curve was established using potassium hydrogen phthalate as the standard substance. Each sample was measured in triplicate, and the average value was taken. The mineralization rate η is calculated as follows:
η = (1 − Ct/C0) × 100%,
where C0 and Ct represent the TOC concentrations of the CR degradation solution at the initial time and at the conclusion of the reaction, respectively.

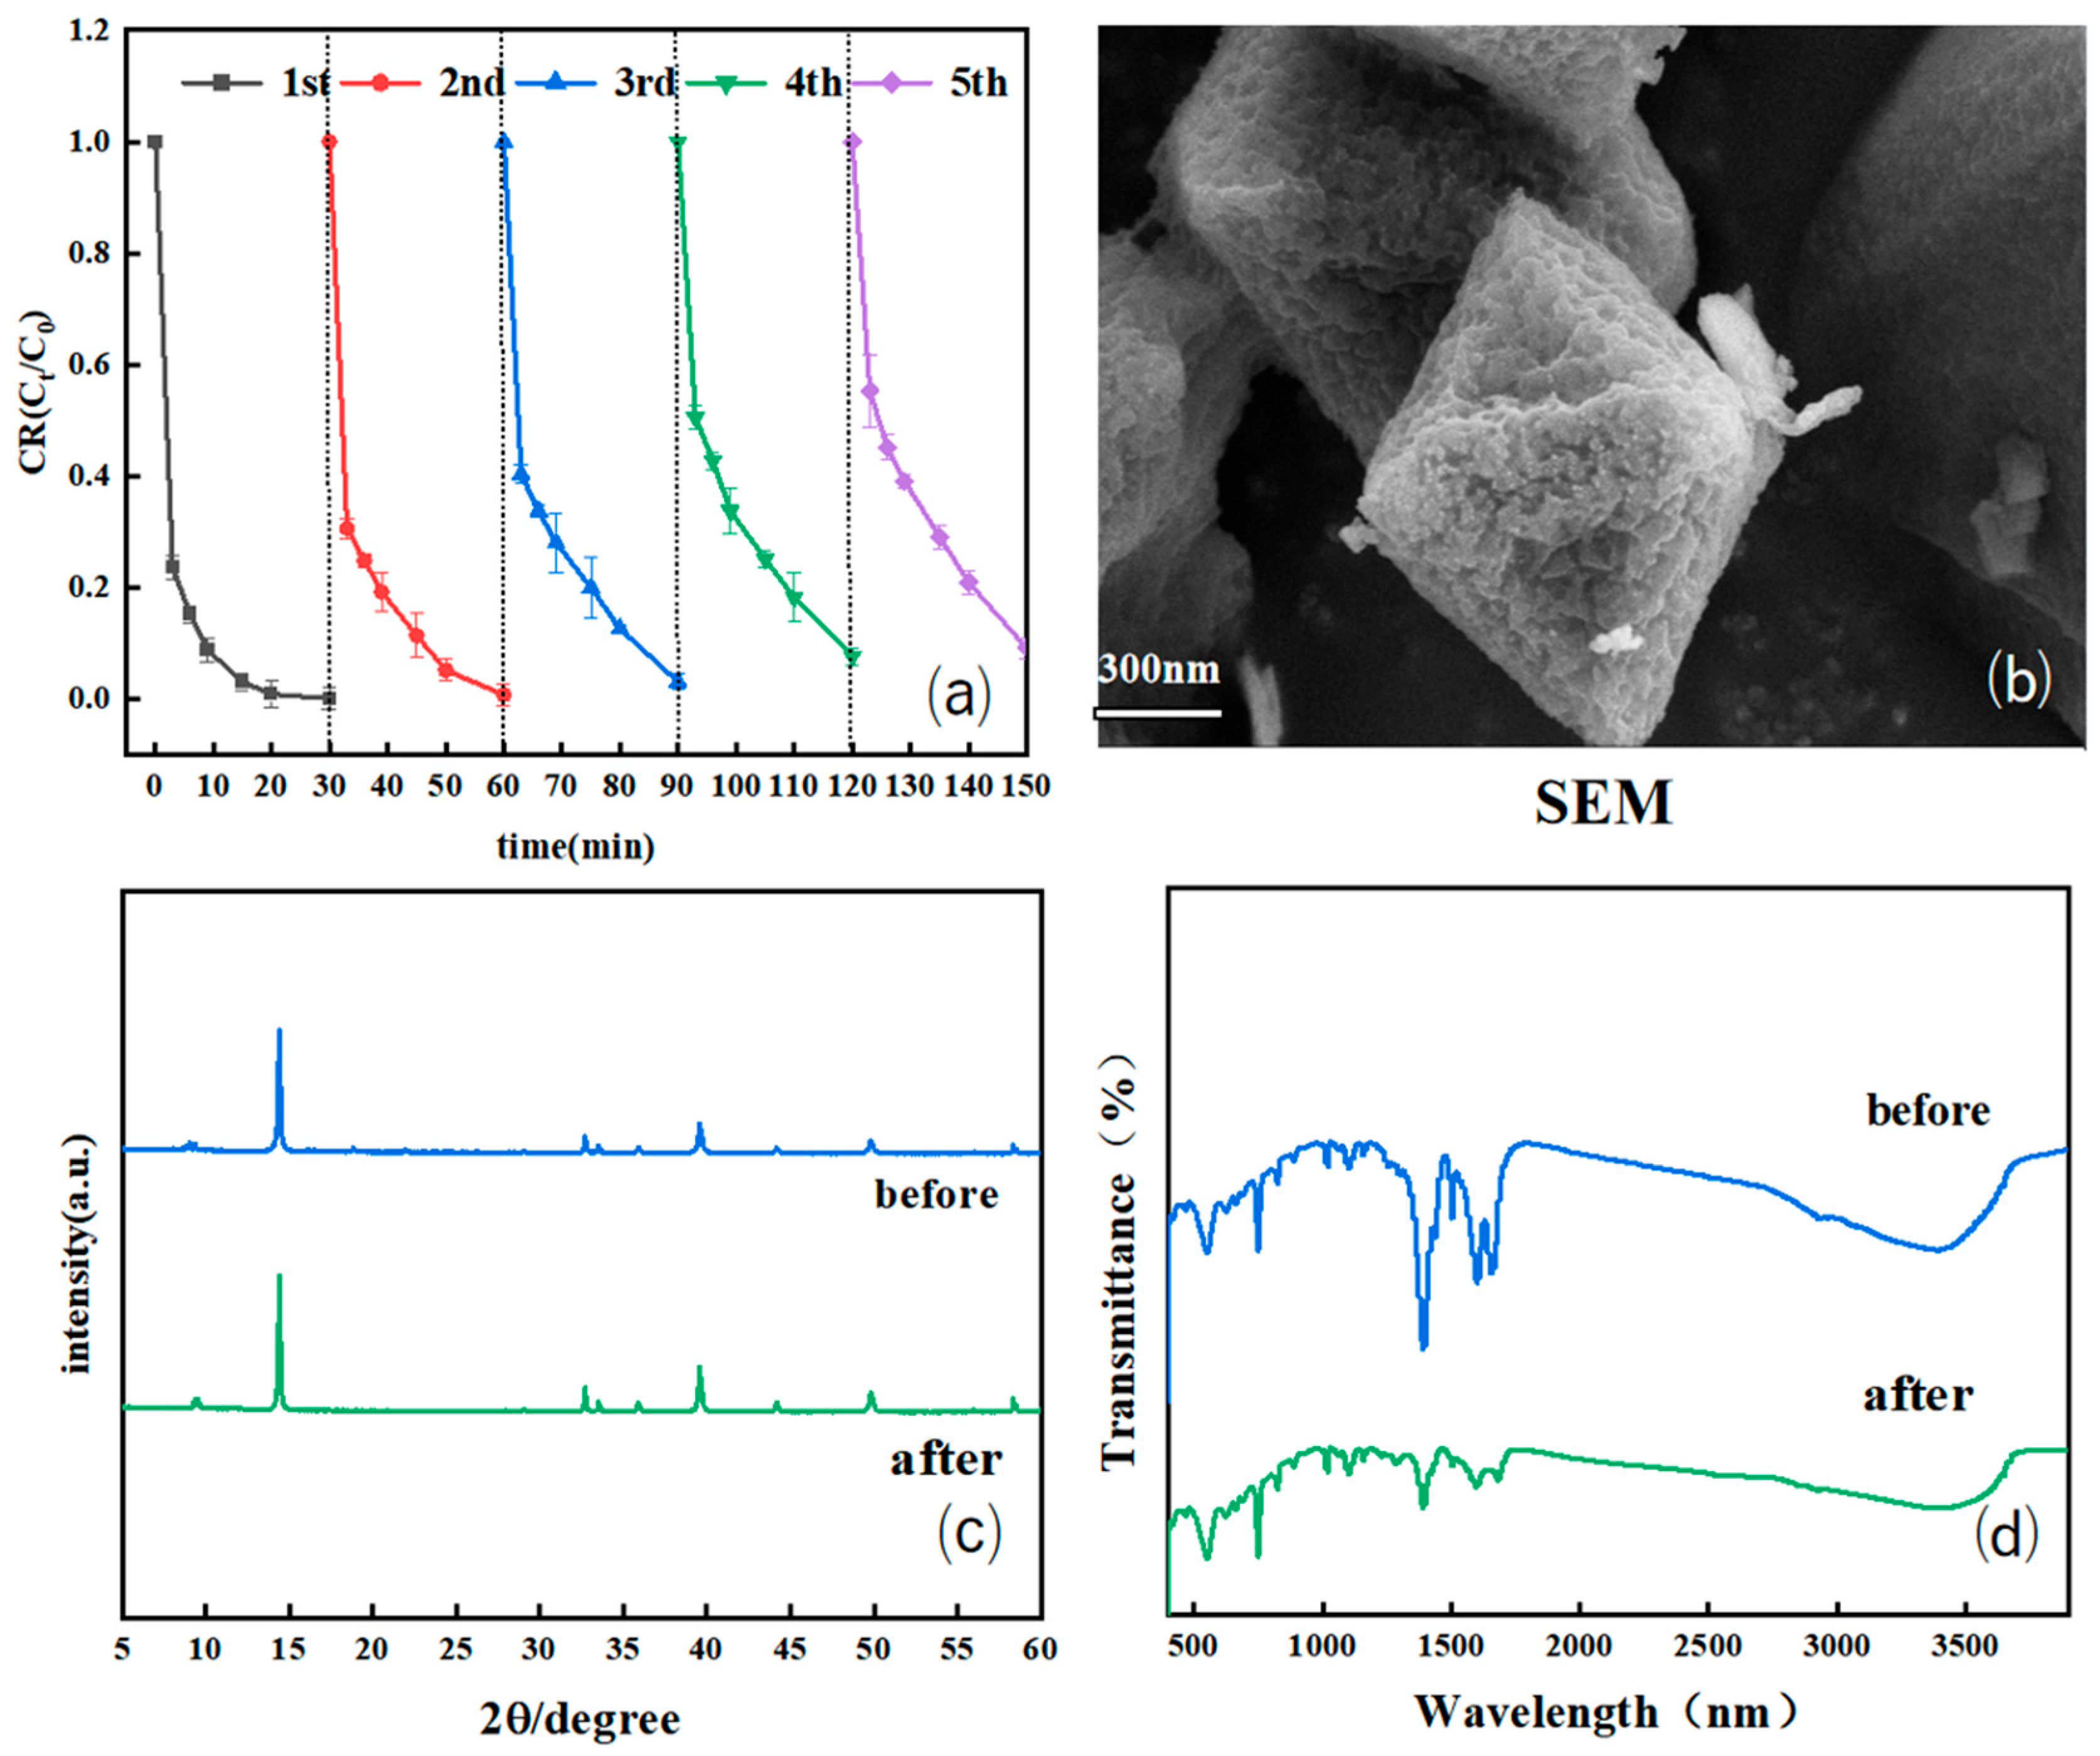
2.3.4. Catalyst Stability and Reproducibility Testing

The stability of the catalyst was evaluated through five cycles of experimental tests. Following each degradation experiment, the suspension was centrifuged at 3000 r/min for 5 min to recover the catalyst, which was then washed three times with anhydrous ethanol and ultrapure water in sequence. After drying in a vacuum at 60 °C for 8 h, the catalyst was reused. The crystalline phase structure and surface morphology of the catalyst after recycling were characterized using X-ray diffraction (XRD) and scanning electron microscopy (SEM). The repeatability tests were completed under the same experimental conditions.

3. Results and Discussion

3.1. Catalyst Characterization

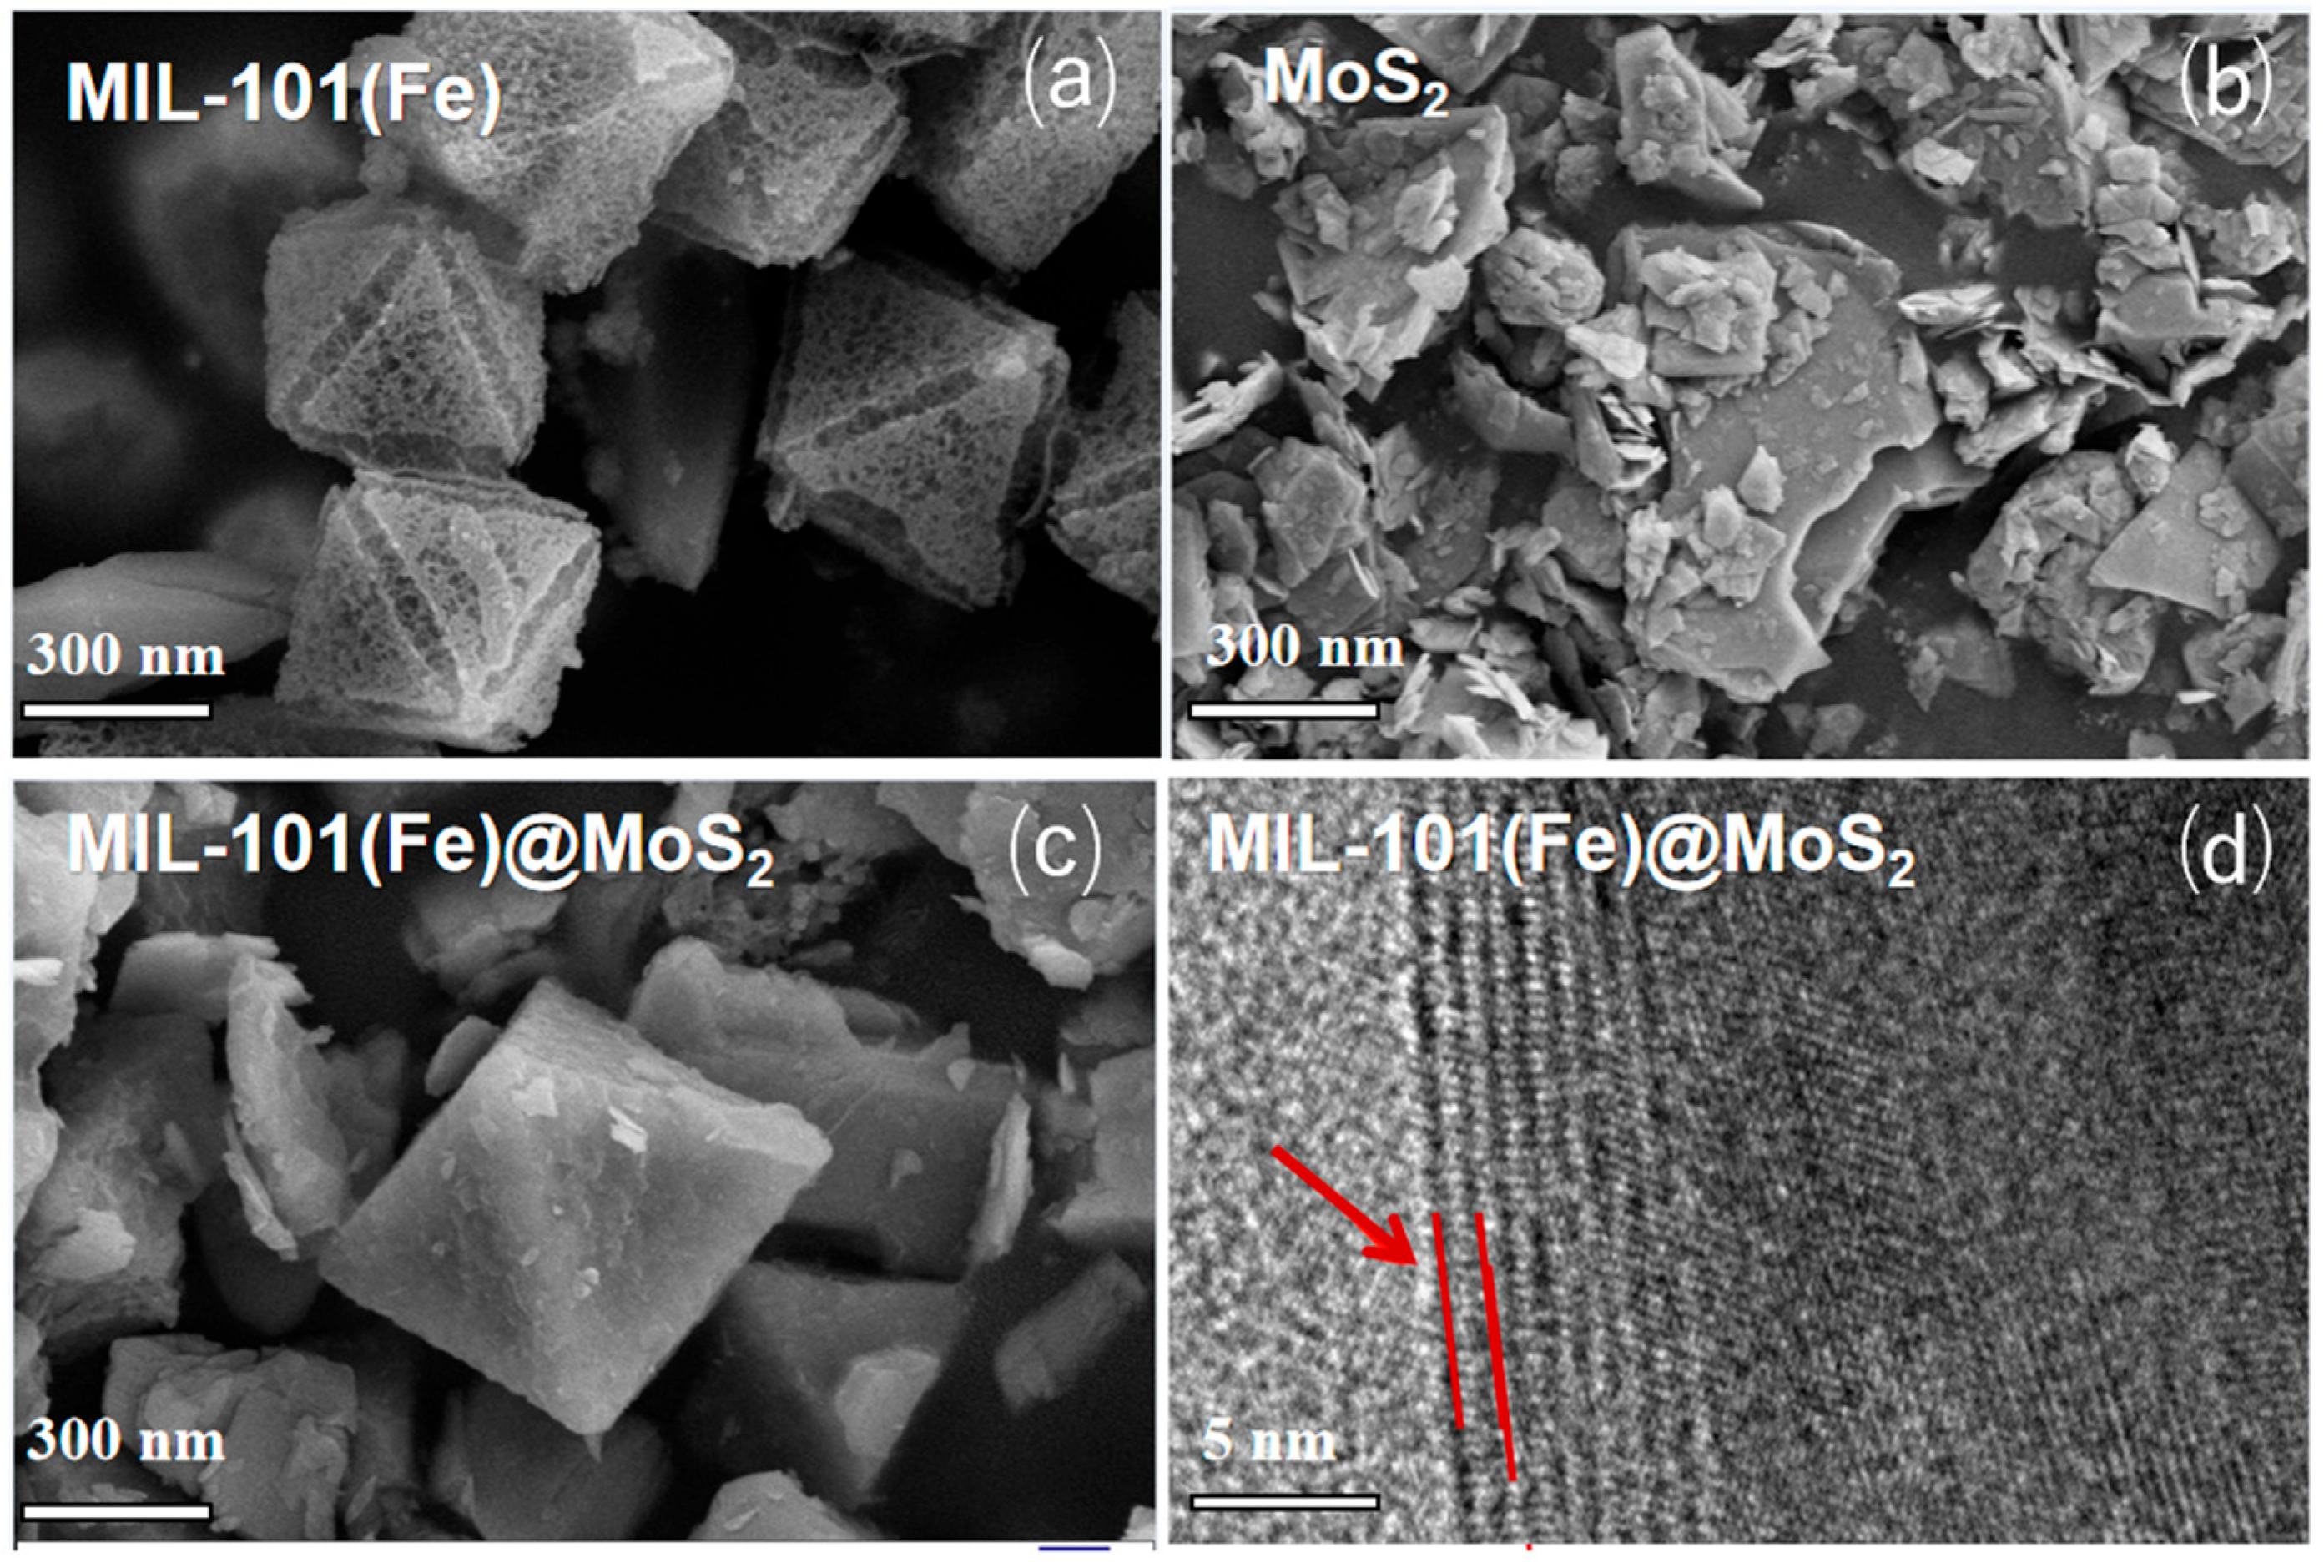
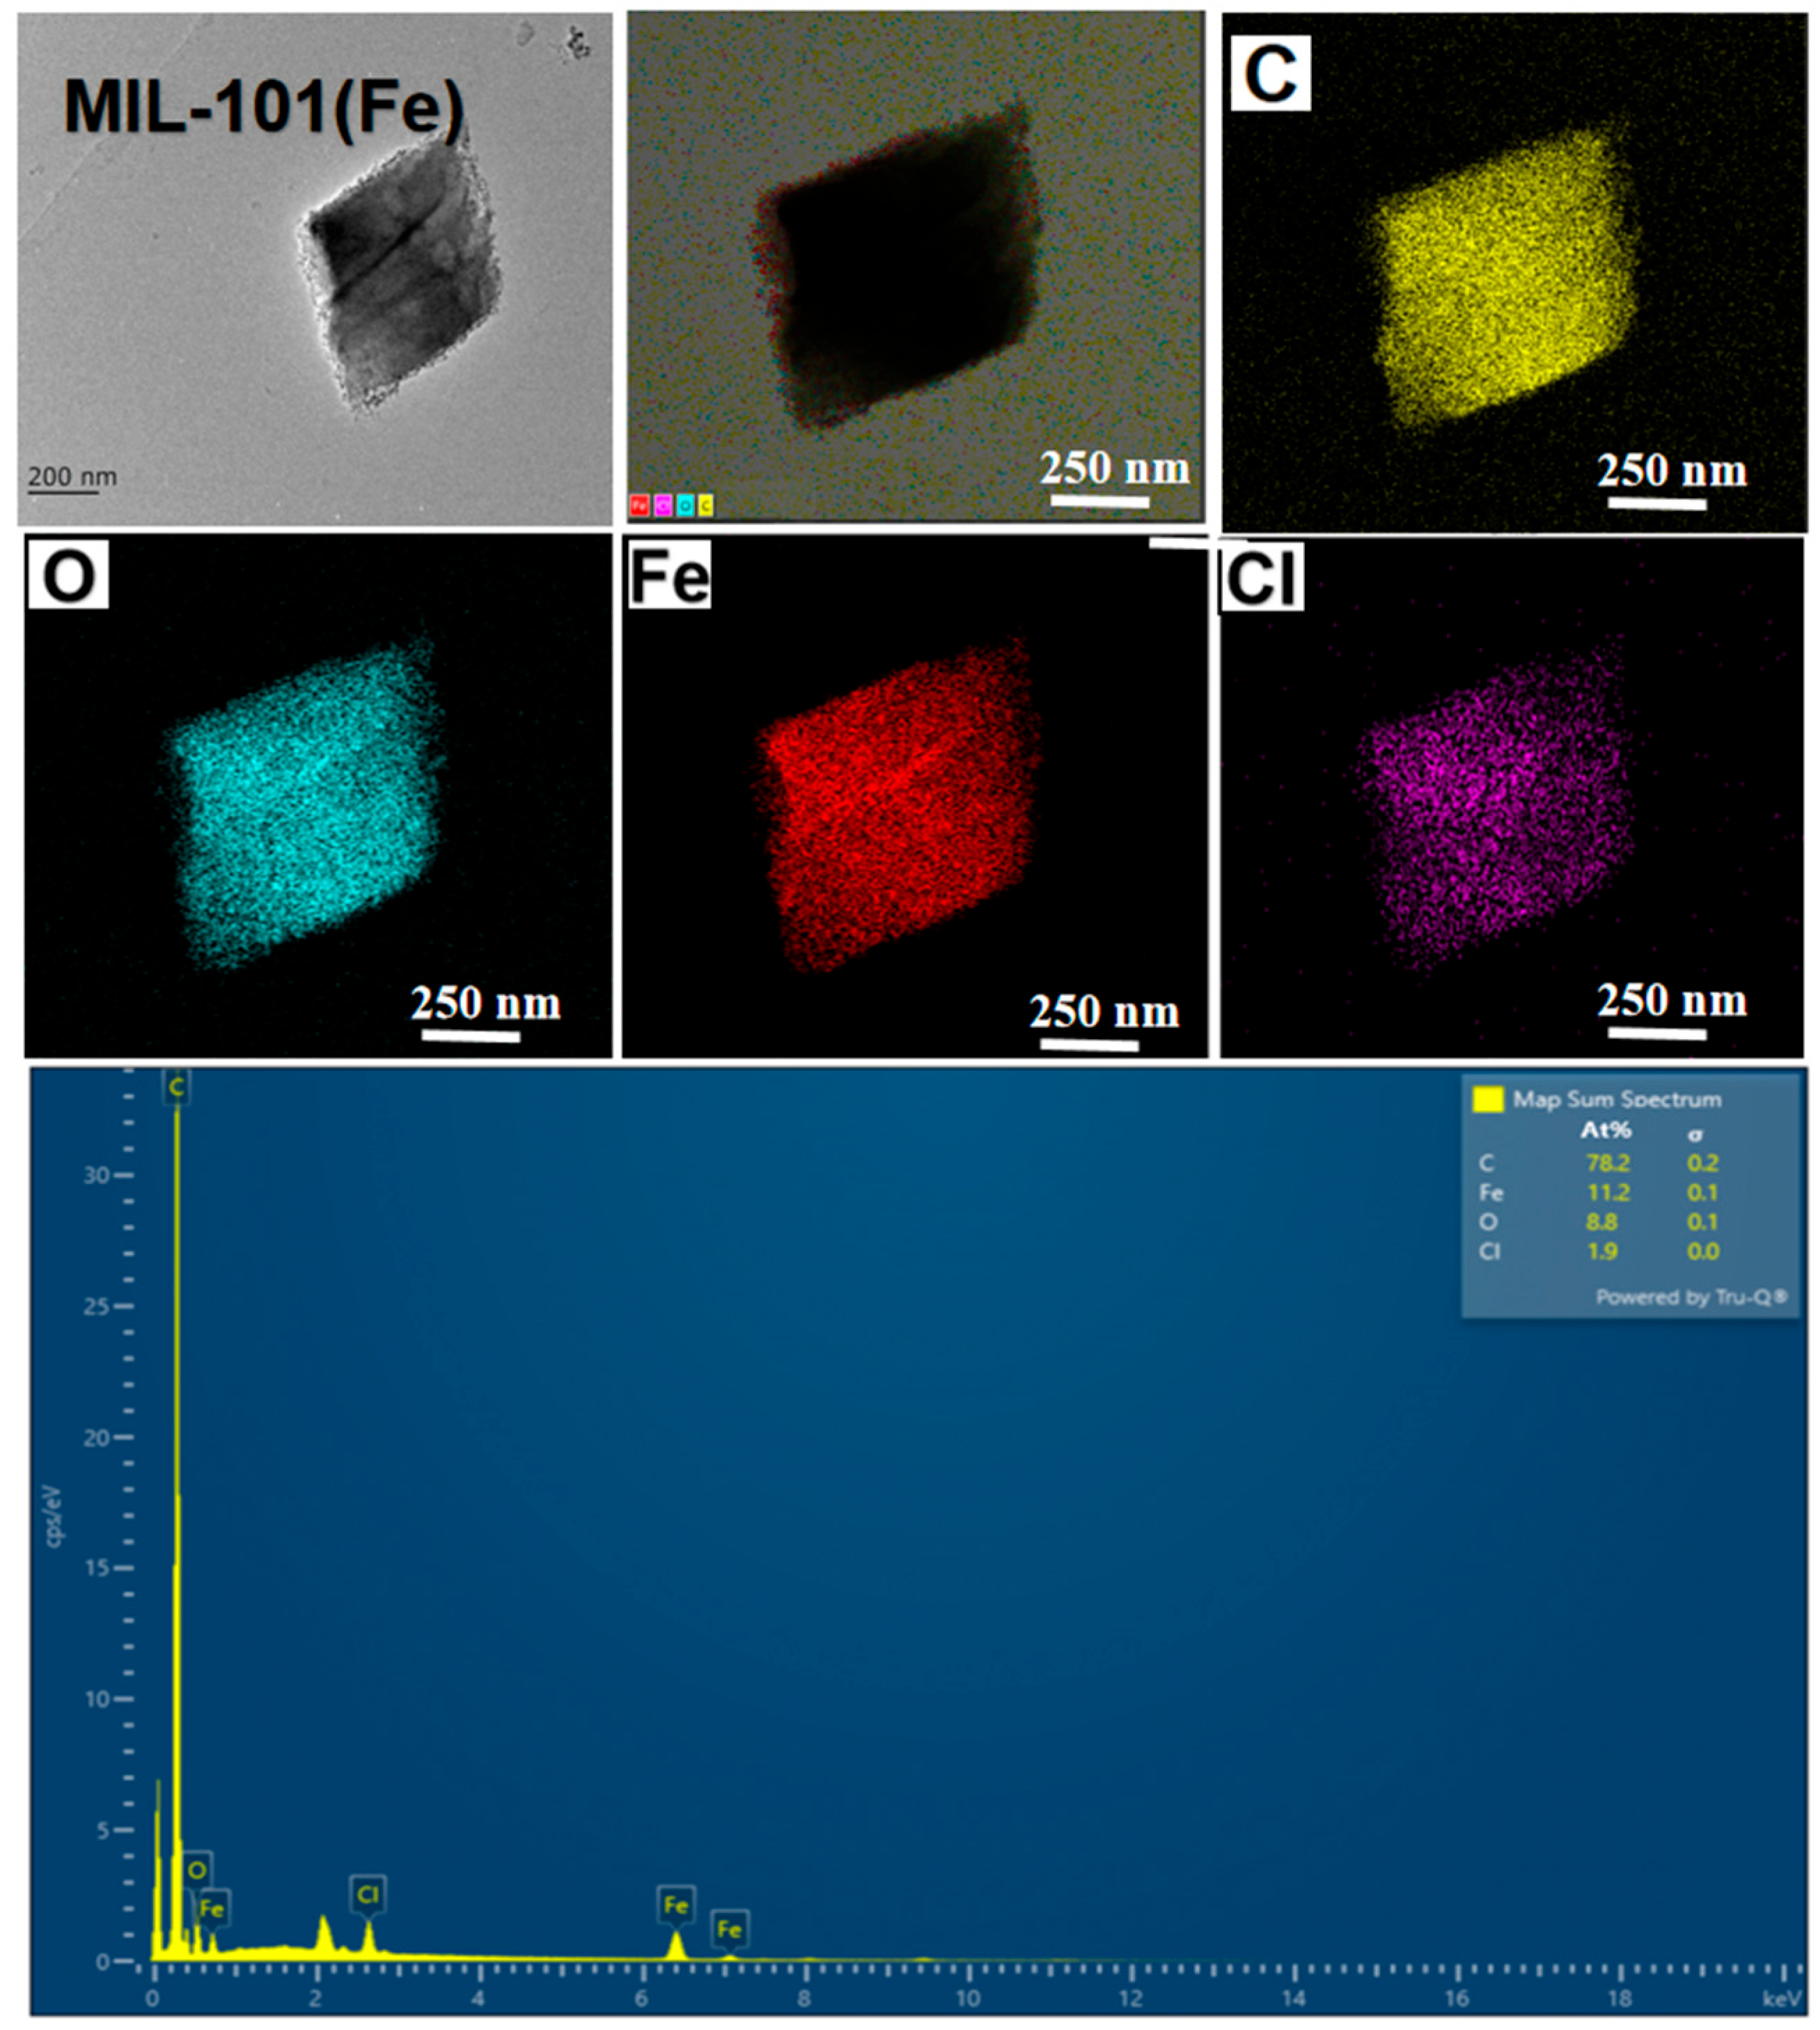
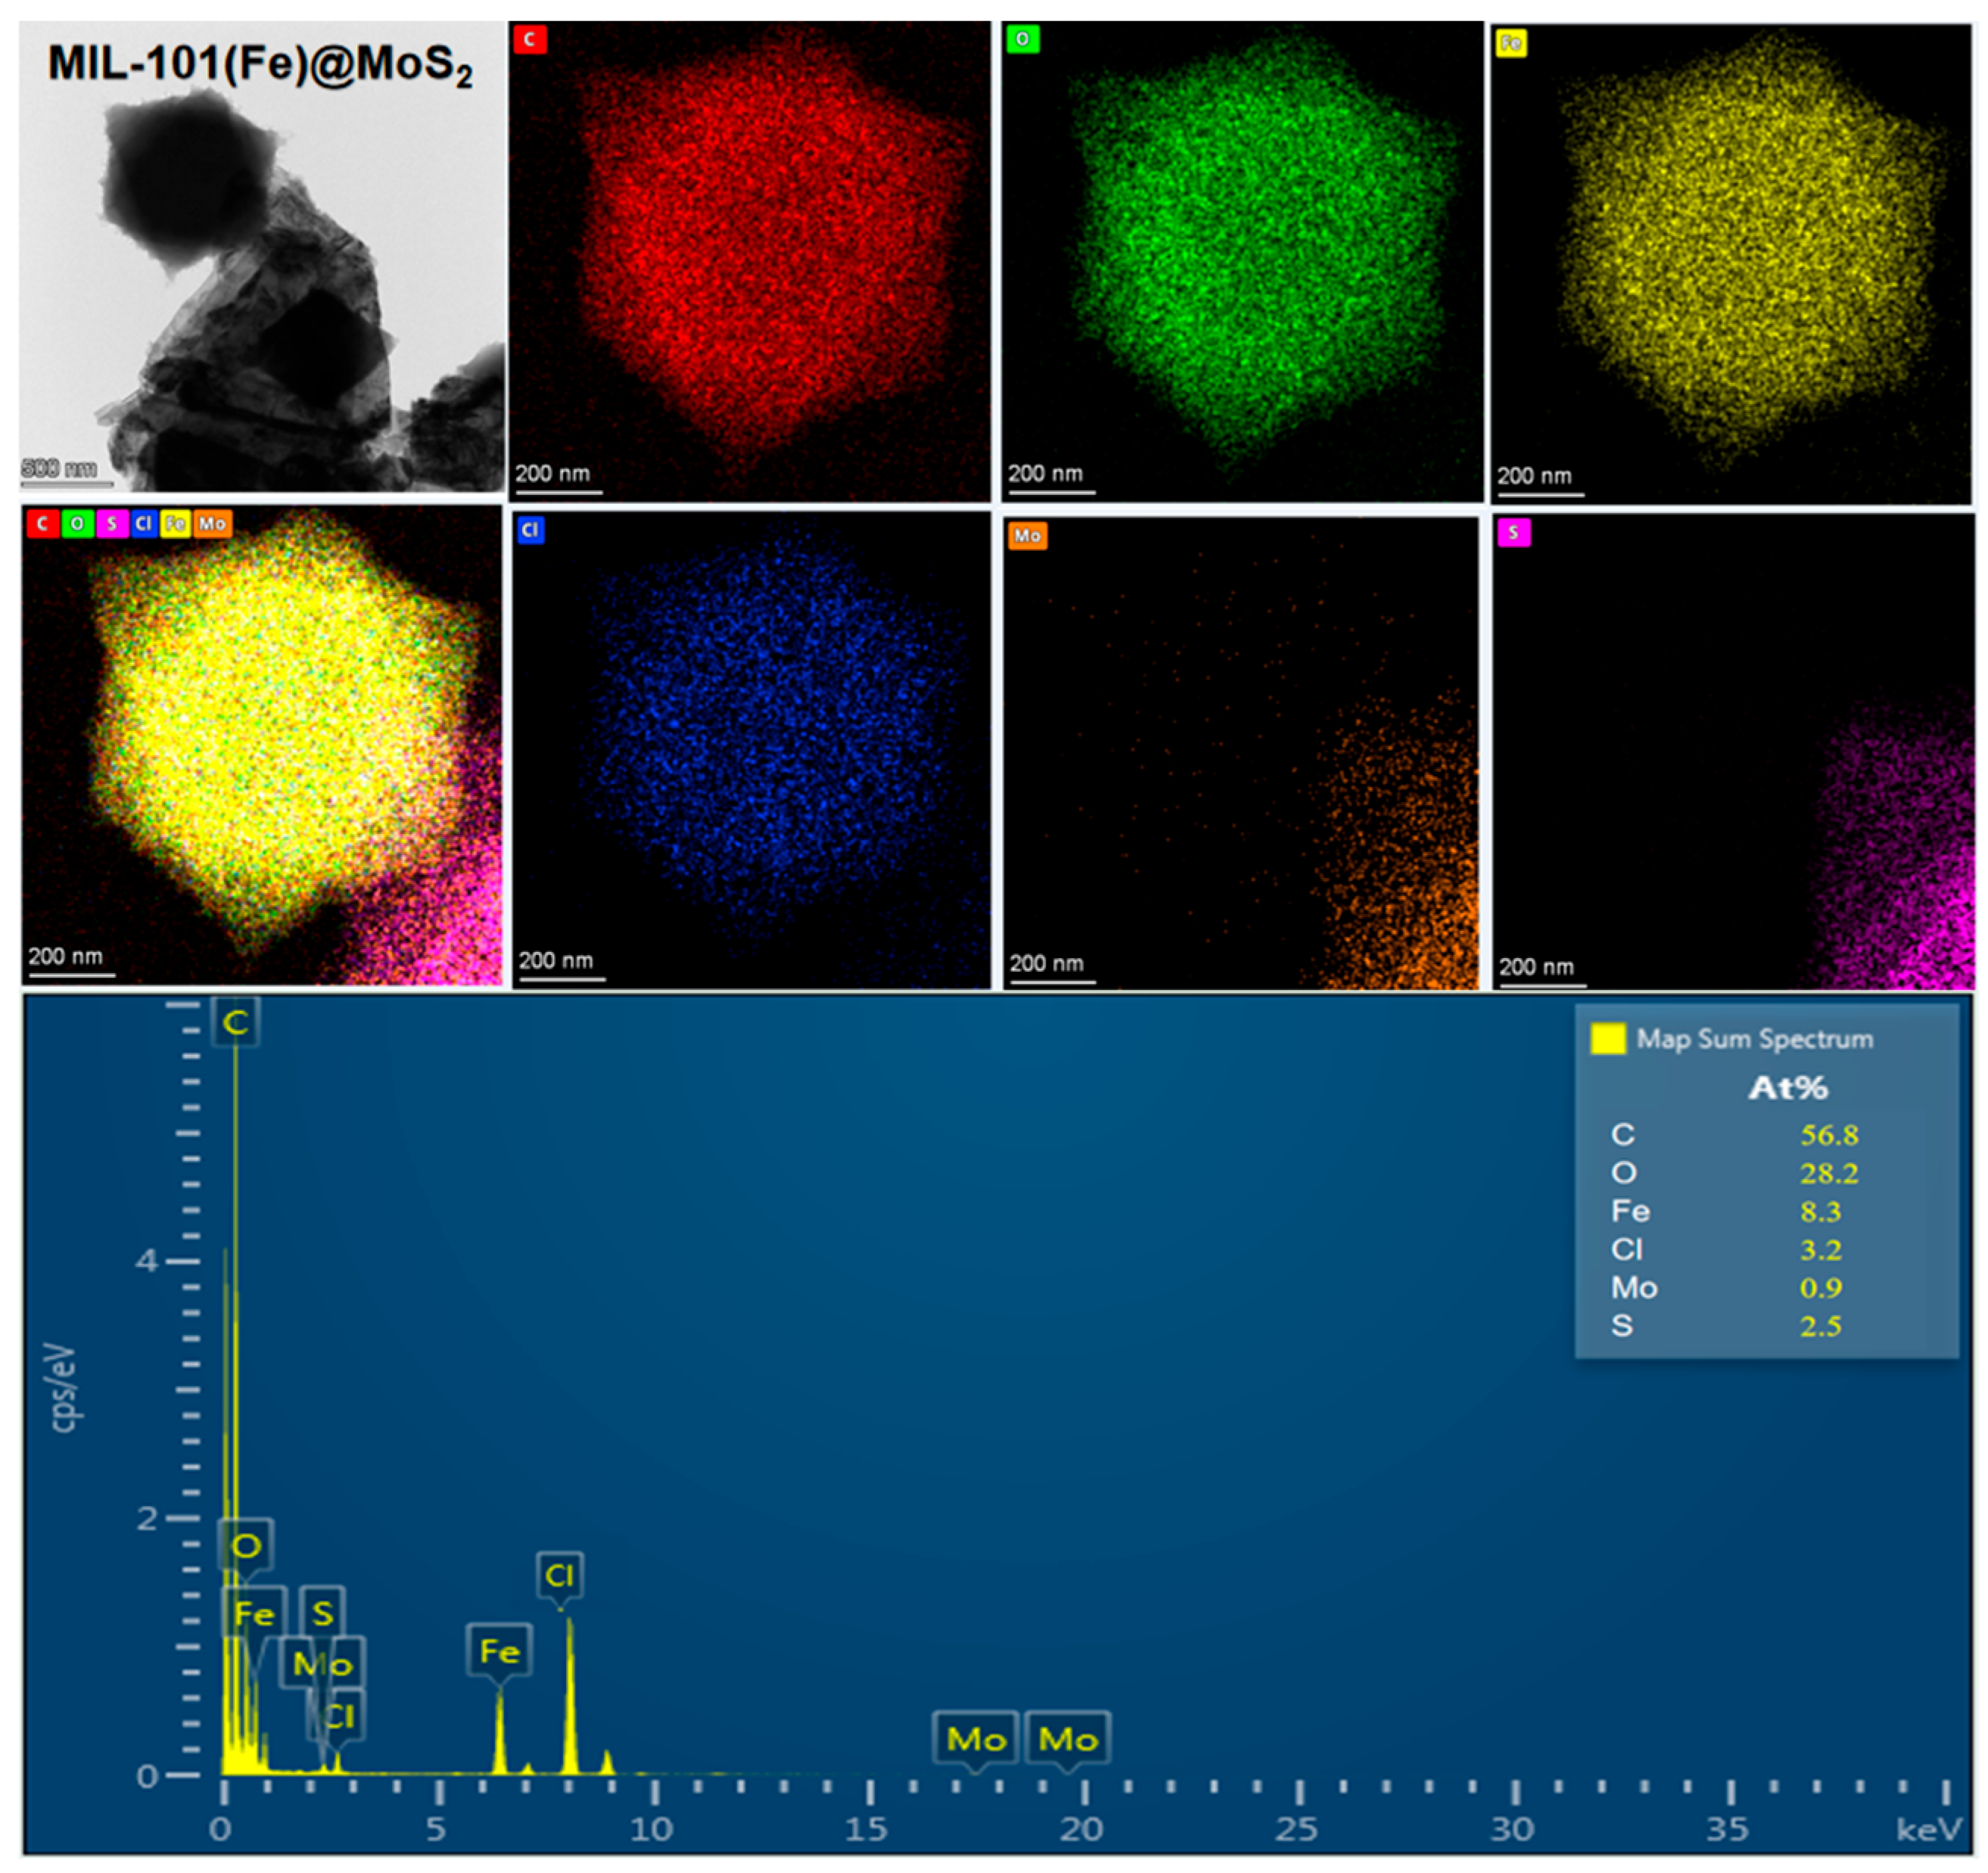
3.1.1. SEM/Energy-Dispersive X-Ray Spectroscopy (EDS) and High-Resolution Transmission Electron Microscopy Analysis

The morphology and microstructures of MIL-101(Fe), MoS2, and the MIL-101(Fe)@MoS2 composite were analyzed using SEM and high-resolution transmission electron microscopy (HRTEM). As shown in Figure 2a, pure MIL-101(Fe) exhibited regular octahedral morphology and a uniform size of approximately 500 nm [34]. Figure 2b depicts the structure of MoS2, which is formed by the stacking and stratification of thin nanosheets with a thickness of 50 nm. After the introduction of MoS2, the MIL-101(Fe)@MoS2 maintained roughly the same shape as the pure MIL-101(Fe), but the surface became rougher (Figure 2c). Furthermore, the diameter of the MIL-101(Fe)@MoS2 became larger compared to that of both MIL-101(Fe) and MoS2, which was attributed to the highly dispersed MIL-101(Fe) in the MoS2 [35]. HRTEM observations revealed that MoS2 was evenly distributed on the surface of the MIL-101(Fe) octahedral morphology (Figure 2d), and the lattice spacing of the MIL-101(Fe)@MoS2 composite reached 0.21 nm, which was consistent with the carbon (001) crystal surface [36], indicating that MoS2 was successfully loaded into the MIL-101(Fe)@MoS2 composite.
Figure 3 and Figure 4 depict the elemental maps of MIL-101(Fe) and MIL-101(Fe)@MoS2, respectively, indicating that the MIL-101(Fe) samples contain Fe, O, C, Cl, Mo, and S elements, where Mo and S are mainly contributed by MoS2. Furthermore, the elemental content obtained through EDS shows that the carbon and oxygen content in MIL-101(Fe)@MoS2 varies significantly with increasing MoS2 loading compared to the original MIL-101(Fe). The above characterization results further confirm the successful synthesis of MIL-101(Fe)@MoS2 composed of MIL-101(Fe) and MoS2.

3.1.2. XRD Analysis

The crystal structure and composition of MIL-101(Fe), MoS2, and MIL-101(Fe)@MoS2 were systematically characterized through XRD analysis. As illustrated in Figure 5, the MIL-101(Fe) samples exhibited distinctive characteristic peaks at 9.38°, 10.66°, 12.67°, 16.52°, 18.86°, and 21.98°, aligning precisely with the reference data from previous studies [37]. Concurrently, the MoS2 sample exhibited six pronounced diffraction peaks at 2θ values of 14.4°, 32.7°, 39.6°, 49.8°, and 58.3°, which corresponded closely to established crystallographic patterns [38]. The sharpness of these peaks further confirmed the material’s exceptional crystalline quality and high structural order.
Notably, the diffraction peak of the MIL-101(Fe)@MoS2 composite had more diffraction peaks characteristic of MoS2, in addition to those of the original MIL-101(Fe) material, and the crystal surfaces were consistent, which confirmed that MoS2 was successfully doped into the composite. The low diffraction peak intensity may have occurred because the prepared MIL-101(Fe)@MoS2 had smaller crystal sizes [39].
Detailed crystallographic analysis revealed that the four attenuated diffraction peaks of MoS2 at 2θ = 14.4°, 32.7°, 39.6°, 49.8°, and 58.3° corresponded to the (002), (100), (103), (105), and (110) planes (PDF#77–1716), respectively. The diffraction profile of MIL-101(Fe) exhibited perfect consistency with the simulated patterns (CCDC No. 605510) [40], further validating the structural integrity of the synthesized materials.
Based on the XRD data (Figure 5), this study applied the Debye–Scherrer formula to analyze the full width at half maximum of the characteristic diffraction peaks for MIL-101(Fe), MoS2, and MIL-101(Fe)@MoS2 composites to calculate the average grain size. The formula is as follows:
D = k λ β cos θ
where k = 0.89 (the Scherrer constant), λ = 0.15406 nm (the Cu-Kα radiation wavelength), β is the half-width of the diffraction peak in radians, and θ is the Bragg angle.
Based on the calculation results, the average grain size of MIL-101(Fe) was 91.6 nm, which differed from the regular octahedral morphology observed using SEM (~500 nm), indicating its polycrystalline structure. The average grain size of MIL-101(Fe)@MoS2 was 63.5 nm. However, the particle size distribution image (Figure 5b) revealed an average particle size of approximately 741.95 ± 16.88 nm. This anomaly may originate from the Scherrer method of XRD, which can only measure the size of individual grains and cannot reflect the grain size distribution or agglomeration effects. The larger particle size observed by the SEM discrepancies arises from agglomeration, lattice strain, and measurement limitations compared to pure MIL-101(Fe) [41]. The grain size of MIL-101(Fe) in the composite material was significantly reduced, and the smaller grain size and the close contact between the two phases contributed to the enhanced catalytic efficiency of the photo-Fenton reaction [42].

3.1.3. Fourier Transform Infrared (FT-IR) Spectroscopy Analysis

The functional groups and bonds of MIL-101(Fe), MIL-101, and MIL-101(Fe)@MoS2 were studied using FT-IR spectroscopy. As shown in Figure 6, the characteristic peaks of the MIL-101(Fe)@MoS2 sample almost matched the typical vibration modes of the original MIL-101(Fe), indicating that the introduction of MoS2 did not alter the structural characteristics of MIL-101(Fe). The broad peak centered at 3440 cm−1 may be related to the O-H longitudinal tensile vibration of the adsorbed water molecules. The narrow peak at 550 cm−1 corresponds to the stretching vibration of the Fe-O bonds arising from the coordination between Fe3+ and the carbohydrate group (-COO) of the ligated carbolic acid. The sharp peak at 1660 cm−1 corresponds to the C=C aromatic ring stretching vibrations from the benzene backbone of the ligated BDC, as reported in the FT-IR features of MIL-101(Fe) [43] and the bending vibration of the H-O-H in water molecules. Meanwhile, the weak absorption at 748 cm−1 originates from out-of-plane bending vibrations of the C-H bonds in the mono-/institutionalized benzene ring, further confirming the gangland’s structural integrity. The prominent peaks at 1600 cm−1 and 1390 cm−1 are assigned to the asymmetric and symmetric stretching vibrations of the carbohydrate groups (-COO), respectively, which are characteristic of the encephalitic acid ligated in MIL-101(Fe). This dual-peak signature confirms the deprecation and coordination of carbohydrate groups to Fe3+ centers [44]. In the low-frequency region, the distinct peak at 550 cm−1 is attributed to Fe-O stretching vibrations [45], reflecting the coordination interaction between Fe3+ ions and carbohydrate oxygen atoms. Notably, the intensity of peaks associated with O-H (3440 cm−1), C=C (1660 cm−1), and carbohydrate groups (1600/1390 cm−1) are significantly enhanced in the MIL-101(Fe)@MS2 composite compared to pristine MIL-101(Fe).

3.2. Analysis of the Photocatalytic Properties

The experiment employed the single-factor experimental design. MoS2 was doped into MIL-101(Fe) at mass percentages of 0%, 6%, 12%, and 24% to study its effect on catalytic activity, and 30% H2O2 was added in volumes ranging from 0 to 6 mL to determine the optimal oxidant concentration. Initial CR concentrations (50–200 mg/L) were tested to evaluate the system’s capacity under high pollutant loads. The pH was adjusted (3–11) to assess the catalyst’s pH adaptability.

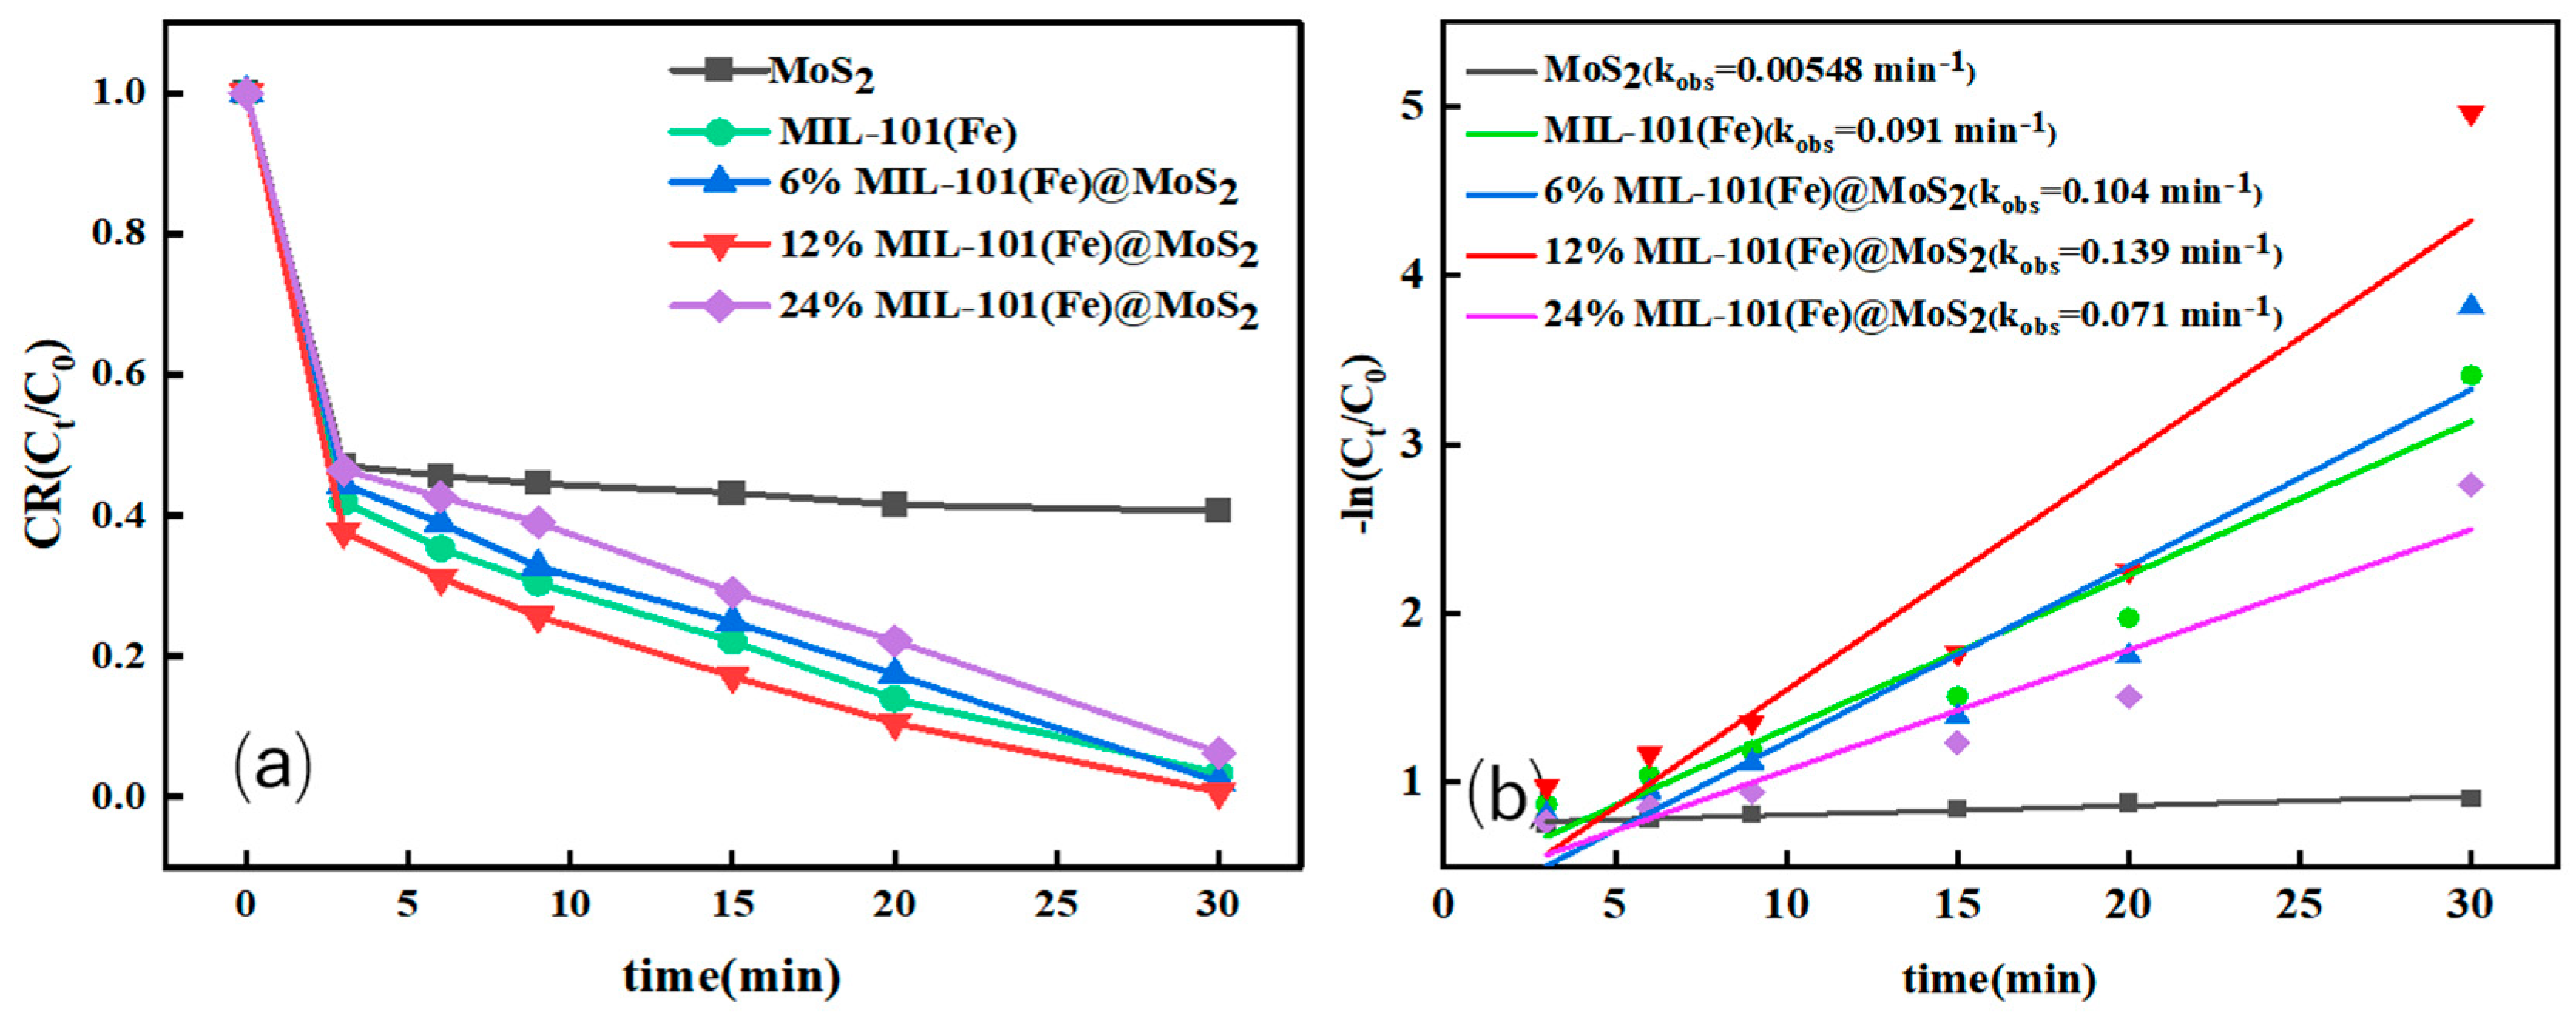
3.2.1. The Effect of Different MoS2 Doping Ratios on the Degradation Efficiency

Figure 7a shows the effect of different MoS2 doping ratios on the degradation efficiency of MIL-101(Fe)@MoS2, with the initial CR concentration at 100 mg/L and H2O2 at 1 mL. The degradation rates of CR by MIL-101(Fe), MoS2, and MIL-101(Fe)@MoS2 were initially very high, with CR degradation occurring within 30 min. Among the different composites, MIL-101(Fe)@MoS2 with a 12% MoS2 mass ratio exhibited the optimal removal rate.
The experimental data was fitted using the pseudo-first-order model to further study the photocatalytic degradation process, with the results shown in Figure 7b. The rate constant (kobs) for MoS2, MIL-101(Fe), 6% MIL-101(Fe)@MoS2, 12% MIL-101(Fe)@MoS2, and 24% MIL-101(Fe)@MoS2 were 0.00548, 0.091, 0.104, 0.139, and 0.071 min−1, respectively. Among these, the 12% MoS2 doping ratio of 12% MIL-101(Fe)@MoS2 had the fastest degradation rate.

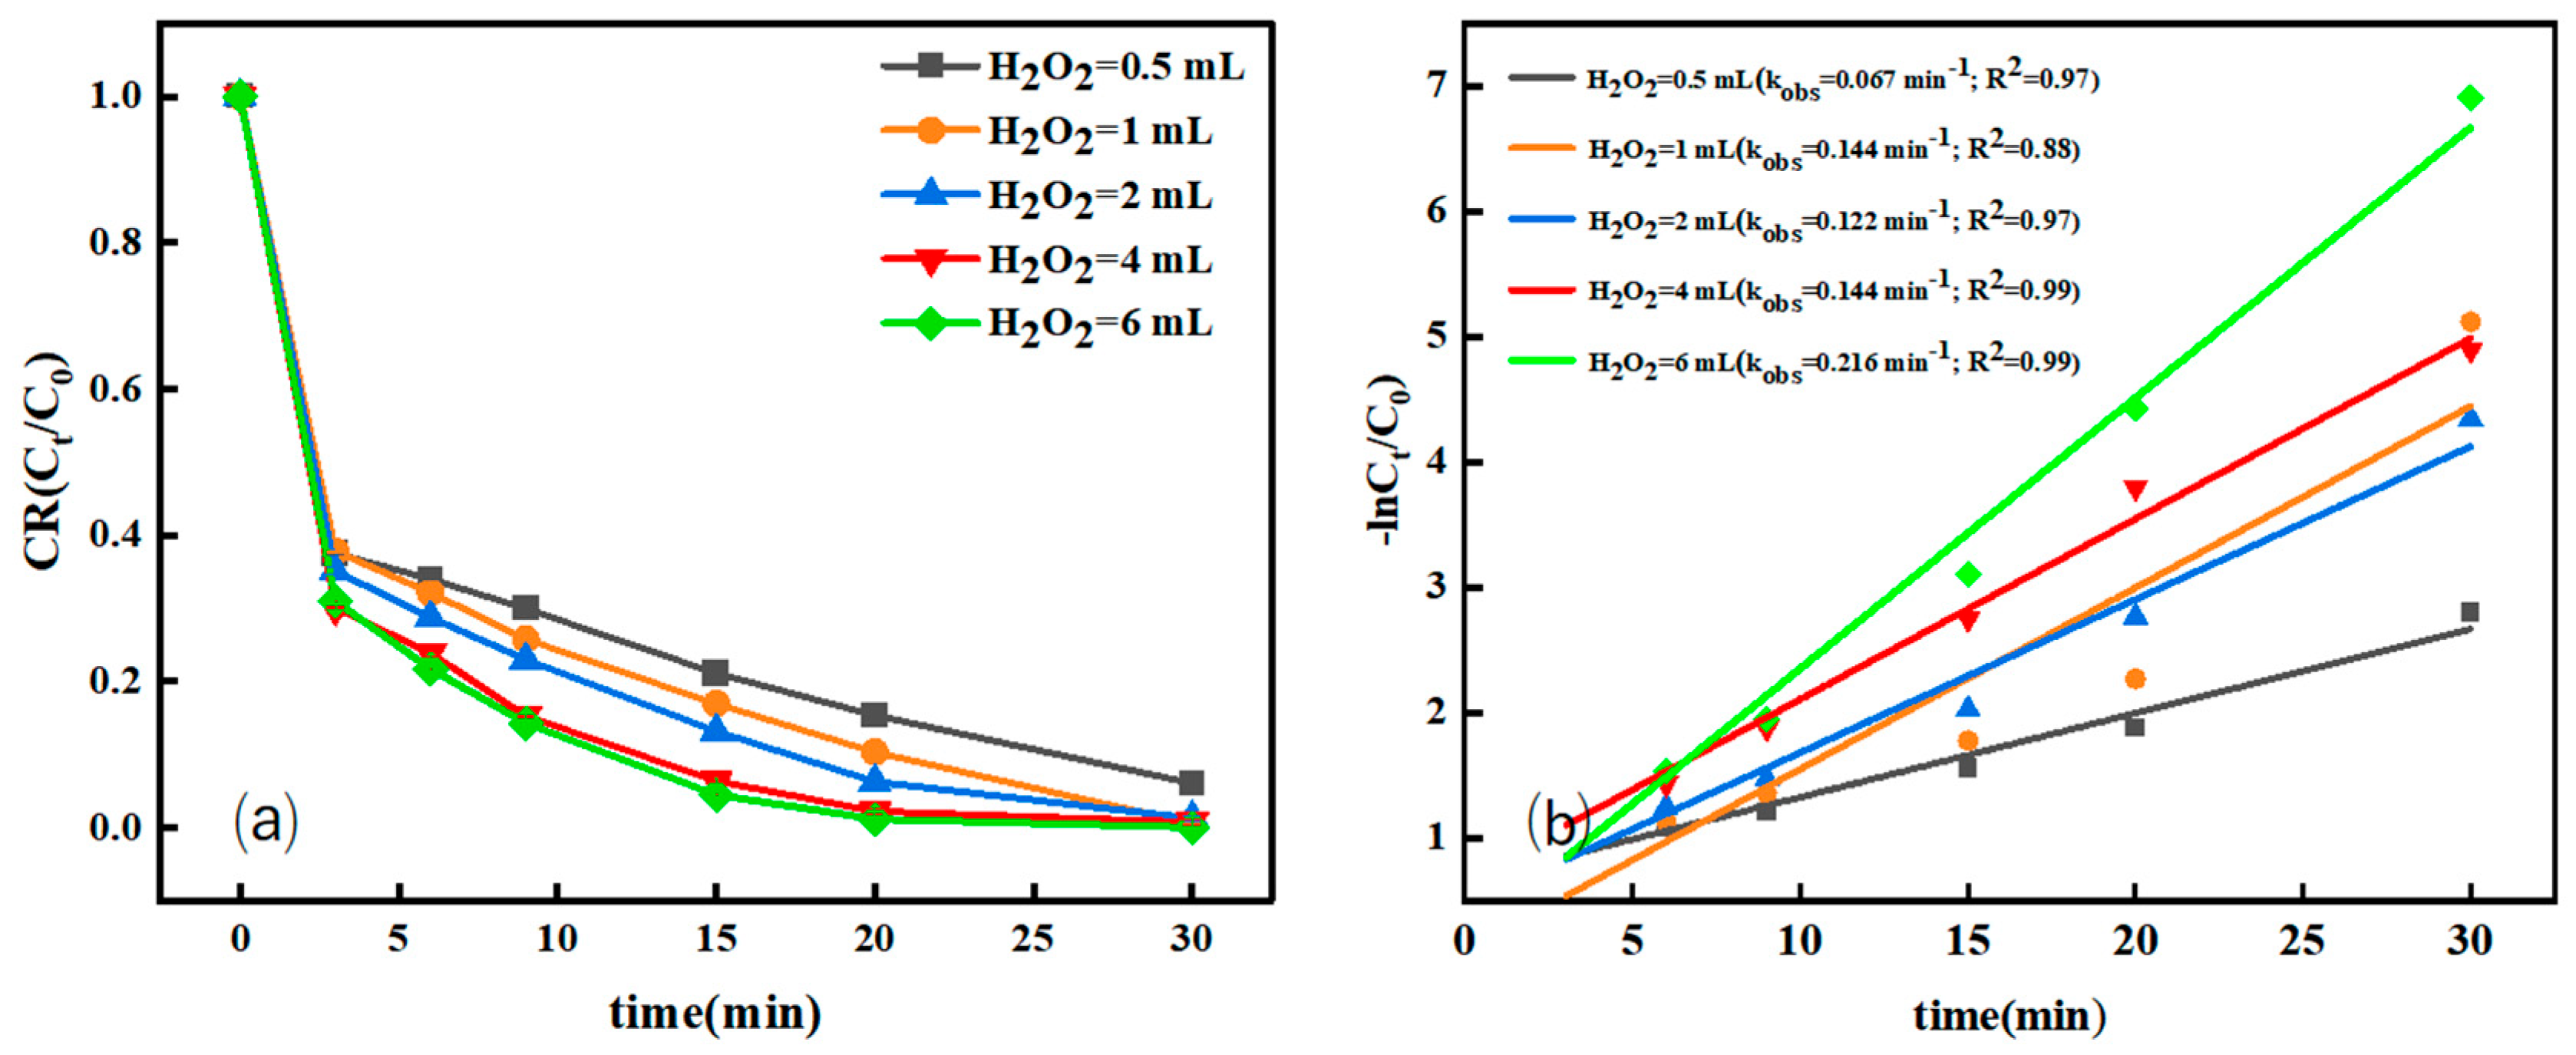
3.2.2. Effect of H2O2 Dosage on the Degradation Efficiency

Using the optimal composite MIL-101(Fe)@MoS2 (12%) as a reference, the effects of different dosages of H2O2 on the degradation efficiency of CR were investigated. As shown in Figure 8a, with the increase in the H2O2 dosage from 0.5 mL to 6 mL, the CR removal rate gradually increased. According to the pseudo-first-order kinetic model, as shown in Figure 8b, under the dosage conditions of 0.5 mL and 2 mL, the reaction rate constants (kobs) were 0.067 and 0.122 min−1, respectively, which were significantly lower than the value at 4 mL (0.144 min−1). Additionally, the R2 value for 2 mL (0.97) was slightly inferior to that of 4 mL (0.99). When the H2O2 dosage was 4 mL, the reaction rate constant (kobs = 0.144 min−1) matched that of 1 mL, but the model-fitting accuracy (R2 = 0.99) was significantly superior to the 1 mL condition (R2 = 0.88). Although the 6 mL dosage achieved the highest (0.216 min−1), considering the cost and the fact that excess H2O2 can scavenge hydroxyl radicals (·OH) produced by photo-Fenton oxidation, the H2O2 dosage of 4 mL was selected for subsequent experiments.

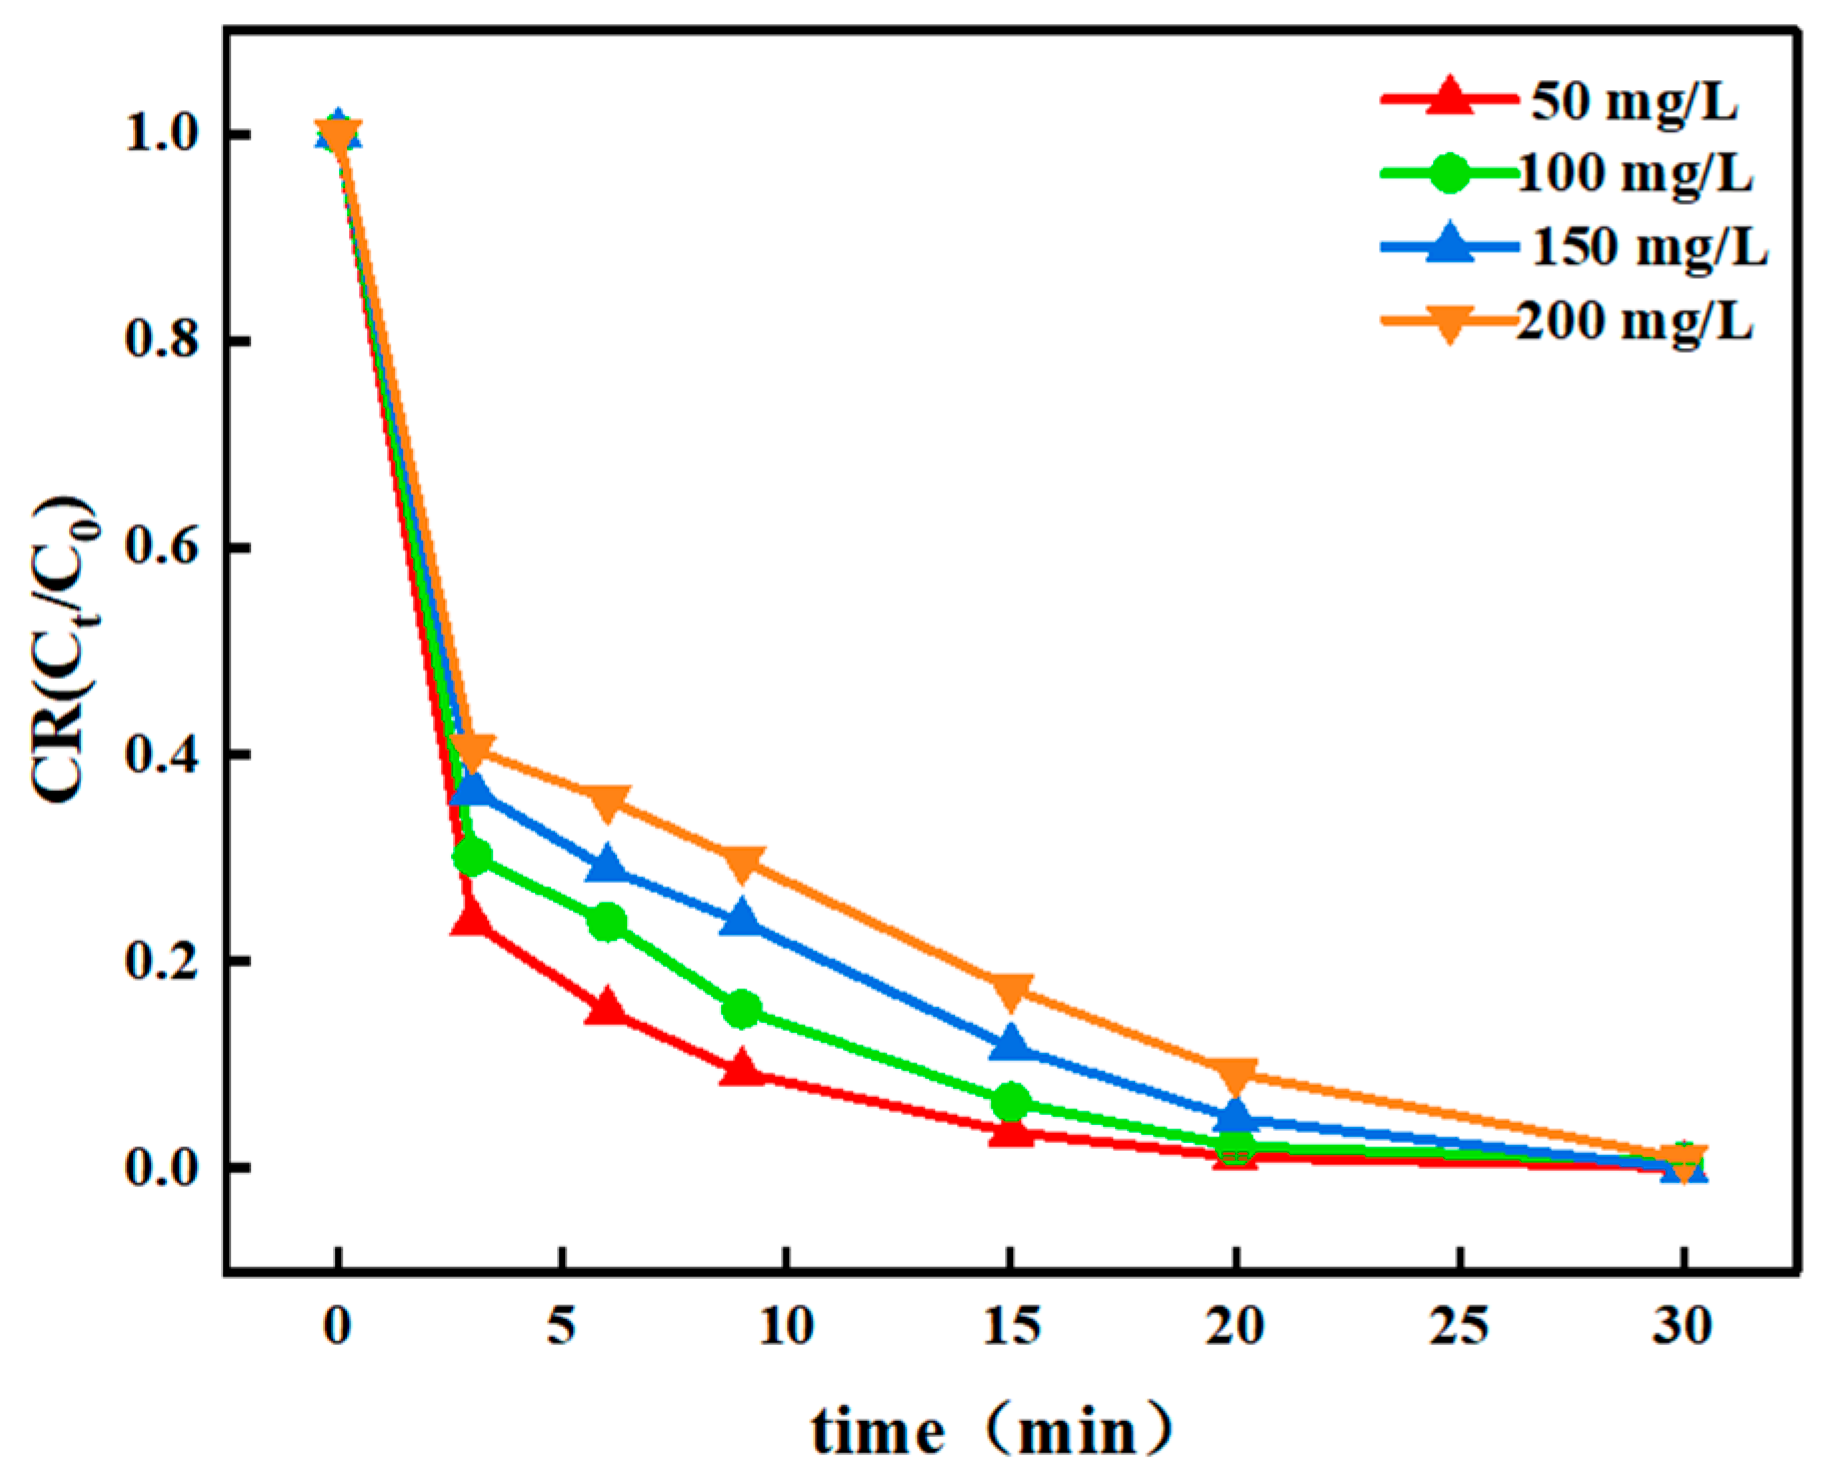
3.2.3. Effect of the Initial CR Concentration on the Degradation Efficiency

Using the optimal reaction conditions obtained from the previous single-factor experiments as the initial conditions, Figure 9 shows the experimental results for CR initial concentrations ranging from 50 to 200 mg/L. When the CR concentration was 50 mg/L, in the presence of H2O2, the CR degradation rate reached 96.7% after 15 min of reaction. As the CR concentration increased, the CR degradation rate decreased. At a CR concentration of 200 mg/L, the CR degradation rate was 82.7% after 15 min of reaction. The main reason for this was that, when the CR concentration was too high, there were insufficient active sites on the MIL-101(Fe)@MoS2, leading to the insufficient activation of H2O2 to produce ·OH radicals. Therefore, it was not possible to achieve the rapid and efficient degradation of high concentrations of CR.

3.2.4. Effect of the Initial pH Value on Degradation Efficiency

Figure 10a depicts the CR degradation performance under different pH conditions. When the initial pH of the solution was 11, the degradation rate of CR reached 10.1% after 15 min of reaction, and the degradation of CR was significantly inhibited. However, when the initial pH of the solution was between three and nine, after 15 min of reaction, the degradation rate of CR could be maintained above 90%. Therefore, the degradation of CR by MIL-101(Fe)@MoS2 photo-Fenton oxidation has a wide pH adaptation range (pH = 3–9).
A zeta potential analysis indicated that the surface charge characteristics of MIL-101(Fe)@MoS2 were significantly correlated with the pH value of the solution (Figure 10b). When the pH value increased from 3 to 11, the material’s zeta potential linearly decreased from +29.3 mV to −39.3 mV and crossed the zero point at pH = 7 (pHzpc ≈ 7). This phenomenon was consistent with the typical surface charge response mechanism of MOF materials. Under acidic conditions (pH = 3), the material’s surface protonation resulted in abundant positive charge sites (zeta potential = +29.3 mV), which was favorable for the adsorption of negatively charged CR molecules through electrostatic attraction, thereby promoting its subsequent degradation. This charge-dependent adsorption behavior was consistent with the experimental results shown in Figure 10a, where the CR degradation efficiency at pH = 3 (over 90%) was significantly higher than that at pH = 11 (10.1%).
It is particularly noteworthy that, when pH > pHzpc (e.g., pH = 11), the material’s surface negative charge (zeta potential = −39.3 mV) caused electrostatic repulsion with the CR anionic groups, which directly inhibited their effective contact [46]. The pH-dependent speciation of CR plays a critical role in its interaction with the catalyst. Under acidic conditions (pH 3–5), partial protonation of CR’s sulfonic groups (-SO3H) reduces electrostatic repulsion, promoting compact self-assembly via hydrophobic stacking [47]. This facilitates adsorption onto the positively charged MIL-101(Fe)@MoS2 surface (zeta potential ≈ +29.3 mV). Conversely, at neutral to alkaline pH (7–9), fully deprotonated CR (-SO3) forms loose aggregates but interacts with MoS2 through coordination, enhancing ·O2 generation [48].

3.3. Degradation Kinetics and Mechanism Analysis

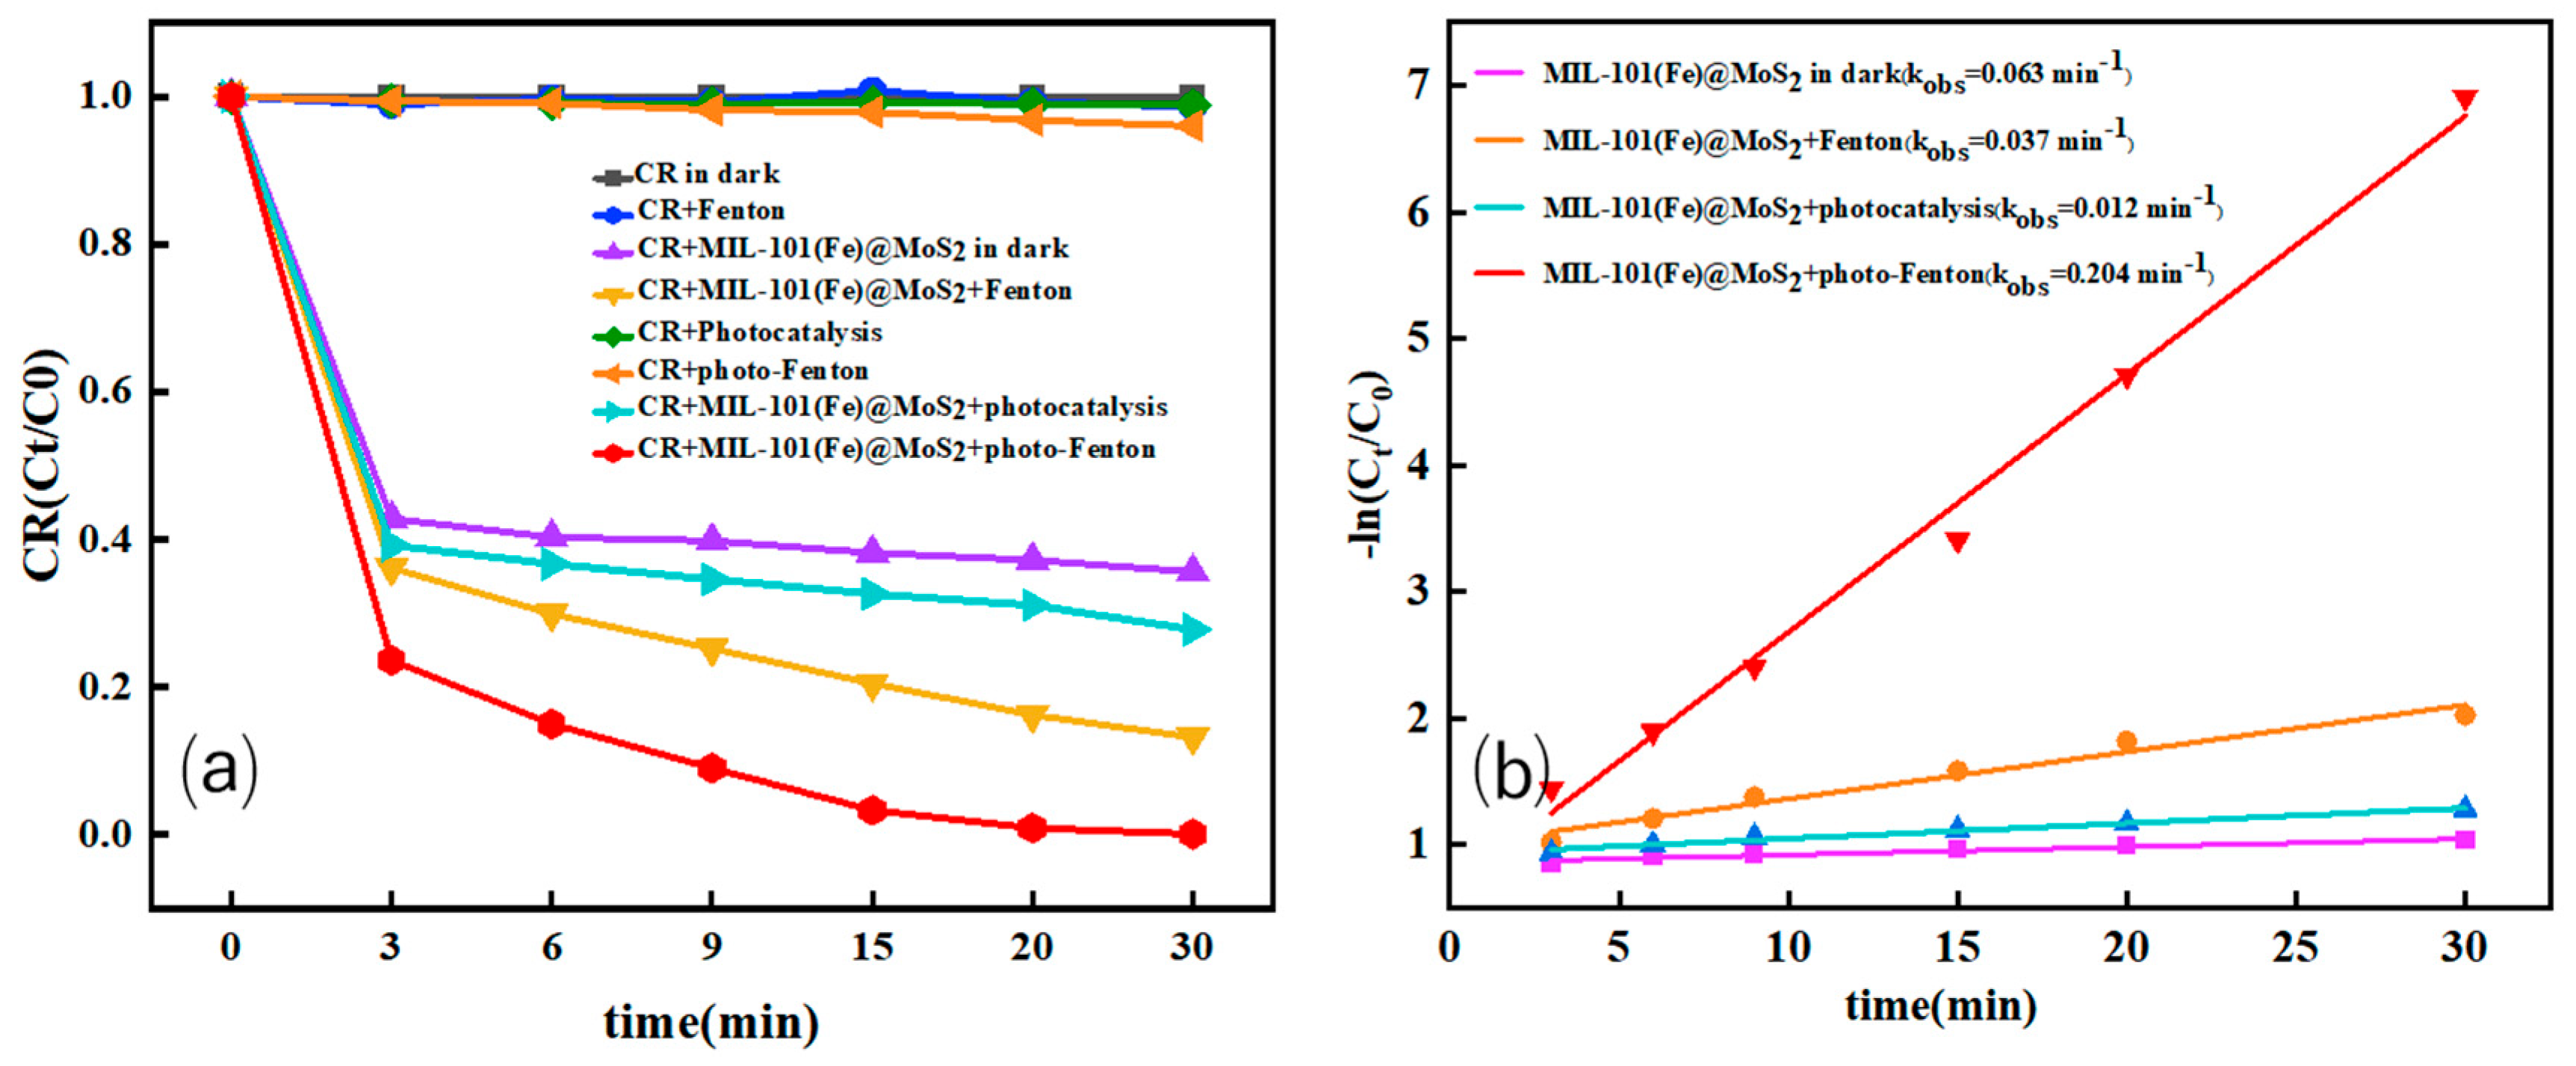
3.3.1. Comparison of the Contribution of MIL-101(Fe)@MoS2 to CR Degradation and Adsorption Under Different Conditions

Figure 11a shows the comparison of the contribution of MIL-101(Fe)@MoS2 to CR degradation under different conditions. First, under dark conditions, in the absence of light and H2O2, the degradation rate of CR by MIL-101(Fe)@MoS2 reached 64.5%, which was mainly due to the adsorption effect of MIL-101(Fe)@MoS2 on CR. After adding H2O2, the degradation rate of CR significantly increased to 86.8%, indicating that MIL-101(Fe)@MoS2 acted as a catalyst in the photo-Fenton reaction, promoting the oxidative degradation of CR. Under visible-light irradiation, the CR degradation rate further increased, reaching 72.2% and 100%, respectively. This demonstrates that MIL-101(Fe)@MoS2 has not only an adsorption effect but also an oxidative effect, and under the conditions of the photo-Fenton reaction, MIL-101(Fe)@MoS2 exhibits the highest CR degradation rate.
According to the pseudo-first-order kinetic model, the rate constants (kobs) for the degradation of CR under four different conditions for MIL-101(Fe)@MoS2 were fitted. As shown in Figure 11b, under dark conditions, the rate constant for MIL-101(Fe)@MoS2 was 0.063 min−1. After adding H2O2, the rate constant increased to 0.037 min−1. Under visible light irradiation, the rate constant for MIL-101(Fe)@MoS2 was 0.021 min−1. In the photo-Fenton reaction, the rate constant was the highest at 0.204 min−1. Based on these findings, it is evident that MIL-101(Fe)@MoS2 mainly degrades CR through adsorption under dark conditions. After adding H2O2, MIL-101(Fe)@MoS2 significantly improved the degradation rate of CR through the photo-Fenton reaction. Visible-light irradiation further enhanced the CR degradation effect, especially in the photo-Fenton reaction, where CR could be completely degraded within 30 min, demonstrating the highly efficient application potential of this system in environmental remediation.
As can be seen from Figure 12, with the passage of time, the mineralization efficiency of CR gradually increased, indicating that MIL-101(Fe)@MoS2 had a significant degradation effect on CR in the photo-Fenton reaction. Notably, within 30 min, the mineralization efficiency of CR reached 75.2%, and the mineralization rate curve differs from Figure 11a. This discrepancy arises from the distinct two-stage mechanism of advanced oxidation processes. In the initial stage (0–3 min), the synergistic adsorption–catalysis effect dominated, and hydroxyl radicals (·OH) and superoxide radicals (·O2) generated via the photo-Fenton reaction cleaved the chromophoric azo bonds (-N=N-), leading to immediate decolorization. However, this step produced intermediate organic byproducts (e.g., aromatic amines and naphthalene derivatives) [49] that retained organic carbon content. After 3 min, the process transitioned to a catalysis-dominated phase, where intermediates were slowly oxidized into CO2 and H2O, further explaining the reason why the overall TOC curve maintains a stable trend [50].
This study conducted a comparative analysis with other similar studies in terms of degradation efficiency, degree of mineralization, and reaction rate constants. Detailed data are presented in Table 1.
As can be seen in Table 1, MIL-101(Fe)@MoS2 achieved 100% degradation efficiency for CR (50 mg/L) in just 30 min, which was a significantly shorter time than that of other catalysts, such as the TiO2-g-C3N4-10 heterojunction (180 min to reach 100% degradation efficiency), RGO-modified MIL-125 (Ti) (180 min to reach 92.60% degradation efficiency), ultrathin oxygen-doped g-C3N4 nanosheets (120 min to reach 83.10% degradation efficiency), Fe-doped BiOBr hollow flower balls (7% Fe) (180 min to reach 89.66% degradation efficiency), and the GCN/CdO/CaFe2O4 ternary heterojunction (60 min to reach 88% degradation efficiency). The degradation time was greatly reduced, and the degradation efficiency was high, demonstrating the high efficiency of MIL-101(Fe)@MoS2 in terms of catalytic performance. Moreover, the reaction rate constant of MIL-101(Fe)@MoS2 was 0.204 min−1, which was significantly higher than that of the TiO2-g-C3N4-10 heterojunction (0.0104 min−1), RGO-modified MIL-125 (Ti) (0.012 min−1), ultrathin oxygen-doped g-C3N4 nanosheets (0.0131 min−1), and Fe-doped BiOBr hollow flower balls (7% Fe) (0.00935 min−1). This indicated that the catalytic reaction proceeded at a faster rate, further demonstrating the advantages of MIL-101(Fe)@MoS2 in catalytic performance. In addition, MIL-101(Fe)@MoS2, when degrading CR (50 mg/L), required a catalyst dosage of 20 mg/100 mL and could maintain 90.8% degradation efficiency after five cycles of use. Compared to other catalysts, such as the TiO2-g-C3N4-10 heterojunction, which dropped to 83.7% degradation efficiency after five cycles, and RGO-modified MIL-125 (Ti), which dropped to 65.2% degradation efficiency after four cycles. MIL-101(Fe)@MoS2 showed better repeatability stability and could maintain high catalytic activity over a long period of use. From an economic perspective, this reduces the cost of frequent catalyst replacement, offering an economic advantage.

3.3.2. Radical-Trapping Experiment and Electron Paramagnetic Resonance (EPR) Spectrum Analysis

The contribution of different active substances to the performance of photo-Fenton reactions was studied through active species-trapping experiments. Under the conditions of the photo-Fenton reaction, BQ, EDTA, nBuOH, and IPA were added to the CR solution as radical scavengers for superoxide anion radicals (·O2) [56], photogenerated holes (·h+) [57], hydroxyl radicals (·OH) [58], and sulfate radicals (·SO4), respectively [59]. As shown in Figure 13a, after adding BQ and EDTA, the CR degradation rate was effectively suppressed, decreasing to 60.8% and 53.1%, respectively, indicating that ·O2 and ·h+ are the main radicals in the MIL-101(Fe)@MoS2 and H2O2 system. The degradation rate first increased and then decreased after the introduction of BQ. This suggests that ·O2 is the main radical in the degradation process, and the subsequent decrease may be due to the adsorption effect of MIL-101(Fe)@MoS2 on CR, which is stronger than the inhibitory effect. Figure 13b further confirms the presence and role of the relevant free radicals.

3.3.3. Analysis of Band Structure and Band Gap Values (Tauc Formula)

The light absorption properties of MIL-101(Fe), MoS2, and MIL-101(Fe)@MoS2 were characterized using ultraviolet–visible diffuse reflectance spectroscopy (UV-Vis DRS), as shown in Figure 14a. MIL-101(Fe) exhibited a strong light absorption performance in the ultraviolet region, with an absorption edge at 515 nm. In contrast, MoS2 showed a satisfactory light-harvesting performance over a wide range (200–800 nm), with the corresponding absorption edge around 700 nm. Compared to MIL-101(Fe), the light-harvesting capability of MIL-101(Fe)@MoS2 was significantly improved, especially in the visible-light region.
According to the Kubelkae–Munk function, the band gap was determined based on the relationship curve between the square of the band gap ((αhν)2) and the energy (hv) of the excitation light, as shown in Figure 14b. The bandgaps of the three materials, MIL-101(Fe), MoS2, and MIL-101(Fe)@MoS2, were 2.63, 2.49, and 2.09 eV, respectively, indicating that the light absorption performance and photoelectric conversion ability of the MIL-101(Fe)@MoS2 material synthesized from MIL-101(Fe) and MoS2 were enhanced.
According to recent studies, the combination of transition metal composite oxides (such as CoFe2O4) with carbon-based materials can significantly enhance the activation efficiency of persulfate, with the synergistic factor reaching 2.75 [60]. Furthermore, the composite system of ZnO with magnetic cobalt ferrite (CoFe2O4) exhibits excellent stability over a wide pH range (3–9), which is highly consistent with the pH adaptability mechanism of the MIL-101(Fe)@MoS2 discussed in the present study [61]. These findings further validate the key role of heterojunction interface charge separation and synergistic catalysis in enhancing the performance of the photo-Fenton processes.

3.4. Catalyst Stability

3.4.1. Loop Experiment and Efficiency Retention Rate

Reusability is an important indicator for measuring the practical application of catalysts. The cyclic degradation experimental data shown in Figure 15a fully confirmed that, after five consecutive catalytic cycles without additional regeneration treatment, MIL-101(Fe)@MoS2 maintained a degradation efficiency of 90.8% for CR in the fifth cycle after 150 min. Synchronous characterization results revealed that the material retained its unique octahedral morphology features following the reaction (Figure 15b). More importantly, FTIR spectroscopy analysis (Figure 15c) did not detect any significant new characteristic peaks or the attenuation of the original functional group signals, indicating that the material’s chemical structure had excellent stability. In addition, the comparative XRD pattern (Figure 15d) showed that the positions of the characteristic diffraction peaks before and after the reaction were highly consistent, and the crystal phase structure did not undergo significant changes. The above multi-dimensional characterization results fully verified the excellent structural stability and recyclability performance of the MIL-101(Fe)@MoS2 composite material.

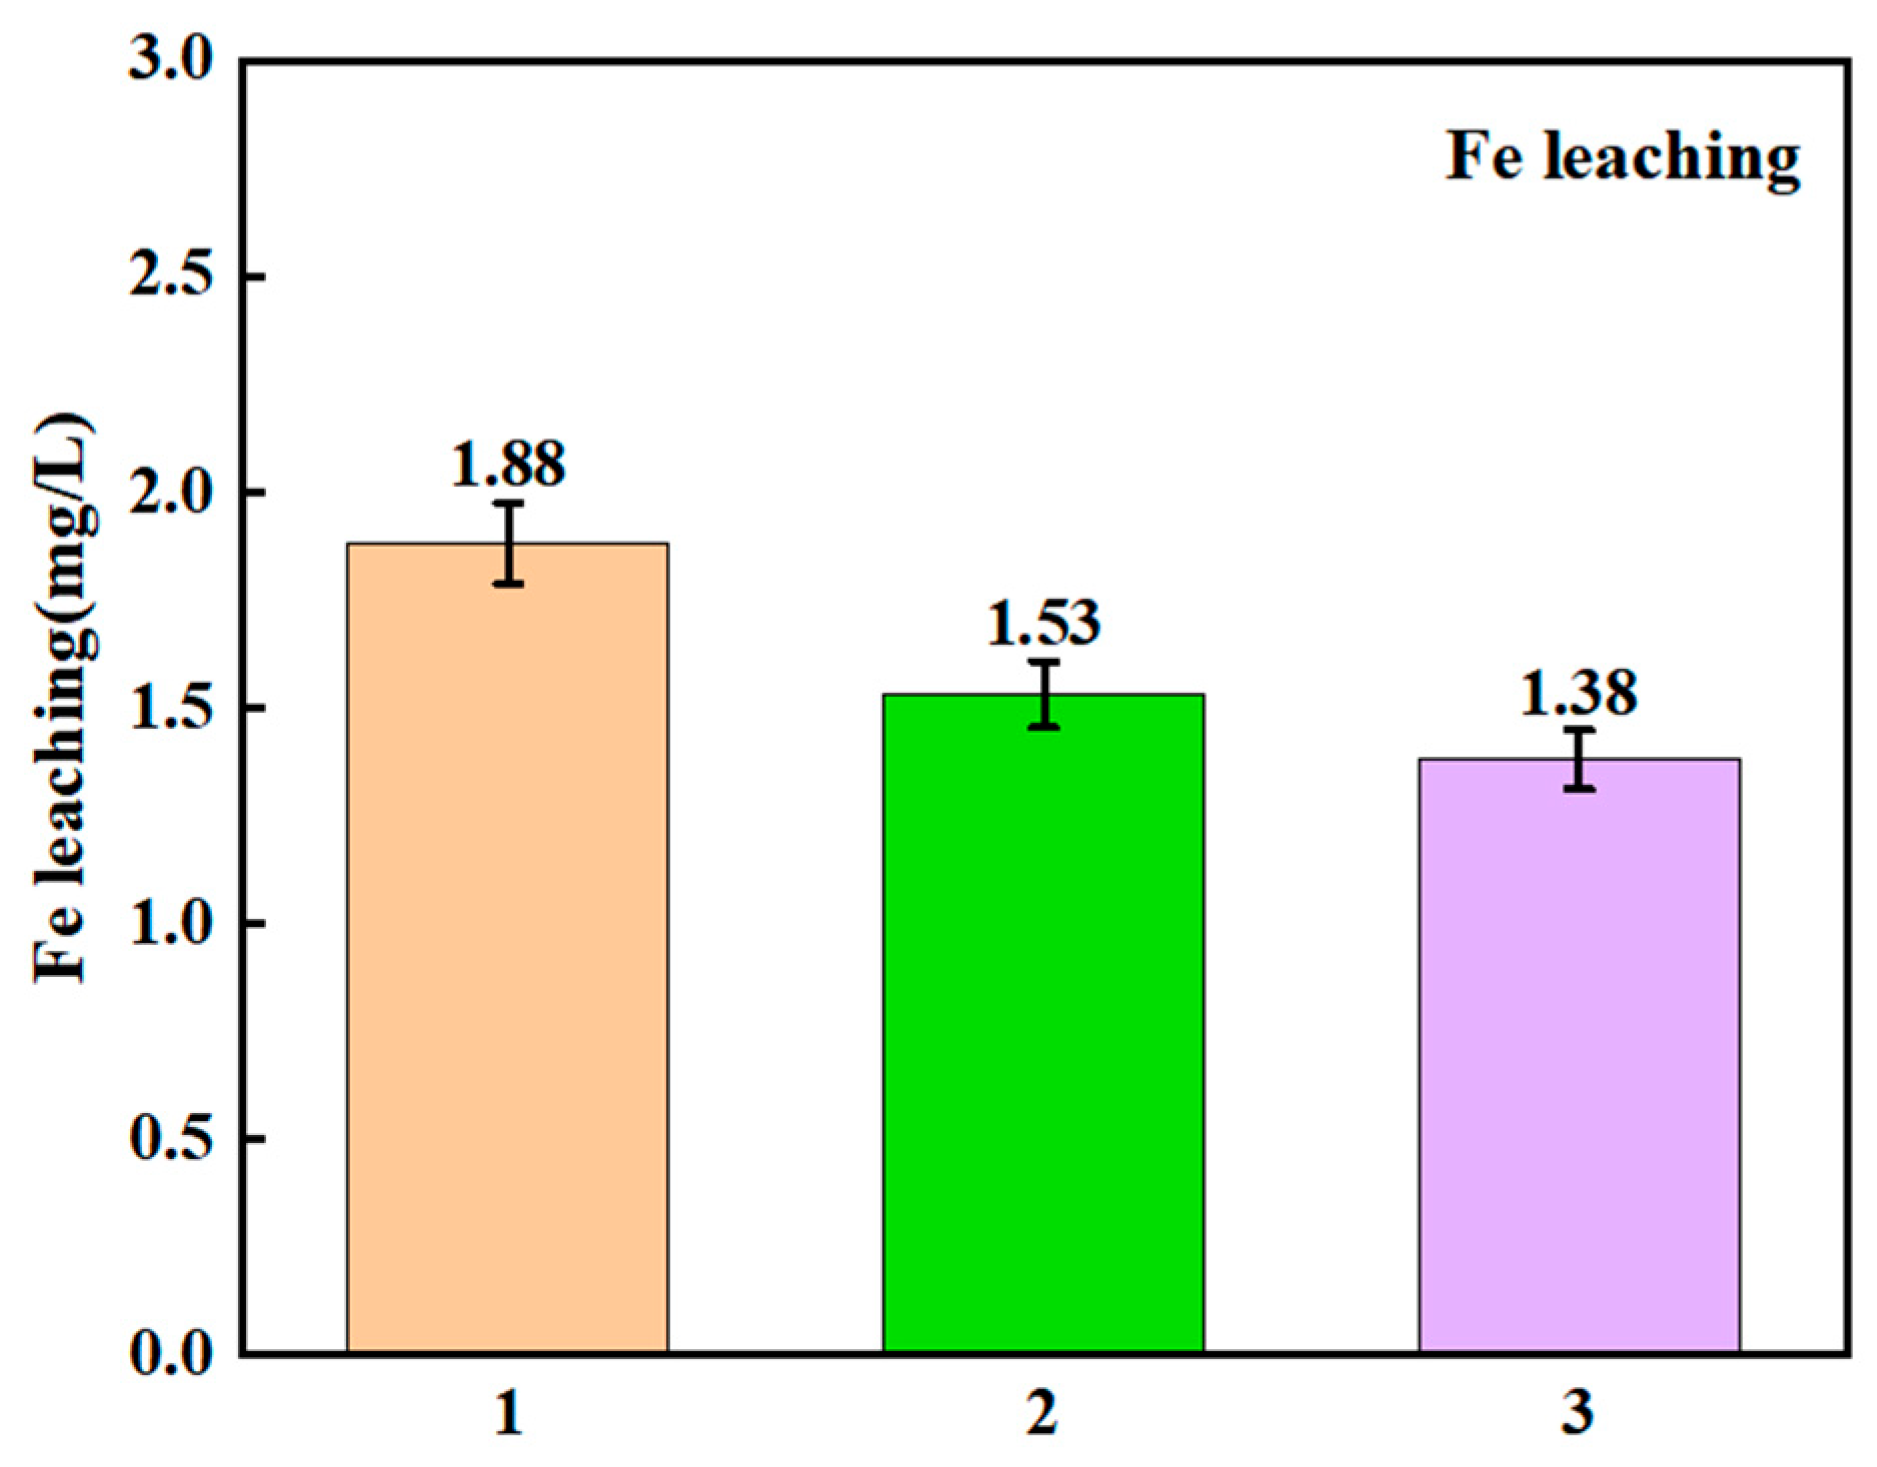
3.4.2. Metal-Leaching Quantity Assessment and Environmental Safety

The leaching Fe concentrations after the reaction are shown in Figure 16, which is 1.88 mg/L after the first reaction, then decreases to 1.53 and 1.38 mg/L after the second and third, accounting for 0.94%, 0.76%and 0.69% of the MIL-101(Fe)@MoS2 dosage (0.2 g/L), which was lower than that of previous reports [62]. After three reactions, the total dissolution rate of Fe was 2.41%. This phenomenon can be explained from two aspects. First, the magnetic stirring, redox conditions, and changes in pH value during the reaction process may cause slight damage to the MOF structure, releasing a small amount of iron ions. Second, the strong oxidizing power of H2O2 and photogenerated holes (h+) may initiate the redox cycle of Fe3+/Fe2+, and due to incomplete coordination, some iron ions dissolve. However, the overall performance and environmental safety still meet the requirements for practical applications [63].

4. Conclusions

This study successfully constructed MIL-101(Fe)@MoS2 composite photocatalytic material and confirmed its optimized structural and morphological integration using characterization techniques including XRD, FT-IR, SEM, and EDS. The experiments demonstrated that the material exhibited excellent CR degradation performance in a visible-light-driven photo-Fenton system. Under neutral conditions with an initial CR concentration of 50 mg/L, a catalyst dosage of 0.2 g/L, an H2O2 addition of 4 mL, and pH = 7, CR could be completely degraded within 30 min, with the TOC removal rate reaching 72.5%, which significantly enhanced the mineralization efficiency of the organic pollutants. Moreover, the catalyst maintained an efficient degradation capacity (90%) over a broad pH range of 3–9, breaking through the traditional Fenton system’s dependence on acidic media and showing stronger practical application adaptability.
Radical-trapping experiments and EPR analysis clarified that superoxide radicals (·O2) and photogenerated holes (·h+) were the main active substances for CR degradation, revealing the reaction mechanism of heterojunction interface synergistic catalysis. Cyclic experiments indicated that the catalyst maintained a degradation efficiency of 90.8% after five repeated uses, and XPS analysis confirmed the stable combination of Fe and Mo, with an extremely low metal-leaching amount (the binding energy of Fe3+ did not significantly shift, and the peak intensity of Mo4+/Mo6+ remained stable), effectively avoiding the risk of secondary pollution. This study developed a novel photo-Fenton catalytic system with high activity, wide pH adaptability, and stability for the efficient treatment of dyed wastewater, providing a scientific basis for the development of green water treatment technology.

Author Contributions

Conceptualization, S.Z. and H.Z.; Methodology, S.Z. and H.Z.; Formal analysis, Z.Y.; Investigation, Z.Y. and Y.X.; Resources, N.J. and L.M.; Writing—original draft, Z.Y.; Writing—review & editing, S.Z. and L.M.; Project administration, H.Z.; Funding acquisition, L.M. All authors have read and agreed to the published version of the manuscript.

Funding

This research was supported by the National Natural Science Foundation of China (52200107).

Data Availability Statement

The data presented in this study are available on request from the corresponding author.

Conflicts of Interest

The authors declare no conflict of interest.

References

  1. Ozturk, E. Improving water-use efficiency and environmental performances in an integrated woven-knitted fabric printing-dyeing textile mill. J. Clean. Prod. 2022, 379, 134805. [Google Scholar]
  2. Sahoo, S.K.; Dhal, J.P.; Panigrahi, G.K. Magnesium oxide nanoparticles decorated iron oxide nanorods: Synthesis, characterization and remediation of Congo red dye from aqueous media. Compos. Commun. 2020, 22, 100496. [Google Scholar]
  3. Debnath, S.; Maity, A.; Pillay, K. Impact of process parameters on removal of Congo red by graphene oxide from aqueous solution. J. Environ. Chem. Eng. 2014, 2, 260–272. [Google Scholar]
  4. GB8978-1996; Integrated Wastewater Discharge Standard. Ministry of Environmental Protection: Beijing, China, 1996.
  5. Chen, H.; Wang, K.; She, S.Q.; Yu, X.; Yu, L.Y.; Xue, G.; Li, X. Insight into dissolved organic nitrogen transformation and characteristics: Focus on printing and dyeing wastewater treatment process. J. Hazard. Mater. 2023, 450, 131086. [Google Scholar]
  6. Huang, C.K.; Xiang, Z.Q.; Huang, J.C.; Liu, G.B.; Yu, X.M.; Liu, W.J.; Cao, H.J. Efficient adsorptive removal of Sb (Ⅲ) and Sb (V) from printing and dyeing wastewater by TiCl4. Chem. Eng. J. 2024, 493, 152858. [Google Scholar] [CrossRef]
  7. Yang, Q.; Guo, J.; Yao, Q.; Zhang, S.; Feng, S.; Guan, F.C.; Li, Z.; Zhang, X.; Xu, Y.; He, J.H. Self-cleaning and multi-active sites amphoteric composite sponges: Efficient removal, selective adsorption and photocatalyst substrates of dyes. Chem. Eng. J. 2024, 494, 152865. [Google Scholar]
  8. Zhou, Y.K.; Chen, T.Y.; Zhang, X.; Chen, R.Q.; Zhu, N.L.; Li, L.X.Y.; Zhao, L.X.; Li, Z.G.; Wang, Y.W.; Jiang, G.B. Occurrence and ecological risk assessment of highly toxic halogenated byproducts during chlorination decolorization of textile printing and dyeing wastewater. Environ. Sci. Technol. 2024, 58, 17970–17978. [Google Scholar]
  9. Gao, N.; Chen, Y.; Zhang, Q.; Fan, Y.; Li, Q.; Xu, L.; Jiang, J.; Gao, J.; Shi, J.; Wang, H.; et al. TiO2/CMWCNT/CaAlg composite membrane used for dye desalination and its rapid cleaning under ultraviolet light and advanced oxidation activated by monopersulfate. Compos. Commun. 2024, 48, 101921. [Google Scholar]
  10. Solayman, H.M.; Hossen, M.A.; Aziz, A.A.; Yahya, N.Y.; Leong, K.H.; Sim, L.C.; Monir, M.U.; Zoh, K.D. Performance evaluation of dye wastewater treatment technologies: A review. J. Environ. Chem. Eng. 2023, 11, 109610. [Google Scholar] [CrossRef]
  11. Pan, X.; Fan, X.; Liang, A.; Zhang, S.; Wang, W.; Qu, S.; Li, C. Electron-rich CNTs modified FeOCl/Fe2O3 with improved Fenton catalytic performance. Compos. Commun. 2021, 27, 100811. [Google Scholar]
  12. Kakavandi, B.; Salmasi, M.Z.; Ahmadi, M.; Naderi, A.; Roccara, P.; Bedía, J.; Farzood, M.H.; Kalantary, R.R. Spinel cobalt ferrite-based porous activated carbon in conjunction with UV light irradiation for boosting peroxymonosulfate oxidation of bisphenol A. J. Environ. Manag. 2023, 342, 118242. [Google Scholar]
  13. Tian, N.; Madani, Z.; Giannakis, S.; Isari, A.A.; Arjmand, M.; Hasanvandian, F.; Noorisephir, M.; Kakavandi, B. Peroxymonosulfate assisted pesticide breakdown: Unveiling the potential of a novel S-scheme ZnO@CoFe2O4 photo-catalyst, anchored on activated carbon. Environ. Pollut. 2023, 334, 122059. [Google Scholar] [CrossRef] [PubMed]
  14. Bosio, G.N.; Einschlag, F.S.G.; Carlos, L.; Mártire, D.O. Recent advances in the development of novel Iron-Copper bimetallic photo fenton catalysts. Catalysts 2023, 13, 159. [Google Scholar] [CrossRef]
  15. Ali, J.; Guo, S.; Chen, Y.A.; Shahzad, A.; Ullah, M.W.; Chen, F.X. Metal sulfides as emerging materials for advanced oxidation of wastewater: Recent developments, challenges, and prospects. Coord. Chem. Rev. 2024, 509, 215765. [Google Scholar] [CrossRef]
  16. Gao, Z.Y.; Deng, B.X.; Xu, L.F.; Tang, J.; Zhao, Q.; Hu, T.F.; Chen, Y.; Deng, L.F.; Bai, Y.J.; Du, K. Enhanced removal of organic dyes by piezoelectric-Fenton-like treatment with Fe-MOF@MoS2 catalysts. J. Alloys Compd. 2024, 1007, 176474. [Google Scholar]
  17. Yang, X.; Li, Y.; Yue, D.; Li, R.; Song, H. Facile synthesis of NH2-MIL-53 (Al)@ BiOBr@ CQDs ternary heterostructure photocatalyst for degradation of ciprofloxacin in water. Compos. Commun. 2024, 50, 102028. [Google Scholar]
  18. Wang, Q.; Zheng, S.; Ma, W.; Qian, J.; Huang, L.; Deng, H.; Zhou, Q.; Zheng, S.; Li, S.; Du, H.; et al. Facile synthesis of direct Z-scheme PPy/NH2-UiO-66heterojunction for enhanced photocatalytic Cr (VI) reduction, industrialelectroplating wastewater treatment, and tetracycline degradation. Appl. Catal. B Environ. 2024, 344, 123669. [Google Scholar]
  19. Li, S.C.; Hu, B.C.; Shang, L.M.; Ma, T.; Li, C.; Liang, H.W.; Yu, S.H. General synthesis and solution processing of metal-organic framework nanofibers. Adv. Mater. 2022, 34, 2202504. [Google Scholar]
  20. Zhang, W.; Huang, C.; Zhu, J.; Zhou, Q.; Yu, R.; Wang, Y.; An, P.; Zhang, J.; Qiu, M.; Zhou, L.; et al. Dynamic Restructuring of Coordinatively Unsaturated Copper Paddle Wheel Clusters to Boost Electrochemical CO2 Reduction to Hydrocarbons. Angew. Chem. Int. Ed. 2022, 61, e202112116. [Google Scholar]
  21. Liang, J.; Liang, Z.; Zou, R.; Zhao, Y. Heterogeneous catalysis in zeolites, mesoporous silica, and metal-organic frameworks. Adv. Mater. 2017, 29, 1701139. [Google Scholar]
  22. Huang, N.Y.; Zheng, Y.T.; Chen, D.; Chen, Z.Y.; Huang, C.Z.; Xu, Q. Reticular framework materials for photocatalytic organic reactions. Chem. Soc. Rev. 2023, 52, 7949–8004. [Google Scholar] [PubMed]
  23. Li, L.; Li, Z.; Yang, W.; Huang, Y.; Huang, G.; Guan, Q.; Dong, Y.; Lu, J.; Yu, S.H.; Jiang, H.L. Integration of Pd nanoparticles with engineered pore walls in MOFs for enhanced catalysis. Chem 2021, 7, 686–698. [Google Scholar]
  24. Guo, J.; Qin, Y.; Zhu, Y.; Zhang, X.; Long, C.; Zhao, M.; Tang, Z. Metal-organic frameworks as catalytic selectivity regulators for organic transformations. Chem. Soc. Rev. 2021, 50, 5366–5396. [Google Scholar]
  25. Li, S.J.; Wang, C.C.; Dong, K.X.; Zhang, P.; Chen, X.B.; Li, X. Study on degradation of orange G by modified Fe-based metal-organic frameworks activated persulfate. Chin. J. Catalys. 2023, 51, 101–112. [Google Scholar]
  26. Li, Y.; Xu, Z.J.; Zhou, R.; Liu, W.; Liao, S.; Liu, Z.N. Preparation of MIL/MoS2 and photocatalytic degradation of tetracycline hydrochloride. Ind. Water Wast. 2023, 54, 39–43. [Google Scholar]
  27. Ahmadijokani, F.; Ghaffarkhah, A.; Molavi, H.; Dutta, S.; Lu, Y.; Wuttke, S.; Kamkar, M.; Rojas, O.J.; Arjmand, M. COF and MOF hybrids: Advanced materials for wastewater treatment. Adv. Funct. Mater. 2024, 34, 2305507. [Google Scholar]
  28. Stephenson, T.; Zhi, L.; Olsen, B.; Mitlin, D. Lithium ion battery applications of molybdenum disulfide (MoS2) nanocomposites. Energy Environ. Sci. 2013, 7, 209–231. [Google Scholar] [CrossRef]
  29. Dharman, R.K.; Francis, B.M.; Ponraj, J.S.; Muthuvijayan, S.; Manavalan, R.K.; Harisingh, S.; Balasubramanian, S.; Dhanabalan, S.C. Realization of Ti MOF/MoS2 hybrid nanostructure and their catalytic activity towards 4-nitrophenol reduction. J. Mater. Res. Technol. 2022, 17, 1760–1769. [Google Scholar] [CrossRef]
  30. Duan, Y.; Fu, H.; Zhang, L.; Gao, R.; Sun, Q.; Chen, Z.; Du, H. Embedding of ultra-dispersed MoS2 nanosheets in N, O heteroatom-modified carbon nanofibers for improved adsorption of Hg2+. Compos. Commun. 2022, 31, 101106. [Google Scholar] [CrossRef]
  31. Wang, J.; Yang, C.Q.; Ye, D.Q.; Hu, Y. The mechanism of effective photocatalytic degradation of toluene by Zr/Ti bimetallic metal-organic framework derivatives loaded with TiO2. Appl. Catal. B 2025, 361, 124635. [Google Scholar] [CrossRef]
  32. Lei, Y.; Huo, D.; Liu, H.; Cheng, S.; Ding, M.; Jiang, B.; Zhang, F.; Zhang, Y.; Gao, G. An Investigation of PPy@1T/2H MoS2 Composites with Durable Photothermal-Promoted Effect in Photo-Fenton Degradation of Methylene Blue and in Water Evaporation. Polymers 2023, 15, 3900. [Google Scholar] [CrossRef] [PubMed]
  33. Song, J.; Yuan, X.; Sun, M.; Wang, Z.; Cao, G.; Gao, K.; Yang, C.; Zhang, F.; Dang, F.; Wang, W. Oxidation of tetracycline hydrochloride with a photoenhanced MIL-101(Fe)/g-C3N4/PMS system: Synergistic effects and radical/nonradical pathways. Ecotoxicol. Environ. Saf. 2023, 251, 114524. [Google Scholar] [CrossRef] [PubMed]
  34. Gao, Y.W.; Zhu, Y.; Li, T.; Chen, Z.H.; Jiang, Q.K.; Zhao, Z.Y.; Liang, X.Y.; Hu, C. Unraveling the high-activity origin of single-atom iron catalysts for organic pollutant oxidation via peroxymonosulfate activation. Environ. Sci. Technol. 2021, 55, 8318–8328. [Google Scholar] [PubMed]
  35. Zhu, K.; Qin, W.L.; Gan, Y.P.; Huang, Y.Z.; Jiang, Z.W.; Chen, Y.W.; Li, X.; Yan, K. Acceleration of Fe3+/Fe2+ cycle in garland-like MIL-101(Fe)/MoS2 nanosheets to promote peroxymonosulfate activation for sulfamethoxazole degradation. Chem. Eng. J. 2023, 470, 144190. [Google Scholar]
  36. Li, Y.; Zhao, Y.J.; Nie, H.D.; Wei, K.Q.; Cao, J.J.; Huang, H.; Shao, M.W.; Liu, Y.; Kang, Z.H. Interface photo-charge kinetics regulation by carbon dots for efficient hydrogen peroxide production. J. Mater. Chem. A 2021, 9, 515–522. [Google Scholar]
  37. Yuan, H.; Sun, X.H.; Zhang, S.; Shi, W.L.; Chin, F.G. Achieving high-efficient photocatalytic persulfate-activated degradation of tetracycline via carbon dots modified MIL-101(Fe) octahedrons. J. Chem. Eng. 2024, 66, 298–309. [Google Scholar]
  38. Gyawali, G.; Jeong, H.K. Size Effects of MoS2 on Hydrogen and Oxygen Evolution Reaction. J. Electrochem. Sci. Technol. 2022, 13, 120–127. [Google Scholar]
  39. Moradi-Bieranvand, M.; Farhadi, S.; Zabadrasti, A.; Mahmoudi, F. Construction of magnetic MoS2/NiFe2O4/MIL-101(Fe) hybrid nanostructures for separation of dyes and antibiotics from aqueous media. RSC Adv. 2024, 14, 11037–11056. [Google Scholar]
  40. Vall’es-García, C.; Gkaniatsou, E.; Santiago-Portillo, A.; Gim, M.; Greneche, J.-M.; Steunou, N.; Sicard, C.; Naval, S.; Serre, C.; García, H. Design of stable mixed-metal MIL-101(Cr/Fe) materials with enhanced catalyticactivity for the Prins reaction. J. Mater. Chem. A 2020, 8, 17002–17011. [Google Scholar]
  41. Ioelovich, M. Preparation, Characterization and Application of Amorphized Cellulose—A Review. Polymers 2021, 13, 4313. [Google Scholar] [CrossRef]
  42. Zhao, F.; Liu, Y.; Hammouda, S.B.; Doshi, B.; Guijarro, N.; Min, X.; Tang, C.J.; Sillanpää, M.; Sivula, K.; Wang, S. MIL-101(Fe)/g-C3N4 for enhanced visible-light-driven photocatalysistoward simultaneous reduction of Cr(VI) and oxidation of bisphenol A in aqueous media. Appl. Catal. B Environ. 2020, 272, 119033. [Google Scholar]
  43. Xie, Y.H.; Liu, C.R.; Li, D.J.; Liu, Y. In situ-generated H2O2 with NCQDs/MIL-101(Fe) by activating O2: A dual effect of photocatalysis and photo-Fenton for efficient removal of tetracycline at natural pH. Appl. Surf. Sci. 2022, 592, 153312. [Google Scholar]
  44. Shen, Z.; Peng, Y.; Li, X.; Li, N.; Xu, H.; Li, W.; Guo, X.; Pang, H. Design principle and synthetic strategy for metal-organic framework composites. Compos. Commun. 2024, 48, 101933. [Google Scholar]
  45. Wu, Q.S.; Siddique, M.S.; Yang, Y.K.; Wu, M.; Kang, L.; Yang, H.P. Facile and scalable synthesis of Fe-based metal organic frameworks for highly efficient photo-Fenton degradation of organic contaminants. J. Clean. Prod. 2022, 374, 134033. [Google Scholar]
  46. Chen, G.; Li, X.; Li, X.; Song, Z.; Liu, B. Active-passive synergistic alleviation of membrane scaling from groundwater by grafting charged positive monomers on the surface of nanofiltration membranes. Desalination 2025, 599, 118436. [Google Scholar]
  47. Reichhardt, C.; Jacobson, A.N.; Maher, M.C.; Uang, J.; McCrate, O.A.; Eckart, M.; Cegelski, L. Congo Red Interactions with Curli-Producing E. coli and Native Curli Amyloid Fibers. PLoS ONE 2015, 10, e0140388. [Google Scholar]
  48. Kustanovich, I.; Poupko, R.; Zimmermann, H.; Luz, Z.; Labes, M.M. Lyomesophases of the diethylammonium flufenamate-water system studied by deuterium NMR spectroscopy. J. Am. Chem. Soc. 1985, 107, 3494–3501. [Google Scholar]
  49. Mekidiche, M.; Khaldi, K.; Lerari-Zinai, D.; Bachari, K. Montmorillonite-supported Cu-tripeptide complex for efficient Congo red degradation. Mater. Chem. Phys. 2025, 339, 130640. [Google Scholar]
  50. Mansour, D.; Albawi, E. Abdulmohsen Khalaf Dhahi Alsukaibi, Basmah Al Shamari, Removal of Congo red dye by electrochemical advanced oxidation process: Optimization, degradation pathways, and mineralization. Sustain. Water Resour. Manag. 2024, 10, 41. [Google Scholar] [CrossRef]
  51. Saeed, M.; Asghar, H.; Khan, I.; Akram, N.; Usman, M. Synthesis of TiO2-g-C3N4 for efficient photocatalytic degradation of Congo Red dye. Catal. Today 2024, 447, 115154. [Google Scholar] [CrossRef]
  52. Fatima, R.; Afridi, M.N.; Mohdeb, I.; Madhusudan, P.; Hwang, Y. Photocatalytic degradation of Congo red using RGO-modified MIL-125 (Ti) under visible light. J. Water Process Eng. 2025, 69, 106893. [Google Scholar] [CrossRef]
  53. Zhang, Z.; Wang, J.; Zhang, Y.; Wang, M.; Wang, K.; Yang, J. Preparation and photocatalytic performance of ultrathin oxygen-doped g-C3N4 nanosheets. Fine Chem. 2023, 40, 1925–1933. [Google Scholar] [CrossRef]
  54. Ge, J.; Chen, D.; Li, J.; Xu, X.; Shen, Y.; Yang, Z. Preparation of Fe-doped BiOBr hollow microspheres for efficient degradation of Congo red under visible light. Min. Metall. Eng. 2023, 43, 154–158. [Google Scholar] [CrossRef]
  55. Sudhaik, A.; Kumar, R.; Sharma, S.; Sharma, A.; Devi, S.; Raizada, P.; Le, Q.V.; Ahamad, T.; Nguyen, V.-H.; Singh, P. Structural design of dual Z-scheme GCN/CdO/CaFe2O4 ternary heterojunction with high visible light activity: Photocatalytic performance and mechanism in the degradation of Congo red dye. Inorg. Chem. Commun. 2025, 172, 113697. [Google Scholar] [CrossRef]
  56. Tang, L.; Lv, Z.Q.; Xue, Y.C.; Xu, L.; Qiu, W.H.; Zheng, C.M.; Chen, W.Q.; Wu, M.H. MIL-53 (Fe) incorporated in the lamellar BiOBr: Promoting the visible-light catalytic capability on the degradation of rhodamine B and carbamazepine. Chem. Eng. J. 2019, 374, 975–982. [Google Scholar]
  57. Chen, Y.X.; Yang, S.Y.; Wang, K.; Lou, L.P. Role of primary active species and TiO2 surface characteristics in UV-illuminated photodegradation of Acid Orange 7. J. Photochem. Photobiol. A 2005, 172, 47–54. [Google Scholar] [CrossRef]
  58. Lv, K.; Xu, Y.M. Effects of polyoxometalate and fluoride on adsorption and photocatalytic degradation of organic dye X3B on TiO2:  The difference in the production of reactive species. J. Phys. Chem. B 2006, 110, 6204–6212. [Google Scholar]
  59. Zhou, C.Y. Design of Polymeric Carbon Nitride and Their Performance and Mechanism in Catalytic Degradation of Antibiotic Contaminants in Water Under Visible Light. Ph.D. Thesis, Hunan University, Changsha, China, 2020. [Google Scholar]
  60. Olfatmehr, N.; Kakavandi, B.; Khezri, S.M. Peroxydisulfate activation by enhanced catalytic activity of CoFe2O4 anchored on activated carbon: A new sulfate radical-based oxidation study on the Cefixime degradation. Sep. Purif. Technol. 2022, 302, 121991. [Google Scholar]
  61. Naderi, A.; Firooz, M.H.; Gharibzadeh, F.; Giannakis, S.; Ahmadi, M.; Kalantary, R.R.; Kakavandi, B. Anchoring ZnO on spinel cobalt ferrite for highly synergic sono-photo-catalytic, surfactant-assisted PAH degradation from soil washing solutions. J. Environ. Manag. 2023, 326, 116584. [Google Scholar]
  62. McCarthy, B.D.; Beiler, A.M.; Johnson, B.A.; Liseev, T.; Castner, A.T.; Ott, S. Analysis of electrocatalytic metal-organic frameworks. Coord. Chem. Rev. 2020, 406, 213137. [Google Scholar]
  63. Zhang, X.W.; Wang, F.; Wang, C.C.; Wang, P.; Fu, H.; Zhao, C. Photocatalysis activation of peroxodisulfate over the supported Fe3O4 catalyst derived from MIL-88A(Fe) for efficient tetracycline hydrochloride degradation. Chem. Eng. J. 2021, 426, 131927. [Google Scholar] [CrossRef]
Figure 1. Preparation of MIL-101(Fe)@MoS2.
Water 17 00980 g001
Figure 2. Scanning electron microscopy (SEM) images of (a) MIL-101(Fe), (b) MoS2, and (c) MIL-101(Fe)@MoS2; (d) high-resolution transmission electron microscopy (HRTEM) image of MIL-101(Fe)@MoS2.
Water 17 00980 g002
Figure 3. Energy-dispersive X-ray spectroscopy (EDS) spectra of MIL-101(Fe).
Water 17 00980 g003
Figure 4. Energy-dispersive X-ray spectroscopy (EDS) spectra of MIL-101(Fe)@MoS2.
Water 17 00980 g004
Figure 5. (a) X-ray diffraction (XRD) patterns of MIL-101(Fe), MoS2, and MIL-101(Fe)@MoS2. (b) Particle size distribution of MIL-101(Fe)@MoS2 by SEM.
Water 17 00980 g005
Figure 6. Fourier transform infrared (FIRST) spectra of MIL-101(Fe), MoS2, and MIL-101(Fe)@MoS2.
Water 17 00980 g006
Figure 7. (a) Effect of different MoS2 doping ratios on the degradation efficiency [catalyst dosage = 20 mg/mL, H2O2 = 1 mL, CR = 100 mg/L] (b) Adsorption–photocatalytic degradation first-order kinetic equation fitting curve.
Water 17 00980 g007
Figure 8. (a) Effect of H2O2 dosage on the degradation efficiency [MIL-101(Fe)@MoS2 (12%) = 20 mg/mL, CR = 50 mg/L]. (b) The fitting of first-order kinetic equations for different amounts of H2O2 added.
Water 17 00980 g008
Figure 9. Effect of the initial CR concentration on the degradation efficiency [MIL-101(Fe)@MoS2 (12%) = 20 mg/mL, H2O2 = 4 mL, CR = 50 mg/L].
Water 17 00980 g009
Figure 10. (a) Effect of pH on the degradation efficiency [pH = 3–11, MIL-101(Fe)@MoS2 (12%) = 20 mg/mL, H2O2 = 4 mL, Congo red (CR) = 50 mg/L]; (b) catalyst’s pHzpc value.
Water 17 00980 g010
Figure 11. (a) Comparison of the contribution of MIL-101(Fe)@MoS2 to CR degradation and adsorption under different conditions [pH = 3–11, MIL-101(Fe)@MoS2 (12%) = 20 mg/mL, H2O2 = 4 mL, CR = 50 mg/L, pH = 7]; (b) CR rate constant through the photo-Fenton reaction.
Water 17 00980 g011
Figure 12. Congo red (CR) mineralization rate under photo-Fenton conditions with MIL-101(Fe)@MoS2 [MIL-101(Fe)@MoS2 (12%) = 20 mg/mL, H2O2 = 4 mL, CR = 50 mg/L, pH = 7].
Water 17 00980 g012
Figure 13. (a) Removal efficiency of Congo red (CR) by MIL-101(Fe)@MoS2 in the presence of various scavengers; (b) EPR spectra of 5,5-dimethyl-1-pyrroline N-oxide (DMPO) spin-trapping adducts in the MIL-101(Fe)@MoS2 system after the photo-Fenton process [catalyst dosage = 20 mg/mL, H2O2 = 4 mm, scavenger concentration = 1 mM].
Water 17 00980 g013
Figure 14. (a) Ultraviolet–visible (UV-Vis) absorbance spectrum for MIL-101(Fe), MoS2, and MIL-101(Fe)@MoS2 and (b) their band gap values.
Water 17 00980 g014
Figure 15. (a) Evaluation of the reusability of MIL-101(Fe)@MoS2; (b) scanning electron microscopy (SEM) analysis of the MIL-101(Fe)@MoS2 after the photo-Fenton reaction; (c) Fourier transform infrared (FT-IR) comparison before and after the photo-Fenton reaction; and (d) X-ray diffraction (XRD) comparison before and after the photo-Fenton reaction.
Water 17 00980 g015
Figure 16. MIL-101(Fe)@MoS2 leached metal concentration [MIL-101(Fe)@MoS2 (12%) = 20 mg/mL, H2O2 = 4 mL, CR = 50 mg/L, pH = 7].
Water 17 00980 g016
Table 1. Comparison between the performance of previously reported photocatalysts and MIL-101(Fe)@MoS2.
Catalyst TypePollutants
(Concentration)
Degradation
Time
Degradation EfficiencyReaction Rate Constant min−1Repeatability StabilityLiterature
Source
TiO2-g-C3N4-10Congo red
(100 mg/L)
180 min100%0.0104After five cycles:
83.7%
[51]
RGO-modified MIL-125 (Ti)Congo red
(10 mg/L)
180 min92.60%0.012After four cycles:
65.2%
[52]
Ultrathin oxygen-doped g-C3N4 nanosheetsCongo red
(20 mg/L)
120 min83.10%0.0131-[53]
Fe-doped BiOBr hollow spheres (7% Fe)Congo red
(50 mg/L)
180 min89.66%0.00935-[54]
GCN/CdO/CaFe2O4 ternary heterojunctionCongo red
(5 × 10⁻⁶ M)
60 min88%-After five cycles: 80%[55]
MIL-101(Fe)@MoS2Congo red
(50 mg/L)
30 min100%0.204After five cycles: 90.8%This work
Disclaimer/Publisher’s Note: The statements, opinions and data contained in all publications are solely those of the individual author(s) and contributor(s) and not of MDPI and/or the editor(s). MDPI and/or the editor(s) disclaim responsibility for any injury to people or property resulting from any ideas, methods, instructions or products referred to in the content.

