Article

The Investigation of Two-Phase Fluid Flow Structure Within Rock Fracture Evolution in Terms of Flow Velocity: The Role of Fracture Surface Roughness and Shear Displacement

1
Chongqing Institute of Geology and Mineral Resources, Chongqing 401120, China
2
State Key Laboratory of Mountain Bridge and Tunnel Engineering, Chongqing Jiaotong University, Chongqing 400074, China
3
Chongqing Expressway Group Co., Ltd., Chongqing 401120, China
4
State Grid Xuzhou Power Supply Company, Xuzhou 221000, China
5
State Key Laboratory of Coal Mine Disaster Dynamics and Control, Chongqing University, Chongqing 400044, China
6
Chongqing Municipal Transportation Commission, Chongqing 401147, China
*
Authors to whom correspondence should be addressed.
Water 2025, 17(7), 973; https://doi.org/10.3390/w17070973
Submission received: 27 January 2025 / Revised: 20 March 2025 / Accepted: 21 March 2025 / Published: 26 March 2025

Abstract

:
Understanding the structural evolution of two-phase fluid flow in fractured rock is of great significance for related rock engineering, including underground oil and gas extraction, contaminant storage and leakage, etc. Considering that rock fracture is the fundamental element of fractured rock, we conduct a series of numerical simulations to investigate the role of fracture aperture, surface roughness and shear displacement in the transition of two-phase fluid flow. The roughness fracture surfaces were generated by a MATLAB code we developed according to successive random addition algorithms. The level set method was applied to describe two-phase fluid flow and the numerical solution of the governing equations in COMSOL 6.2, and its effectiveness was verified by comparing it with the results of previous experiments. Numerical simulation results indicated the following: the water saturation (Sw) in the fracture decreases with an increase in the gas–water flow rate ratio; with an increase in roughness, the water saturation contained within the fracture gradually increases; the effect of fracture roughness on the two-phase fluid flow structure is enhanced; with an increase in dislocations, the water saturation in the low-roughness fracture increases, and the water saturation in the high-roughness fracture first increases and then decreases. The results of this study can provide reference significance for the study of gas–water two-phase fluid flow and provide theoretical guidance in related engineering.

1. Introduction

Rock fractures are widespread in various types of rock formations, particularly in surface-exposed or shallowly buried regions [1,2,3]. These fractures, especially when forming a network, serve as critical pathways for fluid and heat migration in underground fractured rock systems [4,5]. They are also the primary channel for multiphase fluid flow, facilitating the transport of underground resources such as oil, natural gas, and potentially hazardous pollutants [6]. However, the random spatial distribution, pronounced anisotropy, non-uniform fracture medium properties, diverse fracture scales and widths, along with the complexity of multiphase fluid flow patterns, make the storage and transport dynamics within rock fractures highly intricate [7]. Quantitative modeling of multiphase fluid transport in such complex rock fracture systems remains a significant challenge. Since single fractures constitute the fundamental units of fracture networks, it is essential to investigate the multiphase fluid flow behavior within individual fractures to better understand the flow processes in fractured rock masses [8]. Key factors influencing the behavior of multiphase fluid flow in fracture media mainly include fracture aperture, fracture orientation, surface roughness, surface tension, fluid properties, and scale effects [9,10]. These factors collectively determine the mechanisms of multiphase fluid flow in the medium. Among them, surface roughness and fracture aperture are key parameters that describe the geometric properties of fractures and critically influence their fluid flow behavior [11]. Consequently, the accurate and effective modeling of multiphase fluid flow within a single rock fracture holds immense theoretical importance and significant practical and strategic value for applications of multiphase flow structures to enhance underground oil and gas recovery, optimize extraction processes, and evaluate the impact of fracture networks on water storage and transport [12,13].
Investigating the migration patterns of two-phase fluid flow in fractured media lays the groundwork for enhancing oil and gas extraction efficiency [14,15]. The fluid flow structure mainly contains the following types: laminar flow, slug flow, annular flow, bubble flow and turbulent flow [16,17]. If the two-phase fluid flow structures transition from laminar flow to slug flow, that means the fluid changes from a steady flow into an unsteady flow pattern, which can lead to flow and pressure instability [18]. The gas and liquid phases alternate in the form of segment plugs, the presence of which causes a significant increase in resistance to flow, causing the liquid phase to be intermittently squeezed and moved through the fracture, resulting in an increase in the localized pressure gradient and the system requiring higher energy or pressure to maintain the flow, decreasing the overall flow efficiency [19]. The study of two-phase flow structures can enhance underground oil and gas recovery, optimize extraction processes, and evaluate the impact of fracture networks on water storage and transport [20,21].
Currently, physical simulation experiments are the primary method used to study the flow behavior of gas–liquid two-phase fluid in fractures [22]. Research indicates that segmental plug flow occurs during the early stages of gas–liquid two-phase flow and the late stages of gas flow decline [23,24]. When the liquid phase “lifted” by the gas flow in the fracture contacts the fracture wall, the Bernoulli effect causes an increase in gas-phase velocity, resulting in a pressure drop at the wave crest. This pressure drop increases the number of waves around the crest under the surrounding pressure field; simultaneously, gravity reduces the number of waves [25]. When the Bernoulli effect outweighs gravity and the wave touches the top of the pipe, the pipe diameter becomes blocked, forming a segmental plug. Wang et al. [26], through comparative analysis of experiments and field data, found that lower reservoir permeability, higher driving pressure differences, and greater fluid surface tension increase the likelihood of segmental plug flow. Based on the transport dynamics of gas and liquid phases in fractures, Wang classified segmental plug flow into four stages: plug formation, plug outflow, gas–liquid eruption, and liquid reflux. Azim et al. [10] revealed the micro-scale segmental plug flow behavior in coal bed gas and liquid systems, concluding that in segmental plug flow, the relative permeability of gas has a negative exponential relationship with water saturation (Sw). Wang [27] conducted experimental studies on segmental plug flow in horizontal pipes and found that the angle of the reducer cone affects the gas–liquid distribution, as well as the pressure and velocity of the segmental plug flow in horizontal reducer pipes.
Compared with laboratory tests, where the number of specimens is limited and difficult to repeat, numerical simulation can obtain a set geometry and arbitrary boundary conditions for two-phase fluid flow [28]. The numerical simulation methods currently used to simulate two-phase fluid flow in rock fractures mainly include the Volume of Fluid (VOF) method, the lattice Boltzmann (LBM) method, and the level set method [29,30,31,32,33]. Wang et al. [29] investigated the effects of fluid flow rate and wettability on the flow structure of two-phase fluids in 1D fractures. Guiltinan et al. [30] investigated the effect of heterogeneous wetting properties of 2D fractures on supercritical carbon dioxide displacement of water based on the LBM method. Zhao et al. [31] investigated the effect of wettability heterogeneity on the relative permeability of two-phase flow in porous media using a multiple relaxation time colored gradient LBM model. Huang et al. [32] used the VOF method to analyze the flow characteristics of the gas phase in different fluids at the microscopic scale in a 1D fracture as well as the effect of fluid parameters on the flow pattern. Liu et al. [33] used the level set method to simulate the evolution of the plug structure under the effect of different flow ratios, fracture surface wettability and fracture tortuosity in 1D fractures. These studies have provided a solid foundation for understanding the evolution of two-phase fluid flow structures in fractures. However, the influence of two-phase fluid flow velocity, surface roughness, and shear displacement on the evolution of two-phase fluid flow structures remains unclear.
In this study, we first generate curves with predetermined roughness based on the successive random additions (SRA) method and then form a surface roughness crack model with different spatial distributions of openings through lifting and shearing. Then, we carry out numerical simulations of two-phase fluid flow by using the level set method to investigate the matching/mismatching roughness cracks on the surface for different two-phase flow rates; finally, we analyze the effects of the two-phase fluid flow rate, surface roughness, and shear on the two-phase fluid flow. The influence of the two-phase fluid flow velocity, surface roughness, and shear on the two-phase fluid flow structure is analyzed.

2. Research Methodology

2.1. Governing Equations

During the modeling study of immiscible two-phase fluids in a fracture, the diffusion effect out of the interface of the two-phase fluids is equivalent, and the convective velocity satisfies the law of zero dispersion. Therefore, the continuity equation and the time-varying Navier–Stokes equation are used for modeling [34]:
u = 0
ρ u t + ρ ( u ) u = [ p I + μ ( u + ( u ) T ] + F g + F st + F
where u is the velocity vector, m/s; ρ is fluid density, kg/m3; p is fluid pressure, Pa; I is unit matrix; Fg is gravity, N/m3; F is other external forces in the system, N/m3; Fst is surface tension, N/m3; μ is dynamic viscosity, Pa·s. surface tension Fst satisfies the following equation [35]:
F st = σ κ δ n
where σ is the surface tension coefficient, N·s/m2; κ is interface curvature, κ = · n ; n is unit normal vector at the interface of a two-phase fluid, which can be expressed as n = φ / φ ; δ is Dirac delta function, which can be expressed as δ F = 6 φ φ ( 1 φ ) .
In the level set method, the distribution of two-phase fluid in the fracture space can be described by the level set function φ. The level set function φ can be varied continuously between 0 and 1. When φ < 0.5, the region is occupied by one of the two-phase fluids, and when φ > 0.5, the region is occupied by another phase, and the flow interface of the two-phase fluids is when φ = 0.5. In this study, level set functions are defined as follows [36]:
φ < 0.5   Water = 0.5   Interface > 0.5   Gas
Based on the level set approach, the density and dynamic viscosity in functioning Equation (2) can be defined as:
ρ = ρ w + ( ρ g ρ w ) φ
μ = μ w + ( μ g μ w ) φ
The two-phase fluid flow interface can be described by the advection equation:
φ t + u φ = 0
The interface thickness of the two-phase fluid during the numerical simulation of the two-phase fluid flow uses a fixed interface thickness and allows the smoothing parameter to vary. In addition, to improve the stability during the simulation process, the phase reinjection equation is introduced into the flow interface equation of the two-phase fluid, which can be obtained from the following equation [37]:
φ t + u φ = γ . ( ε φ φ ( 1 φ ) φ φ )
where ε and γ are model parameters related to mesh size and velocity field, respectively.

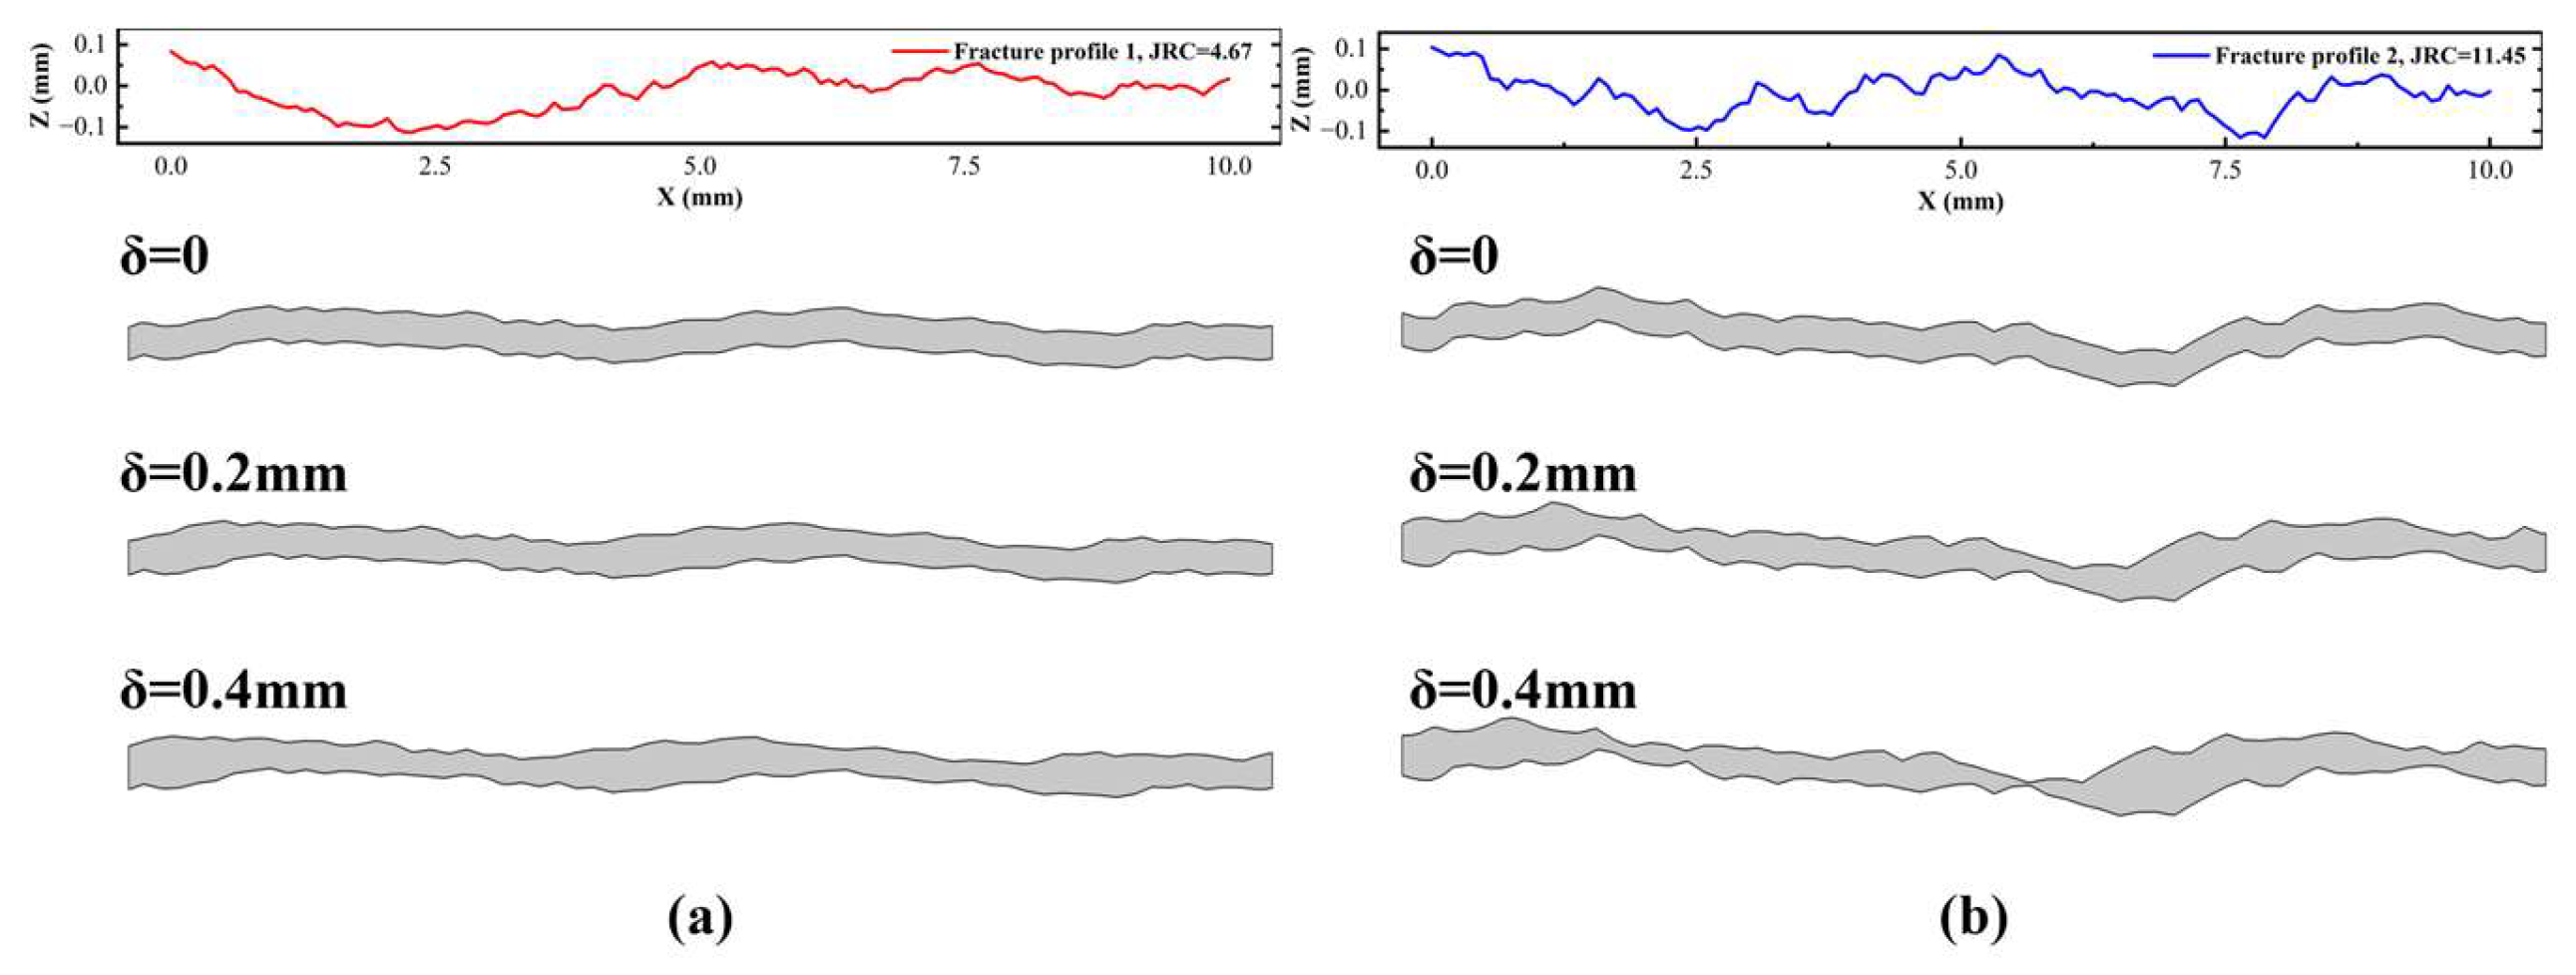
2.2. Rough Fracture Geometry Model Generation

The surface topographic characteristics of natural rock fractures can be effectively described using fractal geometry methods. Previous studies have shown that the roughness of natural rock fracture surfaces closely aligns with the randomly generated fracture surfaces obtained through fractal geometry, indicating its suitability for modeling complex fracture morphologies [38]. As an extension of traditional Brownian motion, fractal Brownian motion (FBM) effectively captures the self-affine characteristics of rough rock fracture surfaces. Among the various algorithms based on FBM, the successive random additions (SRA) algorithm is particularly efficient and computationally fast for generating rough fracture surfaces. Its key advantage lies in its ability to construct fracture surfaces with varying degrees of roughness, making it a valuable tool for simulating natural rock fractures.
In one-dimensional fractal Brownian motion, the position of any point on the cleavage surface can be defined by a random and continuous single-valued function Z(x), and the increment at the lag distance h with the origin satisfies a Gaussian distribution with mean 0 and variance σ2. Based on the mean and variance of the increments, the self-affine nature of the fractal Brownian motion can be expressed by the following equation [39]:
Z ( x ) Z ( x + r h ) = 0
( Z ( x ) Z ( x + r h ) ) 2 = r 2 H ( Z ( x ) Z ( x + h ) ) 2
where r is the arbitrary constant, and H is the Hurst index.
According to Equations (9) and (10), the function increment can be expressed as:
σ rh 2 = r 2 H σ h 2
In this study, two fracture profile curves with different roughness characteristics were generated using the successive random additions (SRA) method. The surface morphology was then statistically analyzed to quantify the fracture surface roughness in relation to the flow direction of the two-phase fluids in the two-phase flow test, and the root mean square of the first-order derivatives of the fracture surface (Z2) as well as the nodal roughness coefficients (JRCs) were calculated using Equations (12) and (13) [40]:
Z 2 = 1 L i = 1 N 1 ( z i + 1 z i ) 2 x i + 1 x i
J R C = 32.2 + 32.47 log Z 2
where x—coordinate in the length direction of the fracture surface contour line; z—coordinate in the height direction of the fracture surface contour line; N—total number of data points; i—index of the data points. The specific surface morphology parameters are presented in Table 1, and the corresponding fracture profile curve is shown in Figure 1.
The surface asperity distribution of the two fracture surfaces with varying roughness, as shown in Figure 1, serves as the basis for constructing two fracture profiles with different roughness levels and uniformly distributed degrees of aperture, initially modeled as matching fractures with δ = 0. Subsequently, fractures with varying dislocation degrees are constructed by adjusting the dislocation δ values. The Δ values considered in this study are 0, 0.2 mm, and 0.4 mm, respectively. The detailed geometric models are illustrated in Figure 1.

2.3. Numerical Solution Scheme, Boundary Conditions, and Physical Parameters

In this study, the density and viscosity of the fluid at 20 °C were selected, while the dissolution of gas in water was neglected. The physical properties of the specific gas and water phases at room temperature and pressure are listed in Table 2. To account for gas compressibility, the density of nitrogen in the simulation was determined using the ideal gas equation of state, defined as:
ρ g = P M R T
where M is the molar mass of the gas; R is the gas constant, J/(mol-K); T is the gas-phase temperature, K.
The fracture cavity was initially filled with water, and the two-phase fluid inlet boundary condition for the fracture profile was set as a velocity inlet. The outlet was configured with a zero-pressure boundary and no viscous stress, while the wall contact angle was set to 60°. During the simulations conducted in this study, the initial fracture aperture was uniformly set to 0.1 mm.
In fact, due to the hydrophilicity of the fracture wall and the consideration about the two-phase fluid flow state in the actual engineering, this study sets up the two-phase fluid inlet conditions in a segmented way and divides the fracture inlet into three parts, with the upper 25% and lower 25% as the water-phase inlet and the middle 50% as the gas-phase inlet.
In this study, the coupled computation of the laminar flow module and the level set module in the multiphase flow module of COMSOL Multiphysics 6.2 is employed to simulate gas–water two-phase flow in a fracture. The laminar flow module solves the Navier–Stokes (N-S) equations for laminar flow, while the level set module enables precise tracking of the gas–water interface. Additionally, a surface tension model is implemented to account for surface tension effects. During the numerical modeling of the rough fracture in COMSOL, a segregated solver is utilized to compute the flow parameters of each phase and solve the governing equations. The generalized minimal residual solver (GMRES) is applied for model parameter computations, maintaining an error threshold of 0.001. To enhance convergence, GMRES is combined with a preconditioning method. Furthermore, the parallel sparse direct linear solver (PARDISO) is employed as a fine-mesh preprocessor to efficiently handle phase initialization and time-dependent computations, ensuring numerical stability and computational efficiency.
In order to ensure the accuracy of the simulation results, local adaptive refinement of the mesh was carried out in this study, which was used to adapt to the meandering characteristics of the fracture wall, so that the level set method can effectively simulate the actual flow state of the fluid flowing through the vicinity of the meandering wall, and, at the same time, the mesh was evaluated by recording the element count and selecting the most appropriate mesh resolution for the simulations. The total number of meshes was finally selected to be 60,000 to 70,000 meshes. The maximum unit growth rate is 1.1 and the curvature factor is 0.2.
The main steps of solving in this study can be divided into the following:
(1)
Construction of a suitable geometric model;
(2)
Define the physical parameters and variables in the model;
(3)
Introduce the control equations into the corresponding model to define the model boundary conditions and initial conditions;
(4)
Select appropriate mesh parameters for meshing;
(5)
Select the solver to solve the model;
(6)
Post-processing of the simulation results.

3. Results and Analysis

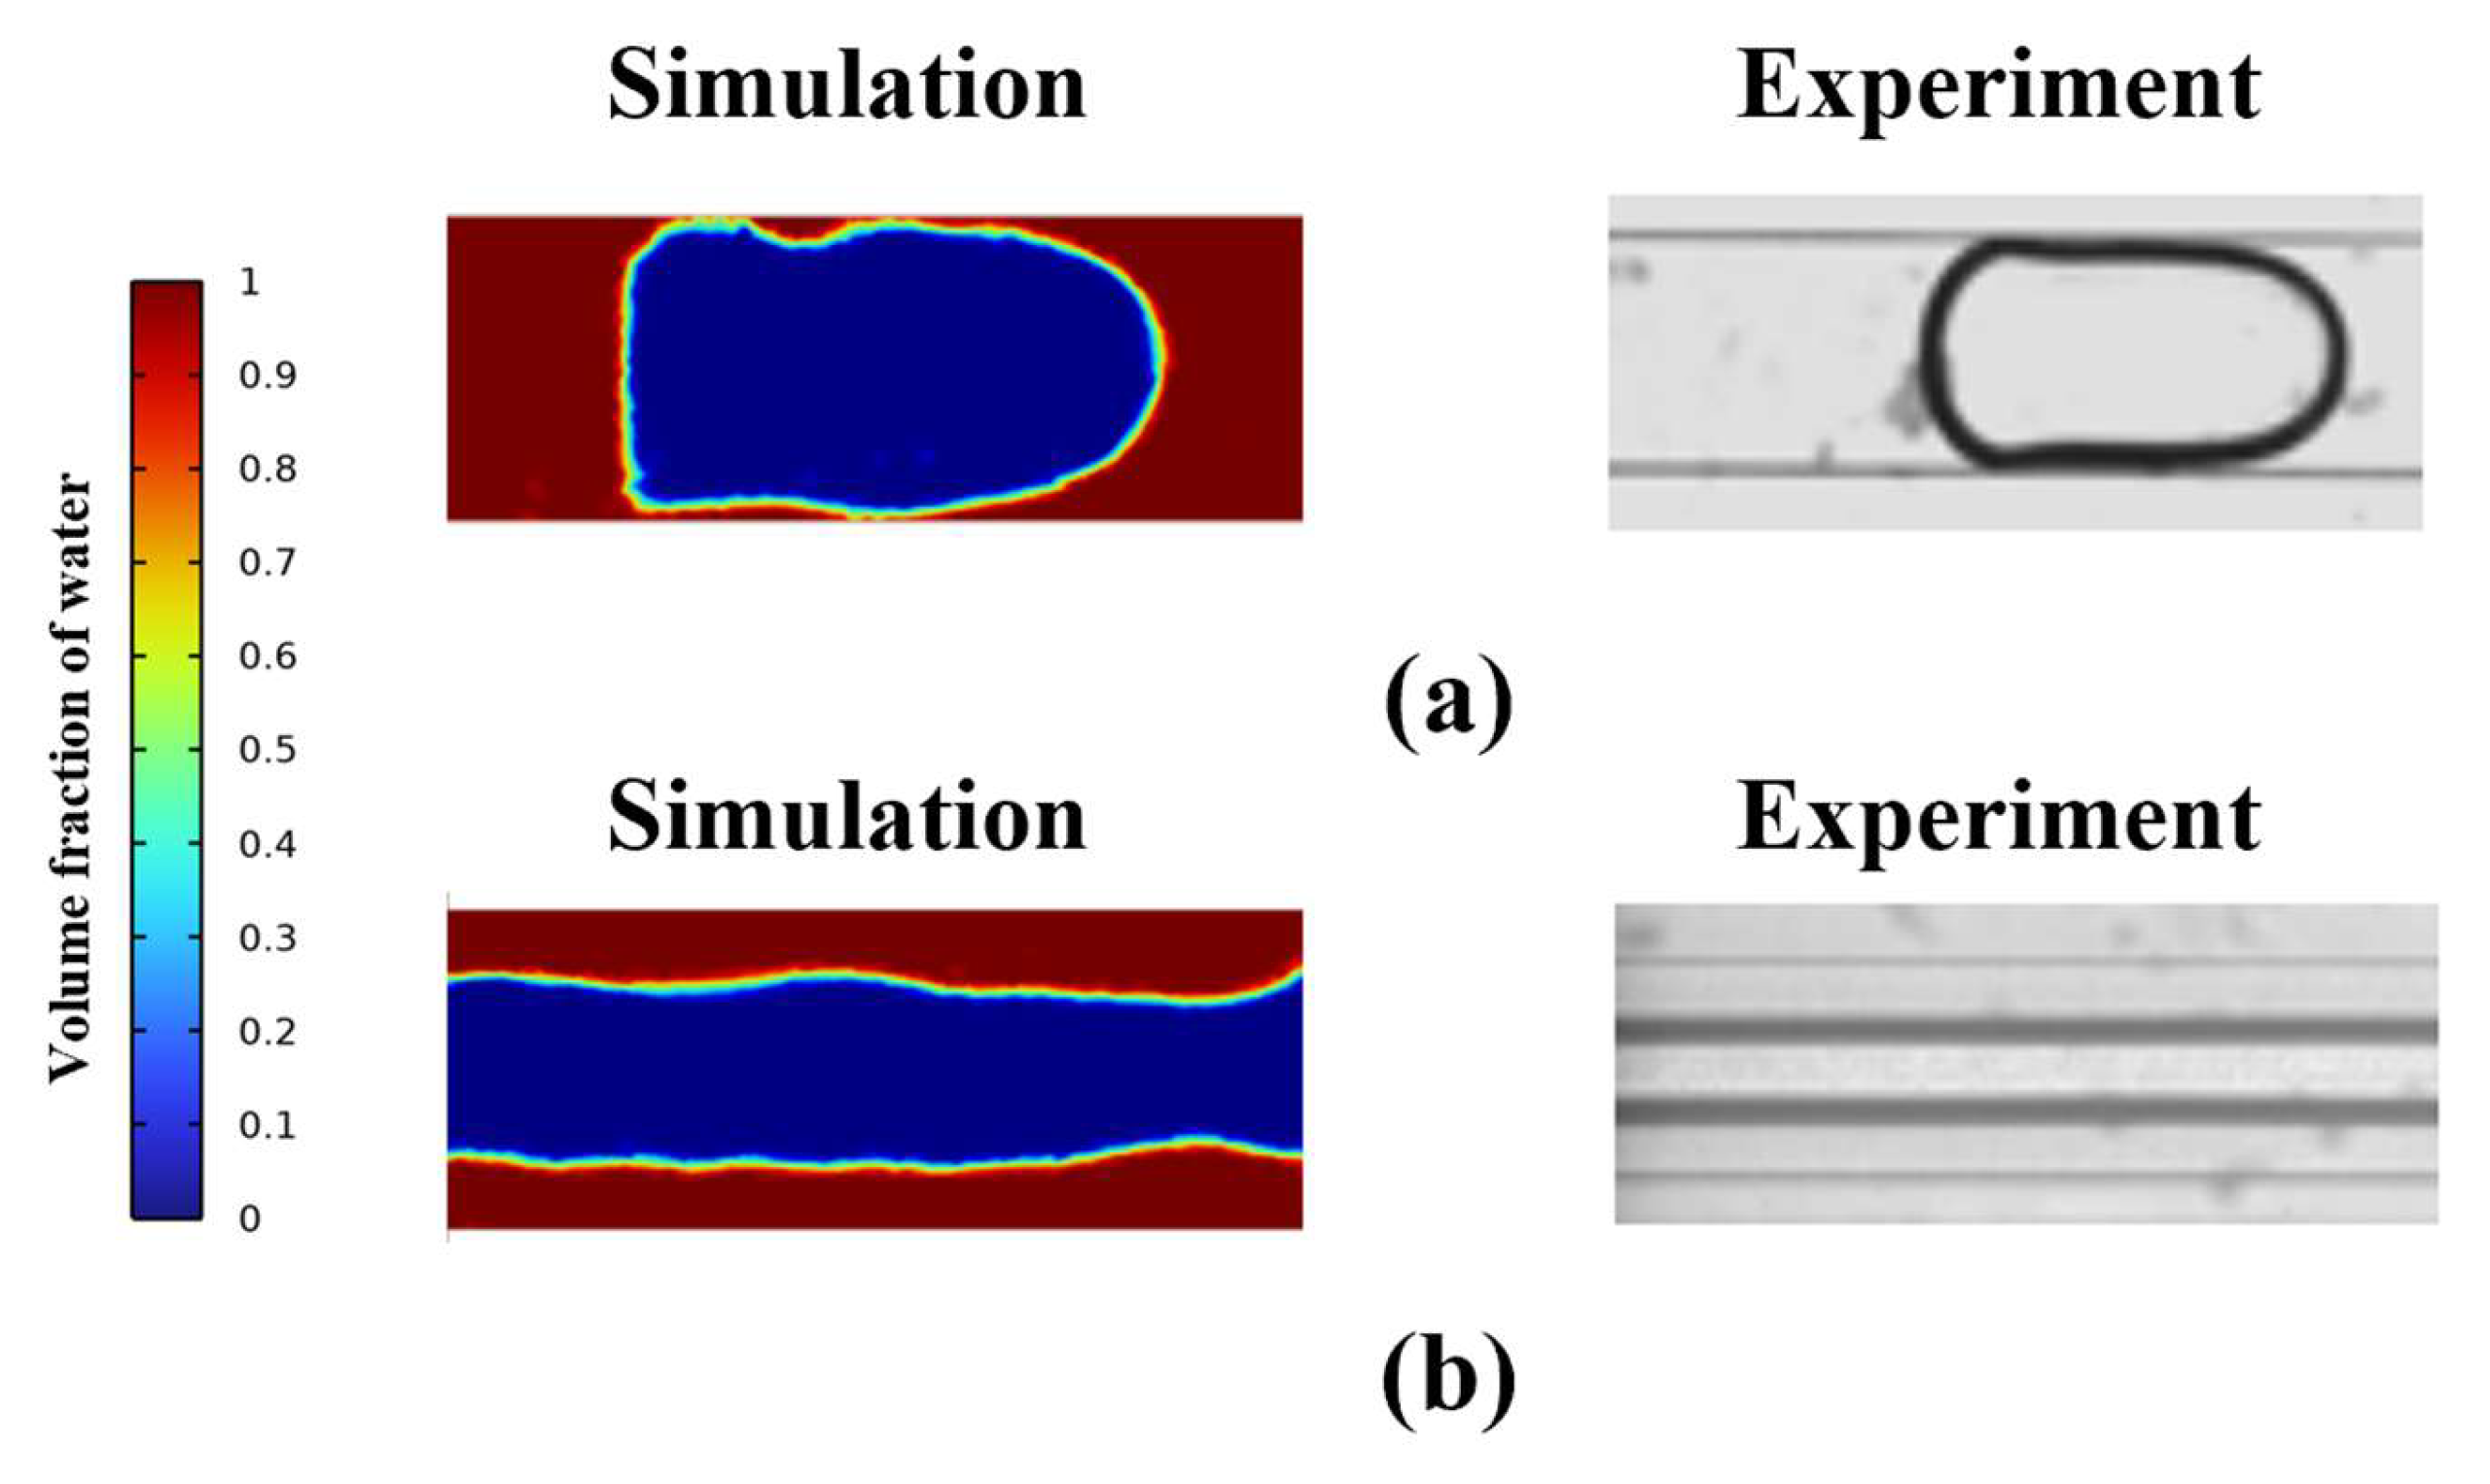
3.1. Validation of the Numerical Simulation Methods

To validate the accuracy of the numerical simulation method used in this study, the simulation results were compared with experimental findings from previous studies, ensuring that the relevant physical parameters remained consistent with those used in the experiments. In order to enhance the validity and rationality of the validation process, Table 3 demonstrates the relevant parameters used in the simulation and experimental process [41]. Figure 2 presents a comparison between the flow structures obtained through the numerical simulation in this study and the experimental results reported by Sur et al. [41]. The comparison shows a high degree of agreement, demonstrating that the numerical simulation method effectively captures the two-phase fluid flow phenomena within the channel. This validation confirms the feasibility of employing the level set method for studying gas–water two-phase flow in fractures, reinforcing the reliability of the simulation approach adopted in this study.

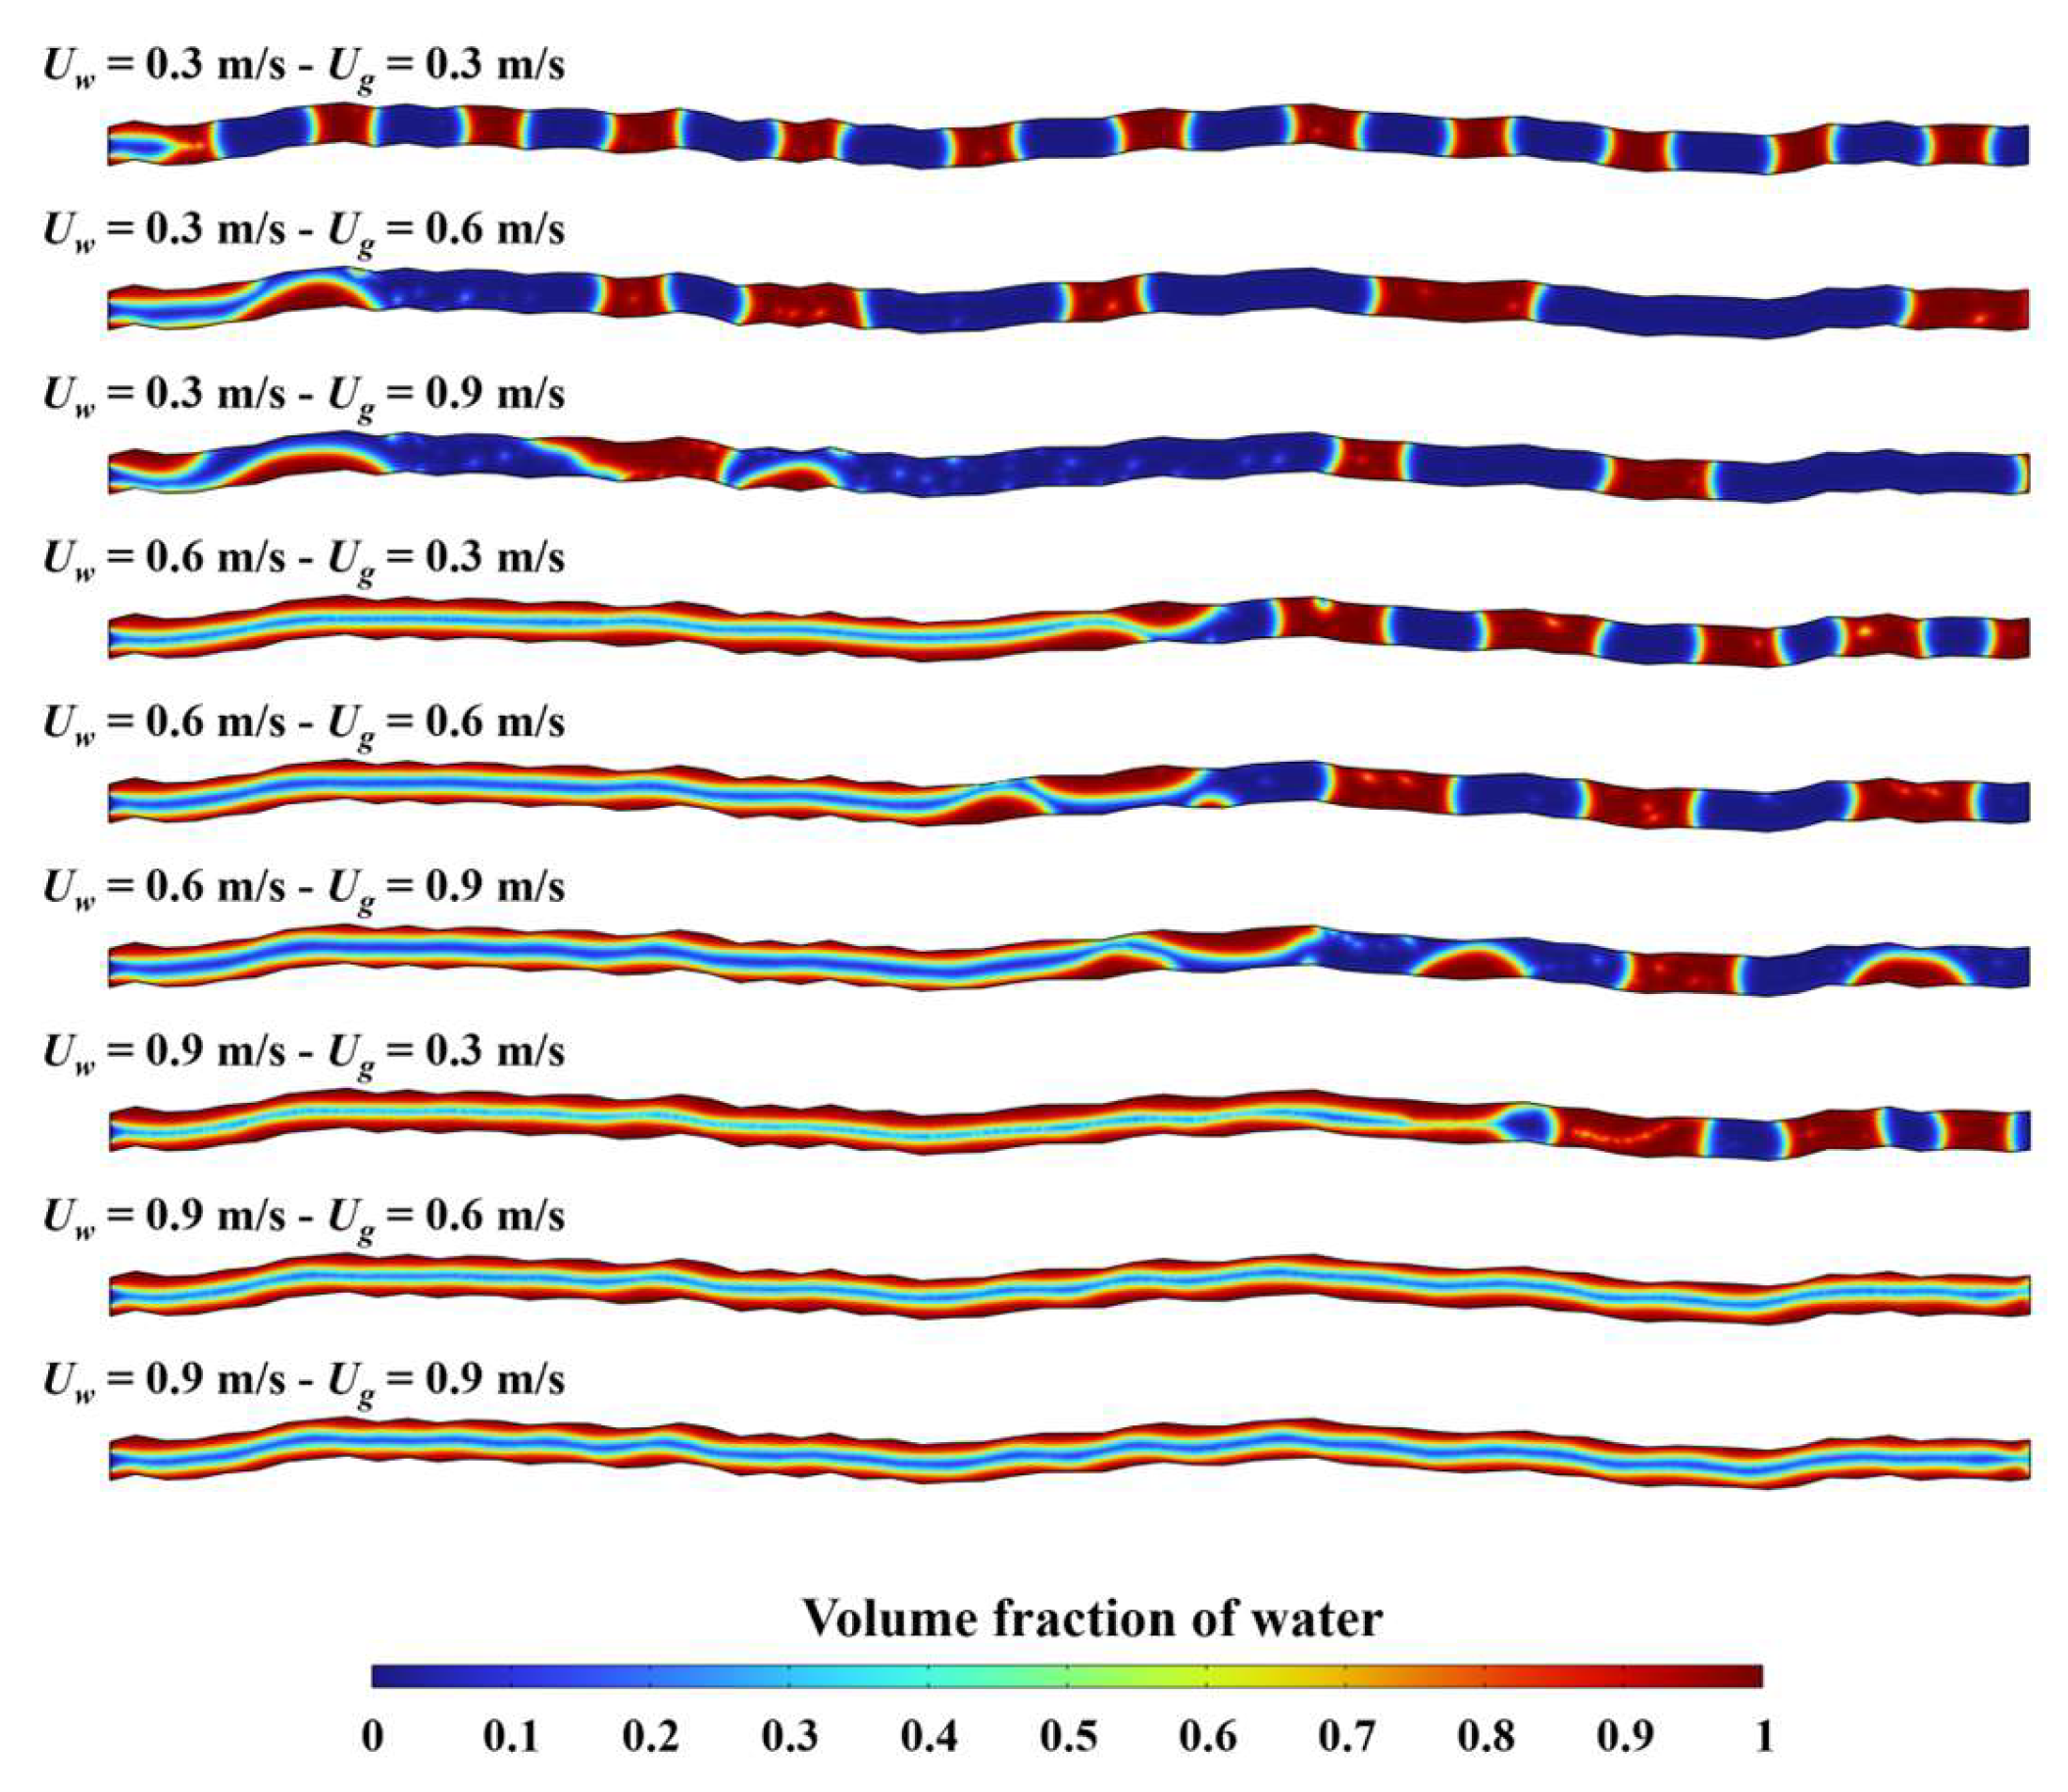
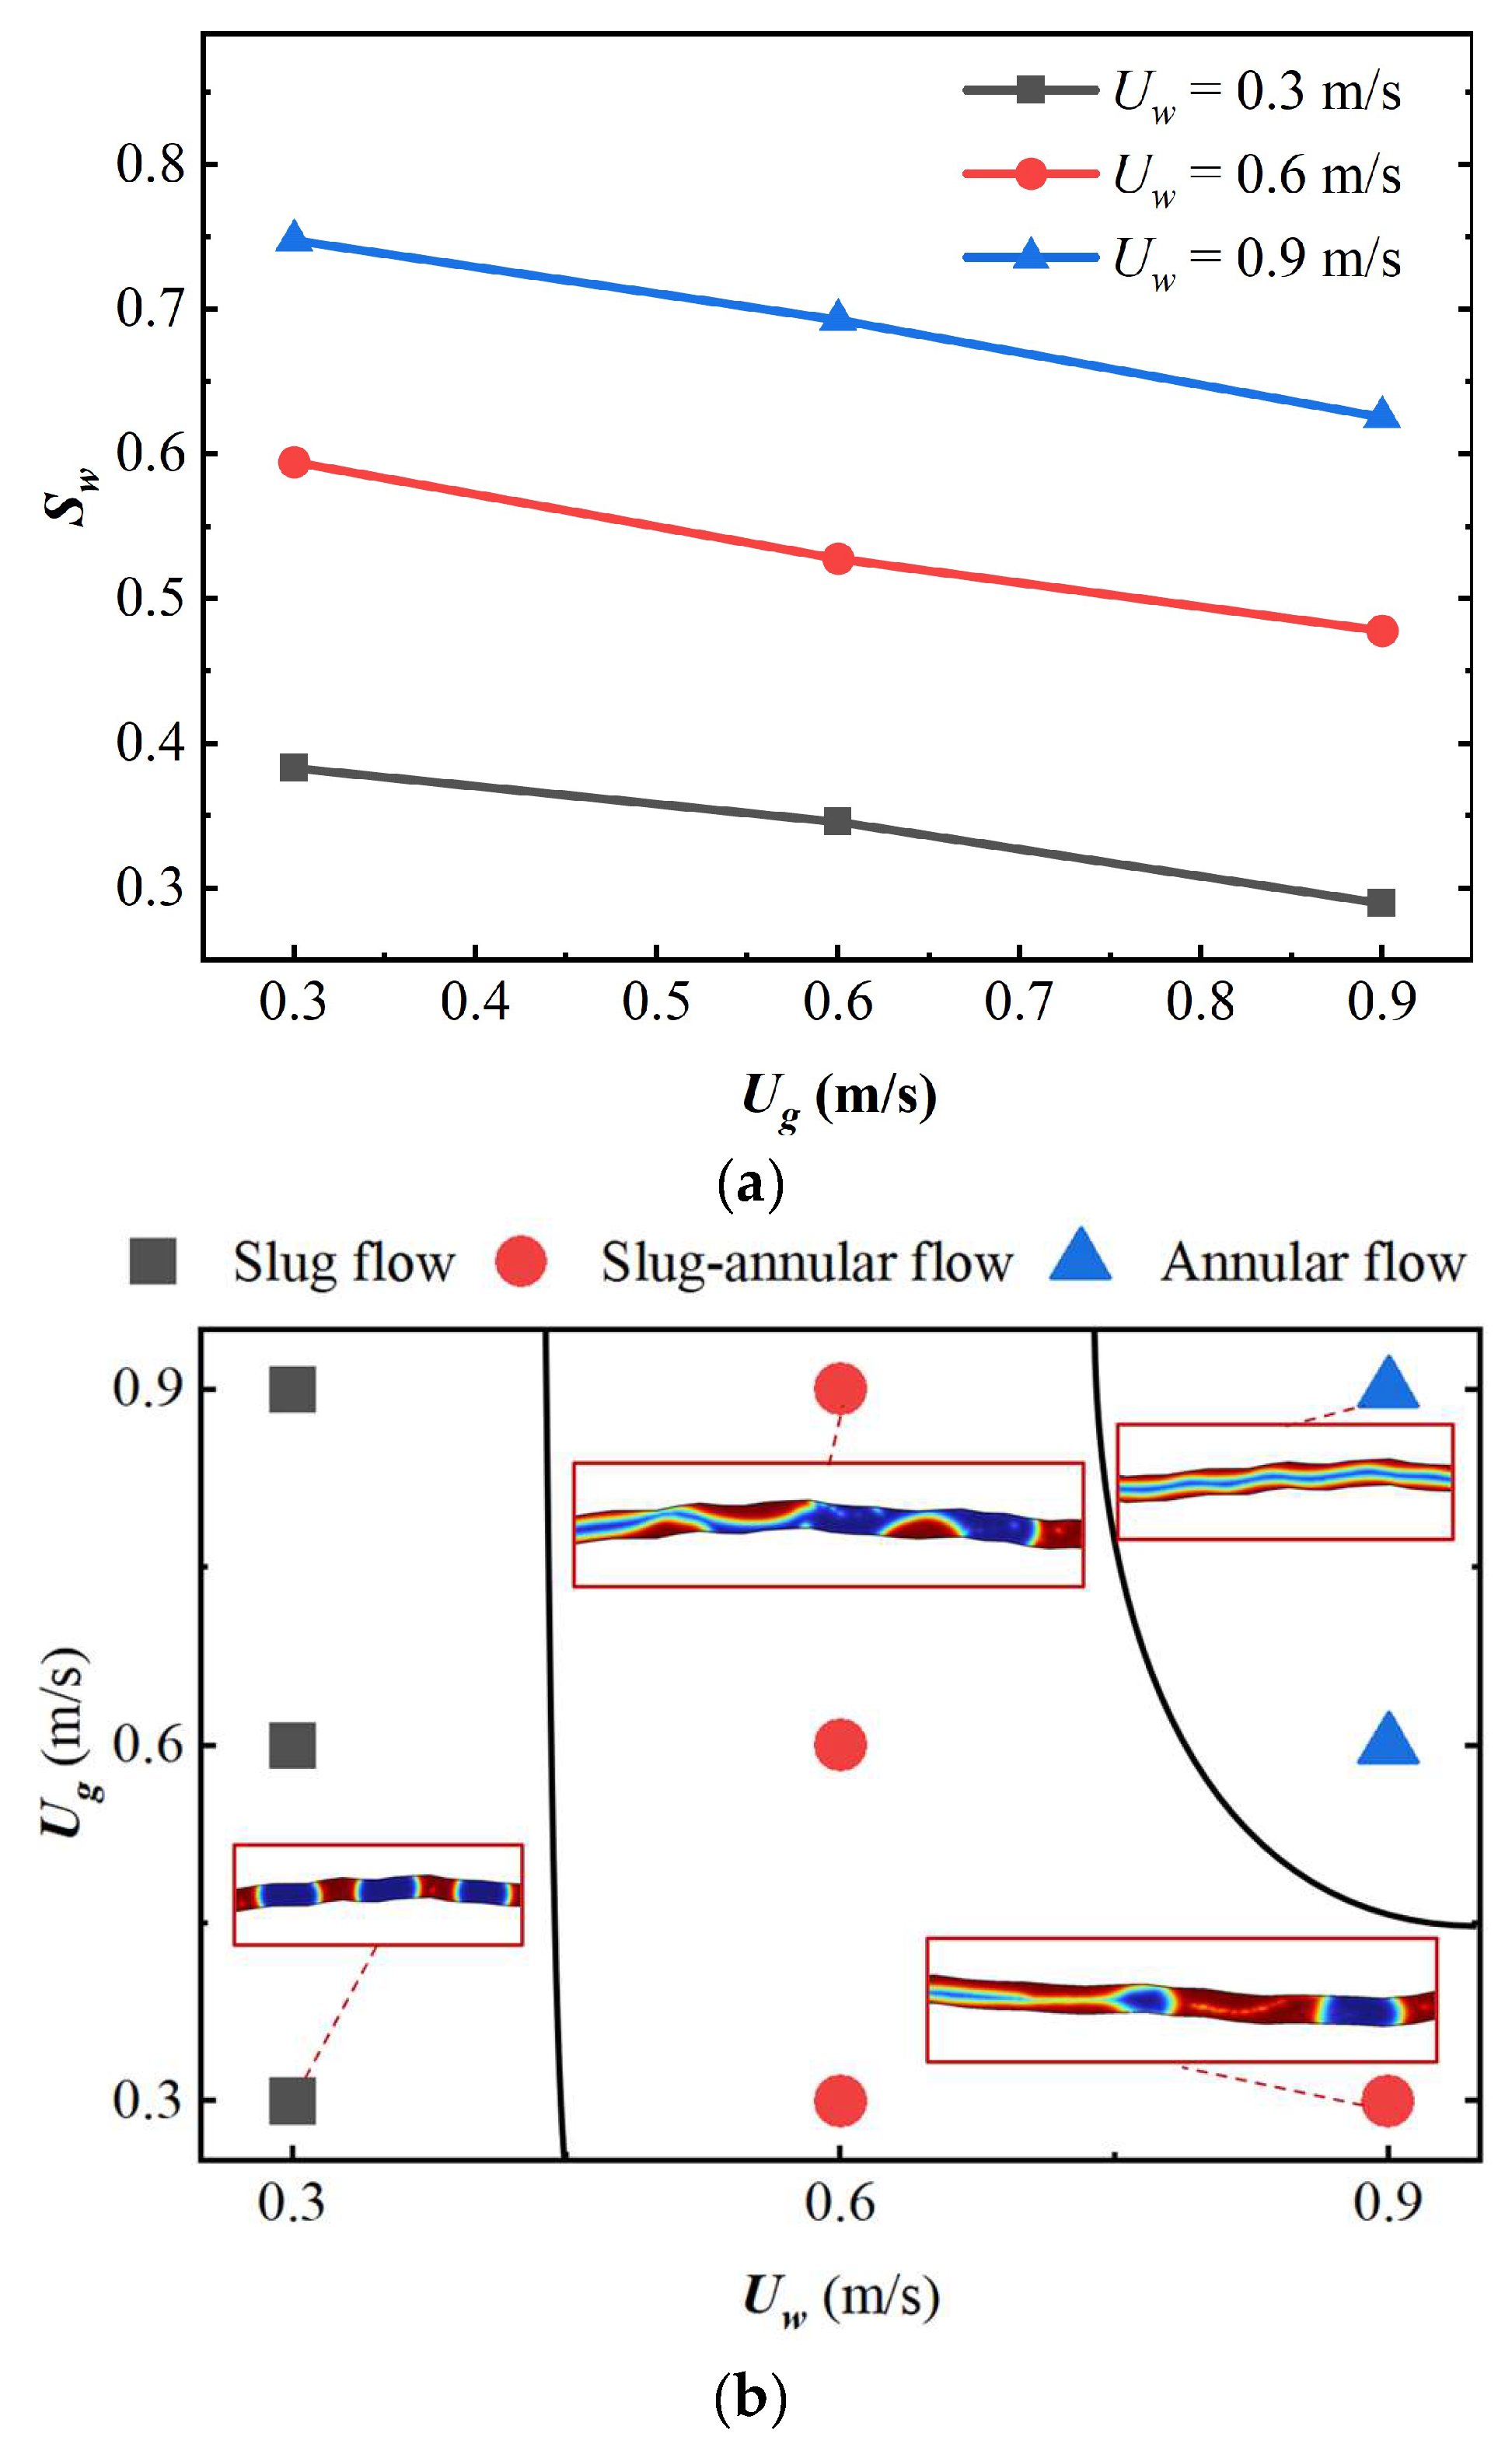
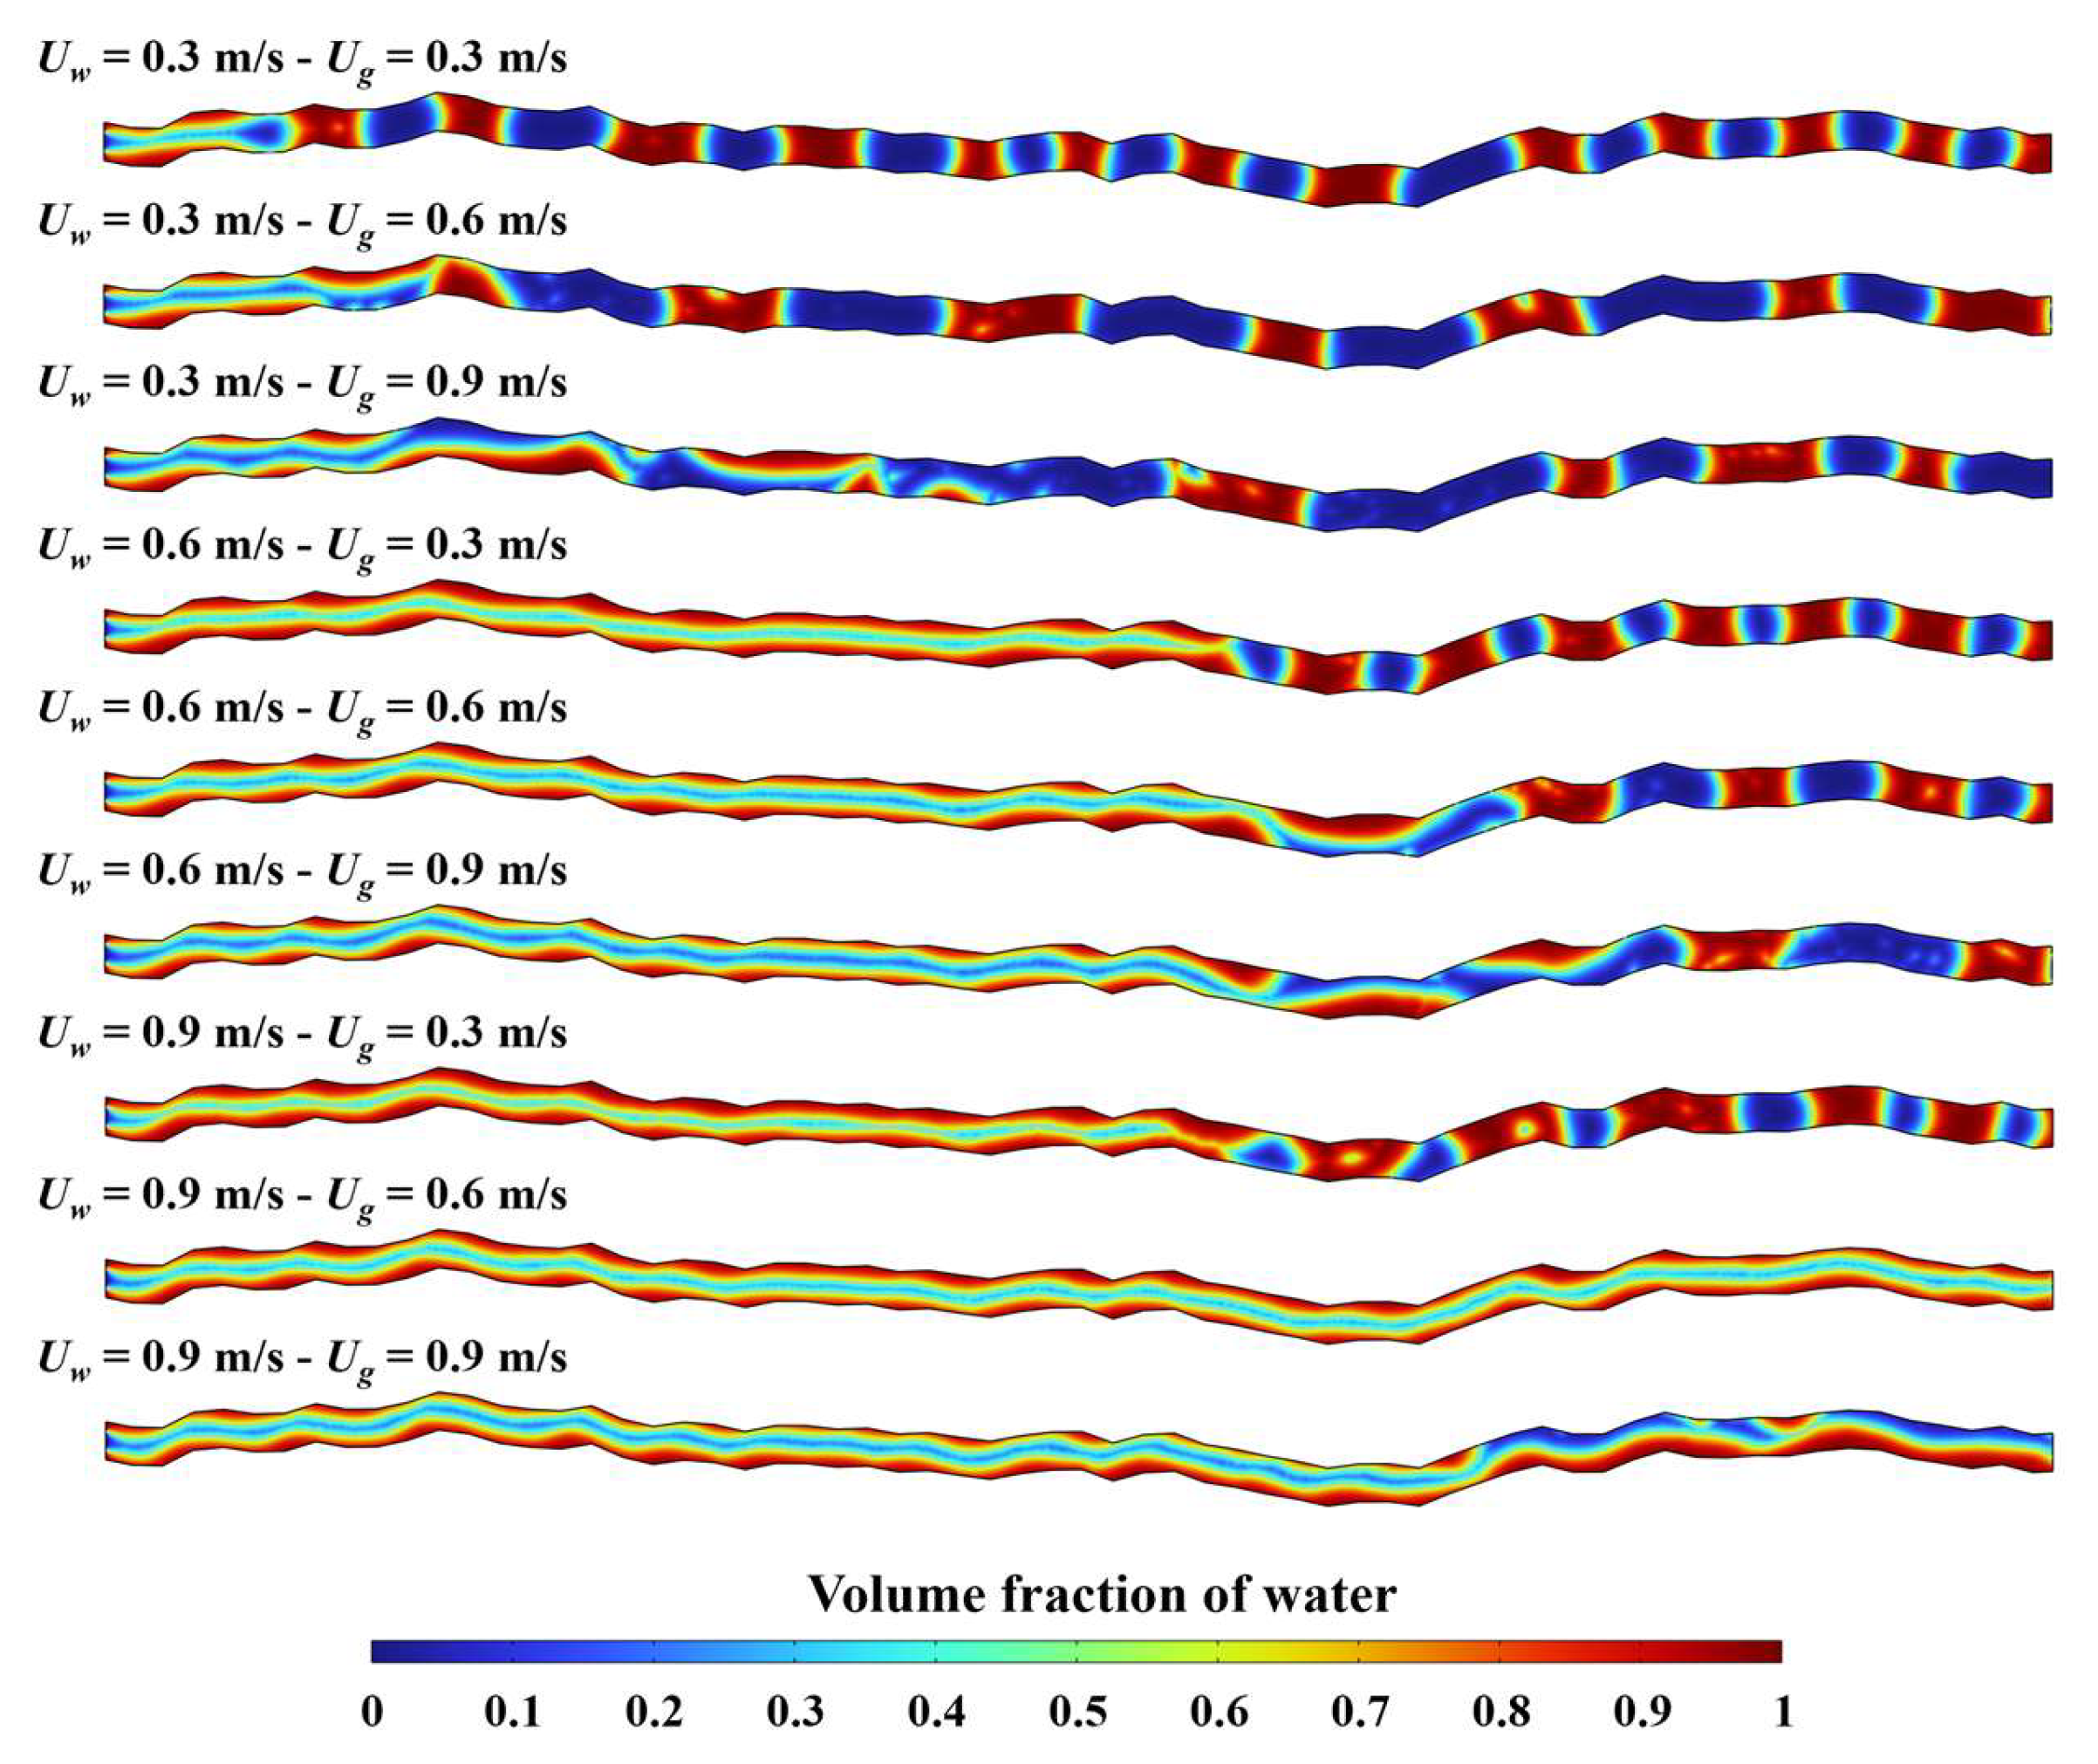
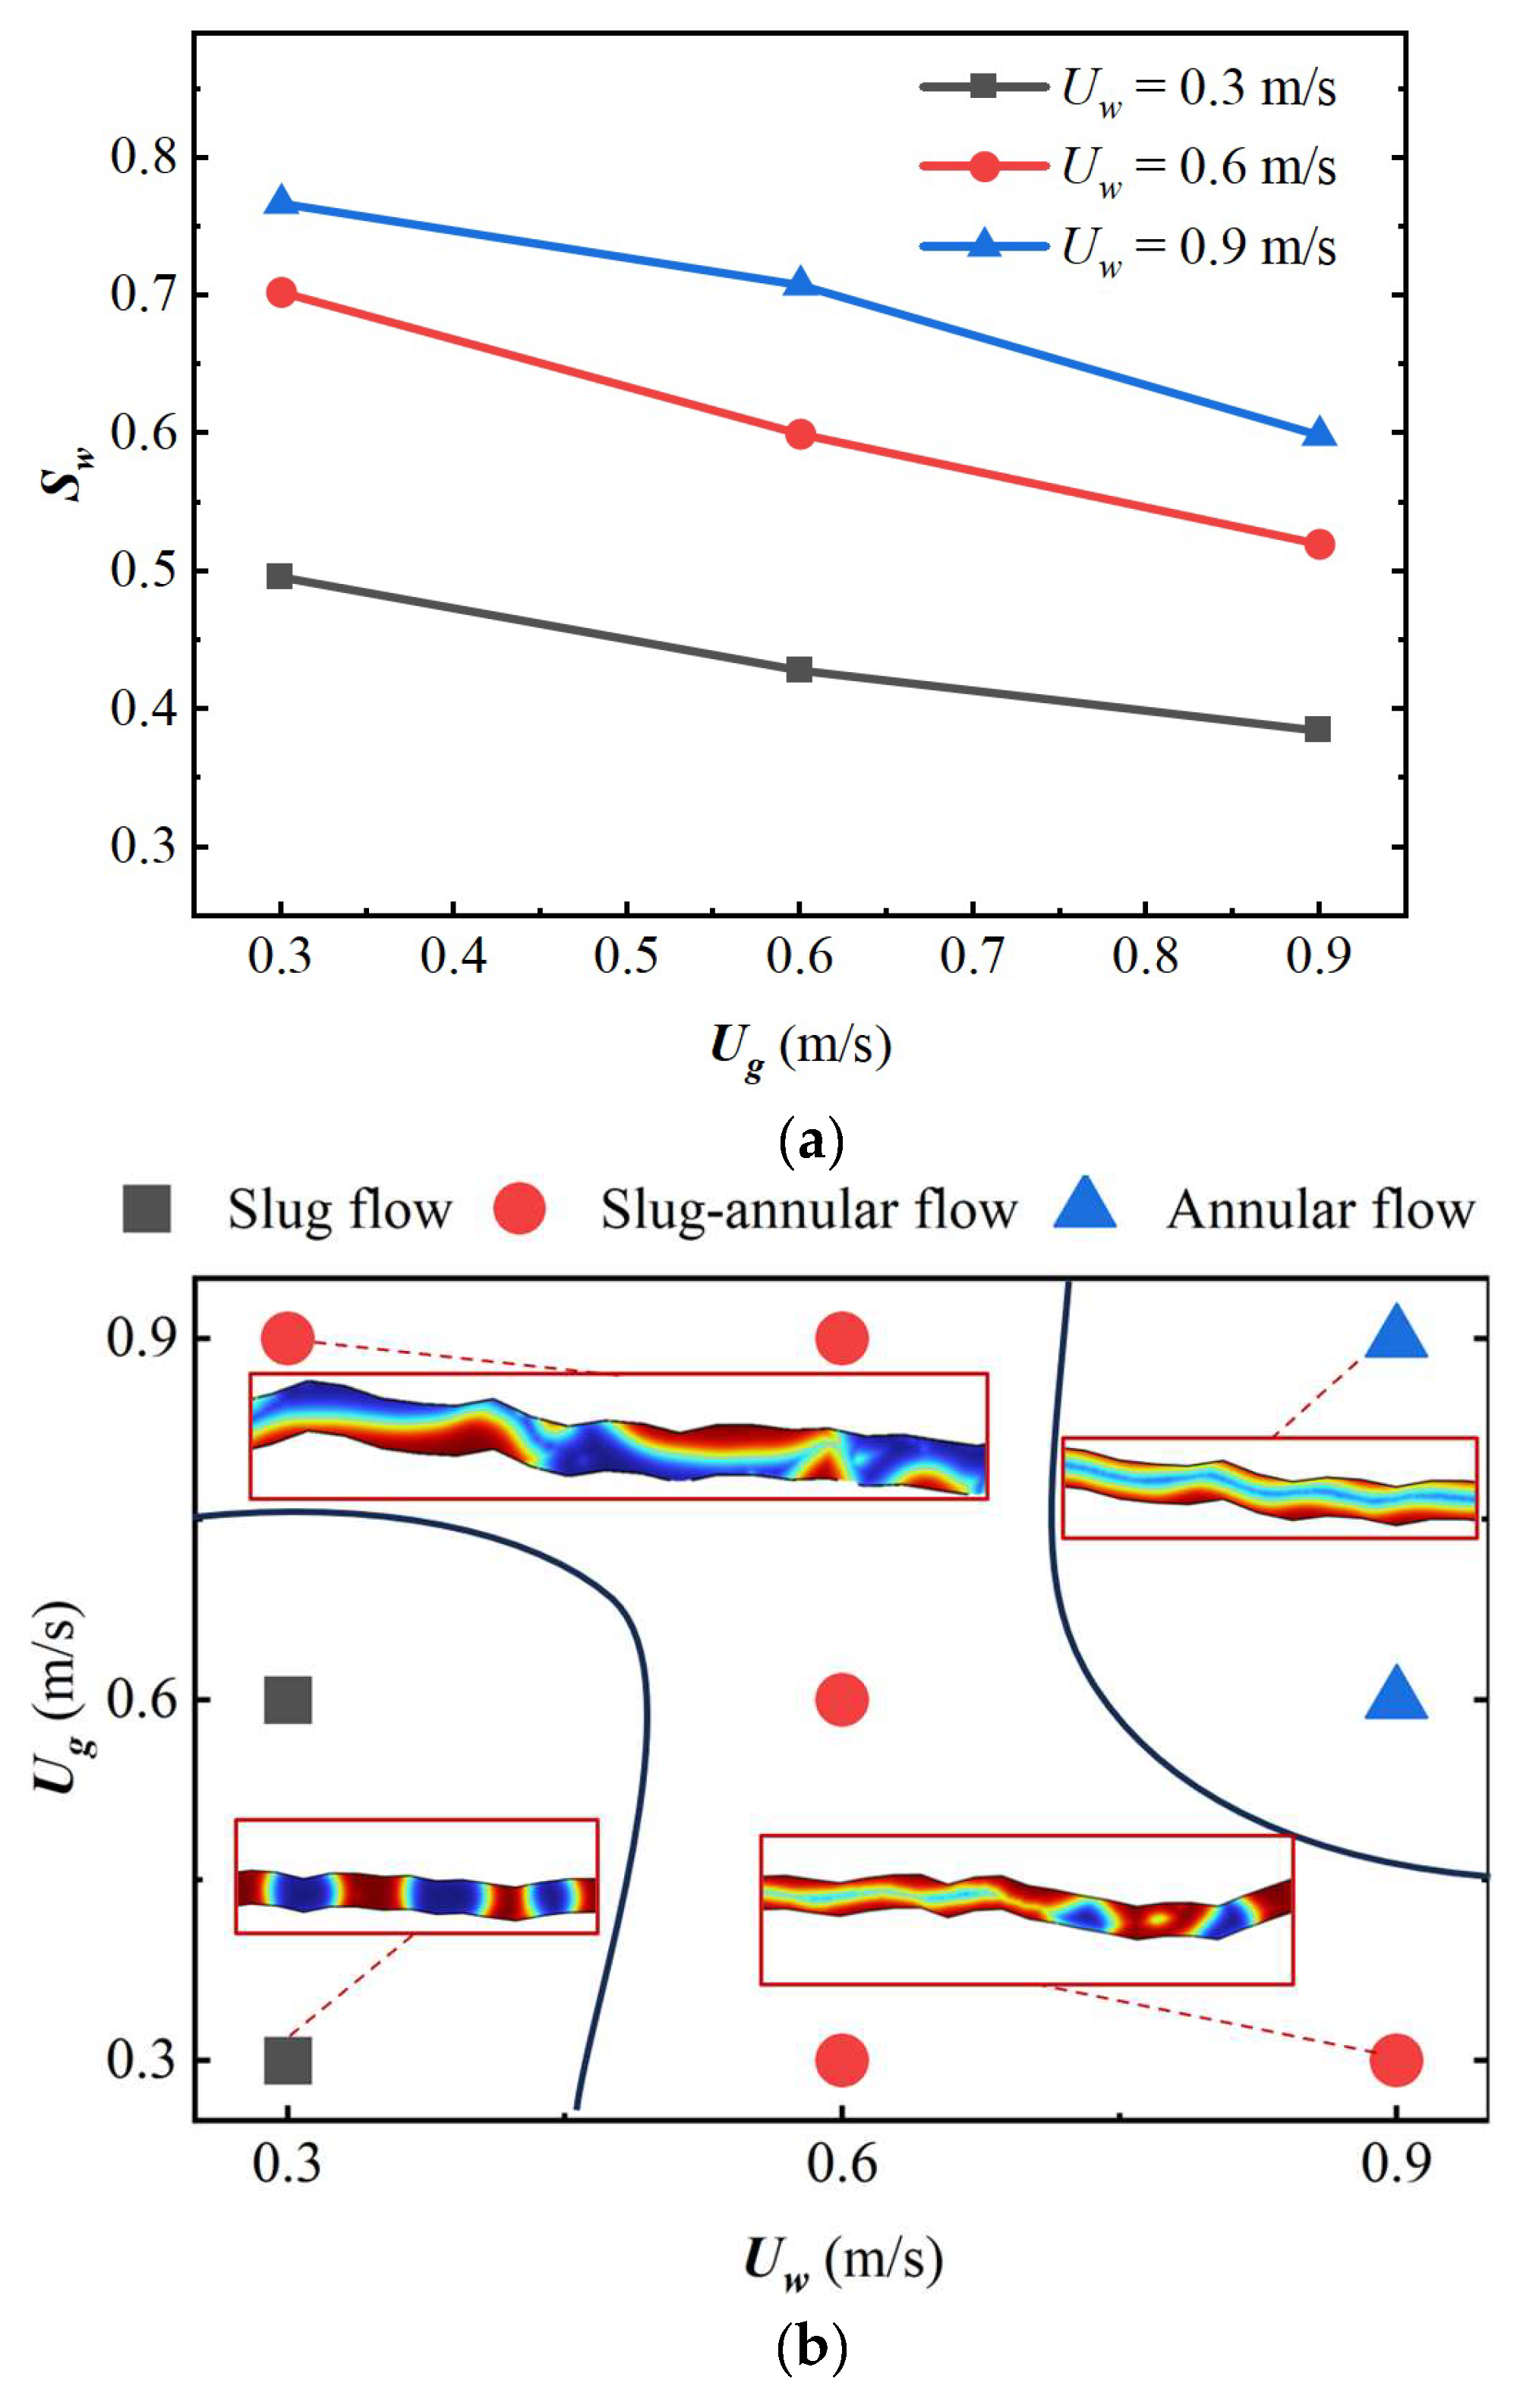
3.2. Effect of Flow Rate on the Structure of Two-Phase Fluid Flow

The flow of two-phase fluid in a fracture is influenced by multiple factors, with the flow rate being a key determinant of the flow structure. To accurately characterize the effects of different flow rates on flow patterns, this study simulates the two-phase fluid flow structure under varying gas–water flow rates, providing insights into the dynamic evolution of flow regimes within fractures.
Figure 3 demonstrates the two-phase fluid flow phase diagrams within the aperture under different flow rates. It can be seen that with an increase in flow rate, the flow structure within the aperture gradually transitions from the slug flow to the slug–annular flow and finally to the annular flow. Specifically, Figure 4 demonstrates the flow structure and water saturation evolution law within the aperture under the flow rate conditions. When Uw = 0.3 m/s, the water saturation in the aperture is between 0.3 and 0.4, the gas content in the aperture is higher than the water content, the water saturation decreases by 26% as the gas flow rate increases from 0.3 m/s to 0.9 m/s, the aperture has only one flow structure of the slug flow, and the length of the slug bubbles gradually increases with the elevation of the gas-phase flow rate. When Uw = 0.6 m/s, the water saturation in the aperture is between 0.45 and 0.6, water saturation decreases by 19% as the gas flow rate increases from 0.3 m/s to 0.9 m/s, and the structure in the aperture is slug–annular flow. With an increase in the gas-phase flow rate, the stratified structural channel in the front of the aperture gradually expands, the length of the slug bubbles gradually increases, and the aperture transitions from water-containing to gas-containing. When Uw = 0.9 m/s, the water saturation in the aperture is between 0.6 and 0.75, water saturation decreases by 16% as the gas flow rate increases from 0.3 m/s to 0.9 m/s, and the flow structure in the aperture has two kinds of flow: slug–annular flow and annular flow. With an increase in the gas-phase flow rate, the flow structure in the aperture is transitioned from the slug–annular flow to the stable annular flow, and both phases of the fluids are able to realize the stable transportation inside the aperture; the aperture is dominated by the water content. The water saturation inside the aperture decreases gradually with an increase in the gas-phase flow rate and increases gradually with an increase in the water-phase flow rate, and when both phases of the fluid flow rate are at a low level, the water saturation inside the aperture is low, and the aperture is mainly gas-containing.
Comparing the evolution of the flow structure in the aperture under different water-phase flow rates, it can be found that under the same gas-phase flow rate, with an increase in the water-phase flow rate, it is easier to form the annular flow structure in the aperture. When Uw is 0.3 m/s and 0.6 m/s, an increase in the gas-phase flow rate does not lead to the formation of stable annular flow inside the aperture, and when Uw = 0.9 m/s, the stable annular flow inside the aperture appears, which shows that a certain water-phase flow rate is necessary to form stable annular flow inside the aperture. This shows that a certain water-phase flow rate is a necessary condition for the formation of stable annular flow in the aperture, and only relying on the elevated gas-phase flow rate does not lead to the formation of stable annular flow in the aperture; the water-phase flow rate plays an important role in the formation of a stable structure in the aperture.

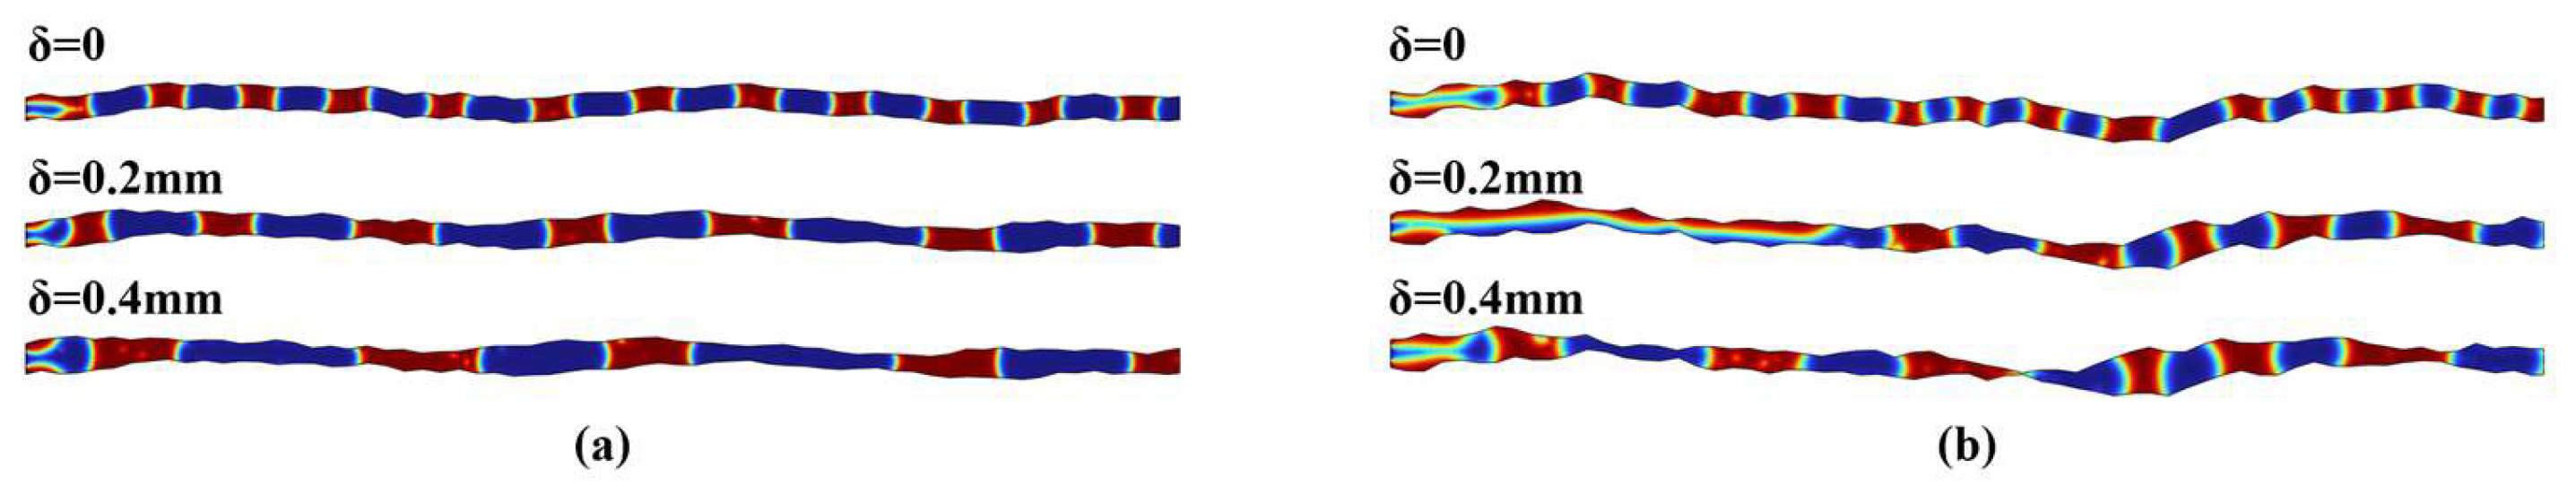
3.3. Effect of Surface Roughness on the Structure of Two-Phase Fluid Flow

To investigate the effect of surface roughness on the two-phase fluid flow structure, numerical simulations were conducted for two-phase fluid flow in Fracture 1 and Fracture 2 without imposed dislocations. Figure 5 shows the phase distribution diagrams of the two-phase fluid flow structures at different flow rates in Fracture 2. When compared with the phase diagrams of the two-phase fluid flow structures in Fracture 1 (Figure 2), the flow structures in Fracture 2, particularly in the slug–annular and annular phases, exhibit significant fluctuations. In contrast, Fracture 1 demonstrates a more stable flow structure. The increased roughness in Fracture 2 leads to higher resistance to flow within the slit, making it more challenging for the gas phase to be transported with a stable flow structure. This indicates that rougher surfaces impede the stability of gas-phase transport within the aperture.
To further clarify the influence of surface roughness on the two-phase fluid flow structure and water saturation in fractures, Figure 6 presents the evolution of two-phase fluid flow structures and water saturation under different flow rates. A comparison of water saturation evolution in Fracture 1 and Fracture 2 under different water-phase flow rates reveals that when Uw = 0.3 m/s, water saturation in Fracture 1 ranges from 0.3 to 0.4, while in Fracture 2, it is 0.4 to 0.5, and as the gas flow rate increases from 0.3 m/s to 0.9 m/s, water saturation in Fracture 2 decreases by 22%. When Uw = 0.6 m/s, water saturation in Fracture 1 is 0.45 to 0.6, while in Fracture 2, it is 0.5 to 0.7, and water saturation in Fracture 2 decreases by 26% as the gas flow rate rises from 0.3 m/s to 0.9 m/s. When Uw = 0.9 m/s, water saturation in Fracture 1 is 0.6 to 0.75, while in Fracture 2, it is 0.6 to 0.8, and water saturation in Fracture 2 decreases by 22% as the gas flow rate increases from 0.3 m/s to 0.9 m/s. These results indicate that, under the same flow rate conditions, water saturation in the fracture increases with increasing roughness, suggesting that higher roughness enhances resistance to gas flow, thereby reducing gas content and making gas transport more difficult within the fracture. Figure 6b illustrates the evolution of two-phase fluid flow structures in Fracture 2 under different flow rates. Compared to Fracture 1, when Uw = 0.3 m/s and Uw = 0.9 m/s, Fracture 1 exhibits slug flow, while Fracture 2 develops an unstable slug–annular flow. As roughness increases, slug bubbles come into contact and coalesce when passing through the tortuous surface, eventually forming longer annular segments. Additionally, rough flow paths hinder the formation of a stable annular flow at low aqueous-phase flow rates, leading to a more unstable slug–annular flow, as shown in Figure 5.
The observed phenomenon indicates that, under the same flow rate conditions, water saturation in the fracture increases with increasing roughness. This suggests that higher roughness enhances resistance to gas flow, reducing gas content and making gas transport more difficult within the fracture. Figure 6b illustrates the evolution of the two-phase fluid flow structure in Fracture 2 under different flow rates. Compared to Fracture 1, when Uw = 0.3 and Ug = 0.9 m/s, Fracture 1 exhibits slug flow, while Fracture 2 develops an unstable slug–annular flow. As roughness increases, slug bubbles contact and coalesce when passing through the tortuous surface, eventually forming longer annular segments. Additionally, the presence of rough flow paths hinders the formation of a stable annular flow at low aqueous-phase flow rates, resulting in a more unstable slug–annular flow, as shown in Figure 5.

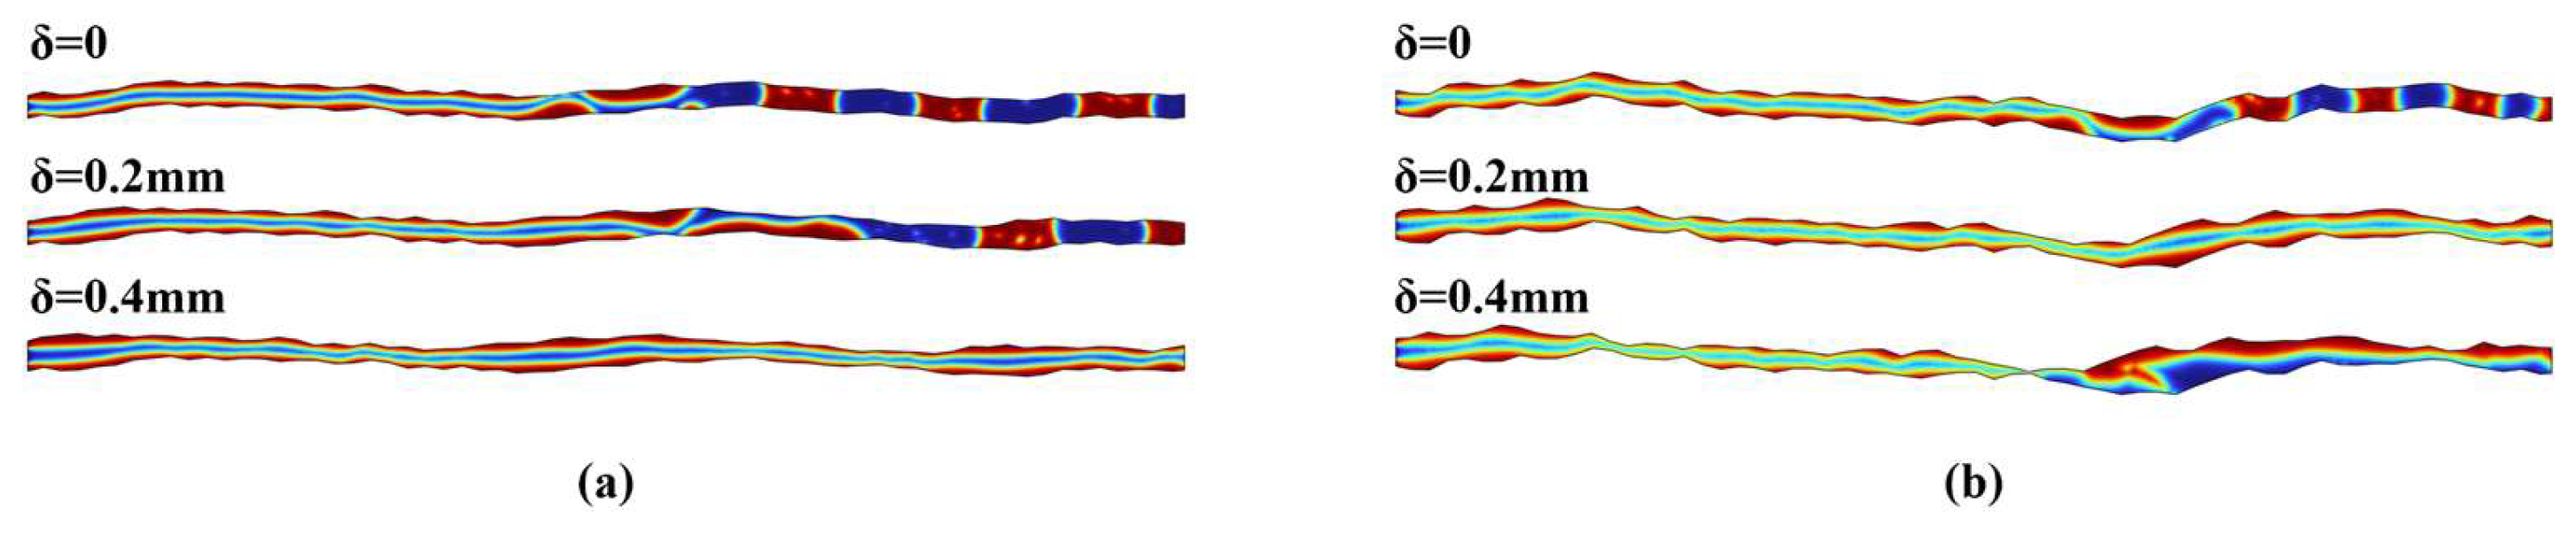
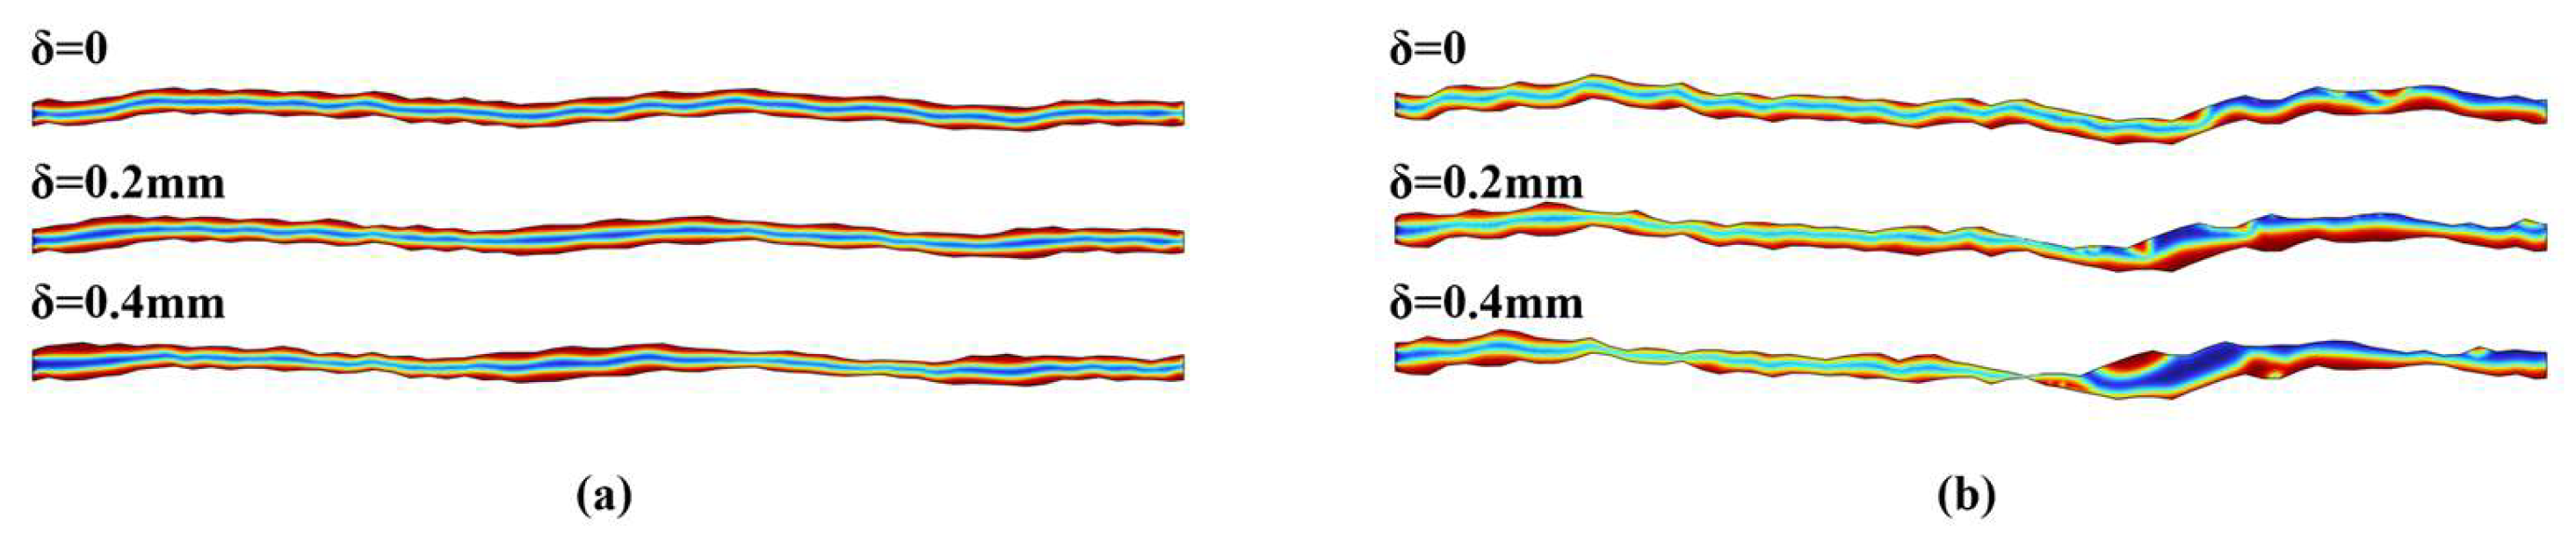
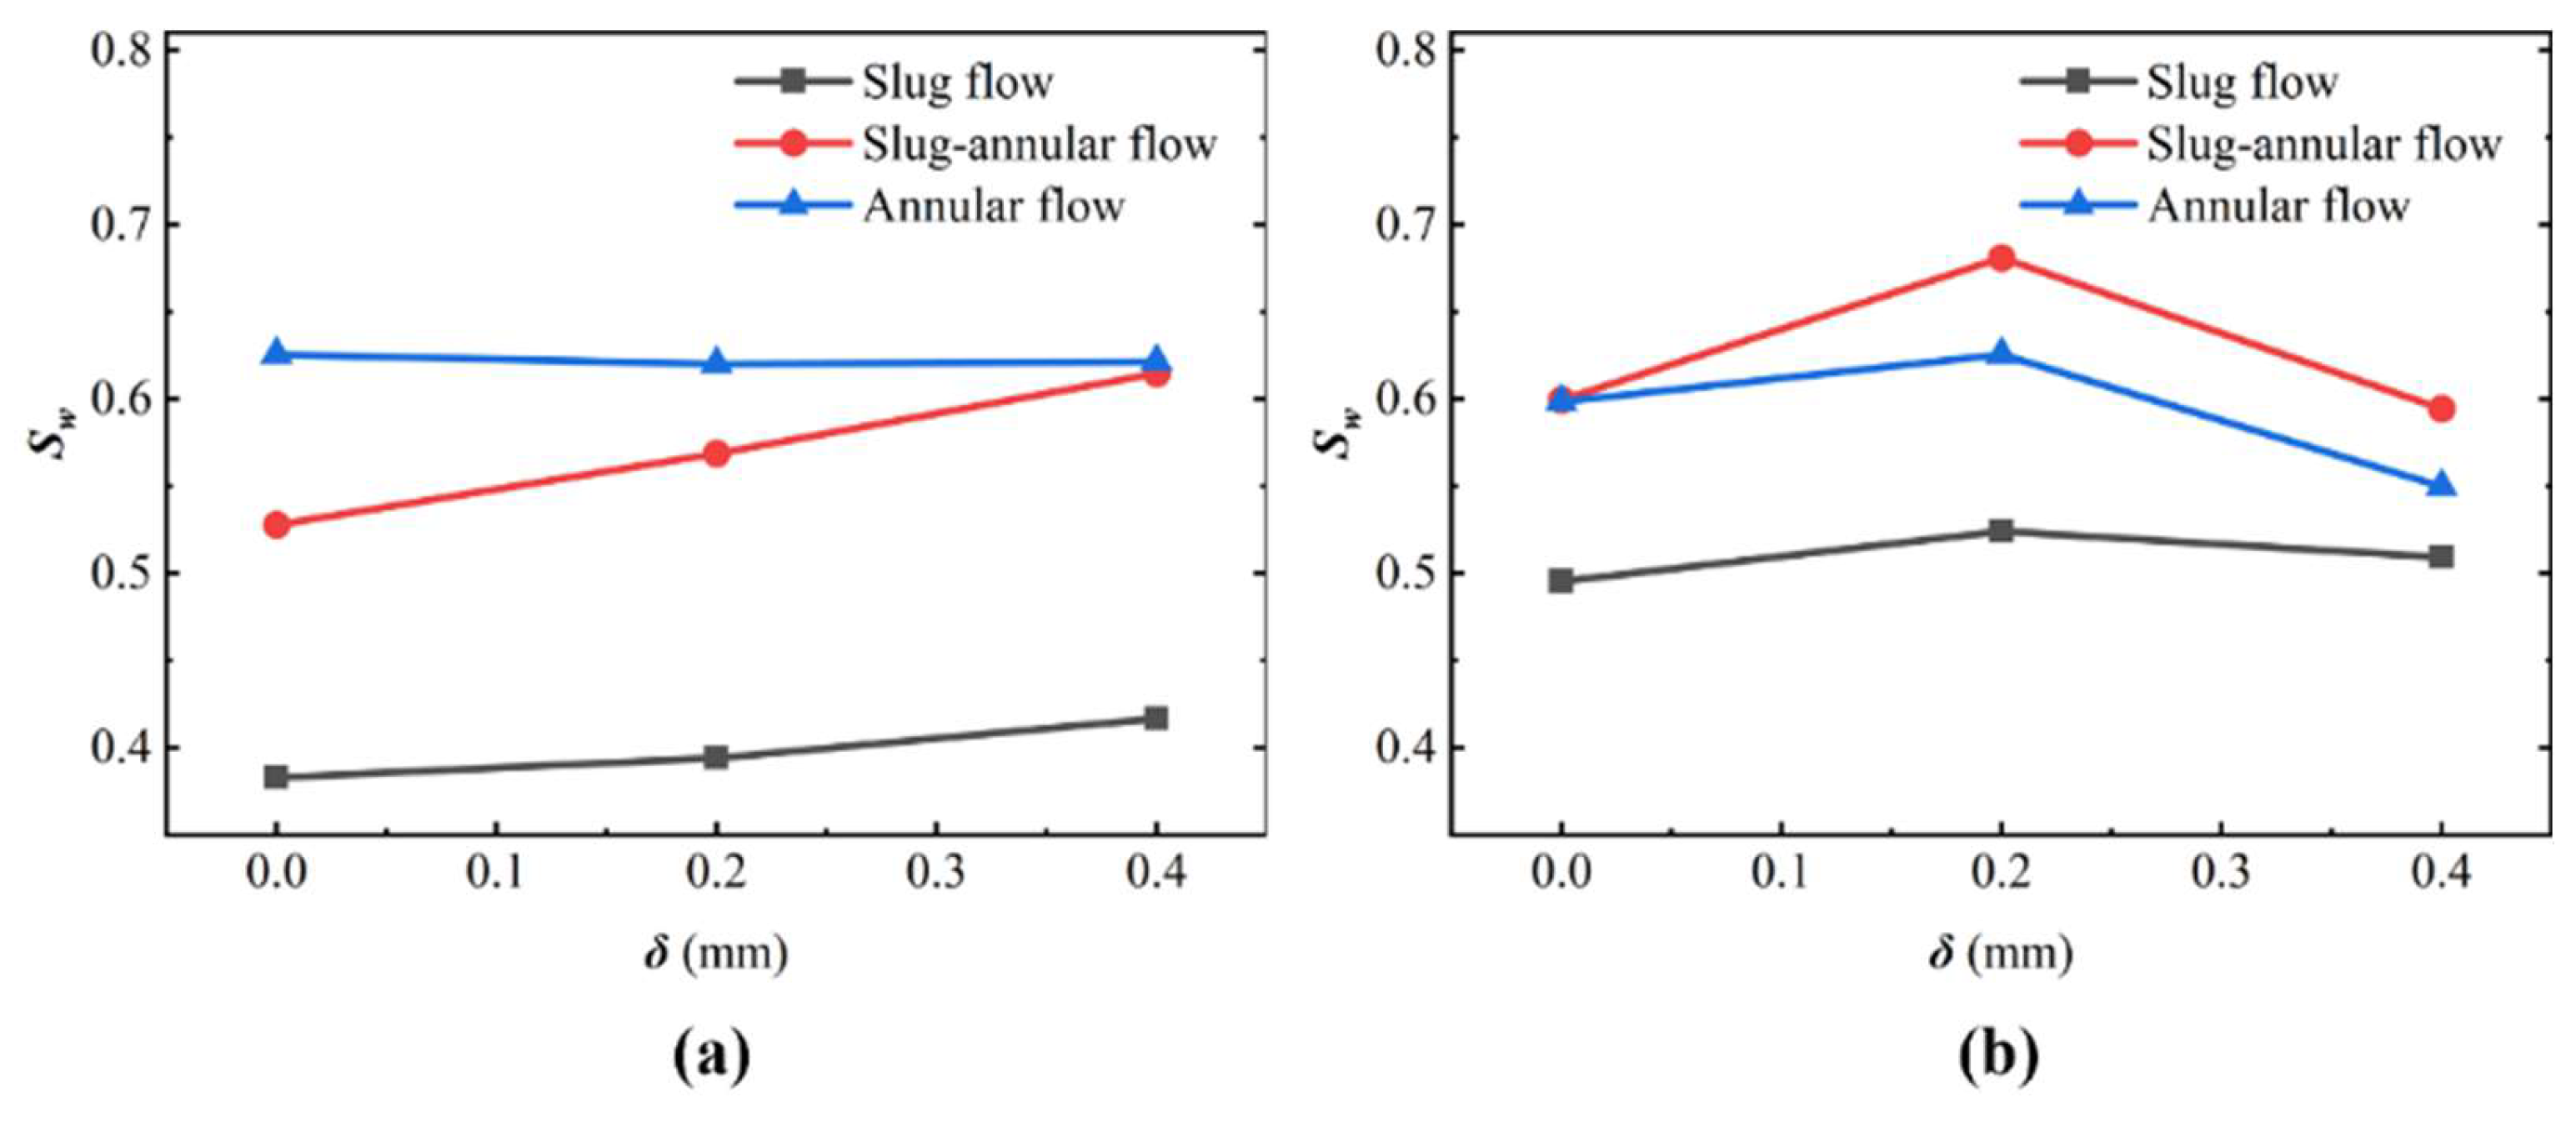
3.4. Effect of Dislocations on the Structure of Two-Phase Fluid Flow

Most rock fractures are located in complex geological environments, where geological activities and engineering perturbations can alter the geometric structure of the fractures. Shear stress, in particular, can cause dislocations between the upper and lower surfaces of the fractures, resulting in a mismatch between them. To investigate the effect of dislocation on the two-phase fluid flow structure within the fracture, this study applied dislocations of 0.2 mm and 0.4 mm and conducted numerical simulations of gas–water two-phase flow. The simulation parameter settings are presented in Table 4.
To investigate the effects of dislocations on different flow structures, three distinct flow conditions in a matched fracture were selected for this study: Uw = 0.3 m/s and Ug = 0.3 m/s (slug flow), Uw = 0.6 m/s and Ug = 0.6 m/s (slug–annular flow), and Uw = 0.9 m/s and Ug = 0.9 m/s (annular flow). Figure 7 presents the phase diagrams of two-phase fluid flow structures in the slug flow stage within dislocated fractures (Fracture 1 and Fracture 2). The results show that as dislocation (δ) increases from 0 mm to 0.4 mm, the number of slugs gradually decreases, while the length and irregularity of slug segments increase. This suggests that dislocation promotes slug coalescence, leading to the formation of larger slug segments. This phenomenon can be attributed to the non-uniform aperture distribution caused by dislocation; at narrower local apertures, slug segments merge, forming longer slugs, whereas in wider local apertures, slug segments break up, reducing their length. A comparison between Figure 7a,b reveals that Fracture 2 (higher roughness) exhibits a more irregular flow structure under dislocation effects compared to Fracture 1 (lower roughness). This indicates that the impact of roughness on two-phase fluid flow is amplified when dislocations are introduced, further disrupting flow uniformity and increasing flow structure complexity.
The phase diagrams of two-phase fluid flow structures in the slug–annular flow stage for different dislocation fractures (Fracture 1 and Fracture 2) are presented in Figure 8. As illustrated, with increasing dislocation, the number of slug segments in the slug–annular flow stage progressively decreases, and the flow structure transitions toward annular flow. This suggests that as dislocations are introduced, the slug–annular flow gradually diminishes, giving way to a more stable annular flow structure within the fracture. This transformation can be attributed to the reduction in local aperture size due to dislocations, which promotes the coalescence of slug segments. Additionally, the critical flow velocity required for annular flow formation decreases, allowing the annular structure to develop at lower velocities. This indicates that moderate dislocation enhances the stability of two-phase fluid flow structures within the fracture by facilitating the transition to a fully developed annular flow regime. A comparison between Figure 8a,b reveals that while the presence of dislocations accelerates annular flow formation in high-roughness fractures, the resulting annular flow structure in Fracture 2 (high roughness) is more irregular compared to that in Fracture 1 (low roughness). This indicates that higher roughness intensifies flow disturbances, disrupting the slug–annular structure and making the transition to annular flow less uniform. In contrast, low-roughness fractures facilitate the formation of a more stable and continuous annular flow, whereas high-roughness fractures introduce greater structural instability and irregularity in flow morphology. These findings highlight the interplay between dislocation and surface roughness, underscoring their combined influence on the evolution of two-phase fluid flow structures in fractured media.
Figure 9 presents the phase diagrams of the two-phase fluid flow structure in the annular flow stage for different dislocated fractures (Fracture 1 and Fracture 2). The results indicate that while dislocations do not fundamentally alter the overall flow structure, they significantly affect the shape of the annular flow structure by modifying the local aperture size. Specifically, in regions with reduced aperture, the gas-phase flow channels contract, increasing flow resistance and altering the distribution of the annular flow. This phenomenon arises due to the narrowing of the local aperture, which restricts gas-phase movement and increases the shear resistance encountered by the two-phase fluid. A comparison of annular flow evolution in fractures with different roughness levels reveals that high-roughness fractures are more significantly affected by dislocation. In Fracture 2 (high roughness), the annular flow structure becomes more irregular with increasing dislocation. This is attributed to the highly tortuous surface morphology and the inhomogeneous aperture distribution in rough fractures, which are further amplified by dislocation effects. The frequent variations in aperture size due to roughness and dislocation introduce additional flow instability, making the annular flow structure less uniform and more disrupted. In summary, while dislocations influence the local aperture size and induce constriction effects in the gas-phase flow channels, their impact is more pronounced in high-roughness fractures, where irregular surface topography amplifies structural instability in the annular flow. This highlights the interplay between fracture roughness and dislocation, emphasizing their combined role in shaping two-phase flow structures in fractured media.
To further analyze the impact of dislocation (δ) on the flow area of two-phase fluid in fractures, Figure 10 presents the evolution patterns of water saturation at different flow structure stages in Fractures 1 and 2 under varying δ values. The water saturation patterns differ significantly between the two fractures.
In Fracture 1, water saturation increases notably with rising δ during the slug flow and slug–annular flow stages, while it remains relatively unchanged in the laminar flow stage. This suggests that larger dislocations expand the aqueous phase flow area, primarily affecting discontinuous flow structures within the fracture.
In Fracture 2, water saturation initially increases and then decreases as δ grows, indicating that the influence of fracture roughness on the two-phase flow area intensifies with greater dislocation. Combined with previous observations on flow structure evolution, it is evident that high-roughness fractures exhibit a more pronounced response to dislocation. The interplay between roughness and dislocation leads to irregular flow structure variations, resulting in complex changes in the two-phase flow area within the fracture channel.

4. Conclusions

In this study, the effects of the two-phase fluid flow rate, surface roughness, and dislocation on gas–water flow structures in rock fractures were investigated using the level set method. The key findings are as follows:
(1)
Impact of Two-Phase Fluid Flow Rate
The flow structure within the fracture evolves from slug flow to slug–annular flow and ultimately to annular flow as the water and gas flow rates increase. A stable annular flow structure forms only when the water-phase flow rate surpasses a critical threshold. At a constant water-phase flow rate, increasing the gas-to-water flow rate ratio reduces water saturation within the fracture.
(2)
Effect of Surface Roughness
Surface roughness disrupts the formation of stable, continuous gas-phase flow channels. Higher roughness increases flow irregularity and hinders annular flow formation at low water-phase flow rates. Under identical flow conditions, greater roughness leads to higher water saturation within the fracture.
(3)
Effect of Dislocation
Dislocation significantly alters the two-phase flow structure. As dislocation increases, the number of slugs in slug flow decreases, slug length increases, and the flow structure becomes more irregular. The slug–annular flow gradually transitions to annular flow with increased irregularity. Additionally, the influence of roughness on flow structure intensifies with greater dislocation. Under identical flow conditions, water saturation increases with dislocation in low-roughness fractures, whereas in high-roughness fractures, it initially rises and then declines as dislocation increases.
These findings provide valuable insights into the interplay between flow rates, surface roughness, and dislocation, enhancing the understanding of two-phase fluid flow behavior in fractured rock.
Based on the existing research results, the numerical simulation of fracture gas–water flow can be further extended to the three-dimensional fracture and fracture network and combined with the machine learning method to predict the fluid flow behavior, which can effectively guide engineering applications.

Author Contributions

Y.L., Conceptualization; software; data curation; methodology; writing—original draft preparation; L.C., investigation; formal analysis; writing—original draft preparation; supervision; S.R., data curation; software; validation; X.L. Conceptualization; methodology; data curation, supervision; M.L. Conceptualization; methodology; data curation; K.L., methodology; data curation. All authors have read and agreed to the published version of the manuscript.

Funding

This study was financially supported by the Open Project of Chongqing Institute of Geology and Mineral Resources (Grant No. TICG-K2024006) and the Natural Science Foundation Project of Chongqing (Grant No. CSTB2022NSCQ-MSX0427) and the Science and Technology Research Program of Chongqing Municipal Education Commission (Grant No. KJZD-M202400702).

Data Availability Statement

The original contributions presented in this study are included in the article. Further inquiries can be directed to the corresponding author.

Conflicts of Interest

Author Mengjiao Liu was employed by the company State Grid Xuzhou Power Supply Company, Xuzhou 221000, China; Author Xiujun Li was employed by the company Chongqing Expressway Group Co., Ltd. The remaining authors declare that the research was conducted in the absence of any commercial or financial relationships that could be construed as a potential conflict of interest.

Nomenclature

FOther external forces in the system
FgGravity
FstSurface tension
HHurst index
IUnit matrix
KCurrent permeability
MThe molar mass of the gas
RThe gas constant
TThe gas phase temperature
UgThe velocity of the gas
UwThe velocity of the water
pFluid pressure
rArbitrary constant
uVelocity vector
Greek letter
ρFluid density
σSurface tension coefficient
μDynamic viscosity
κ Interface curvature
δ Dirac delta function
φThe level set function
ρwDensity of water
ρgDensity of gas
μwDynamic viscosity of water
μgDynamic viscosity of gas
εModel mesh size parameters
γModel velocity field parameters

References

  1. Berkowitz, B. Characterizing flow and transport in fractured geological media: A review. Adv. Water Resour. 2002, 25, 861–884. [Google Scholar] [CrossRef]
  2. Karra, S.; Makedonska, N.; Viswanathan, H.S.; Painter, S.L.; Hyman, J.D. Effect of advective flow in fractures and matrix diffusion on natural gas production. Water Resour. Res. 2015, 51, 8646–8657. [Google Scholar] [CrossRef]
  3. Wang, Z.; Xu, C.; Dowd, P.; Xiong, F.; Wang, H. A nonlinear version of the reynolds equation for flow in rock fractures with complex void geometries. Water Resour. Res. 2020, 56, e2019WR026149. [Google Scholar] [CrossRef]
  4. Cao, M.; Hirose, S.; Sharma, M.M. Factors controlling the formation of complex fracture networks in naturally fractured geothermal reservoirs. J. Pet. Sci. Eng. 2022, 208, 109642. [Google Scholar] [CrossRef]
  5. Zhu, W.; Chen, Z.; Yang, Y.; Gong, W.; Wang, M. Impacts of t-type intersections on the connectivity and flow in complex two-dimensional fracture networks. Eng. Geol. 2023, 320, 107122. [Google Scholar] [CrossRef]
  6. Xue, K.; Zhang, Z.; Han, X.; Guang, W. A fractal model for estimating the permeability of tortuous fracture networks with correlated fracture length and aperture. Phys. Fluids 2023, 35, 043615. [Google Scholar] [CrossRef]
  7. Harp, D.R.; Ortiz, J.P.; Pandey, S.; Karra, S.; Anderson, D.; Bradley, C.; Viswanathan, H.; Stauffer, P.H. Immobile pore-water storage enhancement and retardation of gas transport in fractured rock. Transp. Porous Media 2018, 124, 369–394. [Google Scholar] [CrossRef]
  8. Pritchett, J. Dry-steam wellhead discharges from liquid-dominated geothermal reservoirs: A result of coupled nonequilibriurn multiphase fluid and heat flow through fractured rock. Dyn. Fluids Transp. Fract. Rock 2005, 162, 175. [Google Scholar] [CrossRef]
  9. Li, T.; Tang, C.; Rutqvist, J.; Hu, M. TOUGH-RFPA: Coupled thermal-hydraulic-mechanical rock failure process analysis with application to deep geothermal wells. Int. J. Rock Mech. Min. Sci. 2021, 142, 104726. [Google Scholar] [CrossRef]
  10. Azim, R.A. Finite element model to simulate two-phase fluid flow in naturally fractured oil reservoirs: Part I. ACS Omega 2022, 7, 27278–27290. [Google Scholar] [CrossRef]
  11. Zheng, J.; Jin, Y.; Dong, J.; Liu, S.; Zhang, Q.; Song, H.; Huang, P. Reexamination of the permeability-aperture relationship for rough fractures with mismatched self-affine surfaces. J. Hydrol. 2022, 609, 127727. [Google Scholar] [CrossRef]
  12. Li, Q.; Li, Q.; Cao, H.; Wu, J.; Wang, F.; Wang, Y. The Crack Propagation Behaviour of CO2 Fracturing Fluid in Unconventional Low Permeability Reservoirs: Factor Analysis and Mechanism Revelation. Processes 2025, 13, 159. [Google Scholar] [CrossRef]
  13. Li, Q.; Li, Q.; Wu, J.; Li, X.; Li, H.; Cheng, Y. Wellhead Stability During Development Process of Hydrate Reservoir in the Northern South China Sea: Evolution and Mechanism. Processes 2025, 13, 40. [Google Scholar] [CrossRef]
  14. Shen, W.; Ma, T.; Li, X.; Sun, B.; Hu, Y.; Xu, J. Fully coupled modeling of two-phase fluid flow and geomechanics in ultra-deep natural gas reservoirs. Phys. Fluids 2022, 34, 043101. [Google Scholar] [CrossRef]
  15. Khudayarov, B.A.; Komilova, K.M. Vibration and dynamic stability of composite pipelines conveying a two-phase fluid flows. Eng. Fail. Anal. 2019, 104, 500–512. [Google Scholar] [CrossRef]
  16. Cheng, L.; Xia, G. Flow patterns and flow pattern maps for adiabatic and diabatic gas liquid two phase flow in microchannels: Fundamentals, mechanisms and applications. Exp. Therm. Fluid Sci. 2023, 148, 110988. [Google Scholar] [CrossRef]
  17. Khoei, A.R.; Mortazavi, S.M.S. Thermo-hydro-mechanical modeling of fracturing porous media with two-phase fluid flow using X-FEM technique. Int. J. Numer. Anal. Methods Geomech. 2020, 44, 2430–2472. [Google Scholar] [CrossRef]
  18. Momen, A.M.; Sherif, S.A.; Lear, W.E. Modeling of two-phase gas-liquid slug flows in microchannels. Comput. Therm. Sci. 2024, 16, 113–128. [Google Scholar] [CrossRef]
  19. Guiltinan, E.J.; Santos, J.E.; Cardenas, M.B.; Espinoza, D.N.; Kang, Q. Two-phase fluid flow properties of rough fractures with heterogeneous wettability: Analysis with lattice boltzmann simulations. Water Resour. Res. 2020, 57, e2020WR027943. [Google Scholar] [CrossRef]
  20. Gao, Z.; Qu, Z.; Cai, Q.; Hou, L.; Liu, M.; Yuan, T. A deep branch-aggregation network for recognition of gas–liquid two-phase flow structure. IEEE Trans. Instrum. Meas. 2021, 70, 5000408. [Google Scholar] [CrossRef]
  21. Huang, J.; Lu, Y.; Jia, L. Experimental study on the two-phase flow structure in a supercritical water-fluidized bed. Ind. Eng. Chem. Res. 2019, 58, 20099–20108. [Google Scholar] [CrossRef]
  22. Krzaczek, M.; Nitka, M.; Tejchman, J. Effect of gas content in macropores on hydraulic fracturing in rocks using a fully coupled DEM/CFD approach. Int. J. Numer. Anal. Methods Geomech. 2020, 45, 234–264. [Google Scholar] [CrossRef]
  23. Gong, Y.; Sedghi, M.; Piri, M. Two-phase relative permeability of rough-walled fractures: A dynamic pore-scale modeling of the effects of aperture geometry. Water Resour. Res. 2021, 57, e2021WR030104. [Google Scholar] [CrossRef]
  24. Wong, T.N.; Che, Z.; Nguyen, N.T. Flow field, heat transfer and mixing in segmented plug flow in microchannels. In Proceedings of the 7th International Multidisciplinary Conference on Optofluidics, Singapore, 25–28 July 2017. [Google Scholar] [CrossRef]
  25. Muzychka, Y.S.; Walsh, E.J.; Walsh, P. Heat transfer enhancement using laminar gas-liquid segmented plug flows. J. Heat Transf. 2011, 133, 041902. [Google Scholar] [CrossRef]
  26. Chen, G. Structural, solvent quality changes and flow regulation through PEO-grafted gold nanopore. Macromolecules 2024, 57, 4855–4866. [Google Scholar] [CrossRef]
  27. Wang, Q.; Hu, J.; Song, M.; Shen, H.; Zhou, Y.; Li, D.; Xie, F. Study on the transient flow characteristics of a hump water pipeline based on the random distribution of bubbles. Water 2023, 15, 3831. [Google Scholar] [CrossRef]
  28. Ahammad, M.J.; Rahman, M.A.; Zheng, L.; Alam, J.M.; Butt, S. Numerical investigation of two-phase fluid flow in a perforation tunnel. J. Nat. Gas. Sci. Eng. 2018, 55, 606. [Google Scholar] [CrossRef]
  29. Wang, Y.; Zhang, Z.; Ranjith, P.G.; Han, X. Flow structure transition and identification of two-phase fluid flow through rough rock fractures. Eur. Phys. J. Plus 2023, 138, 376. [Google Scholar] [CrossRef]
  30. Chen, C.Y.; Horne, R.N. Two-phase flow in rough-walled fractures: Experiments and a flow structure model. Water Resour. Res. 2006, 42, W03430.1–W03430.17. [Google Scholar] [CrossRef]
  31. Zhao, J.; Kang, Q.; Yao, J.; Viswanathan, H.; Pawar, R.; Zhang, L.; Sun, H. The effect of wettability heterogeneity on relative permeability of two-phase flow in porous media: A lattice Boltzmann study. Water Resour. Res. 2018, 54, 1295–1311. [Google Scholar] [CrossRef]
  32. Huang, X.; Zhang, L.; Zhang, R.; Chen, X.; Zhao, Y.; Yuan, S. Numerical simulation of gas-liquid two-phase flow in the micro-fracture networks in fractured reservoirs. J. Nat. Gas Sci. Eng. 2021, 94, 104101. [Google Scholar] [CrossRef]
  33. Liu, D.; Pu, H.; Xue, K.; Ni, H. Numerical Simulation of Gas–Water Two-Phase Flow Patterns in Fracture: Implication for Enhancing Natural Gas Production. Water 2024, 16, 2860. [Google Scholar] [CrossRef]
  34. Hu, R.; Zhou, C.; Wu, D.; Yang, Z.; Chen, Y. Roughness control on multiphase flow in rock fractures. Geophys. Res. Lett. 2019, 46, 12002–12011. [Google Scholar] [CrossRef]
  35. Brackbill, J.U.; Kothe, D.B.; Zemach, C. A continuum method for modeling surface tension. J. Comput. Phys. 1992, 100, 335–354. [Google Scholar]
  36. Xue, K.; Zhang, Z.; Jiang, Y.; Luo, Y. Estimating the permeability of fractured rocks using topological characteristics of fracture network. Comput. Geotech. 2023, 157, 105337. [Google Scholar] [CrossRef]
  37. Shabelansky, A.H.; Nihei, K.T.; Fradelizio, G.; Tracey, S.; Bevc, D. Efficient fully coupled 3d poroelastic modeling of geomechanical deformation during depletion and reinjection: An asymptotic transformation of biot’s poroelasticity from a dynamic to a quasistatic response. Geophysics 2023, 88, M201–M212. [Google Scholar] [CrossRef]
  38. Wang, P.; Fu, Y.; Liu, C.; Zhou, X.; Cai, M. Directional fracture patterns of excavated jointed rock mass within rough discrete fractures. Eng. Fract. Mech. 2024, 309, 110419. [Google Scholar] [CrossRef]
  39. Zhang, A.; Yang, J.; Cheng, L.; Ma, C. A simulation study on stress-seepage characteristics of 3d rough single fracture based on fluid-structure interaction. J. Pet. Sci. Eng. 2022, 211, 110215. [Google Scholar] [CrossRef]
  40. Barton, N. Review of a new shear-strength criterion for rock joints. Eng. Geol. 1973, 7, 287–332. [Google Scholar] [CrossRef]
  41. Sur, A.; Yang, L.; Liu, D. Experimental and numerical investigation of two-phase patterns in a cross-junction microfluidic chip. In Proceedings of the 8th International Conference on Nanochannels, Mi-Crochannels and Minichannels, Montreal, QC, Canada, 1–5 August 2010. [Google Scholar] [CrossRef]
Figure 1. Fracture profiles with different joint roughness coefficients (JRCs): (a) Fracture No. 1; (b) Fracture No. 2.
Water 17 00973 g001
Figure 2. Comparison of different flow structures of two-phase flow between numerical simulation and experiment [41]: (a) slug flow, UG = 0.2 m/s, UL = 0.29 m/s; (b) annular flow, UG = 4.74 m/s, UL = 0.07 m/s.
Water 17 00973 g002
Figure 3. Structural phase diagram of two-phase fluid flow in the fracture at different two-phase fluid flow rates.
Water 17 00973 g003
Figure 4. Evolution of water saturation and two-phase fluid flow structure in Fracture 1 at different two-phase fluid flow rates: (a) water saturation, (b) flow structure: The red area represents the water phase and the blue area represents the gas phase.
Water 17 00973 g004
Figure 5. Structural phase diagram of two-phase fluid flow within a fracture (Fracture No. 2).
Water 17 00973 g005
Figure 6. Evolution of water saturation and two-phase fluid flow structure in Fracture 2 at different two-phase fluid flow rates: (a) water saturation, (b) flow structure: The red area represents the water phase and the blue area represents the gas phase.
Water 17 00973 g006
Figure 7. Effect of dislocation δ on the structure of slug flow (Uw = 0.3 m/s, Ug = 0.3 m/s): (a) Fracture No. 1, (b) Fracture No. 2. The red area represents the water phase and the blue area represents the gas phase.
Water 17 00973 g007
Figure 8. Effect of dislocation δ on the structure of slug-annular flow (Uw = 0.6 m/s, Ug = 0.6 m/s): (a) Fracture No. 1, (b) Fracture No. 2. The red area represents the water phase and the blue area represents the gas phase.
Water 17 00973 g008
Figure 9. Effect of dislocation δ on the structure of the toroidal flow (Uw = 0.9 m/s, Ug = 0.9 m/s): (a) Fracture No. 1, (b) Fracture No. 2. The red area represents the water phase and the blue area represents the gas phase.
Water 17 00973 g009
Figure 10. Effect of dislocations δ on water saturation under different flow structures: (a) Fracture No. 1, (b) Fracture No. 2.
Water 17 00973 g010
Table 1. Geometric parameters of fracture profiles under shear displacement is 0 (δ = 0).
Fracture (δ = 0)Length (mm)HZ2JRC
No. 1100.330.144.67
No. 2100.270.2311.46
Table 2. Physical properties of gas and water phase.
Temperature (K)Density (kg/m3)Viscosity (Pa·s)
Nitrogen293.151.1841.79 × 10−5
Water293.1510001.12 × 10−3
Table 3. Parameters used in the model validation process.
MethodFluidDensity (kg/m3)Velocity (m/s)Flow Structure
1Experiment [41]Air1.160.2Slug flow
Water9970.29
NumericalAir1.160.2Slug flow
Water10000.29
2Experiment [41]Air1.164.74Annular flow
Water9970.07
NumericalAir1.164.74Annular flow
Water10000.07
Table 4. Simulation parameters in shear fractures.
Fractureδ (mm)Uw (m/s)Ug (m/s)
No. 1, No. 20.2, 0.40.3, 0.6, 0.90.3, 0.6, 0.9
Disclaimer/Publisher’s Note: The statements, opinions and data contained in all publications are solely those of the individual author(s) and contributor(s) and not of MDPI and/or the editor(s). MDPI and/or the editor(s) disclaim responsibility for any injury to people or property resulting from any ideas, methods, instructions or products referred to in the content.

