
Influence of Geographical Locations on Drinking Water Quality in Rural Pavlodar Region, Kazakhstan

 ,
,  , , , and
Abstract
1. Introduction
2. Materials and Methods
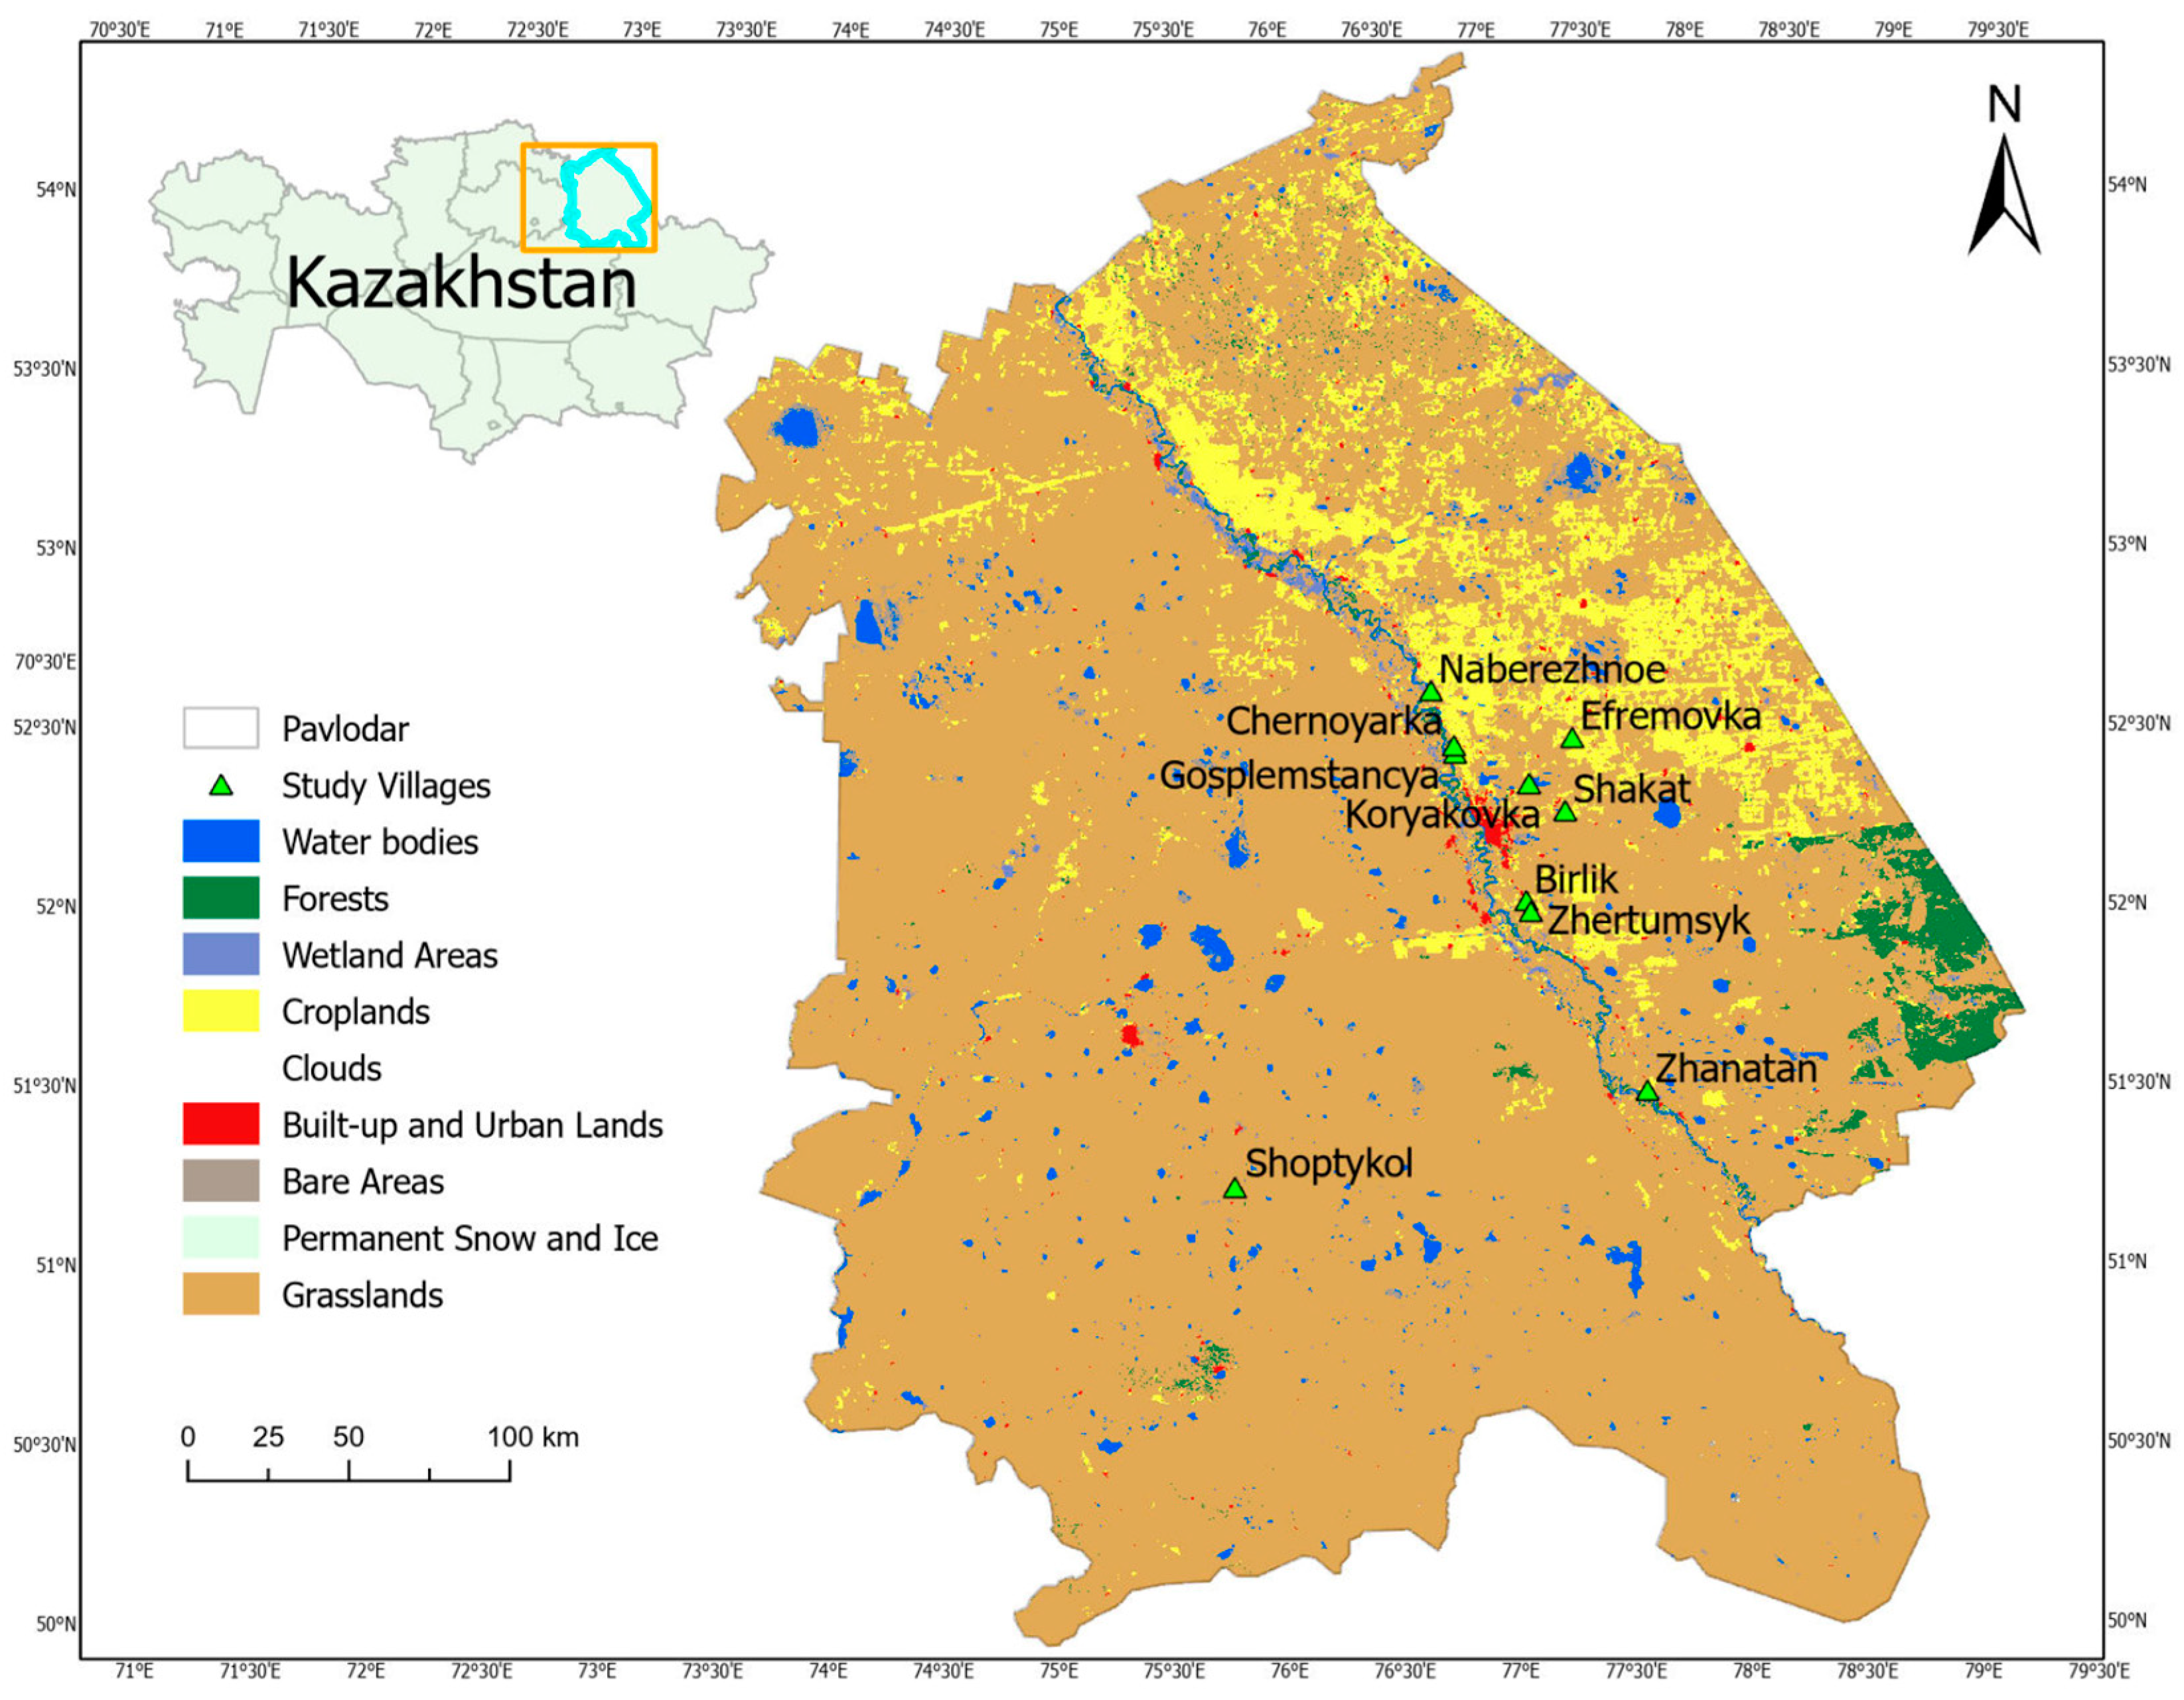
2.1. Research Area
2.1.1. Geographical and Climate Features of the Research Area
2.1.2. Major Economic Activities of the Pavlodar Region
2.1.3. Sampling Period Feature
2.1.4. Sampling Villages
2.1.5. Research Area Water Sources
2.1.6. Drinking Water Sources in Research Villages
2.2. Research Methods
2.2.1. Water Quality Index
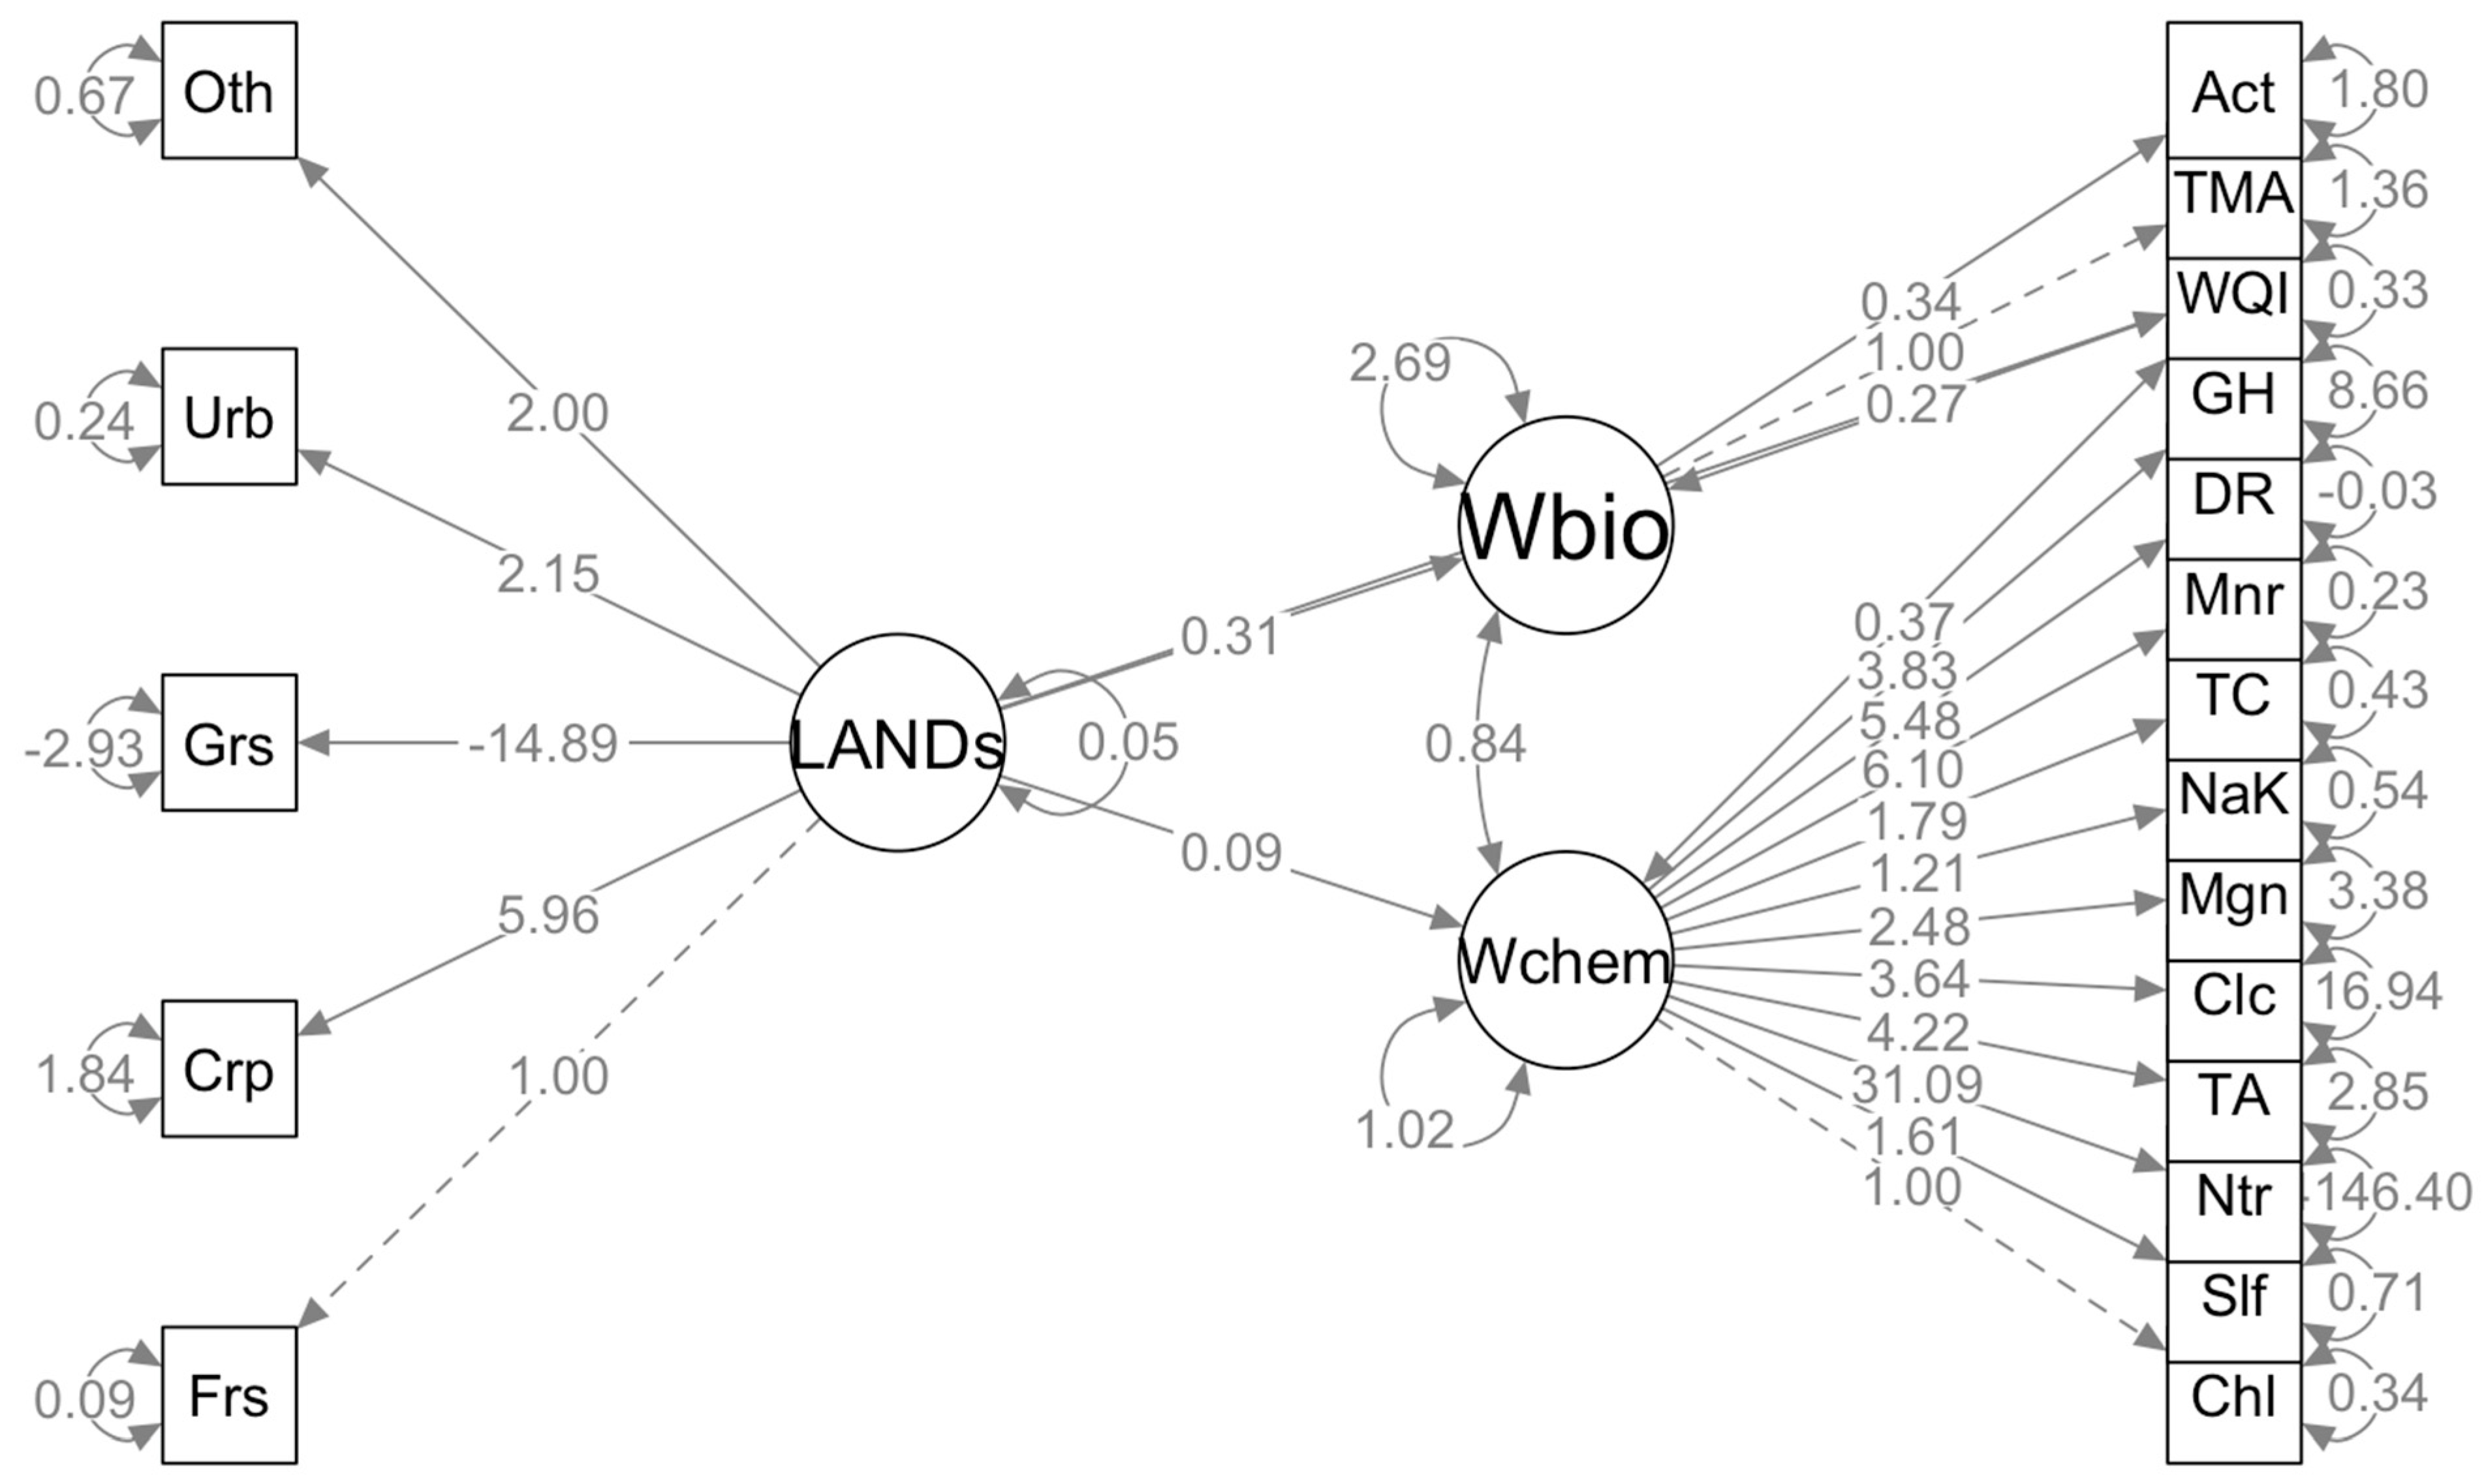
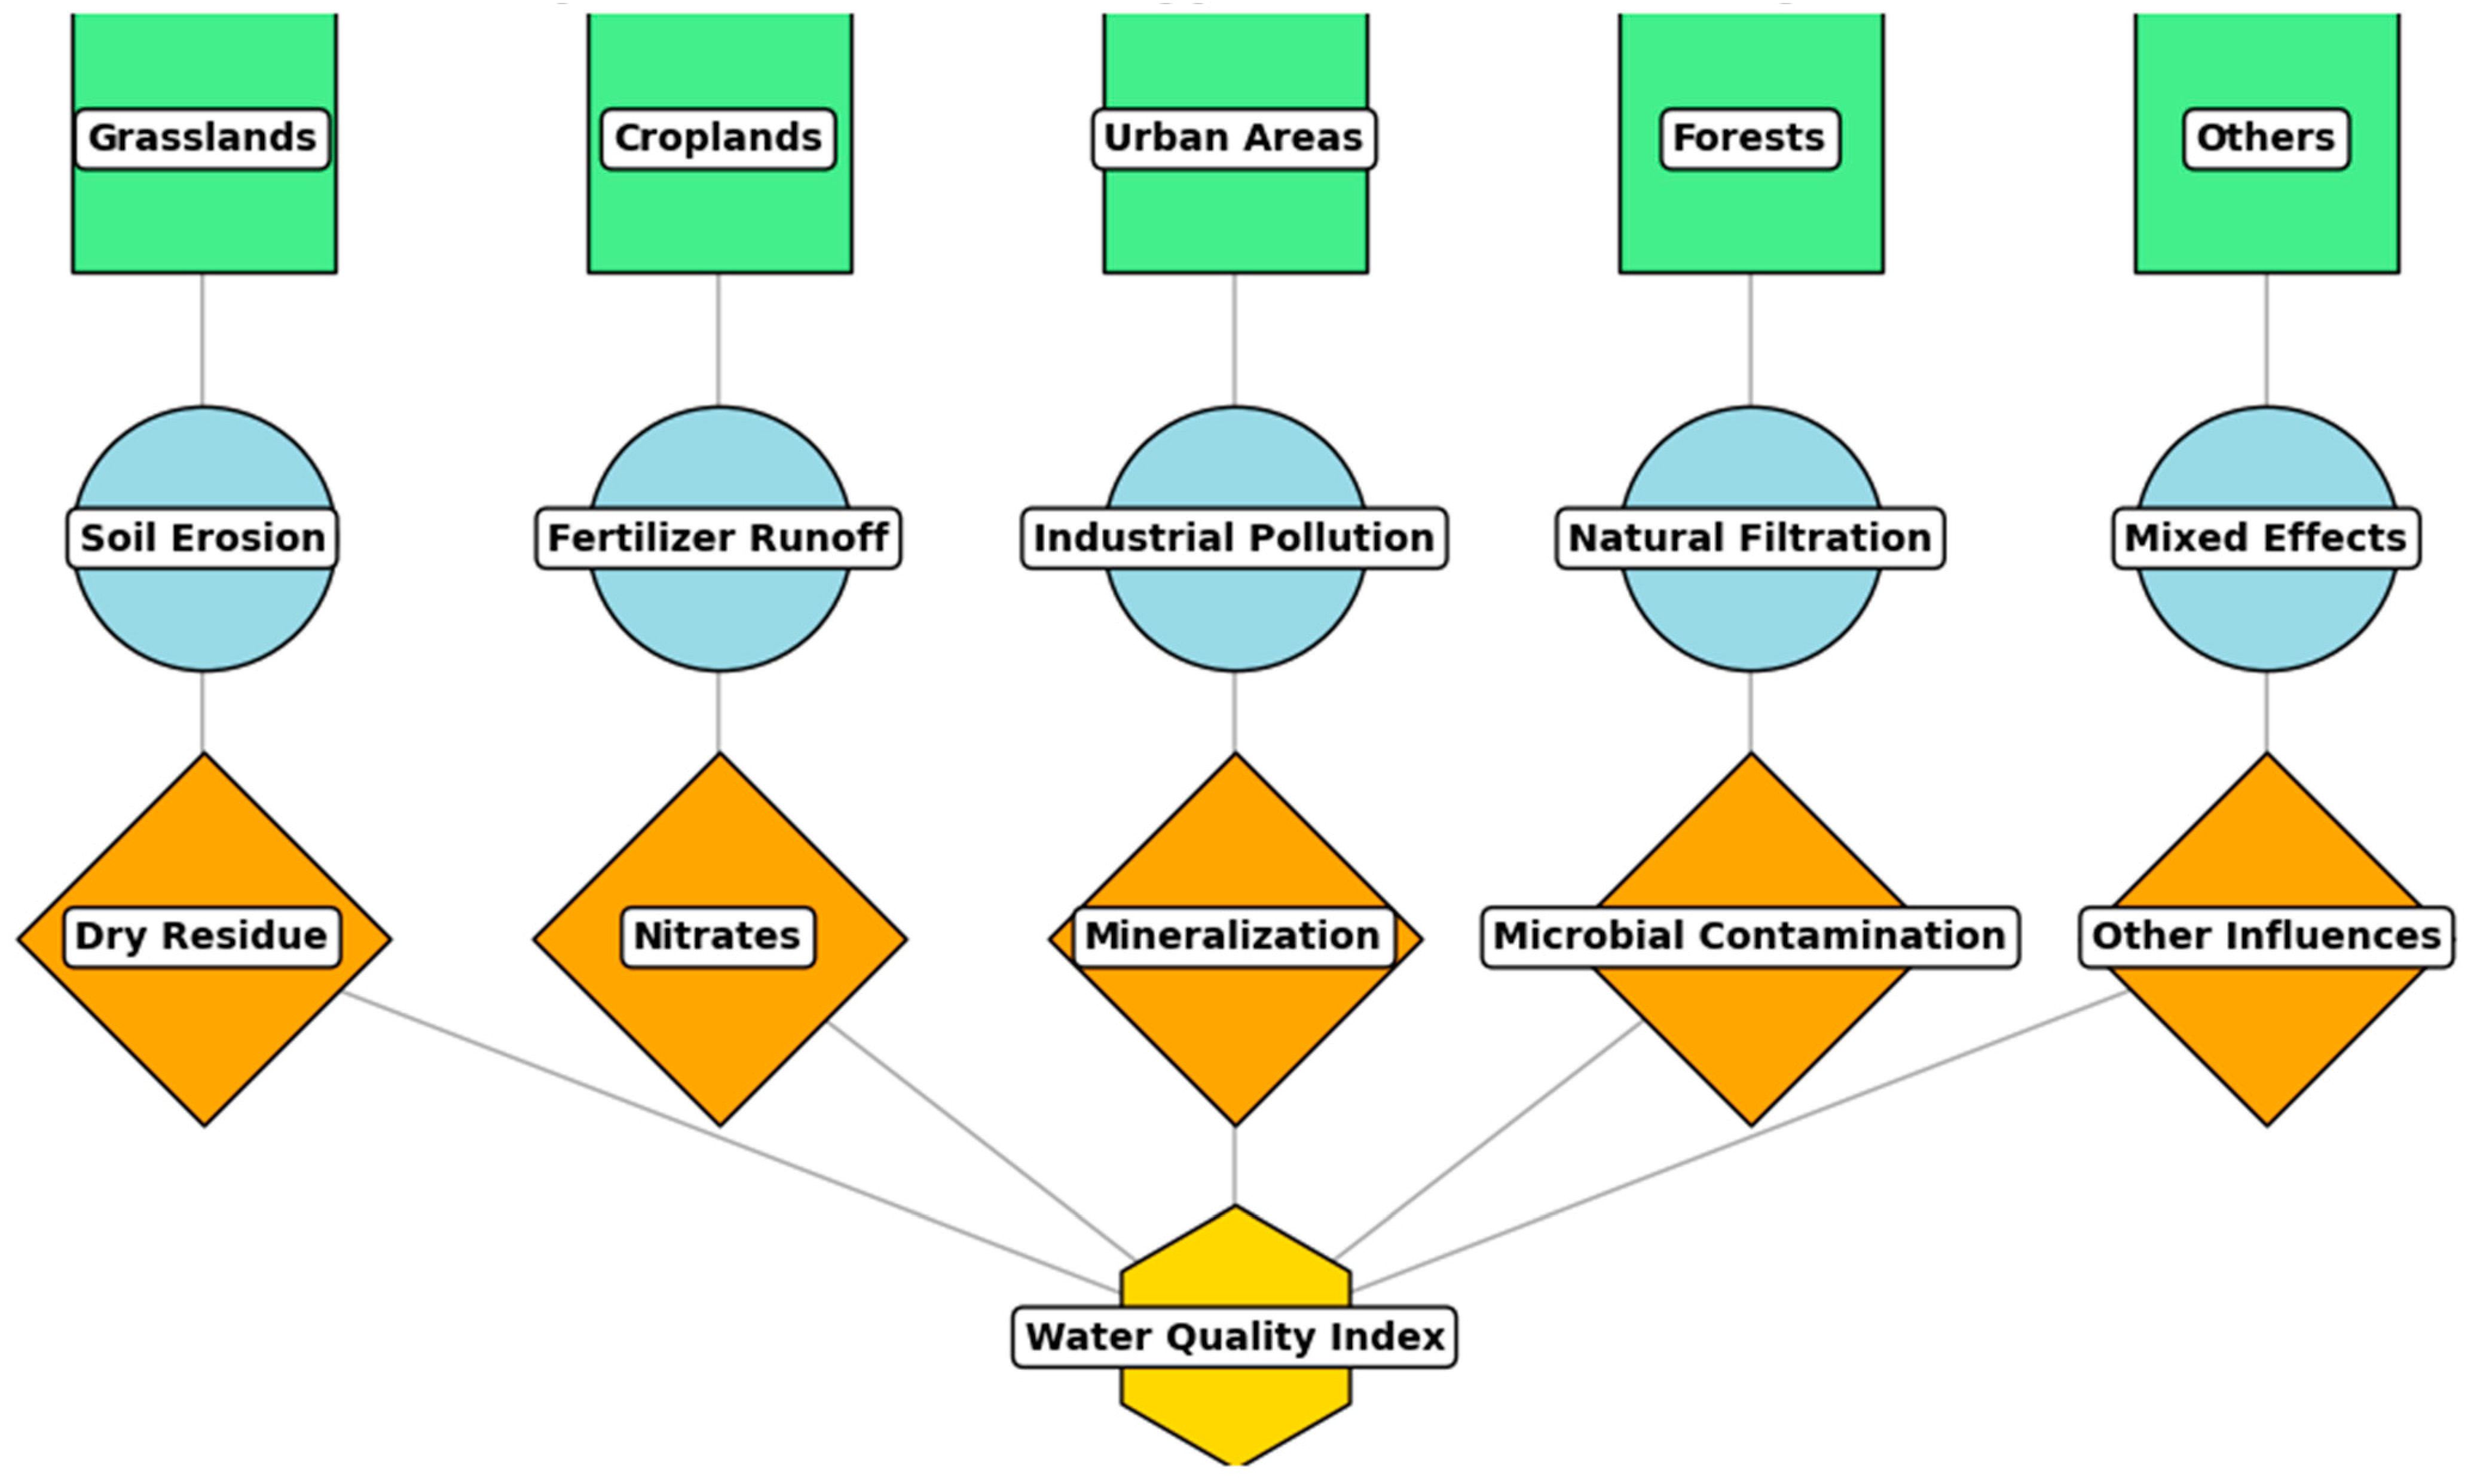
2.2.2. Land Use Land Cover Method of the Geospatial Mapping
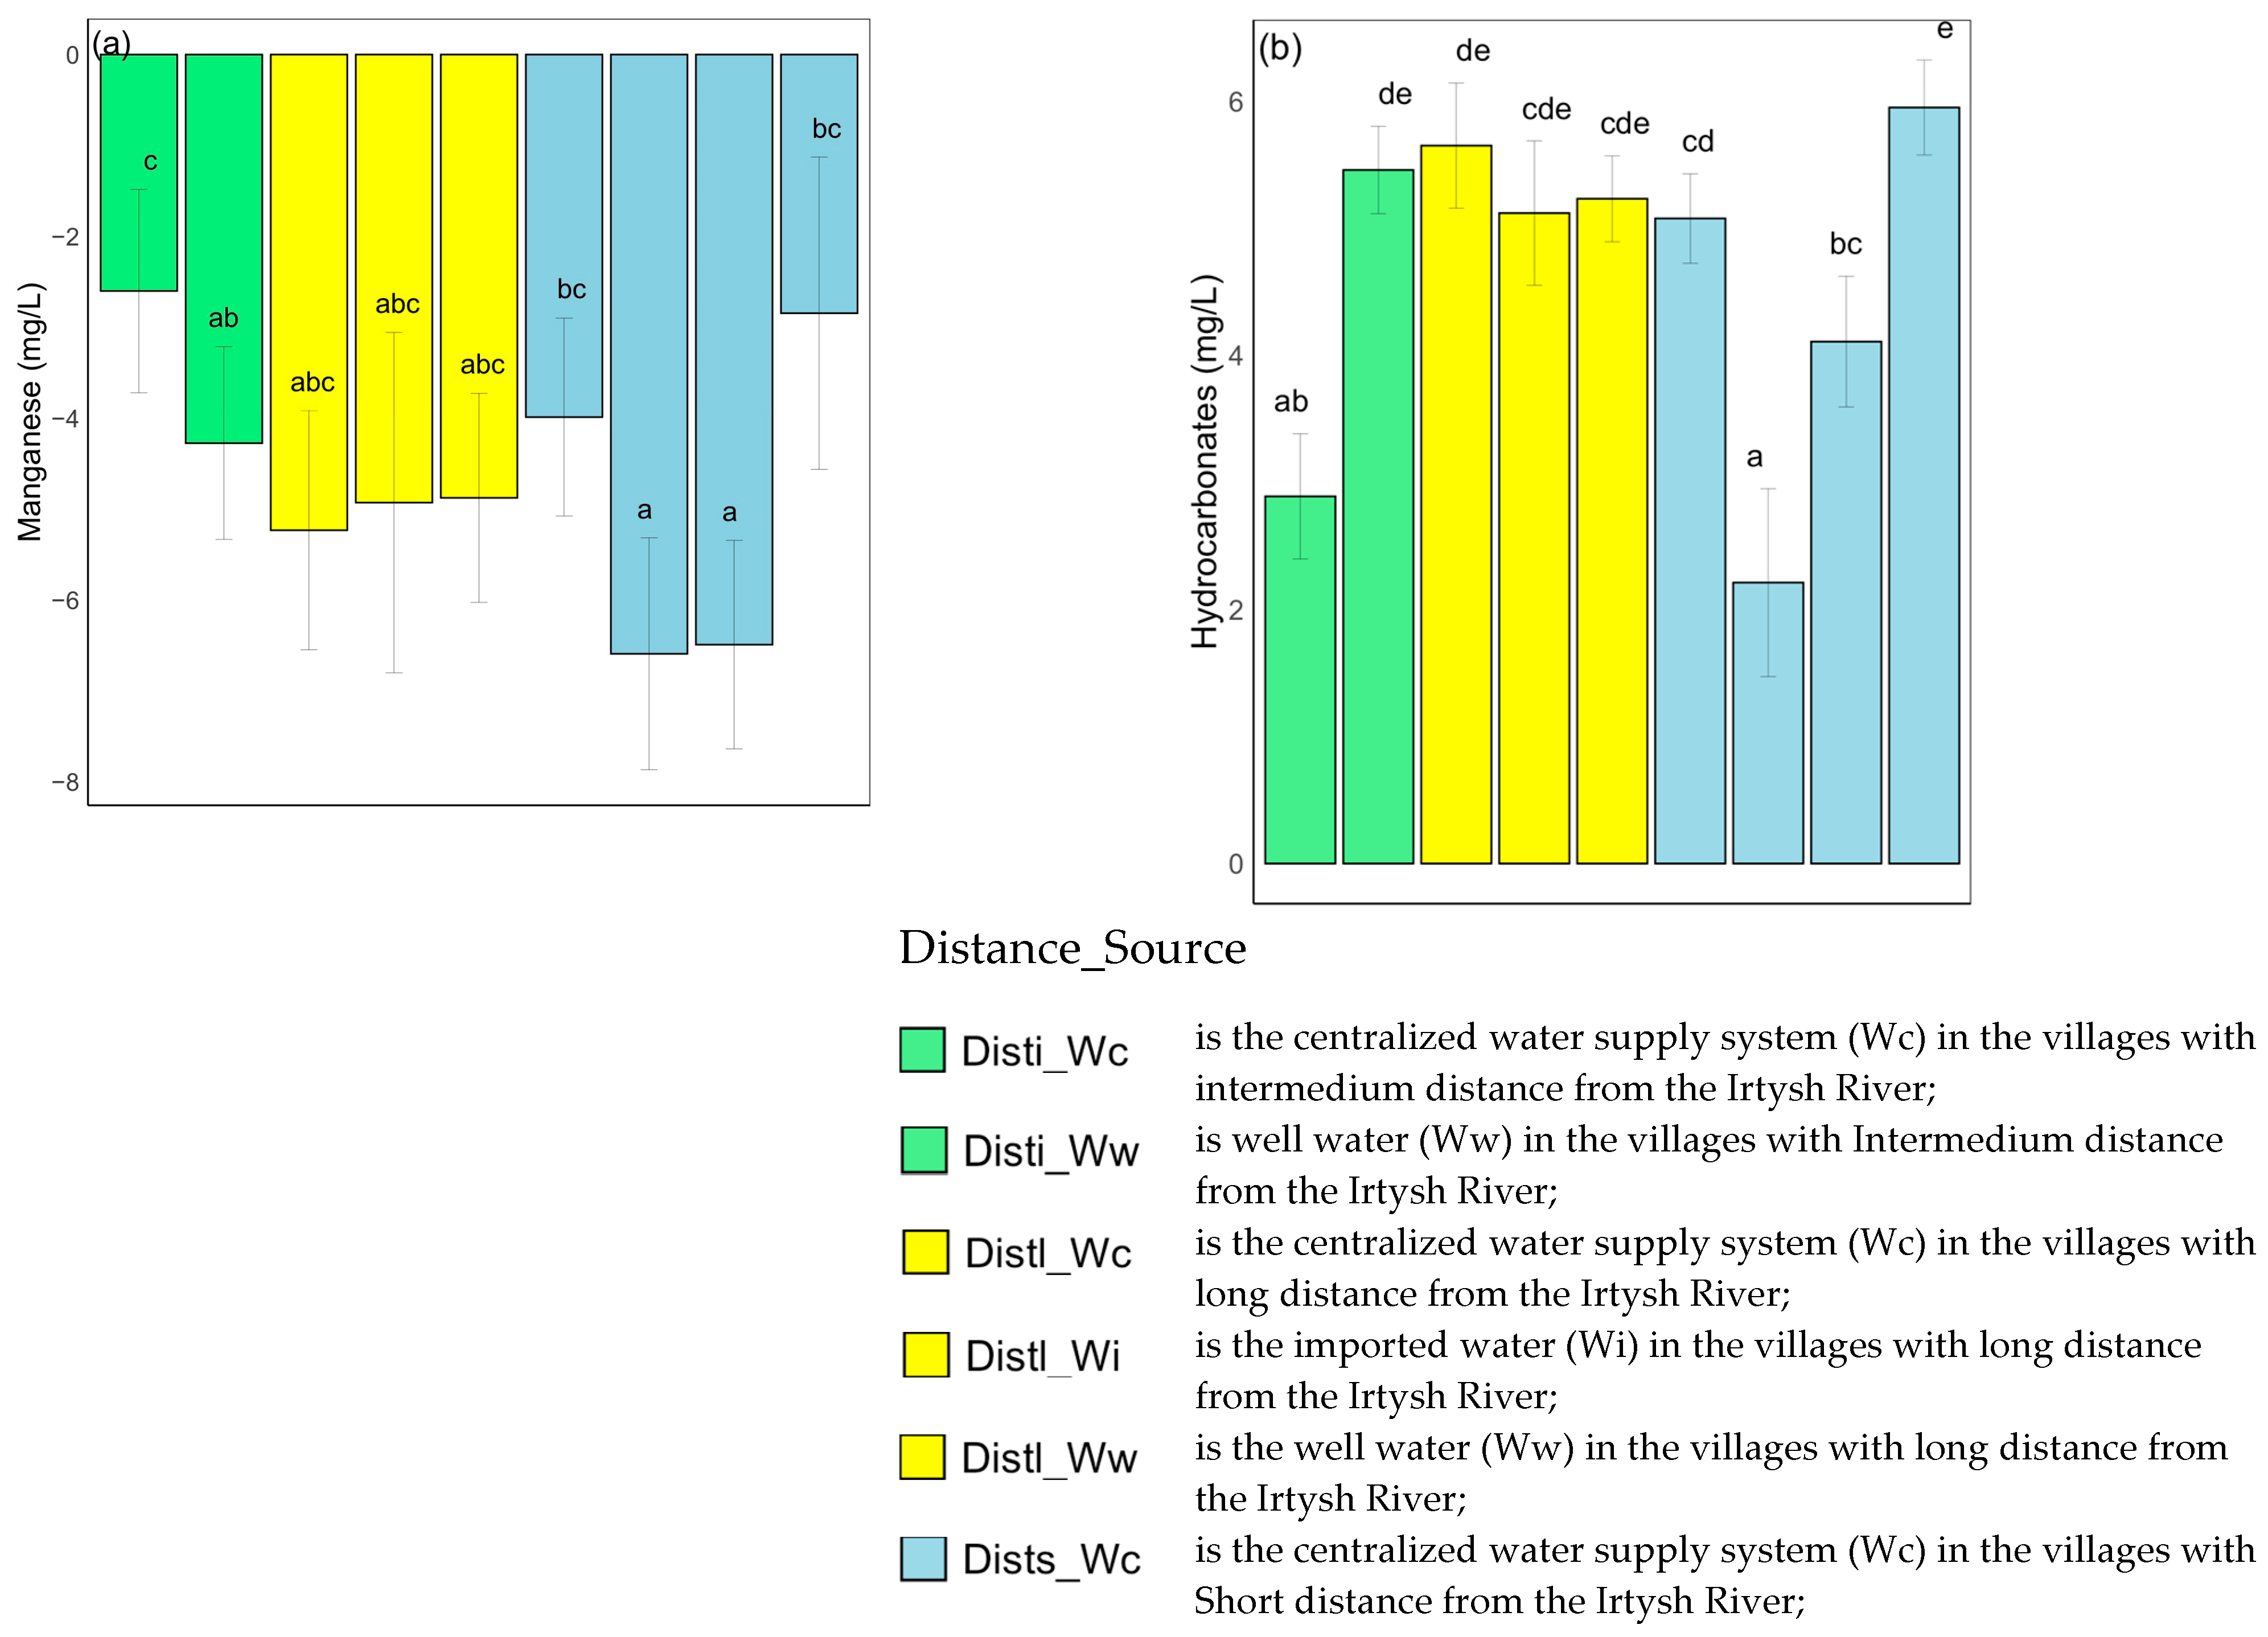
2.2.3. Statistical Analysis
3. Results
4. Discussion
5. Conclusions
Author Contributions
Funding
Data Availability Statement
Acknowledgments
Conflicts of Interest
Appendix A
References
- Song, Y.; Song, X.; Shao, G.; Hu, T. Effects of Land Use on Stream Water Quality in the Rapidly Urbanized Areas: A Multiscale Analysis. Water 2020, 12, 1123. [Google Scholar] [CrossRef]
- Dao, P.U.; Heuzard, A.G.; Le, T.X.H.; Zhao, J.; Yin, R.; Shang, C.; Fan, C. The impacts of climate change on groundwater quality: A Review. Sci. Total Environ. 2024, 912, 169241. [Google Scholar]
- Paule-Mercado, M.C.; Rabaneda-Bueno, R.; Porcal, P.; Kopacek, M.; Huneau, F.; Vystavna, Y. Climate and land use shape the water balance and water quality in selected European lakes. Sci. Rep. 2024, 14, 8049. [Google Scholar] [CrossRef]
- Naz, I.; Ahmad, I.; Aslam, R.W.; Quddoos, A.; Yaseen, A. Integrated Assessment and Geostatistical Evaluation of Groundwater Quality through Water Quality Indices. Water 2024, 16, 63. [Google Scholar] [CrossRef]
- Datta, S.; Karmakar, S.; Islam, M.N.; Karim, M.E.; Kabir, M.H.; Uddin, J. Assessing landcover and water uses effects on water quality in a rapidly developing semi-urban coastal area of Bangladesh. J. Clean. Prod. 2022, 336, 130388. [Google Scholar] [CrossRef]
- Singh, C.K.; Shashtri, S.; Mukherjee, S.; Kumari, R.; Avatar, R.; Singh, A.; Singh, R.P. Application of GWQI to Assess Effect of Land Use Change on Groundwater Quality in Lower Shiwaliks of Punjab: Remote Sensing and GIS Based Approach. Water Resour. Manag. 2011, 25, 1881–1898. [Google Scholar] [CrossRef]
- Thakur, D.; Bartarya, S.K.; Nainwal, H.C.; Dutt, S. Impact of environment and LULC changes on groundwater resources in the Soan Basin, western Himalaya. Environ. Monit. Assess. 2022, 194, 612. [Google Scholar] [CrossRef]
- Shanmuharajan, M.B.; Aparna, S.B.; Vivek, S. Groundwater Vulnerability Assessment Phenomenon using DRASTIC & Modified DRASTIC Modeling validated with Nitrate Concentration. Water Qual. 2023, 25, 153–163. [Google Scholar] [CrossRef]
- Mueller-Warrant, G.W.; Griffith, S.M.; Whittaker, G.W.; Banowetz, G.M.; Pfender, W.F.; Garcia, T.S.; Giannico, G.R. Impact of land use patterns and agricultural practices on water quality in the Calapooya River Basin of western Oregon. J. Soil Water Conserv. 2012, 67, 183–201. [Google Scholar] [CrossRef]
- Cheng, C.; Zhang, F.; Shi, J.; Kung, H.T. What is the relationship between land use and surface water quality? A review and prospects from remote sensing perspective. Environ. Sci. Pollut. Res. 2022, 29, 56887–56907. [Google Scholar] [CrossRef]
- Xiao, R.; Wang, G.; Zhang, Q.; Zhang, Z. Multi-scale analysis of relationship between landscape pattern and urban river water quality in different seasons. Sci. Rep. 2016, 6, 25250. [Google Scholar] [CrossRef] [PubMed] [PubMed Central]
- Francis, J.B.; Ramberg, E.; Sargac, J.; Forio, M.A.E.; de Saeyer, N.; Mutinova, P.T.; Moe, T.F.; Pavelescu, M.O.; Dinu, V.; Cazacu, C.; et al. Assessing the Benefits of Forested Riparian Zones: A Qualitative Index of Riparian Integrity Is Positively Associated with Ecological Status in European Streams. Water 2020, 12, 1178. [Google Scholar] [CrossRef]
- Thomson, A.J.; Giannopoulos, G.; Pretty, J.; Baggs, E.M.; Richardson, D.J. Biological sources and sinks of nitrous oxide and strategies to mitigate emissions. Philos. Trans. R. Soc. B. 2012, 367, 1157–1168. [Google Scholar] [CrossRef] [PubMed] [PubMed Central]
- Lapierre, J.-F.; Seekell, D.A.; del Giorgio, P.A. Climate and landscape influence on indicators of lake carbon cycling through spatial patterns in dissolved organic carbon. Glob. Change Biol. 2015, 21, 4425–4435. [Google Scholar] [CrossRef] [PubMed]
- The III-IV National Communication of the Republic of Kazakhstan to the UN Framework Convention on Climate Change; Forma Plus Printing House: Astana, Kazakhstan, 2013; 265p, Available online: https://unfccc.int/files/national_reports/annex_i_natcom_/application/pdf/kaz_nc3,4,5,6_eng.pdf (accessed on 12 October 2024).
- Mishra, K.; Choudhary, B.; Fitzsimmons, K.E. Predicting and evaluating seasonal water turbidity in Lake Balkhash, Kazakhstan, using remote sensing and GIS. Front. Environ. Sci. 2024, 12, 1371759. [Google Scholar] [CrossRef]
- Bolatova, Z.; Tussupova, K.; Toleubekov, B.; Sukhanberdiyev, K.; Sharapatova, K.; Stafström, M. Challenges of Access to WASH in Schools in Low- and Middle-Income Countries: Case Study from Rural Central Kazakhstan. Int. J. Environ. Res. Public Health 2021, 18, 9652. [Google Scholar] [CrossRef] [PubMed]
- Order of the Minister of Health of the Republic of Kazakhstan Dated February 20, 2023 No. 26. On Approval of the Sanitary Rules “Sanitary and Epidemiological Requirements for Water Sources, Water Intake Places for Domestic and Drinking Purposes, Domestic and Drinking Water Supply and Places of Cultural and Domestic Water Use and Safety of Water Bodies”. Registered with the Ministry of Justice of the Republic of Kazakhstan on February 20, 2023 No. 31934. Available online: https://adilet.zan.kz/rus/docs/V2300031934 (accessed on 12 October 2024).
- Chen, J.; John, R.; Yuan, J.; Mack, E.A.; Groisman, P.; Allington, G.; Wu, J.; Fan, P.; de Beurs, K.M.; Karnieli, A.; et al. Sustainability challenges for the social- environmental systems across the Asian Drylands Belt. Environ. Res. Lett. 2022, 17, 023001. [Google Scholar] [CrossRef]
- RSE “Kazhydromet”. Information Bulletin on the State of the Environment in the Pavlodar Region. National Hydrometeorological Service. Retrieved from Kazhydromet.kz. 2022. Available online: https://www.kazhydromet.kz/en/ecology/ezhemesyachnyy-informacionnyy-byulleten-o-sostoyanii-okruzhayuschey-sredy/2023 (accessed on 23 May 2024).
- Doe, J. Water resource use and management in the Pavlodar Region of Kazakhstan. J. Water Resour. Manag. 2017, 15, 123–135. [Google Scholar]
- Kolluru, V.; John, R.; Chen, J.; Xiao, J.; Amirkhiz, R.G.; Giannico, V.; Kussainova, M. Optimal ranges of social-environmental drivers and their impacts on vegetation dynamics in Kazakhstan. Sci. Total Environ. 2022, 847, 157562. [Google Scholar]
- Xi, X.; Steinfeld, D.; Cavallo, S.M.; Wang, J.; Chen, J.; Zulpykharov, K.; Henebry, G.M. What caused the unseasonal extreme dust storm in Uzbekistan during November 2021? Environ. Res. Lett. 2023, 18, 114029. [Google Scholar] [CrossRef]
- Mogilyuk, S.V.; Poukh, M.M. Ecology of the Pavlodar Region; EKO: Pavlodar, Kazakhstan, 2019; p. 84. (In Russian) [Google Scholar]
- Kikeshev, N.I. Kimak Khaganate. History of Eurasia. In Origins. Hypotheses. Discoveries; LitRes: Moscow, Russia, 2019; T. 2; pp. 166–520. [Google Scholar]
- Population Dynamics and Ethnic Composition of Kazakhstan in the Second Half of the 20th Century, Demoscope Weekly, No. 103–104, 3–16 March 2003. Available online: https://stat.gov.kz/en/ (accessed on 23 May 2024). (In Russian)
- Korneeva, S.V. Use of groundwater with increased mineralization for drinking water supply in the Pavlodar Region. Geol. Subsoil Prot. 2016, 3, 74–83. [Google Scholar]
- Krupa, E.; Romanova, S.; Serikova, A.; Shakhvorostova, L. A Comprehensive Assessment of the Ecological State of the Transboundary Irtysh River (Kazakhstan, Central Asia). Water 2024, 16, 973. [Google Scholar] [CrossRef]
- Shamshedenova, S.; Beisenova, R.; Rakhymzhan, Z.; Zhaznaeva, Z.; Syzdykova, N.; Tazitdinova, R.; Khanturin, M. Ecological Characteristics of Groundwater in Rural Areas of the Karaganda Region. J. Ecol. Eng. 2019, 20, 67–75. [Google Scholar] [CrossRef] [PubMed]
- Bergey, D.H.; Holt, J.G. Bergey’s Manual of Determinative Bacteriology, 9th ed.; Williams & Wilkins: Baltimore, UK, 1994; pp. 169–178. [Google Scholar]
- Horton, R.K. An index number for rating water quality. J. Water Pollut. Control Fed. 1965, 37, 300–306. [Google Scholar]
- Karra, K.; Kontgis, C.; Statman-Weil, Z.; Mazzariello, J.C.; Mathis, M.; Brumby, S.P. Global land use/land cover with Sentinel-2 and deep learning. In Proceedings of the 2021 IEEE International Geoscience and Remote Sensing Symposium IGARSS, Brussels, Belgium, 11–16 July 2021; pp. 4704–4707. [Google Scholar] [CrossRef]
- Singh, D.D.; Sahoo, M.; Sharma, M.; John, S. Geospatial analysis of groundwater Quality in Ludhiana, Punjab (India). Geo. Environ. Earth Sci. Inter. 2019, 20, 1–12. [Google Scholar]
- Marouane, B.; Belhsain, K.; Jahdi, M.; El Hajjaji, S.; Dahchour, A.; Dousset, S.; Satrallah, A. Impact of Agricultural Practices on Groundwater Quality: Case of Charb region—Morocco. J. Mater. Environ. Sci. 2014, 5, 2151–2155. [Google Scholar]
- Rath, S.; Zamora-Re, M.; Graham, W.; Dukes, M.; Kaplan, D. Quantifying nitrate leaching to groundwater from a corn-peanut rotation under a variety of irrigation and nutrient management practices in the Suwannee River Basin, Florida. Agric. Water Manag. 2021, 246, 106634. [Google Scholar] [CrossRef]
- Rahman, M.N. Urban Expansion Analysis and Land Use Changes in Rangpur City Corporation Area, Bangladesh, Using Remote Sensing (RS) and Geographic Information System (GIS) Techniques. Int. J. Adv. Study Res. Work 2019, 2, 2581–5997. [Google Scholar]
- Cui, Y.; Wang, J.; Hao, S. Spatial variability of nitrate pollution and its sources in a hilly basin of theYangtze River based on clustering. Sci. Rep. 2021, 11, 16752. [Google Scholar] [CrossRef]
- Kristanti, R.A.; Hadibarata, T.; Syafrudin, M.; Yilmaz, M.; Abdullah, S. Microbiological Contaminants in Drinking Water: Current Status and Challenges. Water Air Soil Pollut. 2022, 233, 299. [Google Scholar] [CrossRef]
- Nurtazin, S.; Pueppke, S.; Ospan, T.; Mukhitdinov, A.; Elebessov, T. Quality of Drinking Water in the Balkhash District of Kazakhstan’s Almaty Region. Water 2020, 12, 392. [Google Scholar] [CrossRef]
- Abebe, Y.; Alemayehu, T.; Birhanu, B.; Alamirew, T.; Alemayehu, E. Demystifying Heavy Metals and Physicochemical Characteristics of Groundwater in a Volcano-Tectonic Region of Middle Awash, Ethiopia, for Multipurpose Use. Sustainability 2024, 16, 5257. [Google Scholar] [CrossRef]
- Rost, S.; Gerten, D.; Bondeau, A.; Lucht, W.; Rohwer, J.; Schaphoff, S. Agricultural green and blue water consumption and its influence on the global water system. Water Resour. Res. 2008, 44, W09405. [Google Scholar] [CrossRef]
- Issaka, S.; Ashraf, M.A. Impact of soil erosion and degradation on water quality: A review. Geol. Ecol. Landsc. 2017, 1, 1–11. [Google Scholar] [CrossRef]
- Turunen, J.; Markkula, J.; Rajakallio, M.; Aroviita, J. Riparian forests mitigate harmful ecological effects of agricultural diffuse pollution in medium-sized stream. Sci. Total Environ. 2018, 649, 495–503. [Google Scholar] [CrossRef]


| Region | January | February | March | April | May | June | July | August | September | October | November | December |
|---|---|---|---|---|---|---|---|---|---|---|---|---|
| Kazakhstan | −4.8 (23) | 15.5 (98) | 21.2 (98) | −12.9 (10) | −18.8 (1) | −8.1 (20) | −5.4 (33) | −7.1 (27) | −6.6 (18) | −10.2 (17) | −3.9 (42) | −14.2 (3) |
| Pavlodar | −5.7 (35) | 6.5 (86) | 14.4 (91) | −12.9 (6) | −20.5 (1) | 11.5 (57) | 2.9 (56) | 15.4 (82) | 1.7 (50) | −5.0 (51) | 5.6 (76) | −2.2 (30) |
| Months | Day Air Temperature, °C | Night Air Temperature, °C | Air Pressure, mmHg | Wind Speed, m/s | Air Humidity, % |
|---|---|---|---|---|---|
| January | −19 | −20 | 763 | 1.7 | 72 |
| February | −12 | −16 | 754 | 2.9 | 79 |
| March | −4 | −7 | 752 | 3.5 | 80 |
| April | 11 | 3 | 757 | 3.0 | 55 |
| May | 21 | 14 | 751 | 3.4 | 38 |
| June | 22 | 15 | 747 | 3.2 | 50 |
| July | 25 | 18 | 744 | 2.1 | 55 |
| August | 23 | 17 | 748 | 2.3 | 61 |
| September | 14 | 8 | 749 | 2.4 | 59 |
| October | +7 | +3 | 756 | 2.5 | 70 |
| November | −3 | −6 | 755 | 2.9 | 67 |
| December | −8 | −9 | 758 | 2.4 | 84 |
| Name of Village | Latitude, Longitude | Population * (Men/Women) | D ** (km) | Land Area (km2) | ||||
|---|---|---|---|---|---|---|---|---|
| Forests | Grasslands | Croplands | Urban | Others | ||||
| Gosplemstancya | 52°29′59″ N 76°48′43″ E | 1308 (653/655) | 2.25 | 0.83 | 3.02 | 5.96 | 1.78 | 1.01 |
| Shoptykol | 51°17′46″ N 75°47′00″ E | 187 (96/91) | 122.8 | 0.00 | 12.35 | 0.00 | 0.20 | 0.01 |
| Shakat | 52°19′47″ N 77°18′28″ E | 774 (375/399) | 26.2 | 0.48 | 4.38 | 4.31 | 1.73 | 1.66 |
| Chernoyarka | 52°31′15″ N 76°48′29″ E | 653 (327/326) | 1.2 | 0.01 | 9.48 | 1.91 | 0.97 | 0.20 |
| Birlik | 52°04′55″ N 77°07′07″ E | 426 (229/197) | 7.1 | 0.00 | 9.09 | 0.01 | 0.28 | 3.13 |
| Koryakovka | 52°24′32″ N 77°08′47″ E | 176 (87/89) | 20.5 | 0.17 | 11.54 | 0.68 | 0.04 | 0.13 |
| Zhanatan | 51°32′27″ N 77°38′11″ E | 352 (182/170) | 5.1 | 1.08 | 4.96 | 0.68 | 2.01 | 1.66 |
| Naberezhnoe | 52°40′32″ N 76°42′32″ E | 1552 (731/821) | 1.4 | 0.03 | 10.35 | 0.96 | 0.33 | 0.89 |
| Zhertumsyk | 52°03′05″ N 77°08′14″ E | 234 (115/119) | 6.5 | 0.01 | 6.52 | 4.48 | 1.55 | 0.02 |
| Efremovka | 52°32′01″ N 77°21′02″ E | 1090 (517/573) | 38.2 | 0.07 | 8.71 | 1.87 | 1.33 | 0.60 |
| Anions | * µ ± σ | Cations | µ ± σ | General Parameters | µ ± σ |
|---|---|---|---|---|---|
| Hydrocarbonates, mg/L | 81.33 ± 09.62 | Natrium and Kalium, mg/L | 17.33 ± 0.29 | Mineralization, mg/L | 196.33 ± 6.50 |
| Carbonates, mg/L | 20.32 ± 0.13 | Iron, mg/L | 0.56 ± 0.01 | General Hardness, mg-Eq | 2.17 ± 0.05 |
| Chlorides, mg/L | 14.00 ± 0.16 | Calcium, mg/L | 28.00 ± 0.26 | Carbonate Hardness, mg-Eq | 1.98 ± 0.03 |
| Nitrates, mg/L | 0.50 ± 0.01 | Magnesium, mg/L | 9.67 ± 0.06 | Dry Residual, mg/L | 155.67 ± 5.03 |
| Sulfates, mg/L | 25.33 ± 0.71 | Manganese, mg/L | 0.01 ± 0.004 | pH | 8.28 ± 0.09 |
| Total Anions, mg/L | 143.67 ± 1.27 | Total Cations, mg/L | 55.67 ± 0.32 |
| Name of Village | Wc | Wi | Wr | Ww | ||||||||
|---|---|---|---|---|---|---|---|---|---|---|---|---|
| Wi1 | Wi2 | Wi3 | Wi4 | Ww1 | Ww2 | Ww3 | Ww4 | Ww5 | Ww6 | |||
| Gosplemstancya | 50.79 | 4.76 | 1.59 | - | - | - | - | 15.88 | 26.98 | - | - | - |
| Shoptykol | - | - | - | - | - | - | - | - | - | 100 | - | - |
| Shakat | 16.22 | 2.70 | - | 2.70 | - | - | - | 70.27 | 8.11 | - | - | - |
| Chernoyarka | 8.70 | - | - | - | - | - | - | 41.30 | 34.78 | - | - | 15.22 |
| Birlik | 40.82 | - | - | - | 8.16 | - | - | 20.41 | 12.24 | - | - | 18.37 |
| Koryakovka | - | - | - | - | 5.26 | - | 42.11 | 5.26 | 26.32 | 21.05 | - | - |
| Zhanatan | - | 13.33 | - | - | - | - | - | 60.00 | 26.67 | - | - | - |
| Naberezhnoe | 40.86 | 1.08 | - | - | 3.22 | 33.33 | - | 4.30 | 6.45 | 1.08 | 8.60 | 1.08 |
| Zhertumsyk | 3.03 | - | - | 3.03 | 21.21 | - | - | 45.45 | 12.12 | 3.03 | - | 6.06 |
| Efremovka | - | - | - | - | - | - | - | 72.50 | 27.50 | - | - | - |
| WQI | Water Quality | Possible Usage |
|---|---|---|
| 0–25 | Excellent | Drinking, Irrigation, and Industrial |
| 26–50 | Good | Domestic, Irrigation, and Industrial |
| 51–75 | Fair | Irrigation and Industrial |
| 76–100 | Poor | Irrigation |
| 101–150 | Very Poor | Restricted Use for Irrigation |
| >150 | Unfit for Drinking | Proper Treatment Required Before Use |
| Class Name | Description of Class |
|---|---|
| Water Bodies | Rivers, ponds, lakes, flooded salt plains |
| Forests | Deciduous, evergreen, mixed, and residential forests |
| Wetland Areas | Flooded areas, emergent vegetation, rice paddies, and other irrigated/inundated lands |
| Croplands | Crops of cereals, crops not at tree height, rainfed, irrigated, mosaic |
| Built-up and Urban Lands | Residential, commercial, industrial, roads and transportation, communications, and utilities |
| Bare Areas | Bare rock areas, sands, dry salt flats/pans, dried lake beds |
| Permanent Snow/Ice | Perennial cover of ice and/or snow, generally greater than 25% of total cover |
| Grasslands | Managed grasslands, semi-natural grasslands, natural grassy vegetation, and rangelands |
| Clouds | No land cover information due to persistent cloud cover |
| Village’s Name/Chemical Substances | Birlik | Chernoyarka | Efremovka | Gosplemstantcyia | Koryakovka | Naberezhnoe | Shakat | Shoptykol | Zhanatan | Zhertumsyk |
|---|---|---|---|---|---|---|---|---|---|---|
| Natrium and Kalium, mg/L | 71.17 ± 6.42 | 135.33 ± 7.98 | 181.6 ± 3.41 | 211.71 ± 5.53 | 256.69 ± 4.44 | 132.71 ± 1.57 | 380.17 ± 1.48 | 332 ± 4.29 | 192.6 ± 1.51 | 119.8 ± 1.11 |
| Iron, mg/L | 0.16 ± 0.02 | 0.08 ± 0.006 | 0.06 ± 0.002 | 0.3 ± 0.051 | 0.05 ± 0.002 | 0.27 ± 0.037 | 0.18 ± 0.025 | 0.08 ± 0.004 | 0.18 ± 0.011 | 0.05 ± 0.007 |
| Calcium, mg/L | 28.67 ± 0. 39 | 88.33 ± 0.68 | 36.4 ± 0.53 | 81.71 ± 0.26 | 134.63 ± 2.35 | 28.29 ± 0.16 | 23.5 ± 0.84 | 62 ± 0.53 | 76.4 ± 0.28 | 140 ± 1.01 |
| Magnesium, mg/L | 13.17 ± 0.17 | 49.32 ± 0.37 | 34.6 ± 0.69 | 54.43 ± 0.19 | 94.08 ± 1.63 | 16.14 ± 0.14 | 17.33 ± 0.86 | 82.5 ± 1.04 | 47.2 ± 0.96 | 47.4 ± 0.35 |
| Manganese, mg/L | 0.01 ± 0.001 | 0.2 ± 0.046 | 0.02 ± 0.003 | 0.1 ± 0.016 | 0.03 ± 0.004 | 0.07 ± 0.011 | 0.01 ± 0.001 | 0.01 ± 0.001 | 0.22 ± 0.007 | 0.01 ± 0.001 |
| Total Cations, mg/L | 113.17 ± 1.15 | 273.17 ± 1.79 | 252.6 ± 2.89 | 359.17 ± 1.01 | 364.27 ± 6.28 | 177.71 ± 1.62 | 421.17 ± 1.31 | 476.5 ± 5.84 | 260 ± 1.34 | 308 ± 2.46 |
| Hydrocarbonates, mg/L | 90.33 ± 1.12 | 247.17 ± 1.71 | 296.4 ± 3.09 | 245.71 ± 4.31 | 866.4 ± 15.69 | 181.14 ± 1.49 | 339.67 ± 3.28 | 291.75 ± 3.91 | 337.67 ± 3.95 | 197.8 ± 1.06 |
| Carbonates, mg/L | 18 ± 0.08 | 28 ± 0.22 | 36 ± 0.14 | 30 ± 8.49 | 12 ± 0.03 | 23.57 ± 18.04 | 0 | 0 | 0 | 0 |
| Chlorides, mg/L | 79.67 ± 0.63 | 153.5 ± 8.04 | 80.8 ± 0. 20 | 247.29 ± 8.03 | 383.50 ± 8.55 | 78.86 ± 0.81 | 139.33 ± 5.46 | 175.5 ± 2.85 | 150 ± 3.54 | 184.8 ± 1.78 |
| Nitrates, mg/L | 24.24 ± 3.75 | 58.2 ± 6.73 | 4.78 ± 0.18 | 1.41 ± 0.03 | 2.86 ± 0.48 | 2.71 ± 0.34 | 3.63 ± 0.17 | 11.65 ± 0.17 | 20.53 ± 0.35 | 180.56 ± 1.67 |
| Sulfates, mg/L | 57.67 ± 0.63 | 197.5 ± 8.04 | 239.8 ± 2.02 | 311 ± 8.03 | 646.4 ± 8.58 | 120 ± 8.15 | 459.83 ± 5.43 | 169.75 ± 2.85 | 286.67 ± 3.54 | 228.8 ± 1.71 |
| Total Anions, mg/L | 260.83 ± 2.86 | 684.33 ± 4.68 | 632.2 ± 4.79 | 819.43 ± 2.30 | 105.03 ± 1.36 | 407.71 ± 3.53 | 942.67 ± 2.44 | 655.25 ± 1.01 | 796.67 ± 1.07 | 792.4 ± 6.13 |
| Mineralization, mg/L | 374.17 ± 4.01 | 957.83 ± 6.47 | 884.8 ± 7.65 | 1162.43 ± 3.36 | 750.57 ± 1.69 | 584.14 ± 5.17 | 1363.67 ± 3.85 | 922.25 ± 1.53 | 1081 ± 1.47 | 1100.6 ± 8.51 |
| General Hardness, mg-Eq | 2.52 ± 0. 34 | 8.47 ± 0.66 | 4.66 ± 0.086 | 8.57 ± 0.29 | 6.16 ± 11.25 | 2.74 ± 0.02 | 3.66 ± 0.01 | 5.7 ± 0.88 | 7.7 ± 0.27 | 10.92 ± 0.89 |
| Carbonate Hardness, mg-Eq | 1.77 ± 0.02 | 4.82 ± 0.03 | 4.54 ± 0.08 | 4.31 ± 0.07 | 13.82 ± 0.25 | 2.65 ± 0.025 | 2.93 ± 0.26 | 4.78 ± 0.062 | 5.28 ± 0.06 | 3.72 ± 0.021 |
| Dry Residual, mg/L | 312.33 ± 3.63 | 834.33 ± 5.61 | 738 ± 8.12 | 1039.57 ± 31.89 | 646.24 ± 1.41 | 493.43 ± 4.45 | 1193.83 ± 36.71 | 776.5 ± 1.22 | 940 ± 15.18 | 1001.4 ± 8.12 |
| pH | 7.78 ± 0.69 | 8.27 ± 0.28 | 8.28 ± 0.27 | 8.04 ± 0.33 | 8.07 ± 0.58 | 8.5 ± 0.23 | 6.65 ± 2.13 | 7.54 ± 0.17 | 7.87 ± 0.16 | 6.85 ± 1.1 |
| WQI | 31.83 ± 0.45 | 52.8 ± 0.39 | 50.23 ± 0.26 | 114 ± 7.11 | 44.58 ± 0.42 | 42.73 ± 0.27 | 72.85 ± 0.32 | 60.42 ± 0.88 | 125.43 ± 6.83 | 53.39 ± 0.58 |
| Actinomycetes | 1.14 ± 0.018 | 0.49 ± 0.005 | 1.71 ± 0.17 | 1.99 ± 0.33 | 1.06 ± 0.056 | 1.02 ± 0.091 | 1.46 ± 0.018 | 0.15 ± 0.001 | 1.62 ± 0.066 | 0.41 ± 0.005 |
| Fungi | 0.08 ± 0.001 | 0 ± 0 | 0 ± 0 | 0 ± 0 | 0 ± 0 | 0.18 ± 0.004 | 0.18 ± 0.003 | 0.1 ± 0.002 | 0 ± 0 | 0.33 ± 0.007 |
| Total Microbial Amount | 0.76 ± 0.01 | 0.92 ± 0.007 | 81.28 ± 1.08 | 30.16 ± 0.74 | 50.62 ± 0.99 | 29.47 ± 0.75 | 100.95 ± 1.08 | 0.72 ± 0.009 | 160.48 ± 8.87 | 41.08 ± 0.88 |
| LC | Ch~LC | HCO3 | SO4 | Cl | NO3 | TA | Ca | Mg | Na, K | Fe | TC | Min | DR | GH |
|---|---|---|---|---|---|---|---|---|---|---|---|---|---|---|
| Grasslands | Estimate | −0.063 | −0.283 | −0.096 | −0.652 | −0.486 | −0.537 | −0.236 | −0.184 | −0.194 | −0.226 | −0.745 | −0.703 | −0.421 |
| SE | 0.057 | 0.057 | 0.043 | 1.260 | 0.152 | 0.123 | 0.111 | 0.050 | 0.558 | 0.067 | 0.205 | 0.179 | 0.136 | |
| Z-value | −1.112 | −4.925 | −2.256 | −0.517 | −3.203 | −4.382 | −2.136 | −3.695 | −0.347 | −3.386 | −3.641 | −3.929 | −3.087 | |
| P(>|z|) | 0.266 | 0.000 | 0.024 | 0.605 | 0.001 | 0.000 | 0.033 | 0.000 | 0.729 | 0.001 | 0.000 | 0.000 | 0.002 | |
| Croplands | Estimate | 0.121 | 0.430 | 0.216 | 6.789 | 0.886 | 0.949 | 0.338 | 0.217 | −0.567 | 0.332 | 1.014 | 0.984 | 0.715 |
| SE | 0.077 | 0.085 | 0.062 | 3.681 | 0.215 | 0.238 | 0.157 | 0.070 | 0.864 | 0.099 | 0.297 | 0.265 | 0.220 | |
| Z-value | 1.582 | 5.077 | 3.505 | 1.844 | 4.119 | 3.996 | 2.156 | 3.111 | −0.656 | 3.343 | 3.413 | 3.717 | 3.253 | |
| P(>|z|) | 0.114 | 0.000 | 0.000 | 0.065 | 0.000 | 0.000 | 0.031 | 0.002 | 0.512 | 0.001 | 0.001 | 0.000 | 0.001 | |
| Forests | Estimate | 0.276 | 1.339 | 0.420 | −44.088 | 1.704 | 1.686 | 1.669 | 1.121 | 1.268 | 1.020 | 4.424 | 4.091 | 2.124 |
| SE | 0.381 | 0.448 | 0.293 | 13.240 | 1.088 | 1.090 | 0.598 | 0.251 | 3.906 | 0.421 | 1.134 | 1.036 | 0.962 | |
| Z-value | 0.724 | 2.988 | 1.433 | −3.330 | 1.567 | 1.547 | 2.790 | 4.469 | 0.325 | 2.424 | 3.901 | 3.947 | 2.207 | |
| P(>|z|) | 0.469 | 0.003 | 0.152 | 0.001 | 0.117 | 0.122 | 0.005 | 0.000 | 0.745 | 0.015 | 0.000 | 0.000 | 0.027 | |
| Urban | Estimate | 0.453 | 1.276 | 0.365 | 11.985 | 2.391 | 2.988 | 1.424 | 0.815 | −1.137 | 1.103 | 3.763 | 3.468 | 2.454 |
| SE | 0.233 | 0.232 | 0.165 | 7.082 | 0.625 | 0.538 | 0.399 | 0.190 | 2.656 | 0.254 | 0.782 | 0.688 | 0.535 | |
| Z-value | 1.941 | 5.493 | 2.218 | 1.692 | 3.826 | 5.555 | 3.573 | 4.303 | −0.428 | 4.341 | 4.814 | 5.040 | 4.590 | |
| P(>|z|) | 0.052 | 0.000 | 0.027 | 0.091 | 0.000 | 0.000 | 0.000 | 0.000 | 0.669 | 0.000 | 0.000 | 0.000 | 0.000 | |
| Others | Estimate | −0.291 | −0.078 | −0.179 | −17.882 | −0.696 | −1.343 | −0.696 | 0.094 | 3.836 | −0.130 | −0.816 | −0.739 | −1.347 |
| SE | 0.162 | 0.179 | 0.113 | 7.749 | 0.458 | 0.561 | 0.299 | 0.150 | 1.591 | 0.195 | 0.649 | 0.578 | 0.469 | |
| Z-value | −1.802 | −0.436 | −1.584 | −2.308 | −1.519 | −2.395 | −2.326 | 0.622 | 2.412 | −0.667 | −1.258 | −1.280 | −2.869 | |
| P(>|z|) | 0.072 | 0.663 | 0.113 | 0.021 | 0.129 | 0.017 | 0.020 | 0.534 | 0.016 | 0.505 | 0.209 | 0.201 | 0.004 |
Disclaimer/Publisher’s Note: The statements, opinions and data contained in all publications are solely those of the individual author(s) and contributor(s) and not of MDPI and/or the editor(s). MDPI and/or the editor(s) disclaim responsibility for any injury to people or property resulting from any ideas, methods, instructions or products referred to in the content. |
© 2025 by the authors. Licensee MDPI, Basel, Switzerland. This article is an open access article distributed under the terms and conditions of the Creative Commons Attribution (CC BY) license (https://creativecommons.org/licenses/by/4.0/).
Share and Cite
Beisenova, R.; Chen, J.; Kussainova, M.; Tussupova, K.; Tazitdinova, R.; Mujahid, N.; Rakhymzhan, Z. Influence of Geographical Locations on Drinking Water Quality in Rural Pavlodar Region, Kazakhstan. Water 2025, 17, 945. https://doi.org/10.3390/w17070945
Beisenova R, Chen J, Kussainova M, Tussupova K, Tazitdinova R, Mujahid N, Rakhymzhan Z. Influence of Geographical Locations on Drinking Water Quality in Rural Pavlodar Region, Kazakhstan. Water. 2025; 17(7):945. https://doi.org/10.3390/w17070945
Chicago/Turabian StyleBeisenova, Raikhan, Jiquan Chen, Maira Kussainova, Kamshat Tussupova, Rumiya Tazitdinova, Nurul Mujahid, and Zhanar Rakhymzhan. 2025. "Influence of Geographical Locations on Drinking Water Quality in Rural Pavlodar Region, Kazakhstan" Water 17, no. 7: 945. https://doi.org/10.3390/w17070945
APA StyleBeisenova, R., Chen, J., Kussainova, M., Tussupova, K., Tazitdinova, R., Mujahid, N., & Rakhymzhan, Z. (2025). Influence of Geographical Locations on Drinking Water Quality in Rural Pavlodar Region, Kazakhstan. Water, 17(7), 945. https://doi.org/10.3390/w17070945