Abstract
Given the increasing threat of groundwater pollution, comprehending the trends and influencing factors of groundwater quality variation is essential for effective mitigation strategies. This study addresses groundwater quality variations in the Beichuan River, a critical area in China’s arid region. Using hydrochemical analysis and multivariate statistics, we identified key factors influencing groundwater quality. Groundwater is mildly alkaline, with HCO3−-Ca as the dominant hydrochemical type. The concentrations of major ions increase during the high-flow period due to rainfall effects. The dissolution of rock salt primarily contributes to the presence of Na+ and Cl− ions. Meanwhile, the weathering of silicate and carbonate rocks is the main origin of Ca2+, Mg2+, and HCO3− ions. Additionally, the dissolution of evaporite rocks is identified as the principal source of SO42−. Human activities, particularly sewage discharge and fertilization, significantly contribute to nitrate contamination. Principal component analysis revealed that the weathering of rocks and industrial activities are the main controlling factors during the high-flow season, while the hydrochemistry of groundwater during the low-flow season is mainly influenced by the weathering of silicate rocks, evaporite rocks, and rock salt. Our findings provide a scientific basis for preventing groundwater quality deterioration and ecological environmental protection in arid regions.
1. Introduction
As a vital resource for human survival, groundwater also holds a crucial role in sustaining sustainable social development and ecological stability [1]. In recent years, as industrialization and urbanization have made rapid progress, the impact of human activities on groundwater quality has increased annually, especially in arid areas with restricted groundwater recharge sources, where human activities may have a more severe effect on groundwater [2,3,4]. Considering the escalating impact on groundwater quality, it is highly vital to determine the characteristics and controlling factors of groundwater quality variation in arid areas [5,6,7].
The quality of groundwater is primarily impacted by both natural factors, including topography, lithology, and the conditions of groundwater recharge, and human factors, such as land use, agricultural practices, and industrial activities [8,9]. Presently, researchers both domestically and internationally have explored the characteristics of groundwater quality variation to some extent. For instance, Bozdağ [10] applied saturation index methods and multivariate statistical analysis to investigate the hydrochemical controlling factors of groundwater in Turkey’s Konya Plain. The findings indicated that water–rock interactions are the predominant factors influencing the hydrochemical composition in this region. Zhang et al. [11] examined the hydrochemical evolution patterns of groundwater in the Hutuo River region and suggested that the chemical composition of groundwater is impacted not only by water–rock interactions and cation exchange but also by domestic sewage. In addition, researchers found that the determinants of groundwater quality include mineral dissolution, interaction with mine water, contamination from domestic wastewater and septic tanks, and pollution from agricultural fertilizers [12]. Nevertheless, investigations into the characteristics and driving factors of groundwater quality fluctuations in arid regions are rather sparse, and the underlying mechanisms causing groundwater quality degradation in these areas remain to be fully elucidated.
The Beichuan River Basin is situated in China’s arid northwest region, where groundwater serves as the primary water supply. Nowadays, the rapid progress of industrialization and urbanization has led to an increasing impact of human activities on groundwater quality, resulting in a deteriorating trend of groundwater quality [13]. Previous research in this area has predominantly concentrated on the features of surface water quality variation, contamination sources, and prevention strategies [14,15]. However, studies on the features and influential factors of groundwater quality variation remain inadequate. Groundwater in arid areas has limited recharge sources and significant evaporation, making the groundwater system more vulnerable and more sensitive to human activities. The patterns and driving factors of groundwater quality variation in these regions may differ from those in other areas. Consequently, this study comprehensively gathered groundwater samples from the Beichuan River Basin and employed hydrochemical diagrams along with multivariate statistical methods to thoroughly examine the patterns of hydrochemical change and the controlling factors of groundwater across different periods. It is anticipated that the findings of this research will offer a significant scientific foundation for the sustainable utilization of groundwater resources and ecological environment conservation in regions with similar geological backgrounds
2. Materials and Methods
2.1. Overview of the Study Area
The Beichuan River Basin spans two major geomorphological units: the Qilian Mountain Plateau and the Huang–Liangzhong Plateau [16]. The topography of the area is characterized by higher elevations in the northwest and lower elevations in the southeast, forming a narrow and elongated shape extending from north to south. The region experiences a semi-arid continental climate, characterized by a mean annual rain volume of 367.5 mm, which is primarily concentrated between May and September.
2.2. Geological and Hydrogeological Conditions
The geological strata within this area are composed of formations from the Neogene (Lower Tertiary), Upper Tertiary, and Quaternary systems. The Quaternary system is primarily composed of alluvial, fluvioglacial, and glacial deposits of sand and gravel. The types of groundwater include porous aquifer water in loose rocks, fractured porous water in clastic rocks, and karstic fracture water in carbonate rocks, each reflecting distinct hydrogeological characteristics. Topography plays a crucial role in determining the interaction between groundwater and surface water. In narrow valley areas, groundwater flow is obstructed, causing the water table to rise and groundwater to discharge to the surface. In wider valley areas, surface water infiltrates extensively, strongly recharging the groundwater. The primary sources of groundwater recharge include rainfall and snowmelt, as well as the percolation of surface water into the subsurface. The main exit routes for groundwater are pumping, spring outflow, and evaporation, which collectively influence the groundwater balance.
2.3. Sample Collection and Testing
A total of 21 groundwater samples were collected during the low-flow season (July 2024) and the high-flow season (October 2024). Sampling sites were predominantly situated along both banks of the Beichuan River, with sampling depths varying between 5 and 25 m below the ground surface. The spatial distributions of these sampling sites are illustrated in Figure 1.
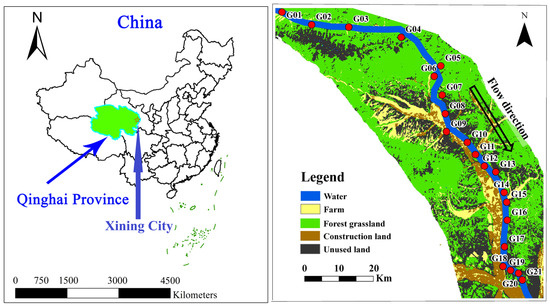
Figure 1.
Geographical location map of the Beichuan River Basin.
In this study, a 500 mL polyethylene plastic bottle was used for sampling. Before sampling, the bottle was thoroughly cleaned with distilled water. During sampling, the collection bottle was thoroughly rinsed three times using the groundwater collected.
Prior to collecting the water samples, the wells were purged to remove stagnant water. The collected samples were subsequently split into two parts. One part was used for the analysis of cations (Na+, K+, Ca2+, and Mg2+), with high-purity nitric acid added in situ to acidify the sample to pH < 2. The other part was reserved for the analysis of anions (HCO3−, SO42−, Cl−, and NO3−). All samples were filled to capacity in the containers without any air bubbles to prevent contamination and stored in a dark environment at low temperatures to maintain the sample’s integrity. Testing was conducted within a week after collection to ensure accurate results.
The pH of the water was measured on site using a portable water quality multiparameter analyzer (Hach-HQ40D, produced by Hach Company Water Quality Analyzer (Shanghai) Co., Ltd., Shanghai, China). The total dissolved solids (TDSs) were determined via the drying method. Na+, K+, Ca2+, and Mg2+ were measured using an atomic absorption spectrophotometer (AA240FS/GTA120, produced by Agilent Technologies Co., Ltd., Shanghai, China), and the detection limit values for the respective analytes were 0.01 mg/L, 0.05 mg/L, 4.0 mg/L, and 3.0 mg/L. The SO42−, Cl−, and NO3− were analyzed using ion chromatography (CIC-D180, manufactured by Qingdao Shenghan Chromatography Technology Co., Ltd., Qingdao, China), with detection limits of 0.75 mg/L, 1.0 mg/L, and 0.664 mg/L, respectively. HCO3− was determined via titration with hydrochloric acid, with a detection limit of 5.0 mg/L.
2.4. Data Analysis Methods
Water Quality Index (WQI)
In our research, the WQI served as a tool for evaluating the groundwater quality within the Beichuan River Basin. The calculation of the WQI involved allocating a specific weight (Wi) to each parameter based on its critical role relative to the overall potability of groundwater. The criteria for water quality were primarily based on China’s Grade III standards for groundwater [17]. In cases where these standards did not include a particular parameter, the guidelines from the World Health Organization (WHO) published in 2011 were utilized. The weights (Wi) and their corresponding relative weights (RWi) for each parameter are detailed in Supplementary Table S1. The WQI values obtained were then categorized into five distinct quality levels: excellent (WQI < 50), good (50 ≤ WQI ≤ 100), poor (100 < WQI ≤ 200), very poor (200 < WQI ≤ 300), and unsuitable for drinking (WQI > 300).
The WQI was calculated as follows:
In the formula, Qi denotes the quality rating; Ci and Si denote the concentration (mg/L) and the water quality standard of each indicator, respectively; SIi is the sub-index of the i-th indicator.
ArcGIS10.5 was employed in this study to generate the map of sampling point distribution for the study area, providing a visual representation of the sampling locations. Ion ratio diagrams were drawn using Origin 2022. SPSS25.0 was employed in this study to conduct correlation assessment and principal component evaluation on the data of water quality.
3. Results and Discussion
3.1. Pattern of Groundwater Quality in the Beichuan River Basin
To analyze the water quality characteristics during the two hydrological periods, statistical analyses were conducted on the range of values, means, and exceedance rates of various water quality indicators (Table 1). The results indicate that in the high-flow season, groundwater pH levels fluctuated between 6.60 and 8.31, averaging 7.53, which suggests a mildly alkaline to neutral nature. In contrast, during the low-flow season, pH values oscillated from 6.80 to 8.20, with a mean of 7.64, consistently reflecting a weakly alkaline condition. In the high-flow season, the levels of cations were ordered as follows: Na+ > Ca2+ > Mg2+ > K+. In the low-flow season, the ranking was as follows: Ca2+ > Na+ > Mg2+ > K+. For anions, the content ranking was consistent in both seasons: SO42− > HCO3− > Cl− > NO3−. During the high-flow season, the average levels of Na+, Mg2+, Cl−, HCO3−, NO3−, and TDS were elevated compared to the low-flow season. In contrast, the average levels of pH, K+, Ca2+, and SO42− were greater during the low-flow season than in the high-flow season. TDS, SO42−, Na+, and Cl− were recognized as the key determinants of groundwater quality, with excess rates during the high-flow season being 35.3%, 33.3%, 14.3%, and 4.76%, respectively, and during the low-flow season, they were 35.3%, 28.6%, 19.1%, and 4.76%.

Table 1.
Statistical analysis of the water sample index of the study area.
3.2. Water Quality Assessment
Table 2 presents the water quality index (WQI) classifications for groundwater quality during the high- and low-flow seasons along the Beichuan River. During the high-flow season, the quality distribution of the samples was as follows: 61.9% were rated as Class I, 19.0% as Class II, 9.52% as Class III, 4.76% as Class IV, and 4.76% were deemed Class V. In contrast, during the low-flow season, the classification shifted to 51.7% Class I, 28.6% Class II, and 6.3% Class III. Overall, the proportion of poor-quality groundwater was higher in the high-flow season compared to the low-flow season, likely due to the infiltration of groundwater by surface runoff carrying pollutants.
Table 2.
Groundwater quality index classification for the two seasons in Beichuan River.
3.3. Analysis of Groundwater Chemical Types
The Piper diagram is widely utilized for depicting the hydrochemical type of groundwater [18]. As depicted in Figure 2, during the high-flow season, the primary hydrochemical categories of groundwater included the HCO3–Ca type (38.1%), HCO3–Ca·Mg type (19.0%), and HCO3·SO4–Ca·Na·Mg type (14.3%). During the low-flow season, the dominant hydrochemical categories were HCO3–Ca type (38.1%), HCO3·SO4–Ca type, SO4–Na·Ca type, and HCO3·SO4–Ca·Na·Mg type (each accounting for 14.3%). Overall, the proportion of sulfate-type water is higher during the high-flow season than during the dry season. This increase is primarily attributed to the enhanced leaching of evaporite rocks during the high-flow season. This facilitated the accumulation of SO42− in groundwater [19].
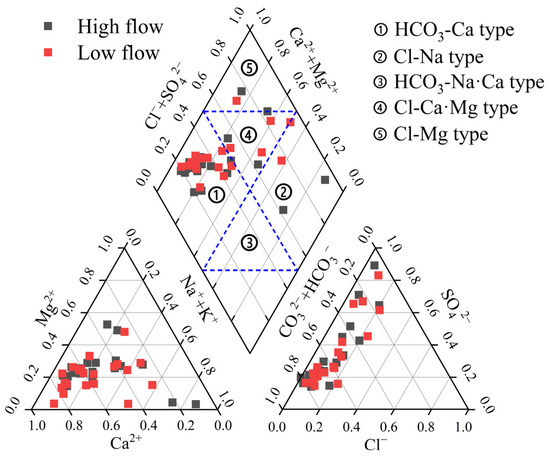
Figure 2.
Piper triplex of the Beichuan River Basin.
3.4. Controlling Factors and Origins of Groundwater Ions
3.4.1. Identify the Controlling Factors
The chemical composition of natural water is primarily impacted by rock weathering, atmospheric precipitation, and evaporation [20]. The atmospheric precipitation control zone is typified by low TDS concentrations (<10 mg/L) and elevated [Na+]/[Na+ + Ca2+] and [Cl−]/[Cl− + HCO3−] ratios (typically between 0.5 and 1), and it is positioned at the Gibbs diagram’s lower right corner. The rock weathering control zone, with TDS values generally between 70 and 300 mg/L and [Na+]/[Na+ + Ca2+] and [Cl−]/[Cl− + HCO3−] ratios both below 0.5, is located in the middle left section. The evaporation concentration control zone, characterized by high TDS (>300 mg/L) and [Na+]/[Na+ + Ca2+] and [Cl−]/[Cl− + HCO3−] ratios ranging from 0.5 to 1, is situated at the diagram’s upper right corner [21].
Figure 3a,b show that the sampling sites are primarily located in areas controlled by rock weathering and evaporative concentration processes. This trend suggests that they are the dominant factors influencing the hydrochemical characteristics of groundwater in this area. However, the Gibbs diagram is not sufficient for distinguishing the impact of human activities. Subsequent studies will concentrate on examining how human activities impact groundwater chemistry.
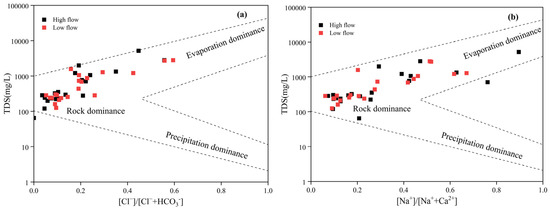
Figure 3.
(a,b) Gibbs chart of the Beichuan River basin.
3.4.2. Water–Rock Interaction
Water–rock interactions significantly influence the chemical composition of groundwater. Studies have shown that the breakdown and dissolution of carbonate rocks mainly produce Ca2+, Mg2+, and HCO3−. Silicate rocks, through analogous processes, yield Ca2+, Mg2+, Na+, K+, and HCO3−. In addition, the weathering and dissolution of evaporite rocks lead to the formation of Ca2+, Mg2+, Na+, K+, SO42−, and Cl−. With these findings in mind, ion ratio diagrams can be effectively employed to identify the sources of major ions in the groundwater of the study area [22].
The relationship between [Ca2+/Na+] and [HCO3−/Na+] can be used to identify the effects of the weathering and dissolution of carbonate, silicate, and evaporite rocks on the chemical composition of groundwater [23]. Researchers found that the endmember ratios for silicate rocks are [Ca2+/Na+] = 0.35 ± 0.15 and [HCO3−/Na+] = 2 ± 1; for carbonate rocks, they are [Ca2+/Na+] = 50 and [HCO3−/Na+] = 120; for evaporite rocks, they are [Ca2+/Na+] = 0.25 ± 0.15 and [HCO3−/Na+] = 0.01 ± 0.01 [24]. Figure 4a reveals that, in both high-flow and low-flow seasons, the majority of groundwater sampling points cluster in the central region between the silicate and carbonate rock endmembers, with a few points nearing the evaporite dissolution zone. This suggests that Ca2+, Mg2+, Na+, K+, and HCO3− in groundwater predominantly stem from the weathering and dissolution of silicate and carbonate rocks, while minor quantities of Na+, K+, and Ca2+ could be sourced from evaporite rocks like rock salt and gypsum [25]. Considering the hydrogeological context, groundwater resides in sand and gravel layers, where the dissolution of minerals such as quartz and feldspar serves as the primary origin of Ca2+, Mg2+, Na+, K+, and HCO3−.
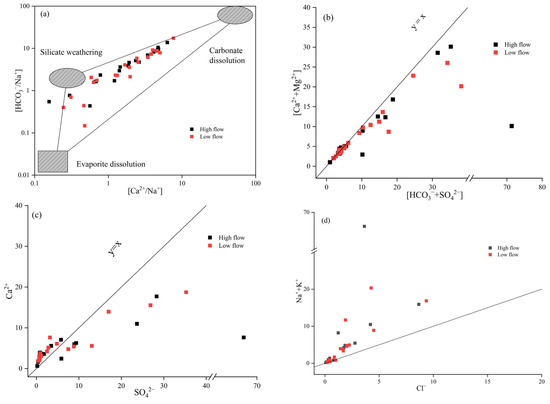
Figure 4.
Ion ratio diagram: (a) [Ca2+/Na+] vs. [HCO3−/Na+]; (b) [HCO3− + SO42−] vs. [Ca2+ + Mg2+]; (c) [SO42−] vs. [Ca2+]; (d) [Cl−] vs. [Na+ + K+].
Figure 4b indicates that during both seasons, the groundwater sampling points are predominantly situated above the y = x line, indicating that the dissolution of silicate and evaporite rocks is dominant, providing K+, Na+, Ca2+, Mg2+, and SO42−, while the dissolution of carbonate rocks mainly supplies HCO3− and a portion of Ca2+ and Mg2+.
Figure 4c, which is the [Ca2+]/[SO42−] ratio diagram, shows that in both seasons, 71.4% of samples are positioned above the y = x line, where a strong correlation between Ca2+ and SO42− is evident. This implies that the dissolution of gypsum is the primary source of SO42− [26], whereas excess Ca2+ primarily originates from the weathering and dissolution of silicate or carbonate rocks. Conversely, 28.6% of samples fall below the y = x line, indicating additional sources of SO42− beyond gypsum dissolution, such as industrial activities and domestic sewage [27].
The [Na+ + K+]/[Cl−] milliequivalent ratio serves as an indicator of the primary sources of Na+ and Cl− in the water’s chemical processes. As depicted in Figure 4d, during both seasons, all water samples are positioned above the y = x line and display a general correlation. This suggests that Na+ and Cl− share a common origin, specifically the dissolution of rock salt. The milliequivalent ratio of [Na+ + K+] typically exceeds that of Cl−, which is primarily attributed to the dissolution of silicate rocks. Additionally, domestic sewage discharge may contribute to elevated Na+ concentrations [28].
3.5. Human Activity Impact
Human activities significantly influence the variation in groundwater quality by altering the chemical composition through the discharge of wastewater, waste, and exhaust gases [29]. In regions with high levels of human activity, the levels of NO3−, Cl−, SO42−, and Na+ in groundwater are prone to substantial increases. Specifically, SO42− is predominantly influenced by industrial operations, whereas NO3−, Cl−, and Na+ are more affected by agricultural practices, such as the use of fertilizers and manure, and domestic wastewater [30]. Figure 5a shows that during both seasons, 90.5% and 85.7% of the sampling points, respectively, exhibited higher [SO42−]/[Ca2+] ratios than [NO3−]/[Ca2+]. Specifically, during the high-flow season, the [SO42−]/[Ca2+] ratio ranged from 0.201 to 8.74, while the [NO3−]/[Ca2+] ratio ranged from 0.001 to 0.241. During the low-flow season, the [SO42−]/[Ca2+] ratio ranged from 0.220 to 2.34, and the [NO3−]/[Ca2+] ratio ranged from 0.001 to 0.210. Combined with the distribution of sampling points on the diagram, this suggests that industrial activities are the primary source of human impact on groundwater, followed by agricultural activities. According to the survey results, large aluminum and thermal power plants are located in the southern part of the study area, and the discharge of wastewater from these plants may lead to increased SO42− concentrations in groundwater [31].
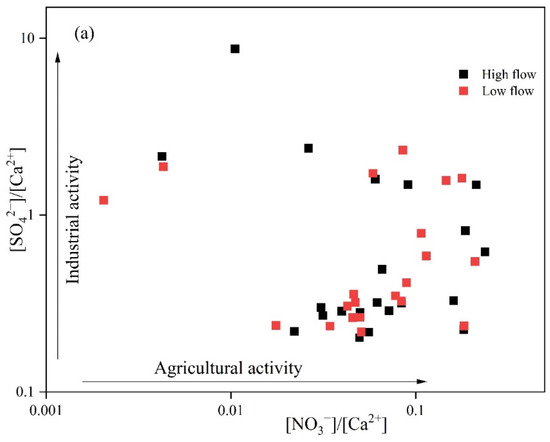
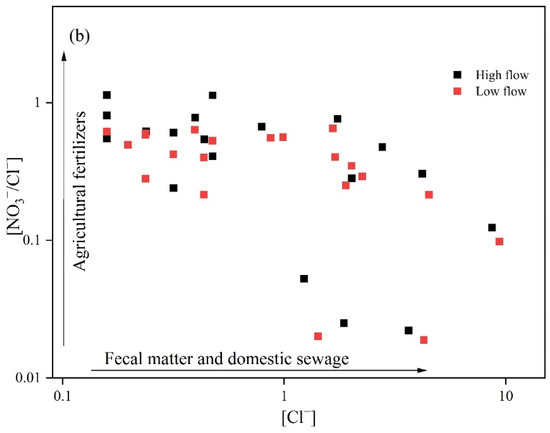
Figure 5.
Ion ratio diagram: (a) [NO3−]/[Ca2+] vs. [SO42−]/[Ca2+]; (b) [Cl−] vs. [NO3−]/[Cl−].
The [NO3−]/[Cl−] ratio in relation to [Cl−] concentrations is typically employed to identify the sources of NO3−. Usually, elevated [Cl−] levels coupled with low [NO3−]/[Cl−] ratios point to domestic sewage and manure as the main contributors of NO3−. Conversely, low [Cl−] levels with high [NO3−]/[Cl−] ratios imply that NO3− is predominantly from agricultural activities. When both [Cl−] and [NO3−]/[Cl−] ratios are low, soil nitrogen is the key source of NO3− [32]. As shown in Figure 5b, during the high- and low-flow periods, 52.4% and 61.9% of the sampling points, respectively, exhibited higher [Cl−] than [NO3−]/[Cl−]. Specifically, in the high-flow period, the content of [Cl−] varied between 0.081 and 8.66, while the [NO3−]/[Cl−] ratio fluctuated from 0.021 to 0.652. In contrast, during the low-flow season, [Cl−] concentrations spanned from 0.161 to 9.35, with the [NO3−]/[Cl−] ratio ranging similarly from 0.021 to 0.652. Collectively, these data suggest that NO3− in groundwater is predominantly sourced from manure and domestic sewage, with their influence on groundwater quality being more pronounced in the low-flow season than in the high-flow season.
Considering the geographical overview of the study area and the layout of the sampling points, it is evident that most groundwater sampling sites are situated in the southern region, an area characterized by intensive human activities and a high population density. Under such conditions, manure and domestic sewage emerge as the key source of NO3− in groundwater [33]. The low-flow season (July) coincides with the concentrated period of atmospheric precipitation in the region, and surface runoff collects manure and domestic sewage, resulting in higher Cl− concentrations in groundwater during the low-flow season (57.5 mg/L) compared to the high-flow season (50.90 mg/L).
3.6. Identification of Major Controlling Factors of Groundwater Hydrochemistry
3.6.1. Correlation Analysis
Pearson correlation analysis was utilized to examine the relationships between groundwater indicators, offering valuable insights for a more detailed investigation into the origins of each hydrochemical component. As shown in Figure 6, throughout both seasons, pH exhibited negative correlations with Na+, Ca2+, Mg2+, Cl−, SO42−, HCO3−, NO3−, and TDS (correlation coefficients ranged from −0.510 to −0.12). The increase in ion concentrations is generally caused by enhanced water–rock interactions, while acidic conditions (low pH) favor the occurrence of water–rock interactions [34], leading to negative correlations between pH and most ion concentrations.
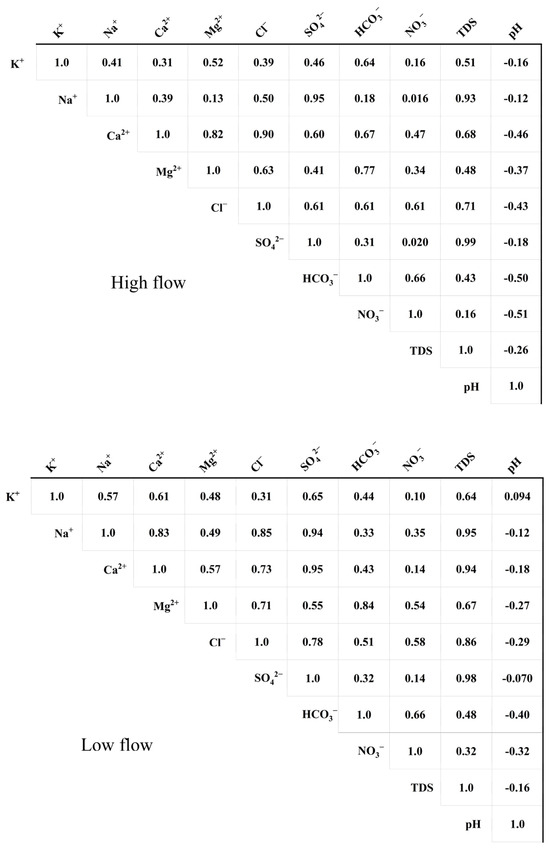
Figure 6.
Correlation among hydrochemical components.
During the high-flow season, Na+ exhibited significant positive correlations with SO42−, TDS, Ca2+, Cl−, Mg2+, HCO3−, and NO3−. Based on the previous analysis, the typical origins of Na+, SO42−, and TDS include the dissolution of rock salt and evaporite rocks, in addition to industrial activities. The common sources of Ca2+, Cl−, and Mg2+ are the dissolution of silicate rocks and domestic sewage. The common sources of NO3−, HCO3−, and Cl− are agricultural fertilization and the dissolution of carbonate rocks. During the low-flow season, Na+ exhibited significant positive correlations with TDS, SO42−, Cl−, and Ca2+, indicating that their common sources are primarily the dissolution of rock salt and evaporite rocks, as well as domestic and industrial wastewater discharges. During the low-flow season, a notable positive correlation was observed between Mg2+ and both HCO3− and NO3−; this indicates that these ions primarily originate from the weathering of silicate and carbonate and agricultural activities.
3.6.2. Principal Component Analysis
To elucidate the dominant factors influencing groundwater hydrochemistry across various periods, a total of 10 key water quality parameters were chosen for detailed analysis (K+, Na+, Ca2+, Mg2+, Cl−, SO42−, HCO3−, NO3−, TDS, and pH) and conducted principal component analysis (PCA) on groundwater samples from both seasons. Before entering the data into the model, we performed the Kaiser–Meyer–Olkin (KMO) and Bartlett’s sphericity tests. The test results indicated that the KMO values for groundwater were 0.776 during the high-flow season and 0.545 during the low-flow season. Correspondingly, the Bartlett’s sphericity test values were 277 and 313 (p < 0.001) for the high- and low-flow seasons, respectively. These results demonstrate that the hydrochemical data are suitable for PCA analysis. In both seasons, two principal components were extracted based on eigenvalues exceeding 1, which accounted for 79.8% and 78.9% of the total variance, respectively.
In Table 3, it is indicated that during the high-flow season, PC1 accounted for 51.5% of the total variance. PC1 displayed strong positive correlations with SO42−, TDS, K+, Na+, Cl−, Mg2+, HCO3−, and Ca2+. Based on prior analysis, Ca2+, Mg2+, and SO42− in the region’s groundwater primarily stem from the dissolution of silicate and evaporite rocks. HCO3− is mainly derived from carbonate rock dissolution, and Na+ and Cl− are predominantly from rock salt dissolution. Moreover, industrial activities in the area have a notable effect on SO42− [35]. Thus, PC1 reflects the joint influence of rock weathering and industrial activities on the hydrochemical properties of groundwater. PC2 explained 28.3% of the total variance and showed strong positive correlations with NO3−. Additionally, moderate positive correlations were observed with Cl−, HCO3−, and Ca2+. As previously discussed, nitrate primarily originates from sewage and agricultural fertilizers. Studies have shown that domestic sewage contains elevated levels of Cl− [36]. Hence, PC2 highlights the impact of sewage and fertilizers on groundwater hydrochemistry.
Table 3.
The results of PCA of groundwater for different seasons in the study area.
During the low-flow period, PC1 accounted for 49.9% of the total variance, and PC1 exhibited strong positive correlations with SO42−, TDS, K+, Na+, Cl−, and Ca2+. Therefore, PC1 represents the influence of the weathering of silicate rocks, evaporite rocks, and rock salt on groundwater hydrochemistry. PC2 explained 29.0% of the total variance, and PC2 exhibited strong positive correlations with NO3− and HCO3−, while Ca2+ has a moderate correlation with PC2. Therefore, PC2 represents the influence of domestic sewage, agricultural fertilizers, and the dissolution of carbonate rocks on groundwater hydrochemistry.
4. Conclusions
This research in-depth analyzed the patterns and determinants of groundwater quality variations in the Beichuan River Basin. The findings suggested that the chemical composition of groundwater is predominantly influenced by precipitation, showing marked differences between the high- and low-flow seasons. Water–rock interactions, sewage, and chemical fertilizer are the main factors affecting groundwater quality. The average contents of Na+, Mg2+, Cl−, HCO3−, NO3−, and TDS are higher during the high-flow season compared to the low-flow season, primarily due to the scouring effect of rainfall. Human activities, particularly domestic sewage discharge and agricultural fertilization, are the primary contributors to nitrate contamination in groundwater. Principal component analysis revealed that rock weathering and industrial activities are the main controlling factors for variations in groundwater quality in the high-flow season, while the hydrochemistry of groundwater is mainly influenced by the weathering of silicate rocks, evaporite rocks, and rock salt in the low-flow season.
To address the rational exploitation of groundwater and ecological conservation in this area, we propose several solutions: Firstly, stricter management of sewage and agricultural runoff is needed to reduce the discharge of pollutants into water bodies. Secondly, the promotion of water-saving technologies and irrigation systems can improve water use efficiency. Additionally, comprehensive aquifer assessments should be conducted to better understand groundwater dynamics and inform protective measures. The findings of this research offer a scientific foundation for addressing groundwater quality deterioration in arid regions and provide valuable guidance for the sustainable management of water resources and ecological conservation efforts in such areas.
Supplementary Materials
The following supporting information can be downloaded at: https://www.mdpi.com/article/10.3390/w17070934/s1, Table S1: Relative weight of physicochemical parameters and water quality standard (all units of the parameters are in mg/L, except pH).
Author Contributions
L.W.: Investigation, methodology, software, data curation, and writing—original draft preparation. N.Y.: Investigation, data curation, and software. Y.Z.: Investigation and software. Q.Z.: Supervision, methodology, and writing—reviewing and editing. All authors have read and agreed to the published version of the manuscript.
Funding
This work was supported by the Natural Science Foundation of China (Grant No. 42377232), the Open Foundation of the Key Laboratory of Coupling Process and Effect of Natural Resources Elements (No. 2024KFKT015), the Natural Science Foundation of Hebei Province of China (Grant No. D2022504015), and the Fundamental Research Funds for the Chinese Academy of Geological Sciences (No. YK202310).
Data Availability Statement
Data is contained within the article or Supplementary Materials.
Acknowledgments
The authors gratefully acknowledge the editor and anonymous reviewers for their valuable comments on this manuscript. The authors also appreciate the financial support from the different organizations.
Conflicts of Interest
The authors declare no conflicts of interest.
References
- Wei, S.; Zhang, Y.; Cai, Z.; Bi, D.; Wei, H.; Zheng, X.; Man, X. Evaluation of groundwater quality and health risk assessment in Dawen River Basin, North China. Environ. Res. 2025, 264, 120292. [Google Scholar] [CrossRef] [PubMed]
- Qin, R.; Wu, Y.; Xu, Z.; Xie, D.; Zhang, C. Assessing the impact of natural and anthropogenic activities on groundwater quality in coastal alluvial aquifers of the lower Liaohe River Plain, NE China. Appl. Geochem. 2013, 31, 142. [Google Scholar] [CrossRef]
- Yang, M.; Zhu, L.; Liu, J.; Zhang, Y.; Zhou, B. Influence of water conservancy project on runoff in the source region of the Yellow River and wetland changes in the Lakeside Zone, China. J. Groundw. Sci. Eng. 2023, 11, 333–346. [Google Scholar] [CrossRef]
- Torres-Martínez, J.A.; Mahlknecht, J.; Kumar, M.; Loge, F.J.; Kaown, D. Advancing groundwater quality predictions: Machine learning challenges and solutions. Sci. Total Environ. 2024, 949, 174973. [Google Scholar] [CrossRef]
- El-Rawy, M.; Wahba, M.; Fathi, H.; Alshehri, F.; Abdalla, F.; El Attar, R.M. Assessment of groundwater quality in arid regions utilizing principal component analysis, GIS, and machine learning techniques. Mar. Pollut. Bull. 2024, 205, 116645. [Google Scholar] [CrossRef]
- Chandra, G.V.; Ghosh, P.K. Groundwater quality in high-sulfur coal mining region of India: Spatial distribution, source control, and health risk assessment. J. Environ. Manag. 2024, 368, 122281. [Google Scholar] [CrossRef]
- Deng, Y.; Lu, Y.; Du, X.; Ye, X.; Feng, J. Identifying spatial patterns and driving factors of anthropogenic impacts on the groundwater environment based on groundwater chemical kinetics. J. Clean. Prod. 2025, 486, 144436. [Google Scholar] [CrossRef]
- Huang, G.; Sun, J.; Zhang, Y.; Chen, Z.; Liu, F. Impact of anthropogenic and natural processes on the evolution of groundwater chemistry in a rapidly urbanized coastal area, South China. Sci. Total Environ. 2013, 463, 209. [Google Scholar] [CrossRef]
- Lin, C.Y.; Abdullah, M.H.; Praveena, S.M.; Yahaya, A.H.B.; Musta, B. Delineation of temporal variability and governing factors influencing the spatial variability of shallow groundwater chemistry in a tropical sedimentary island. J. Hydrol. 2012, 432, 26. [Google Scholar] [CrossRef]
- Bozdağ, A. Combining AHP with GIS for assessment of irrigation water quality in Çumra irrigation district (Konya), Central Anatolia, Turkey. Environ. Earth Sci. 2015, 73, 8217–8236. [Google Scholar] [CrossRef]
- Zhang, Q.Q.; Wang, H.W.; Wang, Y.C.; Yang, M.N.; Zhu, L. Groundwater quality assessment and pollution source apportionment in an intensely exploited region of northern China. Environ. Sci. Pollut. Res. 2017, 24, 16639–16650. [Google Scholar] [CrossRef] [PubMed]
- Gu, H.; Chi, B.; Li, H.; Jiang, J.; Qin, W.; He, W. Assessment of groundwater quality and identification of contaminant sources of Liujiang basin in Qinhuangdao, North China. Environ. Earth Sci. 2015, 73, 6477. [Google Scholar] [CrossRef]
- Zhou, B.; Wang, H.; Zhang, Q. Assessment of the evolution of groundwater chemistry and its controlling factors in the Huangshui River Basin of northwestern China, using hydrochemistry and multivariate statistical techniques. Int. J. Environ. Res. Public Health 2021, 18, 7551. [Google Scholar] [CrossRef] [PubMed]
- Qiu, Y.; Lu, C.; Xu, Z.; Wang, Y.Q. Spatio-temporal variation characteristics and water pollution sources in the Huangshui River Basin. Acta Sci. Circumstantiae 2017, 37, 2829–2837. (In Chinese) [Google Scholar] [CrossRef]
- Wang, X.; He, K.; Dong, Z. Effects of climate change and human activities on runoff in the Beichuan River Basin in the northeastern Tibetan Plateau, China. CATENA 2019, 176, 81–93. [Google Scholar] [CrossRef]
- Zhu, L.; Liu, J.T.; Yang, M.N.; Zhang, Y.X.; Wen, D.P. Evolutionary trend of water cycle in Beichuan River Basin of China under the influence of vegetation restoration. J. Groundw. Sci. Eng. 2021, 9, 202–211. [Google Scholar] [CrossRef]
- Ministry of Natural Resources of the People’s Republic of China (MNRPRC). Standard for Groundwater Quality, (GB/T14848-2017); General Administration of Quality Supervision, Inspection and Quarantine of the People’ s Republic of China: Beijing, China, 2017. [Google Scholar]
- Sunkari, E.D.; Seidu, J.; Ewusi, A. Hydrogeochemical evolution and assessment of groundwater quality in the Togo and Dahomeyan aquifers, Greater Accra Region, Ghana. Environ. Res. 2022, 208, 112679. [Google Scholar] [CrossRef]
- Mao, H.; Wang, G.; Rao, Z.; Liao, F.; Shi, Z.; Huang, X.; Chen, X.; Yang, Y. Deciphering spatial pattern of groundwater chemistry and nitrogen pollution in Poyang Lake Basin (eastern China) using self-organizing map and multivariate statistics. J. Clean. Prod. 2021, 329, 129697. [Google Scholar] [CrossRef]
- Li, P.; Wu, J.; Qian, H. Assessment of groundwater quality for irrigation purposes and identification of hydrogeochemical evolution mechanisms in Pengyang County, China. Environ. Earth Sci. 2013, 69, 2211. [Google Scholar] [CrossRef]
- Tang, J.P.; Zhang, Q.; Hu, Y. Groundwater chemical characteristics and analysis of their controlling factors in an alluvial fan of Jianjiang River. Environ. Sci. 2019, 40, 3089. (In Chinese) [Google Scholar] [CrossRef]
- Li, Z.J.; Yang, Q.C.; Yang, Y.S. Isotopic and geochemical interpretation of groundwater under the influences of anthropogenic activities. J. Hydrol. 2019, 576, 685–697. [Google Scholar] [CrossRef]
- Wang, Q.; Dong, S.; Wang, H.; Yang, J.; Huang, H.; Dong, X.; Yu, B. Hydrogeochemical processes and groundwater quality assessment for different aquifers in the Caojiatan coal mine of Ordos Basin, northwestern China. Environ. Earth Sci. 2020, 79, 199. [Google Scholar] [CrossRef]
- Hartmann, J.; Jansen, N.; Dürr, H.H.; Kempe, S.; Köhler, P. Global CO2-consumption by chemical weathering: What is the contribution of highly active weathering regions? Glob. Planet. Change 2009, 69, 185–194. [Google Scholar] [CrossRef]
- Jin, Z.; Xue, Q.; Chen, L.; Jin, M.; Li, F. Using dual isotopes to evaluate sources and transformations of nitrate in the West Lake watershed, eastern China. J. Contam. Hydrol. 2015, 177, 64–75. [Google Scholar] [CrossRef]
- Wang, L.; Zhang, Q.; Wang, H. Rapid urbanization has changed the driving factors of groundwater chemical evolution in the large groundwater depression funnel area of northern China. Water 2023, 15, 2917. [Google Scholar] [CrossRef]
- Ye, H.; Han, Z.; Wu, P.; Zha, X.; Li, X.; Hou, E.; Peñuelas, J. Disentangling sources and transformation mechanisms of nitrogen, sulfate, and carbon in water of a Karst Critical Zone. Sci. Total Environ. 2024, 922, 171310. [Google Scholar] [CrossRef]
- Nayak, A.; Matta, G.; Prasad Uniyal, D.; Kumar, A.; Kumar, P.; Pant, G. Assessment of potentially toxic elements in groundwater through interpolation, pollution indices, and chemometric techniques in Dehradun in Uttarakhand State. Environ. Sci. Pollut. Res. 2024, 31, 36241–36263. [Google Scholar] [CrossRef]
- Yang, J.; Ye, M.; Tang, Z.; Jiao, T.; Song, X.; Pei, Y.; Liu, H. Using cluster analysis for understanding spatial and temporal patterns and controlling factors of groundwater geochemistry in a regional aquifer. J. Hydrol. 2020, 583, 124594. [Google Scholar] [CrossRef]
- Liu, W.; Jiang, H.; Guo, X.; Li, Y.; Xu, Z. Time-series monitoring of river hydrochemistry and multiple isotope signals in the Yarlung Tsangpo River reveals a hydrological domination of fluvial nitrate fluxes in the Tibetan Plateau. Water Res. 2022, 225, 119098. [Google Scholar] [CrossRef]
- Liu, C.Q.; Lang, Y.C.; Satake, H.; Wu, J.; Li, S.L. Identification of anthropogenic and natural inputs of sulfate and chloride into the karstic ground water of Guiyang, SW China: Combined δ37Cl and δ34S approach. Environ. Sci. Technol. 2008, 42, 5421–5427. [Google Scholar] [CrossRef]
- Li, S.L.; Liu, C.Q.; Li, J.; Liu, X.; Chetelat, B.; Wang, B. Assessment of the sources of nitrate in the Changjiang River, China using a nitrogen and oxygen isotopic approach. Environ. Sci. Technol. 2010, 44, 1573–1578. [Google Scholar] [CrossRef] [PubMed]
- Wu, Y.; Wang, J.; Liu, Z.; Li, C.; Niu, Y.; Jiang, X. Seasonal nitrate input drives the spatiotemporal variability of regional surface water-groundwater interactions, nitrate sources and transformations. J. Hydrol. 2025, 655, 132973. [Google Scholar] [CrossRef]
- Kim, K.H.; Yun, S.T.; Choi, B.Y.; Chae, G.T.; Joo, Y.; Kim, K.; Kim, H.S. Hydrochemical and multivariate statistical interpretations of spatial controls of nitrate concentrations in a shallow alluvial aquifer around oxbow lakes (Osong area, central Korea). J. Contam. Hydrol. 2009, 107, 114–127. [Google Scholar] [CrossRef]
- Zhang, D.; Li, X.D.; Zhao, Z.Q.; Liu, C.Q. Using dual isotopic data to track the sources and behaviors of dissolved sulfate in the western North China Plain. Appl. Geochem. 2015, 52, 43–56. [Google Scholar] [CrossRef]
- Li, Y.; Zhang, Z.; Fei, Y.; Chen, H.; Qian, Y.; Yu, D. Investigation of quality and pollution characteristics of groundwater in the Hutuo River alluvial plain, North China Plain. Environ. Earth Sci. 2016, 75, 581. [Google Scholar] [CrossRef]
Disclaimer/Publisher’s Note: The statements, opinions and data contained in all publications are solely those of the individual author(s) and contributor(s) and not of MDPI and/or the editor(s). MDPI and/or the editor(s) disclaim responsibility for any injury to people or property resulting from any ideas, methods, instructions or products referred to in the content. |
© 2025 by the authors. Licensee MDPI, Basel, Switzerland. This article is an open access article distributed under the terms and conditions of the Creative Commons Attribution (CC BY) license (https://creativecommons.org/licenses/by/4.0/).