


Quantitative Analysis of Sponge City Construction and Function in the Main Urban Area of Chengdu

Abstract
1. Introduction
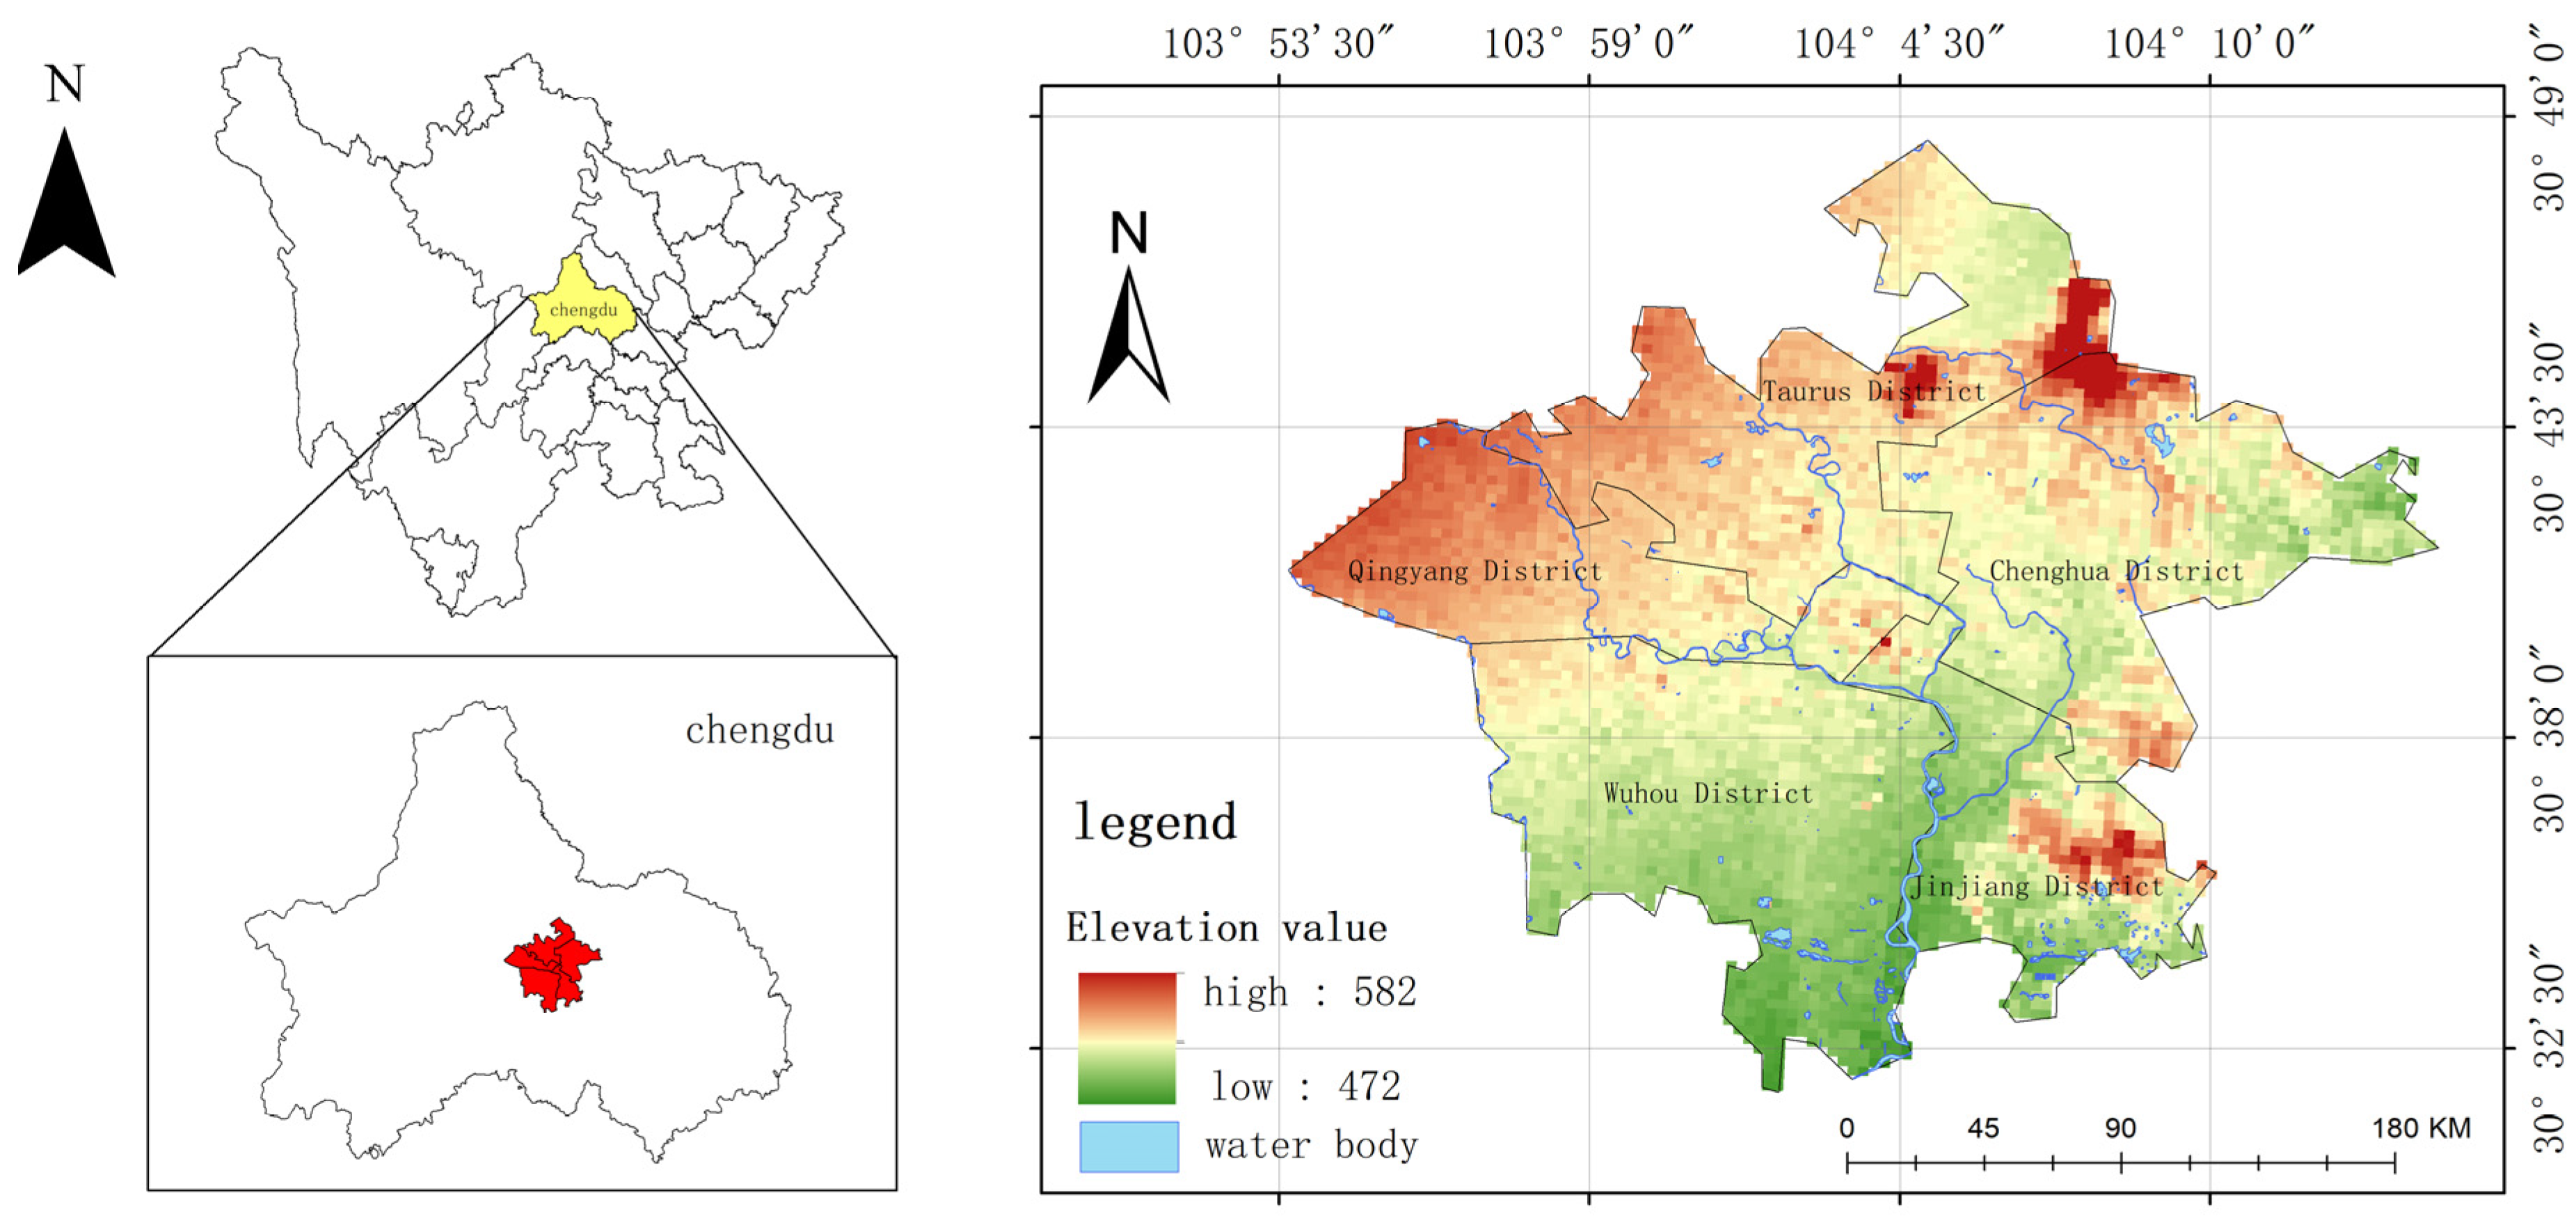
2. Study Area
3. Materials and Methods
3.1. Data Source
3.2. Research Methods
3.2.1. Water Conservation Simulations
3.2.2. InVEST Model
Model Principle
Data Sources and Processing
3.2.3. Principles of the SCS-CN Model
3.2.4. Runoff Calculation Based on SCS-CN Model
3.3. Statistical Analysis
4. Results and Discussion
4.1. Surface Runoff Analysis of Different Land Use Types
4.2. Sponge Function Analysis
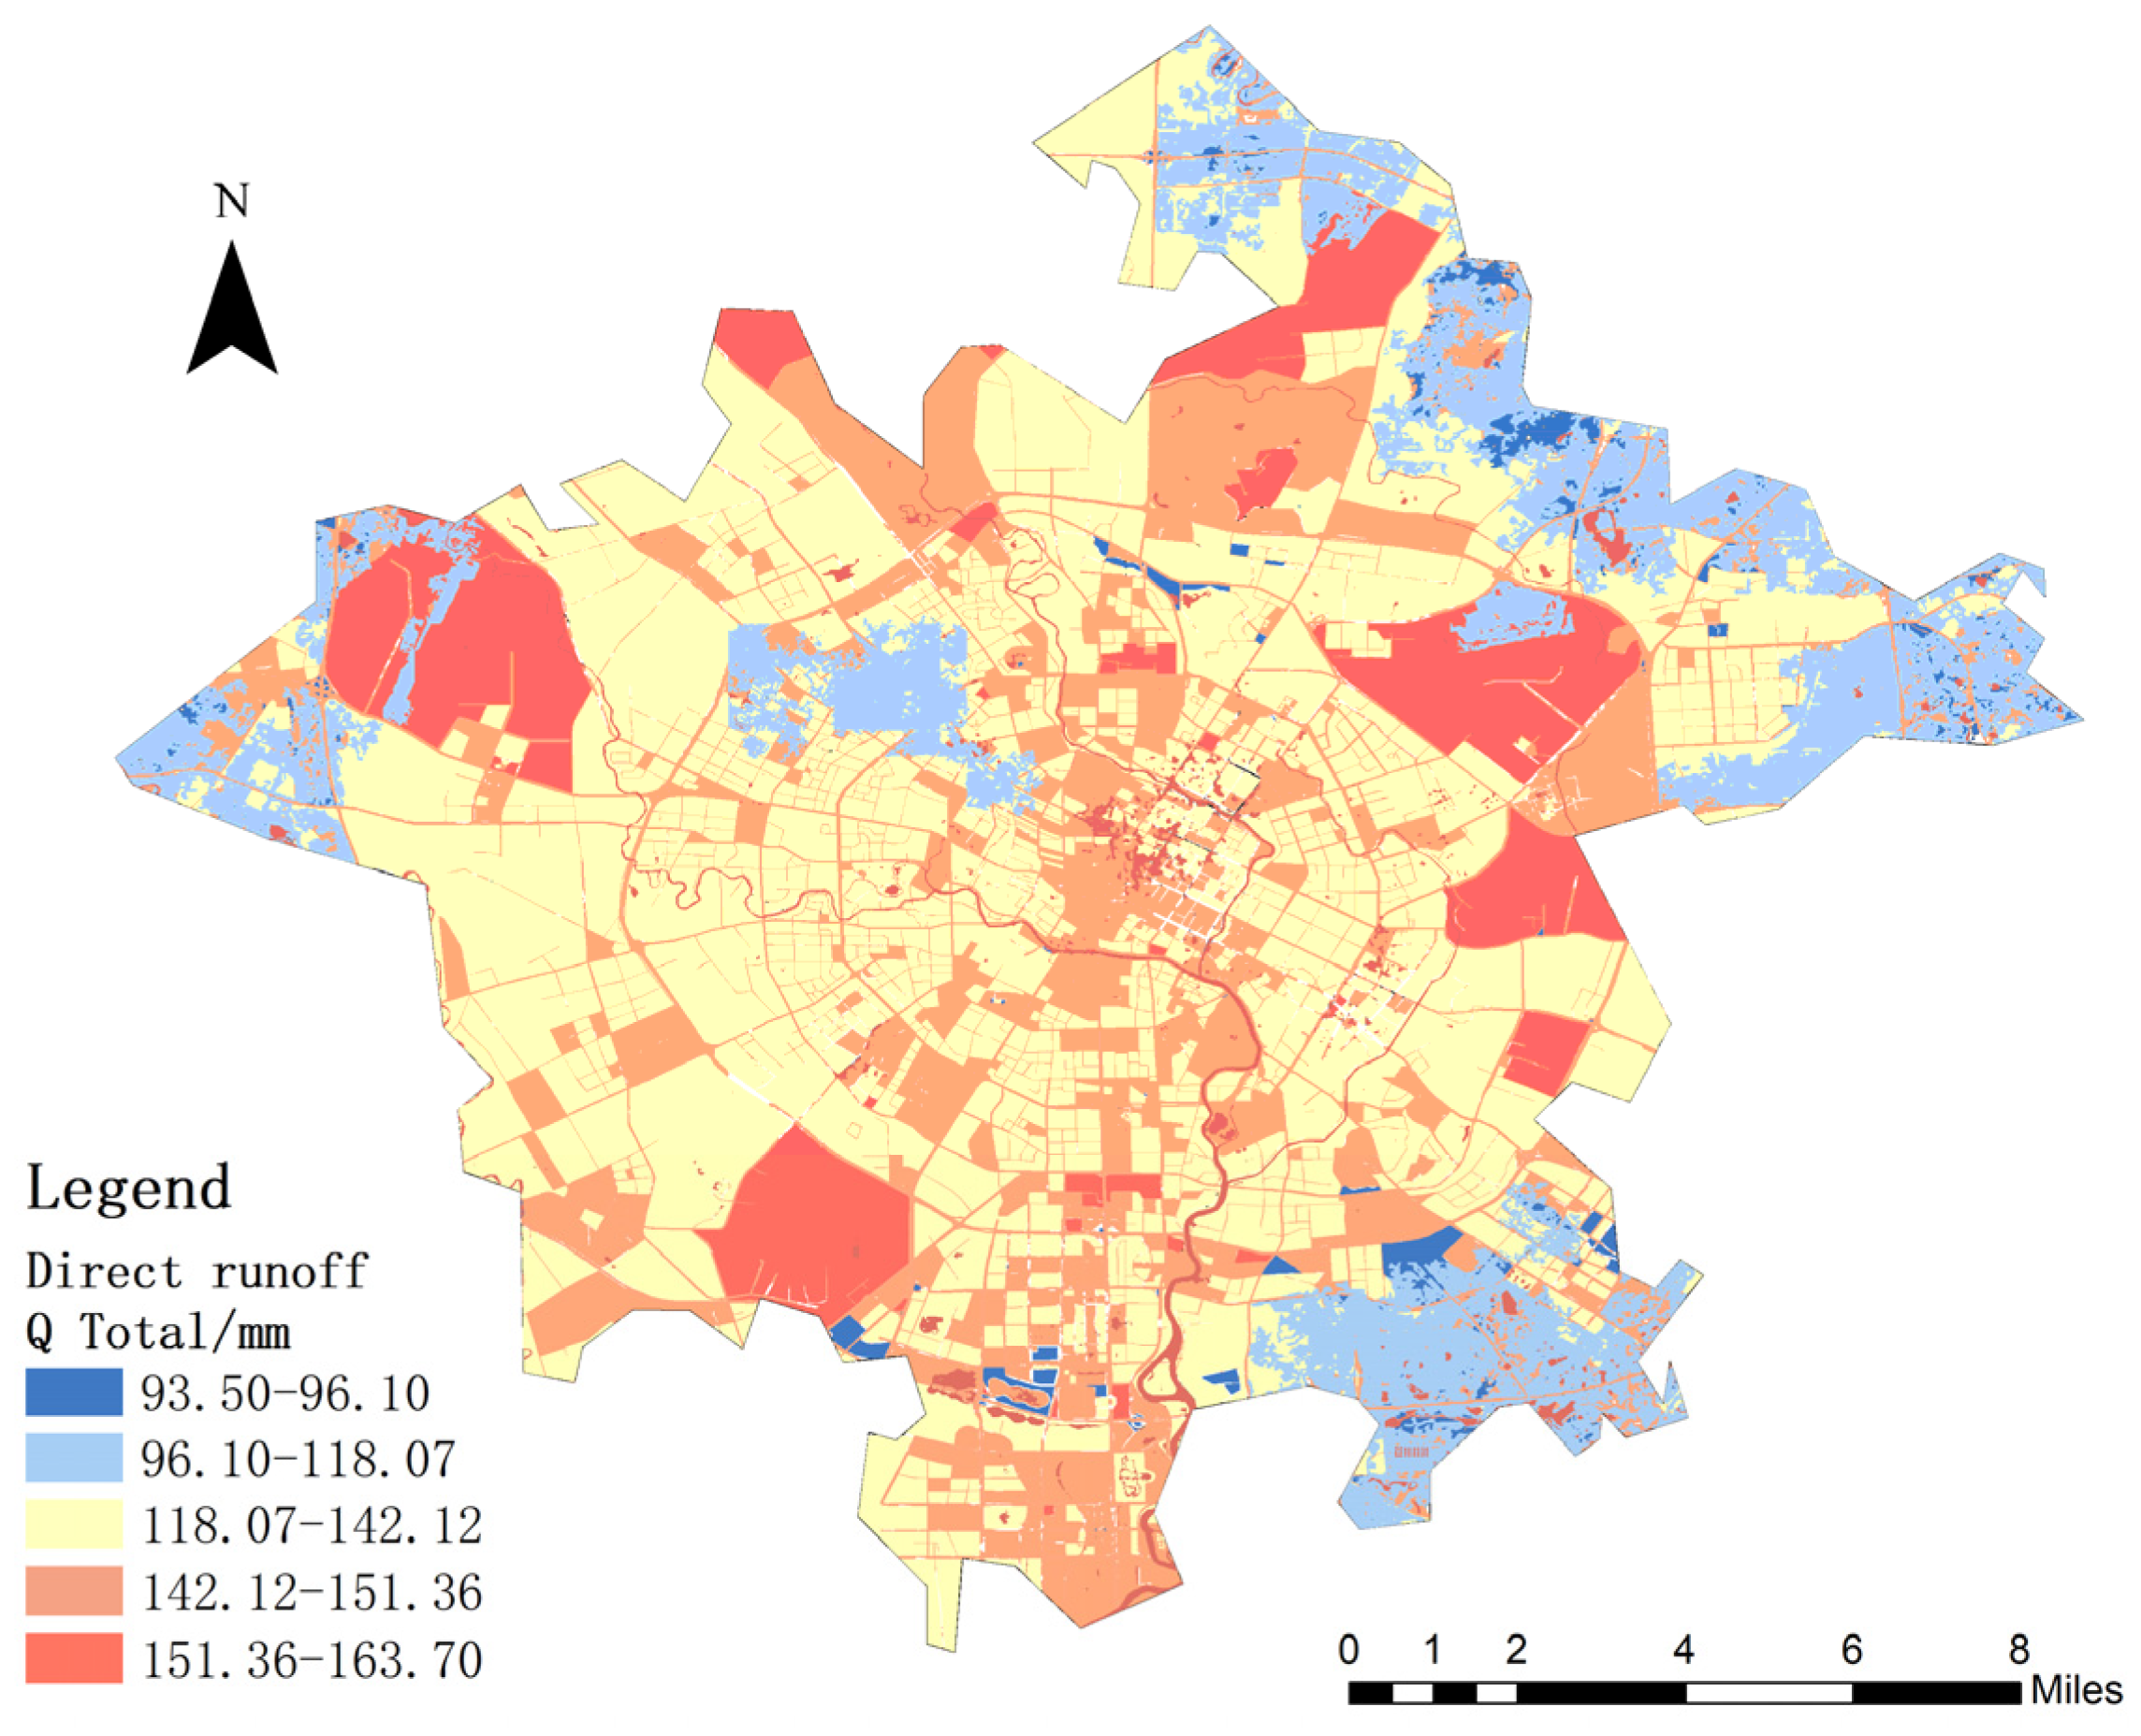
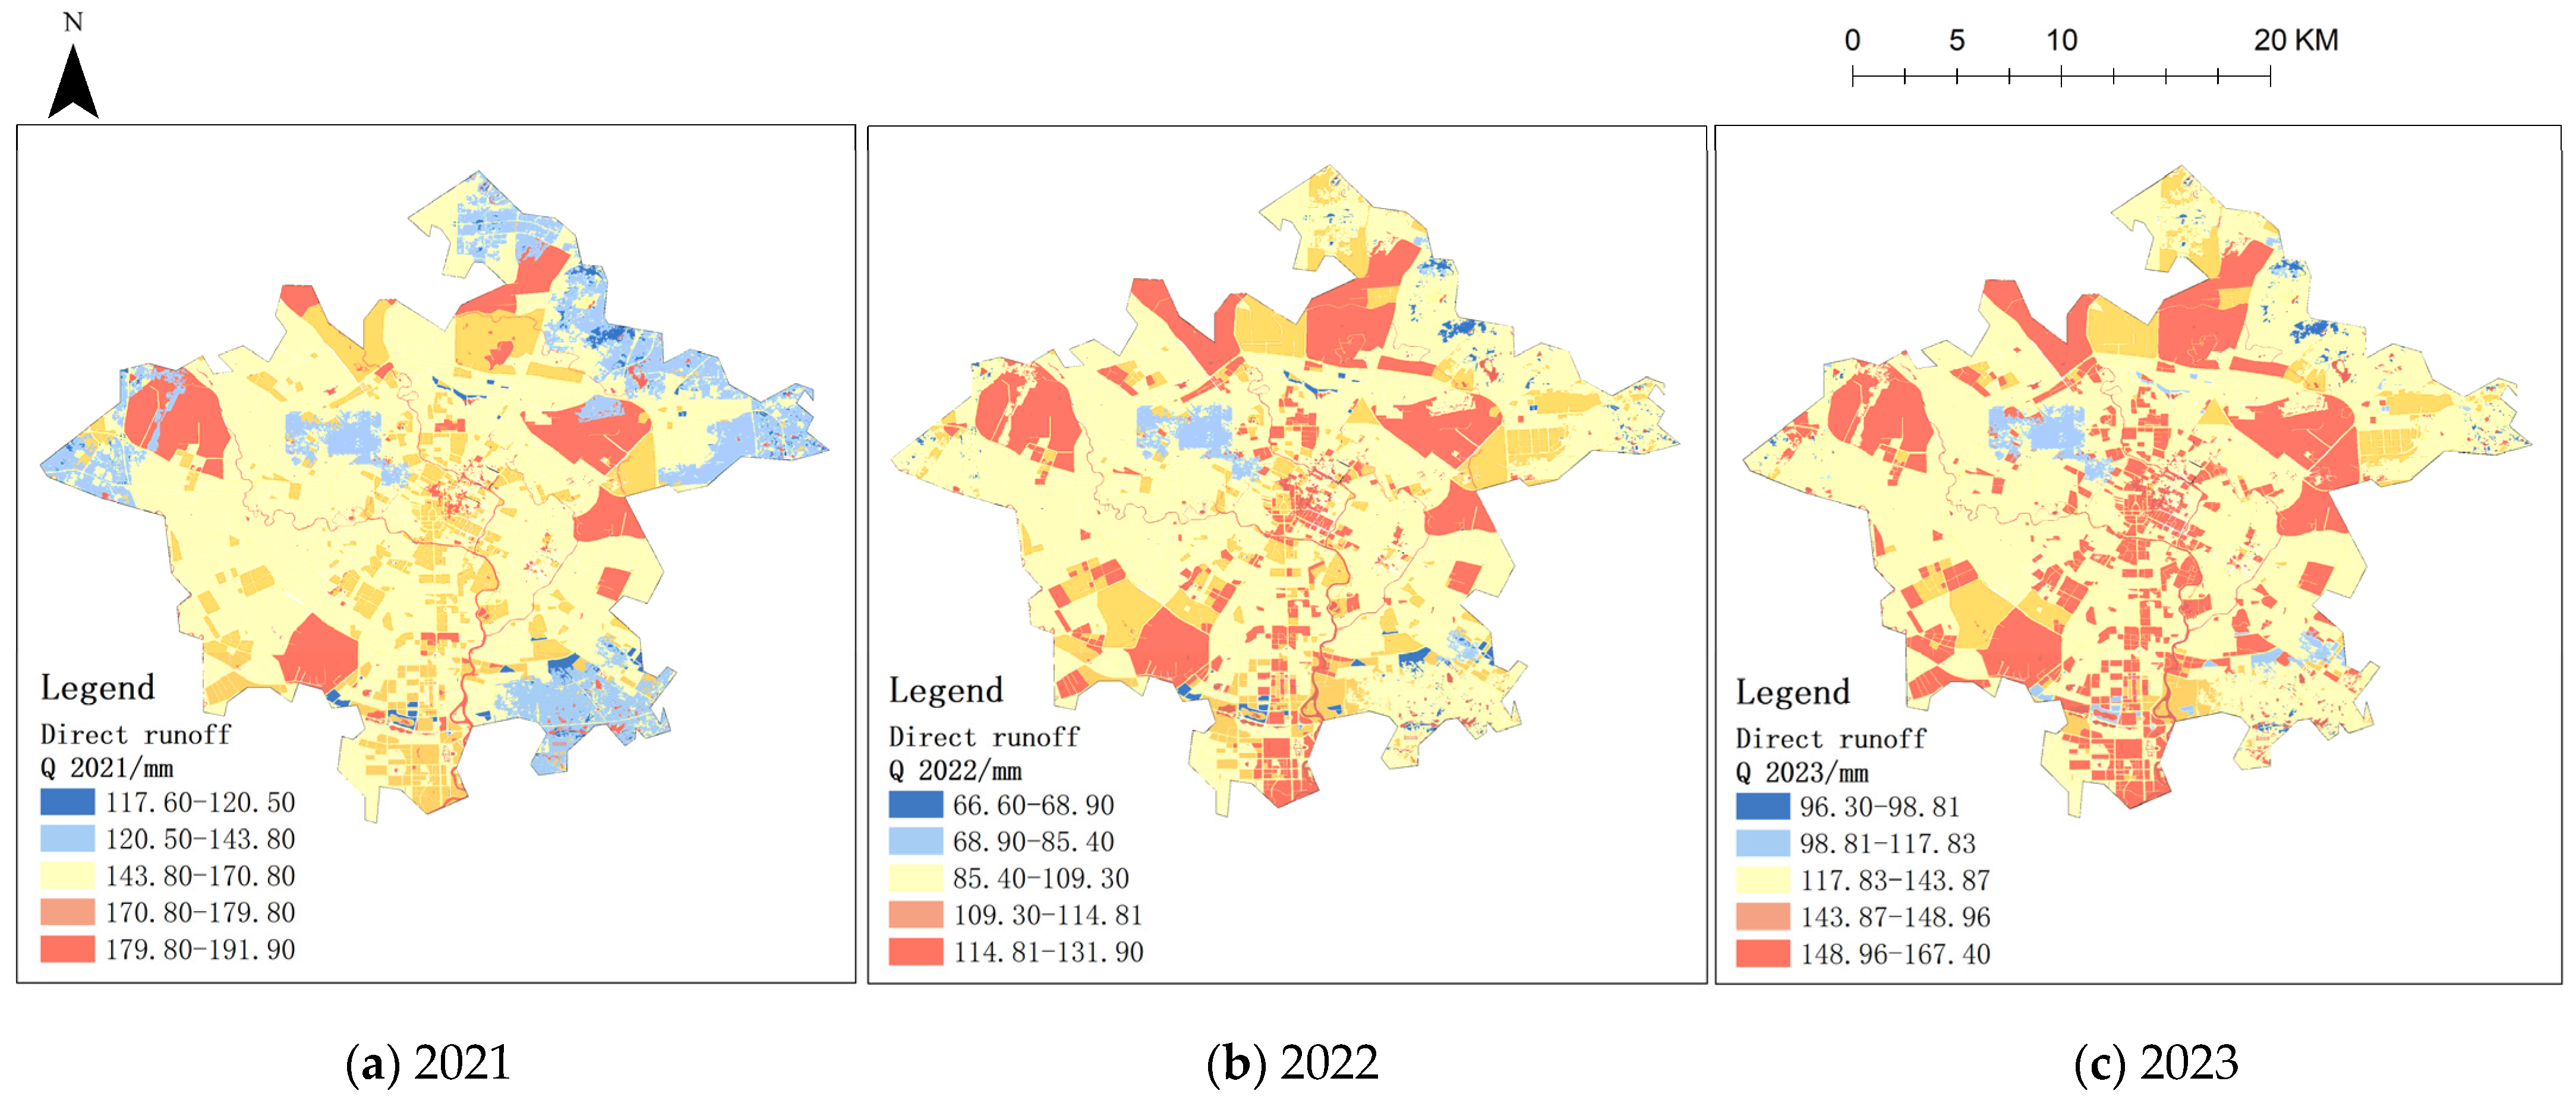
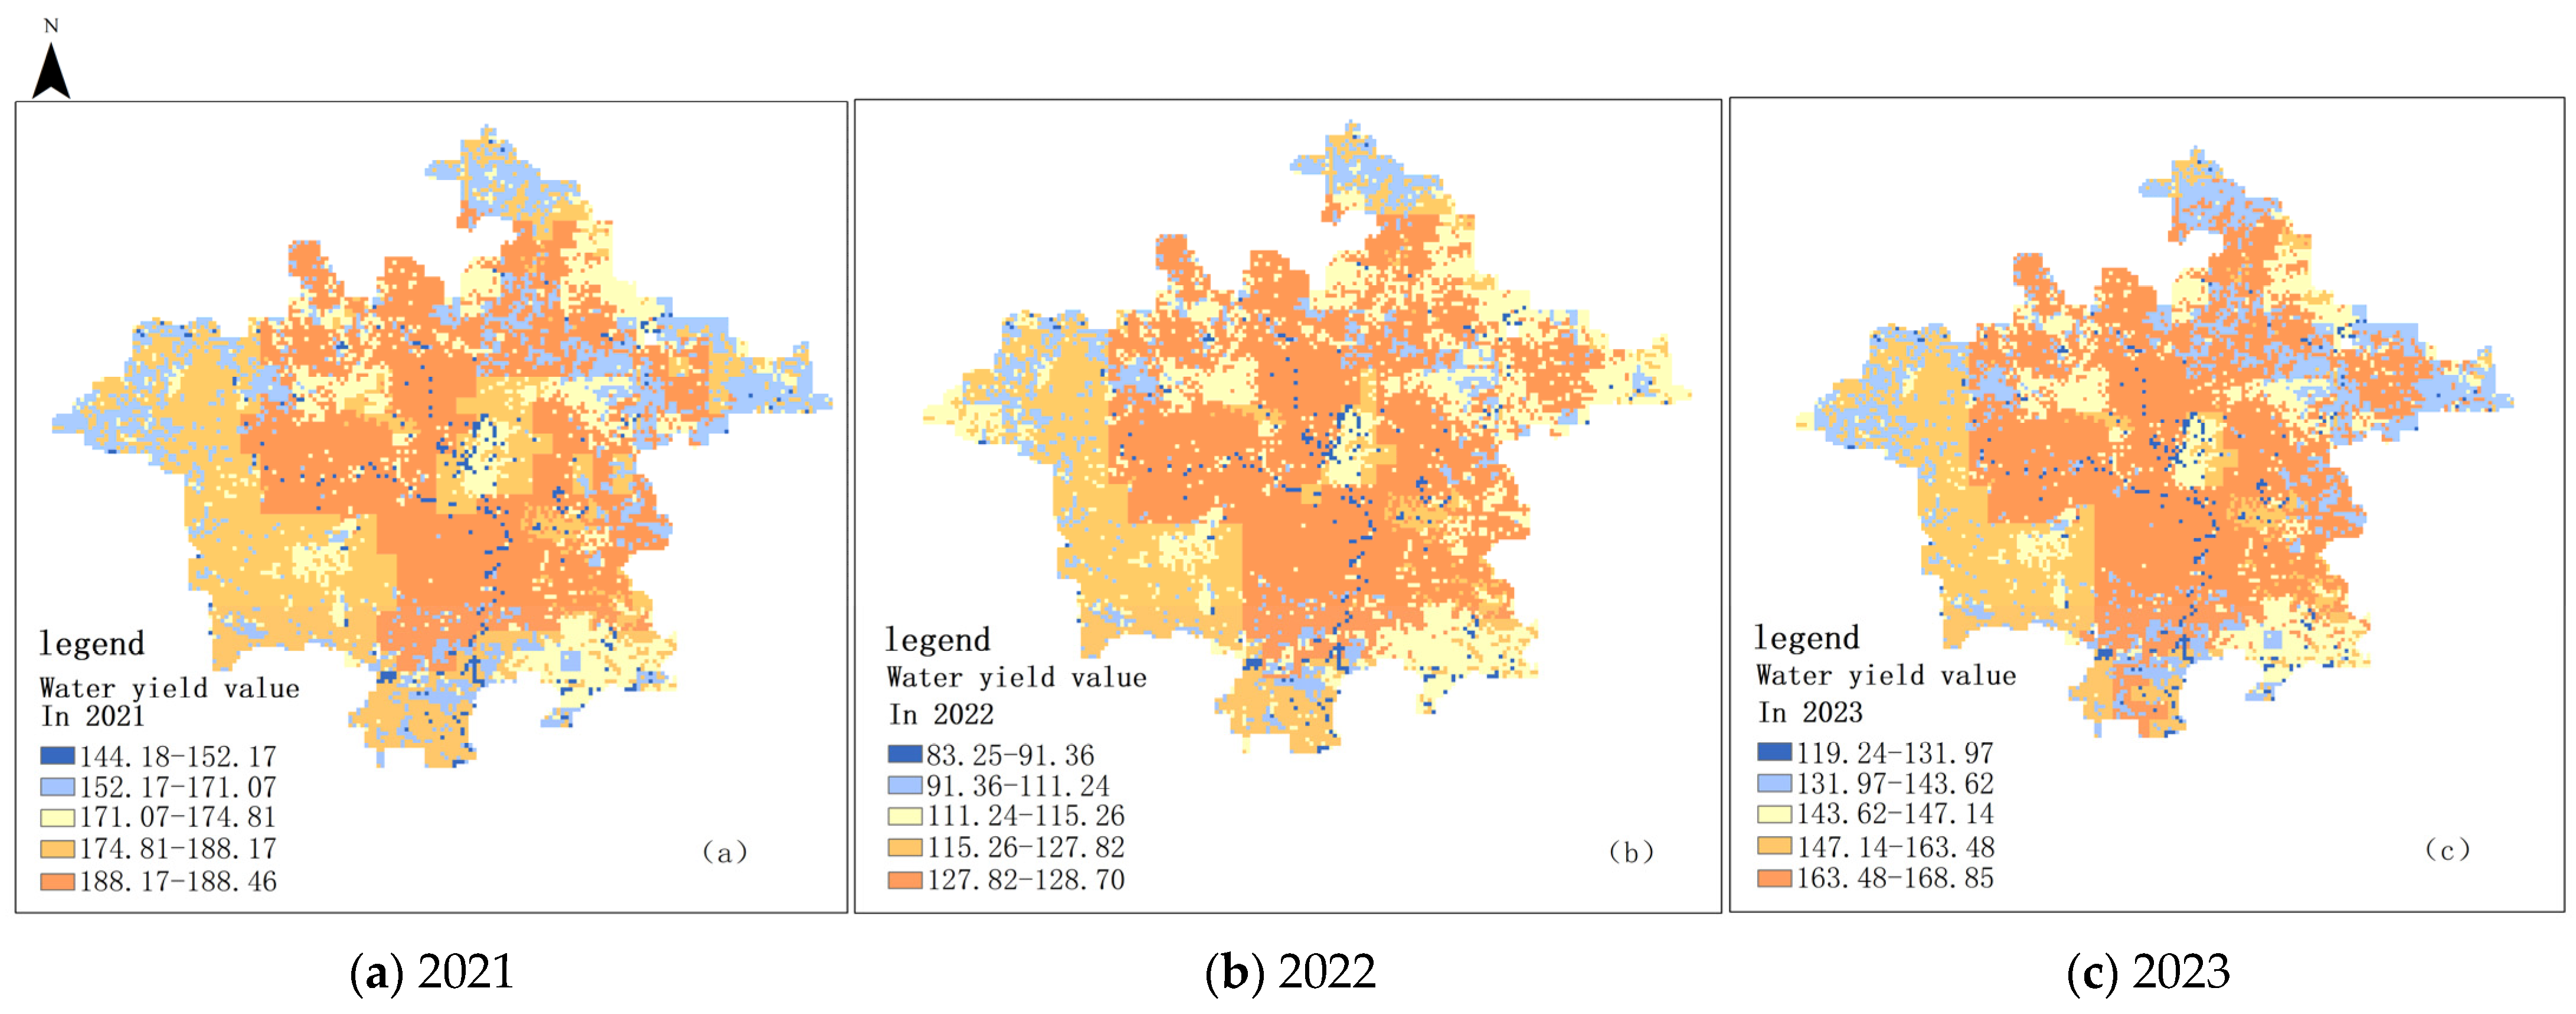
4.2.1. Water Yield and Direct Surface Runoff
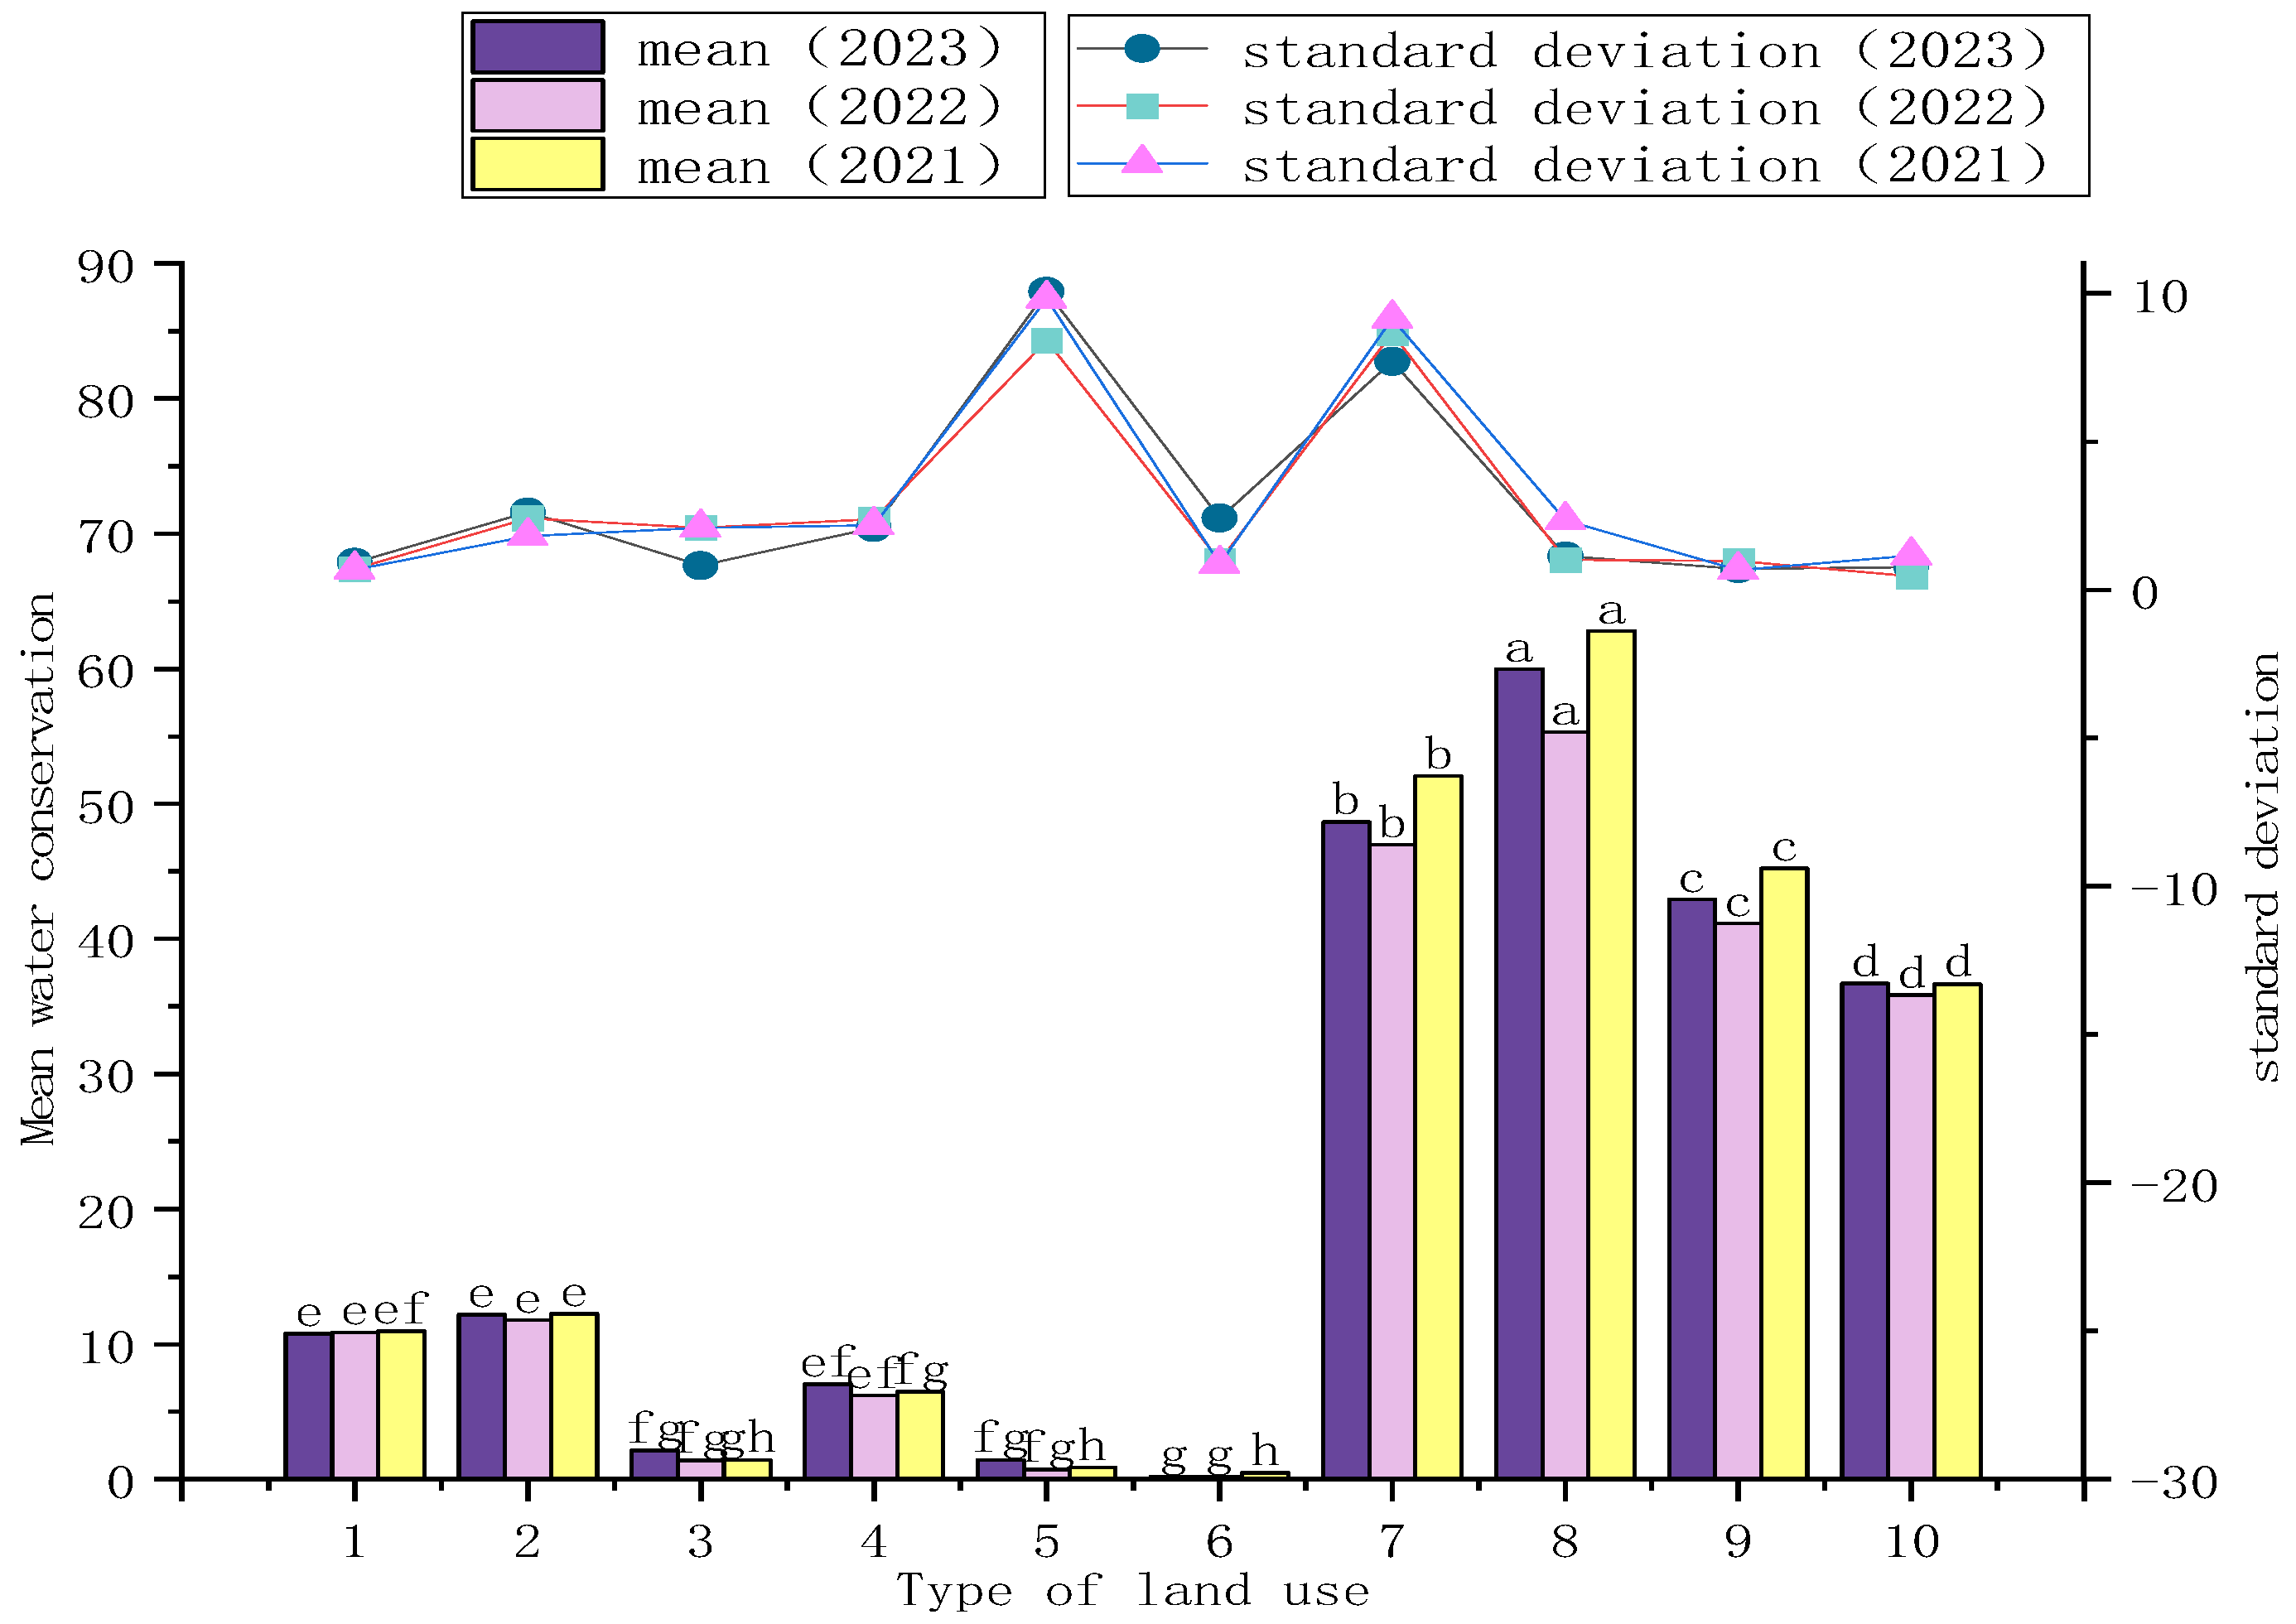
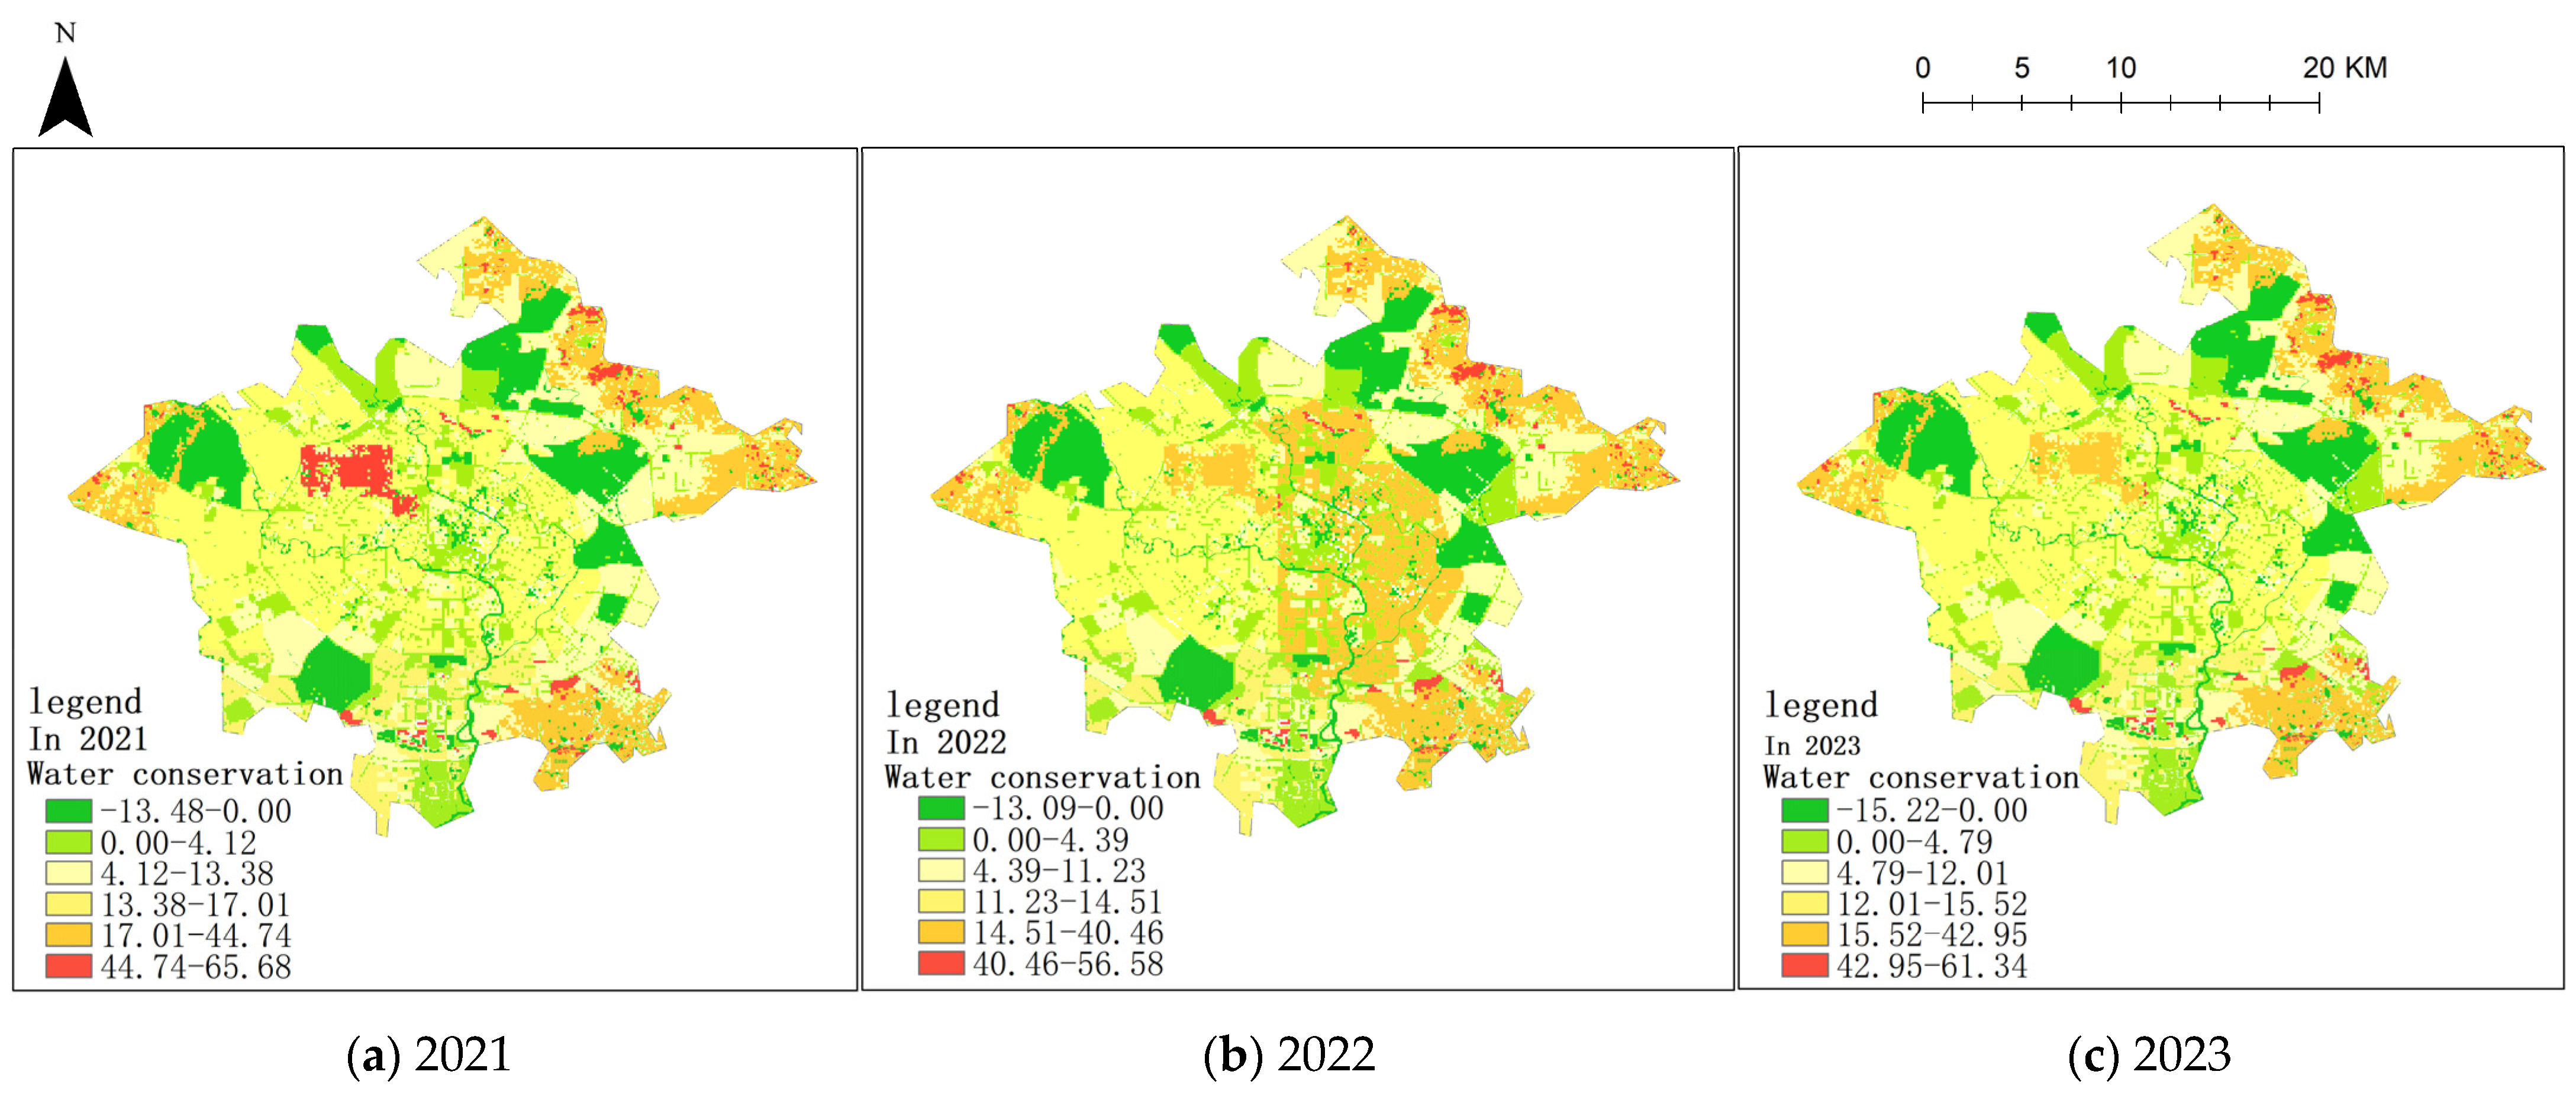
4.2.2. Analysis of Water Conservation
4.3. Urban Waterlogging Risk and Suggestions for Improvement of LID Measures
5. Conclusions
Author Contributions
Funding
Data Availability Statement
Conflicts of Interest
Appendix A
Appendix B

| Land Use Type | Number of Plaques | Area/km2 | Q/mm | Standard Deviation | Total Runoff/m3 | Runoff Percent Ofevery Land Use Type/% |
|---|---|---|---|---|---|---|
| Industrial Land | 156 | 48.8 | 143.1 | 24.26 | 7 × 10⁶ | 10.73 |
| Residential land | 1086 | 193.3 | 140.2 | 24.14 | 2.7 × 10⁷ | 41.65 |
| Commercial Land | 291 | 42.0 | 151.8 | 24.47 | 6.4 × 10⁶ | 9.81 |
| Public Facilities Management Land | 302 | 36.5 | 146.0 | 24.34 | 5.3 × 10⁶ | 8.19 |
| Water Area | 348 | 12.3 | 163.7 | 24.63 | 2 × 10⁶ | 3.09 |
| Transportation Land | 32 | 49.9 | 163.7 | 24.63 | 8.2 × 10⁶ | 12.55 |
| Park Green Land | 106 | 5.3 | 96.1 | 21.16 | 5.1 × 10⁵ | 0.78 |
| Forest Land | 580 | 8.4 | 93.5 | 20.91 | 7.8 × 10⁵ | 1.21 |
| Grass Land | 22 | 9.0 | 112.1 | 22.52 | 1 × 10⁶ | 1.55 |
| Cultivated Land | 33 | 57.8 | 117.5 | 22.90 | 6.8 × 10⁶ | 10.44 |
| total | 2956 | 463.3 | 1327.7 | 233.96 | 6.5 × 10⁷ | 100.00 |
References
- Xu, Z.X.; Cheng, T. Basic theory for urban water management and sponge city—Review on urban hydrology. J. Hydraul. Eng. 2019, 50, 53–61. [Google Scholar]
- Xu, Z.X.; Li, P. Progress on hydrological response to urbanization: Mechanisms, methods and solutions. Water Resour. Prot. 2022, 38, 7–17. [Google Scholar]
- Chen, H.Y.; Liu, Y.Z.; Hu, L.; Zhang, Z.; Chen, Y.; Tan, Y.C.; Han, Y.F. Constructing a Flood-Adaptive Ecological Security Pattern from the Perspective of Ecological Resilience: A Case Study of the Main Urban Area in Wuhan. Environ. Res. Public Health 2023, 20, 385. [Google Scholar]
- Wang, Y.; Jiang, Z.; Zhang, L. Sponge City Policy and Sustainable City Development: The Case of Shenzhen. Front. Environ. Sci. 2022, 9, 772490. [Google Scholar]
- Ji, M.C.; Bai, X. Construction of the sponge city regulatory detailed planning index system based on the SWMM model. Environ. Technol. Innov. 2021, 23, 101645. [Google Scholar]
- Jiang, Q.; Xiong, S.W.; Yang, F.; Huang, J.Y. Simulation Study on Rain-Flood Regulation in Urban “Gray-Green-Blue” Spaces Based on System Dynamics: A Case Study of the Guitang River Basin in Changsha. Water 2024, 16, 109. [Google Scholar]
- Yin, D.K.; Chen, Y.; Jia, H.F.; Wang, Q.; Chen, Z.X.; Xu, C.Q.; Li, Q. Sponge city practice in China: A review of construction, assessment, operational and maintenance. J. Clean. Prod. 2020, 280, 124963. [Google Scholar] [CrossRef]
- Zhou, J.W.; Gao, J.X.; Gao, Z.Q.; Yang, W.C. Analyzing the water conservation service function of the forest ecosystem. Acta Ecol. Sin. 2018, 38, 1679–1686. [Google Scholar]
- Gao, H.K.; Liu, J.G.; Gao, G.Y.; Xia, J. Ecological and hydrological perspectives of the water retention concept. Acta Geogr. Sin. 2023, 78, 139–148. [Google Scholar]
- Feng, C.H.; Zhang, N.; Habiyakare, T.; Yan, Y.N.; Zhang, H. Prospects of eco-hydrological model for sponge city construction. Ecosyst. Health Sustain. 2021, 7, 1994885. [Google Scholar]
- Yin, G.D.; Wang, X.; Zhang, X.; Fu, Y.S.; Hao, F.H.; Hu, Q.H. Invest Model-Based Estimation of Water Yield in North China and Its Sensitivities to Climate Variables. Water 2020, 12, 1692. [Google Scholar] [CrossRef]
- Cui, J.X.; Li, X.F.; Zheng, H.F.; Fu, R.; Zhang, S.Y. Spatial analysis of water conservation function in northeast China under different climatic conditions. Acta Ecol. Sin. 2019, 39, 3026–3038. [Google Scholar]
- Baek, S.S.; Choi, D.H.; Jung, J.W.; Yoon, K.S.; Cho, K.H. Evaluation of a hydrology and run-off BMP model in SUSTAIN on a commercial area and a public park in South Korea. Desalination Water Treat. 2015, 55, 347–359. [Google Scholar] [CrossRef]
- Amatya, D.M.; Walega, A.; Callahan, T.J.; Morrison, A.; Vulava, V.; Hitchcock, D.R.; Williams, T.M.; Epps, T. Storm Event Analysis of Four Forested Catchments on the Atlantic Coastal Plain using a Modified SCS-CN Rainfall-Runoff Model. J. Hydrol. 2022, 608, 127772. [Google Scholar] [CrossRef]
- Kastridis, A.; Stathis, D. Evaluation of Hydrological and Hydraulic Models Applied in Typical Mediterranean Ungauged Watersheds Using Post-Flash-Flood Measurements. Hydrology 2020, 7, 12. [Google Scholar] [CrossRef]
- Melesse, A.M.; Shih, S.F. Spatially distributed storm runoff depth estimation using Landsat images and GIS. Comput. Electron. Agric. 2002, 37, 173–183. [Google Scholar] [CrossRef]
- He, X.Y.; Chen, C.; Liu, Y.; Chu, Y.L. Inundation Analysis Method for Urban Mountainous Areas Based on Soil Conservation Service Curve Number (SCS-CN) Model Using Remote Sensing Data. Sens. Mater. 2020, 32, 3813. [Google Scholar] [CrossRef]
- Liu, Y.H.; Zhong, Y.F.; Ma, A.L.; Zhao, J.; Zhang, L.P. Cross-resolution national-scale land-cover mapping based on noisy label learning: A case study of China. Int. J. Appl. Earth Obs. Geoinf. 2023, 118, 103265. [Google Scholar]
- Wang, Z.Y.; Gu, X.C.; Yu, H.R. Spatiotemporal Variation in the Yangtze River Delta Urban Agglomeration from 1980 to 2020 and Future Trends in Ecosystem Service. Land 2023, 12, 929. [Google Scholar] [CrossRef]
- Pan, T.; Wu, S.H.; Dai, E.F.; Liu, Y.J. Spatiotemporal variation of water source supply service in Three Rivers Source Area of China based on Invest model. Chin. J. Appl. Ecol. 2013, 24, 183–189. [Google Scholar]
- Chen, X.; Lin, S.Y.; Tian, J.; Wang, Y.J.; Ye, Y.X.; Dong, S.N.; Gong, X.L.; Lin, Q.L.; Zhu, L.Y. Simulation study on water yield service flow based on the Invest Geoda-Gephi network: A case study on Wuyi Mountains, China. Ecol. Indic. 2024, 159, 111694. [Google Scholar] [CrossRef]
- Shrestha, P.M.; Jayaraj, G.K. Application of SCS-CN model in Runoff Estimation. Int. J. Res. Appl. Sci. Eng. Technol. 2018, 6, 2363–2369. [Google Scholar]
- Patil, J.P.; Sarangi, A.; Singh, A.K.; Ahmad, T. Evaluation of modified CN methods for watershed runoff estimation using a GIS-based interface. Biosyst. Eng. 2008, 100, 137–146. [Google Scholar] [CrossRef]
- Verma, S.; Singh, P.K.; Mishra, S.K.; Singh, V.P.; Singh, V.; Singh, A. Activation soil moisture accounting (ASMA) for runoff estimation using soil conservation service curve number (SCS-CN) method. J. Hydrol. 2020, 589, 12511. [Google Scholar]
- Fang, Z.H.; Song, S.X.; He, C.Y.; Liu, Z.F.; Qi, T.; Zhang, J.X.; Li, J. Evaluating the Impacts of Future Urban Expansion on Surface Runoff in an Alpine Basin by Coupling the LUSD-Urban and SCS-CN Models. Water 2020, 12, 3405. [Google Scholar] [CrossRef]
- Feng, J.; Wei, W.; Feng, Q.Y. The runoff curve number of SCS-CN method in loess hilly region. Acta Ecol. Sin. 2021, 41, 4170–4181. [Google Scholar]
- Mishra, S.K.; Singh, V.P. Soil Conservation Service Curve Number (SCS-CN) Methodology; Water Science and Technology Library: Washington, DC, USA, 2003; pp. 84–146. [Google Scholar]
- Carra, B.G.; Bombino, G.; Lucas-Borja, M.E.; Denisi, P.; Plaza-Álvarez, P.A.; Zema, D.A. Modelling the Event-Based Hydrological Response of Mediterranean Forests to Prescribed Fire and Soil Mulching with Fern Using the Curve Number, Horton and USLE-Family (Universal Soil Loss Equation) Models. Land 2021, 10, 1166. [Google Scholar] [CrossRef]
- Eshtawi, T.; Evers, M.; Tischbein, B. Quantifying the impact of urban area expansion on groundwater recharge and surface runoff. Hydrol. Sci. J. 2015, 61, 826–843. [Google Scholar]
- Rezaei, A.R.; Ismail, Z.B.; Niksokhan, M.H.; Ramli, A.H.; Sidek, L.M.; Dayarian, M.A. Investigating the effective factors influencing surface runoff generation in urban catchments—A review. Desalination Water Treat. 2019, 164, 276–292. [Google Scholar]
- Wang, Y.; Li, S.Q.; Hu, C.J.; Ren, J.; Liu, P.; Zhao, C.; Zhu, M.K. Analysis of Surface Runoff Characteristics in Zhengzhou City under Extreme Rainfall Conditions. Sustainability 2024, 16, 6980. [Google Scholar] [CrossRef]
- Sun, H.L.; Wu, S.K.; Dong, Q.Y.; Zhou, X.; Yang, J.X.; Li, G. Research on Runoff Management of Sponge Cities under Urban Expansion. Water 2024, 16, 2103. [Google Scholar] [CrossRef]
- Sun, G.; Caldwell, P.; Noormets, A.; McNulty, S.G.; Cohen, E.; Myers, J.M.; Domec, J.-C.; Treasure, E.; Mu, Q.; Xiao, J.; et al. Upscaling key ecosystem functions across the conterminous United States by a water-centric ecosystem model. J. Geophys. Res. 2011, 116, 163. [Google Scholar] [CrossRef]
- Delphin, S.; Escobedo, F.J.; Abd-Elrahman, A.; Cropper, W.P. Urbanization as a land use change driver of forest ecosystem services. Land Use Policy 2016, 54, 188–199. [Google Scholar] [CrossRef]
- Huang, X.; Peng, S.Y.; Wang, Z.; Huang, B.M.; Liu, J. Spatial heterogeneity and driving factors of ecosystem water yield service in Yunnan Province, China based on Geodetector. Chin. J. Appl. Ecol. 2022, 33, 2813–2821. [Google Scholar]
- Gray, L.C.; Zhao, L.; Stillwell, A.S. Impacts of climate change on global total and urban runoff. J. Hydrol. 2023, 620, 129352. [Google Scholar] [CrossRef]
- Cao, Y.J.; Ma, Y.G.; Bao, A.M.; Chang, C.; Liu, T. Evaluation of the water conservation function in the Ili River Delta of Central Asia based on the InVEST model. J. Arid Land 2023, 15, 1455–1473. [Google Scholar] [CrossRef]
- Che, X.C.; Jiao, L.; Zhu, X.L.; Wu, J.J.; Li, Q. Spatial-Temporal Dynamics of Water Conservation in Gannan in the Upper Yellow River Basin of China. Land 2023, 12, 1394. [Google Scholar] [CrossRef]
- Huang, X.; Liu, J.; Peng, S.Y.; Huang, B.M. The impact of multi-scenario land use change on the water conservation in central Yunnan urban agglomeration, China. Ecol. Indic. 2023, 147, 109922. [Google Scholar] [CrossRef]
- Qin, Z.; Yang, M.J.; Qiu, M.Y.; Liu, Z.Y. Spatial-Temporal Distribution and the Influencing Factors of Water Conservation Function in Yunnan, China. Appl. Sci. 2023, 13, 11720. [Google Scholar] [CrossRef]
- Ding, C.F.; Zhang, H.F.; Li, X.; Li, W.T.; Gao, Y.Q. Quantitative assessment of water conservation function of the natural spruce forest in the central Tianshan Mountains: A case study of the Urumqi River Basin. Acta Ecol. Sin. 2017, 37, 3733–3743. [Google Scholar]
- Liu, J.; Lang, X.D.; Su, J.R.; Liu, W.D.; Liu, H.Y.; Tian, Y. Evaluation of water conservation function in the dry-hot valley area of Jinsha River Basin based on InVEST model. Acta Ecol. Sin. 2021, 41, 8099–8111. [Google Scholar]
- Zhang, Q.F.; Wu, Z.F.; Tarolli, P. Investigating the Role of Green Infrastructure on Urban Waterlogging: Evidence from Metropolitan Coastal Cities. Remote Sens. 2021, 13, 2341. [Google Scholar] [CrossRef]
- Li, W.; Wang, H.B. Control of urban river water pollution is studied based on SMS. Environ. Technol. Innov. 2021, 22, 101468. [Google Scholar]
- Zhao, K.X.; Wang, J.M.; Yan, X.; Huang, X.J. Urban waterlogging simulation and its risk assessment in the old area of Xi’an. J. Nat. Disasters 2023, 32, 1–12. [Google Scholar]
- Wei, H.B.; Wu, H.; Zhang, L.Y.; Liu, J. Urban flooding simulation and flood risk assessment based on the Info Works ICM model: A case study of the urban inland rivers in Zhengzhou, China. Water Sci. Technol. 2024, 90, 1338–1358. [Google Scholar] [CrossRef]
- Zhou, X.; Gao, Y.Q.; Wu, D. Simulation on influence of regional rain-flood control effect under different combinations of LID measures. Water Resour. Prot. 2021, 37, 26–31+73. [Google Scholar]
- Marín, C.; Bachawati, M.E.; Pérez, G. The impact of green roofs on urban runoff quality: A review. Urban For. Urban Green. 2023, 90, 128138. [Google Scholar] [CrossRef]
- Kim, H.; Kim, G. An Effectiveness Study on the Use of Different Types of LID for Water Cycle Recovery in a Small Catchment. Land 2021, 10, 1055. [Google Scholar] [CrossRef]
- Yuan, S.C.; Wang, H.J.; Lv, B.; Liu, J. Design and evaluation of sponge city reconstruction scheme for old building district in mountainous city based on Info Works ICM model. Water Resour. Prot. 2020, 36, 43–49+70. [Google Scholar]
- Pan, X.J. Coupling of urban green space system and sponge city construction. IOP Conf. Ser. Earth Environ. Sci. 2019, 346, 012014. [Google Scholar] [CrossRef]
- Li, W.T.; Wang, H.; Zhou, J.J.; Yan, L.; Liu, Z.L.; Pang, Y.L.; Zhang, H.J.; Huang, T.Y. Simulation and Evaluation of Rainwater Runoff Control, Collection, and Utilization for Sponge City Reconstruction in an Urban Residential Community. Sustainability 2022, 14, 12372. [Google Scholar] [CrossRef]
- Zhang, L.Y.; Ye, Z.H.; Shibata, S. Assessment of Rain Garden Effects for the Management of Urban Storm Runoff in Japan. Sustainability 2020, 12, 9982. [Google Scholar] [CrossRef]
- Peng, J.; Zhong, X.; Yu, L.; Wang, Q.Q. Simulating rainfall runoff and assessing low impact development (LID) facilities in sponge airport. Water Sci. Technol. 2020, 82, 918–926. [Google Scholar] [PubMed]
- Zhao, Z.J.; Chen, J.; Han, S.G.; Ding, L.; Zhao, X.Q.; Liu, X.M.; Deng, H. A Study on Plant Selection for Low-Carbon Rain Gardens Based on an AHP-TOPSIS Model. Sustainability 2024, 16, 2097. [Google Scholar] [CrossRef]
- Kenanoğlu, Z.; Malkoç True, E.; Kılıçaslan Deniz, Ç.; Deniz, B.; Özeren Alkan, M. Residents’ Perception of Urban Water System-Based Environmental Issues. Water 2024, 16, 1846. [Google Scholar] [CrossRef]


| Date | Source and Treatment |
|---|---|
| Precipitation | National Earth System Science Data Center (http://www.geodata.cn, accessed on 18 July 2024) |
| Potential evaporation | National Qinghai-Tibet Plateau Science Data Center (https://data.tpdc.ac.cn/, accessed on 6 October 2024) |
| Land Cover Classification Data | 2020 10 m resolution land cover data from Professor Zhong Yanfei’s team at Wuhan University (https://data.tpdc.ac.cn/, accessed on 22 August 2024) |
| Root Restriction Layer Data | 1 km Chinese Soil Depth Map (https://www.nature.com/articles/s41597-019-0345-6, accessed on 22 August 2024) |
| Plant Available Water Content | ISRIC Global Dataset |
| Sub-watershed Data | Based on data from the Resource and Environment Science Data Platform (https://www.resdc.cn/, accessed on 8 October 2024) and generated sub-watersheds through GIS hydrological analysis tools |
| Biophysical Parameters Table | The coefficients of land use types in the biophysical table are obtained from literature [21] and parameters recommended by the InVEST model |
| Soil Type | Soil Properties | Minimum Infiltration Rate/(mm·h−1) |
|---|---|---|
| A | Sandy soil, loamy sand, sandy loam | >7.26 |
| B | Silt loam, loam | 3.81~7.26 |
| C | Sandy clay loam, silty clay loam, shallow sandy loam | 1.27~3.81 |
| D | Sandy clay, clay | 0~1.27 |
| Land Use Type | Soil Hydrology Group | |||
|---|---|---|---|---|
| A | B | C | D | |
| Industrial Land | 81 | 88 | 91 | 93 |
| Residential Land | 77 | 85 | 90 | 92 |
| Commercial Land | 89 | 92 | 94 | 95 |
| Public Utility Management Land | 83 | 88 | 92 | 94 |
| Water Area | 98 | 98 | 98 | 98 |
| Transportation Land | 98 | 98 | 98 | 98 |
| Park Green Land | 39 | 61 | 74 | 80 |
| Forest Land | 36 | 60 | 73 | 79 |
| Grass Land | 52 | 70 | 80 | 84 |
| Cultivated Land | 66 | 75 | 82 | 85 |
| Land Use Type | CN | S/mm | /mm | Q2021/mm | Q2022/mm | Q2023/mm |
|---|---|---|---|---|---|---|
| Industrial Land | 91 | 25.1 | 5.0 | 170.8 | 111.8 | 146.6 |
| Residential land | 90 | 28.2 | 5.6 | 167.8 | 109.0 | 143.8 |
| Commercial Land | 94 | 16.2 | 3.2 | 179.8 | 120.2 | 155.5 |
| Public Facilities Management Land | 92 | 22.1 | 4.4 | 173.8 | 114.5 | 149.6 |
| Water Area | 98 | 5.2 | 1.0 | 191.9 | 131.9 | 167.4 |
| Transportation Land | 98 | 5.2 | 1.0 | 191.9 | 131.9 | 167.4 |
| Park Green Land | 74 | 89.2 | 17.8 | 120.5 | 68.9 | 99.0 |
| Forest Land | 73 | 93.9 | 18.8 | 117.6 | 66.6 | 96.3 |
| Grass Land | 80 | 63.5 | 12.7 | 138.0 | 83.1 | 115.3 |
| Cultivated Land | 82 | 55.8 | 11.2 | 143.8 | 88.0 | 120.8 |
| Land Use Type | Average Water Conservation Depth/mm | Standard Deviation | Proportion of Water Conservation/% | ||||
|---|---|---|---|---|---|---|---|
| 2021 | 2022 | 2023 | 2021 | 2022 | 2023 | ||
| Industrial Land | 10.48 | 10.03 | 9.73 | 1.83 | 4.57 | 4.81 | 4.44 |
| Residential Land | 12.06 | 10.77 | 10.23 | 3.05 | 5.26 | 5.17 | 4.67 |
| Commercial Land | 1.72 | 1.38 | 1.16 | 2.67 | 0.75 | 0.66 | 0.53 |
| Public Facilities Management Land | 7.57 | 6.05 | 6.93 | 2.52 | 3.30 | 2.91 | 3.16 |
| Water Area | 0.54 | 0.27 | 0.49 | 9.60 | 0.24 | 0.13 | 0.22 |
| Transportation Land | 0.46 | 0.61 | 0.73 | 8.52 | 0.20 | 0.29 | 0.33 |
| Park Green Land | 52.50 | 46.79 | 49.26 | 9.37 | 22.90 | 22.45 | 22.48 |
| Forest Land | 61.69 | 53.27 | 57.32 | 4.32 | 26.91 | 25.55 | 26.15 |
| Grass Land | 45.04 | 42.07 | 44.47 | 6.58 | 19.65 | 20.18 | 20.29 |
| Cultivated Land | 37.19 | 37.22 | 38.86 | 6.84 | 16.22 | 17.85 | 17.73 |
| Statistics | 229.25 | 208.46 | 219.18 | 5.53 | 100.0 | 100.0 | 100.0 |
Disclaimer/Publisher’s Note: The statements, opinions and data contained in all publications are solely those of the individual author(s) and contributor(s) and not of MDPI and/or the editor(s). MDPI and/or the editor(s) disclaim responsibility for any injury to people or property resulting from any ideas, methods, instructions or products referred to in the content. |
© 2025 by the authors. Licensee MDPI, Basel, Switzerland. This article is an open access article distributed under the terms and conditions of the Creative Commons Attribution (CC BY) license (https://creativecommons.org/licenses/by/4.0/).
Share and Cite
Tian, Y.; Wang, Y.; Chen, W.; Chen, R.; Wei, Z. Quantitative Analysis of Sponge City Construction and Function in the Main Urban Area of Chengdu. Water 2025, 17, 933. https://doi.org/10.3390/w17070933
Tian Y, Wang Y, Chen W, Chen R, Wei Z. Quantitative Analysis of Sponge City Construction and Function in the Main Urban Area of Chengdu. Water. 2025; 17(7):933. https://doi.org/10.3390/w17070933
Chicago/Turabian StyleTian, Yue, Yuelin Wang, Wende Chen, Ruojing Chen, and Zhengxuan Wei. 2025. "Quantitative Analysis of Sponge City Construction and Function in the Main Urban Area of Chengdu" Water 17, no. 7: 933. https://doi.org/10.3390/w17070933
APA StyleTian, Y., Wang, Y., Chen, W., Chen, R., & Wei, Z. (2025). Quantitative Analysis of Sponge City Construction and Function in the Main Urban Area of Chengdu. Water, 17(7), 933. https://doi.org/10.3390/w17070933