
Water Quality Dynamics in the Zhuxihe River Basin in Hainan Province, China: Insights from Temporal and Spatial Analysis

 ,
,  ,
,
Abstract
1. Introduction
2. Study Area
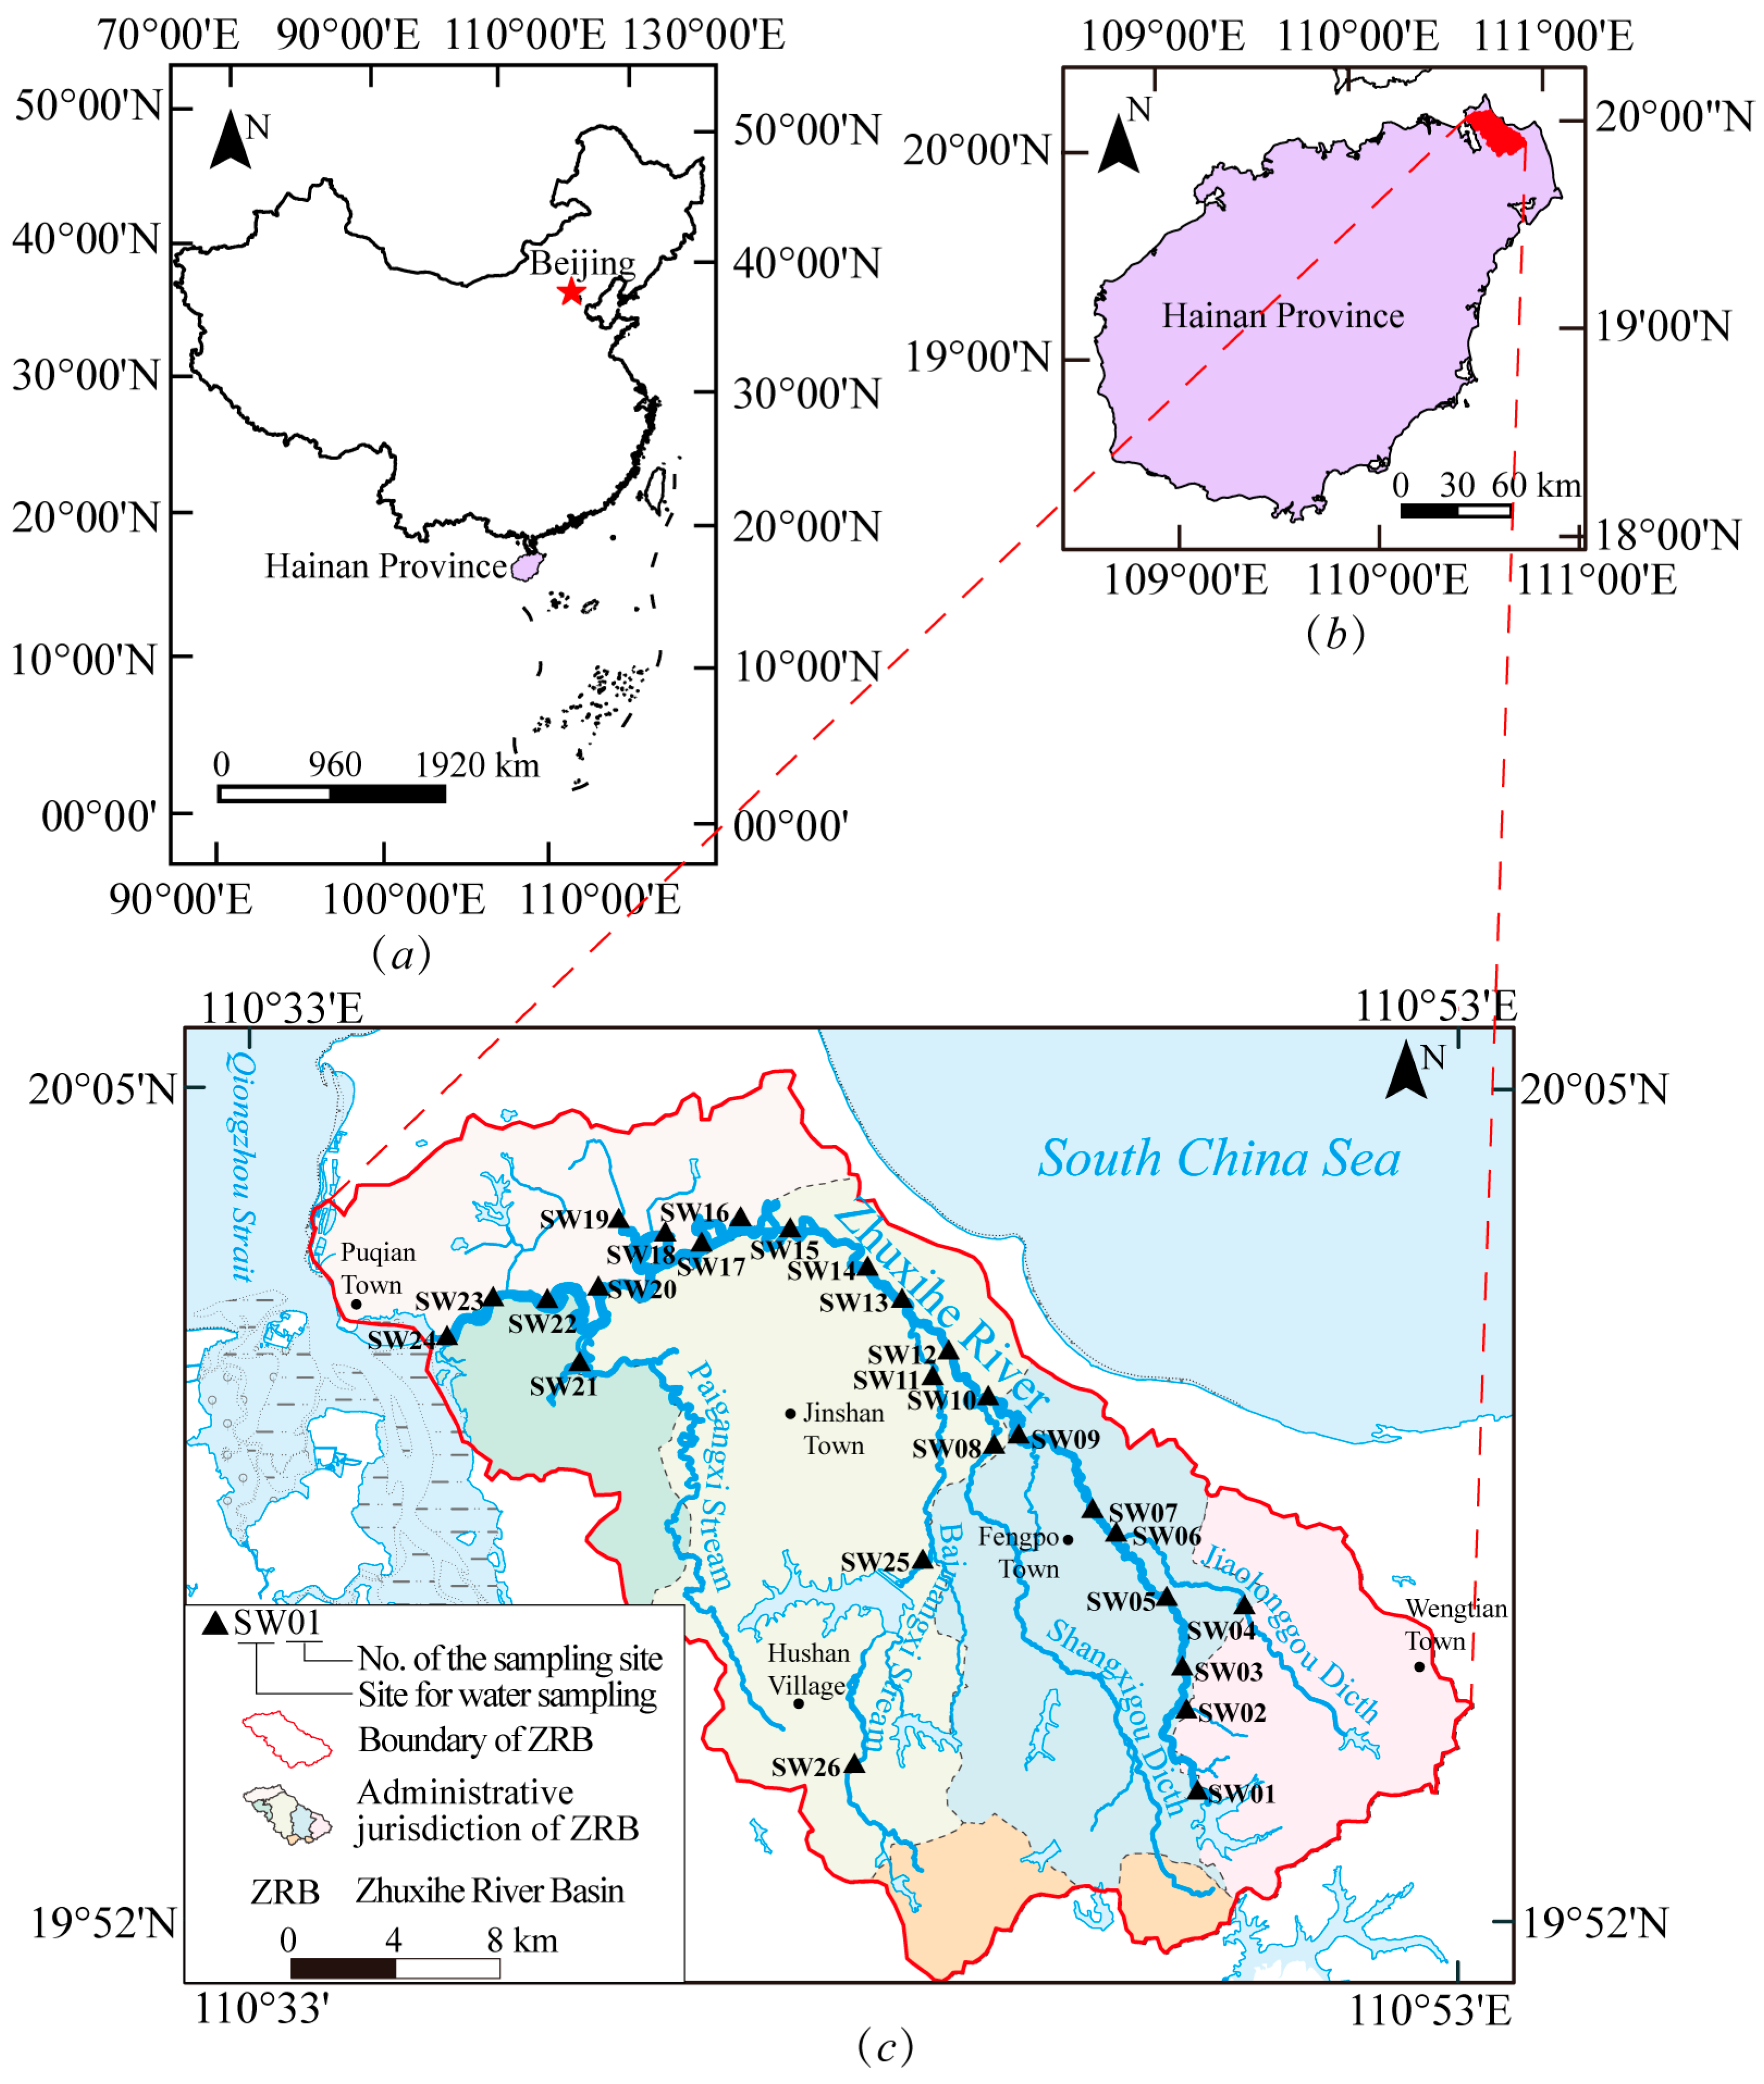
2.1. Location and the River Basin in the Study Area
2.2. Climate and Seasonal Water Sample Collection
2.3. General Condition and Possible Causes of Deterioration of Water Quality
- (1)
- Small-scale and non-industrial livestock and aquaculture
- (2)
- Traditional farming methods
- (3)
- Natural geographical characteristics
- (4)
- Ineffective mitigation measures
3. Materials and Methods
3.1. Water Sample Collection and Testing
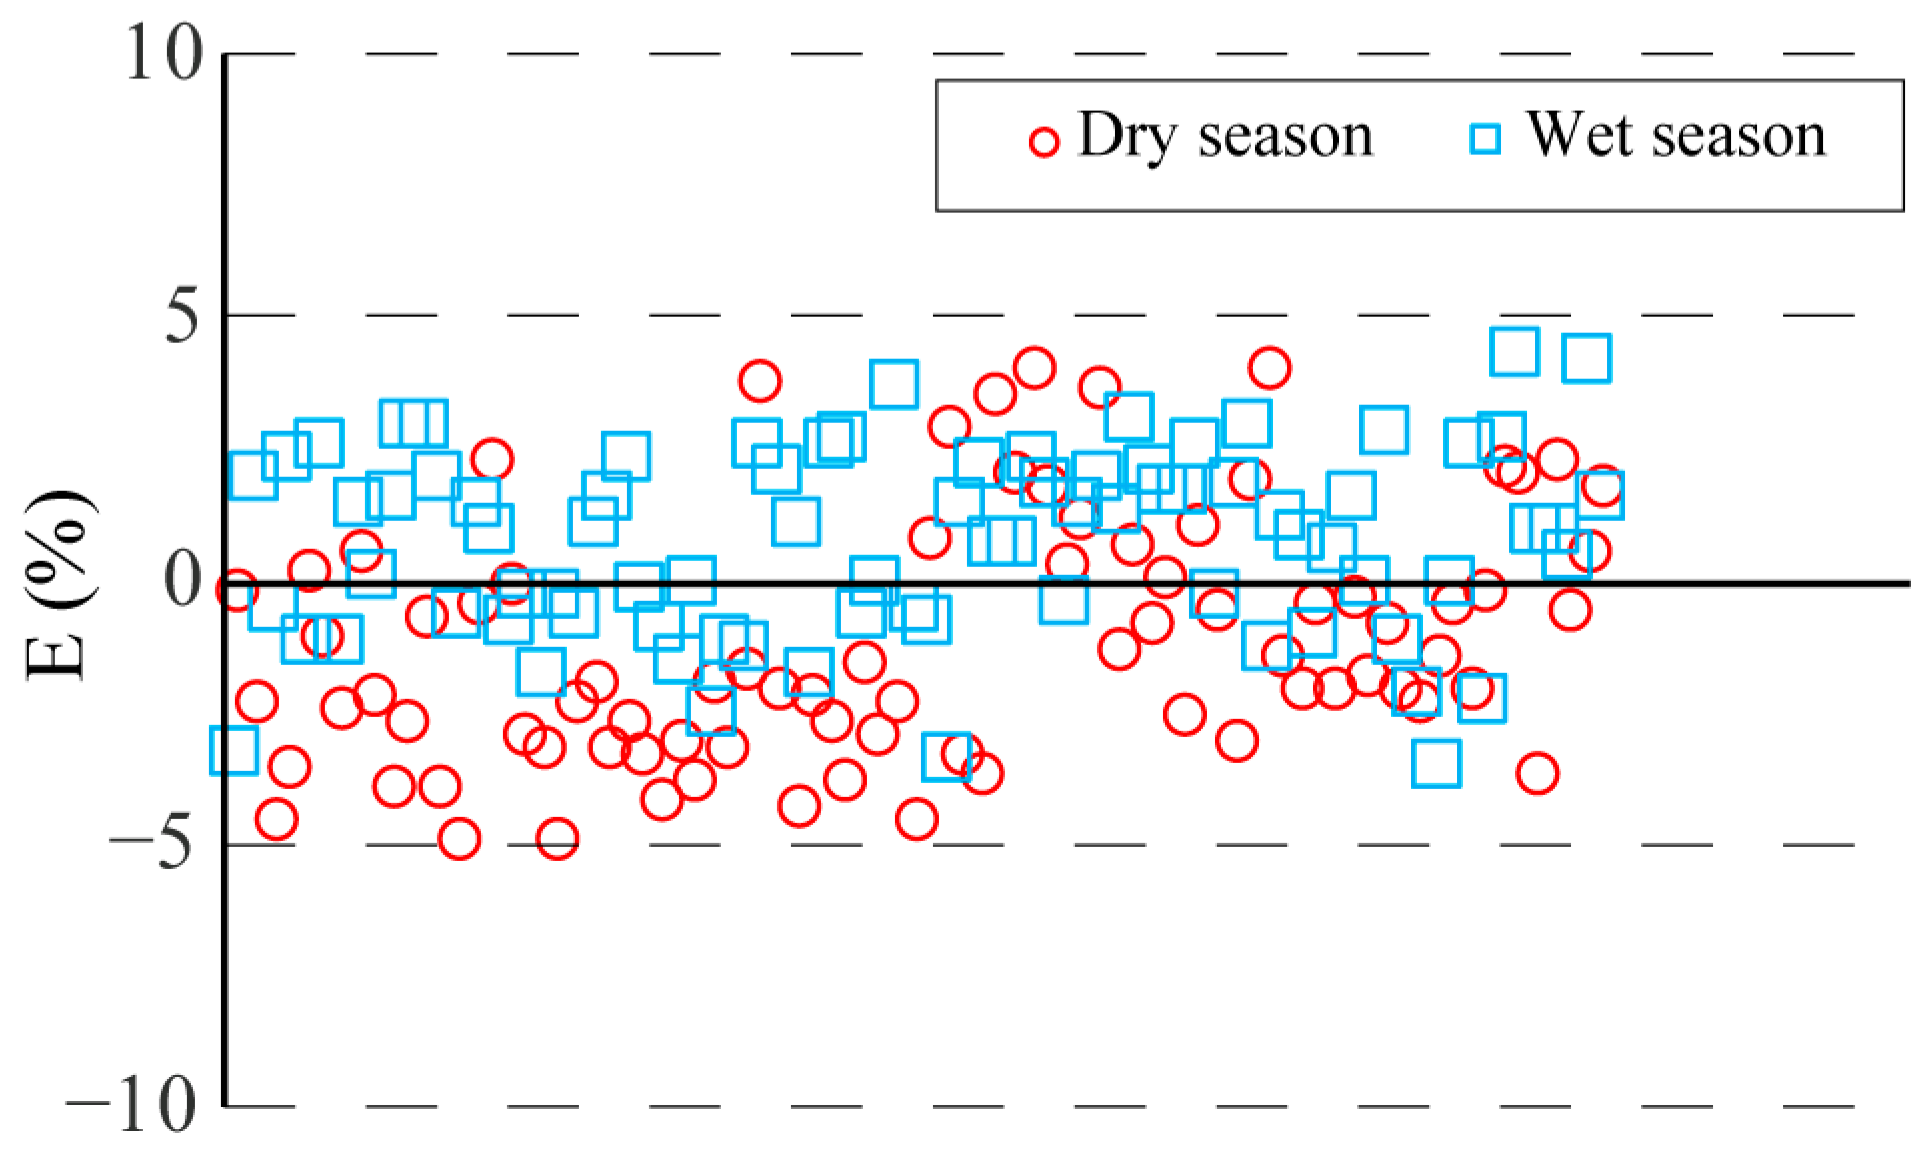
3.2. Examination of Data Reliability
- (1)
- Anion and cation balance examination
- (2)
- Total hardness examination
3.3. Water Quality Evaluation System
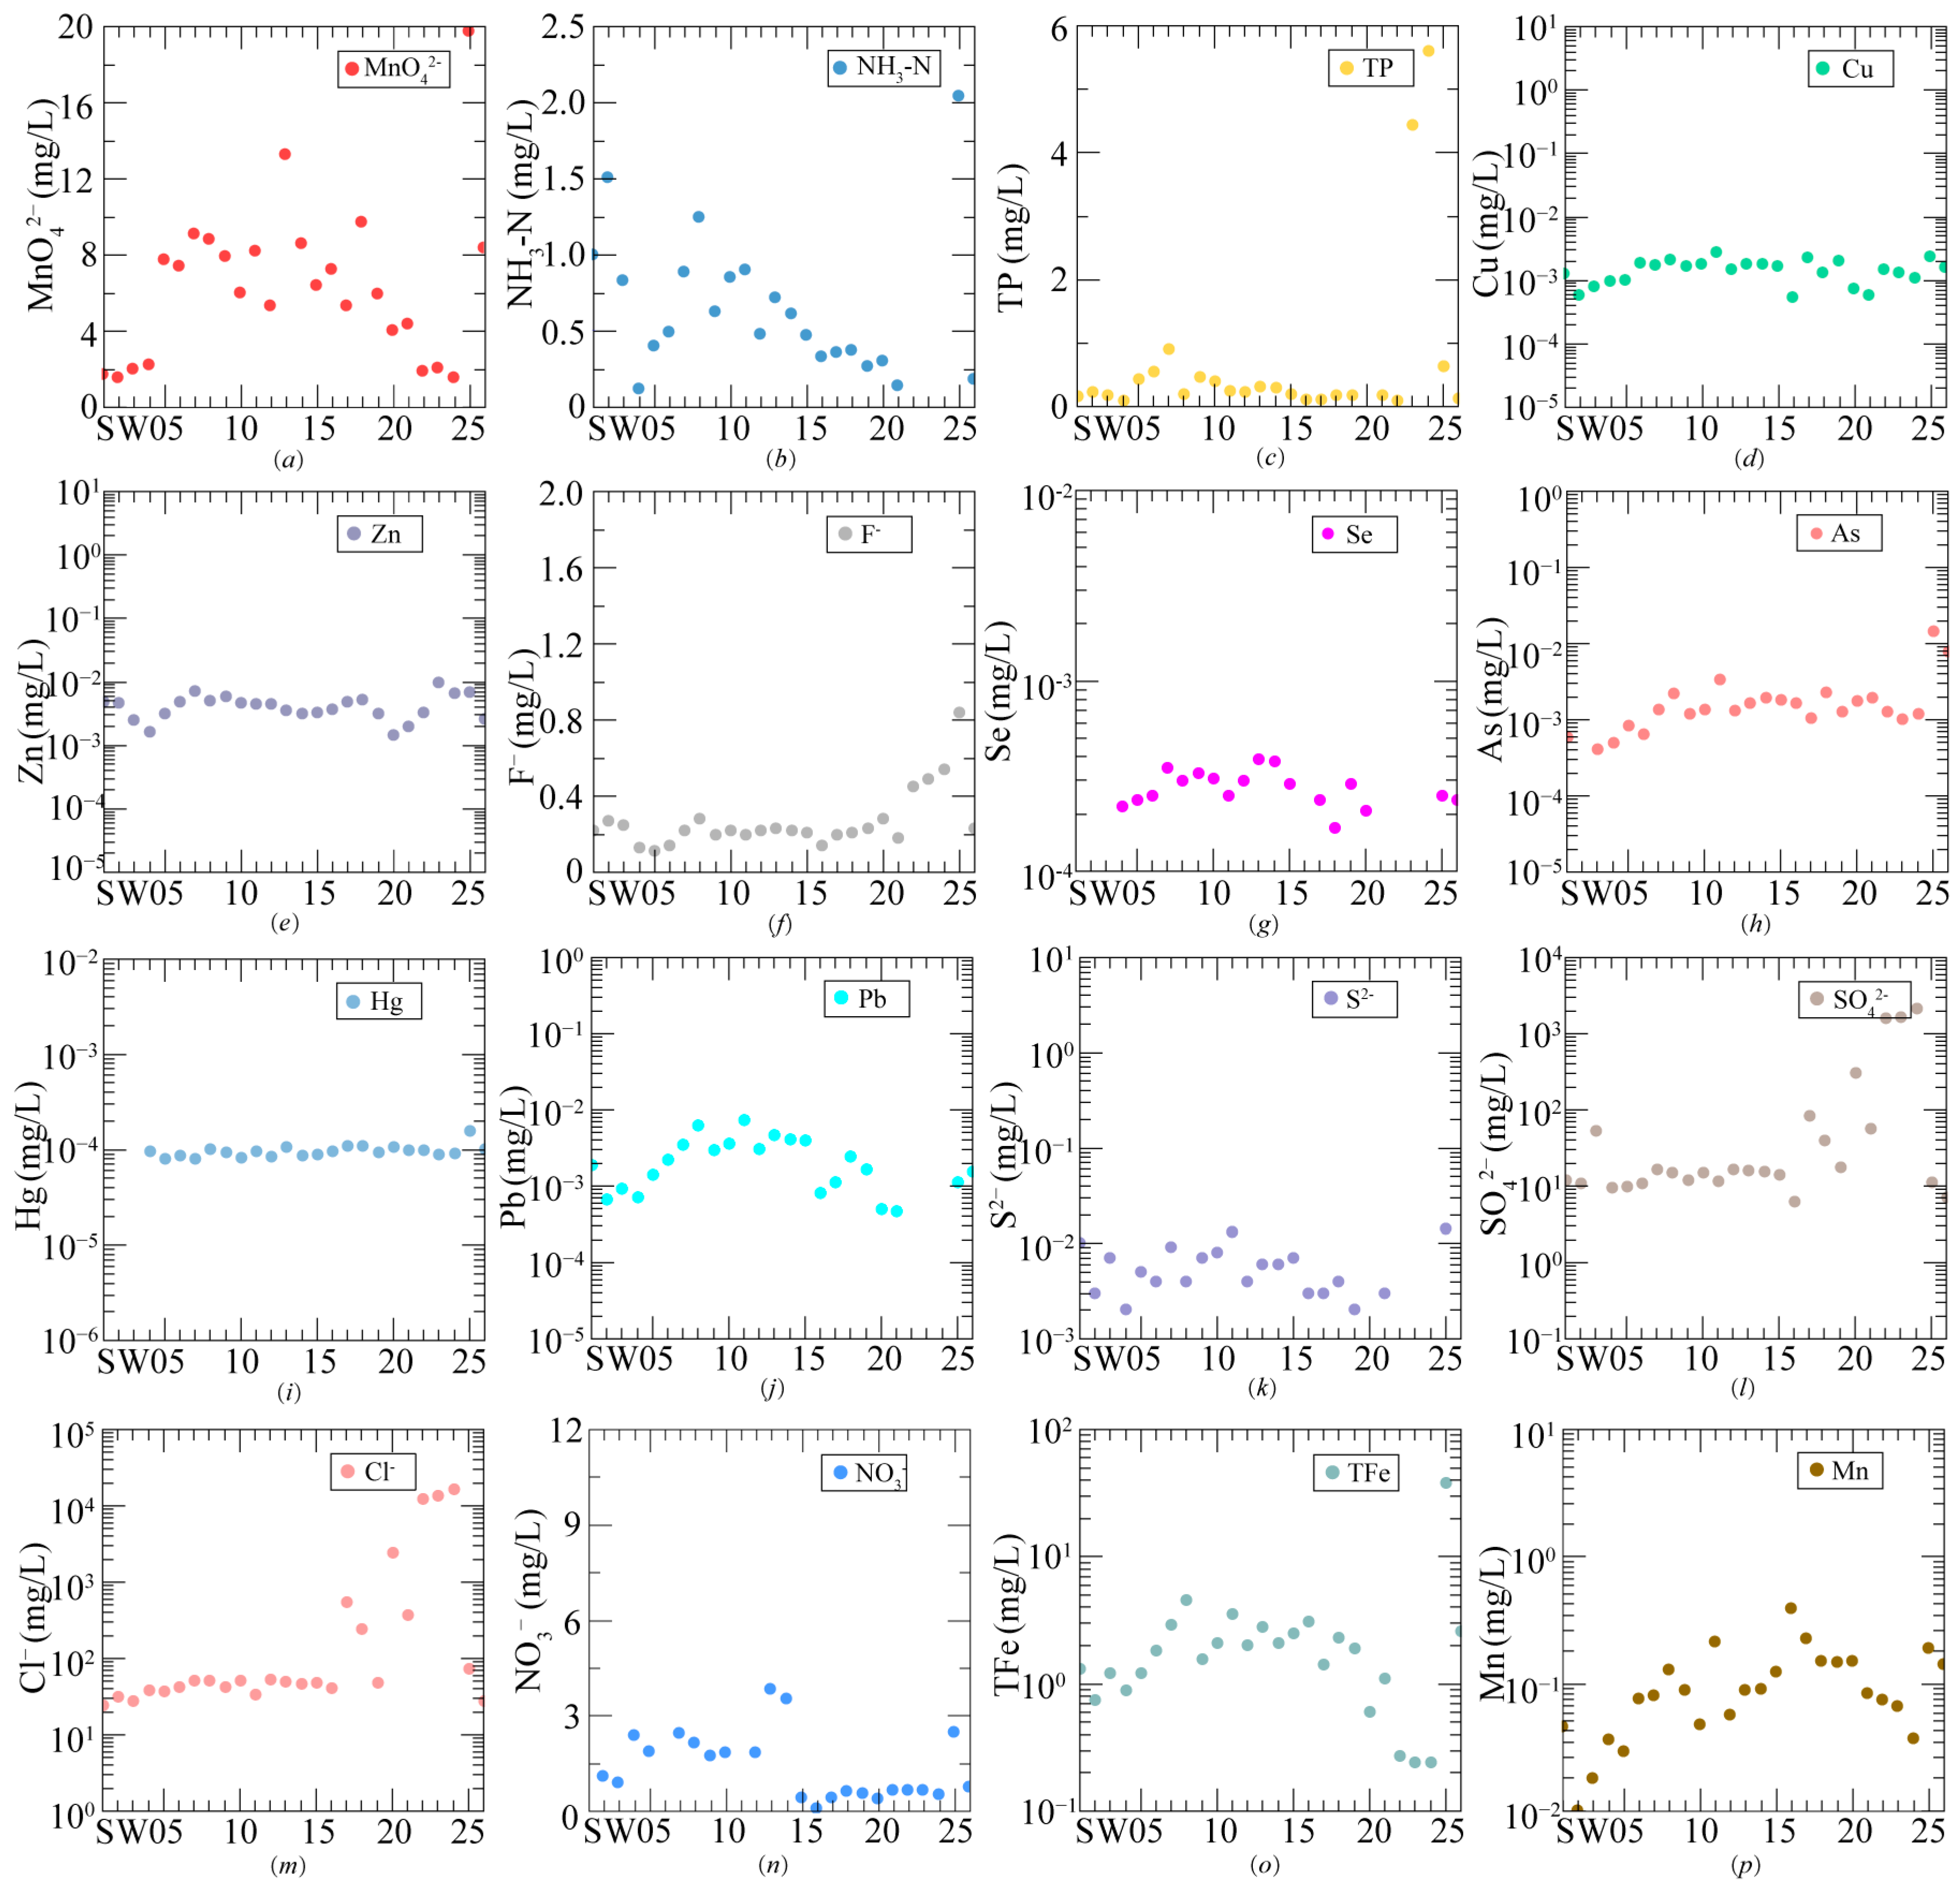
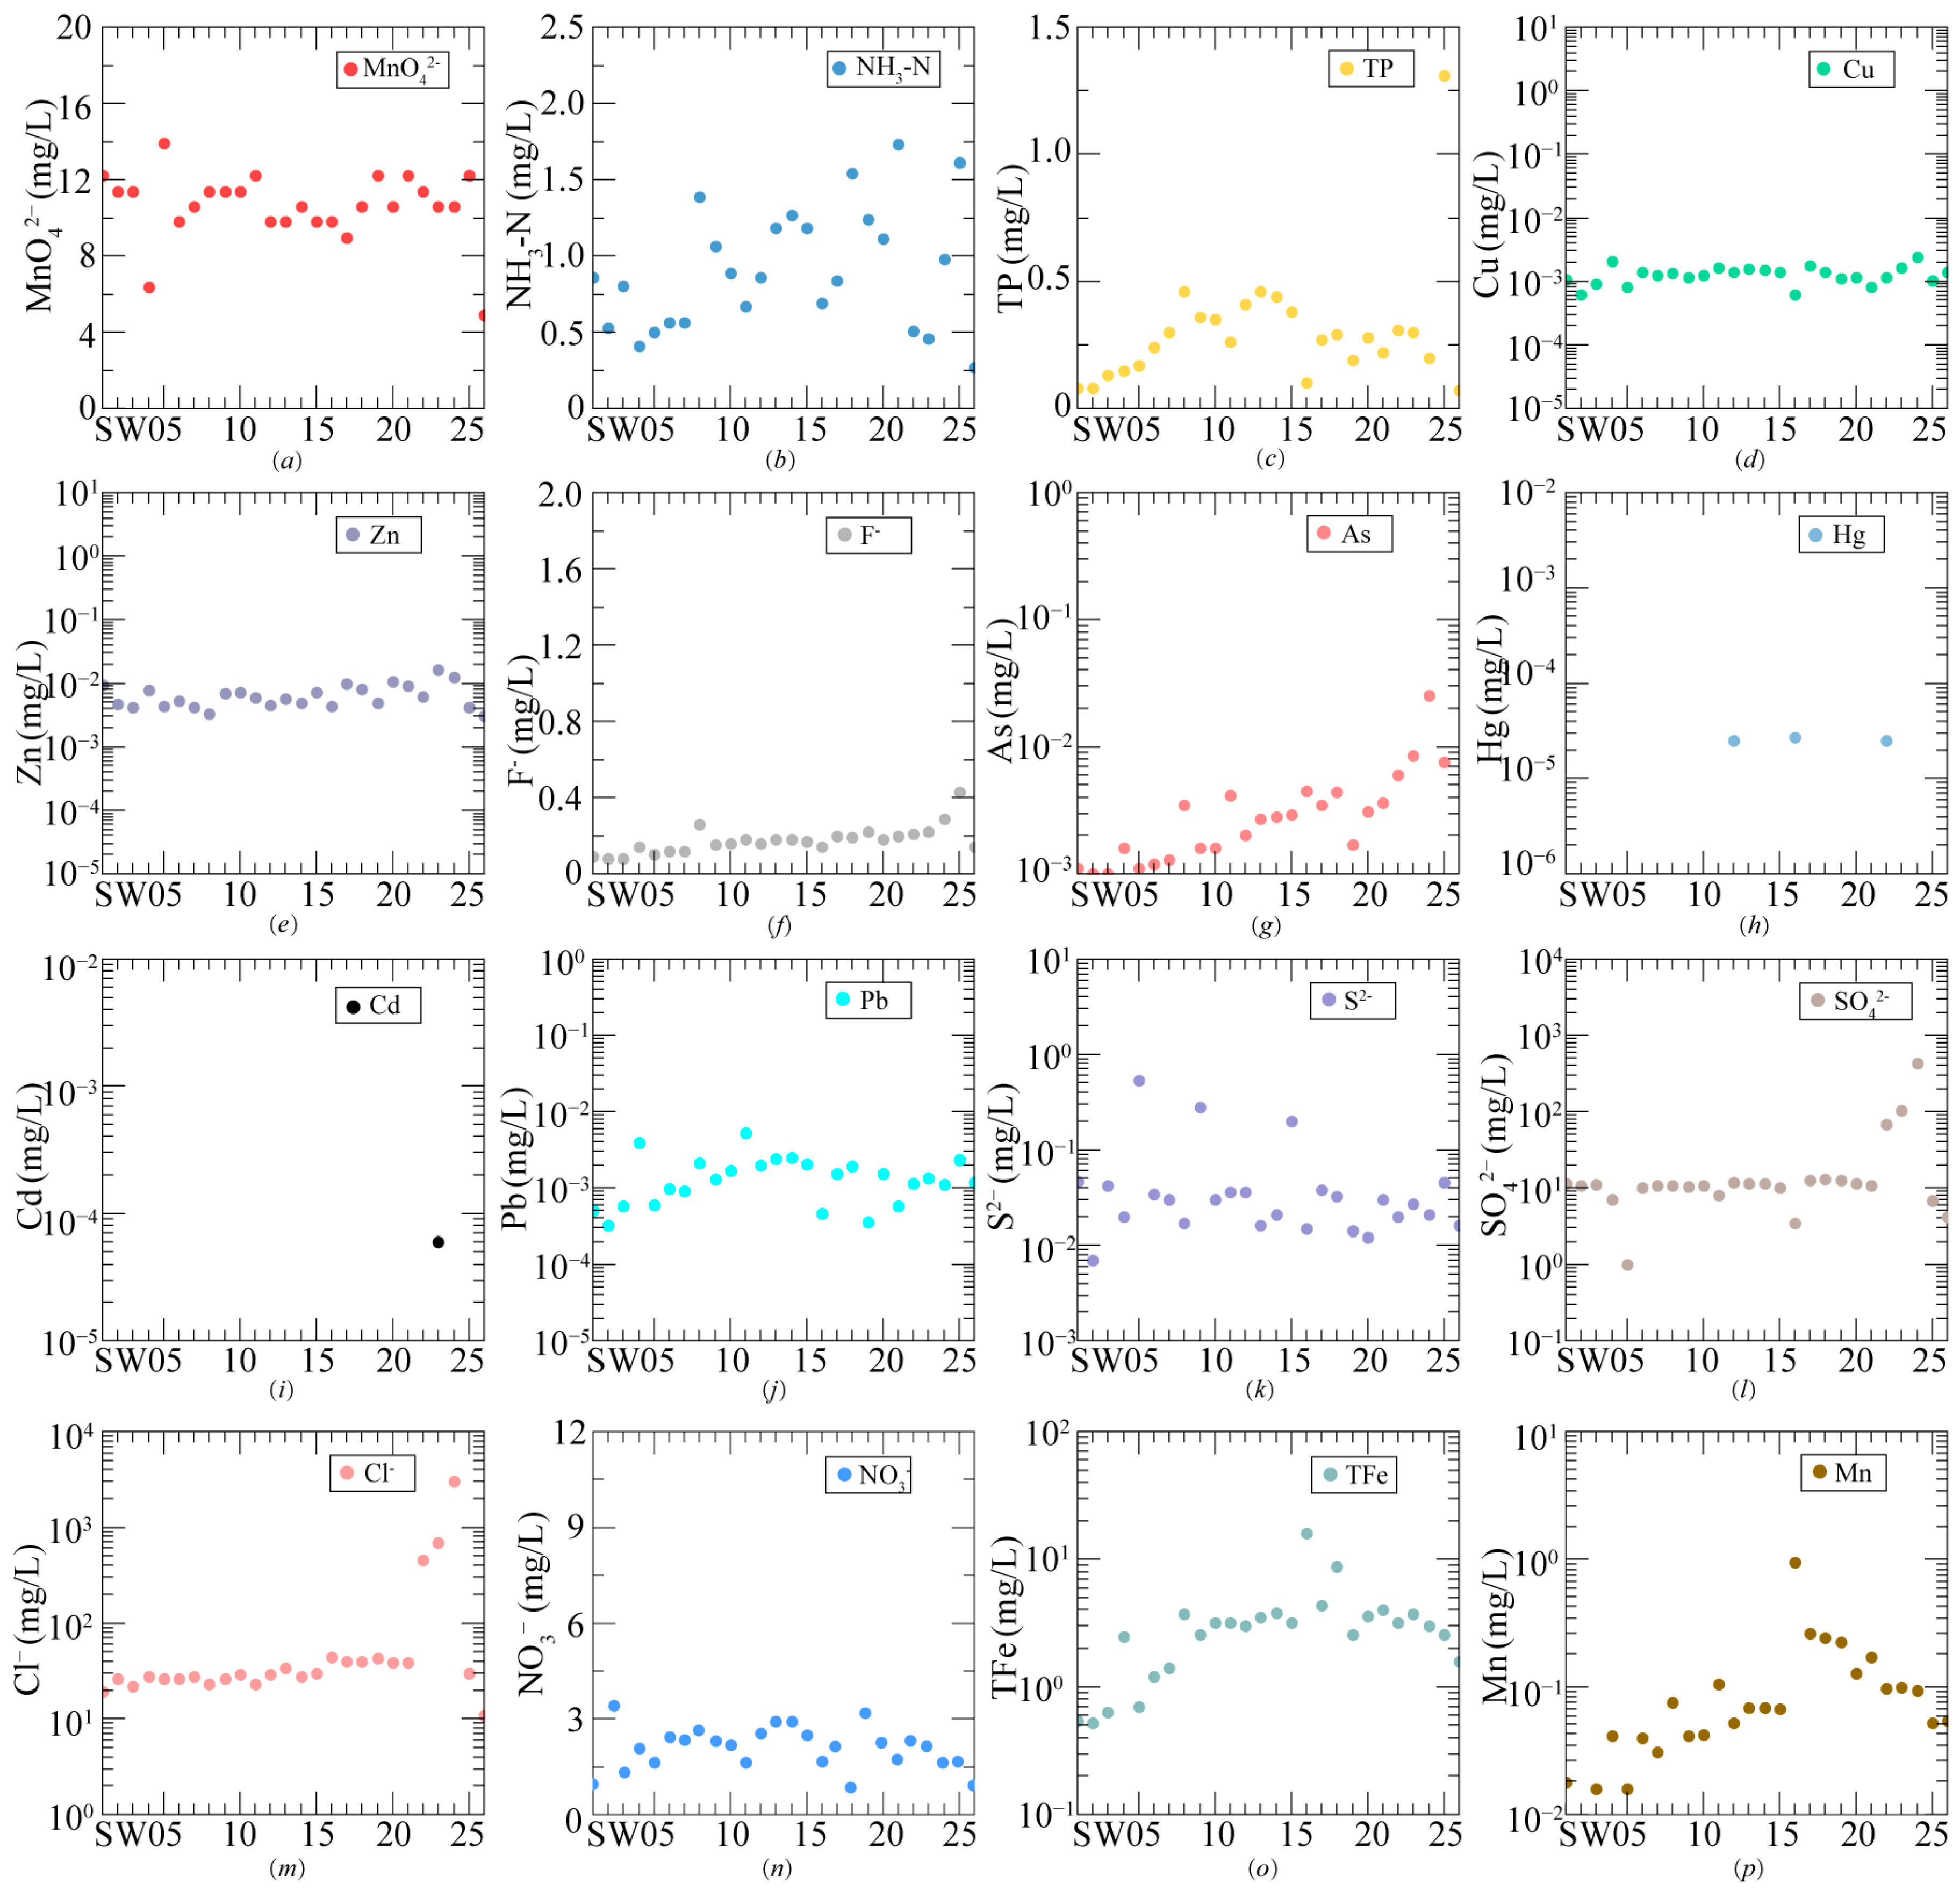
3.3.1. Evaluation Factors
3.3.2. Water Quality Classification
3.3.3. Synthetic Evaluation
- (1)
- SFE method
- (2)
- FCE method
3.4. Data Analysis and Statistical Tools
4. Results
4.1. Testing Results
- (1)
- Dry season
- (2)
- Wet season
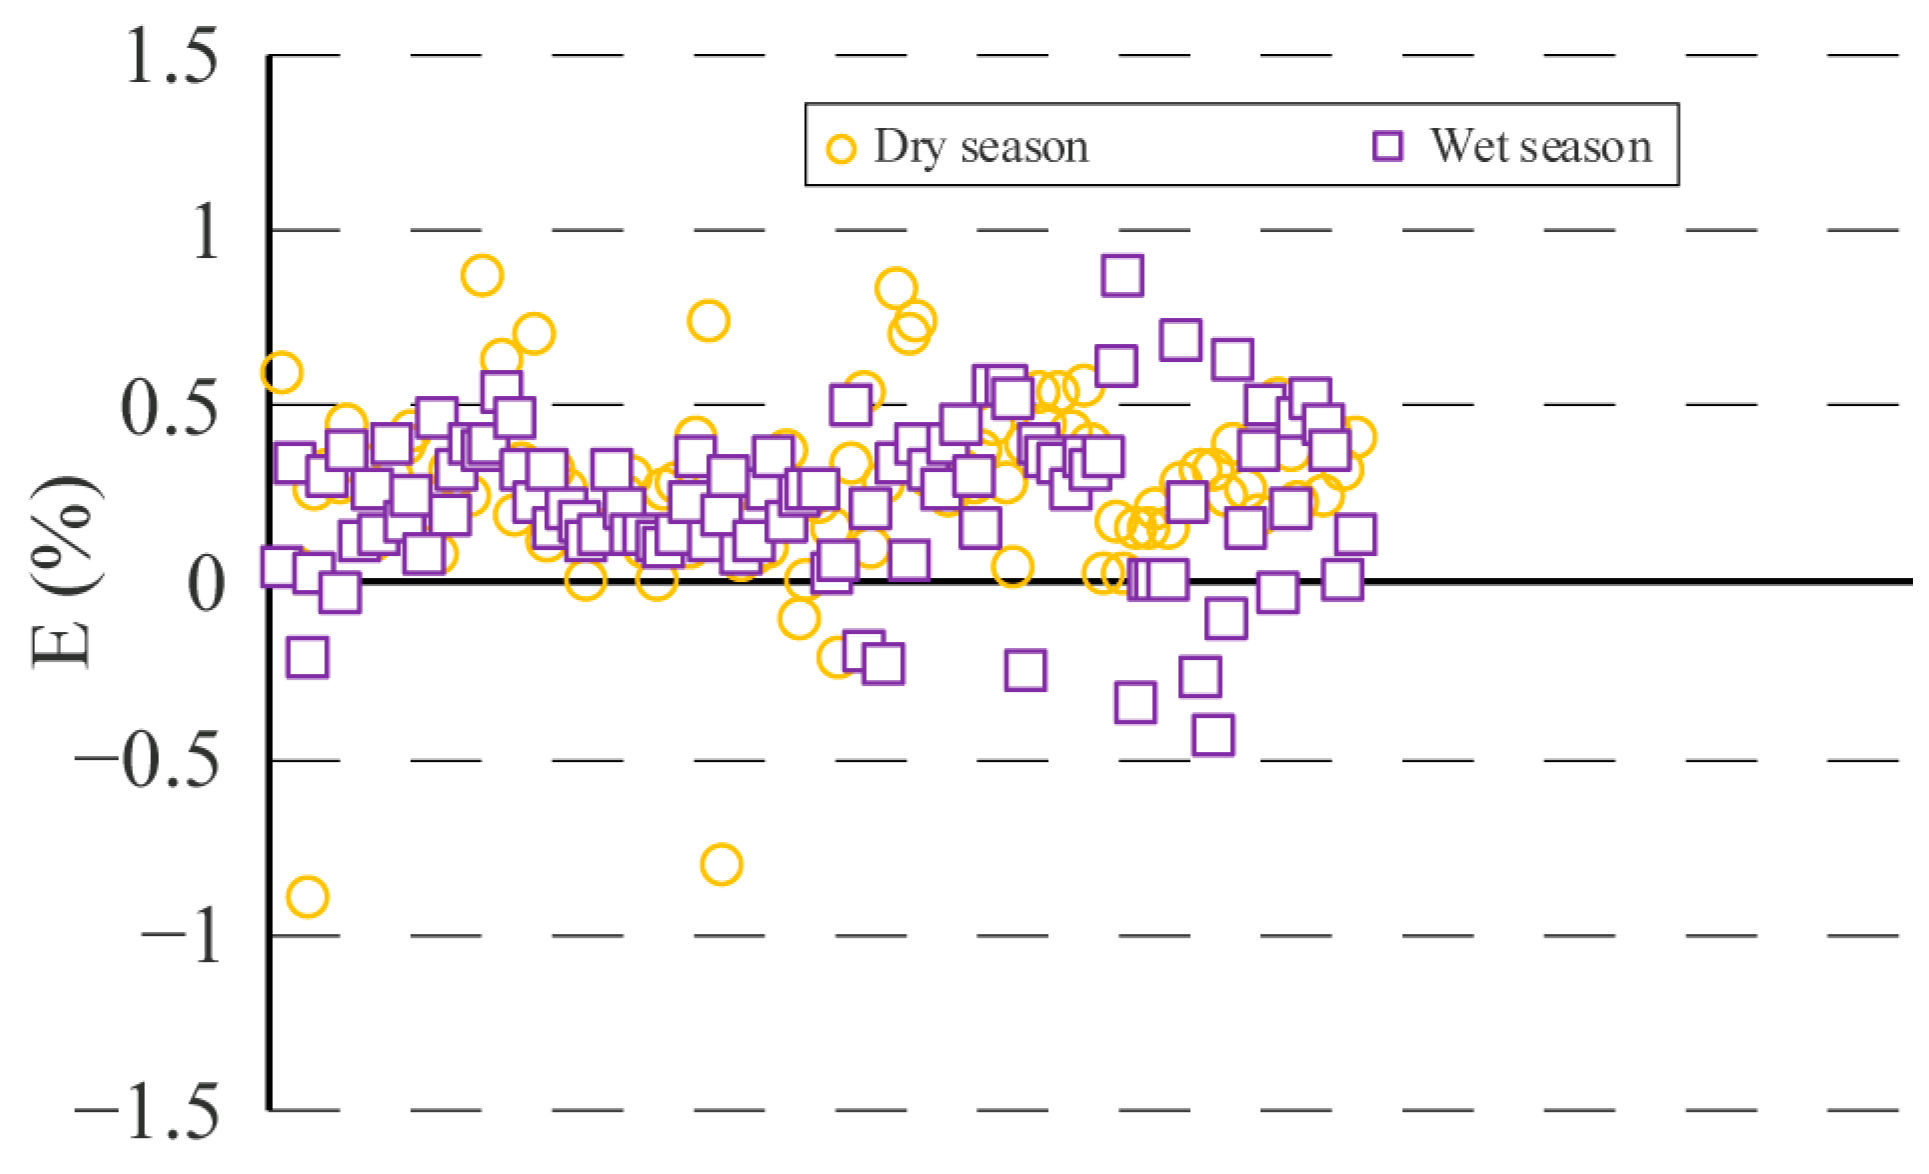
4.2. Data Reliability Results
4.3. Evaluation Results
4.3.1. Temporal Variations of SWQ
- (1)
- Dry season results
- (2)
- Wet season results
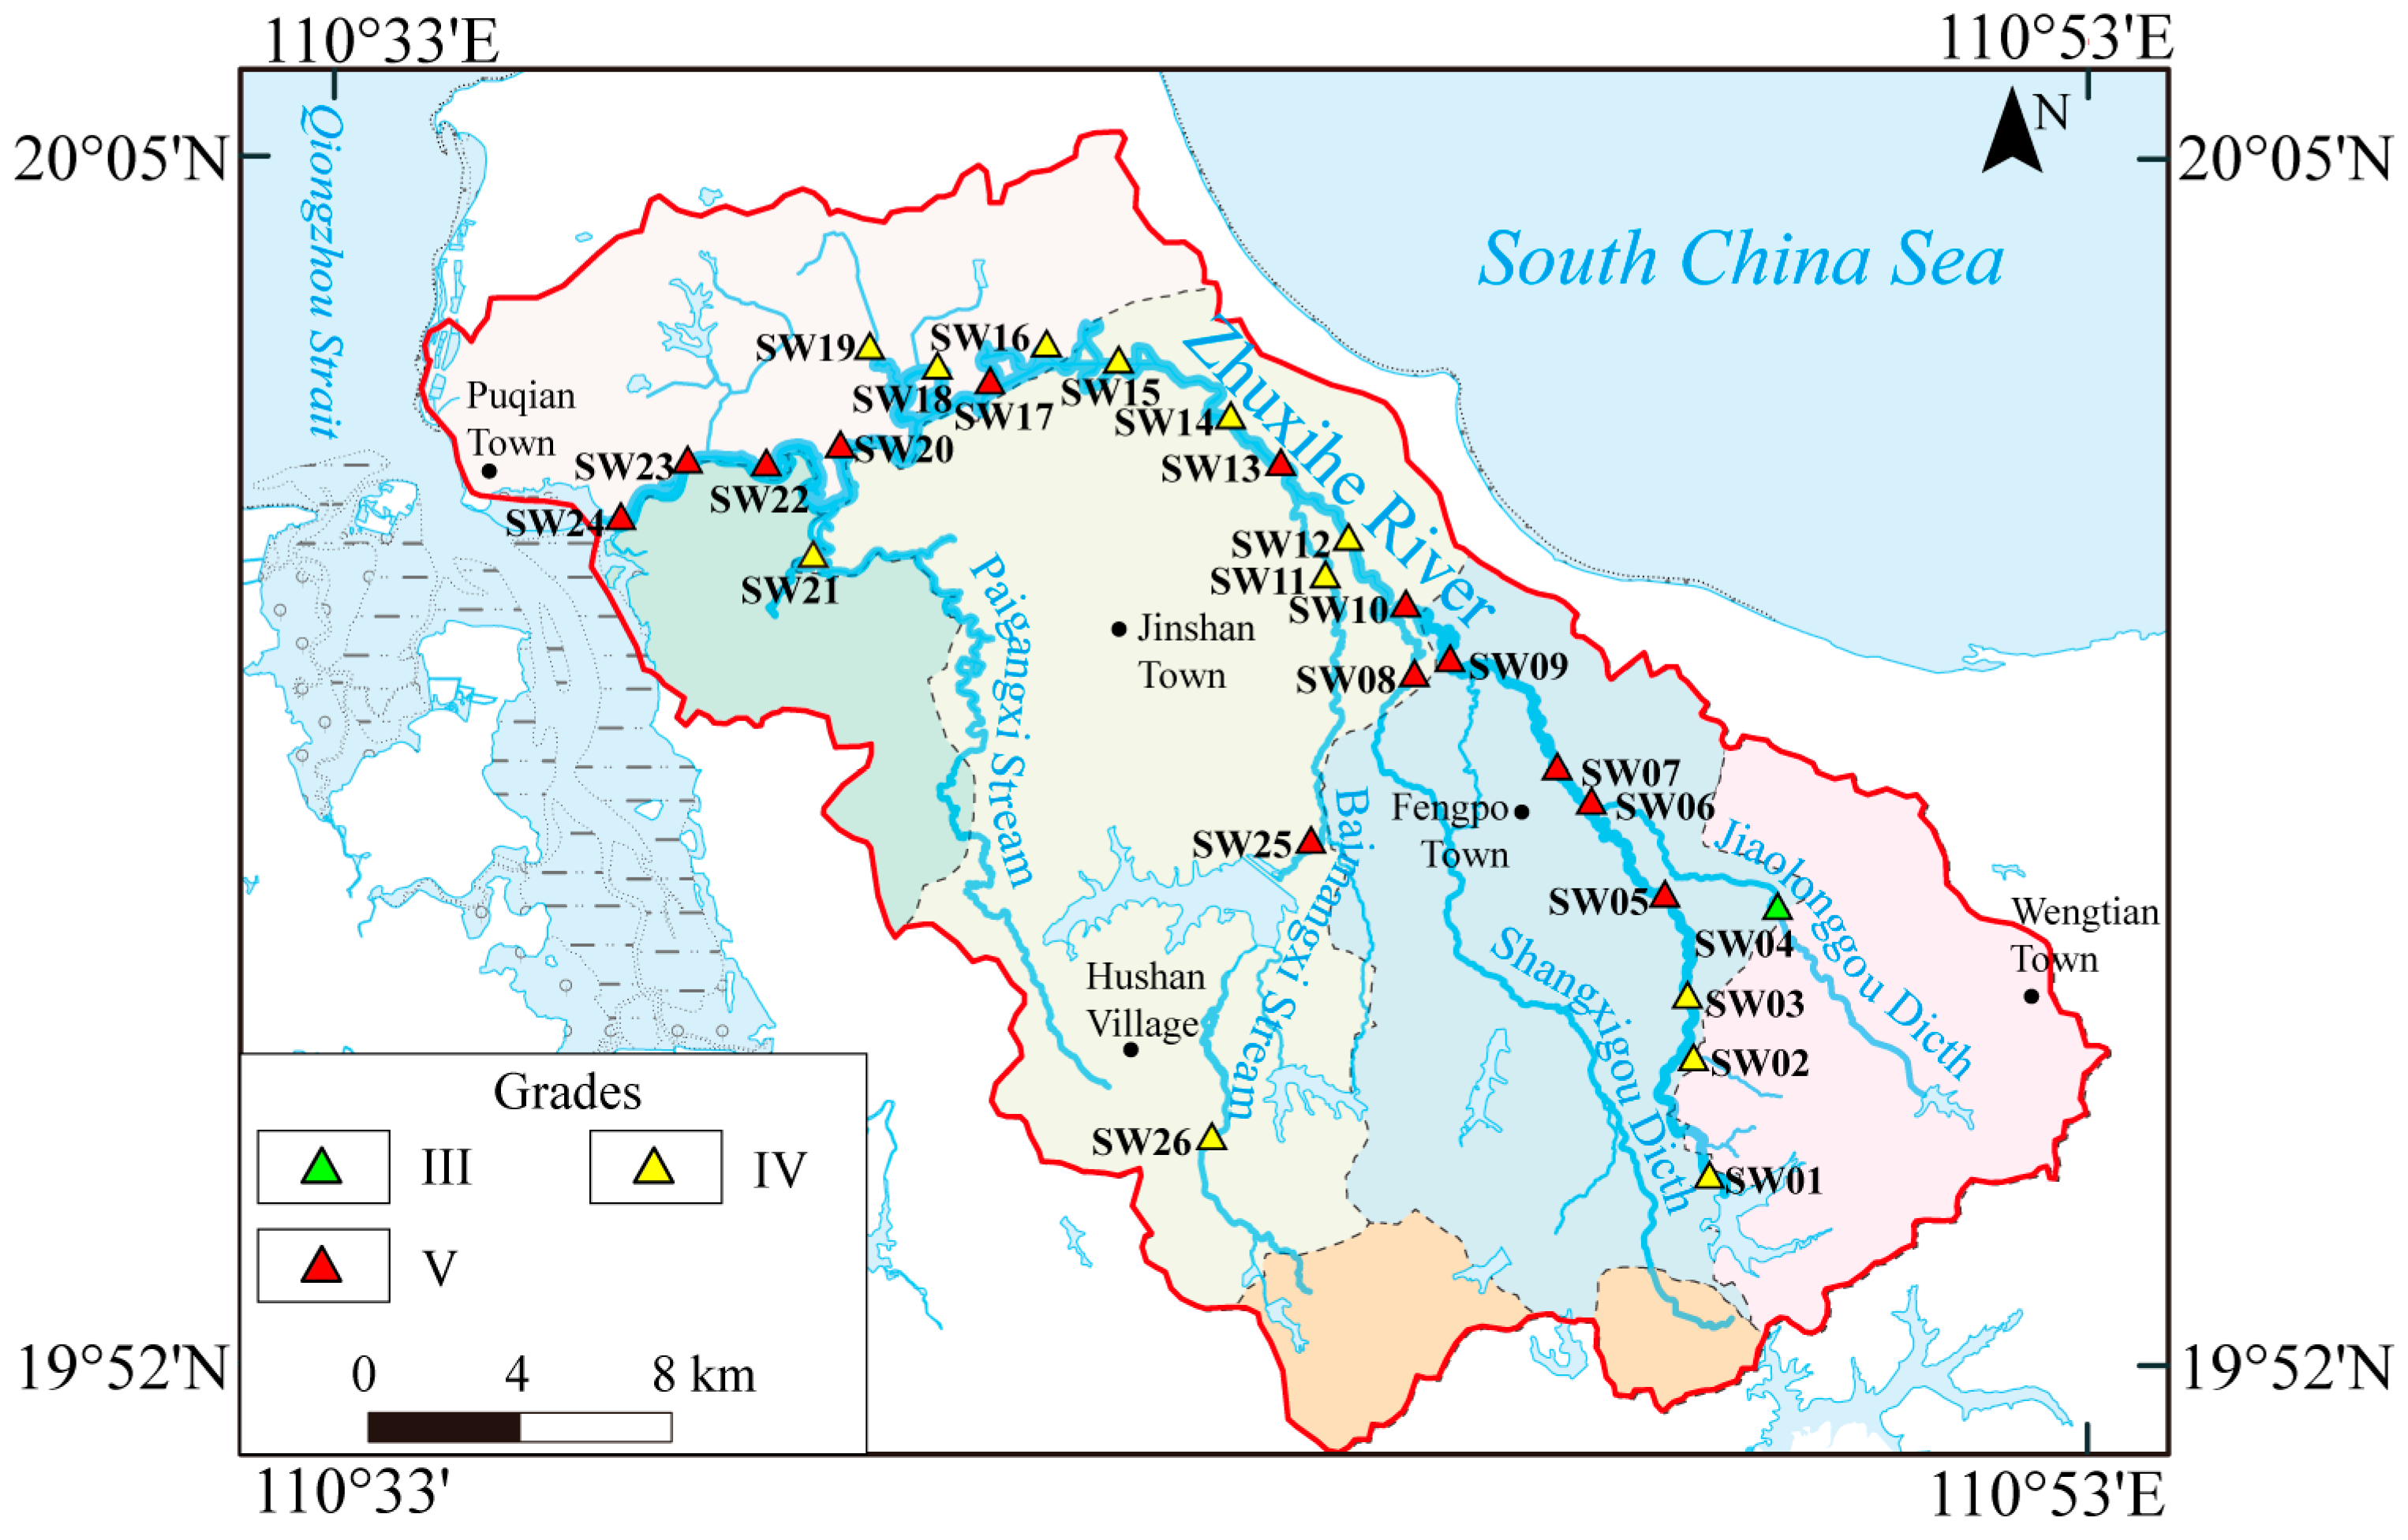
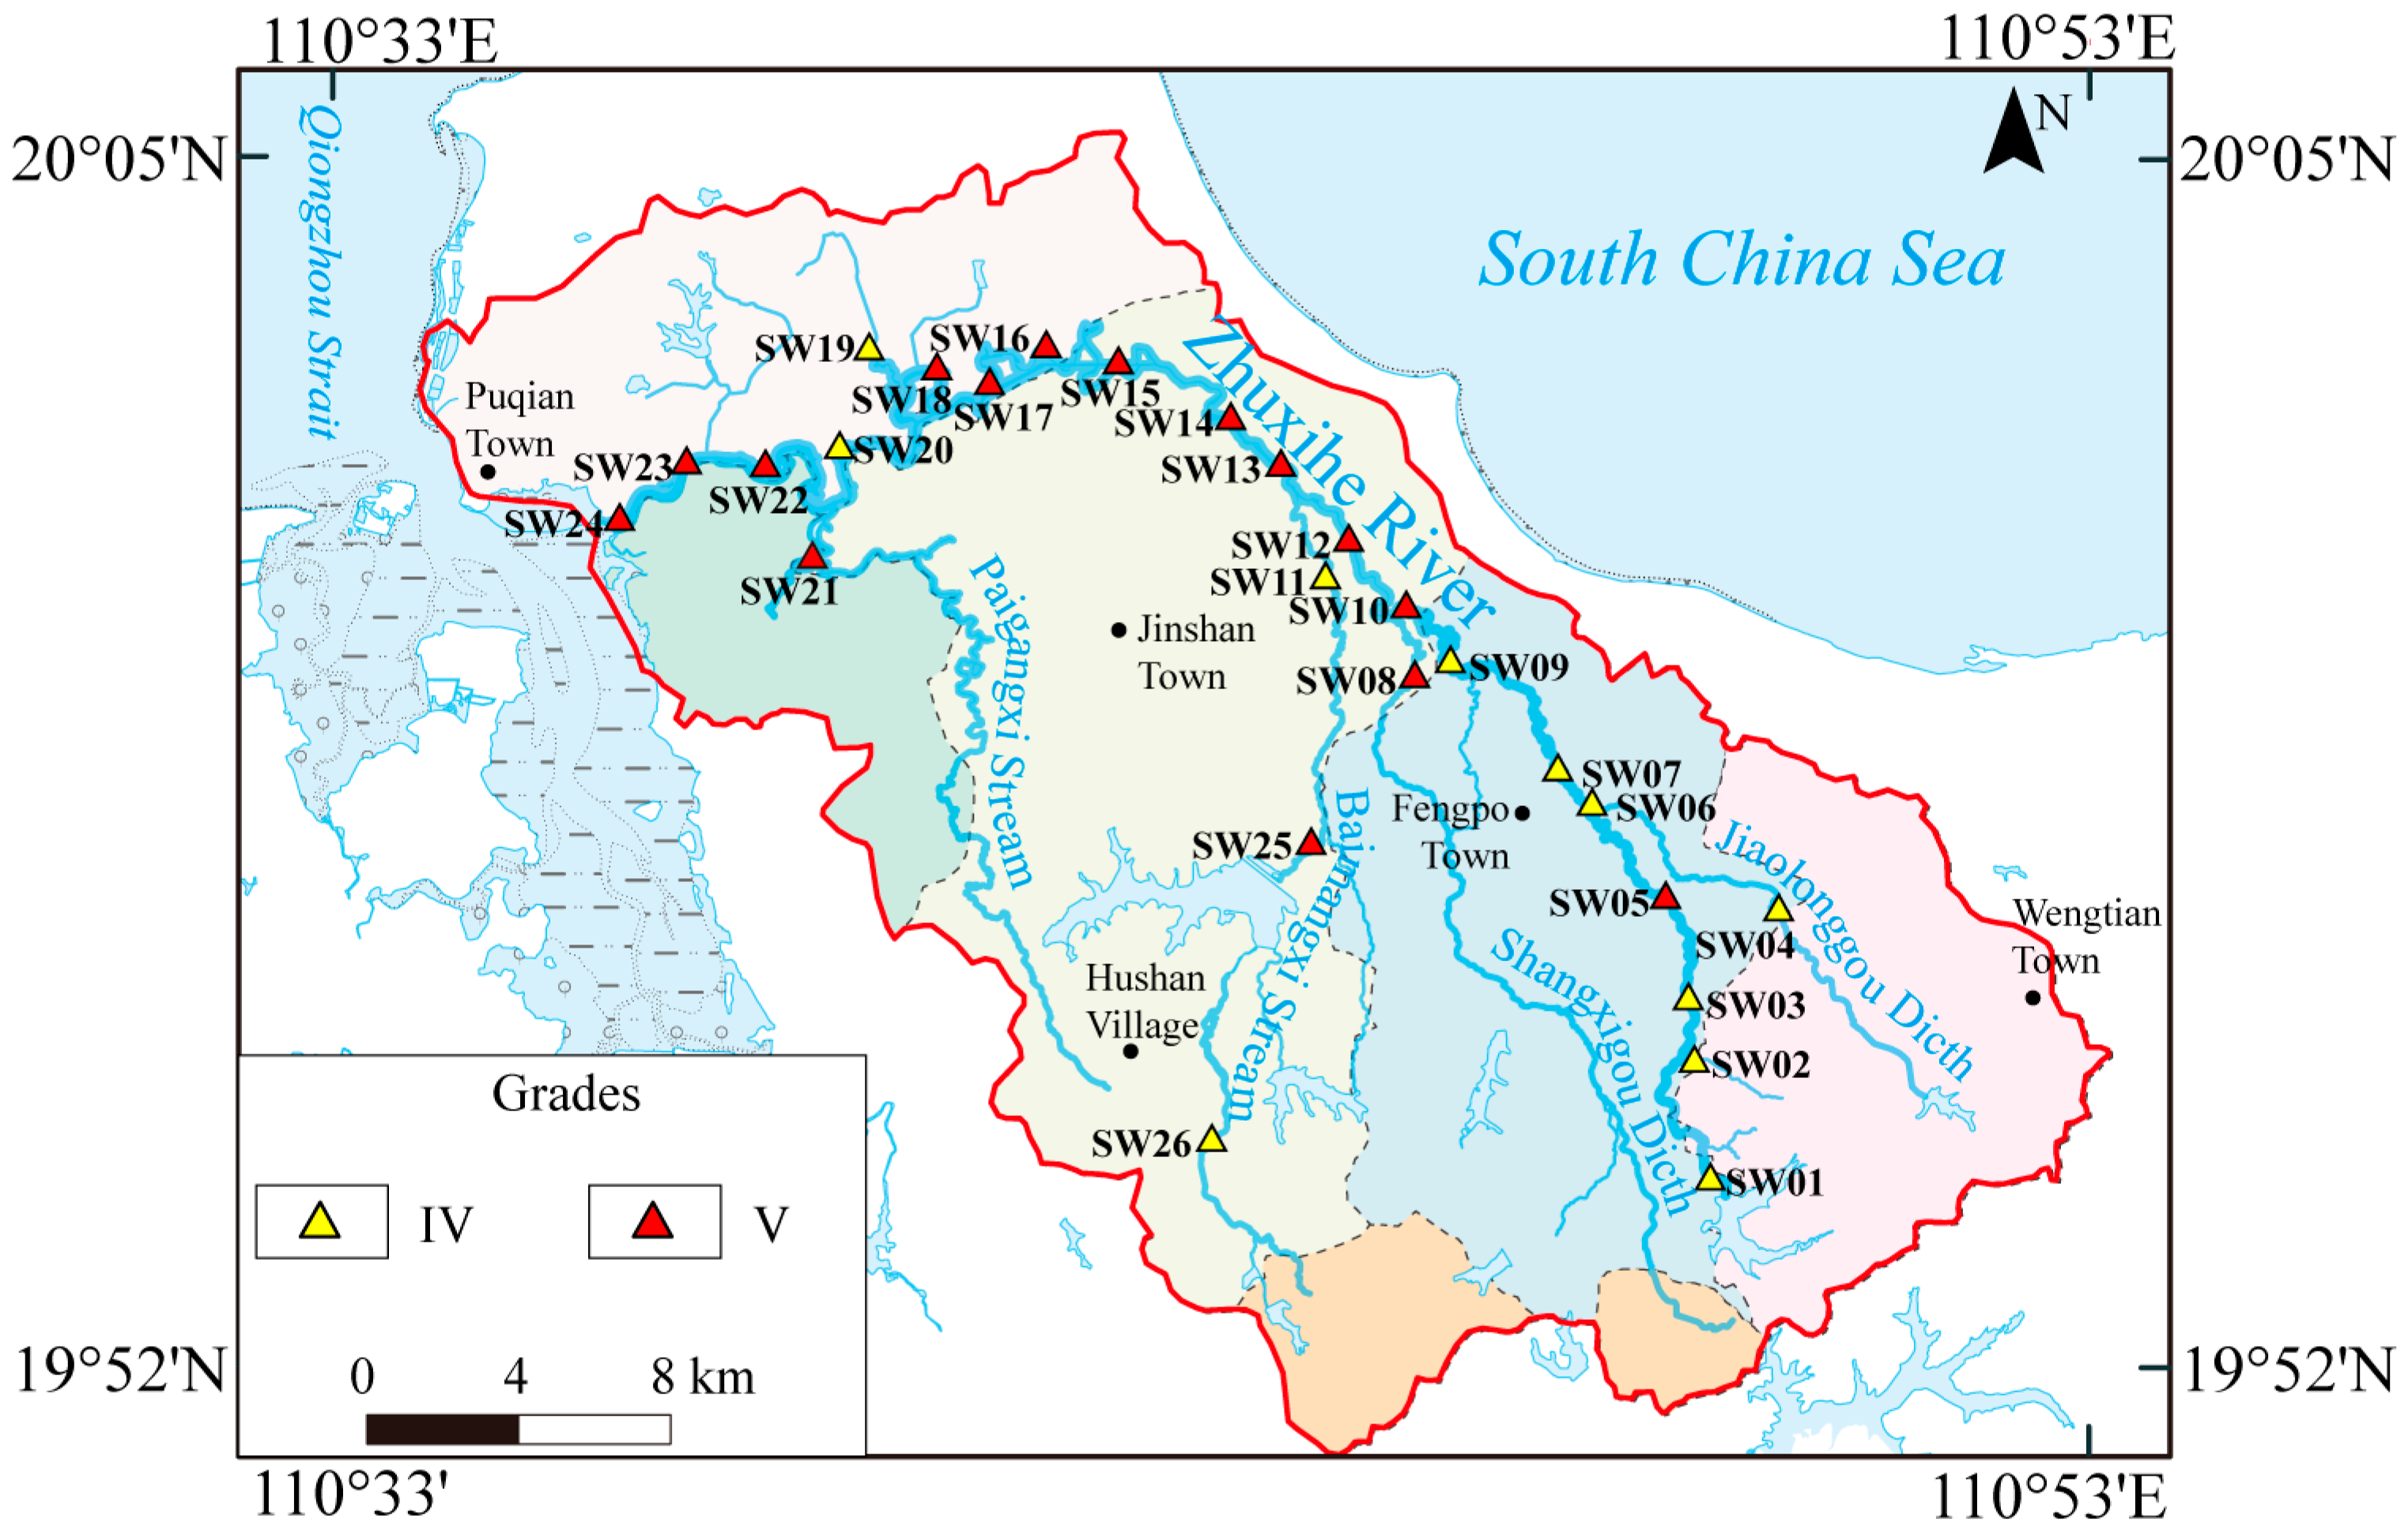
4.3.2. Spatial Distribution of SWQ
- (1)
- Distribution of SWQ During Dry Season
- (2)
- Distribution of SWQ during the wet season
4.3.3. Temporal Variations of DWQ
- (1)
- Dry season results
- (2)
- Wet season results
4.3.4. Spatial Distribution of DWQ
- (1)
- Distribution of DWQ during the dry season
- (2)
- Distribution of DWQ during the wet season
5. Discussion
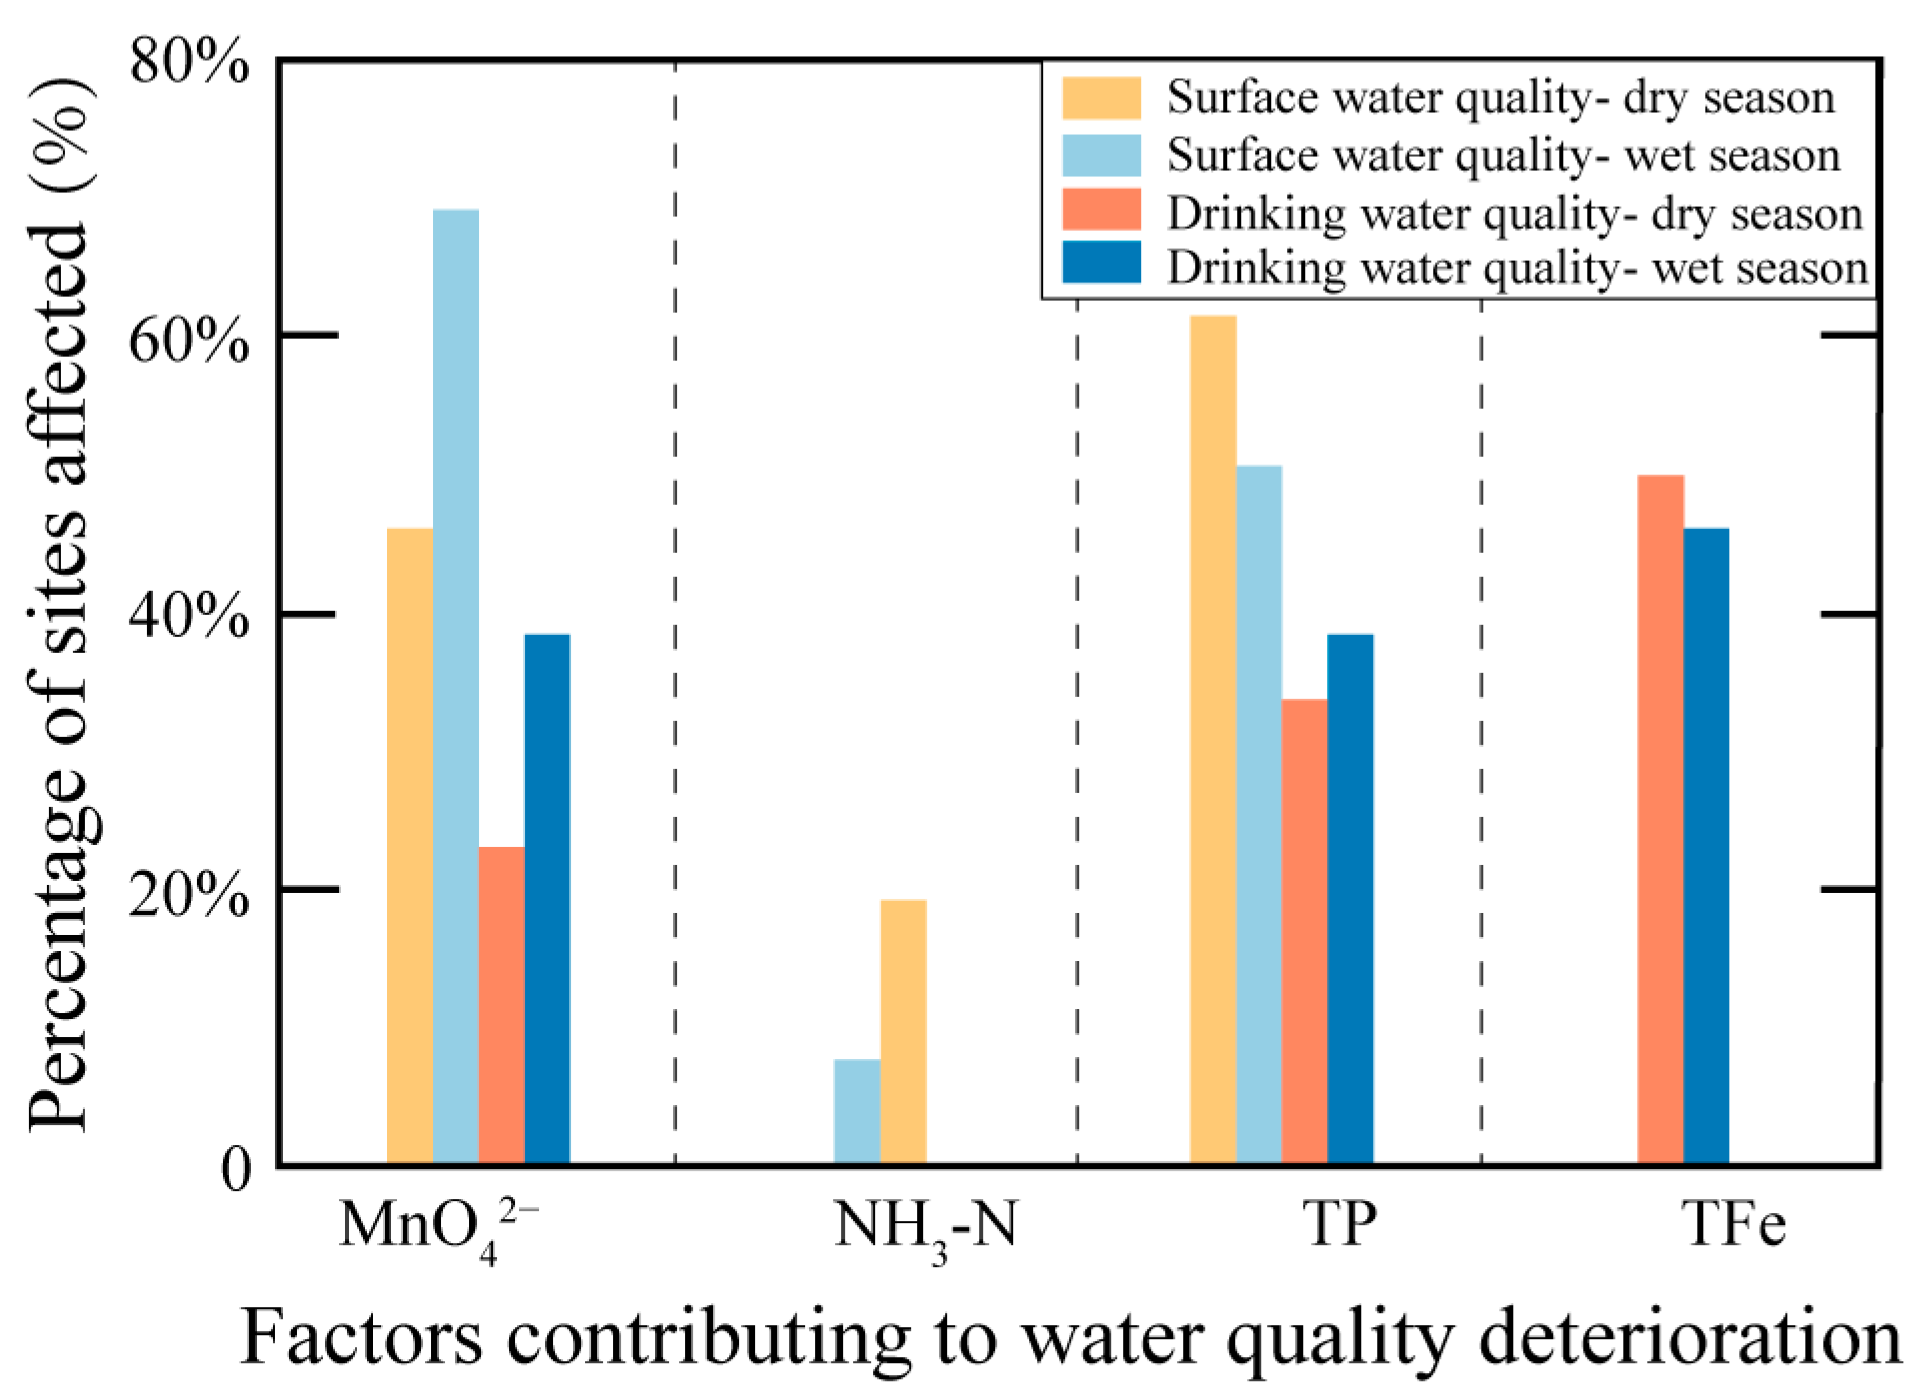
5.1. Contribution of Factors to Water Quality Deterioration
5.2. Temporal and Spatial Characteristics of Main Contributing Factors
- (1)
- Temporal variation
- (2)
- Spatial variation
5.3. Suggestions for Future Work
- (1)
- Isotopic tracing for pollution source identification
- (2)
- Long-term monitoring and data integration
- (3)
- Integrated strategies for water quality improvement
6. Conclusions
- (1)
- SWQ is primarily affected by chemical factors, such as MnO42−, NH3-N, and TP, with high levels of concentrations in both dry and wet seasons. Specifically, MnO42− has the most significant impact during the wet season. Additionally, TP and NH3-N exhibit seasonal fluctuations. This finding suggests that agricultural runoff and wastewater discharge might be reasons for water deterioration.
- (2)
- Evaluation results reveal that the water in Zhuxihe River is unsuitable for drinking purposes. DWQ is mainly affected by TFe, MnO42−, and TP, with TFe identified as the predominant pollutant. This finding suggests that the river’s hydrodynamic conditions and the accumulation of pollutants in sediments might contribute to the deterioration of water quality.
- (3)
- Spatial distribution analysis indicates that the downstream section of the river experiences higher levels of pollution, reflecting an increase in local inputs and the cumulative effects of upstream pollution sources.
- (4)
- Potential solutions, including phytoremediation, microbial remediation, and source reduction of pollutants, could be considered key strategies for addressing water quality issues in the Zhuxihe River. Furthermore, future research should focus on optimizing these techniques, assessing their long-term effectiveness, and exploring the integration of these strategies with other environmental management practices to achieve sustainable improvements in water quality.
Author Contributions
Funding
Data Availability Statement
Acknowledgments
Conflicts of Interest
References
- Macklin, M.G.; Lewin, J. The rivers of civilization. Quat. Sci. Rev. 2015, 114, 228–244. [Google Scholar] [CrossRef]
- Gibling, M.R. River systems and the Anthropocene: A late Pleistocene and Holocene timeline for human influence. Quaternary 2018, 1, 21. [Google Scholar] [CrossRef]
- Ge, J.; Hu, Y. A Historical Survey of the Yellow River and the River Civilizations: Understanding China; Springer: Singapore, 2021; p. 8. [Google Scholar]
- Wang, H.; He, G. Rivers: Linking nature, life, and civilization. River 2022, 1, 25–36. [Google Scholar]
- Zheng, H.; Tatzlaff, D.; Birkel, C.; Chmieleski, J.; Comte, J.C.; Freymueller, J.; Goldhammer, T.; Schmidt, A.; Wohl, E.; Chris, S. Hydrological connectivity and biogeochemical dynamics in the function and management of the lower Oder floodplain. J. Hydrol. 2025, 653, 132708. [Google Scholar]
- Giri, S. Water quality prospective in Twenty First Century: Status of water quality in major river basins, contemporary strategies and impediments: A review. Environ. Pollut. 2021, 271, 116332. [Google Scholar]
- Sarker, B.; Keya, K.N.; Mahir, F.I.; Nahiun, K.M.; Shahida, S.; Khan, R.A. Surface and Ground Water Pollution: Causes and Effects of Urbanization and Industrialization in South Asia. Sci. Rev. 2021, 7, 32–41. [Google Scholar]
- Saxena, V. Water quality, air pollution, and climate change: Investigating the environmental impacts of industrialization and urbanization. Water Air Soil Pollut. 2025, 236, 73. [Google Scholar]
- GB 3838-2002; Environmental Quality Standards for Surface Water. MEE: Beijing, China, 2002. Available online: https://www.mee.gov.cn/ywgz/fgbz/bz/bzwb/shjbh/shjzlbz/200206/t20020601_66497.shtml (accessed on 18 January 2025).
- Li, R.H.; Liu, S.M.; Li, Y.W.; Zhang, G.L.; Ren, L.; Zhang, J. Nutrient dynamics in tropical rivers, lagoons, and coastal ecosystems of eastern Hainan Island, South China Sea. Biogeosciences 2014, 11, 481–506. [Google Scholar]
- Zhang, P.; Ruan, H.; Dai, P.; Zhao, L.; Zhang, J. Spatiotemporal river flux and composition of nutrients affecting adjacent coastal water quality in Hainan Island, China. J. Hydrol. 2020, 591, 125293. [Google Scholar]
- Tan, H.; Zhang, H.; Wu, C.; Wang, C.; Li, Q. Pesticides in surface waters of tropical river basins draining areas with rice—Vegetable rotations in Hainan, China: Occurrence, relation to environmental factors, and risk assessment. Environ. Pollut. 2021, 283, 117100. [Google Scholar]
- Yongo, E.; Jin, F.; Mutethya, E.; Wu, D.; Zhang, P.; Guo, Z. Sediment heavy metal pollution assessment in Changwang and Wuyuan Rivers in Hainan Island, China. Water 2023, 15, 1580. [Google Scholar] [CrossRef]
- Yang, Y.P.; Zeng, W.T.; Wang, X.L.; Zhang, D.Q.; Shan, N. Study on the method of comprehensive evaluation of groundwater quality: A case study in Haikou city. Groundwater 2017, 39, 1–6. (In Chinese) [Google Scholar]
- Hua, R.X.; Zhang, Y.Y.; Liu, W.; Yang, Y.H. Adaptability analysis of multiple evaluation methods in reservoir water quality evaluation. South North Water Transf. Water Sci. Technol. 2016, 14, 183–189. (In Chinese) [Google Scholar]
- Su, K.; Peng, Z.; Wang, Q.; Cao, R.; Xi, Y. Application and comparison of four assessment methods for water quality of Sancha Lake in Central Sichuan Province, China. Water Pract. Technol. 2023, 18, 2797–2808. [Google Scholar]
- Noori, R.; Berndtsson, R.; Hosseinzadeh, M.; Adamowski, J.F.; Abyaneh, M.R. A critical review on the application of the National Sanitation Foundation Water Quality Index. Environ. Pollut. 2019, 244, 575–587. [Google Scholar]
- Ji, X.; Dahlgren, R.A.; Zhang, M. Comparison of seven water quality assessment methods for the characterization and management of highly impaired river systems. Environ. Monit. Assess. 2015, 188, 15. [Google Scholar]
- Frincu, R.M. Artificial intelligence in water quality monitoring: A review of water quality assessment applications. Water Qual. Res. J. 2024, wqrj2024049. [Google Scholar] [CrossRef]
- Nasir, N.; Kansal, A.; Alshaltone, O.; Barneih, F.; Sameer, M.; Shanableh, A.; Al-Shamma’a, A. Water quality classification using machine learning algorithms. J. Water Process Eng. 2022, 48, 102920. [Google Scholar]
- Ehteram, M.; Ahmed, A.N.; Sherif, M.; El-Shafie, A. An advanced deep learning model for predicting water quality index. Ecol. Indic. 2024, 160, 111806. [Google Scholar]
- HEE. HEE’s Official Website. 2023. Available online: https://hnsthb.hainan.gov.cn/xxgk/0200/0202/hjzl/hjzkgb/202406/t20240605_3674989.html (accessed on 18 January 2025).
- Ma, J.; Wang, D.; Zhao, H. Nitrogen flow characteristics and environmental effects in agricultural systems of Zhuxi basin, Hainan Island. Nat. Sci. J. Hainan Univ. 2024, 42, 393–402. (In Chinese) [Google Scholar]
- HJ 493—2009; Water Quality Sampling—Technical Regulation of the Preservation and Handling of Samples. MEE: Beijing, China, 2009. Available online: https://www.mee.gov.cn/ywgz/fgbz/bz/bzwb/jcffbz/200910/t20091010_162157.shtml (accessed on 18 January 2025).
- Hong, T.P.; Lee, C.Y. Induction of fuzzy rules and membership functions from training examples. Fuzzy Sets Syst. 1996, 84, 33–47. [Google Scholar] [CrossRef]
- Chen, M.S.; Wang, S.W. Fuzzy clustering analysis for optimizing fuzzy membership functions. Fuzzy Sets Syst. 1999, 103, 239–254. [Google Scholar] [CrossRef]
- Prokopowicz, P.; Czerniak, J.; Mikołajewski, D.; Apiecionek, L.; Slezak, D. Theory and applications of ordered fuzzy number. In Studies in Fuzziness and Soft Computing; Kacprzyk, J., Ed.; Springer: Charm, Switzerland, 2017; p. 322. [Google Scholar]
- Huang, S.; Li, X.; Wang, Y. A new model of geo-environmental impact assessment of mining: A multiple-criteria assessment method integrating fuzzy-AHP with fuzzy synthetic ranking. Environ. Earth Sci. 2012, 66, 275–284. [Google Scholar] [CrossRef]
- Jia, H.; Liu, J.; Yin, X.; Wang, C.; Geng, H.; Chi, H.; Tang, S. Ecological evaluation of the Tongling pyrite mining district in Anhui Province. Earth Sci. Front. 2021, 28, 131–141. (In Chinese) [Google Scholar]
- Qin, T.; Zhang, C.; Ning, D.; Wang, H. A multi-criteria assessment system for the influence of mining on the geological environment: A case study of the Huodong mining area in Shanxi Province, China. All Earth 2024, 36, 1–15. [Google Scholar] [CrossRef]
- Hosseini-Moghari, S.M.; Ebrahimi, K.; Azarnivand, A. Groundwater quality assessment with respect to fuzzy water quality index (FWQI): An application of expert systems in environmental monitoring. Env. Earth Sci. 2015, 74, 7229–7238. [Google Scholar] [CrossRef]
- Xiong, X.; Wang, Y. Uncertainty analysis of water quality in water distribution system. AQUA-Water Infrastruct. Ecosyst. Soc. 2022, 71, 1453–1468. [Google Scholar] [CrossRef]
- Xie, W.Q.; Gong, Y. Measurement of permanganate index in environmental water via indirect phase-conversion strategy. J. Chromatogr. A 2024, 1728, 464987. [Google Scholar] [CrossRef]
- Pang, Z.; Cai, Y.; Xiong, W.; Xiao, J.; Zou, J. A spectrophotometric method for measuring permanganate index (CODMn) by N,N-diethyl-p-phenylenediamine (DPD). Chemosphere 2021, 266, 128936. [Google Scholar] [CrossRef]
- Choi, M.; Lee, C.; Kim, L.H.; Choi, S.H.; Bong, Y.S.; Lee, K.S.; Shin, W.J. Assessing sources of nutrients in small watersheds with different land-use patterns using TN, TP, and NO3−-N. J. Hydrol. Reg. Stud. 2024, 55, 101958. [Google Scholar] [CrossRef]
- Chen, Z.-L.; Shi, L.-L.; Peng, D.-M.; Chen, C.-L.; Zhang, J.-B.; Zhang, P. Spatial and seasonal variations in iron and the response of chlorophyll-a in Zhanjiang Bay, China. Water 2024, 16, 2338. [Google Scholar] [CrossRef]
- Li, X.; Li, K.; Li, S.; Li, Z.; Wan, L.; Guo, W. Source tracing analysis of the exceedance of NH3-N and CODMn in shallow groundwater in the central typical area of the Yangtze river delta. Sci. Rep. 2024, 14, 28544. [Google Scholar]


| Types of Factors | Factors | Numbers |
|---|---|---|
| SWQ basic factors | MnO42−, NH3-N, TP, Cu, Zn, F−, Se, As, Hg, Cd, Cr, Pd, CN−, VPs, S2− | 15 |
| DWQ supplementary factors | SO42−, Cl−, NO3−, TFe, Mn | 5 |
| Factors | Grades | ||||
|---|---|---|---|---|---|
| Best | Good | Fairly Good | Poor | Worst | |
| I | II | III | IV | V | |
| Classification Limits (Unit: mg/L) | |||||
| MnO42− | 2 | 4 | 6 | 10 | 15 |
| NH3-N | 0.1 | 0.5 | 1 | 1.5 | 2 |
| TP | 0.02 | 0.1 | 0.2 | 0.3 | 0.4 |
| Cu | 0.01 | 1 | 1 | 1 | 1 |
| Zn | 0.05 | 1 | 1 | 2 | 2 |
| F− | 1 | 1 | 1 | 1.5 | 1.5 |
| Se | 0.01 | 0.01 | 0.01 | 0.02 | 0.02 |
| As | 0.05 | 0.05 | 0.05 | 0.1 | 0.1 |
| Hg | 5 × 10⁻⁵ | 5 × 10⁻⁵ | 1 × 10⁻⁴ | 1 × 10⁻³ | 1 × 10⁻³ |
| Cd | 1 × 10⁻³ | 5 × 10⁻³ | 5 × 10⁻³ | 5 × 10⁻³ | 0.01 |
| Cr(VI) | 0.01 | 0.05 | 0.05 | 0.05 | 0.1 |
| Pd | 0.01 | 0.01 | 0.05 | 0.05 | 0.1 |
| CN− | 5 × 10⁻³ | 0.05 | 0.2 | 0.2 | 0.2 |
| VPs | 2 × 10⁻³ | 2 × 10⁻³ | 5 × 10⁻³ | 0.01 | 0.1 |
| S2− | 0.05 | 0.1 | 0.2 | 0.5 | 1 |
| SO42− | 50 | 150 | 250 | 350 | 350 |
| Cl− | 50 | 150 | 250 | 350 | 350 |
| NO3− | 2 | 5 | 20 | 30 | 30 |
| TFe | 0.1 | 0.2 | 0.3 | 2 | 2 |
| Mn | 0.05 | 0.05 | 0.1 | 1.5 | 1.5 |
| Factors | Minimum (mg/L) | Maximum (mg/L) | Average (mg/L) | NSF | RNSF (%) | NOM | RNOM (%) |
|---|---|---|---|---|---|---|---|
| MnO42− | 1.6 | 19.8 | 6.44 | 26 | 100 | 8 | 30.77 |
| NH3-N | 0.12 | 2.04 | 0.66 | 26 | 100 | 5 | 19.23 |
| TP | 0.1 | 5.61 | 0.67 | 26 | 100 | 11 | 42.31 |
| Cu | 6 × 10⁻⁴ | 2.8 × 10⁻³ | 1.5 × 10⁻³ | 26 | 100 | 0 | 0 |
| Zn | 1.5 × 10⁻³ | 9.9 × 10⁻³ | 4.4 × 10⁻³ | 26 | 100 | 0 | 0 |
| F− | 0.11 | 0.84 | 0.27 | 26 | 100 | 0 | 0 |
| Se | 1.7 × 10⁻⁴ | 4 × 10⁻⁴ | 2.8 × 10⁻⁴ | 18 | 69.23 | 0 | 0 |
| As | 4.2 × 10⁻⁴ | 0.0149 | 2.2 × 10⁻³ | 25 | 96.15 | 0 | 0 |
| Hg | 8 × 10⁻⁵ | 1.6 × 10⁻⁴ | 1 × 10⁻⁴ | 23 | 88.46 | 0 | 0 |
| Cd | Not detected | ||||||
| Cr | Not detected | ||||||
| Pd | 4.6 × 10⁻⁴ | 7.24 × 10⁻³ | 2.41 × 10⁻³ | 23 | 88.46 | 0 | 0 |
| CN− | Not detected | ||||||
| VPs | Not detected | ||||||
| S2− | 2 × 10⁻³ | 0.014 | 5.9 × 10⁻³ | 22 | 84.62 | 0 | 0 |
| SO42− | 6.2 | 2100 | 232 | 26 | 100 | 2 | 7.70 |
| Cl− | 25 | 16700 | 1831 | 26 | 100 | 3 | 11.50 |
| NO3− | 0.12 | 3.9 | 1.4417 | 23 | 88.46 | 0 | 0 |
| TFe | 0.24 | 38.1 | 3.1892 | 26 | 100 | 19 | 73.08 |
| Mn | 0.01 | 0.389 | 0.10715 | 26 | 100 | 0 | 0 |
| Factors | Minimum (mg/L) | Maximum (mg/L) | Average (mg/L) | NSF | RNSF (%) | NOM | RNOM (%) |
|---|---|---|---|---|---|---|---|
| MnO42− | 4.9 | 13.9 | 10.48 | 26 | 100 | 24 | 92.31 |
| NH3-N | 0.27 | 1.73 | 0.94 | 26 | 100 | 16 | 61.54 |
| TP | 0.07 | 1.31 | 0.33 | 26 | 100 | 15 | 57.69 |
| Cu | 6.1 × 10⁻⁴ | 2.41 × 10⁻³ | 1.41 × 10⁻³ | 26 | 100 | 0 | 0 |
| Zn | 3.06 × 10⁻³ | 0.01622 | 6.82 × 10⁻³ | 26 | 100 | 0 | 0 |
| F− | 0.08 | 0.43 | 0.19 | 26 | 100 | 0 | 0 |
| Se | Not detected | ||||||
| As | 7 × 10⁻⁴ | 0.0251 | 4.1 × 10⁻³ | 26 | 100 | 0 | 0 |
| Hg | 2.5 × 10⁻⁵ | 2.7 × 10⁻⁵ | 2.6 × 10⁻⁵ | 3 | 11.54 | 0 | 0 |
| Cd | 6 × 10⁻⁵ | 6 × 10⁻⁵ | 6 × 10⁻⁵ | 1 | 3.85 | 0 | 0 |
| Cr | Not detected | ||||||
| Pd | 3.2 × 10⁻⁴ | 5.3 × 10⁻³ | 1.7 × 10⁻³ | 26 | 100 | 0 | 0 |
| CN− | Not detected | ||||||
| VPs | Not detected | ||||||
| S2− | 7 × 10⁻³ | 0.529 | 0.066 | 26 | 100 | 1 | 3.85 |
| SO42− | 1 | 437 | 34.56 | 26 | 100 | 1 | 3.85 |
| Cl− | 11 | 3010 | 207 | 26 | 100 | 3 | 11.54 |
| NO3− | 0.83 | 3.17 | 2.1 | 26 | 100 | 0 | 0 |
| TFe | 0.52 | 16 | 3.72 | 26 | 100 | 22 | 84.62 |
| Mn | 8×10⁻³ | 0.956 | 0.132 | 26 | 100 | 1 | 3.85 |
| Sampling Sites | Dry Season | Wet Season | ||
|---|---|---|---|---|
| Grade | FRLs | Grade | FRLs | |
| SW1 | III | NH3-N, TP | IV | MnO42− |
| SW2 | IV | NH3-N | IV | MnO42− |
| SW3 | III | NH3-N, TP | IV | MnO42− |
| SW4 | III | Hg | III | MnO42− |
| SW5 | V | TP | V | MnO42− |
| SW6 | V | TP | IV | MnO42− |
| SW7 | V | TP | IV | MnO42−, TP |
| SW8 | IV | MnO42−, NH3-N | V | TP |
| SW9 | V | TP | V | TP |
| SW10 | V | TP | IV | MnO42−, TP |
| SW11 | IV | MnO42−, TP | IV | MnO42−, TP |
| SW12 | III | MnO42−, TP, Hg | V | TP |
| SW13 | V | MnO42− | V | TP |
| SW14 | IV | MnO42−, TP | V | TP |
| SW15 | III | MnO42−, TP, Hg | V | TP |
| SW16 | III | MnO42−, Hg | IV | MnO42− |
| SW17 | III | MnO42−, Hg | IV | MnO42−, TP |
| SW18 | IV | MnO42− | IV | MnO42−, NH3-N, TP |
| SW19 | III | MnO42−, TP, Hg | IV | MnO42− |
| SW20 | III | Hg | IV | MnO42−, TP |
| SW21 | III | TP, Hg | IV | MnO42−, NH3-N |
| SW22 | III | Hg | IV | MnO42−, TP |
| SW23 | V | TP | IV | MnO42−, TP |
| SW24 | V | TP | IV | MnO42− |
| SW25 | V | MnO42−, NH3-N, TP | V | TP |
| SW26 | IV | MnO42− | II | MnO42−, TP |
| Sampling Sites | Dry Season | Wet Season | ||
|---|---|---|---|---|
| Grade | FRLs | Grade | FRLs | |
| SW1 | IV | TFe | IV | MnO42− |
| SW2 | IV | NH3-N | IV | MnO42− |
| SW3 | IV | TFe | IV | MnO42− |
| SW4 | III | Hg, TFe | IV | TFe |
| SW5 | V | TP | V | MnO42− |
| SW6 | V | TP | IV | MnO42−, TFe |
| SW7 | V | TP | IV | MnO42−, TP, TFe |
| SW8 | V | TFe | V | TP |
| SW9 | V | TP | V | TP |
| SW10 | V | TP | IV | MnO42−, TP, TFe |
| SW11 | IV | MnO42−, TP, TFe | IV | MnO42−, TP, TFe |
| SW12 | IV | TFe | V | TP |
| SW13 | V | MnO42− | V | TP |
| SW14 | IV | MnO42−, TP, TFe | V | TP |
| SW15 | IV | TFe | V | TP |
| SW16 | IV | TFe | V | TFe |
| SW17 | V | Cl− | V | TFe |
| SW18 | IV | MnO42−, TFe | V | TFe |
| SW19 | IV | TFe | IV | MnO42−, TFe |
| SW20 | V | Cl− | IV | MnO42−, TP, TFe |
| SW21 | IV | Cl− | V | TFe |
| SW22 | V | SO42−, Cl− | V | Cl− |
| SW23 | V | TP, SO42−, Cl− | V | Cl− |
| SW24 | V | TP, SO42−, Cl− | V | SO42−, Cl− |
| SW25 | V | MnO42−, NH3-N, TP, TFe | V | TP |
| SW26 | IV | MnO42−, TFe | IV | TFe |
Disclaimer/Publisher’s Note: The statements, opinions and data contained in all publications are solely those of the individual author(s) and contributor(s) and not of MDPI and/or the editor(s). MDPI and/or the editor(s) disclaim responsibility for any injury to people or property resulting from any ideas, methods, instructions or products referred to in the content. |
© 2025 by the authors. Licensee MDPI, Basel, Switzerland. This article is an open access article distributed under the terms and conditions of the Creative Commons Attribution (CC BY) license (https://creativecommons.org/licenses/by/4.0/).
Share and Cite
Qin, T.; Yang, Y.; Shan, N.; Ding, H.; Shao, W.; Wang, H.; Ning, D. Water Quality Dynamics in the Zhuxihe River Basin in Hainan Province, China: Insights from Temporal and Spatial Analysis. Water 2025, 17, 923. https://doi.org/10.3390/w17070923
Qin T, Yang Y, Shan N, Ding H, Shao W, Wang H, Ning D. Water Quality Dynamics in the Zhuxihe River Basin in Hainan Province, China: Insights from Temporal and Spatial Analysis. Water. 2025; 17(7):923. https://doi.org/10.3390/w17070923
Chicago/Turabian StyleQin, Tongchun, Yongpeng Yang, Ning Shan, Haiqin Ding, Wei Shao, Haigang Wang, and Di Ning. 2025. "Water Quality Dynamics in the Zhuxihe River Basin in Hainan Province, China: Insights from Temporal and Spatial Analysis" Water 17, no. 7: 923. https://doi.org/10.3390/w17070923
APA StyleQin, T., Yang, Y., Shan, N., Ding, H., Shao, W., Wang, H., & Ning, D. (2025). Water Quality Dynamics in the Zhuxihe River Basin in Hainan Province, China: Insights from Temporal and Spatial Analysis. Water, 17(7), 923. https://doi.org/10.3390/w17070923