Article

Assessment of Mercury Contamination in the Chalk Aquifer of the Pays de Caux and Its Implications for Public Health (France)

1
AGHYLE, Institut Polytechnique UniLaSalle Beauvais, SFR Condorcet FR CNRS 341719, Rue Pierre Waguet, 60026 Beauvais Cedex, France
2
SMITVAD du Pays de Caux, Syndicat Mixte de Traitement et Valorisation des Déchets, Place de la Mairie-B.P.14, 76760 Yerville, France
3
Centre de Biologie Humaine (CBH), CHU Amiens-Picardie, 1 Rond-Point du Professeur Christian Cabrol, 80054 Amiens Cedex 1, France
*
Author to whom correspondence should be addressed.
Water 2025, 17(7), 1087; https://doi.org/10.3390/w17071087
Submission received: 10 March 2025 / Revised: 18 March 2025 / Accepted: 3 April 2025 / Published: 5 April 2025
(This article belongs to the Section Hydrology)

Abstract

:
Mercury is naturally present in soils at trace concentrations, but its cycle is increasingly disrupted by anthropogenic activities, which affect its distribution and behavior. Due to its toxic nature, mercury has become a significant focus in environmental and public health policies. Following the detection of mercury anomalies during groundwater quality monitoring at the Pays de Caux study site (France), a comprehensive multidisciplinary research effort was initiated. This included geological and hydrogeological studies aimed at tracking mercury concentrations in piezometric wells and identifying the sources of these anomalies. This study seeks to assess the groundwater quality and characteristics from ten hydrogeological wells. The evaluation will focus on key hydrogeological parameters, including pH, redox potential (Eh), suspended solids, and groundwater levels, as well as a detailed geochemical analysis of elements such as Hg, Fe, Mn, Zn, Pb, and Cu. The mobilization of mercury and other metallic traces elements is strongly governed by environmental factors. Hydrochemical analyses highlight the complex interplay of various parameters that influence the chemical forms and behavior of mercury in both soil and groundwater. The results from the piezometric measurement campaigns (Pz1 to Pz7) have provided crucial insights, enabling the development of hypotheses about mercury’s behavior in the chalk aquifer. It is hypothesized that impermeable areas may trap groundwater for extended periods, leading to the accumulation and abnormal concentration of mercury. This could cause mercury to be intermittently released, potentially affecting the surrounding environment. Mercury concentrations in groundwater are highly sensitive to pH and redox potential (Eh), with low pH and reducing conditions promoting mercury mobilization and the formation of toxic methylated species. The study suggests the chalk aquifer is generally in equilibrium with mercury, but fluctuations in mercury levels between Pz7 and Pz4 are likely due to the heterogeneity of the clay and geological factors such as mineral composition and fracturing. This research provides insights into mercury transfer in heterogeneous environments and emphasizes the need for continuous hydrogeological monitoring, including piezometer readings, to manage mercury dispersion in the aquifer.

1. Introduction

Mercury is considered among the most toxic elements [1,2,3] in the environment and especially in the soil [1] and the groundwater [4]. Thanks to its physico-chemical characteristics, this element is migrated by the atmospheric component [5]. The health risks of mercury are not negligible and can have serious long term effects on the body. Exposure to mercury, whether through inhalation of its vapor, ingestion, or skin contact, can lead to a range of symptoms, such as tremors, cognitive impairment, and kidney damage. In severe cases, mercury poisoning can cause permanent neurological damage, particularly in children and fetuses, whose developing brains are more vulnerable. Chronic exposure to mercury may also increase the risk of cardiovascular diseases and can disrupt the immune system. Given its toxic nature, it is crucial to minimize exposure and handle mercury-containing substances with extreme caution. The chemical transformation is marked by the methylmercury, which is characterized by a greater toxicity [6]. The chemical transformation of mercury into methylmercury is a significant process with profound environmental and health implications. Methylmercury is formed when inorganic mercury, typically released into water bodies through industrial pollution or natural sources, undergoes methylation by microorganisms in aquatic ecosystems. Afterwards, it enters the food chain [7] through sewage, irrigation, and respiration, thus posing hazards to human health. Minamata disease is one of the contaminations which was caused by the presence of methylmercury in seafood, concerning thousands of residents in Minamata Bay (Kyushu, Japan) in the 1950s to 1960s.
Many studies have been conducted across various geological environments to better understand the factors governing the transfer and transformation of mercury, particularly in surface water systems. These investigations reveal that key environmental conditions, such as pH, temperature, organic matter content, and microbial activity, play significant roles in the behavior of mercury in aquatic ecosystems and in geological environments, like mining environments, particularly those associated with coal mining [1,8,9,10].
The presence of mercury can be naturally explained, especially in volcanic environments [11,12,13]. Volcanic eruptions release mercury into the atmosphere via gases, which are then deposited into ecosystems through precipitation. In these areas, mercury interacts with soil and water, contributing to the natural mercury cycle. Combined with human influences, these natural sources can significantly affect local ecosystems, especially in volcanic regions.
Mercury has been extensively studied in numerous works across various scientific disciplines due to its significant environmental and health impacts. Research has focused on its sources, transport mechanisms, and toxicological effects (toxic elements are correlated with pH and Eh [4]. Other studies have highlighted how geological formations and processes affect the distribution, mobilization, and transformation of mercury in the environment [14].
Mercury-cycle modeling has been studied in various geological contexts, considering factors like aquifer types, mineral interactions, and environmental conditions. For example, in southeastern Texas, the release of mercury from sand aquifers into groundwater involves processes like the reduction of Fe2O3/FeO(OH) and adsorption onto iron minerals, such as geothite and hematite [15]. In coastal aquifers, such as those in southern Tuscany, Italy, the interaction between freshwater and seawater can influence mercury behavior, with groundwater mineralization and the formation of Hg-Cl complexes increasing mercury content in the aqueous phase [16]. Similarly, in volcanic and coastal environments, including regions in Italy and Guadeloupe [17], mercury is mobilized due to the presence of sulfide minerals in rocks, where it can be released as elemental or gaseous mercury [17,18,19]. In northeast Algeria, mercury in the Paleocene–Eocene aquifer is influenced by atmospheric mercury recycling and pollution from a mercury plant [20]. Overall, the geological setting, including rock types and mineral compositions, plays a critical role in mercury distribution, mobility, and behavior in various environments.
The interaction between geological formations and mercury is of significant concern for environmental pollution [21,22], especially in areas where anthropogenic mercury contamination occurs, such as mining districts. In such areas, mercury may leach from mercury-rich ores or contaminated soil into aquatic systems, affecting both the local ecosystem and human health. A detailed understanding of local geology is thus essential for managing mercury contamination and predicting its environmental behavior [23].
The research investigation in the study area was initiated to explore the spatial distribution and environmental assessment of mercury, considering local geological, lithological, and hydrological (characterization of the groundwater flow and definition of the aquifer formations) chemical factors. Fieldwork in the study area involved extensive sampling of soil and water to assess mercury concentrations and understand its mobilization through the aquifer (chalk formations). To ensure the accuracy of the findings, we employed both qualitative and quantitative methods in the investigation, including geochemical analysis, soil and water sampling, and in situ monitoring about the non-hazardous waste storage (NHWF) of Brametot in Normandy (Northwestern Europe). The hydrogeological investigations aimed to determine also the correlation between mercury levels, physicochemical parameters (pH, Eh, Suspended Solid Elements), metallic trace elements (Fe, Mn, and Hg), groundwater levels in piezometers of the Brametot site, and local geological features. In this study, the geological structure of the site could provide more information about the transfer of chemical elements and water–rock interactions.
This study relied on both laboratory (of UniLaSalle Institute) analyses and environmental investigations in the field to track mercury movement and identify potential hotspots of contamination in relation to lithological properties in the region. This study aims to assess mercury concentrations in groundwater to evaluate potential contamination levels and their impact on public health. This underscores the importance of careful monitoring and management of mercury pollution to safeguard both human health and the environment around the Brametot site.

2. Description of the Study Site

The study area is located on the outskirts of the Brametot town, southwest of Dieppe, in the Seine-Maritime department of France (Figure 1).
The commune’s land use, as revealed by the European biophysical land cover database Corine Land Cover (CLC), is marked by the importance of agricultural land (100% in 2018), a proportion identical to that in 1990 (100%). The detailed breakdown in 2018 is as follows: arable land (71%), heterogeneous agricultural areas (21.8%), and grassland (7.2%).
Brametot benefits from an oceanic climate characterized by relatively cold temperatures year-round. The average annual midday temperature is 11.9 °C, with winter temperatures averaging around 6 °C and summer temperatures reaching approximately 18 °C (Figure 2a).
The meteorological data provided by Meteoblue indicates that rainfall in 2023 totaled approximately 964.2 mm, showing irregular precipitation distribution between 1979 and 2023 (Figure 2b). A peak of around 1107.2 mm was recorded in 2001. The trend line shows a slight decline, indicating that conditions at Brametot have become progressively drier over time.
The average temperature in the region was approximately 9.2 °C in 1979 and increased to 12.2 °C in 2023. Figure 2 shows a positive trend line, indicating that temperatures in the Brametot region have been rising, likely due to climate change.

3. Description and Characteristics of the Brametot Site (NHWF)

The site houses a waste storage and burial center, specifically a non-hazardous waste storage facility (NHWF). The activities conducted at the site include garbage collection, storage of non-hazardous waste (Figure 3), incineration, and waste combustion [24]. The NHWF has been in operation since 1978 [25], and its primary role is to manage residual household waste and bio-waste from the communes of the Pays de Caux.
The treatment plant handles only a portion of the waste. The remaining waste rejected by the mechanical–biological sorting process (MBSP) is shredded [26] and then buried in storage compartments, known as lockers (Figure 3). The types of waste rejected by the sorting process and sent to the bins may include wood, plastic, rubber, paper, or leather [26]. The storage site consists of four lockers, which are made watertight using an active barrier composed of alternating geotextiles and geomembranes.
The potential sources of mercury include these five lockers, as well as the leachate and rainwater storage basins, the embankments, and the extraction, anaerobic digestion, and composting plants (Figure 3). From an environmental standpoint, the site is also equipped with several piezometers that monitor the chalk aquifer, with particular attention to mercury levels.

4. Geological and Hydrogeological Settings

On a regional scale, the geological formations rest on a bedrock primarily composed of Cretaceous chalk (including the CE, Santonian formation, Figure 4), which is approximately 200 m thick. This complex is overlain by flint, clay, and colluvium sand (Rs), as well as undifferentiated silts from the plateaus (LP) (Figure 4). Locally, a geological section has been created through the analysis and interpretation of survey data obtained from SMITVAD (Figure 5a). A description of the geological formations encountered at the site is provided in the technical log (e.g., Pz0, Figure 5b).
According to BRGM Notice No. 0058 [27], the thickness of the silts, identified as LP, on the site ranges from 0.1 to 0.8 m, directly covering the area. The flint–sandy clay, labeled as RS, exhibits a heterogeneous nature due to reworking processes during the Quaternary period, particularly as a result of formation and dissolution. Additionally, the hydrological properties of loose formations contribute to karstification phenomena in the chalky formations. Depending on the area, the flint clay may be sandy or rich in flint, with its thickness varying between 7 and 21 m. The Santonian chalk formation, referred to as CE, is rich in flint and is impacted by karstification. This process leads to the formation of karsts, which appear as natural cavities filled with clay, explaining the uneven thickness of the formation. The permeability of the chalk, influenced by its internal structure, is further enhanced by fractures and karst phenomena, promoting the flow of water [24]. This supports the presence of a karstic structure to the north of the site, which could serve as a preferential pathway for the migration of mercury toward the valley.

5. Materials

Geological descriptions in the Brametot area involve recording key formations, with ten piezometers (Pz0 to Pz7) positioned and georeferenced using a Garmin Extrex GPS. Water samples are collected from the chalk groundwater via piezometers (SMITVAD), designed for monitoring water quality. Technical details of these wells are in Table 1. Groundwater levels are measured with a multi-parameter piezometric probe, and the chalk aquifer is purged and sampled using the MP1 pump.
Geological descriptions in the field consist of recording the principal formations in the Brametot area.
This multidisciplinary approach combines field Figure 6a,b) and laboratory experiments. Physico-chemical parameters (temperature, conductivity, pH) were recorded at both site piezometers and the hydrogeological platform (UniLaSalle Beauvais, France). Geochemical analyses of elements like Hg, Mg, Ca, Ti, Cr, Mn, Fe, Co, Ni, Zn, Cu, As, Se, Cd, Sb, Tl, Pb, and others were conducted using ICP-MS. Measurement uncertainty is calculated based on international reference solutions, with uncertainties ranging from <5% to <30%. Groundwater levels were measured using a piezometric probe, and water samples were collected using a submersible pump for purging and sampling.

6. Campaign Field and Results

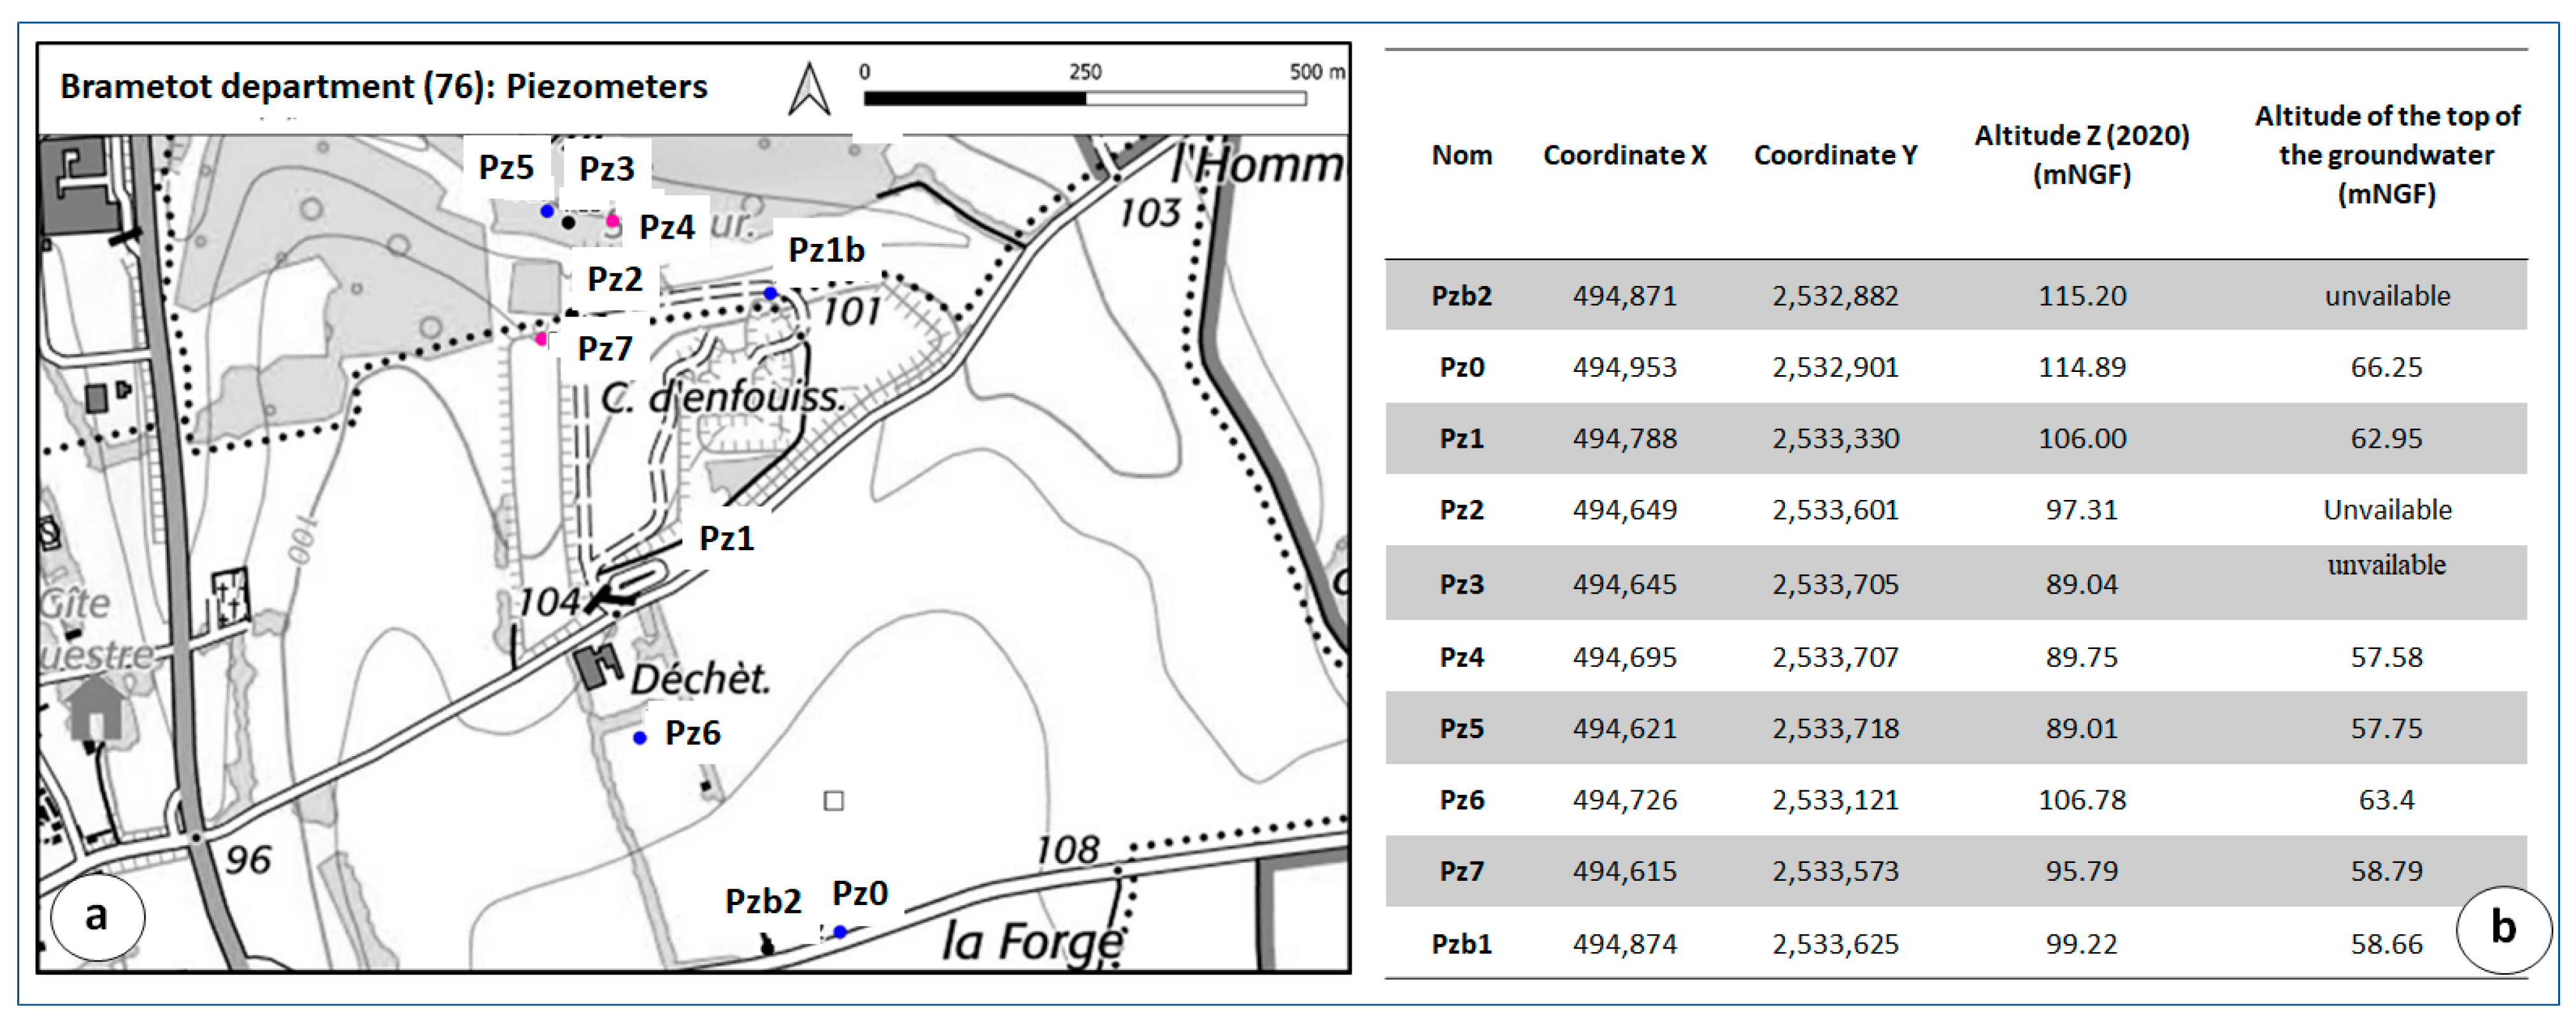
6.1. Piezometric Investigations

Groundwater levels and water sampling in the site’s piezometers at Brametot were conducted in October 2023. The coordinates (Extended Lambert II) of the piezometers are shown in Figure 6. The Upper Cretaceous chalk contains the largest aquifer in the region. Its high porosity and fracturing give the chalk formation a large storage capacity. As mentioned in the geological context, the chalk formation rests on a clay basement, which forms the base of the aquifer and can be up to 200 m thick. In terms of the hydrodynamics of the Dun Valley, the Chalk aquifer is unconfined. At the site, groundwater generally flows from the south to the north, with its roof lying at depths between 55.7 m (to the north) and 66.25 m (to the south) (Figure 7), and especially towards the northwest and northeast directions. The identification of the dividing axis could help confirm the west–east direction of groundwater flow in the chalk aquifer. This dividing axis may be linked to the presence of a tectonic fault, which controls groundwater flow and pollutant transfer.
Hydrodynamic parameters provide information about the aquifer, allowing for the characterization of the chalk aquifer. These physical parameters include porosity, permeability, transmissivity, storage coefficient, and specific flow rate. These data offer insights into the flow of fluid and its storage within the associated medium [28].
  • Transmissivity values: 105 to 102 m2/s;
  • Storage coefficient: 5% to 10%;
  • Cenematic porosity: 0.3 to 1;
  • Hydraulic Conductivity: 107 to 103 m/s;
  • Flow rate: 1 m/y to 500 m/h.

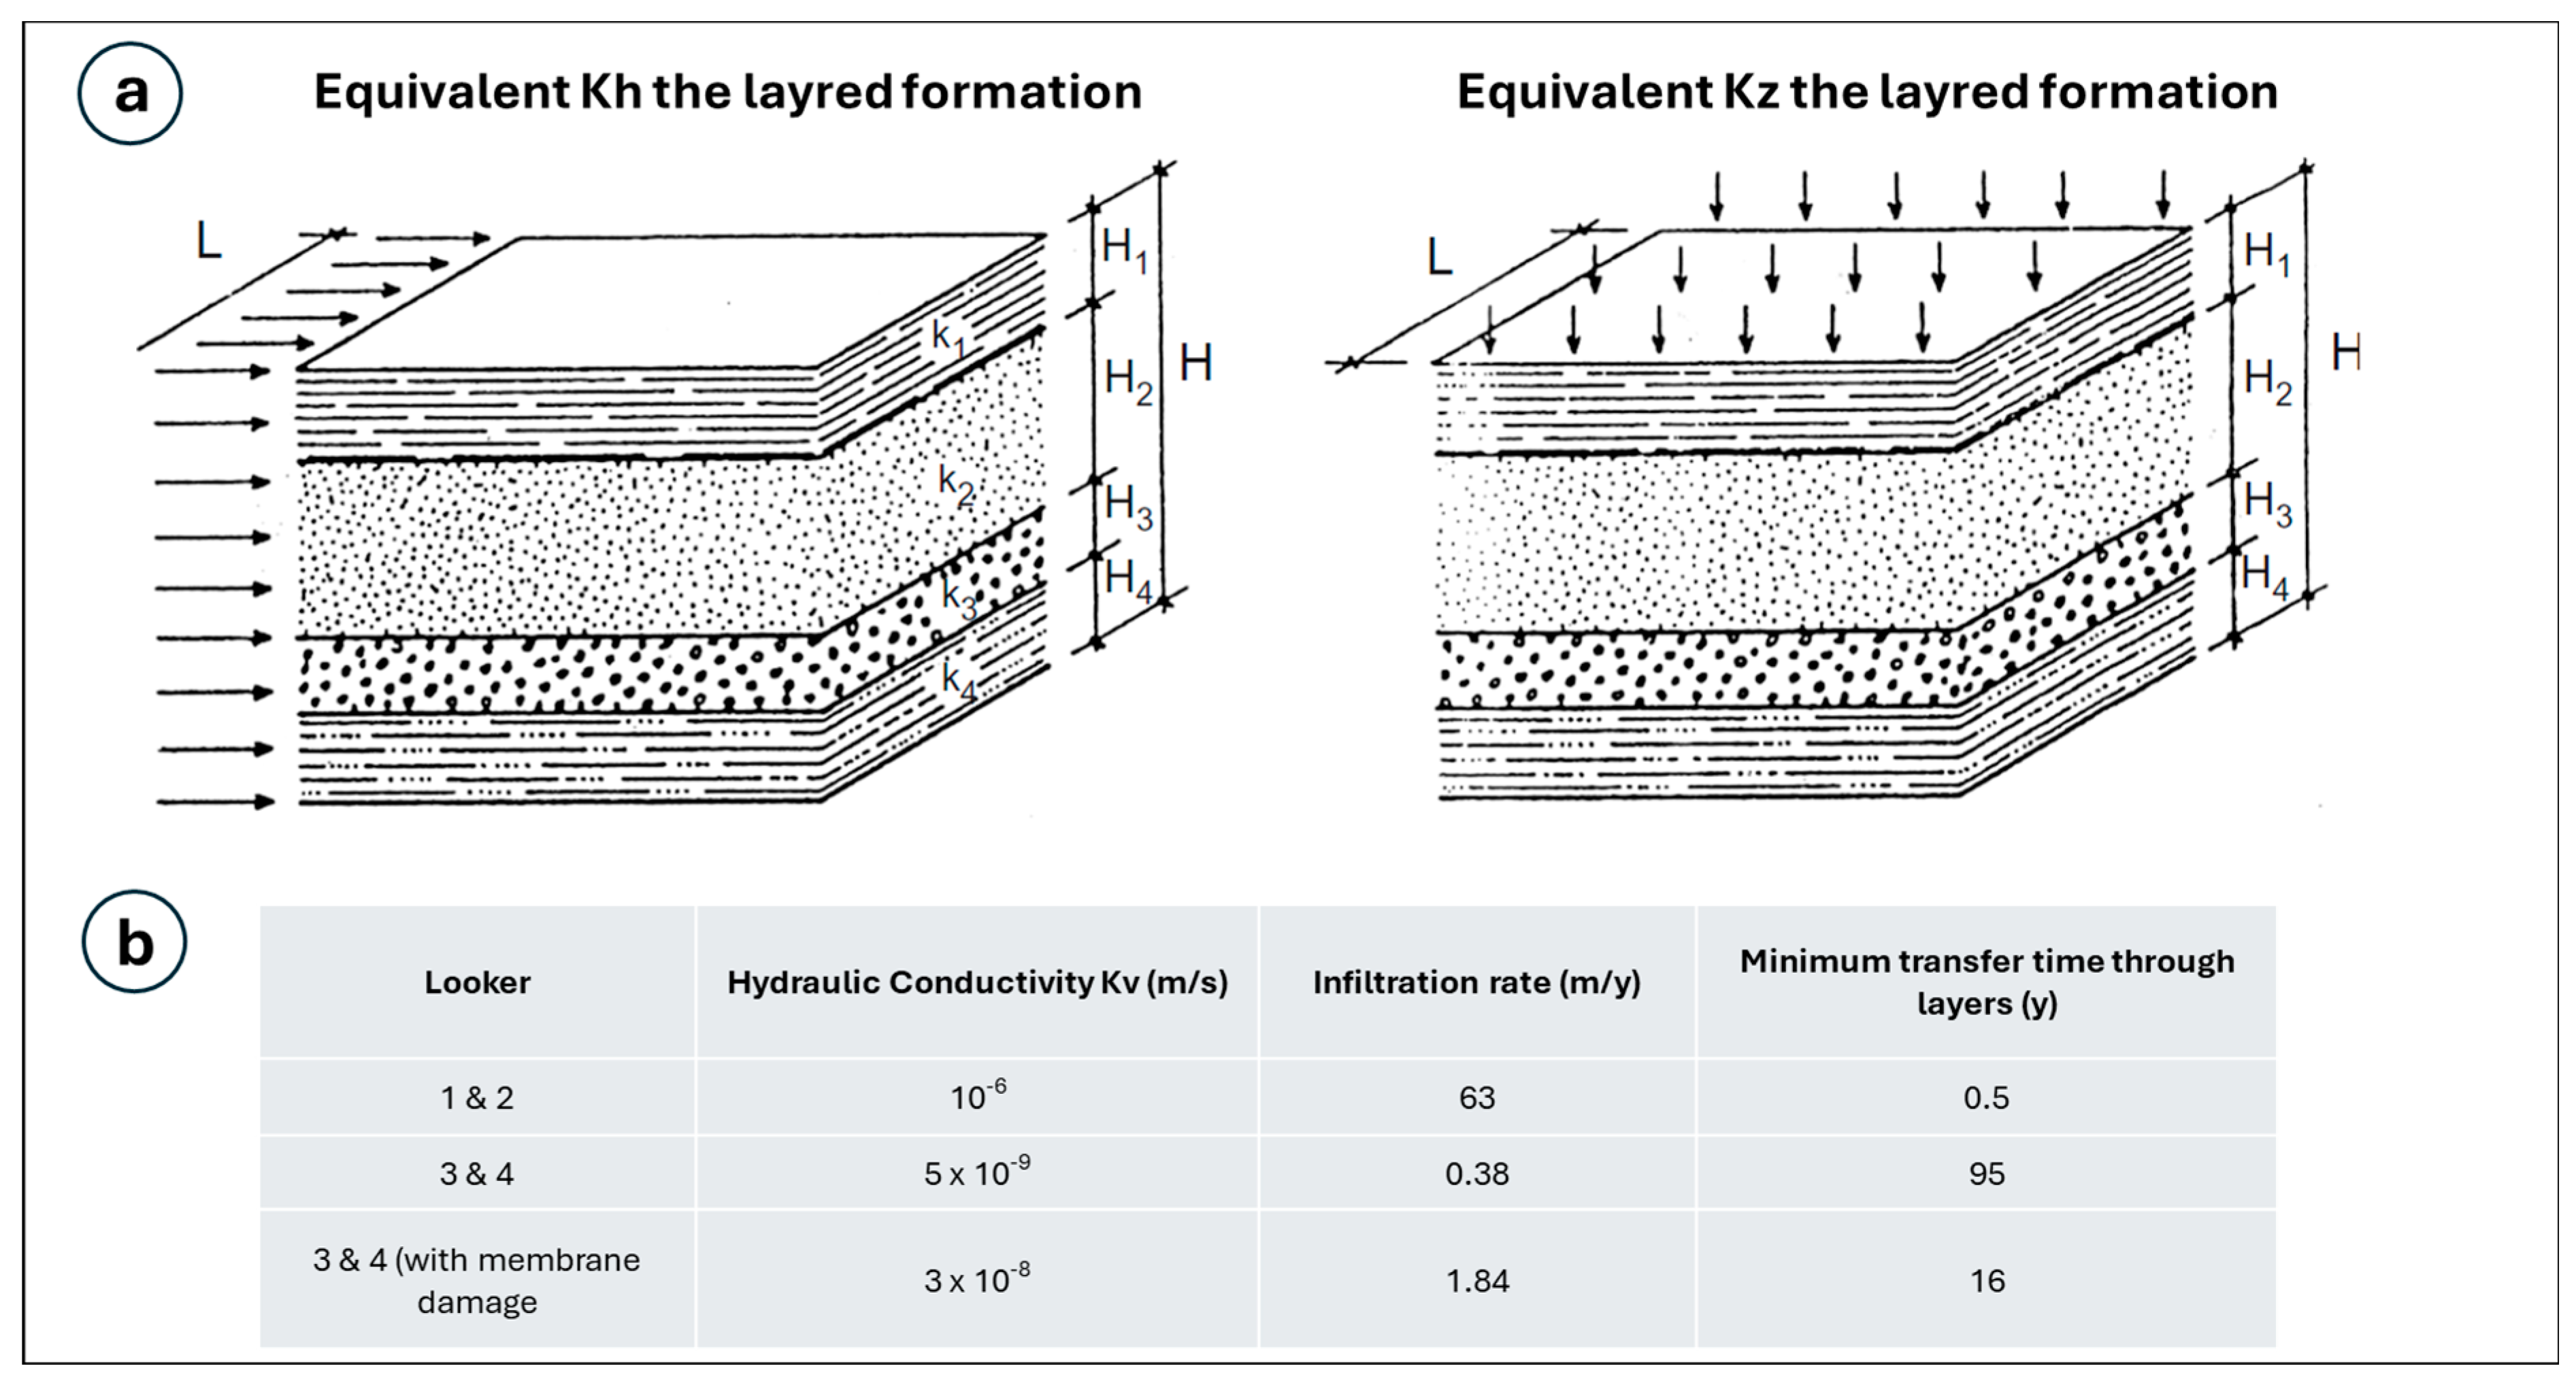
6.2. Velocity of Infiltration

The velocity of infiltration through soil can be described by Darcy’s Law, which is a fundamental equation used to quantify fluid (with contaminant) flow through porous media. According to Darcy’s Law, the infiltration velocity is proportional to the hydraulic conductivity of the soil and the gradient of the hydraulic head, typically represented as the difference in water pressure over a distance (Figure 7). The equation is expressed as follows:
v = −K⋅Δhx
where v is the velocity of infiltration, K is the hydraulic conductivity, Δh is the change in hydraulic head, Δx is the distance over which the infiltration occurs, and . represents the hydraulic gradient
The velocity of water can be calculated using porosity by incorporating it into the Darcy’s Law equation, where the effective porosity influences the flow rate, as only the pore spaces that are interconnected contribute to water movement through the soil:
Δ h i H i = ν H i K i H i K v = H i H i K i
K v = H i H i K i
The velocity distribution observed in the various layers (Figure 8) of the chalk aquifer is influenced by the hydrodynamic parameters. In the Senonian chalk of our experimental hydrogeological experimental site of Beauvais (Institut Polytechnique UniLaSalle), the Beauvais aquifer’s chalk formation exhibits notable characteristics as a reservoir rock, with a porosity ranging from 25% to 50%. However, it is also distinguished by its relatively low permeability [29].

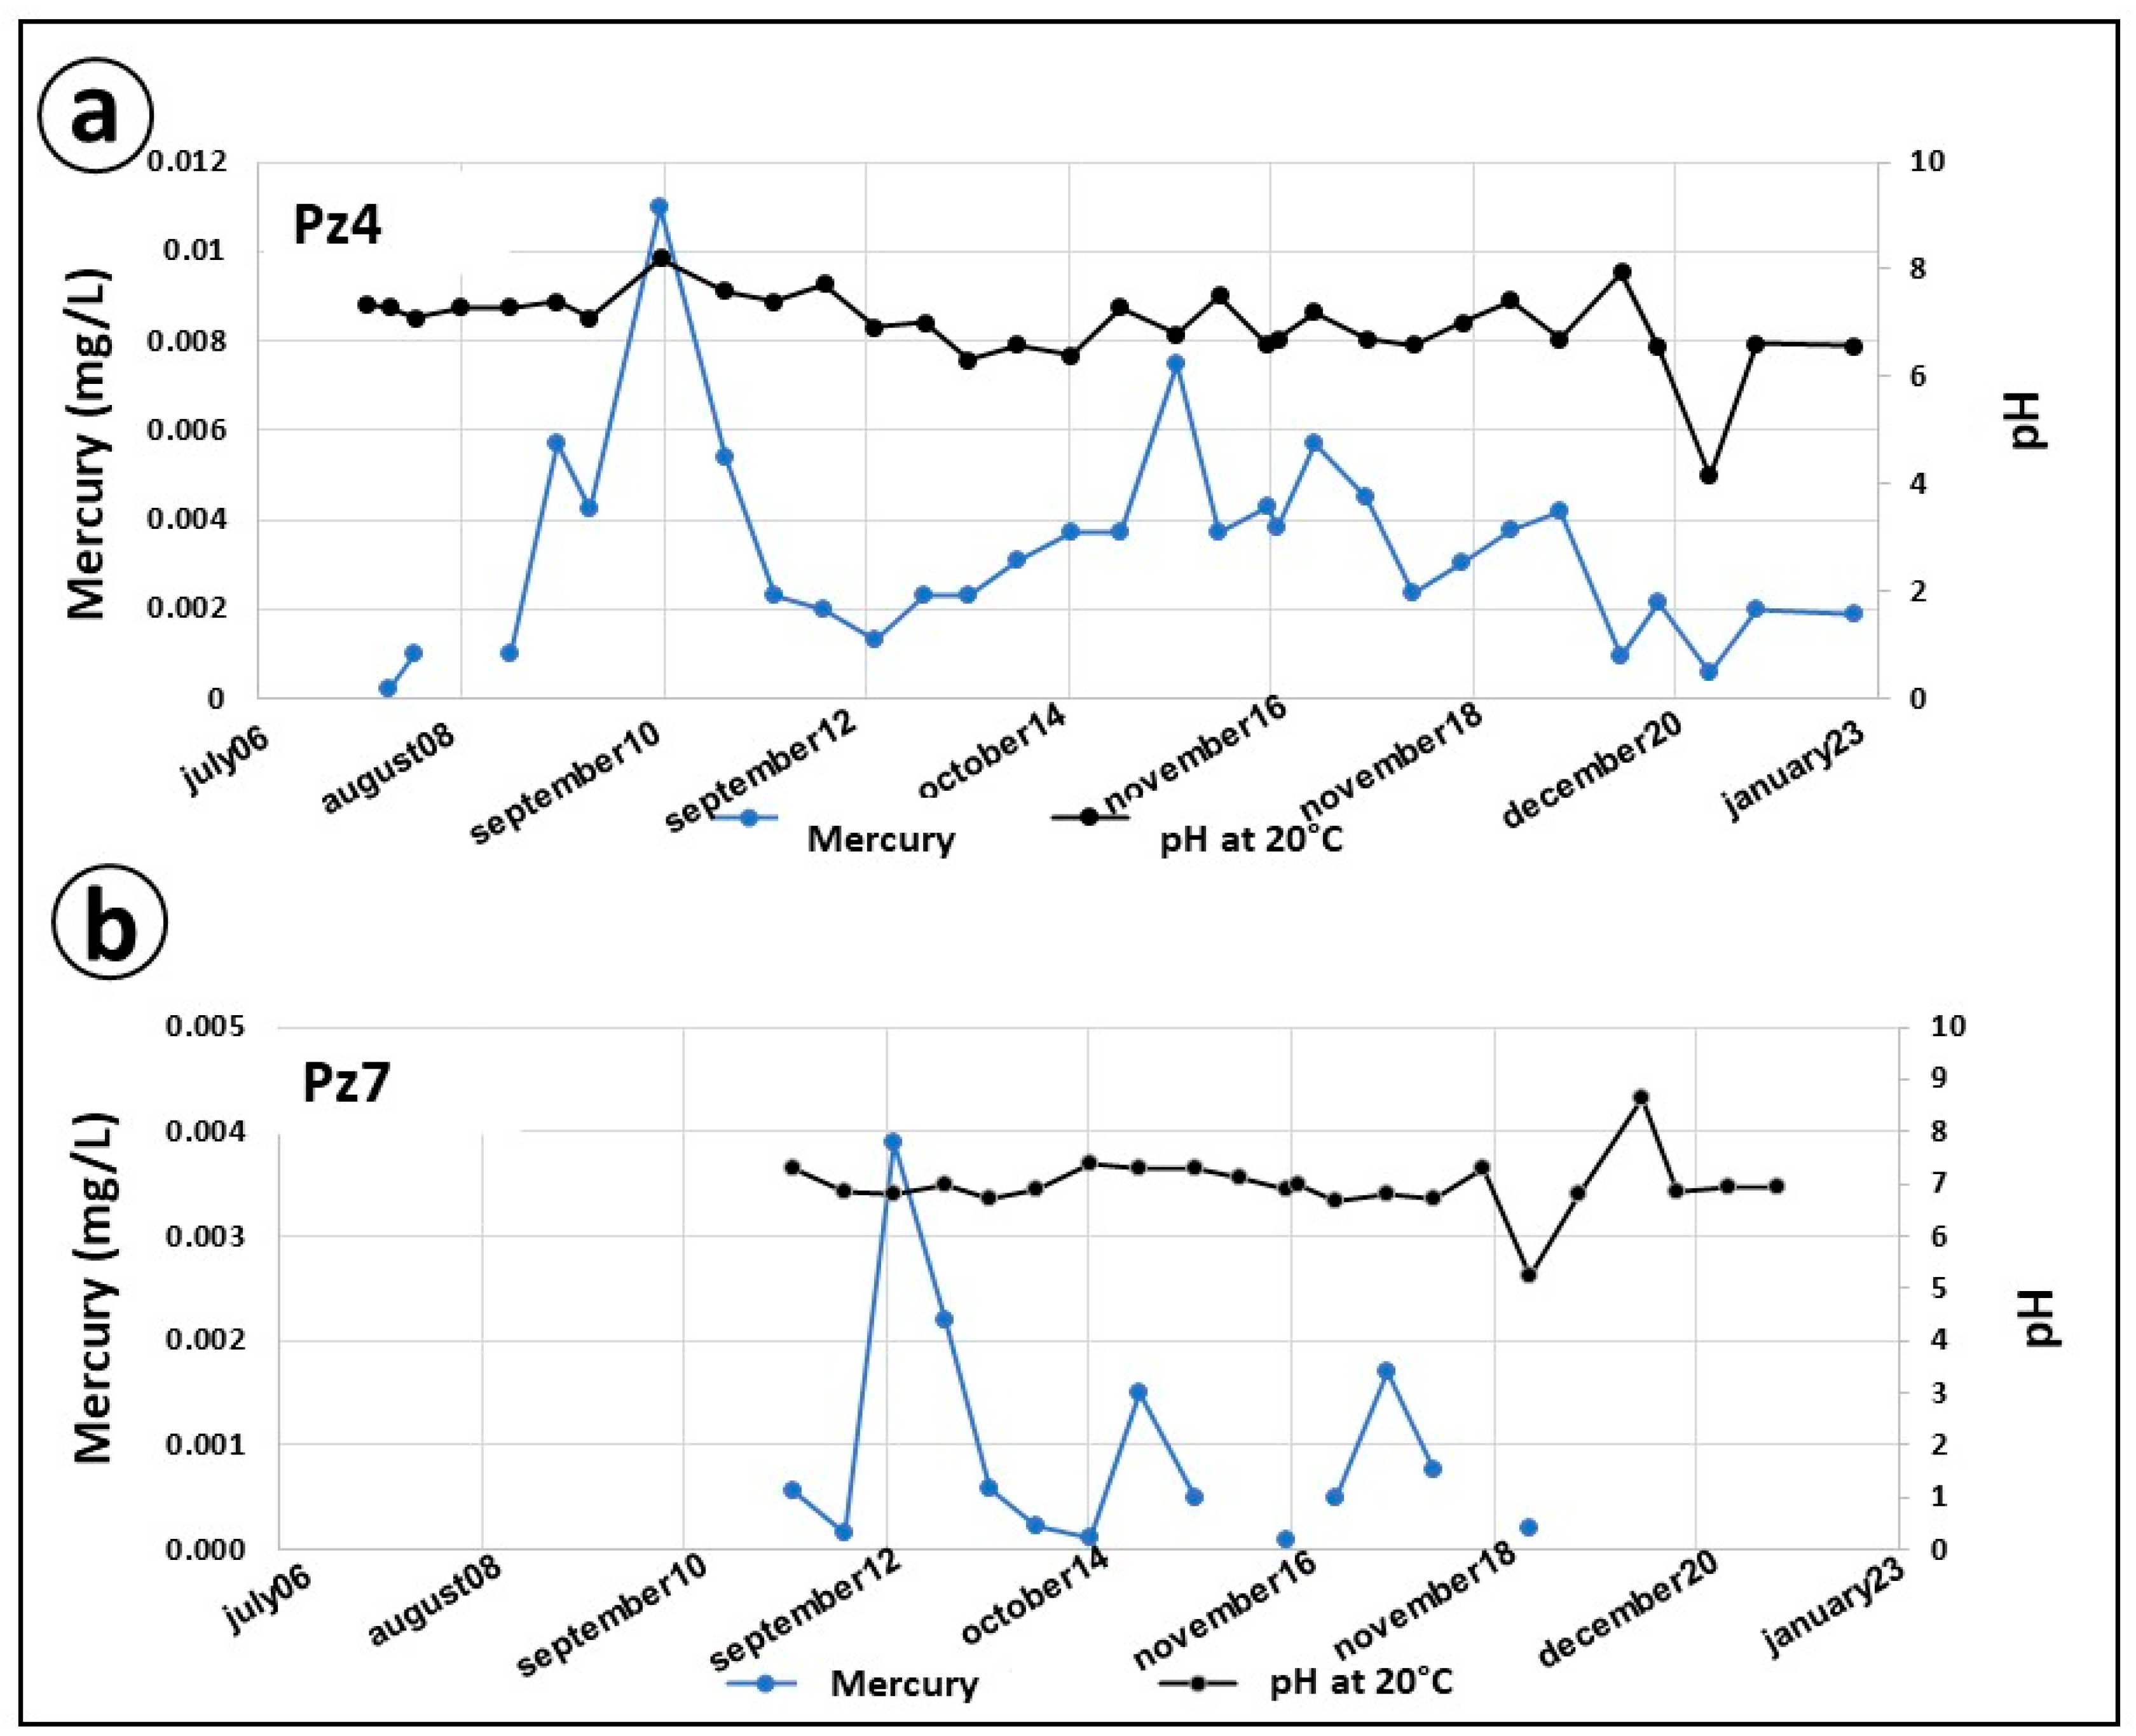
6.3. Correlations of Hg-Ph and Hg-Eh

In this section, we consider the analyses conducted since 2007 on piezometers 4 and 7 (the ones where the mercury anomaly is the most prominent). Note that when no data are shown on the graph, it indicates that the value is below the detection threshold (Figure 9).
“The superposition of the data does not reveal a notable correlation between variations in mercury and changes in pH. Peaks of high mercury values are observed both with drops in pH (e.g., November 2014 in Piezometer Pz4) and increases in pH (e.g., September 10, Piezometer Pz4). However, it is worth noting that the environment is generally relatively neutral, with only a few isolated acidic or basic values.”
On the other hand, the oxidation-reduction potential (Eh) provides insight into the type of environment in which mercury evolves. The analysis below presents the annual averages of this parameter across all piezometers (Table 2). Overall, the general averages are relatively consistent (ranging from 160 mV to 234 mV), except for Pz1, where the value is notably low (46 mV). These values suggest that the environment is predominantly oxidizing. However, the data do not support a direct correlation between mercury levels and Eh.

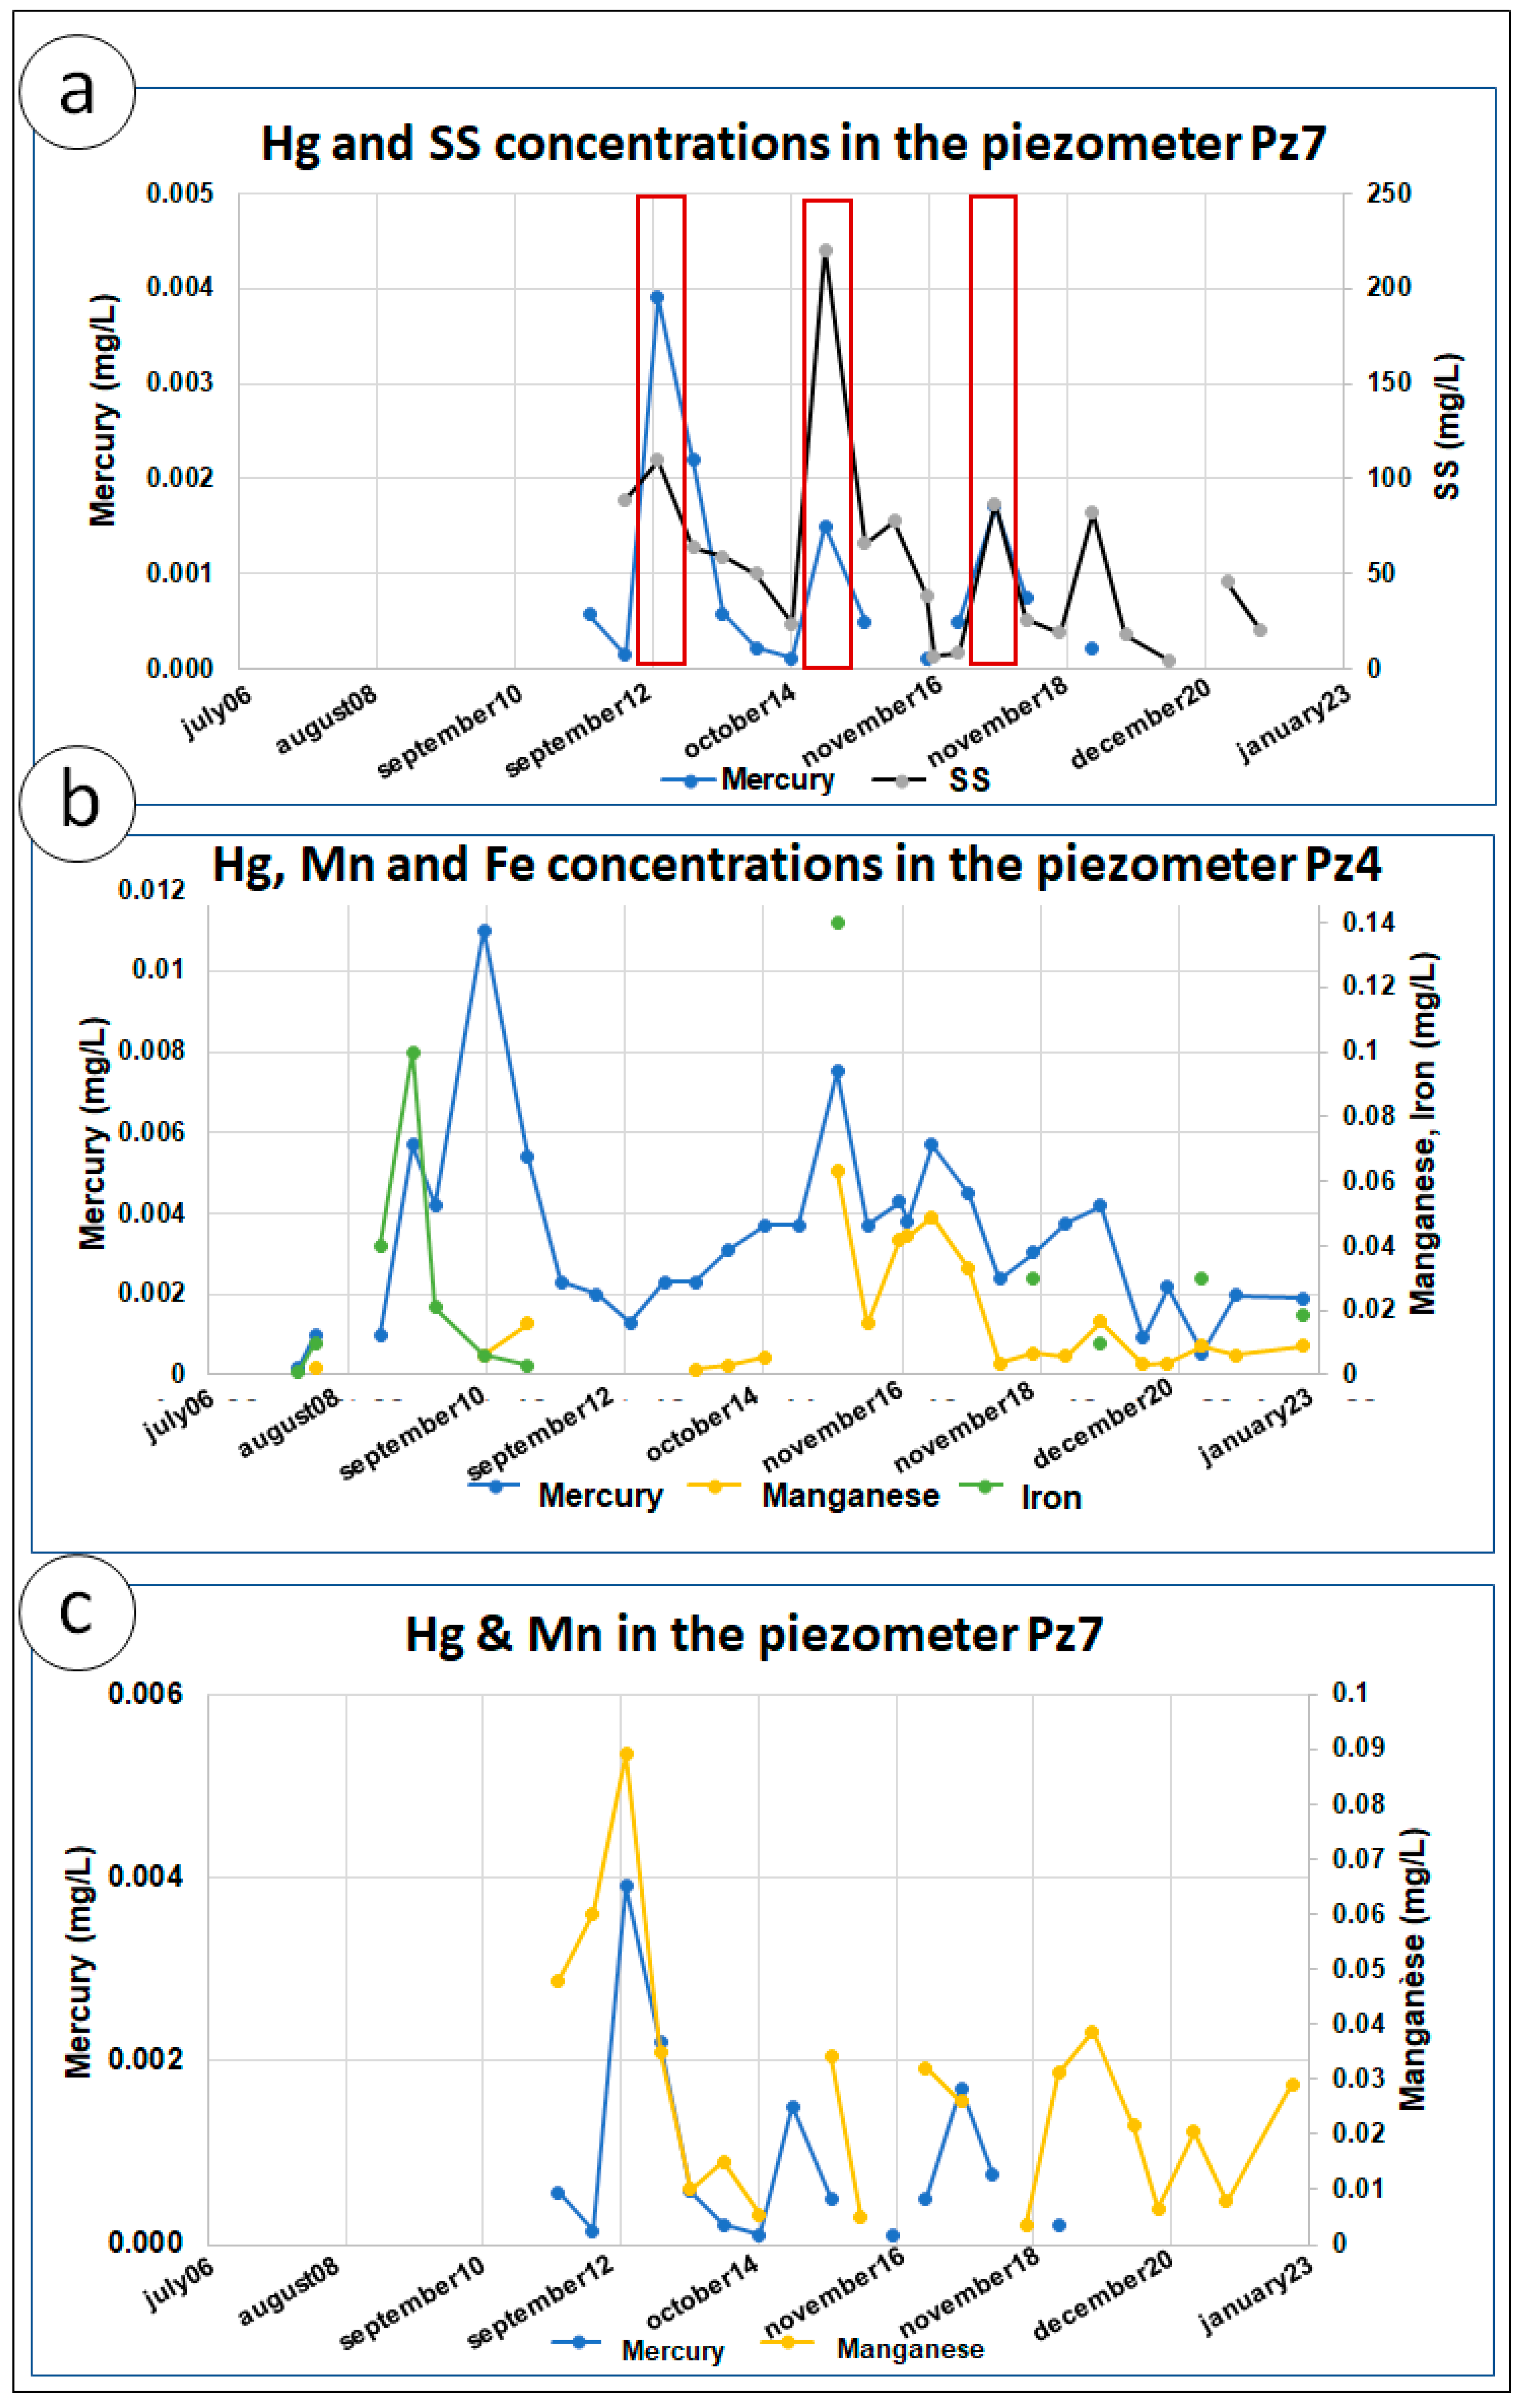
6.4. Evolution of Hg-SS-Metallic Trace Elements (Mn, Fe)

Firstly, regarding suspended solids (SS), a clear heterogeneity is observed across the piezometers on the site. The general averages range from 25 mg/L for Pz0 to 1563 mg/L for Pz1. For Pz4, the SS averages for 2007 and 2012 are higher, at 46 mg/L and 1351 mg/L, respectively (Table 3). However, these variations do not correspond to a significant increase in mercury levels in the same piezometer. Regarding Pz7, the suspended solids values remain relatively stable, although there are notable peaks that correspond to increases in mercury, highlighted in red on the graph (Figure 10a). It is also important to consider the relationship between iron and manganese oxide contents and mercury levels (Table 4), given their affinity (Figure 10b). The data were overlaid; however, the available iron data do not show a clear correlation. Values below the detection thresholds were excluded, which considerably reduced the number of usable data points. For the available values from Pz4, the iron content follows the downward trend of mercury levels.
Research using solid-phase assays in sediments [30,31] has highlighted the association of mercury with iron sulfides (FeS and FeS2) [32] concluded, from an experimental study on mercury contaminated sediments, that mercury is primarily bound to particulate organic matter. Other studies have demonstrated mercury’s preference for iron monosulfides and pyrite. Iron oxides and manganese play a crucial role in mercury sorption [33,34,35,36]. Research using solid-phase assays in sediments [30,31] has highlighted the association of mercury with iron sulfides (FeS and FeS2). An experimental study [32] conducted on mercury-contaminated sediments concluded that mercury is primarily bound to particulate organic matter. Other studies have demonstrated mercury’s preference for iron monosulfides and pyrite. Iron oxides and manganese play a crucial role in mercury sorption [33,34,35].

7. Analysis and Discussion

The values of the parameters studied were compared to identify potential correlations. The curves for suspended solids, as well as those for major elements (iron and manganese), exhibit similarities with mercury concentrations. Mercury is a complex element, and its behavior is challenging to explain solely through these correlations. The variations in manganese (Mn) and iron (Fe) may be associated with bacteriological activity in the groundwater and at the water-casing interface of the piezometers. The natural source of mercury involves the infiltration of naturally occurring mercury present in the environment. The analysis and interpretation of the geological formations mapped at the site, the groundwater flow, and the geochemical data lead to the following hypotheses:
-
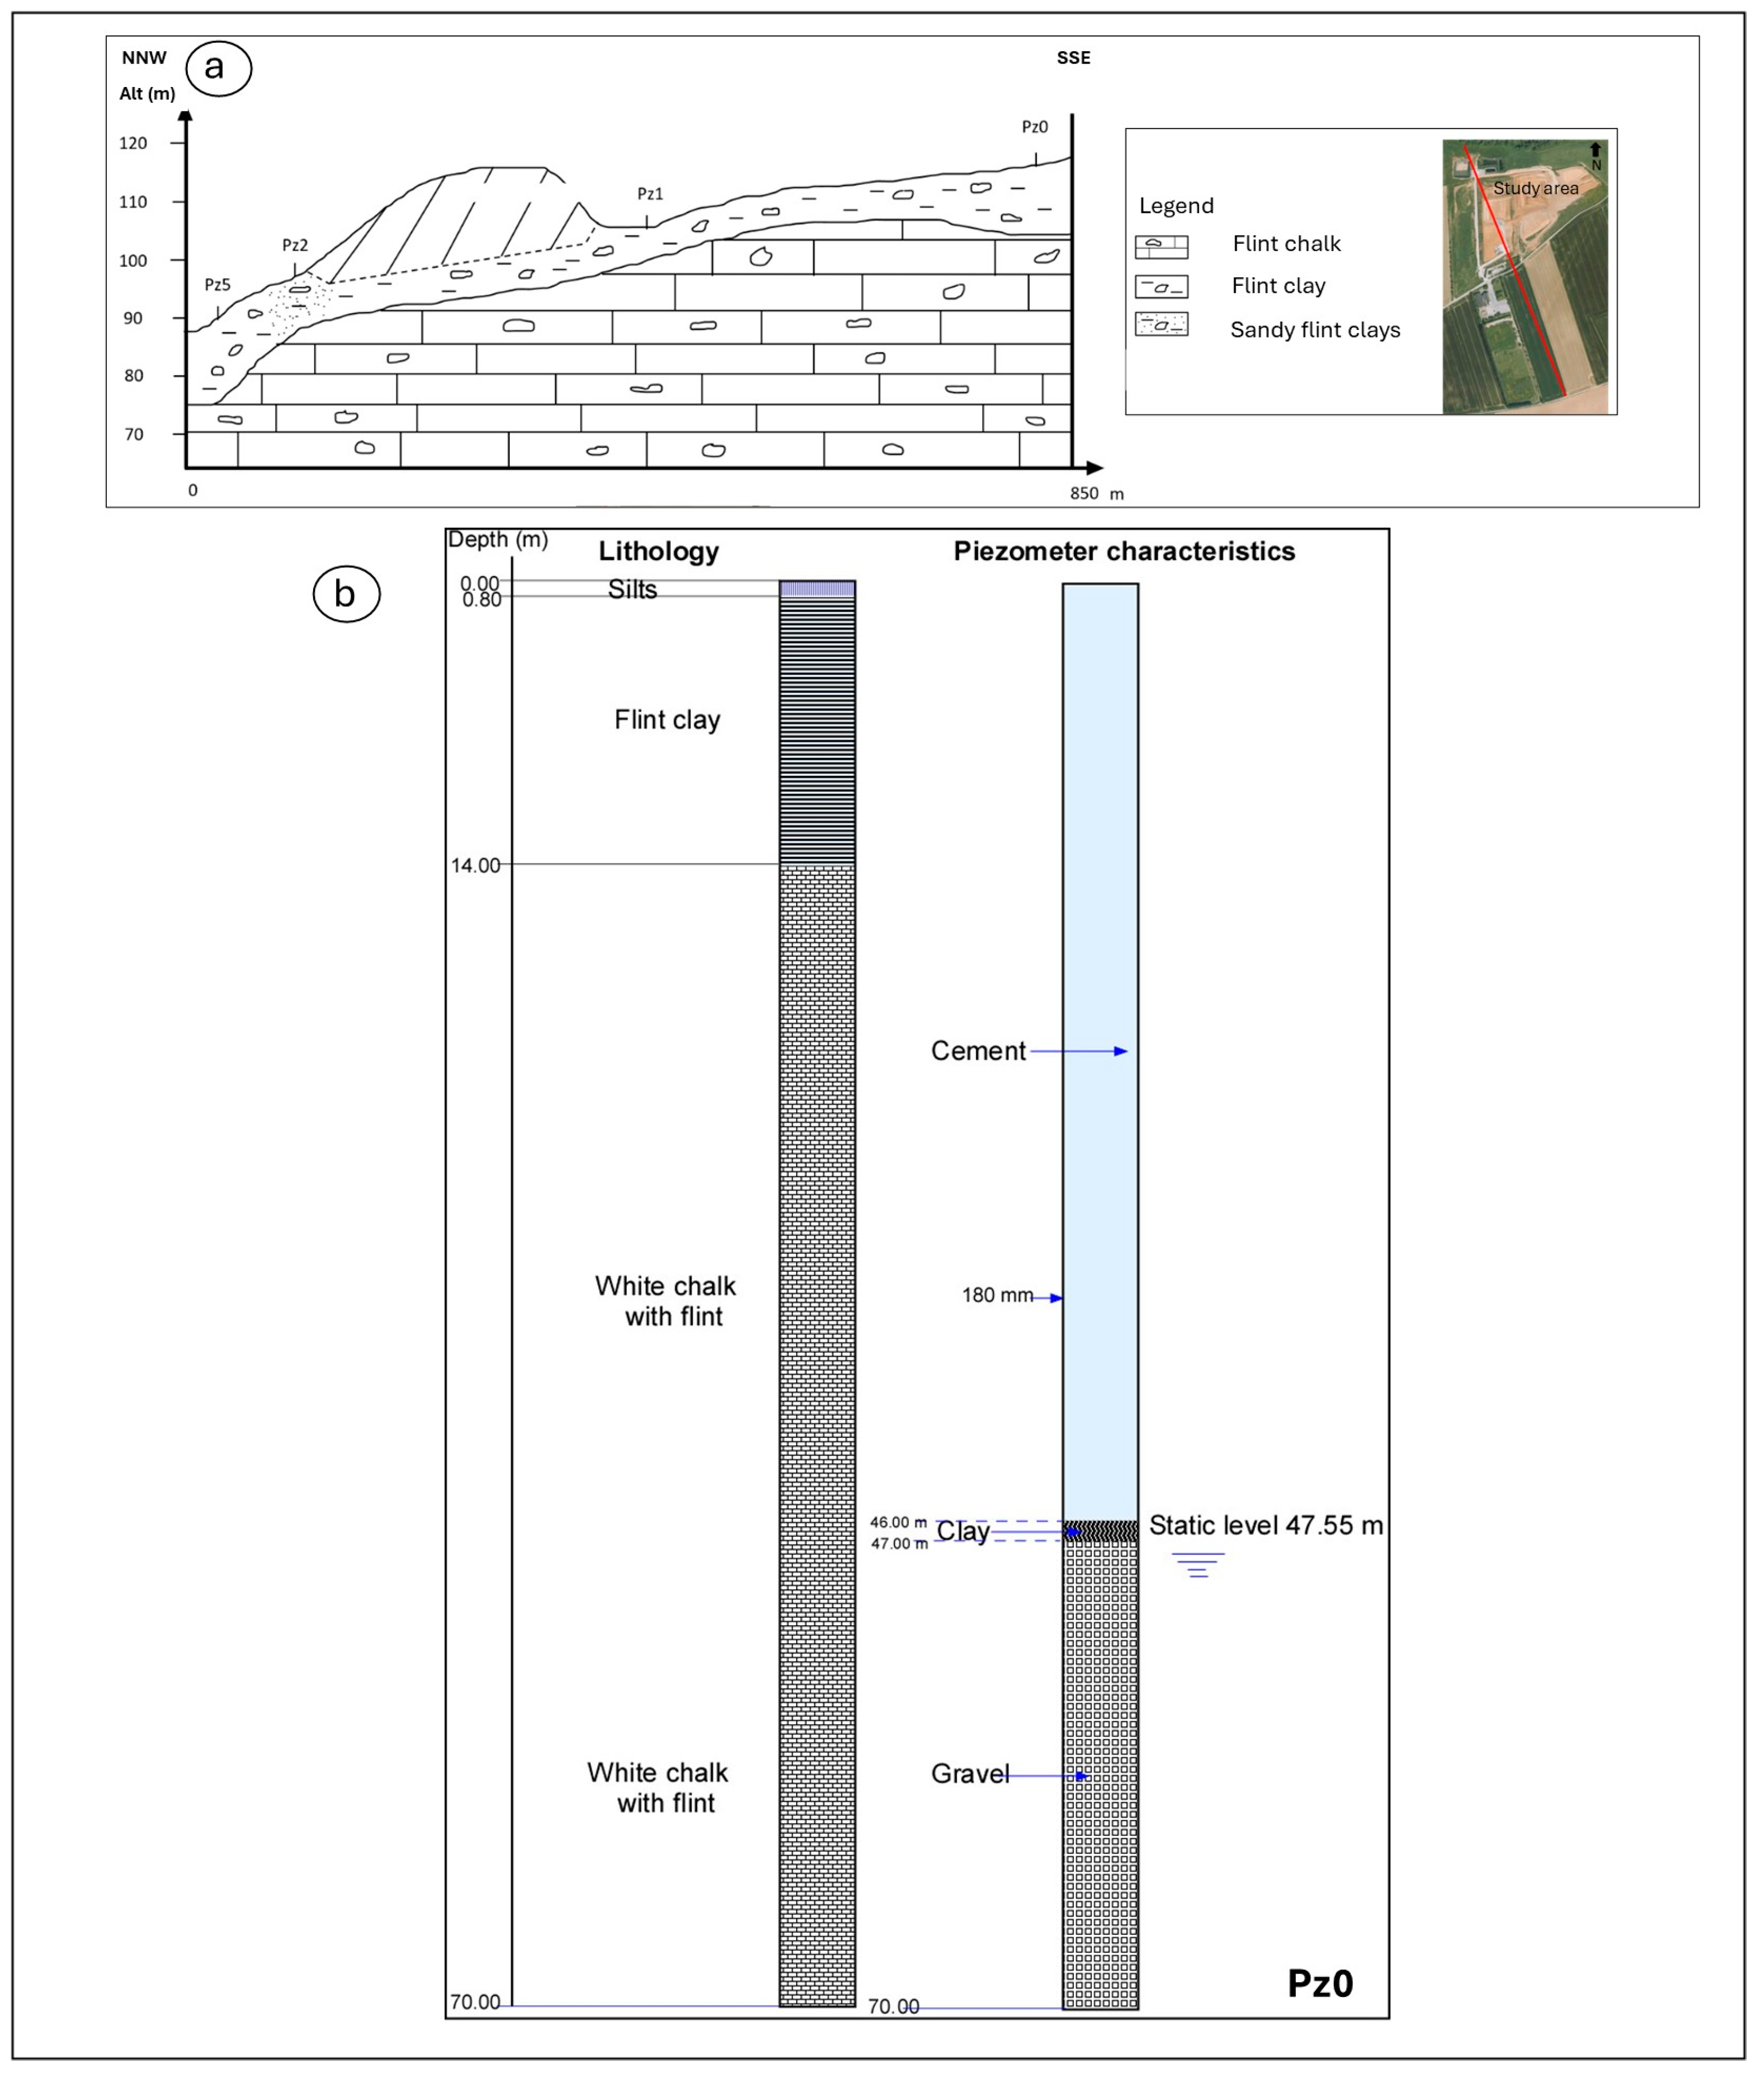
Discharge of leachates before sealing the basins: The superficial formation, composed of flint clay, is heterogeneous and overlays the chalk formation, which is characterized by a network of fractures and matrix porosity. Regarding hydrodynamic parameters, the Brametot site (NHWF) exhibits various types of porosity. The Brametot non-hazardous waste storage facility (NHWS) is located on the Senonian chalk aquifer, which is distinguished by triple porosity:
Fracture porosity: dissolution fractures in the Senonian chalk. Fracture dissolution can form large conduits, leading to the concept of “triple porosity” or “conduit porosity”. Fractures and karstic conduit porosity primarily serve a conductive role, facilitating the flow of water through the less permeable geological layers of the aquifer. The karstic network significantly increases the vulnerability of the chalk groundwater to contamination. This triple porosity also results in groundwater flowing in multiple directions.
The vertical variation and fissuring degrees result in two distinct porosity ranges: primary porosity (0.15–0.45) and secondary porosity (0.005–0.02) [36]. Significant regional and stratigraphic differences in porosity are evident. Additional hydrogeological insights into the chalk aquifer’s complexity have been gathered from various sites across England and from a series of two thousand chalk porosity tests [37]. The minimum porosity values range from 3.3% to 24.1%, while the maximum values fall between 31.4% and 55.5%, with the average porosity generally lying between 3.3% and 24.1%. The variability observed can be attributed to the median (d50) pore throat size, which was found to be 0.49 µm. In a study by [38], a number of regional and stratigraphic variations in Chalk pore size distributions were identified from 104 samples, with the mean pore size fluctuating between 0.22 µm and 0.65 µm.
-
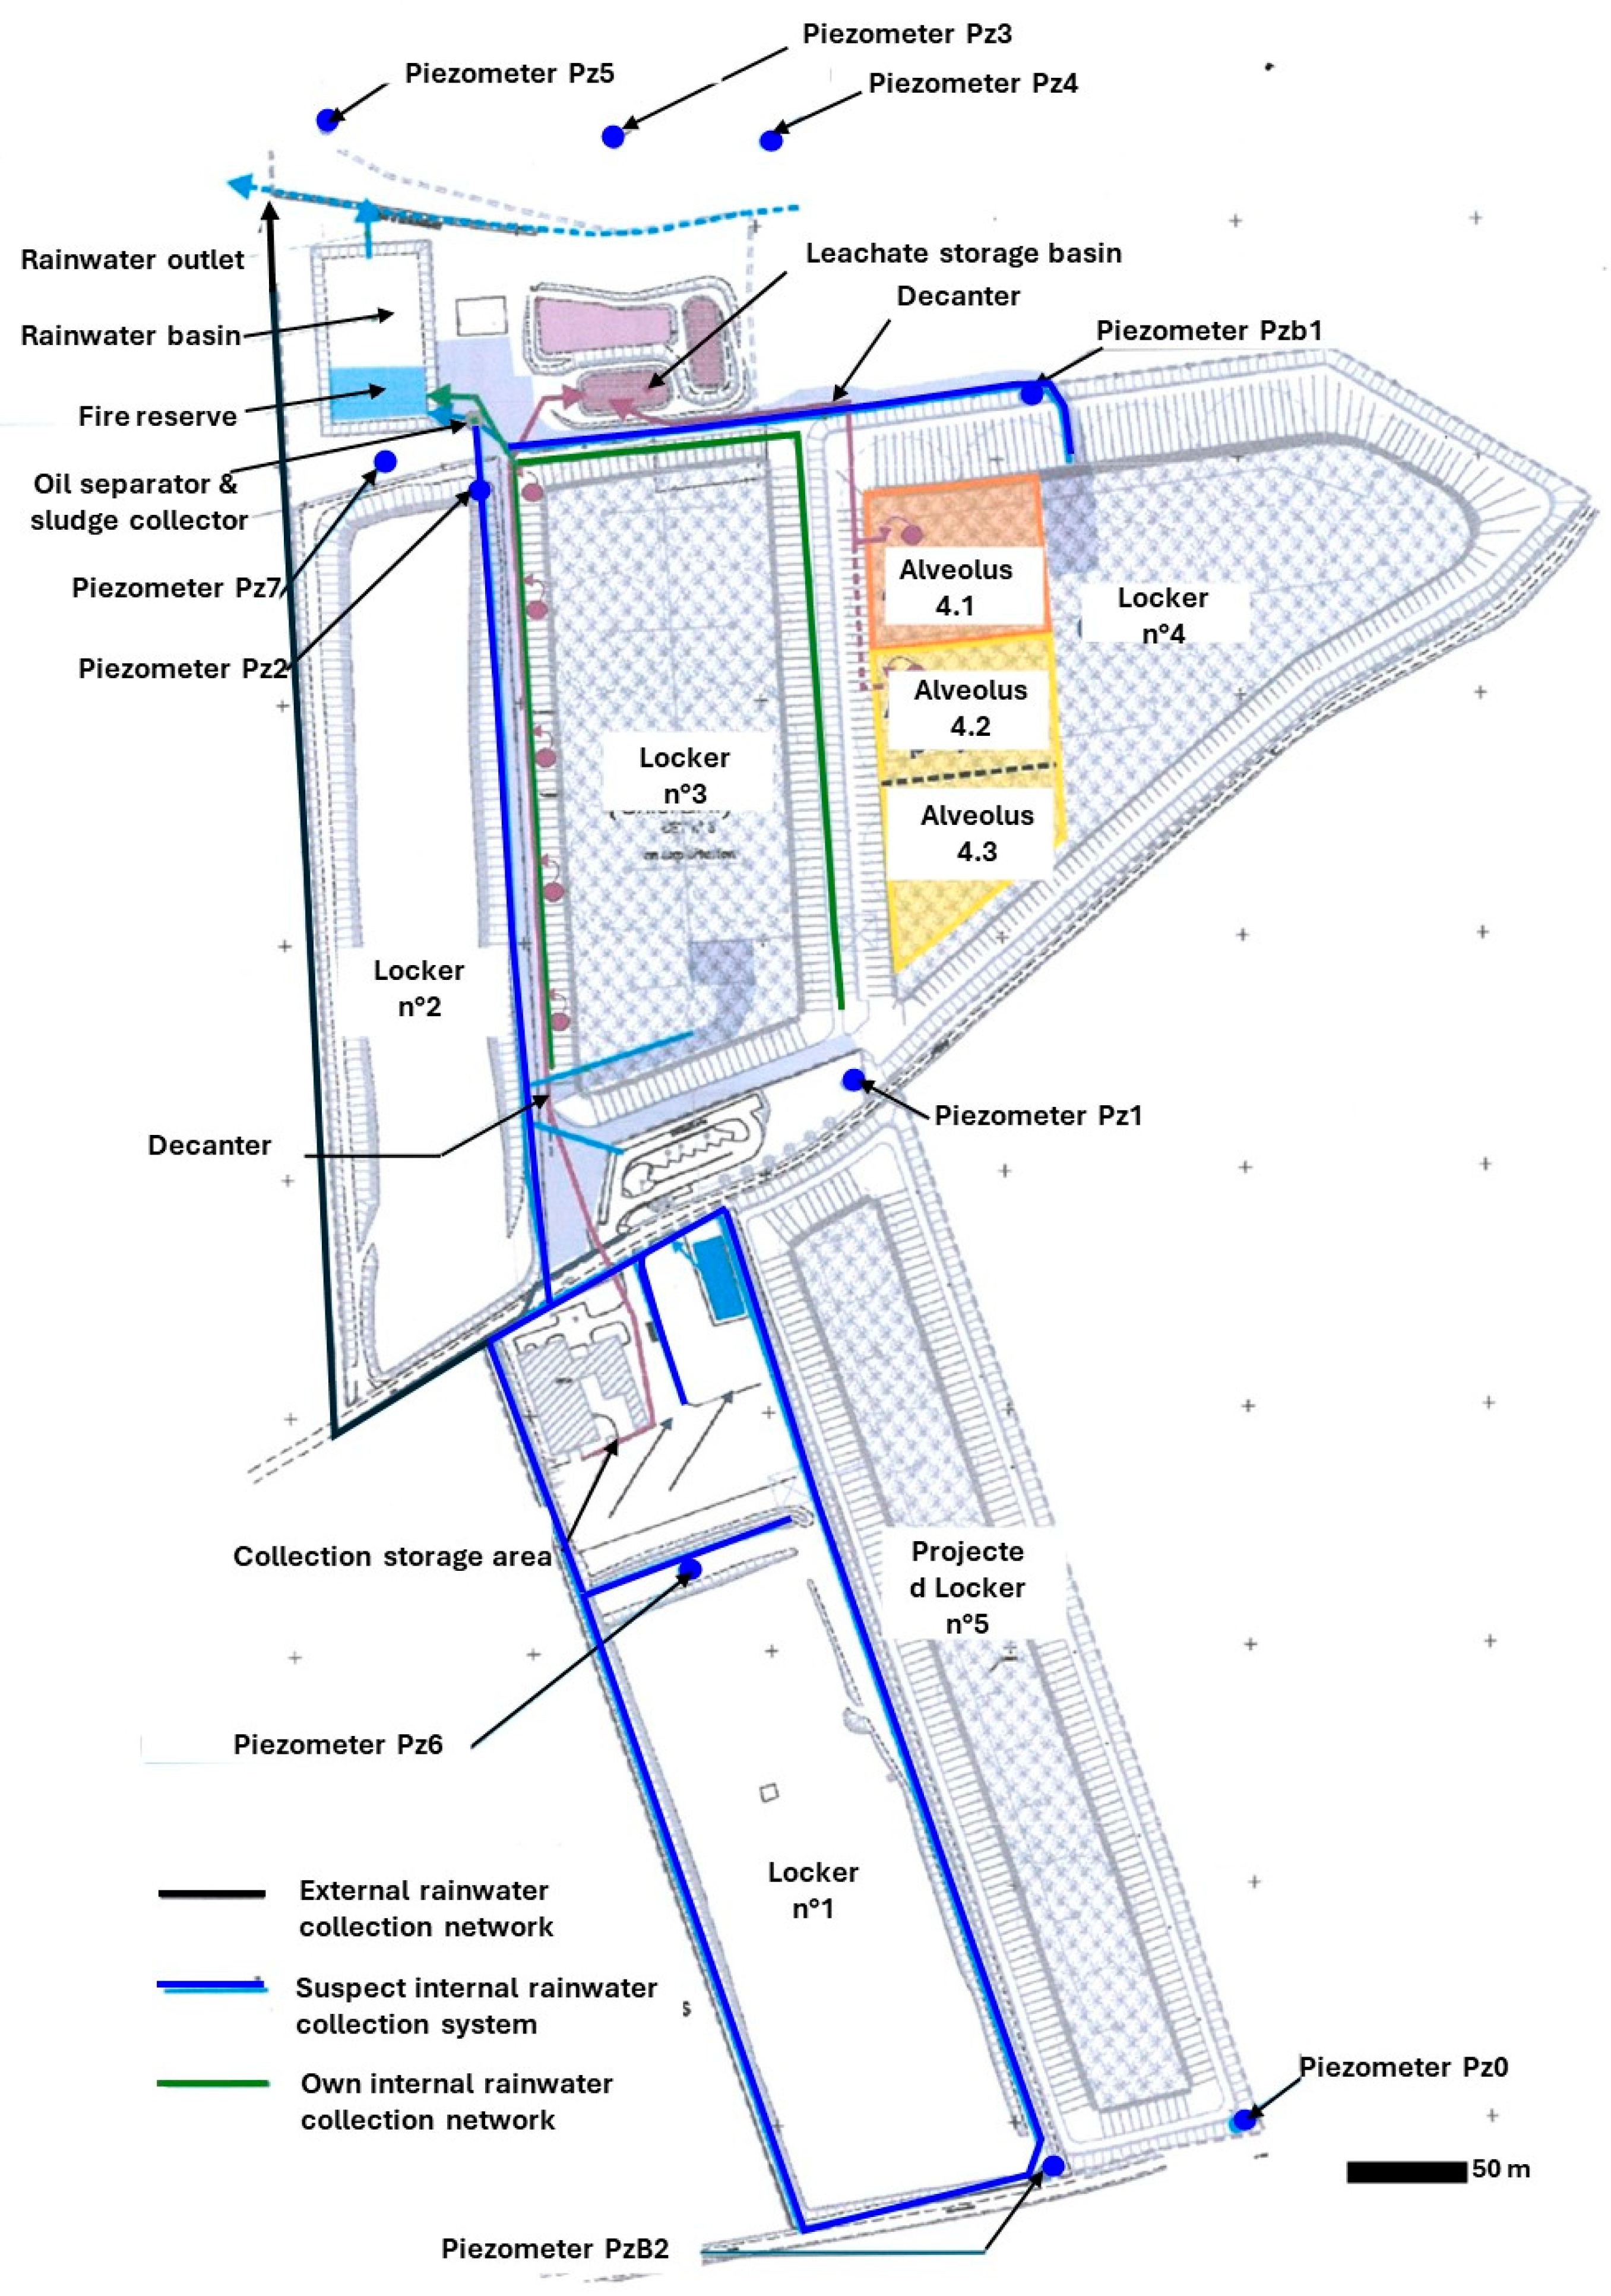
Infiltration of leachate beneath the locker 1 or 2 landfill (Figure 3), resulting from rainwater carrying pollutants from the landfill. Therefore, it is essential to carry out additional geotechnical investigations, including permeability tests, at the site to evaluate the integrity of the locker 2/1 containment.
-
Anthropogenic factors through sinkholes and the karst system in the region. The sinkhole phenomenon is observed in the two talwegs bordering the ISDND to the west and east, as well as in the dry valley to the north of the site.
-
Transport of mercury concentrations from the soil into the groundwater.
When spilled on soil, mercury is rapidly immobilized and fixed by iron, aluminum, and manganese oxides, and primarily by organic matter in the form of highly stable organic complexes. Mercury is predominantly concentrated in the surface layer of soils, particularly in the fine solid fraction. While pinpointing the exact location of mercury is difficult, it generally accumulates within the upper 50 cm of soil [39]. This trend is corroborated by an experimental study in Haut-Rhin, which presented results for a silty-clayey-sandy to clayey-loamy-sandy soil, with a surface pH of 6 and a pH of 8 at depth [40]. The behavior of mercury is significantly influenced by subsoil characteristics such as pH, redox potential, organic matter content, oxides, chlorides, soil composition, and aeration [39]. Therefore, it is essential to investigate the soil’s mercury content within the framework of physicochemical correlations (Mn-Fe-suspended solids, pH, T, electrical conductivity, etc.). Mercury is maybe present in all soil phases (mainly solid, but also liquid and gaseous). It is subject to chemical and biological processes, which degrade fewer stable compounds. Mercury binds with organic particles or minerals (clays and hydroxides), partly limiting its mobility. These behaviors and associations in the form of complexes, are influenced by variations in subsoil characteristics: pH, concentration of organic and non-organic matter, variations in depth, etc.
The presence of hydroxides and organic particles in soils, for example, promotes adsorption and complex formation, depending on environmental conditions (acidic, neutral, or basic) and pH variations. A decrease or increase in pH, depending on the environment, will lead to a preference for complex formation with either mineral particles or organic matter. The primary sorbent—whether organic or inorganic—thus depends heavily on the prevailing environmental conditions. Due to their ability to mobilize and retain mercury, the concentrations of organic matter and clay are critical parameters for identifying mercury in soil [41]. In an acidic medium (low pH), mercury adsorption by the soil is favored, resulting in the formation of stable complexes primarily with organic matter. In neutral or basic environments [42], organic matter dissolves, making mercury mobile, and it may be preferentially adsorbed onto clayey materials, such as iron hydroxide or manganese.
Note that the behavior of mercury has been studied in both total water and suspended solids of surface waters, particularly in England and estuarine environments [43]. A significant correlation between mercury and organic carbon concentrations in suspended solids has been observed. This correlation was further supported by laboratory experiments demonstrating the association between mercury and the organic phase of the suspended material.
Exposure to mercury poses significant public health risks, particularly for child development. Mercury can adversely affect the immune system and cause toxic damage to the eyes, skin, digestive system, and nervous system. The World Health Organization (WHO) has identified mercury as one of the top ten chemicals of major concern for public health. Its effects on health are primarily neurological and behavioral, likely resulting from inhalation, ingestion, or dermal exposure to various mercury compounds. The WHO notes that symptoms of exposure include memory loss, motor dysfunction, neuromuscular effects, and insomnia. A mercury concentration of 20 μg/m3 in the air is the threshold at which workers may begin to show subclinical signs of central nervous system toxicity.
These results will be used in studies evaluating the vulnerability of the region’s water resources, as well as in establishing protection parameters for water catchments. To ensure the protection of water resources, water catchments are designated protection areas, a requirement set forth by the law of 3 January 1992 (Article L-1321-2 of the French Public Health Code). These areas are designed to shield the catchments from both point-source and diffuse pollution. The boundaries of these protection areas are defined under three categories:
  • Immediate Protection Perimeter (IPP): A fenced-off catchment area (unless otherwise exempted), usually owned by a public authority. All activities are prohibited, except those related to the operation and maintenance of the water supply well catchment and the perimeter itself. The primary goal is to protect the integrity of the infrastructure and prevent the discharge of pollutants in the immediate vicinity of the catchment.
  • Close Protection Perimeter (CPP): “A larger area (typically a few hectares) where any activity likely to cause pollution is prohibited or subject to special regulations (such as construction, deposits, discharges, etc.). Its purpose is to prevent the migration of pollutants toward the catchment well”.
  • Remote Protection Perimeter (RPP): “Optional, this perimeter is established if certain activities are likely to be a significant source of pollution. It generally encompasses the entire catchment basin of the water supply well or catchment area”.

8. Conclusions and Recommendations

8.1. Conclusions

The characterization of the mercury source is highly complex. Complementary research is required, including soil analysis to assess the nature of the soils (clay fraction), physicochemical parameters (pH, suspended solids), mercury content, and metallic trace elements (Fe and Mn). The physico-chemical conditions of the clay (such as pH, reducing or oxidizing environment, temperature) can influence the adsorption or release of mercury. Consequently, mercury may be concentrated in specific areas of the chalk aquifer, particularly in clay layers, and released in a localized and over-concentrated manner. The surface layer, composed of flint clay, is heterogeneous and lies on top of the chalk formation, which features a network of fractures and matrix porosity. In terms of hydrodynamic properties, the Brametot site (NHWF) displays various types of porosity, particularly the fracture network, which can contribute to the transport of mercury concentrations in the groundwater flow. Groundwater physico-chemical parameters have been studied to assess mercury concentrations, but soil parameters must also be considered to complete the study. Factors such as soil pH, redox potential, water content, texture, mineral composition, and organic matter content are crucial in determining the mobility and bioavailability of mercury. These soil characteristics not only influence the mercury’s behavior within the soil but also play a key role in the transfer of mercury from the soil to the chalk groundwater. By understanding this transfer mechanism, a more comprehensive assessment can be made.
In terms of health effects from mercury exposure, the mercury levels at the site and in all piezometers do not pose any risk to the Brametot population.

8.2. Recommendations

The watertightness of the lockers may be one of the contributing factors to the presence of mercury in the groundwater. We also recommend conducting hydrogeophysical investigations (including radar and tomography techniques) to:
(i)
Accurately identify the heterogeneous layers within the aquifer, particularly at the flint clay and chalk levels.
(ii)
Define the geometry of both permeable and impermeable geological formations and characterize structures such as faults and fractures that facilitate groundwater flow and mercury transport. Previous studies have demonstrated the significance of tectonic structures in understanding the hydrogeological behavior (including piezometric variations and transmissivity distribution) of complex aquifer systems, such as coastal, porous, and fractured media. The characterization of clayey layers within the chalk aquifer should be further explored in future work through borehole logging techniques (including measurements of water conductivity, temperature, gamma-ray, as well as central and lateral camera logging).
(iii)
Modeling the transport of mercury in the groundwater system, particularly within the chalk aquifer. In this context, the study will focus on defining the hydrogeological parameters that govern groundwater flow within the chalk matrix, including transmissivity, hydraulic conductivity, and storage coefficients. This information will be used to construct hydrodynamic and hydrodispersive models for the site. One promising approach is the application of hydrogeological optimization through the algorithm-based LBM/CMA-ES combination, which offers a solution for improved water management and provides further insights into solute transport dynamics in the chalk aquifer. However, the spatial characterization of these hydrodynamic parameters presents significant challenges due to several factors: (a) the high cost of installing additional piezometers and experimental test wells, especially in deeper boreholes, which requires considerable financial resources and time; and (b) the quality of geophysical survey data (such as Magnetic Resonance Soundings (MRS)) at the Brametot site, which is compromised by interference from field measurement noise originating from surrounding urban infrastructure, including the sewer system, and buried electrical and telecommunication cables.
(iv)
Confirm the influence of geological structures on the presence of the dividing axis (Figure 7). Additionally, the role of microbial activity in reducing mercury concentrations will be further explored. Specifically, under reducing conditions, microbial activity contributes to the reductive dissolution of FeOOH, which, in turn, releases sorbed Hg2+ into the groundwater.
To track the mercury plume over time and space, it is necessary to install a hydrogeological well, particularly in the hydraulic downstream area, to monitor the Hg concentration.
It is essential to highlight that a limitation of this study is the lack of subsurface imaging using electrical geophysics and radar technologies. This limitation also pertains to the sampling resolution, particularly regarding the vertical component in the chalk aquifer, where stratification occurs at every meter. However, this limitation is expected to be addressed through future investigations and proposed methodologies for the study area.

Author Contributions

Conceptualization, L.Z. (Lahcen Zouhri) and J.D.; methodology, L.Z. (Lahcen Zouhri) and J.D.; formal analysis, L.Z. (Lahcen Zouhri); investigation, L.Z. (Lahcen Zouhri); writing—original draft, L.Z. (Lahcen Zouhri); writing—review and editing, L.Z. (Lahcen Zouhri), J.D. and L.Z. (Lockman Zouhri); visualization, L.Z.(Lahcen Zouhri), J.D. and L.Z. (Lockman Zouhri). All authors have read and agreed to the published version of the manuscript.

Funding

This research received no external funding.

Data Availability Statement

Data are available upon request from the authors.

Acknowledgments

The authors would like to express their sincere gratitude for the collaboration with the Institut Polytechnique UniLaSalle Beauvais (France), SMITVAD du Pays de Caux, Veolia Recyclage et Valorisation des Déchets, and the Centre de Biologie Humaine (CBH), CHU Ami-ens-Picardie. The authors also wish to thank the students of the “Parcours métier-Aménagement & Environnement: Hydrogéologie et Risques Industriels”–Promos G083 and G084 for their invalua-ble contributions.

Conflicts of Interest

The authors declare no conflicts of interest.

References

  1. Liu, R.-P.; Xu, Y.-N.; Rui, H.-C.; El-Wardany, R.M.; Dong, Y. Migration and speciation transformation mechanisms of mercury in undercurrent zones of the Tongguan gold mining area, Shaanxi Loess Plateau and impact on the environment. China Geol. 2021, 4, 311–328. [Google Scholar]
  2. Georgin, J.; Franco, D.S.P.; Dehmani, Y.; Nguyen-Tri, P.; El Messaoudi, N. Current status of advancement in remediation technologies for the toxic metal mercury in the environment: A critical review. Sci. Total Environ. 2024, 947, 174501. [Google Scholar] [CrossRef] [PubMed]
  3. Kang, B.; Wang, J.; Guo, S.; Yang, L. Mercury-induced toxicity: Mechanisms, molecular pathways, and gene regulation. Sci. Total Environ. 2024, 943, 173577. [Google Scholar] [CrossRef]
  4. Aleku, D.L.; Lazareva, O.; Pichler, T. Mercury in groundwater—Source, transport and remediation. Appl. Geochem. 2024, 170, 106060. [Google Scholar] [CrossRef]
  5. Liu, B.; Tian, K.; He, Y.; Hu, W.; Huang, B.; Zhang, X.; Zhao, L.; Teng, Y. Dominant roles of torrential floods and atmospheric deposition revealed by quantitative source apportionment of potentially toxic elements in agricultural soils around a historical mercury mine. Southwest China Ecotoxicol. Environ. Safety 2022, 242, 113854. [Google Scholar] [CrossRef] [PubMed]
  6. Hong, Y.-S.; Kim, Y.-M.; Lee, K.-E. Methylmercury Exposure and Health Effects. J. Prev. Med. Public Health 2012, 45, 353–363. [Google Scholar] [CrossRef]
  7. Mahaffey, K.R.; Clickner, R.P.; Bodurow, C.C. Blood organic mercury and dietary mercury intake: National Health and Nutrition Examination Survey, 1999 and 2000. Environ. Health Perspect. 2004, 112, 562–570. [Google Scholar]
  8. Marcello, M.V.; Omotayo, F. A review of the failed attempts to curb mercury use at artisanal gold mines and a proposed solution. Extr. Ind. Soc. 2020, 7, 1135–1146. [Google Scholar] [CrossRef]
  9. Feng, X.; Dai, Q.Q.; Qiu, G.L.; Li, G.H.; He, L.; Wang, D.Y. Gold mining related mercury contamination in Tongguan, Shaanxi Province, PR China. Appl. Geochem. 2006, 21, 1955–1968. [Google Scholar] [CrossRef]
  10. Feng, X.; Li, G.; Qiu, G. A preliminary study on mercury contamination to the environment from artisanal zinc smelting using indigenous methods in Hezhang County, Guizhou, China: Part 2. Mercury contaminations to soil and crop. Sci. Total Environ. 2006, 368, 47–55. [Google Scholar] [CrossRef]
  11. Ferrara, R.; Mazzolai, B.; Lanzillota, E.; Nucaro, E.; Pirrone, N. Volcanoes as emission sources of atmospheric mercury in the Mediterranean basin. Sci Total Environ. 2000, 259, 115–121. [Google Scholar] [PubMed]
  12. Fiorentino, J.C.; Enzweiler, J.; Angélica, R.S. Geochemistry of mercury along a soil profile compared to other elements and to the parental rock: Evidence of external input. Water Air Soil Pollut. 2011, 221, 63–75. [Google Scholar]
  13. Peña-Rodríguez, S.; Pontevedra-Pombal, X.; Fernández-Calviño, D.; Taboada, T.; Arias-Estévez, M.; Martínez-Cortizas, A.; Nóvoa-Muñoz, J.C. Mercury content in volcanic soils across Europe and its relationship with soil properties. J. Soils Sediments 2012, 12, 542–555. [Google Scholar] [CrossRef]
  14. Kotalik, C.J.; Willacker, J.J.; Wesner, J.S.; Johnson, B.L.; Flanagan Pritz, C.M.; Nelson, S.J.; Walters, D.M.; Eagles-Smith, C.A. Ecosystem Drivers of Freshwater Mercury Bioaccumulation Are Con-text-Dependent: Insights from Continental-Scale Modeling. Environ. Sci. Technol. 2025, 59, 1780–1789. [Google Scholar] [CrossRef] [PubMed] [PubMed Central]
  15. Johannesson, K.H.; Neumann, K. Geochemical cycling of mercury in a deep, confined aquifer: Insights from biogeochemical reactive transport modeling Geochem. Cosmochim. Acta. 2013, 106, 25–43. [Google Scholar]
  16. Grassi, S.; Netti, R. Sea water intrusion and mercury pollution of some coastal aquifers in the province of Grosseto (Southern Tuscany–Italy). J. Hydrol. 2000, 237, 198–211. [Google Scholar]
  17. Bagnato, E.; Aiuppa, A.; Parello, F.; D’alessandro, W.; Allard, P. Calabrese Mercury concentration, speciation and budget in volcanic aquifers: Italy and Guadeloupe (Lesser Antilles). J. Volcanol. Geoth. Res. 2009, 179, 96–106. [Google Scholar]
  18. Smith, K.D.; Lacerda, L.D.; Mendes, M. Mercury in the environment: Biological, geological, and environmental perspectives. Sci. Total Environ. 2014, 476, 102–116. [Google Scholar]
  19. Bashir, M.J.K.; Zhang, Z.; Lu, X. Mercury in the environment: A review of its sources, toxicology, and remediation techniques. Environ. Sci. Pollut. Res. 2019, 26, 7479–7494. [Google Scholar]
  20. Moussa, B.; Yahia, H. Contamination by mercury of groundwater of the North Numidian zone of Azzaba, North East Algeria. Effect of inorganic mercury contamination of population. Int. J. Environ. Waste Manag. 2012, 9, 347–357. [Google Scholar]
  21. Charvát, P.; Klimeš, L.; Pospíšil, J.; Klemeš, J.J.; Varbanov, P.S. An overview of mercury emissions in the energy industry—A step to mercury footprint assessment. J. Clean. Prod. 2020, 267, 122087. [Google Scholar]
  22. Wiederhold, J.G.; Skyllberg, U.; Drott, A.; Jiskra, M.; Jonsson, S.; Bjorn, E.; Kretzschmar, R. Mercury Isotope Signatures in Contaminated Sediments as a Tracer for Local Industrial Pollution Sources. Environ. Sci. Technol. Environ. 2015, 49, 177–185. [Google Scholar]
  23. Lacerda, L.D.; Salomons, W. Mercury from gold and silver mining: A global as-sessment. In Mercury in the Environment; Springer: Berlin/Heidelberg, Germany, 2004; pp. 1–18. [Google Scholar]
  24. Brgm-Georisques, Les Risques Près de Chez Moi. Brametot (76). In: Géorisques [17/12/2023.], 223. Date de Consultation. 17 December 2023. Available online: https://www.georisques.gouv.fr/mes-risques/connaitre-les-risques-pres-de-chez-moi (accessed on 1 April 2025).
  25. Sauter, M. Impact sur les Eaux Souterraines d’une Installation de Compostage et de Mise en Décharge D’ordures Ménagères, Le cas de Brametot (76); BRGM: Paris, France, 1989. 20p. Available online: http://infoterre.brgm.fr/rapports/RR-30145-FR.pdf (accessed on 1 April 2025).
  26. Eberentz, P. Notice d’impact de la Décharge D’ordures Ménagères et de la Zone de Compostage de Brametot (76); Bureau de Recherches Géologiques et Minières, Service Géologique National: Orléans, France, 1978; 18p. [Google Scholar]
  27. Bureau de Recherches Géologiques et Minières. Carte et notice 0058. In Doudeville; BGRM: Paris, France; ISBN 9782715910584.
  28. Chevrier, B.; Lallier, S. Rapport D’expertise: Recherche de L’origine de la Qualité des Eaux des Piézomètres ISDND Brametot (76). BRGMRP-58895-FR. 2010. 19p. Available online: http://infoterre.brgm.fr/rapports/RP-58895-FR.pdf (accessed on 1 April 2025).
  29. Jorgensen, L.N.; Andersen, P.M. Integrated study of the Kraka Field. In Proceedings of the Offshore European, Aberdeen, UK, 3–6 September 1991. [Google Scholar] [CrossRef]
  30. Huerta-Diaz, M.; Tessier, A.; Carrigan, R. Geochemistry of trace metals associated with iron monosulphides and pyrite in organic freshwater sediment. Environ. Sci. Technol. 1996, 72, 2367–2372. [Google Scholar]
  31. Morse, J.W. Interaction of trace metals with authigenic sulfide minerals: Implications for their bioavailability. Mar. Chem. 1994, 46, 187–199. [Google Scholar]
  32. Bono, A. The Partitioning of Mercury Among the Solid Components of Sediments of the Saguenay Fjord, Quebec. Master Thesis, McGill University, Montreal, QC, Canada, 1997. [Google Scholar]
  33. Cossa, D.; Coquery, M.; Gobeil, C.; Martin, J.M. Mercury Fluxes at the Ocean Margins. In Global and Regional Mercury Cycles: Sources, Fluxes and Mass Balances; Baeyens, W., Ebinghaus, R., Vasiliev, O., Eds.; NATO ASI Series; Springer: Berlin/Heidelberg, Germany, 1996; Volumn 21, pp. 229–247. [Google Scholar] [CrossRef]
  34. Quémerais, B.; Cossa, D.; Rondeau, B.; Pham, T.T.; Fortin, B. Mercury Distribution in relation to Iron and Manganese in the Waters of the St. Lawrence River. Sci. Total Environ. 1998, 213, 193–201. [Google Scholar] [PubMed]
  35. Roulet, M.; Lucotte, M. Geochemistry of mercury in pristine and flooded ferralitic soils of a tropical rainforest in French Guiana, South America. Water Air Soil Pollut. 1995, 80, 1079–1088. [Google Scholar] [CrossRef]
  36. Domenico, P.A. Schwartz, F W. Physical and Chemical Hydrogeology; John Wiley & Sons: Hoboken, NJ, USA, 1998; 505p. [Google Scholar]
  37. Allen, D.J.; Brewerton, L.J.; Coleby, L.M.; Gibbs, B.R.; Lewis, M.A.; MacDonald, A.M.; Wagstaff, S.J.; Williams, A.T. The Physical Properties of Major Aquifers in England and Wales; British Geological Survey Technical Report WD/97/34; Environment Agency R&D Publication: Washington, DC, USA, 1997; p. 312. [Google Scholar]
  38. Price, M.; Low, R.G.; McCann, C. Mechanisms of water storage and flow in the un-saturated zone of the Chalk aquifer. J. Hydrol. 2000, 233, 54–71. [Google Scholar]
  39. Thomassin, J.F.; Touze, S.; Baranger, P.; Freyssinet, P. Le Mercure et ses Composés Comportement dans les Sols, les Eaux et les Boues de Sédiments; BRGM: Orléans, France, 2003; BRGM/RP 51980 Fr; 119p. [Google Scholar]
  40. Valentin-Rouy, N.; Huet, S. Comportement de certains micropolluants métalliques dans le sol et les produits agricoles après épandage de boues urbaines, Suivi parallèle de l’azote et du phosphore 1995–2004. In Aspects Sanitaires et Environnementaux de L’épandage Agricole des Boues D’épuration Urbaines; ADEME Journées Tech: Montrouge, France, 1997; 320p. [Google Scholar]
  41. Sigg, L.; Behra, P.; Stumm, W. Chimie des Milieux Aquatiques; Dunod: Paris, France, 2014; 514p, ISBN 978-2-10-058801-5. [Google Scholar]
  42. McLean, J.E. Behavior of Metals in Soils; Technology Innovation Office, Office of Solid Waste and Emergency Response: Washington, DC, USA, 1992. [Google Scholar]
  43. Rae, J.E.; Aston, S.R. The role of suspended solids in the estuarine geochemistry of mercury. Water Res. 1982, 16, 649–654. [Google Scholar] [CrossRef]
Figure 1. (a) Location of the Normandy region; (b) location of the Brametot department and the study area, discharge and waste storage center.
Water 17 01087 g001
Figure 2. Repartition of the temperature and the rainfall in the Brametot region. (a). The upper graph shows an estimate of the average annual temperature for the Brametot region. The dashed blue line represents the linear trend of climate change. The lower part of the graph displays the “warming bands”, with each colored band representing the average temperature for a given year-blue for colder years and red for warmer years. (b). The lower graph shows an estimate of the total annual precipitation for the Brametot region. The dashed blue line represents the linear trend of climate change. In the lower section, the graph shows precipitation bands, with each colored band representing a year’s total precipitation—green for the wettest years and brown for the driest.
Water 17 01087 g002
Figure 3. Details of the storage area of the site (Sketch realized by SMITVAD, modified).
Water 17 01087 g003
Figure 4. Geological map of the study area (1/50,000 BRGM–INFOTERRE & SIGES).
Water 17 01087 g004
Figure 5. (a): Geological section of the study area; (b): geological log of the piezometer Pz0.
Water 17 01087 g005
Figure 6. (a) Location, coordinate of the piezometers, and (b) the altitude of the top of the chalk groundwater.
Water 17 01087 g006
Figure 7. Groundwater flow of the chalk aquifer (Brametot site).
Water 17 01087 g007
Figure 8. (a) Equivalent horizontal and vertical Hydraulic conductivity, (b) Infiltration and hydraulic characterization in the Brametot site.
Water 17 01087 g008
Figure 9. Evolution of mercury concentrations-pH in piezometers 4 (a) and 7 (b).
Water 17 01087 g009
Figure 10. Evolution and correlation of the mercury-SS in the Pz7 (a), mercury-manganese-iron in the Pz4 (b), and mercury-manganese (c) in Pz7.
Water 17 01087 g010
Table 1. Characteristics of piezometers (Brametot site).
PiezometerDiameter (mm)Pipe Height (m)Screen Tube Height (m)
Pzb2112/125no infono info
Pz080/900–5050–70
Pz180/900–33.633.6–47
Pz2112/125no infono info
Pz3112/125no infono info
Pz480/900–4040–65
Pz580/900–33.533.5–58.5
Pz680/900–2929–71
Pz780/900–2929–71
Pzb1112/1250–33.633.6–72.6
Table 2. Evolution of the Eh in piezometers of the Brametot site.
Eh Average
Pz0Pz1Pz4Pz5Pz6Pz7Pzb1
Total averages of the Hg (µg/L)0.100.093.320.550.100.930.20
Total averages of the Eh (mV)20846234184205161194
2004 15 18
2005 18 18
2006 19 21
200785 225237 225
2008296226202168 187
200913368380 85
2010304294 229241380280272
2011199149 21615319362213
2012 138−19204176215129172
2013263−62343370349139269
2014219−42204113112156138
2015144−7713810276144146
201636−47 18993800168
201725792 358280388257411
201828136342187227277307
20195343 363405050
2020433 261457
20212828118733100
2022 12
Table 3. Average of the Hg and SS in the all piezometers in the Brametot site.
Average of the SS Content for All Piezometers
Pz0Pz1Pz4Pz5Pz6Pz7Pzb1
Total averages of the Hg (µg/L)0.100.093.320.550.100.930.20
Total averages of the SS (mg/L)25156320473341561159
2004 370
2005 150 2620
2006 57 9055
2007389611477 1424
2008631445371 1845
20093257305531 1830
201034370 9 230
20113340 120 19
2012 254135153150100248
2013639295876215
201428693302603728
2015 1423101365514397
2016468 339974198
2017656 3837548730
2018312633611723490
20195343 363405050
2020433 261457
20212828118733100
2022 12
Table 4. Summary of hydrochemical results obtained during the 2023 campaign at the Brametot sit.
Compounds and parameters analyzedPiezometerPZ0PZ6PZB1PZ7PZ5PZ4PZ1Standards ’Guidelines for drinking water quality (Order of 11/1/01/07/Annex 1 (France))
Unit
In-situ parameters
Oxygene (%)%82.562.278.176.76989.2-
Temperature (°C)°C13.1614.3112.5613.3812.0513.09-
ConductiviyµS/cm-401407----
pH-7.97.917.897.857.817.77-
Redox Potentiel (Eh)mV4−0.10.535.27.7-
Major and Minor Elements
Phosphorus (P)mg/L0.151.410.341.430.28<0.000150.39
Sodium (Na)mg/L12.0910.4510.5622.2264.5512.4713.63200 mg/L
Potatium (K)mg/L0.420.671.101.485.260.781.04
Iron (Fe)µg/L77875662658011059318191200 µg/L
Magnesium (Mg)mg/L4.204.735.007.335.344.795.45
Manganese (Mn)µg/L147.7575.5213252.5842.79.3586.350 µg/L
Aluminium (Al)µg/L9531101806692926343920200 µg/L
Calcium (Ca)mg/L172.90659.70273.70499.10138.40136.20175.10
Rubidium (Rb)µg/L0.971.361.301.761.440.441.44
Cesium (Cs)µg/L0.110.100.090.090.040.010.05
Traces Elements
Berylium (Be)µg/L0.200.190.370.150.040.00380.04
Strontium (Sr)µg/L273.90928.93385.26728.38241.69215.75346.62
Baryum (Ba)µg/L24.7641.3325.5844.2743.9823.2849.16700 µg/L
Titanium (Ti)µg/L< 0.10< 0.10< 0.10< 0.10< 0.10< 0.10< 0.10
Vanadium (V)µg/L1.656.242.414.502.870.432.14
Chrome (Cr)µg/L19.537.522.815.362.491.503.8050 µg/L
Cobalt (Co)µg/L14.945.631.362.802.220.083.71
Nickel (Ni)µg/L53.2810.465.7512.805.061.8613.6920 µg/L
Copper (Cu)µg/L4.422.191.811.652.100.5010.441000 µg/L
Zinc (Zn)µg/L13.2720.0518.6326.909.173.2527.085000 µg/L
Cadmium (Cd)µg/L0.130.530.360.330.200.020.045 µg/L
Mercury (Hg)µg/L<0.50.71<0.5<0.5<0.51.07<0.51 µg/L
Gallium (Ga)µg/L0.730.480.340.360.240.060.25
Indium (In)µg/L0.0010.0040.0020.0030.001< 0.010.003
Plomb (Pb)µg/L1.773.311.702.081.390.083.5810 µg/L
Bismuth (Bi)µg/L0.020.030.020.020.020.010.02
Metalloides
Silicium (Si)mg/L6.067.605.656.486.385.885.81
Lanthanide Elements
Lanthane (La)ng/L738189404465602485954752
Cerium (Ce)ng/L69619711518290202046652031
Praseodyme (Pr)ng/L25561760994122021711192
Neodyme (Nd)ng/L1082070654069487481745753
Samarium (Sm)ng/L2565151795610581919160
Europium (Eu)ng/L59136023326343335
Gadolinium (Gd)ng/L240017061040124820513169
Terbium (Tb)ng/L32723314316727224
Dysprosium (Dy)ng/L1785140985710141579131
Holmium (Ho)ng/L32328217920229225
Erbium (Er)ng/L83478848656080667
Thulium (Tm)ng/L969061641018
Ytterbium (Yb)ng/L63660139142665453
Lutécium (Lu)ng/L85855762100.38
Actinide Elements
Thorium (Th)µg/L0.130.100.120.180.020.0030.10
Uranium (U)µg/L121110.50.2
Disclaimer/Publisher’s Note: The statements, opinions and data contained in all publications are solely those of the individual author(s) and contributor(s) and not of MDPI and/or the editor(s). MDPI and/or the editor(s) disclaim responsibility for any injury to people or property resulting from any ideas, methods, instructions or products referred to in the content.

