1. Introduction
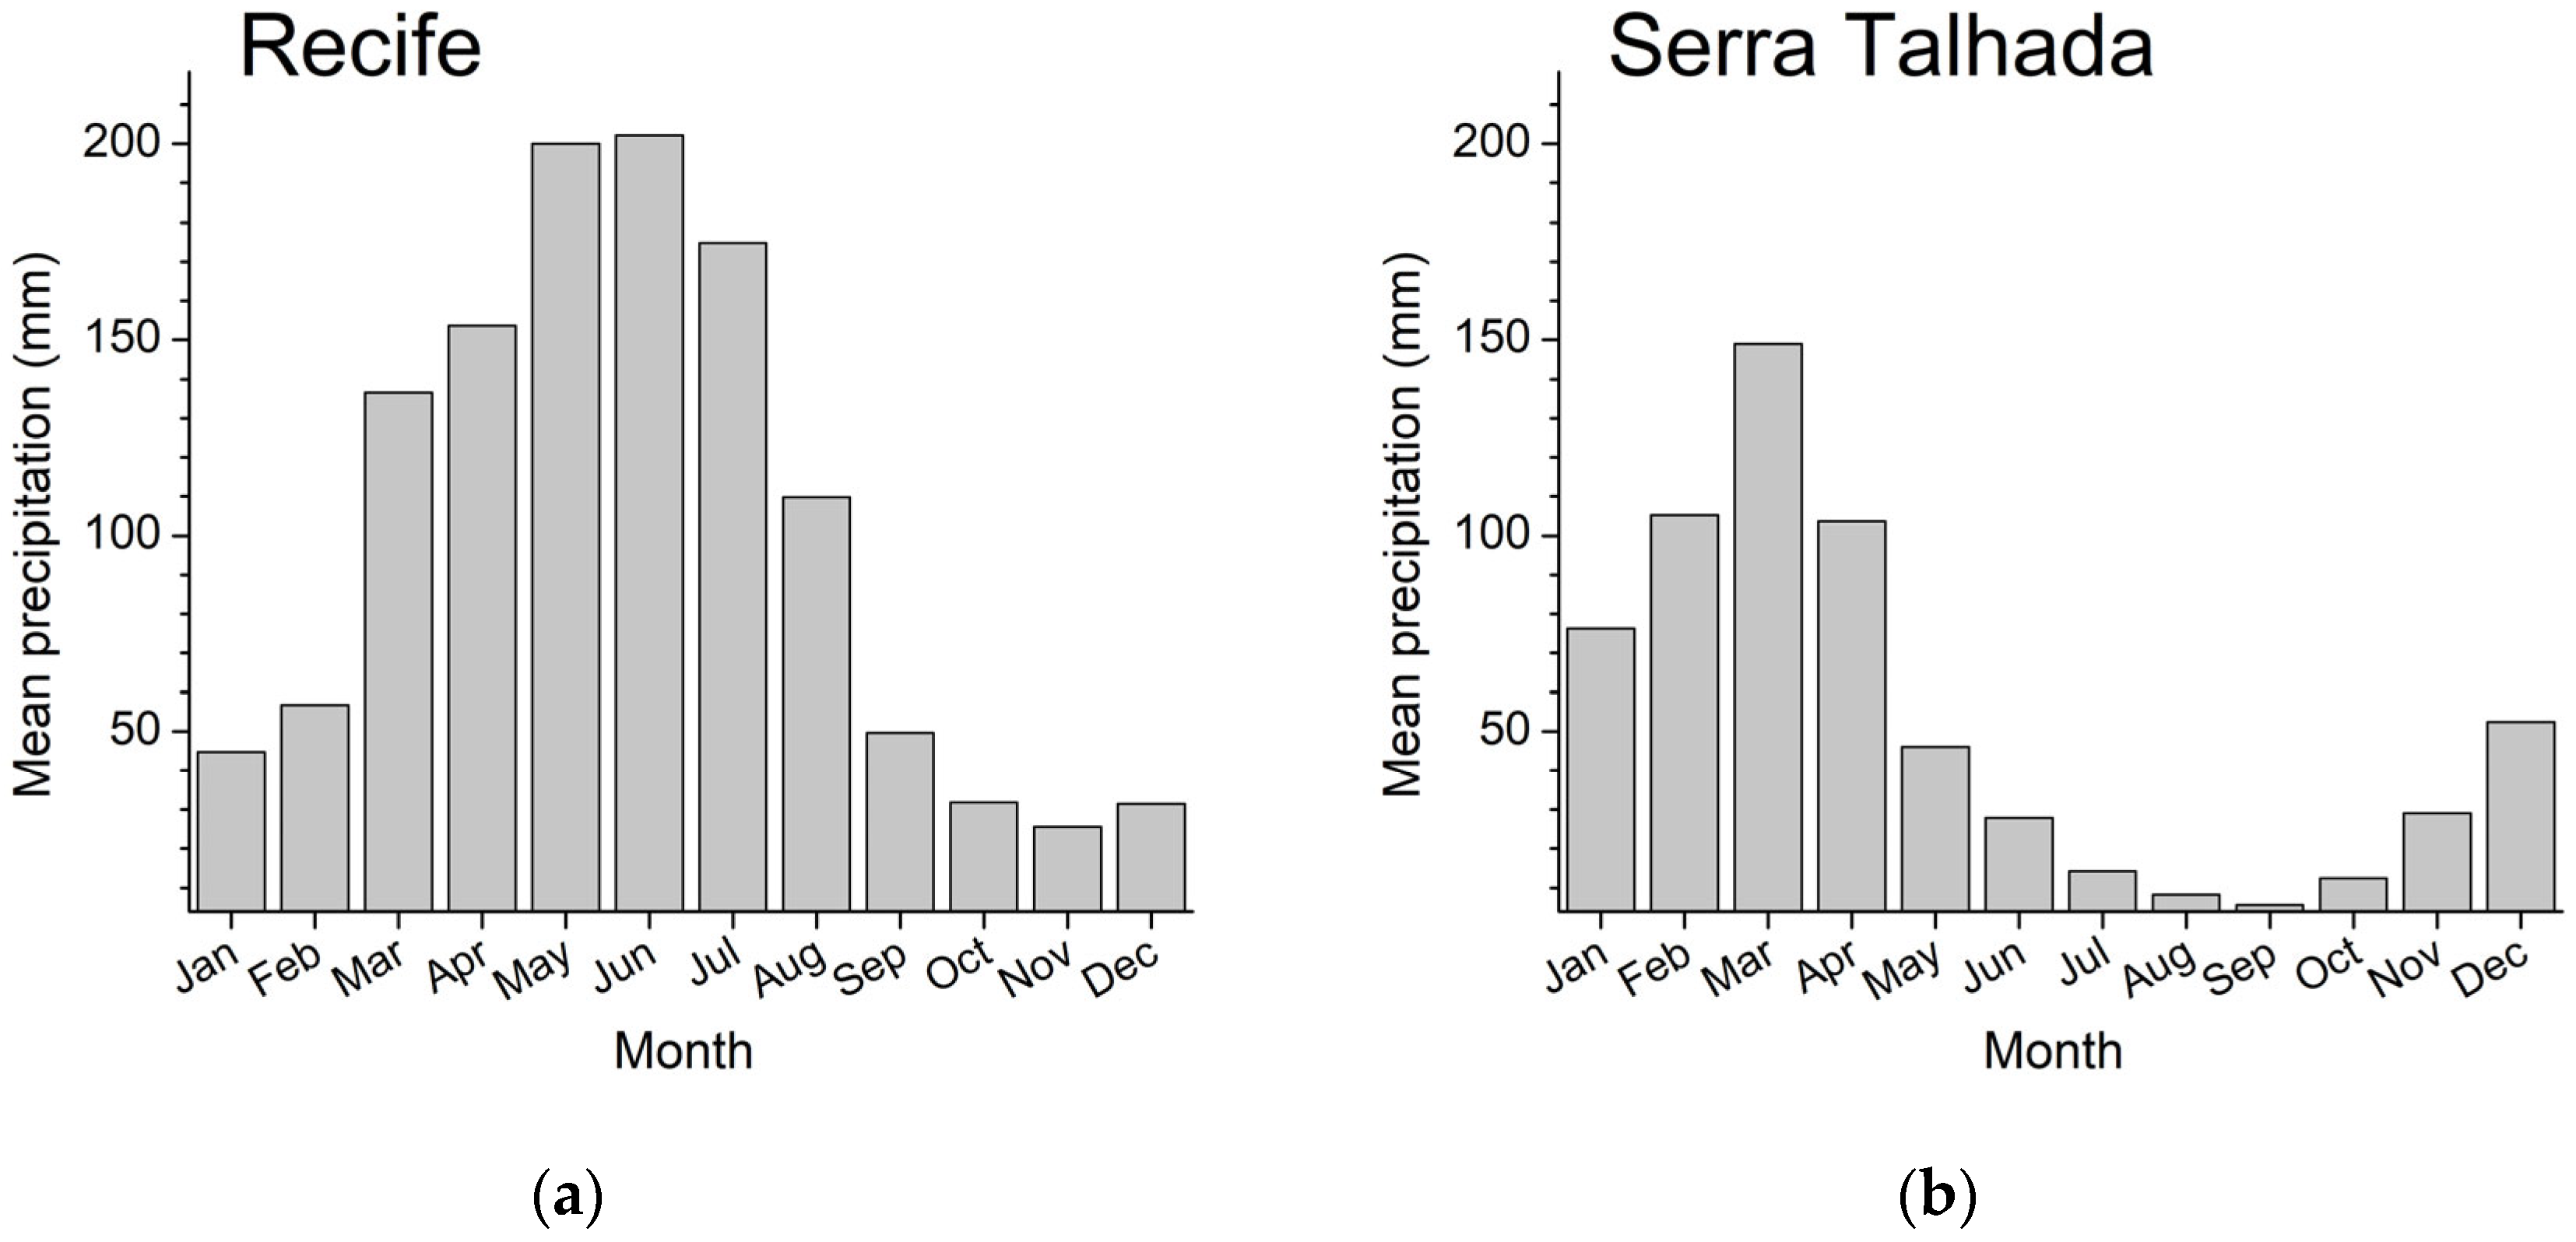
The rainy season in the Brazilian Northeast (NE) depends strongly on the geographic location. For instance, the NE capital Recife, which is located in the coastal area of the state of Pernambuco, experiences excess rain from March to August [
1], while the city of Serra Talhada, only 400 km away, in the interior of the state of Pernambuco (located in the semiarid area), experiences concentrated rain in the period from January to April [
2]. Several studies report that six consecutive rainy months vary across NE: between January and June in the northern part, between March and August in the eastern coastal area, and between November and April in the southern part [
3,
4,
5]. Based on rainfall data from 148 stations covering the 1972–2002 period, Oliveira et al. [
4] identified three rainiest months across NE: March, April, and May in the northern part, June, July, and August in the eastern coastal area, and December, January, and February in the southern part.
Northeast Brazil is one of the regions most vulnerable to climate change worldwide, with an area of
and
inhabitants. In terms of size, the Brazilian Northeast region is compatible with the world’s largest countries (the NE land area is smaller than that of only 16 out of 195 countries, and in terms of population size, NE falls below only 25 countries). The welfare of its habitants highly depends on climate conditions that vary from recurrent and prolonged drought in the semiarid area, where the rural population is primarily dependent on subsistence agriculture [
6,
7], to flash floods in coastal regions that can trigger massive landslides, which can cause numerous fatalities [
8,
9]. These extreme conditions are related to the interannual variability of large-scale oscillation systems, El Niño–Southern Oscillation (ENSO) in the equatorial Indo-Pacific Ocean, and the meridional sea surface temperature gradient (MGRAD) over the tropical Atlantic. During the positive phase of ENSO (El Niño) and the negative phase of MGRAD, there is a decrease in rainfall over NE, while during the negative phase of ENSO (La Niña) and the positive phase of MGRAD, the rainfall in NE is above the average. In general, severe and prolonged droughts occur in El Niño years, in which the direct impact of ENSO is amplified by pre-existing Atlantic sea surface temperature (SST) anomalies [
10]. Intra-annual variability is characterized by well-defined seasonal patterns, which are related to the seasonal displacement of the Atlantic intertropical convergence zone (ITCZ) [
11,
12]. The seasonal cycle of rainfall in NE affects energy production [
13], carbon storage in the tropical dry forest [
14], agricultural productivity [
15], and water quality [
16]. Regions characterized by high rainfall seasonality tend to have a higher percentage of total annual precipitation concentrated during the short period of time, which leads to a higher probability of flood occurrence [
17]. In order to mitigate water-related hazards, which can compromise various economic sectors, such as energy production, agriculture [
18,
19], and infrastructure [
20], and affect ecosystems [
21] and human health [
22], it is fundamental to enhance our understanding of the variability of rainfall anomalies at different temporal and spatial scales, especially in the regions with vulnerable population and higher frequency of severe droughts. To this end, a systematic quantification of the rainy and dry seasons from historical data, at different geographic locations across the Brazilian NE, appears to be of utmost importance.
Currently, a systematic, spatially explicit quantification of the rainy season duration and timing for the Brazilian Northeast, based on established statistical methods, is still lacking in the literature. Recent studies in this direction provide results based on monthly rainfall climatology, identifying six rainiest months and the three peak months of the rainy season. The results depend on the dataset used and the period considered. Rao et al. [
3] studied rainfall regime in Brazil using the global daily precipitation data from the Climate Research Center (CPC) with a horizontal resolution of 0.50 latitude/longitude and a time span from 1979 to 2011. For the NE, they found that the three rainiest months were FMA in the northern part, JFM in the central part, NDJ in the southern part, and MJJ in the eastern coastal part. Using station data for approximately the same period, Oliveira et al. [
4] found peak of the rainy season to be shifted forward by one month: MAM in the northern part, DJF in the southern part, and JJA in the eastern coastal part. Rainfall seasonality can be investigated using monthly rainfall climatology [
3,
4] by identifying the onset and cessation of the wet season [
23,
24] and using specially designed indices, such as the statistics-based precipitation seasonality index SI [
25], which classify rainfall regime according to the degree of variability in monthly rainfall throughout the year. When calculated for the entire period and as an average of individual years, SI provides the information of the replicability of rainfall regime at a certain location [
26,
27]. However, a complete description of rainfall seasonality requires knowledge of the magnitude, duration, and timing of the wet season.
Feng et al. [
28] introduced the relative entropy (RE) method based on information theory, which provides a set of indicators for the quantification of the magnitude, duration, and timing of the wet season. This method was shown to be successful for regions with well-defined wet and dry seasons and was used with both observational and model data [
29,
30,
31,
32,
33]. Tan et al. [
34] compared trends in precipitation seasonality using seven precipitation datasets (two gauge-based, one remote-sensing retrieval, and three reanalysis datasets) over the past three decades. They employed a statistics-based precipitation seasonality index (SI) and relative entropy-based dimensionless seasonality index (DSI). Their findings indicated that DSI is more sensitive to the uncertainties of monthly precipitation than SI, making it more suitable for comparing rainfall seasonality across different datasets. Additionally, DSI is more sensitive to changes in monthly precipitation regimes. However, the RE cannot distinguish unimodal from bimodal rainfall regimes and therefore it does not automatically provide a measure of the duration of the wet season; it works well for unimodal regimes such as the South Asian monsoon region [
29]. It turns out that while the precipitation regime in the Brazilian Northeast is unimodal, it is not strongly pronounced (such as e.g., South Asian monsoon), so that the RE method yields strong overestimates of the wet season.
The principal purpose of the current work is to introduce a modification of the relative entropy method through a choice of probability measure that yields the best results for rainy season quantification in our study area, in agreement with other local studies using traditional statistical techniques. The resulting geographically explicit quantification of the wet season across the Brazilian Northeast should be taken into account for agricultural planning and better management of water resources for renewable energy, as well for developing more efficient measures for the protection and mitigation of the impacts of water-related natural hazards (drought and floods).
2. Materials and Methods
2.1. Study Area
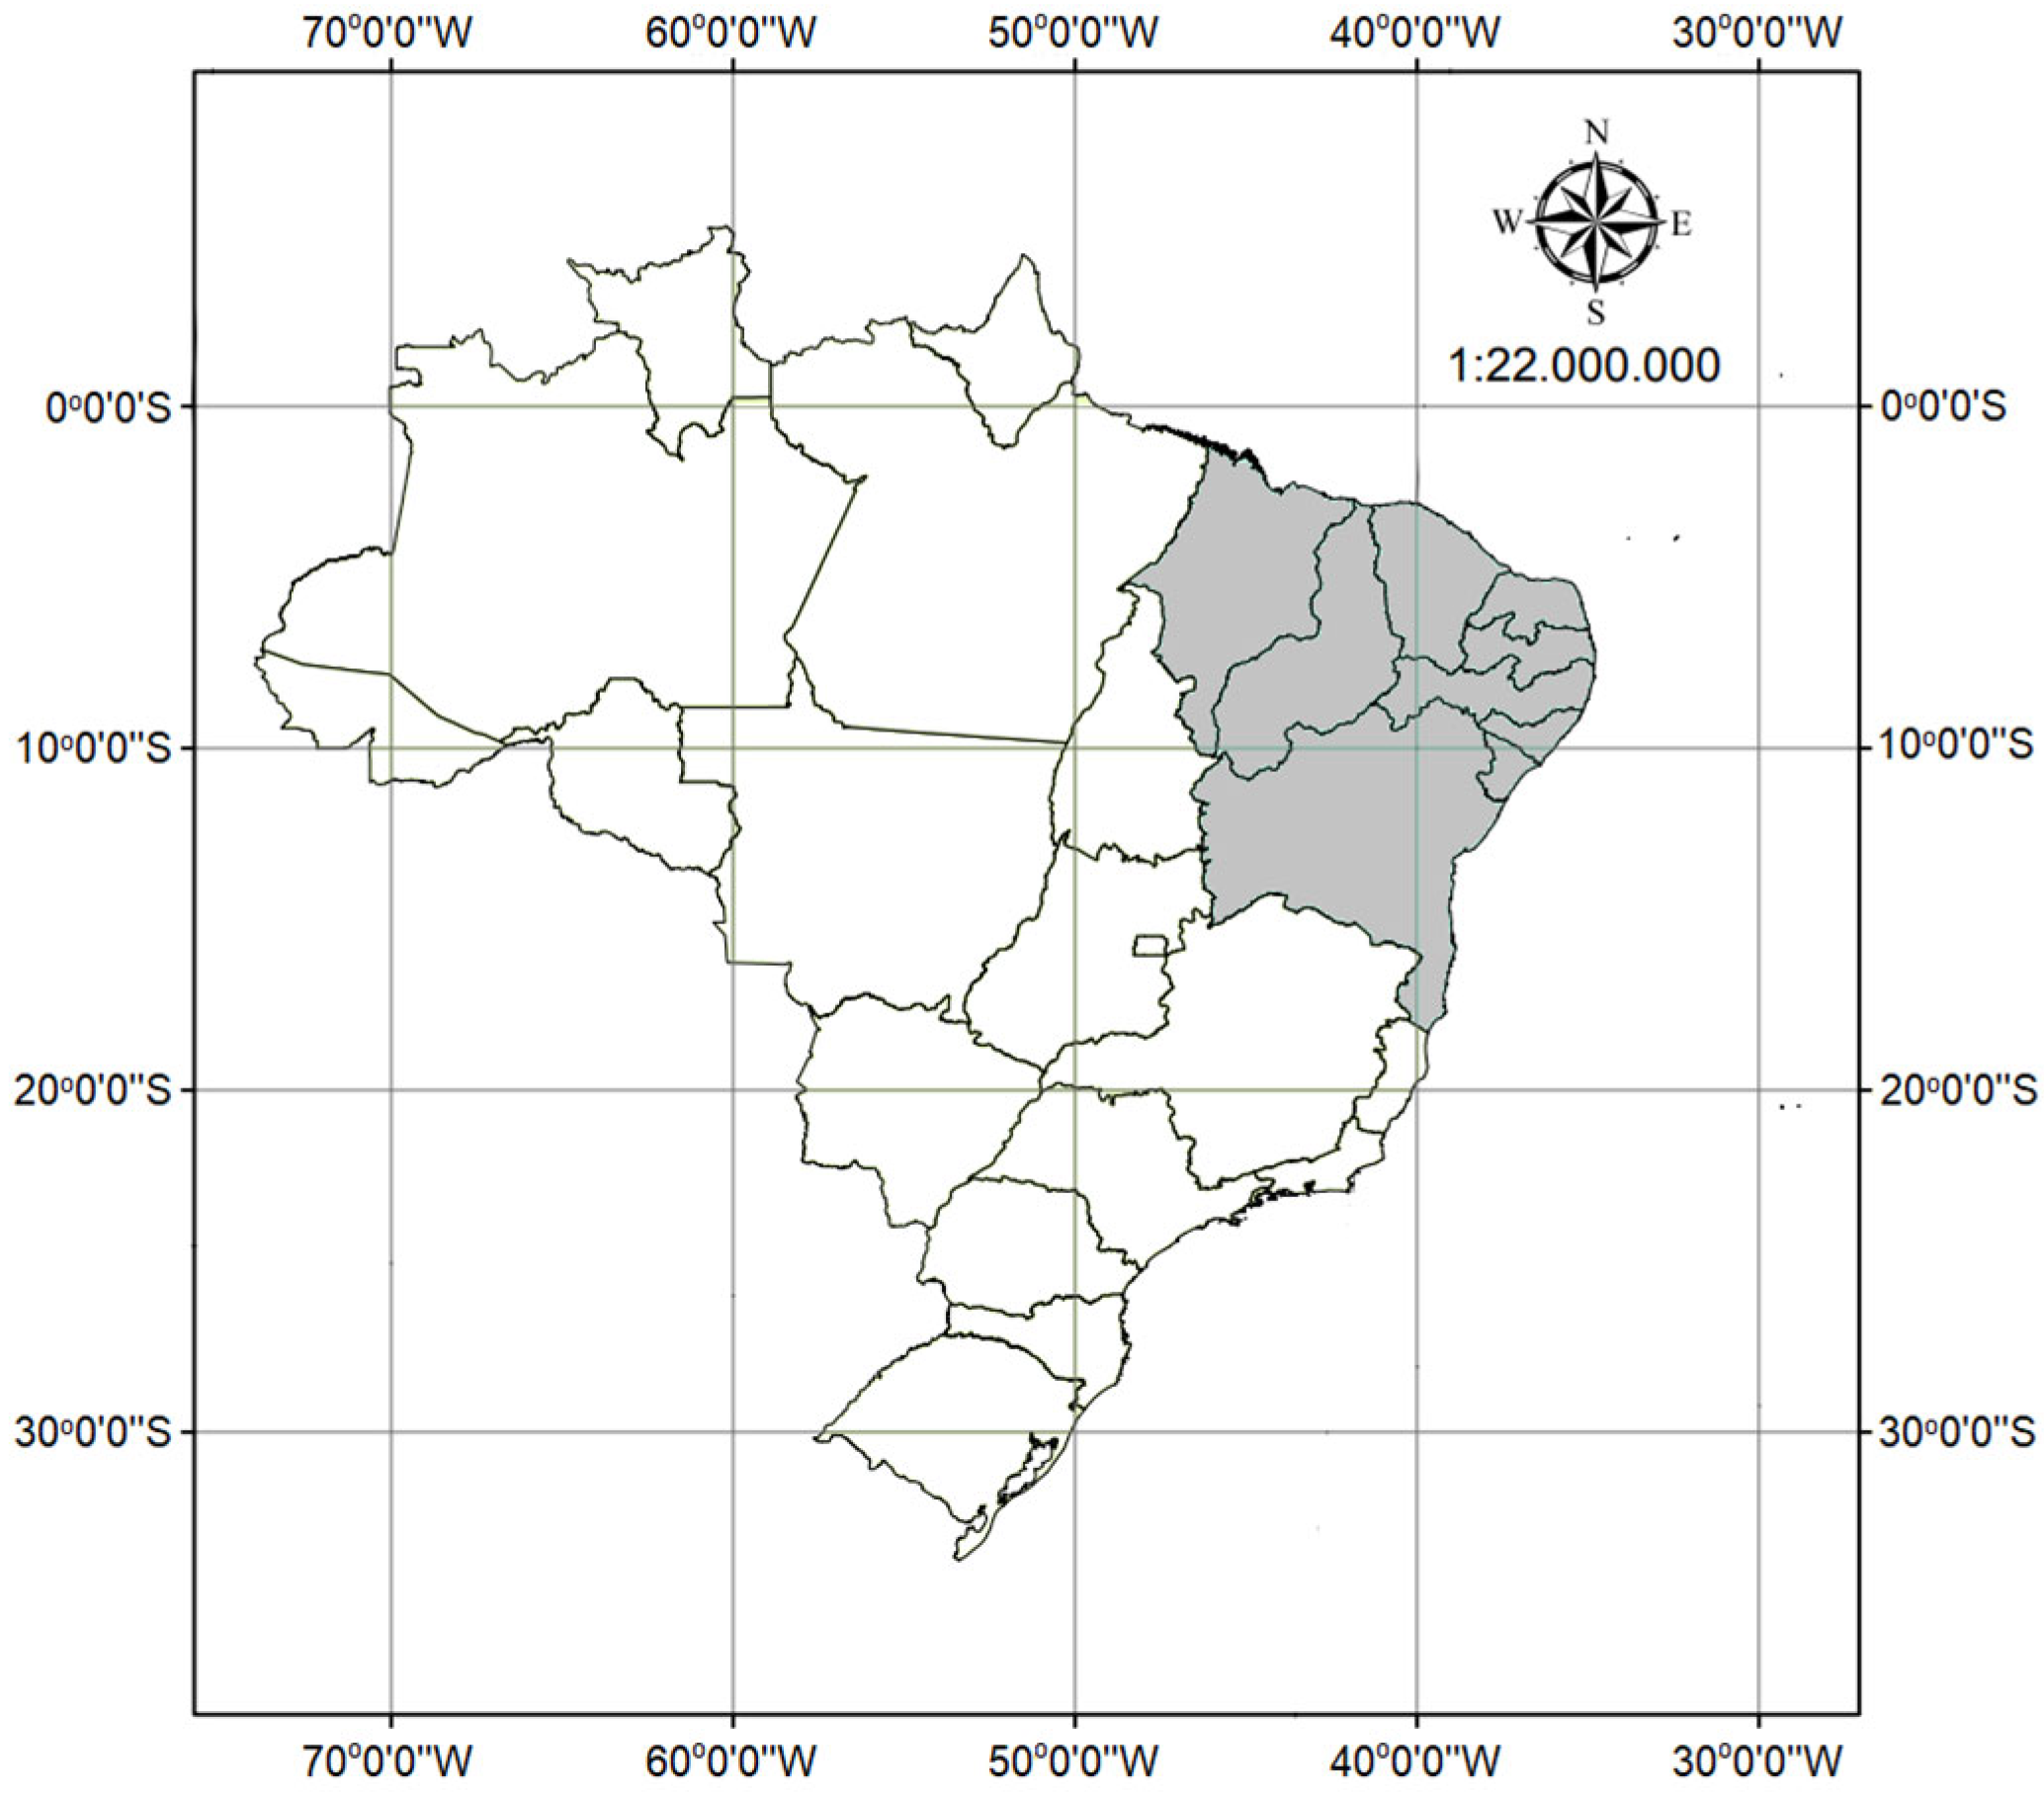
The Northeast Region of Brazil is one of the five official regions of the country, containing nine states: Maranhão, Piauí, Ceará, Rio Grande do Norte, Paraíba, Pernambuco, Alagoas, Sergipe, and Bahia. It is situated between the parallels 01°02′30″ North and 18°20′07″ South, and between the 34°47′30″ and 48°45′ meridians West. It is bordered to the north and east by the Atlantic Ocean, to the south by the states of Minas Gerais and Espírito Santo, and to the west by the states of Pará, Tocantins, and Goiás. It is one of the world’s most vulnerable regions to climate change, with an area of
and
inhabitants. The map of Brazil, with the highlighted Northeast region is shown in
Figure 1.
2.2. Data
ERA5-Land is an advanced reanalysis dataset that provides high-resolution (about 9 km) land surface data over the global domain [
35]. The high resolution of the dataset enhances the accuracy and detail of land surface representations, making it particularly valuable for localized studies. ERA5-Land provides a continuous record of land surface conditions from 1950 to the present, with hourly time resolution. This extensive temporal coverage supports long-term studies, climate monitoring, and trend analysis. The dataset is freely accessible through the Copernicus Climate Data Store (CDS). The CDS portal provides user-friendly tools and services for data retrieval and analysis, ensuring that researchers and practitioners can easily integrate ERA5-Land data into their workflows.
In this work we used data from the ERA5-Land for the period 1980 to 2022, as this period aligns with most of the other works that we compare it to. A total of 19,566 ERA5-Land grid points at a resolution of ~9 km were identified across the 1794 municipalities of the nine states of the Brazilian Northeast. For each grid point, the data were integrated into monthly precipitation series, with the goal of quantifying the timing and duration of the rainy season from historical data, in a geographically explicit manner.
2.3. Relative Entropy
The relative entropy method was introduced [
28,
29] to quantify the length and timing of the rainy season in the regions with a single pronounced rainy epoch, across the globe. For a given discrete probability distribution
information entropy (measure of uncertainty) is defined as
attaining a maximum of
for the uniform distribution
(maximum uncertainty), and a minimum of zero when only one of the
values is unity, all the others being zero (no uncertainty). For two distributions
and
the relative entropy (also known as Kullback–Leibler divergence)
measures the inefficiency of assuming
when the true distribution is
.
For the particular case of monthly rain distribution
, assuming uniform distribution (
leads to relative entropy
Relative entropy quantifies the strength of seasonality and varies between 0 for a uniform rain distribution across the year and when all the rain occurs in a single month.
The effective number of months of the rainy season duration is given by [
29]
and the centroid of the rainy season is given by [
29]
Regions for which
have
(non-seasonal rainfall regime with uniform precipitation distribution all year around), while regions with
have
(extreme seasonal rainfall regime with annual precipitation concentrated in a single month).
The quantities (strength of seasonality), (duration of the rainy season, in months), and (center of the rainy season), represent the principal foci of interest of the current work.
2.4. Modification of the Relative Entropy Method
To test the applicability of the Relative Entropy method for the Brazilian Northeast, a test was performed on precipitation data for Recife (Caxanga station) in the period 1911–1970 and Serra Talhada in the period 1911–1991, collected by the Superintendência de Desenvolvimento do Nordeste (SUDENE) and provided by APAC [
36,
37]. The original Relative Entropy definition yields values of
n~9.62 and
n~8.45 for Recife and Serra Talhada, respectively, in agreement with findings of Ref. [
29], but in disagreement with the commonly accepted values of
n = 6 months and
n = 4 months of the rainy season in the two regions [
1,
2]. The thresholding method adopted in [
28,
29] between the rainy season and the dry season may be adequate for some parts of the world, but here it appears too stringent, and the duration of the rainy season is significantly overestimated.
To mitigate this discrepancy between the results of the RE method and the “common sense” adopted by the scientific community (and community in general) for the Brazilian Northeast, rather than adopting the probability
as the ratio of precipitation in month
to total yearly precipitation, as reported in [
28,
29], here we address
the excess precipitation—the probability of precipitation above the mean, in any given month. More precisely, after the initial testing with the original Relative Entropy method [
29] for several municipalities using the SUDENE database [
36,
37], we observed that the results significantly overestimate the expected values. For the example of Recife and Serra Talhada, shown in
Figure 2, the RE method yields
n = 9.62 and
n = 8.45 months for the duration of the wet season, respectively, while it is well known that rain is more concentrated in the semiarid Sertão region of Serra Talhada (between January and April) than in Recife (March to August), in accord with findings of Refs. [
1,
2]. We therefore tried different functions of the relative frequency to “enhance” the effect of the rainiest months on the RE method results for the Brazilian Northeast (NEB), and it turned out that multiplying the relative frequency with the Heaviside theta function for the corresponding z-score (and then normalizing these products) worked the best, so we adopted this choice for this paper. For the particular case of Recife and Serra Talhada, this approach yields
n = 5.03 and
n = 3.59 months for the wet season duration, in agreement with [
1,
2].
To implement this procedure, first, the z-score
is calculated for each month
, where
is the average, and
is the monthly precipitation standard deviation, and the
excess precipitation probability is defined as
where
is the Heaviside step function,
for
and
for
.
The precipitation histograms for Recife and Serra Talhada, for the SUDENE data, are shown in
Figure 2, while the excess rain probability distributions, as defined in (6) for the two sites, are shown in
Figure 3. While Recife has had 1217 mm rain per year, in Serra Talhada, only 630 mm per year were observed. On the other hand, the probability of precipitation above the mean for the two sites shown in
Figure 3 shows that rain is more concentrated in Serra Talhada (between January and April) than in Recife (March to August), in accord with findings of Refs. [
1,
2].
Using the definition of excess precipitation probability (6) in Equations (3)–(5) leads to values of and n~3.59 for Recife and Serra Talhada, centered around June and March, respectively, in agreement with (albeit slightly underestimating) the widely accepted observational (phenomenological) conclusions.
The objective of this work is to implement this modification of the Relative Entropy method over the vortices across the Brazilian Northeast and thus establish geographically explicit areas of rainfall season duration and timing on purely phenomenological grounds, without assuming any functional form for precipitation probability distributions, and therefore free of any parametrization.
It should be stressed here that we do not expect this approach to work well across the globe, in particular when there is more than one rainy period in a calendar year. As Brazil is a country of continental size, and the NEB is an area comparable to the size of fewer than twenty largest countries in the world, and considering that all of NEB has a single pronounced wet season (albeit not as pronounced as in, e.g., in Sahara), it seemed reasonable (and practical) to proceed with the current analysis.
3. Results and Discussion
The mean monthly precipitation data from the ERA5-Land project across the Brazilian NE, for the period 1980 to 2022, is shown in
Figure 4, the results being quite compatible with the interpolated station precipitation data for the period 1904–1998 [
36]. Interpolation was implemented using the well-known Inverse Distance Squared method, while both the interpolation and rendering of the maps were achieved using software developed in house in C and CUDA programming languages (CUDA is a proprietary NVIDIA company language for programming their massively parallel GPGPU cards).
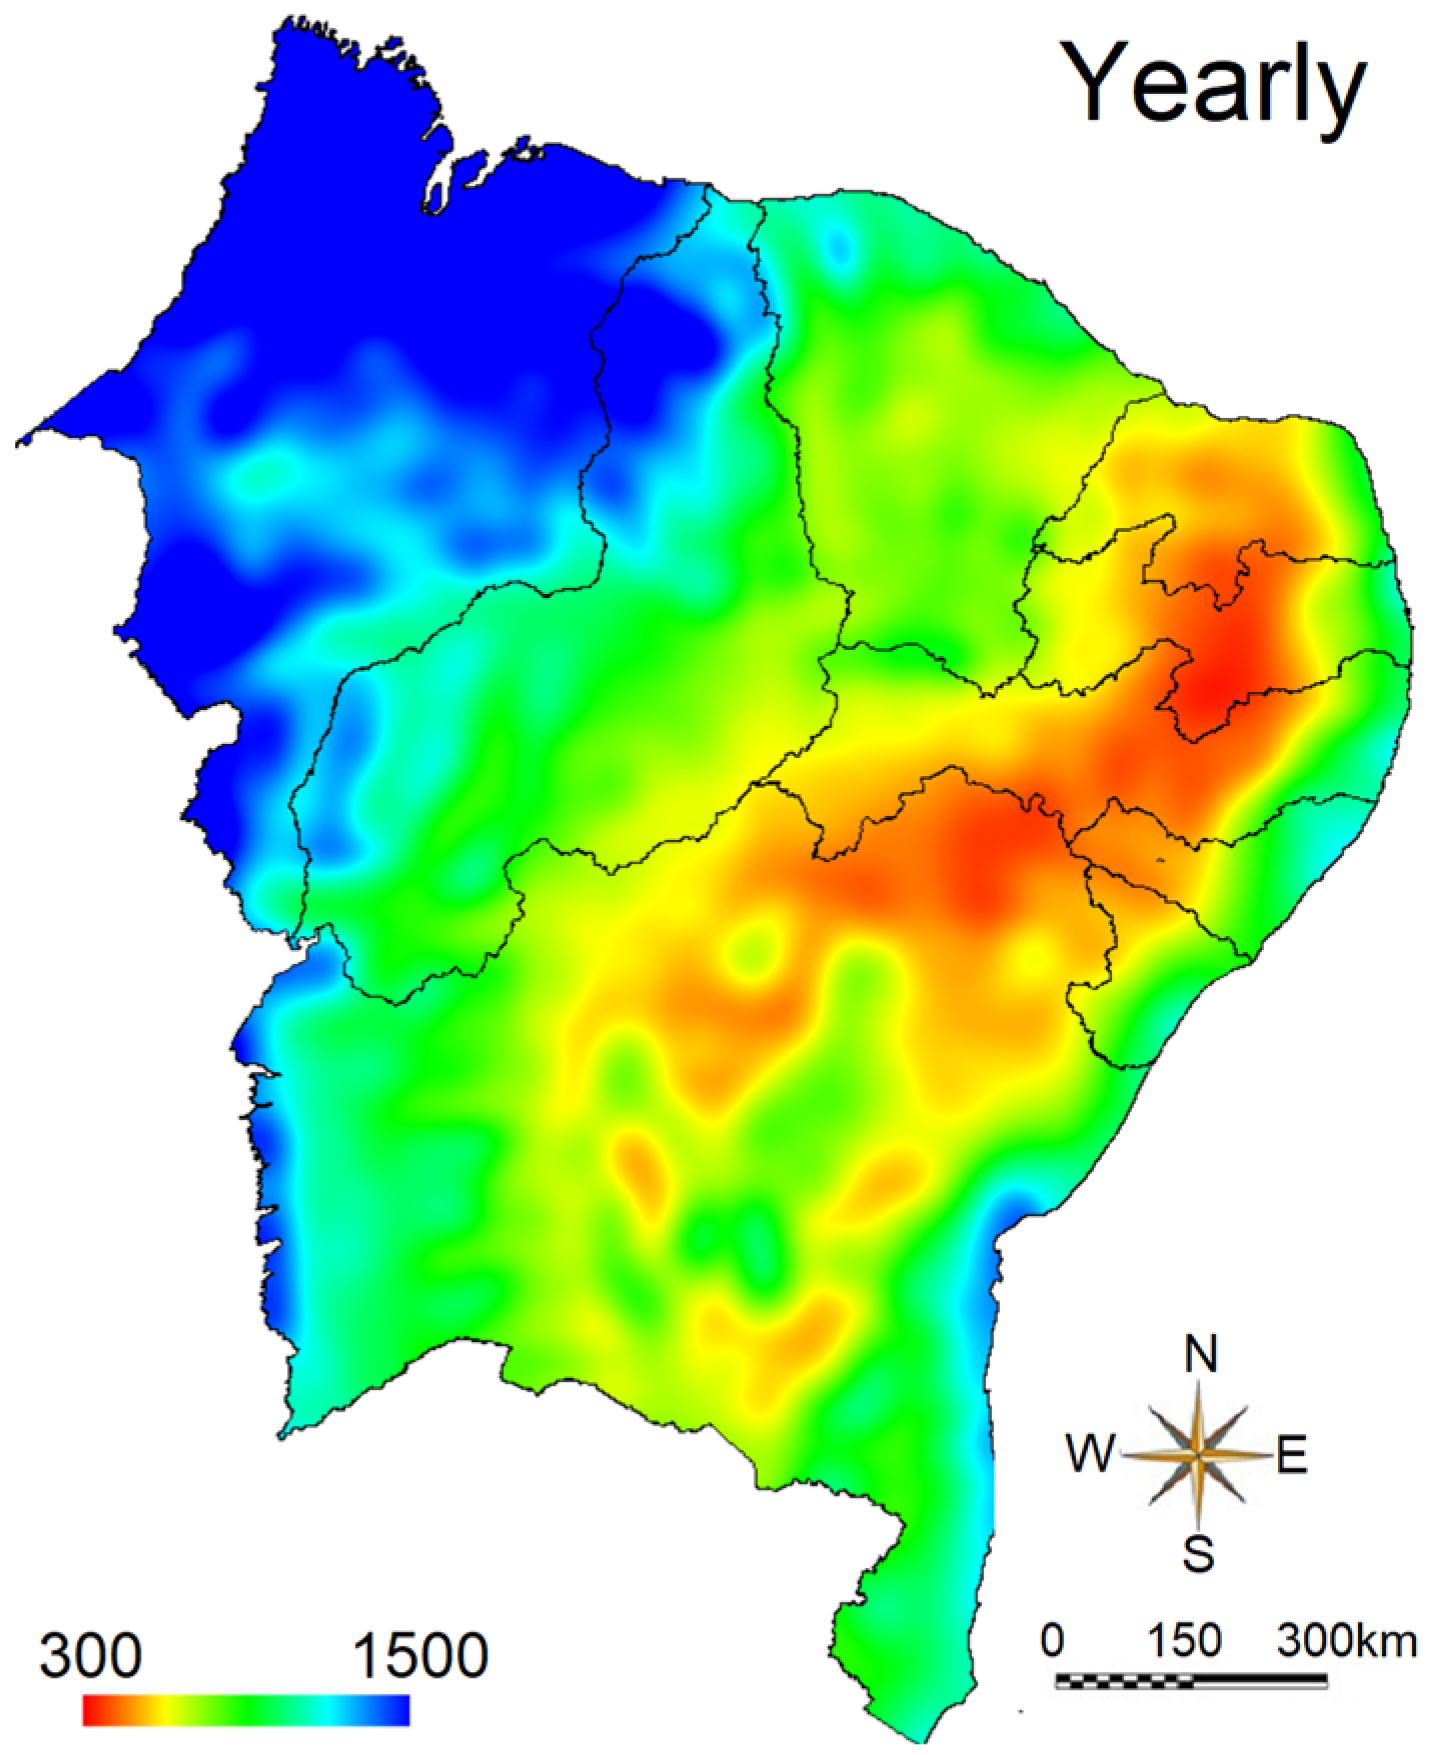
The mean yearly precipitation is shown in
Figure 5, where the orange/yellow region corresponds to the so called “Poligono das Secas” (the Drought Polygon).
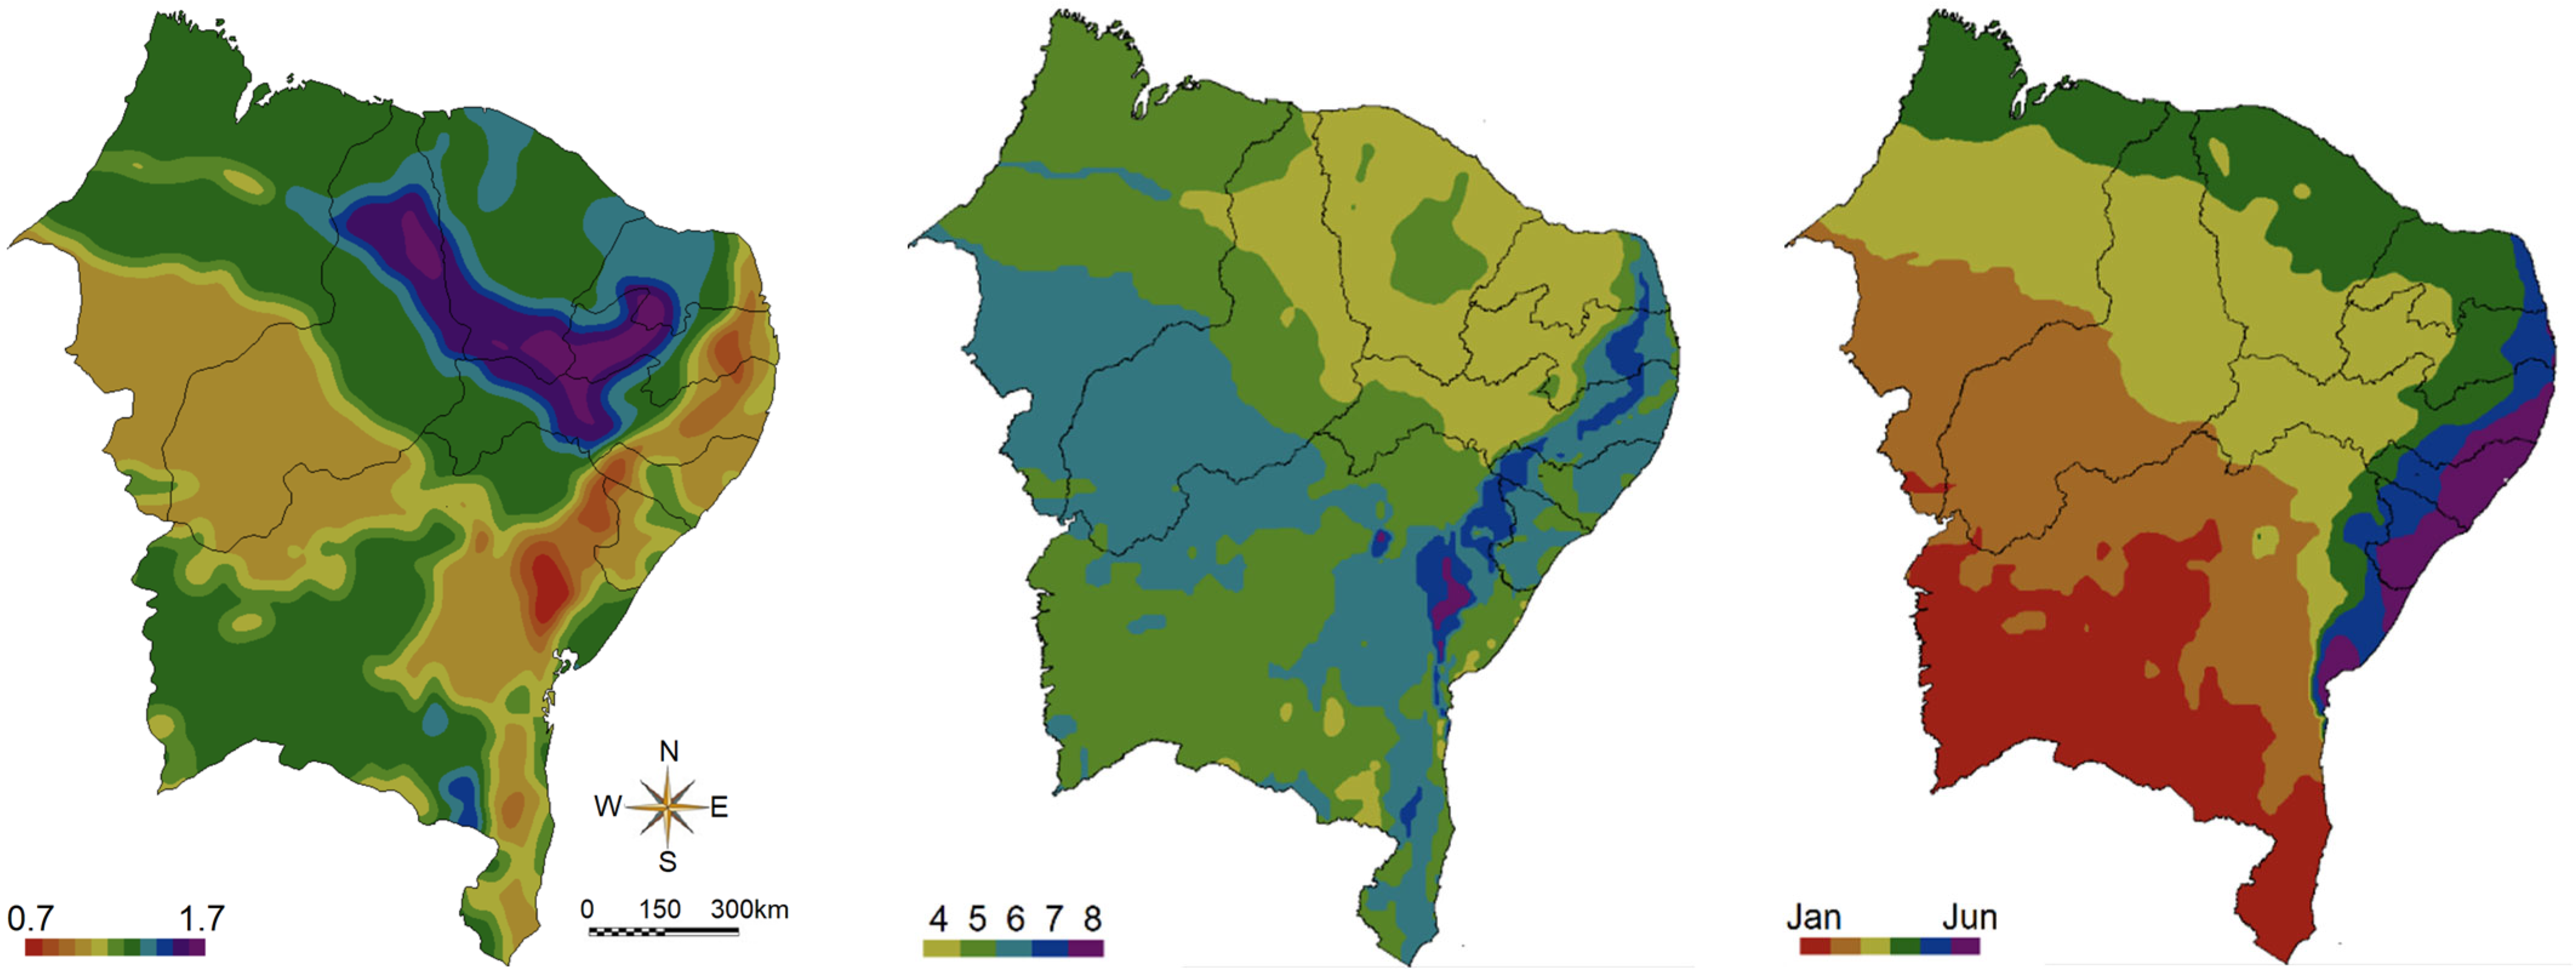
The main results of this work are presented in
Figure 6, where the strength of seasonality
, the duration of the rainy season in months
, and the center of the rainy season
are displayed across the Brazilian NE. The spatial distribution of
coincides with the rainiest months, as found in refs. [
3,
4], where different datasets were used. Rao et al. [
3] found that the three rainiest months were FMA in the northern part, JFM in the central part, NDJ in the southern part, and MJJ in the eastern coastal part, while Oliveira et al. [
4] found a peak of rainy season in MAM in the northern part, DJF in the southern part, and JJA in the eastern coastal part.
The results for the capitals of the nine NE states, including Alagoas (AL), Bahia (BA), Ceará (CE), Maranhão (MA), Paraíba (PB), Pernambuco (PE), Piauí (PI), Rio Grande do Norte (RN), and Sergipe (SE) are presented in
Table 1. The values of the duration of the wet season obtained using the original RE method are presented in parentheses, in italic letters.
Hänsel et al. [
38] investigated climate variability in the capitals of North-Eastern Brazil, based on temperature and precipitation data from nine meteorological stations recorded during the period 1961–2011. They found that the rainy season occurred in different periods in the northern and south-eastern stations. In the northern region, the wettest months are January to April in Teresina and January to June at São Luís and Fortaleza. The rainy season in other six stations spans from March to July, with peaks in April and May in Aracaju and Salvador, and from April to July at Natal, João Pessoa, Recife, and Maceió. The values of duration of the rainy season presented in
Table 1 agree with these results. For Terezinha, Recife, Maceo, Aracaju, and Salvador we obtained the same duration of the rainy season, for Sao Luiz and Fortaleza one month shorter, and for Natal and João Pessoa one month longer. The values for the center of the rainy season in Natal, João Pessoa, Recife, and Maceo agree with the period of highest rainfall in these cities found in [
32]. On the other hand, the values of the duration of the rainy season calculated using the original RE method (shown in parentheses in the second-to-last column of
Table 1) significantly overestimate these findings.
While all studies in this area had a local focus, here we apply the modified Relative Entropy method to quantify the wet season parameters across all of Brazilian northeast region (comparable in size to a large country), with high resolution. A comparison with these earlier (local) studies serves to validate our approach. Considering hourly and daily data is important for the study of extreme events. While we plan to engage in such research in the near future, our current choice of a monthly scale (consistent with that used in references [
28,
29], which introduced the original RE method) guarantees robust quantification of the rainy season across the area under study, which represents the scope of the current work.
Software
For ease of extraction of the rainy season parameters (strength, duration, and the center of the rainy season), together with the monthly precipitation series for any of the 19,566 grid cells on the map, or any of the 1794 municipalities (by averaging over the corresponding grid cells), we also provide user-friendly software with Graphical User Interface for the Windows platform, as presented in
Figure 7, as part of the
Supplementary Material of this paper. We also provide an Excel file containing the mean season parameters for all 1794 municipalities of the Brazilian NE.
The software displays a map of the Brazilian NE with state (dark gray) and municipality (medium gray) borders, together with (red) points corresponding to ERA5-Land grid vertex positions. The municipality of Barra, located in the state of Bahia (BA), is outlined in blue in
Figure 6, being the current choice, which may be changed through the combo box in the lower left part of the control dialog box, or by simply clicking the left mouse button with the cursor positioned anywhere inside the municipality—the point of choice is displayed as a red circle. As the cursor is moved across the map, the current cursor position and the corresponding local rain season parameters are displayed in the top part of the dialog box. The middle part of the control dialog box also allows the selection of a specific point by specifying the latitude and longitude values. Finally, the “Extract” button generates an ASCII file (displayed immediately in Notepad), where the pointwise or municipality average values are listed (together with the monthly precipitation sequence), depending on the selection of the “Municipality” or “Point” radio buttons. If the “Point” option is chosen, the values are calculated applying the Inverse Distance Squared method on up to four neighboring grid points (SW, SE, NW, and NE), while the points close to the NE border area may have less than four neighboring grid points, and the values are derived from these.
The software presented here in the
Supplementary Materials was developed for practical reasons, to aid researchers and practitioners concerned with the Brazilian Northeast. In the current version of the software, the data from ERA5-Land are integrated within the executable (so no software installation is required), and cannot be changed, nor can the equations be changed. Loading different databases with different resolutions, implementing different formulas, and the selection of a subperiod for the analysis will be addressed in future works.
4. Conclusions
We analyzed rainfall seasonality in the Brazilian Northeast (NE) by using the Relative Entropy (RE) method. To better align with the results of other works and with commonly accepted values for the length and the center of the rainy season in this region, we introduced the modification of the original RE method (MRE), which is based on the concept of excess precipitation—the probability of precipitation above the average. By applying the MRE approach on the ERA5-Land high resolution gridded dataset (~9 km) for the period 1980–2022, we obtained the spatial distribution of seasonal characteristics of rainfall (strength, duration, and center of the rainy season) across the NE. We found that the rainy season lasts 4–5 months in the northern region, 5–6 months in the central and southern regions, and 6–7 months in the eastern coastal region. The center of the rainy season ranges from February to March in the northern part, January to February in the central and southern parts, and April to June in the eastern coastal part. The results for the NE capitals agree well with the results obtained using classical statistical methods, while the original RE method overestimated by far the length of the rainy season.
We also developed dedicated user-friendly software that allows for the obtaining of the parameters of rainfall seasonality, together with the monthly precipitation series for any of the 19,566 points on the map or any of the 1794 municipalities (by averaging over the corresponding grid cells). The results of this study showed that the modified RE method provides reliable information about rainfall seasonality in the Brazilian NE, and it should be taken into account for agricultural planning, better planning for the efficient use of water resources, and for developing more efficient measures for the protection and mitigation of the impact from extreme water-related conditions (drought and floods). Finally, the proposed modification of RE should be used (alongside traditional approaches) to (i) compare the characteristics of rainfall seasonality generated from different datasets; (ii) investigate temporal trends in the length and center of rainy season and evaluate the impact of climate change; (iii) serve as metrics to validate the performance of General Circulation Models (GCMs); and (iv) analyze changes in rainfall seasonality for future climate projections influenced by human activities.
Our current approach can be used in other areas of the world with a single rainy season that is not as pronounced, such as the South Asian monsoon region (where the original RE method works well). Moreover, researchers and practitioners concerned with a specific area or municipality within the Brazilian Northeast can use our results to address their own research questions, or they can use the software provided in the
Supplementary Material to extract local historical precipitation series to address other research questions.


 ,
, 


