Article

Inflows into Wastewater and Stormwater Systems: Sources, Causes, and Assessment

by
Maria do Céu Almeida
*,
Rita Salgado Brito
and
Catarina Jorge
Urban Water Unit, National Laboratory for Civil Engineering, LNEC, Av. do Brasil 101, 1700-066 Lisbon, Portugal
*
Author to whom correspondence should be addressed.
Water 2025, 17(7), 1082; https://doi.org/10.3390/w17071082
Submission received: 7 February 2025 / Revised: 21 March 2025 / Accepted: 1 April 2025 / Published: 4 April 2025
(This article belongs to the Section Urban Water Management)

Abstract

:
Illicit or inappropriate inflows into urban drainage systems cause significant operational issues, impacting utilities, communities, and the environment. The continued deterioration of system assets increases these inflows. Groundwater infiltration, rain-derived inflows, and misconnections contribute to reduced system performance, amongst other detrimental inflows. Climate change effects and the revised EU Wastewater Treatment Directive put pressure on utilities to reduce combined sewage and polluted stormwater discharges and overflows while promoting carbon neutrality. The effective management of undue inflows requires identifying cause–effect relationships and quantifying their consequences. This paper proposes a performance-based methodology with metrics and reference values to assess and categorise various undue inflows in wastewater, stormwater, or combined systems. This approach allows the tracking of performance over time, the comparing of systems, and requires data commonly available to utilities. The reliable quantification of inflows depends on the availability and accuracy of flow data from relevant system locations, rainfall data, and pertinent contextual information. This paper uses data from eight utilities and the Portuguese regulator to validate its approach, calculate metrics, refine reference values and enable better-targeted control measures. The results enhance the value of a unified approach to this problem in making better decisions to improve the urban water drainage system’s performance, enhance pollution control, and promote sustainable water management.

1. Introduction

Undue inflows into sewers or natural drainage systems are a known source of functional problems and societal costs, e.g., [1,2]. These can relate to water volume increase, water quality issues, the increased use of energy and greenhouse gas (GHG) emissions, a higher number of untreated discharges and flooding events, detrimental impacts in receiving water bodies, and higher costs to society, e.g., [2,3,4]. These inflows contribute to the poor performance of systems and the deterioration of natural and built environments worldwide, e.g., [5,6,7,8,9,10]. The dimension of the problem is often unknown, yet managers and academics recognise it as crucial for the declining performance of drainage systems, treatment systems, and natural waters [1,2,3,4,5,6,7,8].
Climate change effects and the recast EU Wastewater Treatment Directive put pressure on utilities to reduce combined sewage and polluted stormwater discharges and overflows while promoting carbon neutrality. The revised directive concerning urban wastewater treatment [11] reflects the EU’s policy guidelines for addressing all sources of pollution. Specifically, it seeks to improve the knowledge and control of untreated discharges into receiving waters, which is particularly relevant for combined systems or any drainage system with undue inflows. The directive aims to reduce pollution from stormwater in agglomerations with a population equivalent (PE) of 10,000 or more, alongside the implementation of integrated urban water management plans. Climate trends, on the one hand, can accentuate the detrimental effects on wastewater and combined sewer systems, with negative consequences on natural systems and society because of more frequent and intense rainfall events [10,12,13,14,15,16]; on the other hand, extended periods of droughts and higher temperatures accelerate biochemical processes and the consequences on all types of systems, especially if receiving wastewater [14].
The terminology related to inflows to systems is somehow undefined and does not cover all possible and relevant situations. Most research has focused on specific inflows, e.g., [5,6,7,8,9,10]. For wastewater systems, it is common to address the “I/I”, meaning infiltration ‘from groundwater’ and ‘rainwater’ or ‘surface runoff water’ inflow, e.g., [17]. For stormwater systems, the common inflows addressed include illicit discharges, misconnections, cross-connections, or industrial effluents, e.g., [18]. Herein, the generic term for all sorts of inflows to drainage systems (separate, combined, or natural water bodies) is “undue inflows”, including illicit and inappropriate inflows independent of the system. Illicit inflows are those not complying with legislation or regulations. These undue inflows include infiltration, rainwater, high salinity water, and industrial effluents.
Even if an inflow is not illicit, it can be inappropriate, i.e., inflows that are detrimental to the system performance in different dimensions because of excessive volumes or flows, unacceptable water quality, or solids load. The latter also applies to illicit inflows.
In urbanised areas, undue inflows can occur in separate (wastewater or stormwater) systems, combined sewer systems, and natural drainage systems such as urban streams or coastal waters. Different inflows can be undue in any of these systems whenever they are not supposed to enter the system or negatively impact its performance. For instance, household wastewater is undue in separate stormwater systems and should enter the separate wastewater or combined systems. Effectiveness and efficiency improvements can result from managing all drainage systems in parallel instead of one system at a time; collaboration between utilities and managing bodies is essential. Furthermore, one should adopt a water cycle perspective when analysing undue inflows to have a broad understanding of the existing problems and causal mechanisms, even for utilities managing only one system. Knowledge of causal mechanisms is essential in identifying adequate solutions and preventing future occurrences, e.g., [9,19].
The managers and operational personnel of utilities often acknowledge some symptoms, consequences, or signs of undue inflows in everyday operations. Identifying the causes and mechanisms of undue inflows is more complex, requiring expertise, time, and often scarce resources, yet it is essential for effective problem control. Built systems may exhibit structural and operational deficiencies, including fissures, open joints, misconnections, surcharge, pumping station discharge issues, and flooding. Even though these deficiencies can arise from causes unrelated to undue inflows, it is acknowledged that such inflows can significantly worsen them [19,20]. Undue inflows into natural systems often lead to pollution.
Overall, undue inflows can have effects on performance from several points of view, such as the following [6]: (i) the hydraulic and structural performance because of a reduction in transport and treatment capacity, an increase in anomalies, and the continued degradation of assets materials; (ii) the environmental performance because of discharges into the natural environment (leading to soil and water pollution), to the decreasing efficiency of treatment facilities, and increasing total energy consumption and GHG emissions [3,4]; (iii) social performance, including potential effects on health and public safety, because of increased flooding (in frequency, duration, or peak flow), with ensuing inconvenience to traffic, damages to public or private property, and the potential increase in the likelihood of contact with polluted waters; (iv) economic and financial performance because of an increase in operating costs (e.g., increase in pumped flows and treatment costs) and costs to third parties; (v) non-compliance issues and a reduction in utility overall performance.
The quantification of these undue inflows, overall and per type, is of utmost importance in assessing the effects on system performance, identifying intervention needs, and selecting intervention priorities on subsystems and classes of components.
Various methodologies and guidelines have been proposed to examine specific systems, e.g., wastewater or stormwater systems [5,7,21]. Refs. [17,18] provide a literature review, respectively, on wastewater and stormwater systems and specific undue inflows such as infiltration, rainwater, high salinity water, and industrial effluents [5,6,17,18,22]. Ref. [19] evaluates non-stormwater inflows into stormwater systems, including river water, using a water balance approach. Techniques investigated in the literature include flow and conductivity measurements, the visual inspection of sewers or manholes, temperature monitoring (e.g., distributed temperature sensing), infrared camera, chemical, or microbiological parameters (e.g., ammonia, caffeine, detergents, and bacteria), UV–Vis acquisition, dye testing, analysis of the stable isotopes of oxygen and hydrogen, and smoke testing [23,24,25,26,27,28,29]. Most of these techniques are valuable to localise the sources of a specific inflow but are time and resource intensive; after an initial broad analysis to determine the priority areas or components in the systems and the specific undue inflow, one should proceed with the selection of the methods to locate and estimate the magnitude of the problem. However, due to the complexity of these problems, a broader view is necessary for decision-making.
Methods reported in the bibliography for different undue inflows can be used to feed a performance assessment system, allowing for the comparison of the performance in terms of undue inflows in time and between systems with different dimensions and characteristics. Such a comprehensive approach was not found in scientific or technical publications, but only the use of key performance indicators or metrics, e.g., [7,22], without a robust performance assessment structure, as presented in [3,30].
This paper presents a top-down approach to aid in the decision-making and planning process for investigating different undue inflows in drainage and natural systems. It considers various aspects of the water cycle, local contextual factors (such as the water table level, the condition of the sewer infrastructure, and proximity to the coast), system-specific characteristics (including whether the system is separate or combined), and typical cause-and-effect mechanisms associated with each type of undue inflow. Effective solutions benefit from identifying the specific causes of each type of undue inflow. Another relevant aspect of this approach is the use of various sources of information to allow utilities to proceed even if sophisticated data collection methods are unavailable.
The methodology is a result in itself. It includes a performance assessment system focused on a control strategy for managing undue inflows tailored to a utility or region. The proposed new set of objectives, criteria, and metrics helps estimate these undue flows, accounting for various sources and causal mechanisms, and facilitates the comparison between systems and performance through time. The developed metrics address limitations in flow data and other related information. A new method to decompose the hydrographs allows the use of a novel set of metrics not found in the published literature. This paper explains how to use available curated data and discusses the metrics’ limitations to contribute to well-informed and effective decisions.

2. Methodology and Data

2.1. Types of Undue Inflows

In this integrated approach, the included water systems comprise built or modified systems (separate wastewater, separate stormwater, combined systems, water supply systems, and fluvial canals) and natural systems (groundwater, fluvial, coastal, and estuarine waters). Water flows occur between these systems in a complex modified water cycle. The consideration of the types of flows, namely their origin, quantity, and water quality, allows a thorough identification of the undue inflows to each system.
The types of undue inflows to consider are as follows (Table 1): direct rainwater (e.g., runoff entering through surface water inlets, building drains or manhole covers); delayed rainwater (e.g., subsurface flows entering the systems well after the end of the rain event); the infiltration of groundwater, eventually polluted with, e.g., wastewater leakage from wastewater or combined sewers; inflow from the natural drainage network (fluvial); water losses from water supply systems; drainage from basements and similar; discharges from swimming pools and similar; household wastewater (non-industrial); industrial wastewater; wastewater from other sources (not household nor industrial, e.g., commercial or from the food and beverage sector); high-salinity inflows (e.g., seawater); solid wastes (unsuitable or non-authorised). The relevance of each undue inflow depends on the system under analysis.
Table 1 details the inflow acceptance or authorization criteria per system type and provides additional information whenever this acceptance is typically subject to legal, regulatory, or best-practice restrictions. This information is from current practices, which vary significantly depending on region or country; actual practices might not follow the design and operations criteria.
When sewers transport only wastewater, they present a distinctive daily flow pattern, related to rejections to the system. These are associated with typical behaviours and uses of water by the population (Figure 1a), as they come from residential, commercial, and other service connections. These can vary between weekdays and weekends or seasonally (Figure 1b) in locations with significant population fluctuation over the year (for example, in tourist areas with an increased population over the summer months). These flows exhibit similar variations to those shown in water consumption flows, as household water primarily comes from the usage of water supplied by the water supply network (Figure 1c).
Analysing the hydrographs in different seasons (dry and wet) and weather (with or without rainfall) provides an opportunity to explore the decomposition of measured hydrographs. In regions with uneven annual rainfall distribution, in the dry season period, the flow patterns in sewers incorporate lower groundwater and rain-derived inflows since it is the period of the year when rainfall is significantly reduced or almost absent. A noticeable difference will be observed in dry weather patterns in sewers between dry and wet seasons if groundwater infiltration inflows are significant.
The estimation of flow or volume variations resulting from precipitation uses accepted hydrologic methods. Wet weather runoff derives directly from hydrologic conditions, and the rainwater volume input into the drainage systems depends on the characteristics, surface coverage, or slope of the basin area, among others. An analysis of the hydrographs using dry weather flow patterns and, if available, rainfall data series allows the separation of the rain-derived volumes in dry and wet seasons. Inputs from the rain events to the drainage system are often higher than dry weather flows (Figure 2a) and can continue long after the rain event (Figure 2b).
The differentiation between dry and wet weather data results from initially identifying the periods with wet weather, including the rain events, until complete hydrograph recession to the previous flows. Dry weather is the remaining period where the hydrograph shows the characteristic dry weather flow pattern.
In coastal areas, saline water volumes may enter the system depending on local tidal variations, sewer conditions, and elevation. A method for detecting saline inflow involves comparing hourly variations in wastewater during dry weather with local tidal heights. The additional monitoring of wastewater conductivity allows for the confirmation of the occurrence of saline inflows [31]. When peak wastewater volume variations coincide with tidal fluctuations, the likelihood of saline water inflows significantly increases (Figure 2c).

2.2. Data

Data used to apply and validate the methods are from eight Portuguese utilities considered representative of the Portuguese sector, with the number of service connections from 2220 to 488,725, the total sewer length from 32 km to 1539 km, the number of pumping stations from 0 to 380, and the number of wastewater treatment plants from 0 to 176.
Data from the utilities are for the period from 2015 to 2019 (for monthly data) and 2019 to 2020 (for detailed sub-hourly data). Monitoring flows for every facility is not a standard practice. While sub-daily data are infrequent, monthly data are often available for most treatment plants and pumping stations, typically only for flows entering the facilities. Overflows are generally not monitored. Precipitation data are often unavailable, or the nearest rain gauge is far from the sub-catchment where flow measurements occur. These constraints restrict the use of detailed calculations for undue inflows, highlighting the need for alternative estimation methods. Portuguese utilities report annually to the national regulator, and the published data are also used [32].

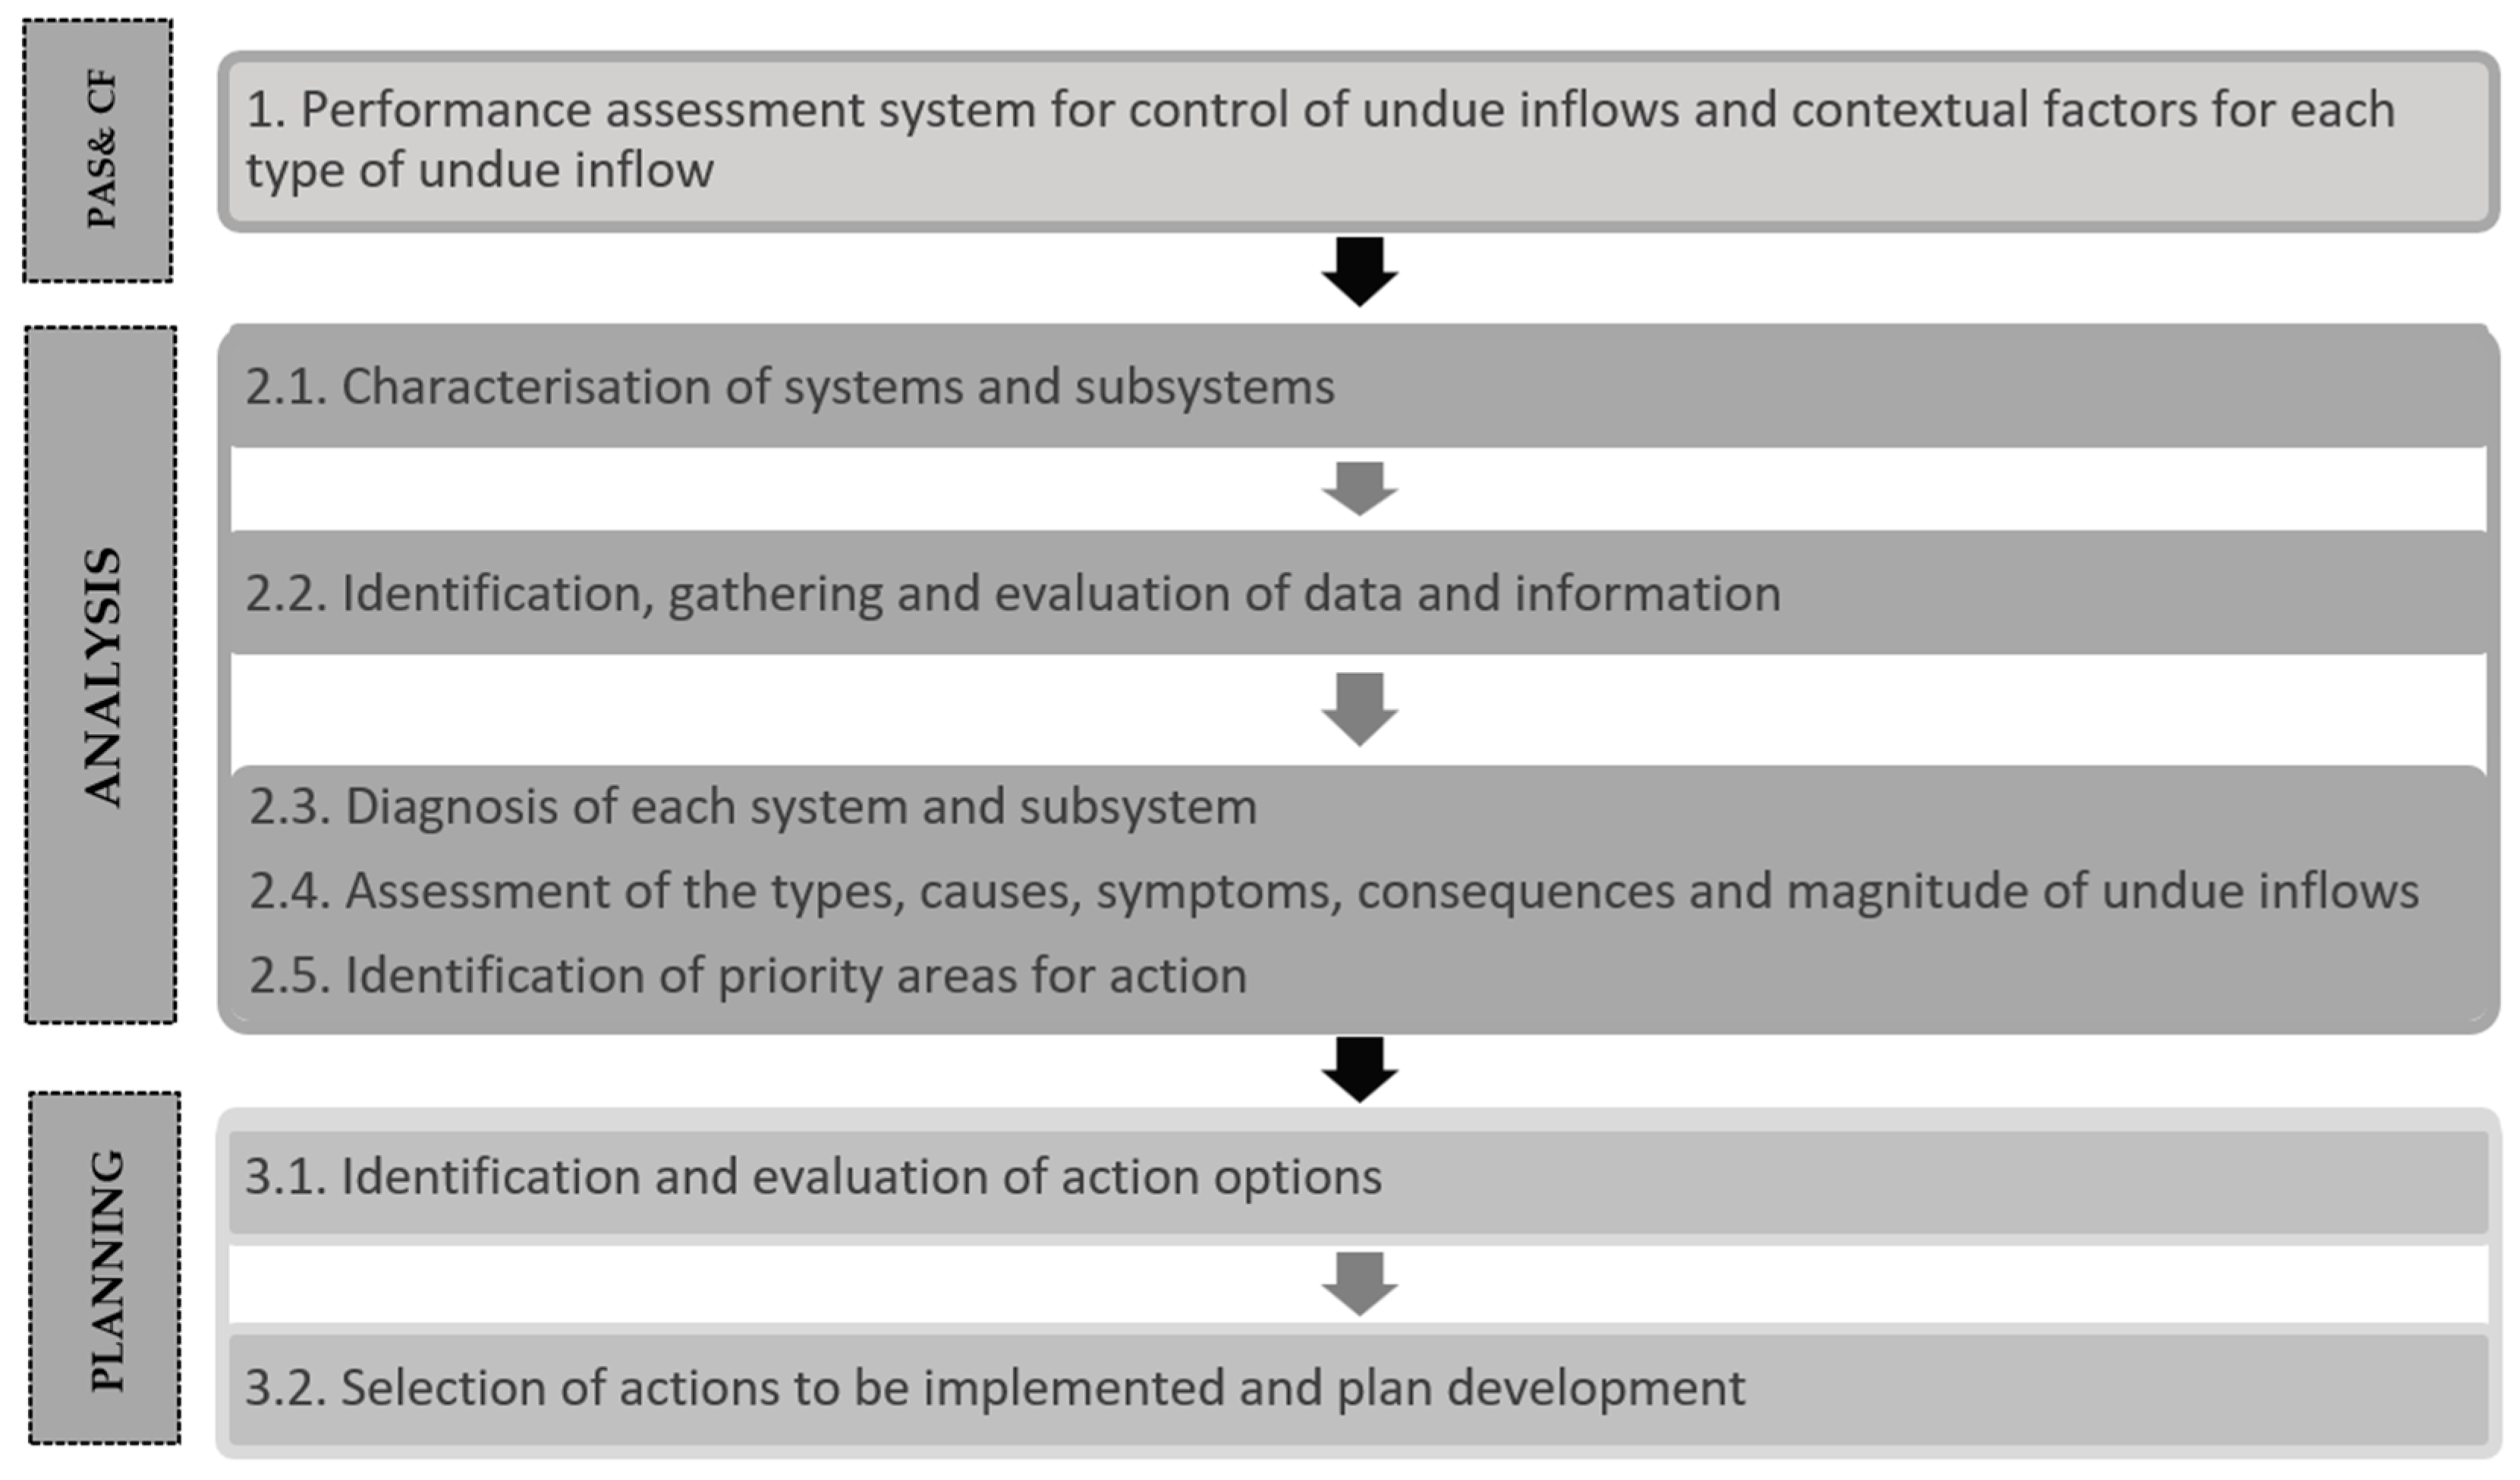
2.3. Methodology for Control of Undue Inflows

The methodology for estimating undue inflows integrates a broader planning methodology comprising the steps shown in Figure 3. First, it is necessary to create a performance assessment system and identify contextual factors for each type of undue inflow (PAS, step 1) to respond to the objectives mentioned above. The application of the PAS in the analysis (steps 2.3, 2.4, and 2.5) allows for the identification of the action priorities that are further developed in planning (steps 3.1 and 3.2).

2.4. Performance Assessment System for Control of Undue Inflows

2.4.1. General Proposal

The assessment of undue inflows to wastewater systems, stormwater systems, combined drainage systems, urban streams, or coastal waters is made through a performance assessment system structure centred on the definitions of objectives, criteria, and metrics (O-C-M). These definitions benefit from alignment with the performance assessment structure proposed by [3,30]. At the tactical level, there are three main objectives: (i) to control or manage the extent of various types of undue inflows, (ii) to address their causes and mechanisms, and (iii) to ensure that their impact does not hinder service delivery, efficient resource use, or the effective utilisation of public space. The criteria related to each objective provide relevant perspectives and are measured using specific metrics.
This paper aims to outline the first objective, which is the management of undue inflows, by establishing criteria and metrics associated with these inflows, as detailed in Table 1. To diagnose the existence and effects of the different inflows, one needs to assign them an order of magnitude, either qualitative or quantitative, and applying adequate metrics can accomplish this assignment. After setting the above-mentioned objectives, the first step in constructing the performance assessment system results from using the rationale of similar approaches [3,30]. In the following steps, the system was improved and validated with eight utility teams in a gradual collaborative validation process, introducing modifications to account for needs and data availability.
The criteria in Table 2 express the perspectives needed to assess the magnitude of the inflows to the systems. Some criteria address water quantity issues, others, water quality, and some address both. Criteria apply to a given system or subsystem depending on their type (Table 1) and context. For instance, criterion 5 (C5) focuses on assessing the magnitude of household (or similar) water inflows into stormwater systems or urban streams, i.e., it does not apply to separate wastewater systems. Similarly, criterion 8 (C8), which addresses saline inflows into wastewater, combined, or stormwater systems, applies specifically to systems located in coastal areas.
Some criteria address specifically one type of inflow (Table 2), as in the case of C8 for saline inflows [31]. Others, given their characteristics, can include several types of inflows. For example, C1 provides an overall magnitude of undue or excessive inflows, and C2 of rain-derived inflows. For C2, an overall quantification of direct or delayed rainwater inflows can be provided by the metrics proposed herein, but to distinguish between these two types of rainwater inflows, an advanced analysis of the flow data must be carried out [33]. Deepening the assessment using the other criteria below (C3 to C8) allows for the disaggregation of the types of inflows or the analysis of the different types of systems. For example, the metrics in C5 relate to the quantification of the undue inflows of household or similar waters to stormwater and natural systems.
The number of metrics included in each criterion varies from 2 to 6 (Table 2). A list of the 31 proposed metrics is presented in Table 3. Due to the high number of metrics, the complete descriptions and formulations are presented in Appendix A (Table A1).
In Table 3, the data sources for each metric are indicated in the last column as follows: (A) sub-daily flow, precipitation, and/or water quality data; (B) monthly flow and/or precipitation data; (C) variables coming from field inspection, GIS, or data from operation and maintenance; (D) qualitative, regarding the acknowledgement of data, given this list of options: (i) confirmed that it does not exist by field survey; (ii) exists, with confirmation by field survey; (iii) to the knowledge of the water utility, it does not exist, without full confirmation; (iv) to the knowledge of the water utility, it exists, without full confirmation; (v) not enough information for evaluation. Details on data requirements for each metric are in Appendix A (Table A2).
Within this set of metrics, 3 are derived from the IWA manual of best practices on performance indicators for wastewater services [34] and use data from operation and maintenance; the remaining 28 are new metrics specifically developed herein. Among the later metrics, eight use sub-daily flow data, precipitation, and water quality data (if applicable); three use monthly volumes or precipitation data; sixteen use variables from field inspections, GIS, or data from operation and maintenance; one is qualitative (list of options). Some metrics rely on the previously explained concepts of wet or dry seasons and of wet or dry weather (see Section 2.1). Some new metrics have previously been presented [30,31]. For instance, a thorough explanation of the M82 calculation, along with contextual factors and additional metrics, aids in identifying relevant data for the management of saline water, as well as its sources, inflow mechanisms, and effects [30,31]. Seasonality analysis has been proposed as a proxy for quantifying the magnitude of the excessive inflows for the strategic assessment of full-scale drainage systems [30].
The evaluation of wastewater systems prioritises metrics associated with criteria C1, C2, and C3, given their importance in water management and pollution control. The application of these metrics enables a general classification of excess inflows (C1) and a quantification of the magnitude of rainfall-derived (C2) and infiltration (C3) inflows. As mentioned, household wastewater’s undue inflows and similar (C5) are relevant for stormwater systems or urban streams. Most of the proposed metrics rely on GIS, operation, or maintenance data because monitoring data in stormwater utilities are more incipient. However, quantitative metrics M53 and M54 are proposed based on the analysis of stormwater flow data.

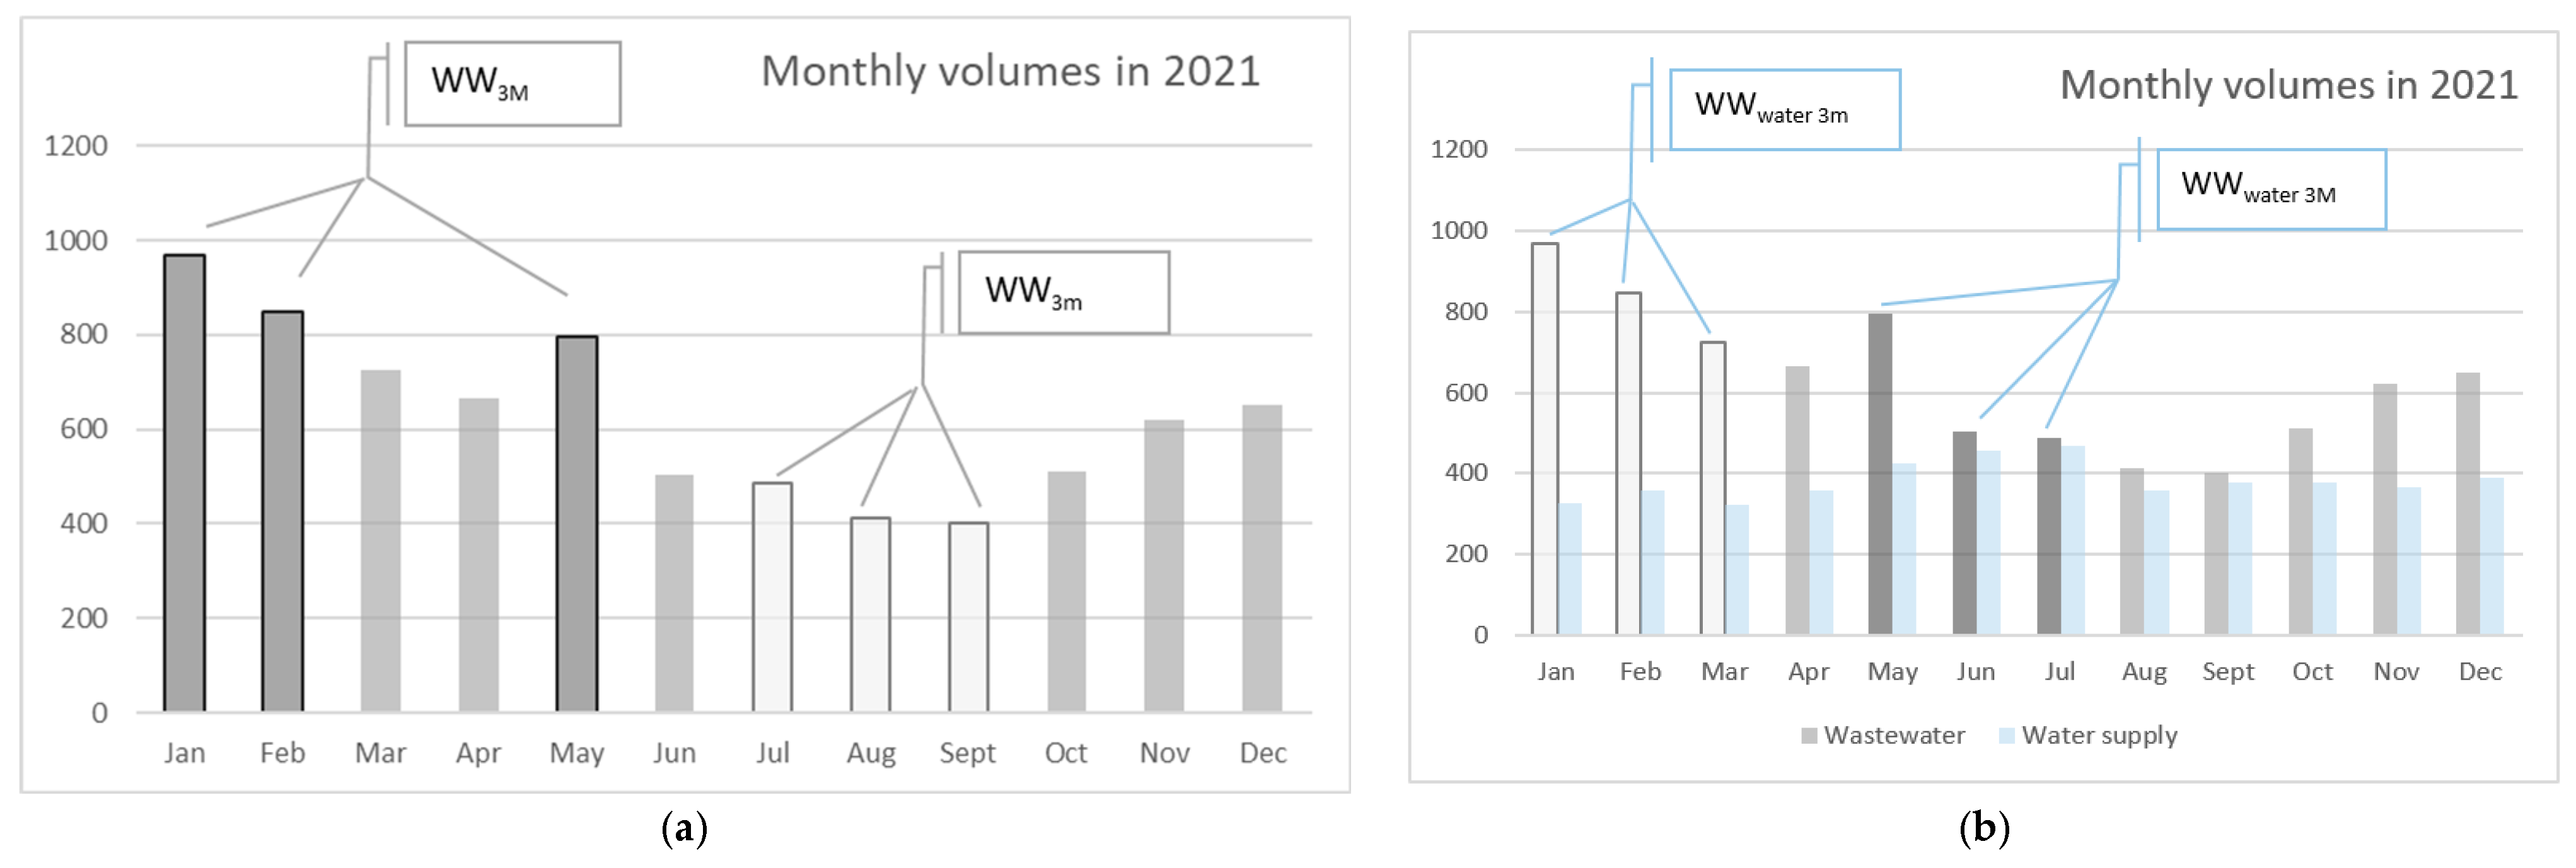
2.4.2. Metrics Using Monthly Data

The inflow seasonality (M11) can be obtained by a quotient between the highest and the lowest volumes (Equation (1)); it allows the emphasis of the seasonal changes throughout the year by comparing the inflows in the three months with the highest volumes and those in the three months with the lowest volumes (example in Figure 4a). This metric also allows for some quantification of the magnitude of the undue inflows. Since the data are gathered at the downstream section of a drainage basin, they do not consider the volumes discharged, which are typically not measured. As such, M11 can underestimate the undue inflows, but seasonality is a first approach towards their quantification. In combined systems, this metric cannot be fully interpreted as a proxy for undue inflows since a portion of rain-derived inflows is supposed to be transported by the system.
M 11 = W W 3 M W W 3 m
where WW3M is the wastewater production in the 3 months with the highest volumes; WW3m is the wastewater production in the 3 months with the lowest volumes.
Also, as Figure 1b,c depict, some seasonality might be due to population fluctuation over the year. The inflow seasonality related to water supply consumption (M12) complements metric M11 since it incorporates the monthly variability in the current population (residents and visitors). It considers wastewater production in the months with the highest and lowest water consumption (Equation (2)). If wastewater variations are only due to changes in water consumption, M12 is expected to be similar to M11. If not, differences will arise because months with higher water consumption might not coincide with those with lower precipitation (example in Figure 4b).
M 12 = W W W a t e r   3 M W W W a t e r   3 m
where WWWater 3M is the wastewater production in the 3 months with the highest water consumption; WWWater 3m is the wastewater production in the 3 months with the lowest water consumption.
The variables used in M11 and M12 are represented as an example in Figure 4a,b, respectively.

2.4.3. Metrics Using Detailed Data

Some other metrics require detailed data (e.g., flow and precipitation data with acquisition steps lower than 15 min) and adequate data processing to calculate dry weather patterns [33]. Few of these metrics require calculating daily dry weather patterns and their quartiles in the dry and wet seasons. These metrics can be applied to any cross-section in the drainage system or a treatment plant, preferably upstream, before surplus discharge.
The exceedance inflow, M13, assesses surplus inflows relative to dry conditions during the dry season. This metric determines the ratio between the drained volume exceeding the household wastewater and the household wastewater (Equation (3)). The difference between the dry weather 75th-percentile pattern and the minimum flow of the 25th percentile (Figure 5a) allows for the estimation of the household wastewater volume (DW in Equation (3)), representing the upper and lower daily patterns in dry weather. DW is an estimate of the domestic household wastewater; but naturally, it may include other contributions (from commercial uses, for example). A sample of at least 15 days of dry weather data for each monitoring site is used to calculate the 75th- and 25th-percentile patterns, typically using hourly flow values, forming upper and lower patterns to represent expected flow variations over 24 h. Metrics M31 and M32 provide additional information on minimum flows. Total wastewater drained volume (WW in Equations (1)–(3)) refers to the volume measured in each period (Figure 5b), corresponding to the total amount of wastewater volume (including household, rain-derived, and industrial waters).
M 13 = W W D W D W
where WW is the total wastewater volume drained; DW is the household wastewater, corresponding to the difference between the 75th percentile, WW75 (dark blue line in Figure 5a) and the minimum of the 25th percentile, WWmin (of the daily dry weather pattern, in the dry season; dashed light blue line in Figure 5a).
These variables are represented in Figure 5 with an example. In Figure 5a, the data from a set of dry weather days overlap (each day is in a different shade of grey).
In relation to inflows derived from rainwater, M21 and M22 apply a similar approach. The inflows during wet weather, referred to as M21, offer an overview of seasonal variations caused by rainfall throughout the year. This metric compares the inflows from the three months with the highest precipitation to those from the three months with the lowest precipitation (Equation (4)), as exemplified in Figure 6a).
M 21 = W W R a i n   3 M W W R a i n   3 m
where WWRain 3M is the wastewater production in the 3 months with the highest precipitation; WWRain 3m is the wastewater production in the 3 months with the lowest water precipitation.
M22, which stands for the excess inflows associated with precipitation, requires the acquisition of detailed data, as in M13. It looks at the surplus inflows, exclusively in wet weather, i.e., rainy periods and subsequent delayed periods in the hydrograph (indicated with red arrows in Figure 6b), compared with the dry weather pattern in the dry season (as exemplified in Figure 6b). For those periods, M22 (Equation (5)) determines the ratio between the drained volume exceeding the household wastewater (yellow line in Figure 6b) and the household wastewater itself (grey line in Figure 6b). Again, the volume corresponding to household wastewater (DW in Equations (3) and (5)) can be obtained by the difference between the 75th percentile and the minimum of the 25th percentiles (as exemplified in Figure 5a). Wastewater drained volume in precipitation periods (WWP in Equation (5)) refers to the volume measured in such periods (during and after a rain event until complete hydrograph recession):
M 22 = W W P D W P D W P
where WWP is the wastewater volume drained in precipitation periods (dark blue area in Figure 6b); DWP is the household wastewater corresponding to the difference between the 75th percentile and the minimum of the 25th percentile of the daily dry weather pattern, in the dry season during the same period (grey line in Figure 6b).
The numerator of Equation (5) is the surplus volume, exclusively in wet weather. It is illustrated in Figure 6c, in light blue, along with the accumulated surplus volume, in the blue line.
Regarding infiltration-derived inflows, the metrics M31 and M32 require detailed data. If data from a dry weather period are limited (few days of data available), a simple approach is proposed to calculate M31 where the damping of the hydrograph is included in the estimated infiltration, thus tending to overestimation. When at least 15 days of dry weather data for both dry and wet seasons are available, the metric M32 provides a better estimation of the infiltration because of groundwater fluctuation between the seasons. In this case, the damping of the hydrograph is not included in the infiltration estimation. These metrics are supported by acknowledging the minimum flow on dry weather days, as shown in Figure 5. The dry weather period for this purpose is when no rain-derived flows occur. Figure 7 shows data from a number of dry weather days, each in a different shade of grey. Figure 7a concerns data from any time of the year for those utilities with not much data available, and for which it is not possible to characterise seasonal differences or daily patterns. Figure 7b,c concern dry and wet season data, respectively. The minimum flows are higher in the wet season (Figure 7c) because groundwater flows are higher, even when rain-derived inflows are not evident.
Metric M31 determines the ratio between the daily minimum flow, WWmin, and the average flow in dry weather, WWav (Equation (6)) at any given time of the year. In any period of the year, the base flow results not only from infiltration but also from the dampening of the flows occurring during the transport of household wastewater along the sewers, from upstream to downstream.
M 31 = W W m i n W W a v
where WWmin is the minimum household wastewater flow, given by the minimum of the 25th percentile of the daily dry weather pattern. WWav is the average household wastewater flow, given by the average of the daily dry weather pattern.
When detailed data are available for dry and wet seasons, M32 is a proxy of the infiltration calculated by the difference between the 25th percentile of the daily dry weather pattern in the wet season (DWmin wet season) and dry season (DWmin dry season). In other words, comparing the pattern in days without rain-derived flows in the wet and dry seasons results in an estimate of the flows exceeding the household base flow (DWmin dry season). This metric calculates the ratio between the estimated infiltration and the average flow in dry weather in the dry season (Equation (7)).
M 32 = D W min w e t   s e a s o n D W min d r y   s e a s o n W W a v   d r y   s e a s o n
where DWmin wet season is the minimum household wastewater in the wet season, given by the 25th percentile of the daily dry weather pattern in the wet season; DWmin dry season is the minimum household wastewater in the dry season, given by the 25th percentile of the daily dry weather pattern in the dry season; WWav dry season is the average of the daily dry weather pattern in the dry season (dashed red line in Figure 7b).

2.5. Reference Values Range Selection

The reference values for a metric can be established from theoretical concepts, design criteria, or legislation related to that metric. Values used in other recognised systems in similar metrics (e.g., the Portuguese regulator) and from the literature review were also helpful for this purpose. Statistical analysis, considering realistic limits for each metric, was conducted on the results from the application to eight Portuguese utilities. The valuation of metric results uses three service quality categories—good, fair, and poor. Typically, the lower and upper limits of the performance range correspond to the 25th and 75th percentiles, respectively, accounting for both the average and median values. These statistics and further discussions with the service providers were valuable in refining and validating the boundaries of reference value ranges.
The type of utility, contextual factors, and the expected accuracy of the variables for an average utility were also considered [34].

3. Results

3.1. Estimation of Undue Inflows

The metrics were calculated using the data available from the utilities. Most metrics required detailed information, such as data acquisition in intervals shorter than one hour and, in some cases, simultaneous rainfall records. As a result, the calculation procedure could only be applied to locations where the utilities had installed rain gauges, collected a representative sample of data, and conducted thorough data processing (as referenced in [33]).
As referred, not all pumping stations and wastewater treatment plants have continuous upstream flow measurements. Therefore, M12, M13, M22, M31, and M32 were applied only to some facilities and sewers where detailed monitoring was available. Data between 5 and 18 measurement locations (n in Figure 1) are available for this set of metrics. Monthly data are more common, so calculations for M11 and M21 were carried out in many different sub-systems using monthly data. Sub-system identification is based on their downstream boundaries, pumping stations, or treatment plants. Calculations were carried out in 119 and 156 locations, respectively, to M11 and M21.
Box and whisker plots present the statistics of the results in Figure 8. The background colours derive from the classification obtained by applying the proposed reference values of the metrics. Green stands for good performance, yellow for fair performance, and red for poor performance; an explanation of the proposed reference values is given in the following section.
For the larger sample under analysis, with monthly data, it appears that seasonality is relevant for most sections (M11), with some presenting remarkably high values. For a smaller sample, still with monthly data, it was possible to assess seasonality considering the evolution of water consumption (M12). The maximum values in the latter are smaller, which may indicate that, for those locations, seasonality is mostly explained by other inflows in addition to household wastewater. The identification of several outliers in M11 implies the need to further explore the causes of such irregularity over the year.
The results regarding the magnitude of excess inflows, when determined with detailed data for the smaller sample (M13), provide evidence that these are relevant for most locations, being notably high for some.
When analysing this magnitude only for periods with precipitation (M21), it appears that rain-derived inflows explain part of the seasonality (when comparing the results with M11).
When detailed data are available, it is possible to better identify the impact of precipitation events (M22), and the importance of rain-derived inflows is quite clear (when these results are compared with those of M13). Results for M13 show good potential for this metric to be used as a surrogate for undue inflows in separate household systems (those that have water quantity as a major impact), despite underestimating them when upstream overflows are not measured. To understand which parts of these excessive inflows are due to rain-derived flows, M22 stands out as a robust metric. When used in combined systems, the interpretation of results from M13 and M22 must include, as a context factor, the amount of rainwater the system was designed for, as not all rain-derived flows are undue.
Regarding the minimum flow (M31), for the smaller sample, it appears that it is not relevant in terms of absolute magnitude, and the same can be perceived in relation to the infiltration flow (M32). However, it is insufficient to conclude that infiltration does not occur. A complete assessment ought to be made, namely, to evaluate the impact of its occurrence, to compare sub-systems, and to identify the most exposed components of the system.
These results will generally underestimate the effective magnitude of undue inflows, given that measurement on discharges and overflows is usually absent. The use of monthly aggregated values (M11 and M21) provides a good estimate but also dampens peaks and daily extremes, also resulting in the underestimation of the results. These limitations must be clear when interpreting the results.

3.2. Reference Values

The results of the iterative process used to validate the reference values are in Table 4. This table presents the results for the seven metrics chosen to illustrate the methodology. For a comprehensive overview of the reference values of all 31 proposed metrics aimed at monitoring various undue inflows, please refer to Appendix A. Figure 8 illustrates the use of the reference values for the eight utilities.
Based on these criteria, an overview of the performance of the set of utilities is obtained, allowing us to have a perspective on the predominant undue inflows and to identify those with higher priority to proceed with minimization actions. If applied to utility subsystems, establishing the priorities can be based on the inflow magnitude and its impact on utility performance and sustainability, aiding decision-making on the best actions. Knowledge of the main source of undue inflow and the potential causes allows the selection of tailored corrective actions.
It is always necessary to have in mind the meaning of each metric and the quality of data used for the calculations. Therefore, the presentation of results should always be accompanied by context information on conditions and limitations.

4. Discussion

The assessment of undue inflows has been a topic of growing attention in recent decades. Still, most available studies present methodologies to address a specific type of inflow. The proposed approach aims to have a clear identification of the different typologies of undue inflows, depending on the system, and on the distinction of whether an inflow is acceptable, illicit, or inappropriate (because of excessive volumes, water quality, or solid wastes). The methodology was improved and validated by utilities. Of the three objectives included in the performance assessment system, one was selected to illustrate the approach. A set of criteria and metrics is established with a focus on the magnitude to provide a holistic estimation of the different types of inflows. The other objectives focus on the causes and mechanisms of undue inflows, and their impact on service delivery, efficient resource use, and the effective utilisation of public space.
Three metrics use monthly data (M11, M12, and M21). These provide an overall picture of excessive, undue inflows. M12 can be more challenging to apply because it includes data on water supply volumes, which may not be easily accessible to wastewater utilities. M21 gives an overall idea of whether rainwater volumes are of concern. The comparison of the results of these three metrics enables a good initial approach to estimating undue inflows.
Metrics related to surplus inflows (M13 and M22) compare the actual inflow volume to a given cross-section with the expected household wastewater volumes (M13 for the whole period under analysis and M22 only for wet weather). These detailed metrics can help explain whether rainwater was the source of the excessive volumes estimated by M11 and M12, and eventually already hinted by M21. M13 can also be used to understand the dilution of household inflows with other inflows. If applied to the inflow volume to a treatment plan or a pumping station, the effect of this exceedance on plant performance and generally on service delivery and environmental impact, in case effective discharges occur, is the focus of the other objectives of the performance assessment system.
The remaining metrics in criteria C1, C2, and C3 provide deeper insights into the undue excessive inflows, and the types that mostly concern the utilities—rain derived and infiltration. These metrics are based on detailed sub-hourly data, adequately sampled and processed. Investing in a reliable monitoring system, with a suitable choice of installation sites and equipment, has added value to the data quality provided, as it enables reducing data uncertainty and better diagnosing the problem. The metrics proposed for rain-derived inflows rely on the previous identification of rain events and the delayed effect on the hydrographs, comparing measurement data for dry and wet seasons with statistically processed dry weather flow patterns. This is a significant step forward in understanding how the system behaves under various conditions without the need for the complex graphical analyses of hydrographs. Such graphical models can be challenging for water utilities to interpret and apply, which limits their ability to estimate rain-derived inflows.
When it comes to infiltration, if only a small data set is available, M31 can be utilised. The base flow during dry weather days may indicate which catchments are more prone to infiltration, based on similarities with other catchments.
However, the use of M32 is recommended, as it relies on the 25th percentile of dry weather days from both the dry and wet seasons, providing a more adequate estimate of the base flows because of groundwater and not delayed nighttime household flows. These delayed nighttime flows can be relevant in downstream sections in longer sewer networks without any undue inflows, simply because of peak and trough damping resulting from flow transport.
The remaining criteria (from C4 to C9) regarding other types of inflows rely not only on data-related metrics but also on the information coming from operations and maintenance. A suggestion is made to start by determining the latter, to better flag the areas prone to a given type of inflow, and then invest in monitoring, so the complementary metrics can be calculated.
As referred, the proposed metrics are focused on the inflow magnitude. Further research is ongoing to propose a complete assessment system. This system considers two planning objectives at the tactical level (not detailed in the paper as mentioned in Section 2.2): to prevent undue inflows’ causes and mechanisms; to ensure that their occurrence (in terms of consequences) does not compromise a good service provision, the efficient use of resources, and the usage of public spaces. The validated reference values apply to wastewater systems. The application of data from stormwater or natural drainage systems would provide a relevant upgrade to the results.
This complete assessment supports tactical diagnosis, planning, and continuous improvement in urban water drainage systems, aiming at system performance, pollution control, and global water management. The developments proposed herein are a relevant milestone in this path.

5. Conclusions

This paper presents a tactical top-down approach, anchored in strategic objectives, to enhance decision-making and planning for the effective control of undue inflows in drainage and natural systems. This integrated approach addresses the control of undue inflows by considering diverse sources and a holistic understanding of water cycle processes. Estimating global undue inflows is important, and effective control relies on identifying the dominant factors and their root causes. A comprehensive assessment requires considering water cycle dynamics, key local factors (such as fluctuating water table levels, ageing sewer infrastructure, and proximity to the coast), distinct system characteristics (separate or combined), and complex cause–effect mechanisms. A structured assessment enables the identification and quantification of specific inflow sources.
The proposed approach integrates data from multiple sources, including GIS-based information, operation and maintenance records, routine monitoring, and complex calculation results. It is adaptable to utilities with varying data repositories, monitoring capabilities, and expertise levels. Moreover, its applicability across different scales—from whole systems to individual subsystems—enhances its comprehensiveness. By analysing the integrated system first, primary undue inflows are identified, followed by targeted calculations for each subsystem to pinpoint the most critical inflows and prioritise mitigation measures. A novel method for decomposing hydrographs introduces unique metrics not available in the existing literature.
The effectiveness of this method is strengthened by input from various utilities, which supply data and engage in validation sessions. Furthermore, by utilising data from the national regulator that oversees more than 300 utilities, we increase the potential for this approach to be replicated and adapted in different contexts.

Author Contributions

Conceptualization, investigation, methodology, M.d.C.A. and R.S.B.; data collection and calculations, M.d.C.A., R.S.B. and C.J.; writing—original draft preparation, review and editing, M.d.C.A., R.S.B. and C.J. All authors have read and agreed to the published version of the manuscript.

Funding

This research received no external funding.

Data Availability Statement

Data are publicly unavailable due to privacy restrictions of the utilities.

Acknowledgments

The authors are grateful to the Portuguese utilities for the collaboration in the validation of the procedure, in particular: Águas do Algarve, Águas do Norte, Águas da Serra, Câmara Municipal de Lisboa, Câmara Municipal do Seixal, Infralobo, INOVA and SMAS de Sintra.

Conflicts of Interest

The authors declare no conflicts of interest.

Appendix A

Table A1. Complete metrics formulation and reference values.
MetricFormulationReference Values (Good; Fair; Poor)
C1: Excessive inflows
M11: Inflow seasonality (-) W a s t e w a t e r   p r o d u c t i o n   i n   t h e   3   m o n t h s   w i t h   h i g h e s t   v o l u m e s W a s t e w a t e r   p r o d u c t i o n   i n   t h e   3   m o n t h s   w i t h   l o w e s t   v o l u m e s [1, 1.25[; [1.25, 2[; [2, +∞[
M12: Inflow seasonality related to water supply consumption (-) W a s t e w a t e r   p r o d u c t i o n   i n   t h e   3   m o n t h s   w i t h   h i g h e s t   w a t e r   c o n s u m p t i o n W a t e r   c o n s u m p t i o n   i n   t h e   3   m o n t h s   w i t h   h i g h e s t   w a t e r   c o n s u m p t i o n W a s t e w a t e r   p r o d u c t i o n   i n   t h e   3   m o n t h s   w i t h   l o w e s t   w a t e r   c o n s u m p t i o n W a t e r   c o n s u m p t i o n   i n   t h e   3   m o n t h s   w i t h   l o w e s t   w a t e r   c o n s u m p t i o n [1, 1.5[; [1.5, 3[; [3, +∞[
M13: Exceedance inflows (-) ( T o t a l   v o l u m e   d r a i n e d T o t a l   w a s t e w a t e r   v o l u m e )   T o t a l   w a s t e w a t e r   v o l u m e [0, 2[; [2, 5[; [5, +∞[
C2: Rainwater
M21: Inflows in periods with precipitation (-) W a s t e w a t e r   p r o d u c t i o n   i n   t h e   3   m o n t h s   w i t h   h i g h e s t   r a i n f a l l W a s t e w a t e r   p r o d u c t i o n   i n   t h e   3   m o n t h s   w i t h   l o w e s t   r a i n f a l l [1, 1.25[; [1.25, 2[; [2, +∞[
M22: Excess inflows associated with precipitation (-) ( W a s t e w a t e r   v o l u m e s   d r a i n e d   i n   p r e c i p i t a t i o n   p e r i o d s H o u s e h o l d   w a s t e w a t e r )   H o u s e h o l d   w a s t e w a t e r [0, 2[; [2, 5[; [5, +∞[
C3: Infiltration
M31: Minimum flow rate (-) M i n i m u m   h o u s e h o l d   w a s t e w a t e r ,   25   p e r c e n t i l e   o f   t h e   d a i l y   d r y   w e a t h e r   p a t e r n A v e r a g e   h o u s e h o l d   w a s t e w a t e r ,   a v e r a g e   o f   t h e   d a i l y   d r y   w e a t h e r   p a t t e r n [0, 0.25[; [0.25, 0.5[; [0.5, 1]
M32: Infiltration flow rate (-) M i n .   h o u s e h o l d   w a s t e w a t e r   i n   w e t   s e a s o n M i n .   h o u s e h o l d   w a s t e w a t e r   i n   d r y   s e a s o n A v e r a g e   h o u s e h o l d   w a s t e w a t e r   i n   d r y   s e a s o n [0, 0.1[; [0.1, 0.25[; [0.25, 1]
C4: Fluvial water (and similar others)
M41: Deviation of fluvial water to the system (n./location) D a y s   w i t h   f l u v i a l   w a t e r   i n f l o w   t o   t h e   s y s t e m     N .   o f   l o c a t i o n s   w i t h   a   d i v e r s i o n   c o n n e c t i o n 0; ]0, 5[; [5, +∞[
M42: Fluvial inflow in relation to total inflow (-)     F l u v i a l   i n f l o w H o u s e h o l d   w a s t e w a t e r   i n   d r y   w e a t h e r [0, 2[; [2, 5[; [5, +∞[
M43: Discharge of pool water to wastewater system (%)     N .   o f   c o l l e c t i v e   u s e   p o o l s   c o n n e c t e d   t o   t h e   s y s t e m N .   o f   c o l l e c t i v e   u s e   p o o l s   .   100 0; ]0, 25[; [25, 100]
C5: Household wastewater (and similar others)
M51: Evidence of household wastewater in stormwater discharges (%)   N .   o f   s t o r m w a t e r   d i s c h a r g e s   w i t h   e v i d e n c e   o f   d o m e s t i c   w a s t e w a t e r T o t a l   n .   s t o r m w a t e r   d i s c h a r g e s   t o   t h e   r e c e i v i n g   b o d i e s   .   100 0; ]0, 5[; [5, +∞[
M52: Wastewater connections to stormwater system (n./1000 drains)   N .   o f   w a s t e w a t e r   c o n n e c t i o n s   t o   p i p e s   t h a t   d i s c h a r g e   i n t o   t h e   r e c e i v i n g   b o d i e s   T o t a l   n .   w a s t e w a t e r   c o n n e c t i o n s   .   1000 0; ]0, 5[; [5, +∞[
M53: Use of the full cross-section capacity in dry weather (%)   M a x i m u m   h o u r l y   f l o w   i n   d r y   w e a t h e r   F u l l   c r o s s   s e c t i o n   f l o w       .   100 [0, 1[; [1, 5[; [5, +∞[
M54: Wastewater inflow to stormwater system (-)   V o l u m e   o f   u n d u e   w a s t e w a t e r   i n f l o w   i n t o   t h e   s t o r m w a t e r   s y s t e m   V o l u m e   i n   t h e   w a s t e w a t e r   s y s t e m   i n   d r y   w e a t h e r 0; ]0, 1[; [1, +∞[
M55: Water quality analyses carried out in the stormwater system (%) N .   o f   w a t e r   q u a l i t y   a n a l y s e s   c a r r i e d   o u t N .   w a t e r   q u a l i t y   a n a l y s e s   s c h e d u l e d   i n   m o n i t o r i n g   p l a n   f o r   s t o r m w a t e r   s y s t e m     .   100 [95, 100]; [75, 95[; [0, 75[
M56: Compliant water quality analyses in the stormwater system (%) N .   o f   c o m p l i a n t   w a t e r   q u a l i t y   a n a l y s e s   c a r r i e d   o u t N .   w a t e r   q u a l i t y   a n a l y s e s   s c h e d u l e d   i n   m o n i t o r i n g   p l a n   f o r   s t o r m w a t e r   s y s t e m     .   100 [95, 100]; [85, 95[; [0, 85[
C6: Industrial wastewater
M61: Evidence of industrial connections to the system (%) N .   o f   c o n n e c t i o n s   w i t h   e v i d e n c e   o f   i n d u s t r i a l   w a s t e w a t e r T o t a l   n .   i n d u s t r i a l   c o n n e c t i o n s   t o   t h e   s y s t e m       .   100 0; ]0, 5[; [5, 100]
M62: Industrial connections without discharge permission (%) N .   o f   i n d u s t r i a l   c o n n e c t i o n s   t o   t h e   s y s t e m   w i t h o u t   a   d i s c h a r g e   p e r m i s s i o n   T o t a l   n .   i n d u s t r i a l   c o n n e c t i o n s       .   100 0; ]0, 1[; [1, 100]
M63: Water quality analyses carried out in the industrial connections (%) N .   o f   w a t e r   q u a l i t y   a n a l y s e s   c a r r i e d   o u t T o t a l   n .   w a t e r   q u a l i t y   a n a l y s e s   s c h e d u l e d   i n   m .   p l a n   f o r   i n d u s t r i a l   c o n n e c t i o n s   .   100 [95, 100]; [75, 95[; [0, 75[
M64: Compliant water quality analyses in the industrial connections (%) N .   o f   c o m p l i a n t   w a t e r   q u a l i t y   a n a l y s e s   T o t a l   n .   w a t e r   q u a l i t y   a n a l y s e s   s c h e d u l e d   i n   m .   p l a n   f o r   i n d u s t r i a l   c o n n e c t i o n s .   100 [95, 100]; [85, 95[; [0, 85[
C7: Other wastewaters
M71: Evidence of health facilities connections in the system (%) N .   o f   c o n n e c t i o n s   w i t h   e v i d e n c e   o f   h e a l t h   f a c i l i t i e s   w a s t e w a t e r T o t a l   n .   h e a l t h   f a c i l i t i e s   c o n n e c t i o n s   t o   t h e   s y s t e m     .   100 0; ]0, 5[; [5, 100]
M72: Compliant health facilities connections (%) N .   o f   c o m p l i a n t   h e a l t h   f a c i l i t i e s   c o n n e c t i o n s   T o t a l   n .   c o n n e c t i o n s   f r o m   t h i s   s o r t   o f   f a c i l i t i e s     .   100 0; ]0, 1[; [1, 100]
M73: Evidence of catering facility connections in the system (%) N .   o f   c o n n e c t i o n s   w i t h   e v i d e n c e   o f   c a t e r i n g   f a c i l i t i e s   w a s t e w a t e r   T o t a l   n .     c a t e r i n g   f a c i l i t i e s   c o n n e c t i o n s   t o   t h e   s y s t e m   .   100 0; ]0, 5[; [5, 100]
M74: Compliant catering facility connections (%) N .   o f   c o m p l i a n t   c a t e r i n g   f a c i l i t i e s   c o n n e c t i o n s   T o t a l   n .     c o n n e c t i o n s   f r o m   t h i s   s o r t   o f   f a c i l i t i e s       .   100 0; ]0, 1[; [1, 100]
M75: Evidence of service station connections in the system (%) N .   o f   c o n n e c t i o n s   w i t h   e v i d e n c e   o f   g a s   s t a t i o n   w a s t e w a t e r   T o t a l   n .   g a s   s t a t i o n   c o n n e c t i o n s   t o   t h e   s y s t e m       .   100 0; ]0, 5[; [5, 100]
M76: Compliant service station connections (%) N .   o f   c o m p l i a n t   g a s   s t a t i o n   c o n n e c t i o n s   T o t a l   n .   c o n n e c t i o n s   f r o m   t h i s   s o r t   o f   f a c i l i t i e s   .   100 0; ]0, 1[; [1, 100]
C8: Saline water
M81: Sites with evident saline inflows (-)Recognition of obvious exposure to saline inflows by local inspection of sites in the system, in a coastal buffer up to the maximum spring tides. Options: (i) Confirmed that does not exist by field survey; (ii) Exist with confirmation by field survey, (iii) To the knowledge of the water utility does not exist, without full confirmation, (iv) In the knowledge of the water utility exist, without full confirmation; (v) Not enough information for evaluation.(i)
(ii) or (iii) or (iv)
(v)
M82: Saline inflow in relation to total inflow (%) W a t e r   v o l u m e   c o l l e c t e d   c o r r e s p o n d i n g   t o   s a l i n e   w a t e r     T o t a l   w a t e r   v o l u m e   c o l l e c t e d   .   100 [0, 9[; [9, 13[; [13, +∞[
C9: Solid wastes
M91: Solids removal in sewers [ton/km] S o l i d s   w e i g h t   r e m o v e d   f r o m   t h e   s e w e r s   T o t a l   p i p e   l e n g h t   [0, 1[; [1, 5[; [5, +∞[
M92: Solids removal in drainage components [ton/km] S o l i d s   w e i g h t   r e m o v e d   f r o m   c o m p l e m e n t a r y   c o m p o n e n t s   o f   t h e   d r a i n a g e   n e t w o r k     T o t a l   p i p e   l e n g h t [0, 1[; [1, 2[; [2, +∞[
M93: Gravel and sand removal in facilities [ton/km] G r a v e l   a n d   s a n d   w e i g h t   r e m o v e d   f r o m   t h e   f a c i l i t i e s     T o t a l   p i p e   l e n g h t [0, 2.5[; [2.5, 5[; [5, +∞[
Table A2. Data requirements for each metric.
Data requirements for the metricMetric
C1: Excessive inflows
(B) Monthly drainage volumesM11: Inflow seasonality (-)
(B) Monthly drainage volumes
(B) Monthly water supply volumes
M12: Inflow seasonality related to water supply consumption (-)
(A) Sub-daily drainage flow dataM13: Exceedance inflows (-)
C2: Rainwater
(B) Monthly drainage volumes
(B) Monthly precipitation data
M21: Inflows in periods with precipitation (-)
(A) Sub-daily drainage flow data
(A) Sub-daily precipitation data
M22: Excess inflows associated with precipitation (-)
C3: Infiltration
(A) Sub-daily drainage flow data
(A) Sub-daily precipitation data
M31: Minimum flow rate (-)
(A) Sub-daily drainage flow data
(A) Sub-daily precipitation data
M32: Infiltration flow rate (-)
C4: Fluvial water (and similar others)
(C) Number of days with deviation of fluvial water to sewer system
(C) GIS registry of locations with fluvial diversion
M41: Deviation of fluvial water to the system (n./location)
(A) Sub-daily drainage flow dataM42: Fluvial inflow in relation to total inflow (-)
(C) Number of pools discharging to wastewater system
(C) GIS registry of collective-use pools
M43: Discharge of pool water to wastewater system (%)
C5: Household wastewater (and similar others)
(C) Number of stormwater discharges with evidence of household wastewater
(C) GIS registry of system components
M51: Evidence of household wastewater in stormwater discharges (%)
(C) Number of household wastewater connections to receiving water bodies
(C) GIS registry of system components
M52: Wastewater connections to stormwater system (n./1000 drains)
(A) Sub-daily drainage flow data
(C) GIS registry of system components
M53: Use of the full cross-section capacity in dry weather (%)
(A) Sub-daily drainage flow dataM54: Wastewater inflow to stormwater system (-)
(C) Number of water quality analyses scheduled and number carried out M55: Water quality analyses carried out in the stormwater system (%)
(A) Water quality monitoring data; OR
(C) Number of compliant water quality analyses and number scheduled
M56: Compliant water quality analyses in the stormwater system (%)
C6: Industrial wastewater
(A) Water quality monitoring data; OR
(C) Number of connections with evidence of undue discharge 1
M61: Evidence of industrial connections to the system (%)
(C) Number of connections without discharge permission and number of industrial connectionsM62: Industrial connections without discharge permission (%)
(C) Number of water quality analyses carried out and number plannedM63: Water quality analyses carried out in the industrial connections (%)
(C) Number of compliant analyses and number plannedM64: Compliant water quality analyses in the industrial connections (%)
C7: Other wastewaters
(A) Water quality monitoring data; OR
(C) Number of connections with evidence of undue discharge from facilities 1
M71: Evidence of health facility connections in the system (%)
(C) Number of compliant facilities and number of facilitiesM72: Compliant health facility connections (%)
(A) Water quality monitoring data; OR
(C) Number of connections with evidence of undue discharge from facilities 1
M73: Evidence of catering facility connections in the system (%)
(C) Number of compliant facilities and number of facilitiesM74: Compliant catering facility connections (%)
(A) Water quality monitoring data; OR
(C) Number of connections with evidence of undue discharge from facilities 1
M75: Evidence of service station connections in the system (%)
(C) Number of compliant facilities and number of facilitiesM76: Compliant service station connections (%)
C8: Saline water
(D) Data from field surveysM81: Sites with evident saline inflows (-)
(A) Sub-daily drainage flow data
(A) Water quality monitoring data
M82: Saline inflow in relation to total inflow (%)
C9: Solid wastes
(C) Weight of solids removed from sewers
(C) GIS registry of system components
M91: Solids removal in sewers [ton/km]
(C) Weight of solids removed from complementary drainage components
(C) GIS registry of system components
M92: Solids removal in drainage components [ton/km]
(C) Weight of gravel and sand removed from facilities
(C) GIS registry of system components
M93: Gravel and sand removal in facilities [ton/km]
Note: 1 typically from visual inspections.

References

  1. Ellis, J.B.; Butler, D. Surface water sewer misconnections in England and Wales: Pollution sources and impacts. Sci. Total Environ. 2015, 526, 98–109. [Google Scholar] [CrossRef] [PubMed]
  2. Saletti, A.O.; Lindhe, A.; Söderqvist, T.; Rosén, L. Costs to society from infiltration and inflow to wastewater systems. Water Res. 2023, 229, 2320. [Google Scholar] [CrossRef]
  3. Jorge, C.; Almeida, M.C.; Covas, D. Performance assessment system for energy efficiency in wastewater systems. Water 2021, 13, 1807. [Google Scholar] [CrossRef]
  4. Jorge, C.; Almeida, M.C.; Brito, R.S.; Covas, D. Water, energy, and emissions nexus: Effect of inflows in urban drainage systems. Water 2022, 14, 868. [Google Scholar] [CrossRef]
  5. Brown, E.; Caraco, D.; Pitt, R. Illicit Discharge Detection and Elimination: A Guidance Manual for Program Development and Technical Assessments; Report EPA X-82907801-0; Center for Watershed Protection: Ellicott City, MD, USA, 2004. Available online: https://www3.epa.gov/npdes/pubs/idde_manualwithappendices.pdf (accessed on 25 January 2025).
  6. Metro Vancouver. Inflow and Infiltration Allowance Assessment Integrated Liquid Waste and Resource Management; Metro Vancouver: Vancouver, BC, Canada, 2014; Available online: https://metrovancouver.org/services/liquid-waste/Documents/inflow-infiltration-allowance-assessment-2014-06.pdf (accessed on 25 January 2025).
  7. Carne, S.; Le, R. Infiltration & Inflow Control Manual; Volume 1: Overview, Background, Theory; GHD for Water New Zealand: Auckland, New Zealand, 2015; Available online: www.waternz.org.nz/Folder?Action=View%20File&Folder_id=394&File=II%20Manual%20Volume%201.pdf (accessed on 25 January 2025).
  8. Kesik, T. Best Practices Guide: Management of Inflow and Infiltration in New Urban Development; ICLR research paper series; Institute for Catastrophic Loss Reduction: Toronto, ON, Canada, 2015; Volume 54, Available online: https://www.iclr.org/wp-content/uploads/PDFS/best-practices-guide-management-of-inflow-infiltration-in-new-urban-developments.pdf (accessed on 25 January 2025).
  9. Robinson, B.; Sandink, D. Guideline to Developing an Efficient and Cost-Effective Inflow and Infiltration (I/I) Reduction Program: A Foundational Document; Institute for Catastrophic Loss Reduction/Standards Council of Canada: Toronto/Ottowa, ON, Canada, 2021. Available online: https://scc-ccn.ca/system/files/2024-05/norton-iclr-scc_-_efficient_and_cost_effective_i-i_reduction_programs_-_2021_en.pdf (accessed on 25 January 2025).
  10. Zeydalinejad, N.; Javadi, A.A.; Webber, J.L. Global perspectives on groundwater infiltration to sewer networks: A threat to urban sustainability. Water Res. 2024, 262, 122098. [Google Scholar] [CrossRef]
  11. EU. Directive (EU) 2024/3019 of the European Parliament and of the Council of 27 November 2024, concerning urban wastewater treatment. Available online: https://eur-lex.europa.eu/eli/dir/2024/3019/oj/eng (accessed on 25 January 2025).
  12. Flood, J.; Cahoon, L. Risks to coastal wastewater collection systems from sea-level rise and climate change. J. Coast. Res. 2011, 27, 652–660. [Google Scholar] [CrossRef]
  13. Cahoon, L.B.; Hanke, M.H. Rainfall effects on inflow and infiltration in wastewater treatment systems in a coastal plain region. Water Sci. Technol. 2017, 75, 1909–1921. [Google Scholar] [CrossRef]
  14. Hughes, J.; Cowper-Heays, K.; Olesson, E.; Bell, R.; Stroombergen, A. Impacts and implications of climate change on wastewater systems: A New Zealand perspective. Clim. Risk Manag. 2021, 31, 100262. [Google Scholar] [CrossRef]
  15. Suchowska-Kisielewicz, M.; Nowogoński, I. Influence of storms on the emission of pollutants from sewage into waters. Sci. Rep. 2021, 11, 18788. [Google Scholar] [CrossRef]
  16. Muttil, N.; Nasrin, T.; Sharma, A.K. Impacts of Extreme Rainfalls on Sewer Overflows and WSUD-Based Mitigation Strategies: A Review. Water 2023, 15, 429. [Google Scholar] [CrossRef]
  17. Panasiuk, O.; Hedström, A.; Langeveld, J.; Viklander, M. Identifying sources of infiltration and inflow in sanitary sewers in a northern community: Comparative assessment of selected methods. Water Sci. Technol. 2022, 86, 1–16. [Google Scholar] [CrossRef]
  18. Panasiuk, O.; Hedström, A.; Marsalek, J.; Ashley, R.M.; Viklander, M. Contamination of stormwater by wastewater: A review of detection methods. J. Environ. Manag. 2015, 152, 241–250. [Google Scholar] [CrossRef] [PubMed]
  19. Xu, Z.; Yin, H.; Li, H. Quantification of non-stormwater flow entries into storm drains using a water balance approach. Sci. Total Environ. 2014, 487, 381–388. [Google Scholar] [CrossRef]
  20. Pangle, L.A.; Diem, J.E.; Milligan, R.; Adams, E.; Murray, A. Contextualizing Inflow and Infiltration Within the Streamflow Regime of Urban Watersheds. Water Resour. Res. 2022, 58, e2021WR030406. [Google Scholar] [CrossRef]
  21. Saletti, A.O.; Rosén, L.; Lindhe, A. Framework for Risk-Based Decision Support on Infiltration and Inflow to Wastewater Systems. Water 2021, 13, 2320. [Google Scholar] [CrossRef]
  22. Staufer, P.; Scheidegger, A.; Rieckermann, J. Assessing the performance of sewer rehabilitation on the reduction of infiltration and inflow. Water Res. 2012, 46, 5185–5196. [Google Scholar] [CrossRef]
  23. De Bénédittis, J.; Bertrand-Krajewski, J.-L. Infiltration in sewer systems: Comparison of measurement methods. Water Sci. Technol. 2005, 52, 219–227. [Google Scholar] [CrossRef]
  24. Lepot, M.; Makris, K.F.; Clemens, F.H.L.R. Detection and quantification of lateral, illicit connections and infiltration in sewers with Infra-Red camera: Conclusions after a wide experimental plan. Water Res. 2017, 122, 678–691. [Google Scholar] [CrossRef]
  25. Tesfamariam, A.T.; Heiderscheidt, E.; Sunela, M.; Pitkänen, A.; Rantala, L.; Rossi, P.M. The estimation of infiltration and inflow in a sewage network by combining continuous monitoring of hydrological parameters, flow and temperature with stable isotopes of oxygen and hydrogen. Water Res. 2024, 255, 121505. [Google Scholar] [CrossRef] [PubMed]
  26. Beheshti, M.; Sægrov, S.; Ugarelli, R. Infiltration/Inflow Assessment and Detection in Urban Sewer System. Vann 2015, 1, 24–34. [Google Scholar]
  27. Ao, F.; Ye, C.; Xu, Y.; Wu, Z.; Xu, Z.; Chu, W. Advancing illicit connection diagnosis of urban stormwater pipes: Comprehensive analysis with EEM fluorescence spectroscopy. Water Res. 2024, 258, 121793. [Google Scholar] [CrossRef]
  28. Chen, X.; Zhao, N.; Zhu, W.; Yin, G.; Jia, R.; Yang, R.; Ma, M. A new method for the rapid identification of external water types in rainwater pipeline networks using UV–Vis absorption spectroscopy. Spectrochim. Acta Part A: Mol. Biomol. Spectrosc. 2025, 324, 124968. [Google Scholar] [CrossRef]
  29. Ge, J.; Li, J.; Qiu, R.; Shi, T.; Zhang, C.; Huang, Z.; Yuan, Z. A data-driven method for estimating sewer inflow and infiltration based on temperature and conductivity monitoring. Water Res. 2024, 261, 122002. [Google Scholar] [CrossRef] [PubMed]
  30. Almeida, M.C.; Brito, R.S.; Jorge, C.; Cardoso, M.A. Performance Assessment System to Wastewater Utilities Strategic Planning. Water 2021, 13, 2489. [Google Scholar] [CrossRef]
  31. Brito, R.S.; Almeida, M.C.; Silva, N.; Barreto, S.; Veríssimo, F. Assessing Intermittent Saline Inflows in Urban Water Systems. Water Sci. Technol. 2021, 85, 90–103. [Google Scholar] [CrossRef]
  32. ERSAR. Annual Report on Water and Waste Services in Portugal (RASARP); ERSAR: Lisbon, Portugal, 2019; ISBN 978-989-8360-36-6. Available online: https://waterhub.pt/en/projects/relatorio-anual-dos-servicos-de-aguas-e-residuos-em-portugal-rasarp (accessed on 25 January 2025). (In Portuguese)
  33. Brito, R.S.; Almeida, M.C.; Ribeiro, A.S. Enhancing Hydraulic Data Reliability in Sewers. Water Pract. Technol. 2022, 17, 431–444. [Google Scholar] [CrossRef]
  34. Matos, R.; Cardoso, A.; Ashley, R.; Duarte, P.; Molinari, A.; Schulz, A. Performance Indicators for Wastewater Services—Manual of Best Practices; IWA Publishing: London, UK, 2003. [Google Scholar]
Figure 1. Examples of typical daily and monthly flow variation in urban water systems. (a) Hourly wastewater flows in dry weather. (b) Monthly variation in wastewater volumes and population in a tourist area. (c) Monthly variation in wastewater and water supply volumes in a tourist area.
Water 17 01082 g001
Figure 2. Examples of inflows to the drainage systems are dependent on the local context. (a) Hourly wastewater flow in wet weather. (b) Hourly wastewater flow in wet weather with significant infiltration. (c) Hourly wastewater flow and tidal height.
Water 17 01082 g002
Figure 3. Methodology for the control of undue inflows.
Water 17 01082 g003
Figure 4. Examples of monthly volumes and a selection of variables for M11 and M12. (a) Wastewater in the three months with the highest (WW3M) and lowest (WW3m) wastewater volumes. (b) Wastewater in the three months with the highest (WWwater 3M) and lowest (WWwater 3m) water supply volumes.
Water 17 01082 g004
Figure 5. Examples of sub-daily data and selection of variables for M13, for (a) dry weather in the dry season and (b) hourly data.
Water 17 01082 g005
Figure 6. Example of (a) monthly volumes and the selection of variables for M21, and (b,c) sub-daily data for wet weather in the dry season, and the selection of variables for M22.
Water 17 01082 g006
Figure 7. Examples of dry weather wastewater hourly data in (a) any period, (b) dry and (c) wet seasons, and selection of variables for M31 and M32.
Water 17 01082 g007
Figure 8. Results of the metrics for C1, C2, and C3.
Water 17 01082 g008aWater 17 01082 g008b
Table 1. Inflows in built and natural systems: (✓) acceptable, under regulation, (🗴) undue (adapted from references [30]).
Inflow TypeWastewater Separate
Sewer Systems
Stormwater Separate
Sewer Systems
Combined Sewer
Systems
Natural
Systems
1.
Direct and delayed rainwater, e.g., surface water inlets, building drains, manhole covers
🗴✓, depends on system capacity ✓, limitations of water quality regulations
2.
Infiltration of groundwater
🗴, limited quantity
acceptable
✓, depends on system capacity
3.
Inflow from the natural drainage network (fluvial)
🗴, allowed in some cases✓, unacceptable if it worsens hydraulic performance🗴, allowed in some cases
4.
Water losses from water supply
🗴🗴
5.
Drainage from basements and similar
🗴🗴✓, can be excessive
6.
Discharges from swimming pools and similar
🗴, enforced in some cases✓, enforced in some cases✓, limitations if water quality regulations
7.
Household wastewater
🗴🗴
8.
Industrial wastewater
✓, if authorised and
complying
🗴✓, if authorised and
complying
🗴
9.
Wastewater from other sources, e.g., commercial, food and beverage
✓, if authorised and
complying
🗴✓, if authorised and
complying
🗴
10.
High-salinity inflows, e.g., sea water
🗴✓, limitations if
aggressive to materials
🗴✓, limitations if water quality regulations
11.
Solid wastes (e.g., septic tanks cleaning wastewater)
✓, if authorised and
complying
🗴✓, if authorised and
complying
🗴
Table 2. Criteria (Ci) associated with the objective O1 of controlling the magnitude of the inflows.
CriteriaDescriptionApplies to 1Inflow Type 2Metrics
C1Excessive inflowsAny undue inflow to wastewater systems and excessive inflow to combined systems. Essentially, quantity aspects.WS, CS1–63
C2Rainwater Rainwater inflows to wastewater systems (undue inflow) and excessive rainwater inflow to combined systems. Direct or delayed inflows. Essentially, quantity aspects.WS, CS12
C3InfiltrationGroundwater inflows to wastewater systems and excessive groundwater inflow to combined systems. Essentially, quantity aspects.WS, CS22
C4Fluvial
water and similar
Inflows of low-polluted water from river waters, water losses from supply systems, basement drainage, pool discharges, and similar others. Applicable to wastewater (undue inflow) and combined (excessive inflow) water systems. Essentially, quantity aspects.WS, CS3–63
C5Household wastewater and similar othersUndue inflow of household or similar waters to stormwater and natural systems. Essentially, quality aspects.SS, NS, CW76
C6Industrial wastewater Undue industrial inflows to wastewater, stormwater, and natural systems. Quantity and quality aspects.WS, CS, SS, NS, CW84
C7Other wastewatersUndue inflow of non-household or industrial water (commercial, hospital, etc.) to wastewater, stormwater, and natural systems. Quantity and quality aspects.WS, CS, SS, NS, CW96
C8Saline water Saline inflow to wastewater, combined, or stormwater systems. Quantity and quality aspects.WS, CS, SS102
C9Solid wastesExcessive solid material inflow to wastewater, combined, or stormwater systems. Quantity and quality aspects.WS, CS, SS113
Notes: 1 WS: wastewater separate system; CS: combined system; SS: stormwater separate system; NS: natural water system (fluvial); CW: coastal and estuarine waters; 2 types of undue inflows as in Table 1.
Table 3. Metrics (Mij) to assess the criteria (Ci) regarding the magnitude of the inflows.
CiMijMetricDescriptionsData Sources 1
C1 Excessive inflows
M11
[30]
Inflow seasonality (-)Ratio between inflows in the 3 months with the highest volumes and those in the 3 months with the lowest volumesB
M12
[30]
Inflow seasonality related to water supply consumption (-)Ratio between the quotient of inflows and water consumption in the 3 months with the highest household wastewater volumes, and the quotient of inflows and water consumption in the 3 months with the lowest household wastewater volumesB
M13
[30]
Exceedance inflows (-)Surplus inflows in relation to the dry weather pattern in the dry seasonA
C2 Rainwater
M21Inflows in periods with precipitation (-)Ratio between inflows (sum of volumes) in the 3 months with the highest rainfall and those in the 3 months with the lowest rainfallB
M22Excess inflows associated with precipitation (-)Surplus wet weather inflows in relation to the dry weather pattern in the dry season. An estimate of the volume that exceeds the dry weather pattern due to precipitationA
C3 Infiltration
M31Minimum flow rate (-)Ratio between the daily minimum dry weather and the average dry weather flows A
M32Infiltration flow rate (-)Ratio between the estimated groundwater infiltration and the mean dry weather flow in the dry seasonA
C4 Fluvial water and similar others
M41Deviation of fluvial water to the system (n./location)Number of days with fluvial water inflow to the system per location with a diversion connectionC
M42Fluvial inflow in relation to total inflow (-)Ratio between the fluvial inflow in relation to the household wastewater in dry weatherA
M43Discharge of pools to wastewater system (%)Percentage of collective pools connected to the systemC
C5 Household wastewater and similar others
M51Evidence of household wastewater in stormwater discharges (%)Percentage of stormwater discharges with evidence of household wastewater in relation to the total number of stormwater discharges to the receiving bodiesC
M52Wastewater connections to stormwater system (n./1000 drains)Number of wastewater connections to pipes that discharge into the receiving bodies (sum of connections associated with all the discharges) per 1000 drainsC
M53Use of the full cross-section capacity in dry weather (%)Percentage of the maximum hourly flow in dry weather in relation to the full cross-section flowA, C
M54Wastewater inflow to stormwater system (-)Ratio between the volume of undue wastewater inflow into the stormwater system and the wastewater volume in the wastewater system in dry weatherA
M55Water quality analyses carried out in the stormwater system (%)Percentage of water quality analyses carried out in relation to those scheduled in the utility’s monitoring plan for the stormwater systemC
M56Compliant water quality analyses in the stormwater system (%)Percentage of compliant water quality analyses in relation to those scheduled in the utility’s monitoring plan for the stormwater systemC
C6 Industrial wastewater
M61Evidence of industrial connections in the system (%)Percentage of connections with evidence of industrial wastewater in relation to the total number of industrial connections to the systemC
M62Industrial connections without discharge permission (%)Percentage of industrial connections to the system without a discharge permission in relation to the total number of industrial connectionsC
M63Water quality analyses carried out in the industrial connections (%)Percentage of water quality analyses carried out in relation to those scheduled in the utility’s monitoring plan for the industrial connectionsC
M64Compliant water quality analyses in the industrial connections (%)Percentage of compliant water quality analyses in relation to those scheduled in the utility’s monitoring plan for the industrial connectionsC
C7 Other wastewaters
M71Evidence of health facility connections to the system (%)Percentage of connections with evidence of health facilities’ wastewater in relation to the total number of health facilities’ connections to the systemC
M72Compliant health facility connections (%)Percentage of connections from health facilities compliant (those meeting system connection requirements) C
M73Evidence of catering facility connections to the system (%)Percentage of connections with evidence of catering facilities’ wastewater (e.g., from restaurants, canteens) in relation to the total number of catering facility connections to the systemC
M74Compliant catering facility connections (%)Percentage of connections from compliant catering facilities (those that meet public system connection requirements) C
M75Evidence of service station connections to the system (%)Percentage of connections with evidence of service station wastewater (e.g., from service stations, auto repair shops) in relation to the total number of service station connections to the systemC
M76Compliant service station connections (%)Percentage of connections from compliant service stations (those that meet public system connection requirements) C
C8 Saline water
M81Sites with evident saline inflows (-)Acknowledgement through the local inspection of sites in the system with evident exposure to saline inflows, in a coastal buffer with an elevation below the maximum spring tides; qualitative metricD
M82
[31]
Saline inflow in relation to total inflow (%)Percentage of total water volume collected corresponding to saline waterA
C9 Solid wastes
M91
[34]
Solids removal in sewers [ton/km]Solids weight removed from the sewers (including, e.g., valves) per pipe length C
M92
[34]
Solids removal in drainage components [ton/km]Solids weight removed from the complementary components of the drainage network (pumping stations, storage structures, and weirs) per pipe length C
M93
[34]
Gravel and sand removal in facilities [ton/km]Gravel and sand weight removed from the facilities (pumping stations and treatment plants) per pipe lengthC
Notes: 1 Data sources: (A) sub-daily flow, precipitation, and/or water quality data; (B) monthly flow and/or precipitation data; (C) variables coming from field inspection, GIS, or data from operation and maintenance; (D) qualitative, provided a list of options: (i) confirmed that it does not exist by field survey; (ii) exists, with confirmation by field survey; (iii) to the knowledge of the water utility, it does not exist, without full confirmation; (iv) to the knowledge of the water utility, it exists, without full confirmation; (v) not enough information for evaluation.
Table 4. Final reference values for selected metrics.
MetricReference Values
(Good; Fair; Poor)
C1: Excessive inflows
M11: Inflows seasonality (-)[1, 1.25[; [1.25, 2[; [2, +∞[
M12: Inflows seasonality related to water consumption (-)[1, 1.5[; [1.5, 3[; [3, +∞[
M13: Exceedance inflows (-)[0, 2[; [2, 5[; [5, +∞[
C2: Rainwater
M21: Inflows in periods with precipitation (-)[1, 1.25[; [1.25, 2[; [2, +∞[
M22: Excess inflows associated with precipitation (-)[0, 2[; [2, 5[; [5, +∞[
C3: Infiltration
M31: Minimum flow rate (-)[0, 0.25[; [0.25, 0.5[; [0.5, 1]
M32: Infiltration flow rate (-)[0, 0.1[; [0.1, 0.25[; [0.25, 1]
Disclaimer/Publisher’s Note: The statements, opinions and data contained in all publications are solely those of the individual author(s) and contributor(s) and not of MDPI and/or the editor(s). MDPI and/or the editor(s) disclaim responsibility for any injury to people or property resulting from any ideas, methods, instructions or products referred to in the content.

