1. Introduction
Water quality is fundamental to environmental sustainability and human well-being. Freshwater resources sustain biodiversity, regulate ecosystems, and provide crucial services for agriculture, industry, and domestic needs. However, pollution-induced deterioration of water quality significantly impacts public health, leading to waterborne morbidity and mortality along with a huge number of out-of-pocket expenditures. On a global scale, contaminated water accounts for approximately 485,000 deaths annually due to diarrheal diseases [
1]. Furthermore, polluted water systems disrupt aquatic ecosystems, causing habitat degradation and biodiversity loss [
2]. Economic activities are also adversely affected, with industries reliant on clean water encountering increased treatment expenses and operational difficulties. Agricultural productivity suffers as well, as elevated salinity and chemical pollutants degrade soil health and reduce crop yields [
3]. Addressing these concerns is vital to achieving sustainable development. The combined effects of rapid industrialization, urbanization, and agricultural growth have placed immense strain on global water resources. Nearly 80% of wastewater is released untreated into natural water bodies, resulting in the contamination of rivers, lakes, and groundwater [
4]. Urban centers contribute a mix of organic and chemical pollutants from untreated sewage, while agricultural practices introduce pesticides, fertilizers, and sediments [
5]. These pollutants lead to eutrophication, reduced dissolved oxygen levels, and increased turbidity, ultimately compromising the usability of water resources. Integrated water quality assessment, encompassing physical, chemical, and microbiological analyses, is crucial for identifying contamination hotspots and enabling effective policy measures [
6].
Delhi and its surrounding districts, including Sonipat, Gurugram, Faridabad, Jhajjar, and Gautam Buddha Nagar, have witnessed rapid urbanization and industrialization over the last two decades. The National Capital Region (NCR), with a population exceeding 30 million, faces increased water demand and pollution loads [
7]. Industries, such as chemicals, pharmaceuticals, textiles, electronics manufacturing, and food processing, discharge untreated effluents and residual byproducts containing hazardous chemicals and heavy metals into nearby water bodies [
8]. Inadequate sewage treatment infrastructure worsens the situation, with only 30% of sewage generated in the NCR undergoing treatment before being released into rivers and streams [
9]. Consequently, high concentrations of total dissolved solids (TDS), biochemical oxygen demand (BOD), and microbial contamination are commonly found in water resources across the region [
10]. Delhi’s water quality is closely connected to that of its surrounding districts through shared hydrological systems, including rivers and groundwater aquifers. Pollutants from industrial and urban areas in neighboring districts flow into major rivers, such as the Yamuna and Hindon [
11]. The Yamuna River, which supplies 70% of Delhi’s drinking water, frequently shows BOD levels far above the permissible limit of 3 mg/L, often reaching as high as 41.3 mg/L in specific stretches [
12]. Groundwater in the region is similarly affected, with over-extraction causing substantial declines in water levels and contamination from nitrates, pesticides, and microbial pathogens, rendering much of the water unfit for consumption [
13]. These interdependencies underscore the necessity for coordinated actions to manage and safeguard shared water resources effectively.
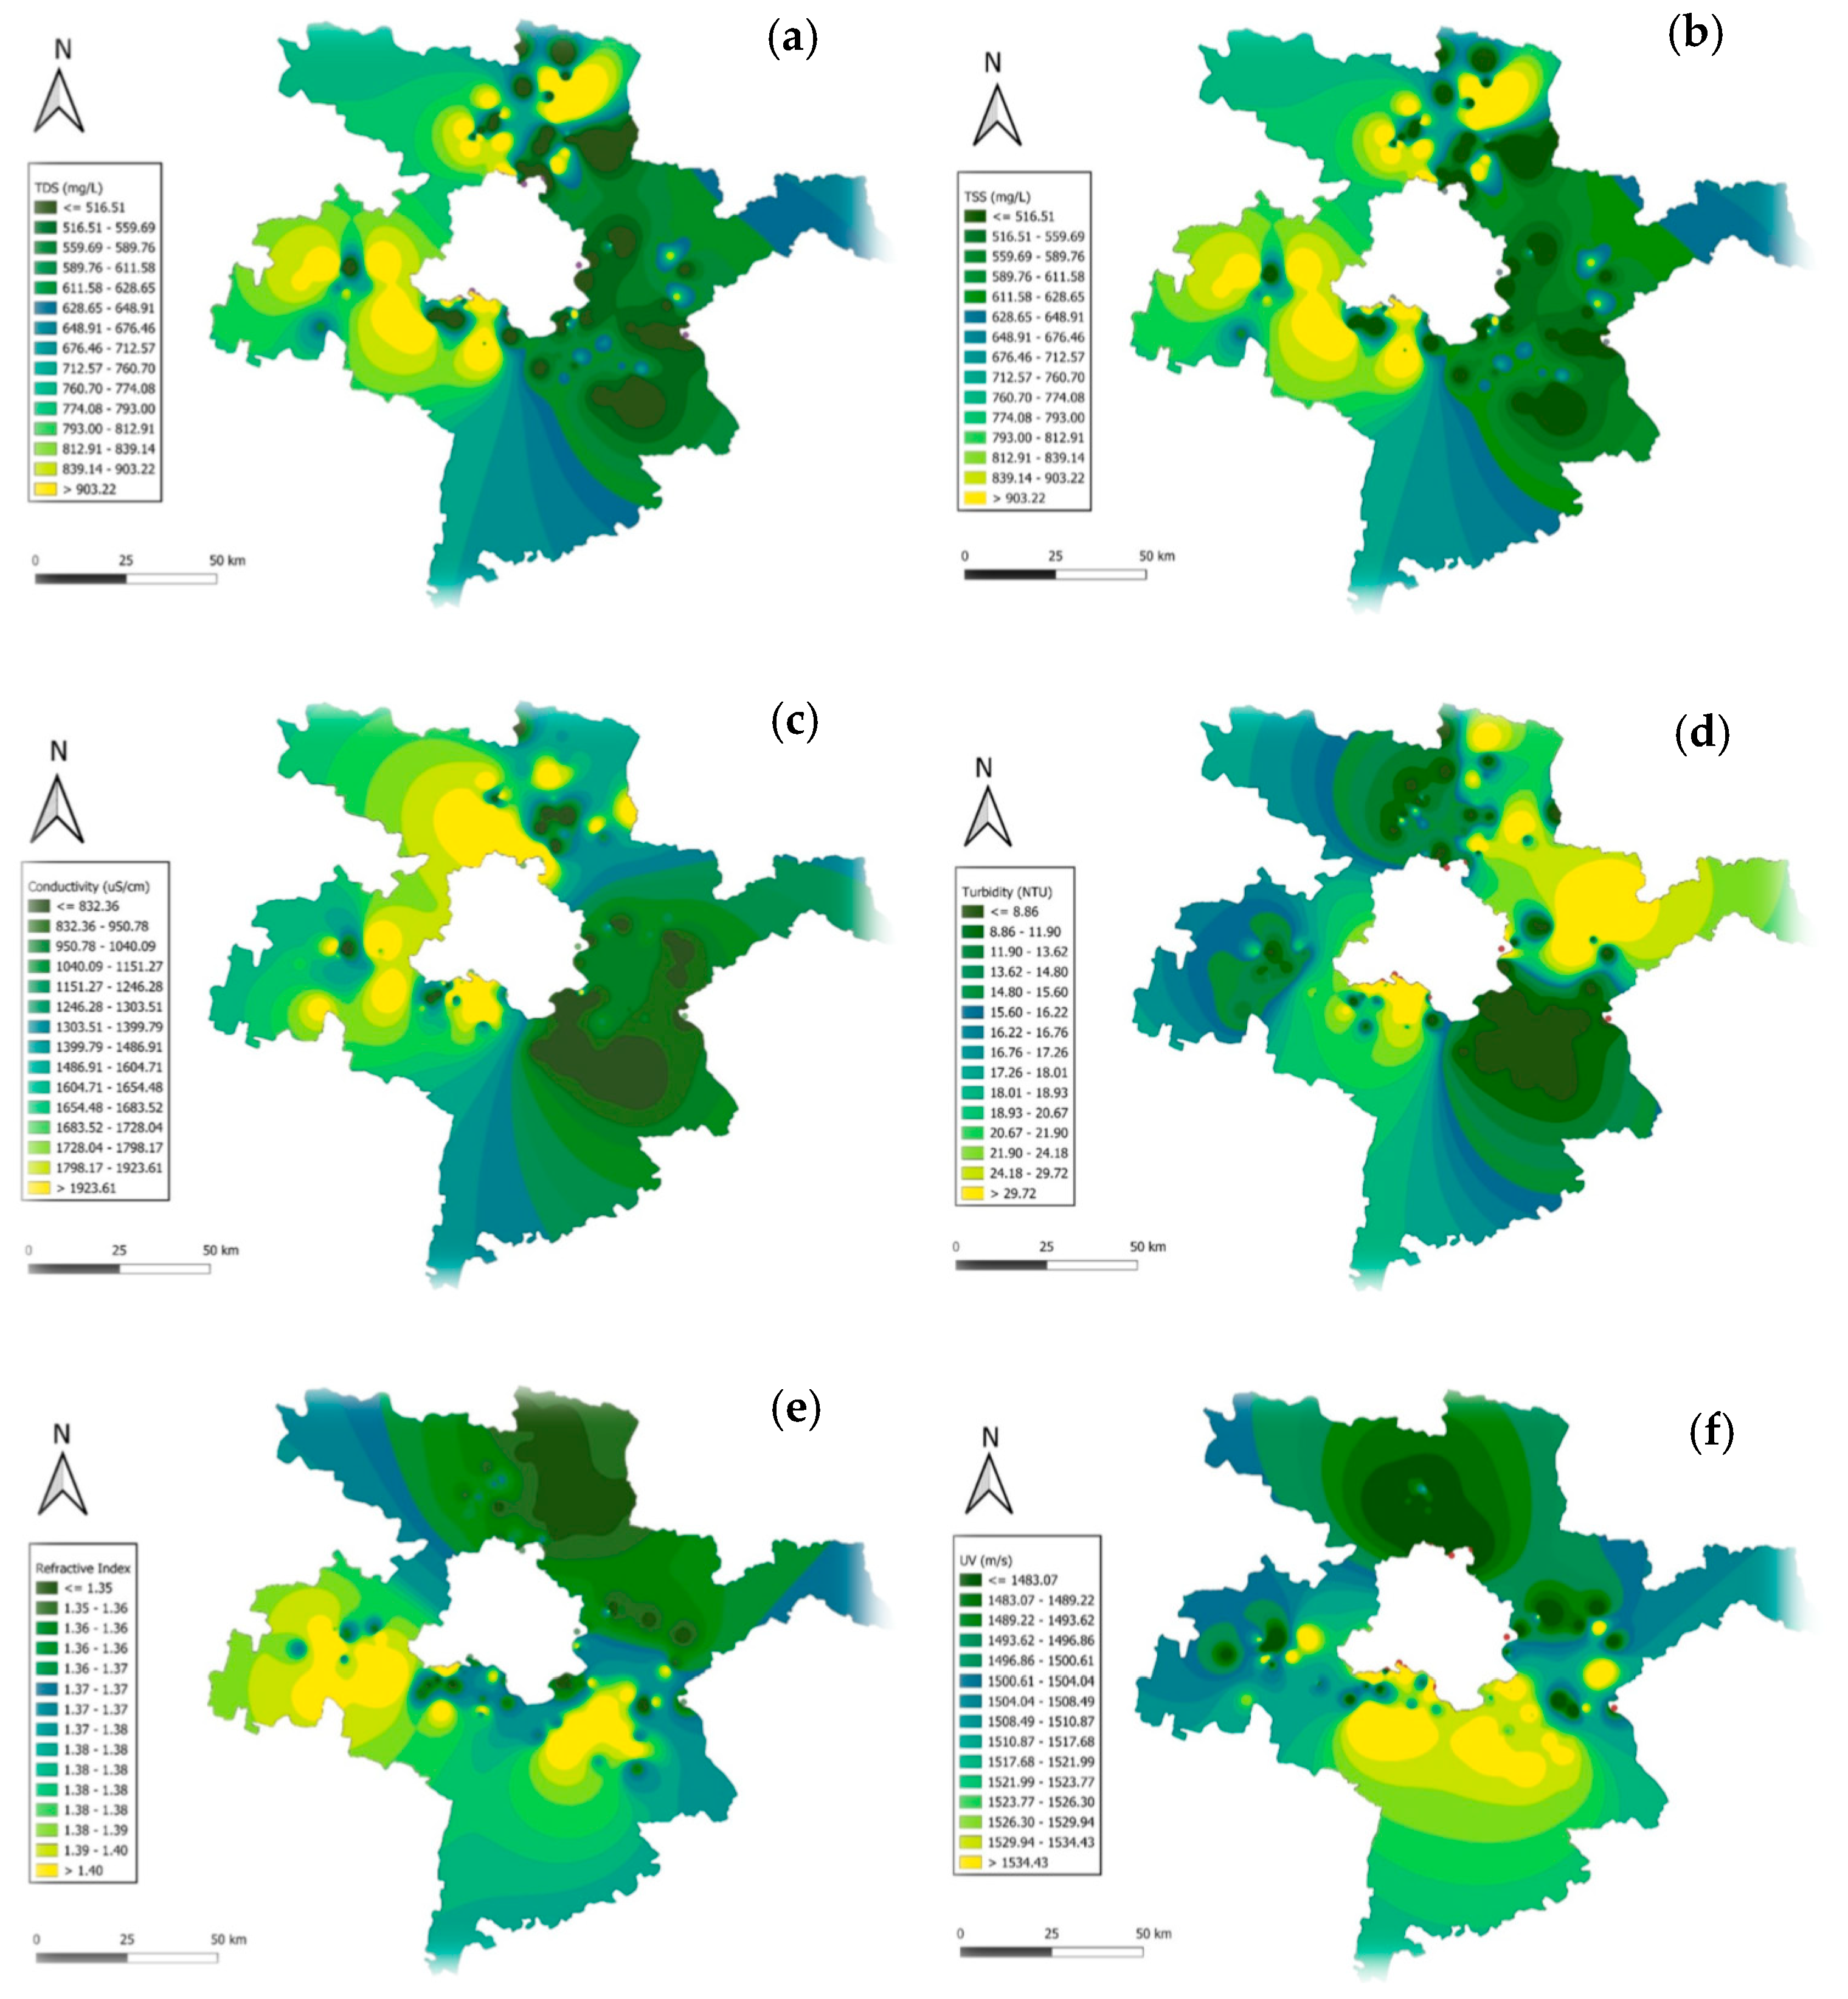
Physical parameters, such as total dissolved solid (TDS), total suspended solids (TSS), and conductivity are vital indicators of water’s physical characteristics, influencing its suitability for drinking, agriculture, and industrial applications. TDS reflects the concentration of dissolved ions and solids, with the World Health Organization (WHO) setting a permissible limit of 500 mg/L for potable water. However, polluted sources, particularly in urban and industrial areas, often exhibit levels exceeding 1000 mg/L [
14]. TSS measures undissolved particles that impact water clarity and aquatic ecosystems. Elevated TSS levels, frequently surpassing 100 mg/L during monsoonal runoff in urban rivers, can obstruct sunlight penetration, disrupting photosynthesis in aquatic plants [
15]. Conductivity serves as an indicator of salinity and ion concentration, correlating with TDS and providing insights into mineralization levels, often exceeding 2000 µS/cm in areas with high salinity or industrial pollution [
16]. Monitoring these parameters is challenging due to seasonal and geographic variations. Monsoonal rains cause spikes in TSS and dilute TDS, while dry seasons concentrate dissolved solids. Geographic differences, influenced by land use patterns, such as industrial or agricultural activities, further complicate monitoring efforts [
17].
Chemical parameters, including pH, dissolved oxygen (DO), biochemical oxygen demand (BOD), nitrate, and total phosphates, are crucial for assessing the chemical health of water. WHO guidelines recommend a pH range of 6.5–8.5 for drinking water and aquatic ecosystems, as deviations affect metal solubility and nutrient availability [
18]. DO levels below 5 mg/L indicate hypoxic conditions, threatening fish populations and overall aquatic health. Nitrate concentrations exceeding 50 mg/L in drinking water, as per WHO recommendations, can cause methemoglobinemia, especially in infants [
19]. Phosphates, though naturally occurring, contribute to eutrophication when levels surpass 0.1 mg/L, leading to algal blooms that deplete DO and harm aquatic biodiversity [
20]. Chemical parameters significantly influence the water quality index (WQI). Certain parameters, like DO and BOD, generally carry the highest weightage due to their direct impact on aquatic ecosystems and human health, while pH, nitrates, and phosphates are assigned intermediate weightages. Elevated BOD levels and high nitrate concentrations (>10 mg/L) notably reduce WQI scores, classifying water as “poor” or “very poor” [
21]. Human activities are the primary sources of chemical contamination. Agricultural runoff introduces nitrates and phosphates from fertilizers, while industrial effluents release heavy metals, hydrocarbons, and synthetic chemicals into water bodies. Untreated sewage further elevates BOD and biotic nutrient levels, particularly in urban and peri-urban areas [
22].
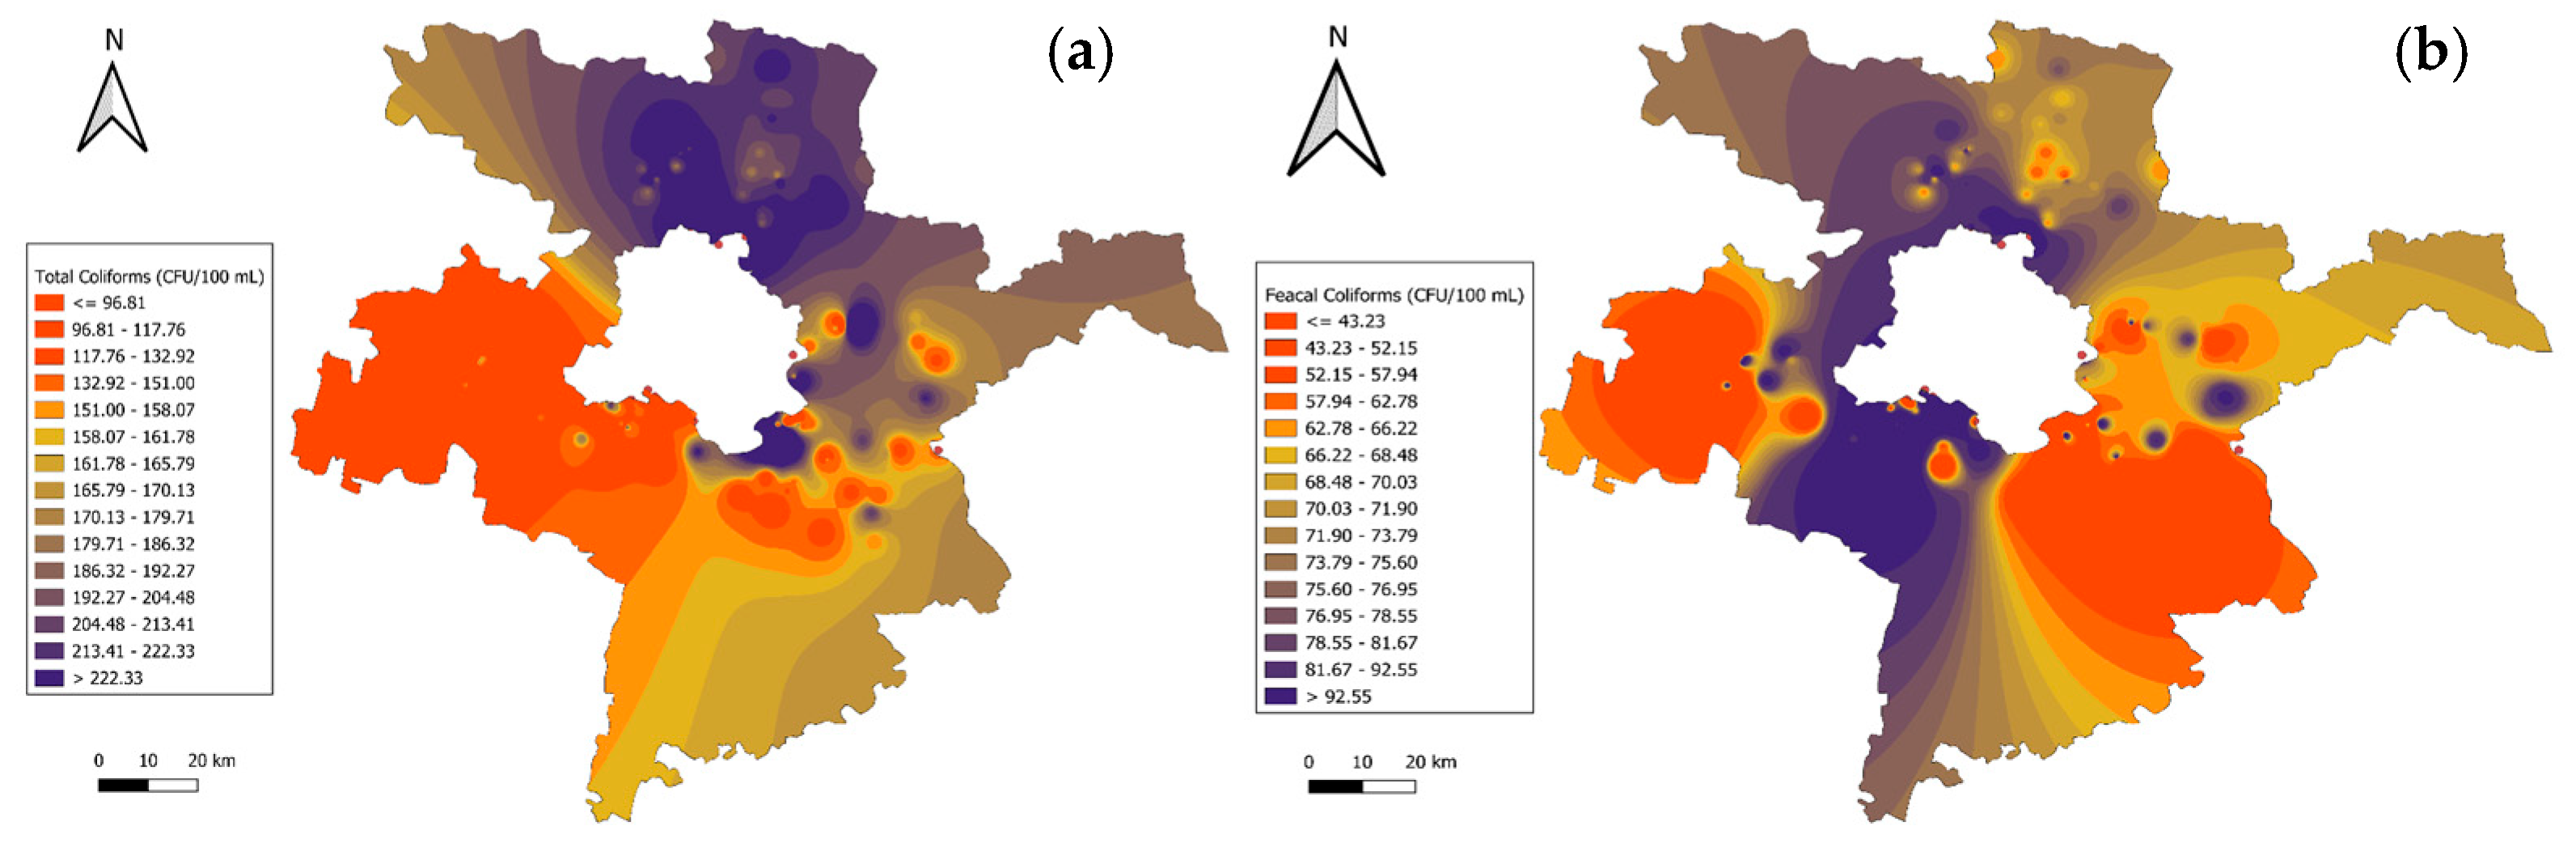
Microbiological parameters, such as total coliforms (TCR, i.e., total coliform rule) and fecal coliforms (also known as thermo-tolerant coliforms) are essential for evaluating water safety. WHO and national regulatory standards advocate zero total coliforms in 100 mL of treated drinking water, as their presence suggests potential fecal contamination. Fecal coliforms, a subset of total coliforms, are specifically linked to human and animal waste, with their detection indicating heightened risks of waterborne diseases, such as cholera, dysentery, and typhoid [
23]. WHO guidelines for recreational water warn that fecal coliform levels exceeding 200 CFU/100 mL pose significant health risks during activities involving water contact [
24]. Microbiological parameters are critical in determining WQI, with high weightages due to their public health significance. Contaminated water sources frequently exhibit total coliform counts exceeding 1000 CFU/100 mL, resulting in WQI classifications marking the water as unfit for human use. Including microbiological data in WQI calculations enhances its relevance for public health assessments [
25]. Microbial contamination shows considerable temporal and spatial variability, influenced by rainfall, agricultural runoff, and urban wastewater discharge. Rain-induced runoff often raises bacterial counts, while extended dry periods reduce microbial dilution. The WHO emphasizes real-time microbial monitoring to address these fluctuations and maintain water safety [
26].
Geographic information systems (GISs) offer advanced capabilities for the spatial analysis of water quality data. GIS applications include mapping the distribution of water quality parameters, aiding in the identification of contamination hotspots. Spatial interpolation techniques, such as kriging and inverse distance weighting (IDW), are widely employed to estimate parameter values in unmeasured locations. By leveraging these methods, GIS can also predict WQI values in unsampled areas, enhancing spatial coverage and enabling proactive decision-making in regions where direct water quality measurements are limited. Such predictive capabilities strengthen environmental management strategies by identifying potential pollution hotspots and guiding targeted interventions [
27]. Studies utilizing GIS have identified urban and industrial zones as significant contributors to water quality degradation. For instance, spatial mapping of TDS and conductivity in semi-arid regions highlighted industrial areas as hotspots, often exceeding permissible limits. Similarly, GIS mapping of microbiological parameters in urban settings revealed strong spatial correlations between elevated coliform counts and proximity to untreated sewage discharge points [
28]. These findings demonstrate the utility of GIS in integrating diverse water quality datasets for comprehensive spatial analysis.
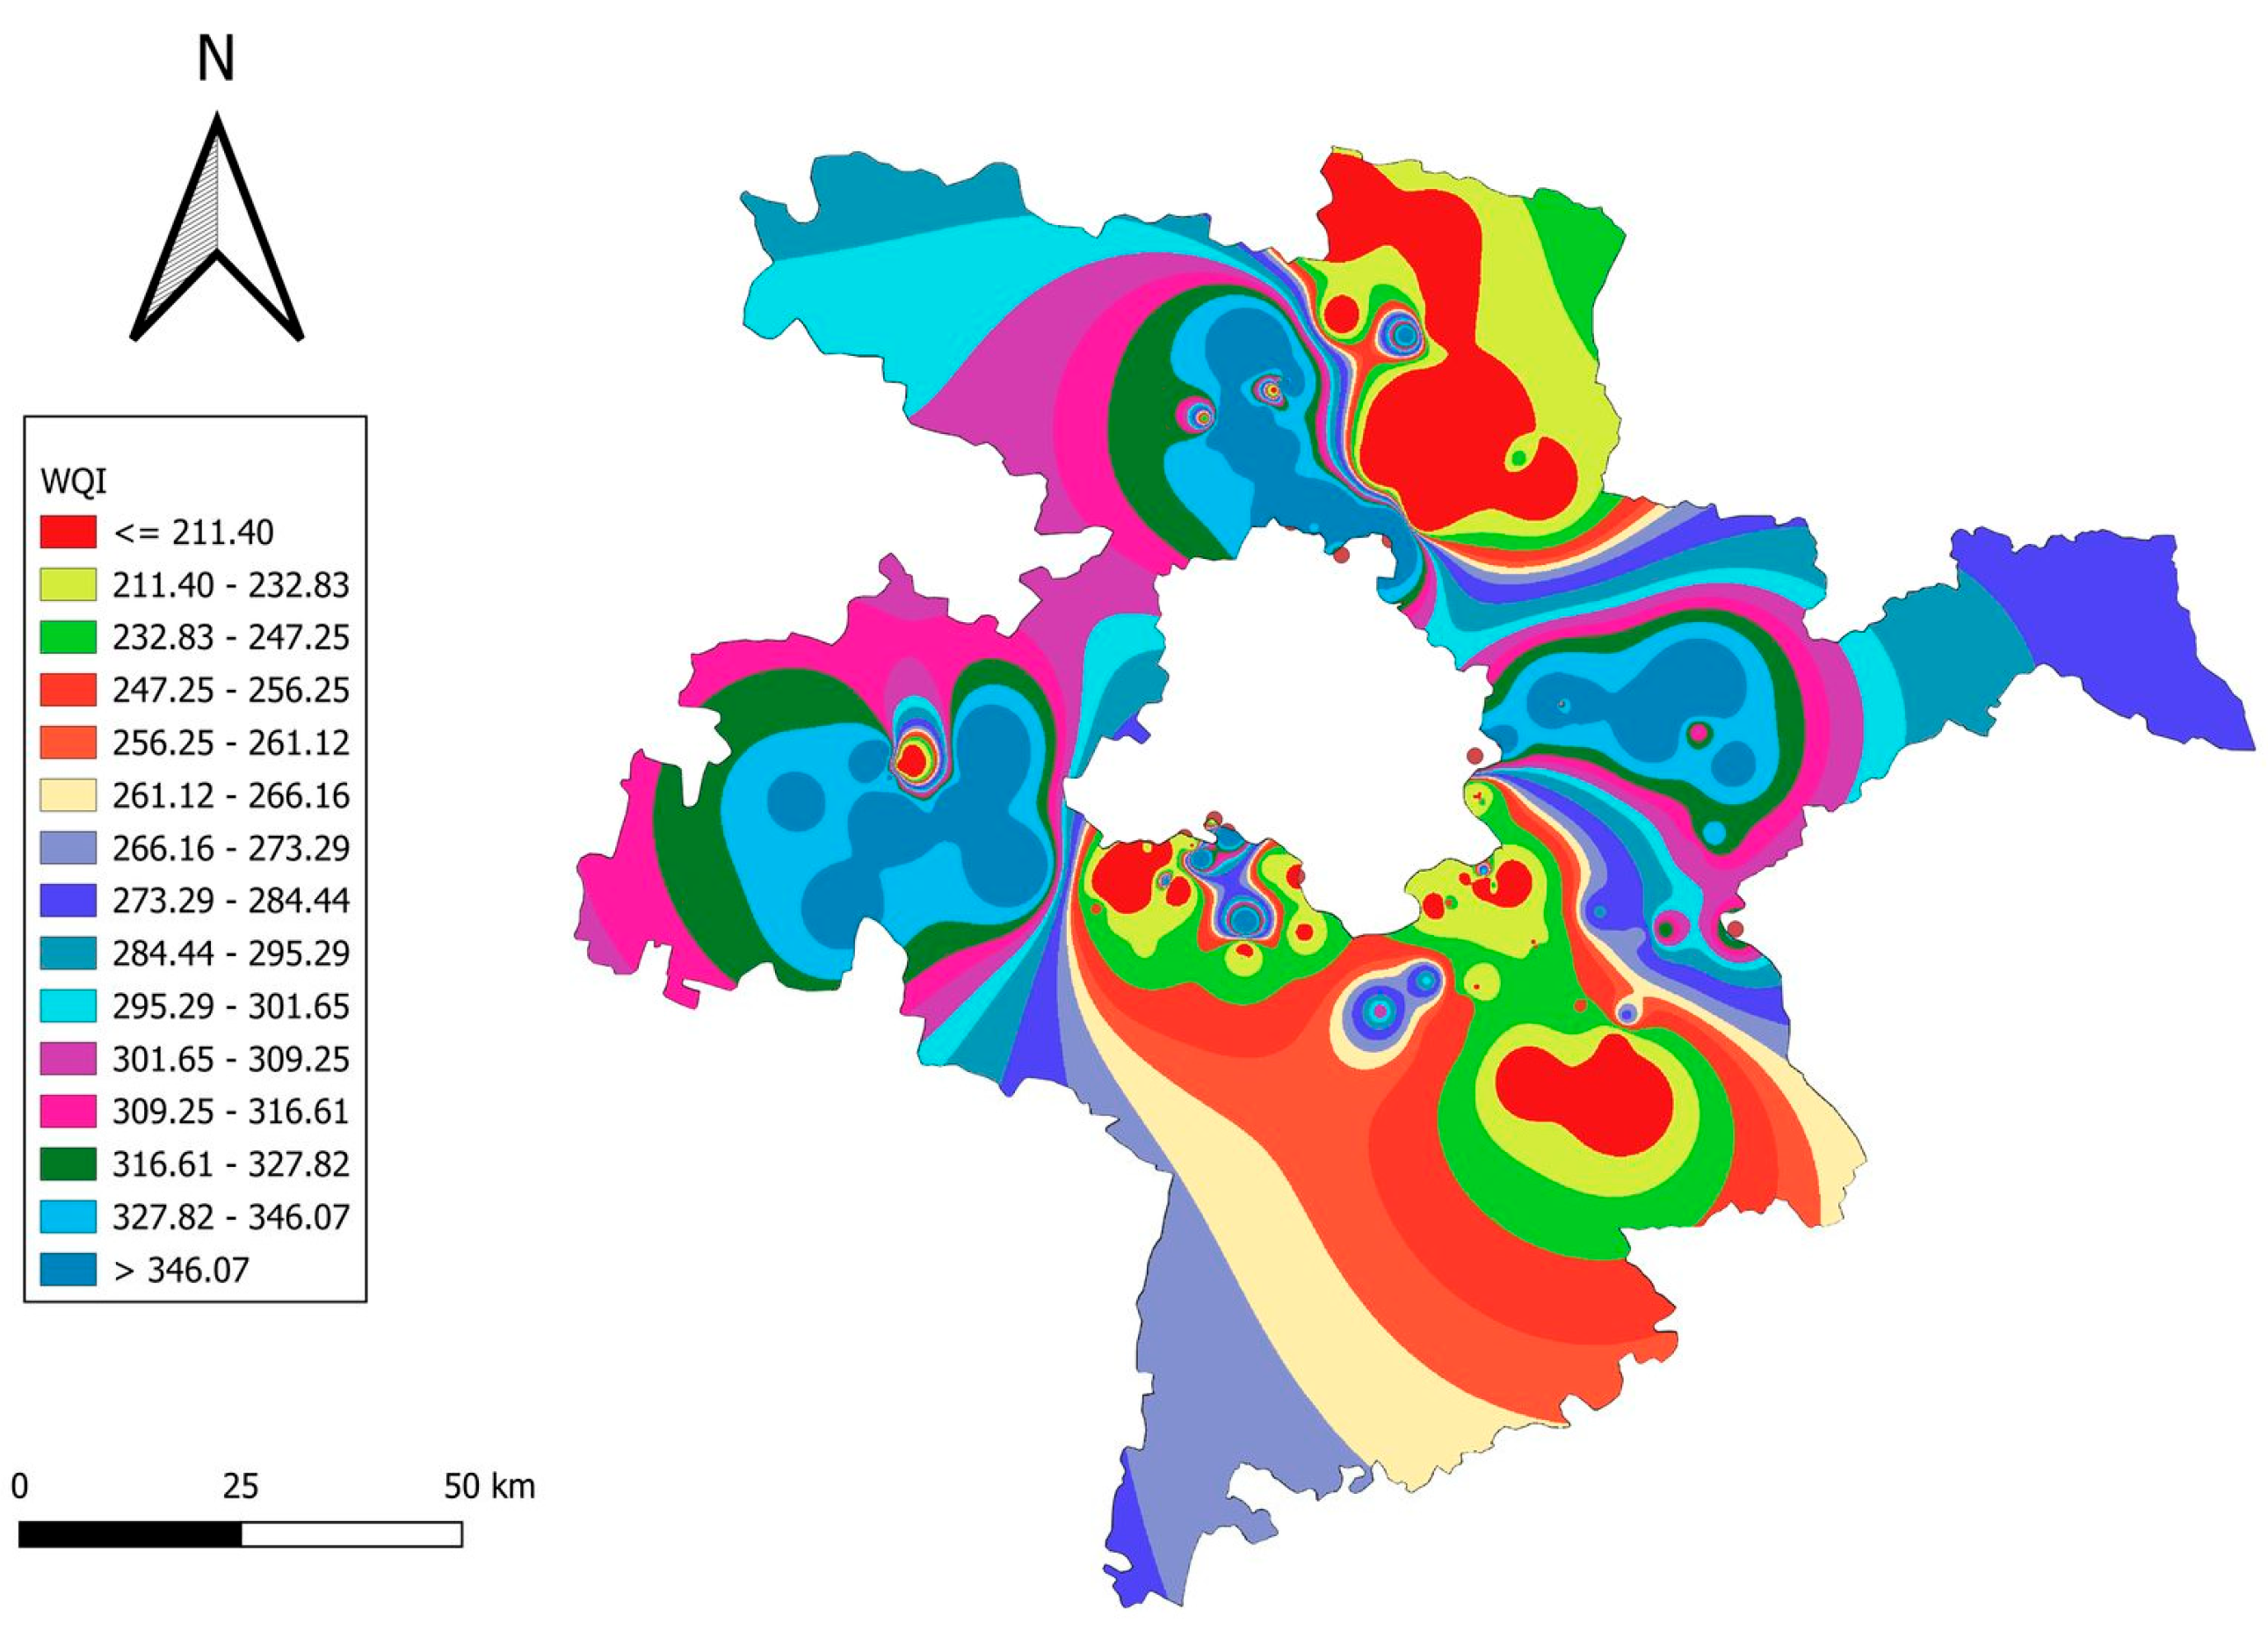
The water quality index (WQI) combines various parameters of water quality assessment into a single value, simplifying complex datasets for easier interpretation. Its calculation involves normalizing parameter values, assigning weightages based on their significance, and summing the weighted values. The final index classifies water into categories, such as “Excellent”, “Good”, and “Poor”, facilitating rapid assessments of water quality [
29]. Research across the globe has demonstrated the utility of the WQI in evaluating different water bodies. For instance, water in industrial areas is often categorized as “poor” due to elevated TDS and BOD levels. In agricultural regions, high concentrations of nitrates and phosphates frequently lead to lower WQI scores. Studies incorporating microbiological parameters have shown that microbial contamination significantly reduces WQI values, particularly in urban and peri-urban water sources [
30].
Machine learning (ML) has become a powerful tool for analyzing water quality by modeling complex relationships, predicting trends, and identifying key influencing factors. ML algorithms are adept at processing diverse datasets, including physicochemical and biological indicators, to predict WQI and identify contamination hotspots [
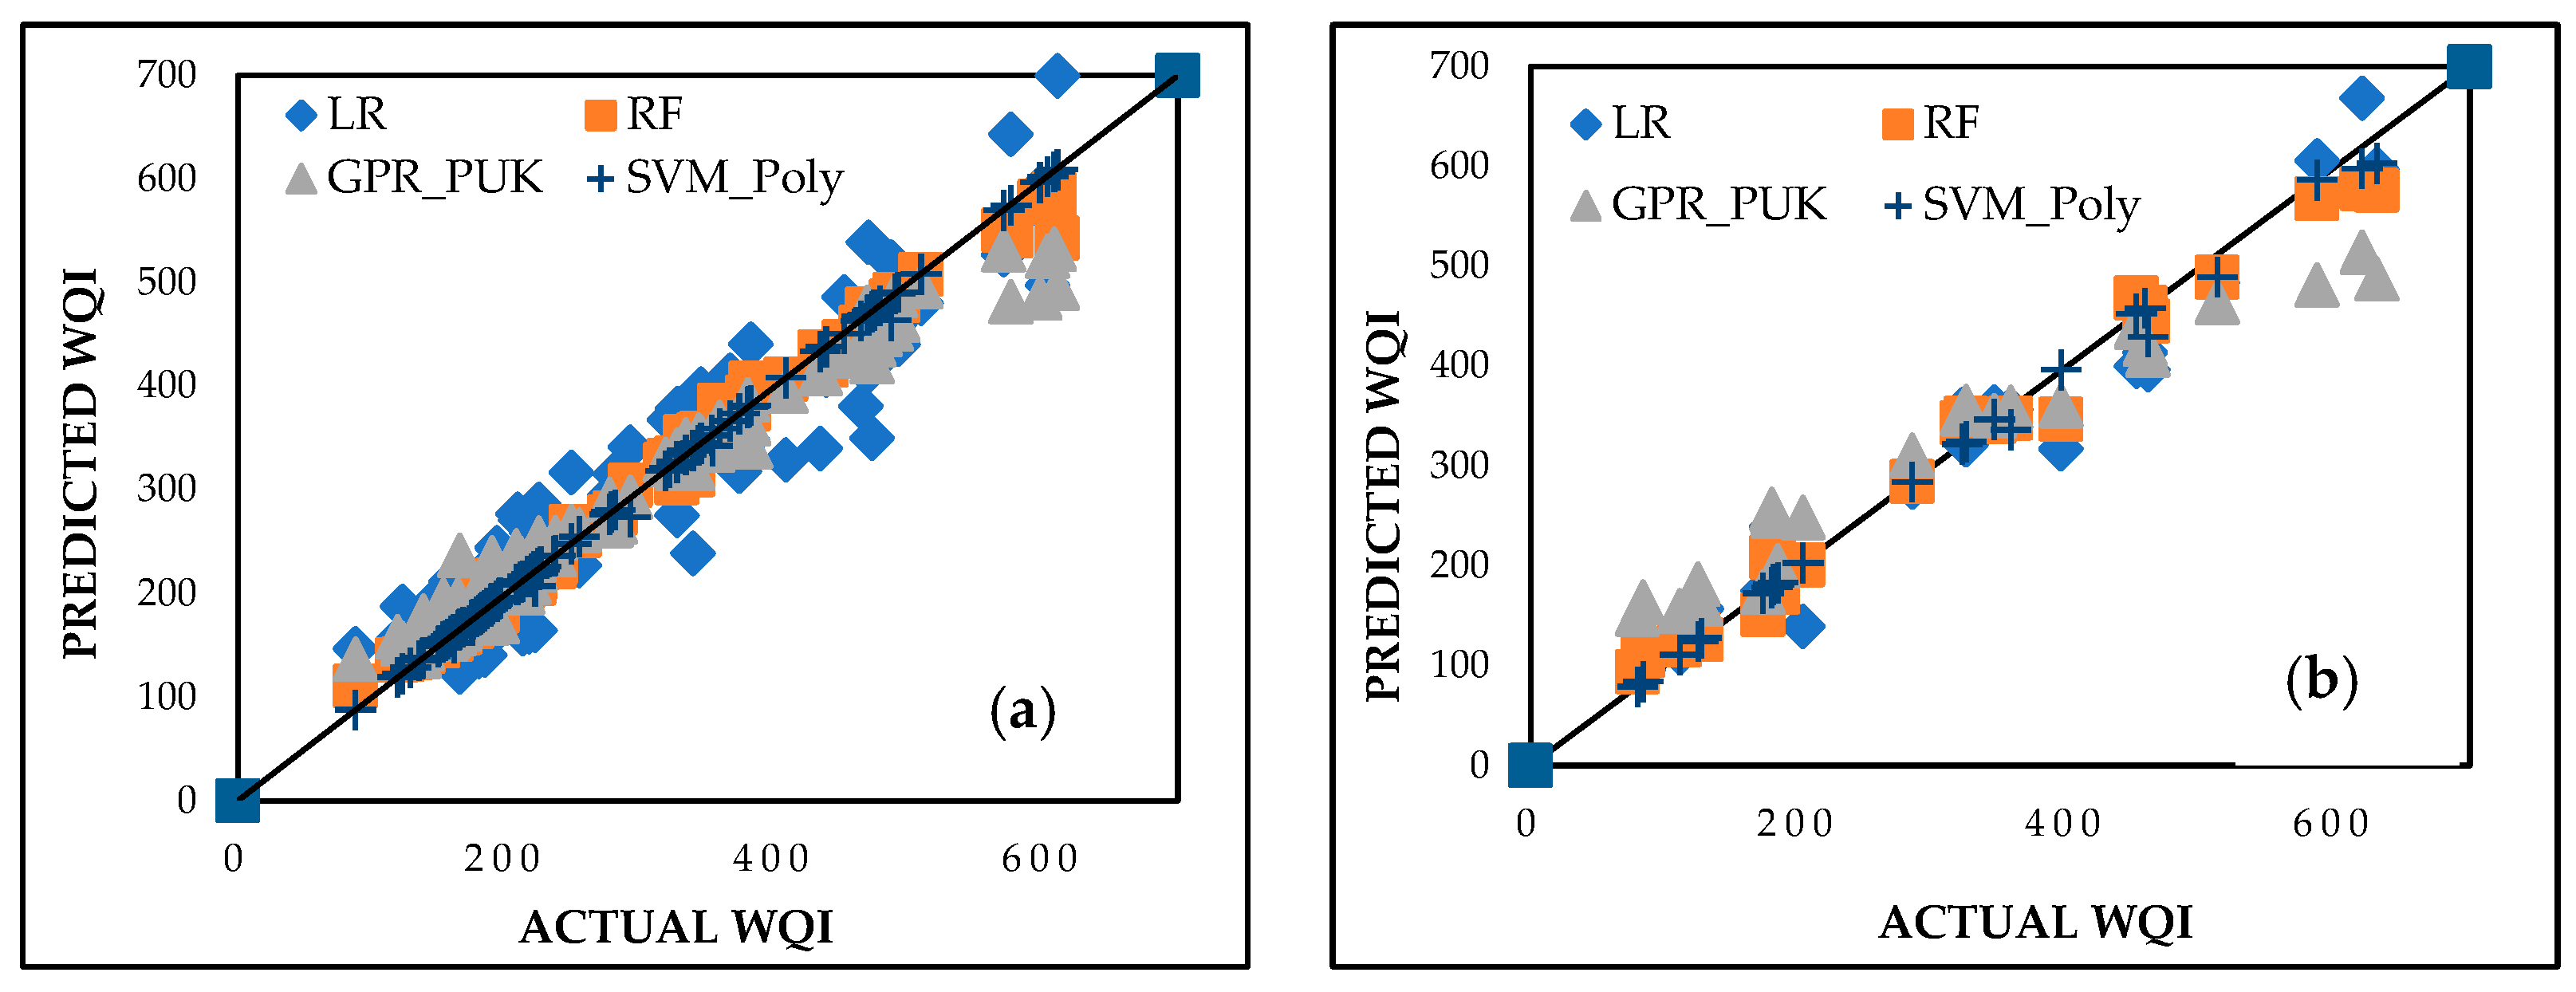
31]. These algorithms handle nonlinear interactions between parameters effectively, making them valuable for understanding complex environmental systems. Commonly used ML algorithms in water quality studies include support vector machines (SVMs), random forests (RFs), Gaussian process regression (GPR), and artificial neural networks (ANNs). The SVM approach applies kernel functions to model nonlinear relationships, while the RF method uses ensemble learning to enhance accuracy and robustness. GPR provides predictions with quantified uncertainties through its probabilistic framework, making it particularly suitable for datasets with variability and noise [
32]. ANNs, known for their adaptability and ability to model nonlinear patterns, have been widely applied in predicting environmental trends, including water quality [
33]. These advancements in ML have significantly improved water quality management by enabling the early detection of pollution trends, accurate WQI predictions, and detailed sensitivity analyses of parameters. Such capabilities assist decision-makers in prioritizing interventions and optimizing resource allocation. Traditional WQI computation relies on direct physicochemical and microbiological measurements, but it lacks predictive capability in unmonitored locations. Integrating ML enhances spatial and temporal predictions, allowing proactive water quality assessments based on historical data and environmental variables, such as land use, industrial activity, and population density. ML models provide scalable, data-driven solutions for identifying contamination trends and supporting evidence-based water resource management. Unlike conventional WQI computation, which assumes static weightage for parameters, ML-based approaches adapt to evolving environmental conditions, improving real-time decision-making in water resource planning and pollution mitigation. The effectiveness of ML in predicting water quality is well established. For example, studies using RF and SVM to predict WQI have achieved correlation coefficients (CC) above 0.95 and root mean squared errors (RMSE) as low as 3.2 across diverse environments [
34]. GPR models with polynomial and radial basis function (RBF) kernels have also shown high accuracy, particularly in urban and agricultural watersheds, with mean absolute errors (MAE) below 5% [
35]. Additionally, ML models have proven valuable in identifying critical parameters affecting water quality. For instance, RF models analyzing urban river systems have emphasized the importance of microbial contamination and nutrient levels in reducing WQI scores [
36]. These findings underscore the potential of ML in providing actionable insights for monitoring water quality and promoting sustainable resource management.
Despite considerable progress, many studies on water quality assessment lack a holistic approach that integrates water quality determinants. Research often emphasizes specific groups of parameters, overlooking the critical role of microbial contamination in determining water safety [
37]. This gap is particularly evident in studies addressing water quality in the districts surrounding Delhi, where the focus has largely been on chemical indicators, such as nitrates and phosphates, with insufficient attention to microbiological factors, like total coliforms and fecal coliforms [
38]. The absence of comprehensive assessments limits the applicability of findings, particularly in areas where microbial contamination poses significant risks to public health and water usability. Additionally, while GIS-based spatial analysis has been widely used to evaluate physical and chemical parameters, its application to microbiological data remains underexplored. A comprehensive methodology that incorporates all parameter types is essential to address the multifaceted challenges of water quality effectively [
39]. Although the Delhi-surrounding districts serve as critical hydrological and economic resources, no study has yet undertaken a comprehensive water quality evaluation across all these districts using an integrated approach that combines GIS mapping, WQI analysis, and machine learning-based prediction. Existing studies are often limited in scope, focusing on specific parameters, individual districts, or isolated methodologies. This segmented approach fails to address the interconnected nature of water quality issues in this region, especially the interactions between surface water and groundwater systems [
40].
Addressing the complex water quality challenges in the Delhi-surrounding districts requires methodologies that integrate spatial analysis, comprehensive WQI evaluation, and predictive modeling. Most current research lacks this unified framework, reducing its ability to provide actionable insights. Developing such an integrated methodology would enable policymakers to identify contamination hotspots, predict WQI under different scenarios, and design targeted intervention strategies [
41]. This study aims to address these gaps by proposing a novel, integrated framework that combines GIS mapping, multi-parameter WQI evaluation (encompassing hydrochemical and microbial factors), and machine learning-based predictive modeling for the entire Delhi-surrounding region. This comprehensive approach not only enhances the understanding of water quality challenges in this critical area but also provides a replicable framework for tackling similar challenges in other regions.
This study addresses significant gaps in water quality assessment for the Delhi-surrounding districts by utilizing advanced scientific methodologies and computational data-driven techniques. Geographic information system (GIS) tools have been applied to map the spatial distribution of aquatic health parameters, facilitating the precise identification of contamination hotspots and spatial variability. A comprehensive water quality index (WQI) has been developed by integrating these parameters, offering a unified and robust measure of water quality for the region. Predictive models for WQI have been created using machine learning techniques, including Gaussian process regression (GPR), linear regression (LR), support vector machines (SVMs), and random forest (RFs), enabling accurate trend forecasts and practical insights. Additionally, sensitivity analysis has been performed to determine the most influential parameters affecting WQI, providing insights into the complex interactions among hydrological and microbiological characteristics. This study represents a comprehensive approach that combines GIS mapping, machine learning, and multi-parameter analysis, establishing an advanced framework for effective water resource management and precise policy development in this critical region.


 ,
, 


